fiscal year 2020 results presentation
TRANSCRIPT

1
STOCK CODE: 9449
Fiscal Year 2020
Results Presentation
February 12, 2021
2
1. Overview
2. Financial Results
3. Segment Report
i) Group Overview
ii) Internet Infrastructure
iii) Online Advertising & Media
iv) Internet Finance
v) Cryptoassets
4. E-Contract Service GMO Sign
5. Conclusion

3
(JPY billions) FY19 FY20YoY
ChangeChange
Net Sales 196.1 210.5 +14.3 +7.3%
Operating Profit 25.27 27.89 +2.61 +10.3%
Ordinary Profit 24.50 27.13 +2.63 +10.7%
Net Profit 8.33 10.28 +1.94 +23.4%
Record high
Overview | Executive Summary: FY2020
Record high
Record high

4
Internet
Infrastructure
Net sales JPY 131.2B (Up 15.1% YoY)All products grew, including e-commerce, payment, and provider
OPJPY 16.28B (Up 15.8% YoY)
Online Ad &
Media
Net sales JPY 46.8B (Up 0.1% YoY) Steady growth of advertising amid COVID-19. Steady growth of
in-house ad tech products. Investing in in-house media.OPJPY 0.42B (Down 23.1% YoY)
Internet
Finance
Net sales JPY 30.8B (Up 8.0% YoY) - FX: No. 1 FX trading volume worldwide
- CFD: expanded the domestic market share; profit contribution
as the second core-product.OP
JPY 10.61B (Up 24.7% YoY)
CryptoassetsNet sales JPY 6.7B (Up 10.8% YoY)
- GMO Coin: No. 2 domestic market share; altcoin also contributed to
profit.
- Mining: new facilities started operating; recorded profit in Q4.
- Stablecoin: acquired official approval from USA’s Financial
Services Authority
OPJPY 0.76B (Down 19.8% YoY)
Overview | Executive Summary: FY2020
Evaluation

5
55.465.4
84.6100.8
114.0131.2
40.5
44.1
44.0
46.7
46.8
46.8
29.8
27.3
26.3
30.7
28.5
30.8
8.26.0
6.7
126.3135.0
154.2
185.1196.1
210.5
4.316.59
8.4711.44
14.0616.28
1.20
1.29
0.97
0.76
0.54
0.42
9.66
9.627.98
10.758.51
10.61
-1.36
0.95
0.76
2.53
14.80
17.0117.64
21.78
25.2727.89
2015 2016 2017 2018 2019 2020 2015 2016 2017 2018 2019 2020
Other
Incubation
Cryptoassets
Internet Finance
Online Ads/Media
Internet Infrastructure
Overview | Financial Results for FY2020Net Sales Operating Profit
Up 7.3% YoY Up 10.3% YoY
(JPY billions) (JPY billions)

6
FY19 FY20
196.1
+17.1
-2.8
FY19 FY20
25.27
27.89+2.22
+0.6 210.5
+1.02
-0.12
-2.42
+0.0
-2.9
+2.2
+2.10
-0.18
Overview | Executive Summary: FY2020
(JPY billions)
OP
Net sales
(JPY billions)
Revenue up
14.3B
Profit up
2.61B
Infrastructure Finance Ad Cryptoassets VC Other
Infrastructure Finance Ad Cryptoassets VC Other

7
Total Shareholder
Returns Ratio
50%
Quarterly dividend Net profit at end of fiscal
year to form basis of
buyback in following year
Dividend Payout Ratio
Over 33%
Share Buyback
17%
Overview | Shareholder Returns (Policy)
8
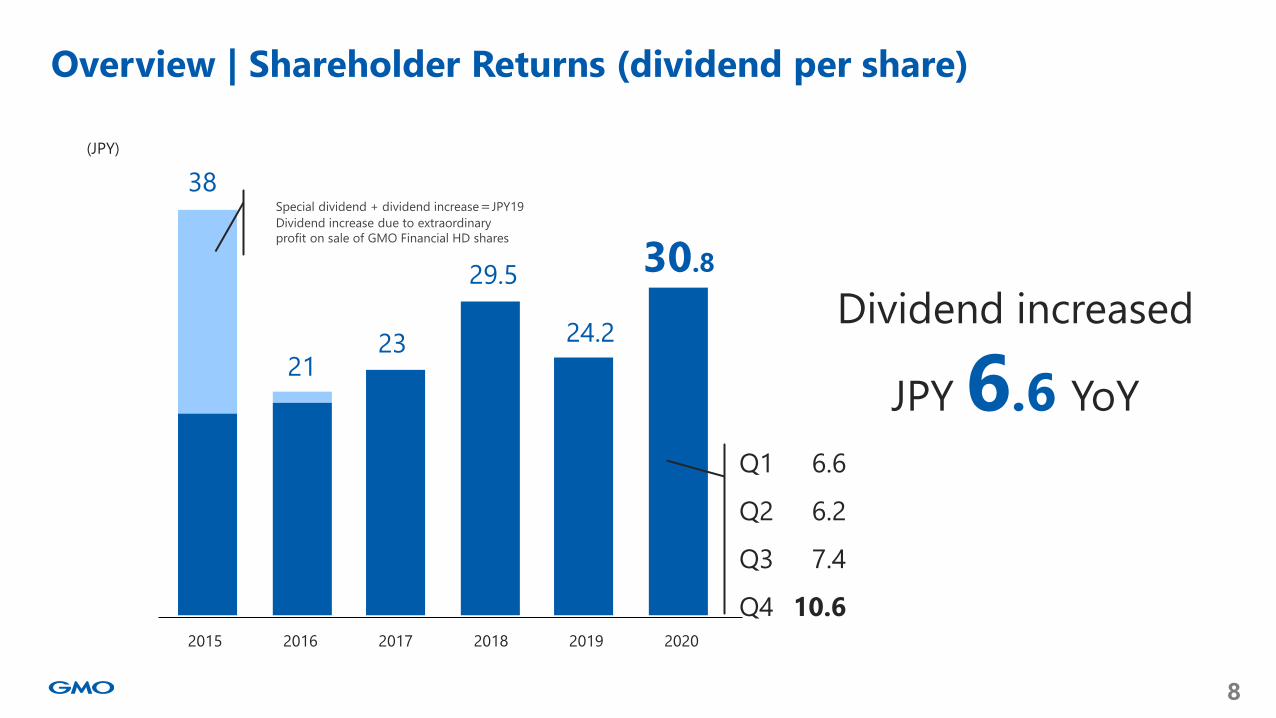
2016 2017 202020182015 2019
38
29.5
2321
30.8
24.2
Special dividend + dividend increase=JPY19
Dividend increase due to extraordinary
profit on sale of GMO Financial HD shares
Overview | Shareholder Returns (dividend per share)
(JPY)
Dividend increased
JPY 6.6 YoY
Q1
Q2
Q3
Q4
6.6
6.2
7.4
10.6

9
4.47
2.43 2.653.39
2.753.39
2.231.18
3.103.16
6.17
4.47 4.663.83
3.39
5.86
12.73
15 16 17 18 19 20
■ Acquisition amount of our own stock (not yet retired)
■ Acquisition amount of our own stock (retired)
■ Total amount paid out in dividends
*2
Overview | Shareholder Returns (total shareholder returns)
(JPY billions)
*1: c.f. press release dated July 30, 2015, entitled “Notice of Revision to
Shareholder Returns Policy with Long Term Share Buyback Plan”
*2: Out of which JPY 3.16 B is related to the net profit in FY2019 and FY2020
and is the total amount to be retired as resolved today
Total acquisition
amount of our own
stock after
announcement of
shareholder returns
policy*1:
JPY 15.8B

10
Total cost of
share acquisition Up to JPY 5.63B
Total number of
shares to be
acquired
Up to 5M shares (to be retired)
4.58% of shares issued (as of December 2020)
Acquisition period February 15, 2021, through to February 14, 2022
Overview | Shareholder Returns (acquisition of treasury stock)

11
1. Overview
2. Financial Results
3. Segment Report
i) Group Overview
ii) Internet Infrastructure
iii) Online Advertising & Media
iv) Internet Finance
v) Cryptoassets
4. E-Contract Service GMO Sign
5. Conclusion
12
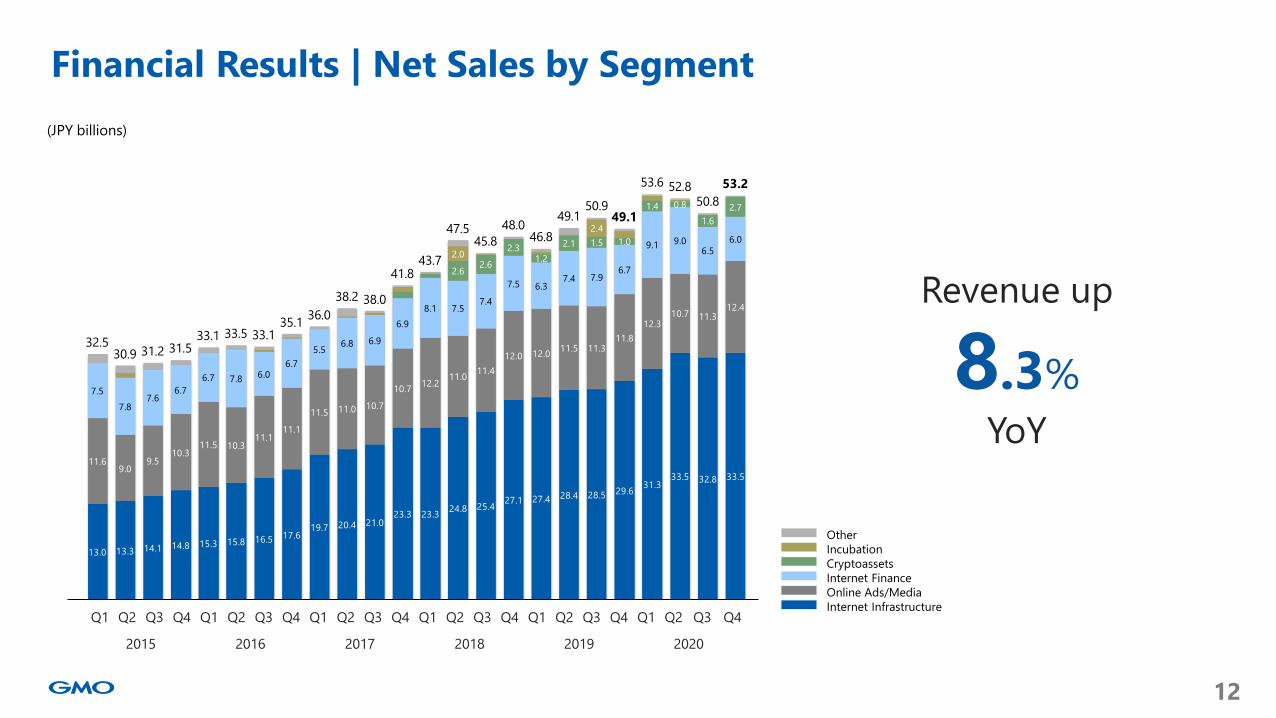
13.0 13.3 14.1 14.8 15.3 15.8 16.5 17.619.7 20.4 21.0
23.3 23.324.8 25.4
27.1 27.4 28.4 28.5 29.631.3
33.5 32.8 33.5
11.69.0
9.510.3
11.5 10.311.1
11.1
11.5 11.0 10.7
10.712.2
11.011.4
12.0 12.011.5 11.3
11.8
12.310.7 11.3
12.4
7.5
7.87.6
6.7
6.7 7.8 6.06.7
5.56.8 6.9
6.9
8.1 7.57.4
7.5 6.37.4 7.9
6.7
9.1 9.06.5
6.0
2.62.6
2.31.2
2.1 1.5 1.0
1.4 0.8
1.6
2.7
2.0
2.4
32.530.9 31.2 31.5
33.1 33.5 33.135.1
36.0
38.2 38.0
41.843.7
47.545.8
48.046.8
49.150.9
49.1
53.6 52.850.8
53.2
Revenue up
8.3%
YoY
Other
Incubation
Cryptoassets
Internet Finance
Online Ads/Media
Internet Infrastructure
Financial Results | Net Sales by Segment
(JPY billions)
2015
Q1 Q2 Q3 Q4
2016 2017 2018 2019 2020
Q1 Q2 Q3 Q4 Q1 Q2 Q3 Q4 Q1 Q2 Q3 Q4 Q1 Q2 Q3 Q4 Q1 Q2 Q4Q3

13
1.12 1.211.00 0.96
1.39 1.591.96
1.652.15
1.802.02
2.50 2.58 2.76 2.933.15
3.61 3.58 3.76
3.09
3.87
4.67
4.013.72
0.56 0.21 0.26 0.15
0.44 0.21
0.41
0.20
0.25
0.19
0.28
0.23 0.31 0.06
0.05
0.32
0.24 0.09 0.06
0.14
0.17
-0.05
0.04 0.25
2.18 2.80
2.47
2.19
2.07
3.31 1.97
2.24 1.232.35
2.33
2.05
3.30
2.602.58
2.26 1.462.31
2.91
1.80
3.39
3.81
1.771.63
-0.01 -0.01 -0.07 -0.23
0.53
-0.73
0.25 0.10
-0.98
-0.22
0.67
0.42
0.08
0.42
-0.26
0.38
0.21
0.480.18
0.38
1.56
0.11
1.91
0.48
0.44
-0.30 -0.75 -0.78
-0.30
3.85
4.64
3.58
2.72
3.65
5.03
4.29 4.03
3.53
3.96
4.49
5.65
5.26
6.51
5.53 4.46 5.00
5.95
8.97
5.34
8.28 8.13
6.09
5.37 Profit up
0.5%
YoY
Financial Results | Profit by Segment
Other
Incubation
Cryptoassets
Internet Finance
Online Ads/Media
Internet Infrastructure
(JPY billions)
2015
Q1 Q2 Q3 Q4
2016 2017 2018 2019 2020
Q1 Q2 Q3 Q4 Q1 Q2 Q3 Q4 Q1 Q2 Q3 Q4 Q1 Q2 Q3 Q4 Q1 Q2 Q4Q3

14
1. Overview
2. Financial Results
3. Segment Report
i) Group Overview
ii) Internet Infrastructure
iii) Online Advertising & Media
iv) Internet Finance
v) Cryptoassets
4. E-Contract Service GMO Sign
5. Conclusion

15
Stock Code Stock Name ExchangeMarket Cap*1
(JPY billions)% Ownership*2 Equity Share
(JPY billions)
9449 GMO Internet TSE1 399.7
3769 GMO Payment Gateway TSE1 1,175.8 42.3% 497.6
3788 GMO GlobalSign HD TSE1 120.3 51.8% 62.3
7177 GMO Financial Holdings TSE JQS 91.1 65.6% 59.7
4051 GMO Financial Gate TSE MOTHERS 86.2 25.1%*321.6
3633 GMO Pepabo TSE1 33.2 57.8% 19.2
4784 GMO AD Partners TSE JQS 10.0 56.3% 5.6
3695 GMO Research TSE MOTHERS 2.9 54.9% 1.6
6180 GMO Media TSE MOTHERS 2.6 66.4% 1.7
6026 GMO TECH TSE MOTHERS 2.4 54.1% 1.3
Group Total 1,924.6*4 670.9*1 Market value as of February 10, 2021 *2 Includes indirect holdings (as of the end of December)
*3 GMO Internet owns 25.1% of GMO-FG indirectly through GMO-PG *4 Calculated as the sum of the listed market cap values
Group Overview | Listed Group Companies: Equity Share

16
Group Overview | Business Segments (Composition)
Solid revenue base
13.29M customers
(Infrastructure and Finance)
Up
0.46M
YoY
*Net sales ratio is calculated based on the numbers before cancelling inter-segment transactions. *13.29M is an aggregate number of customers (the actual number) in Infrastructure, Finance, and Cryptoassets segments.
*Regarding Internet Finance, the number of accounts does not include GMO Aozora Net Bank’s accounts.
17
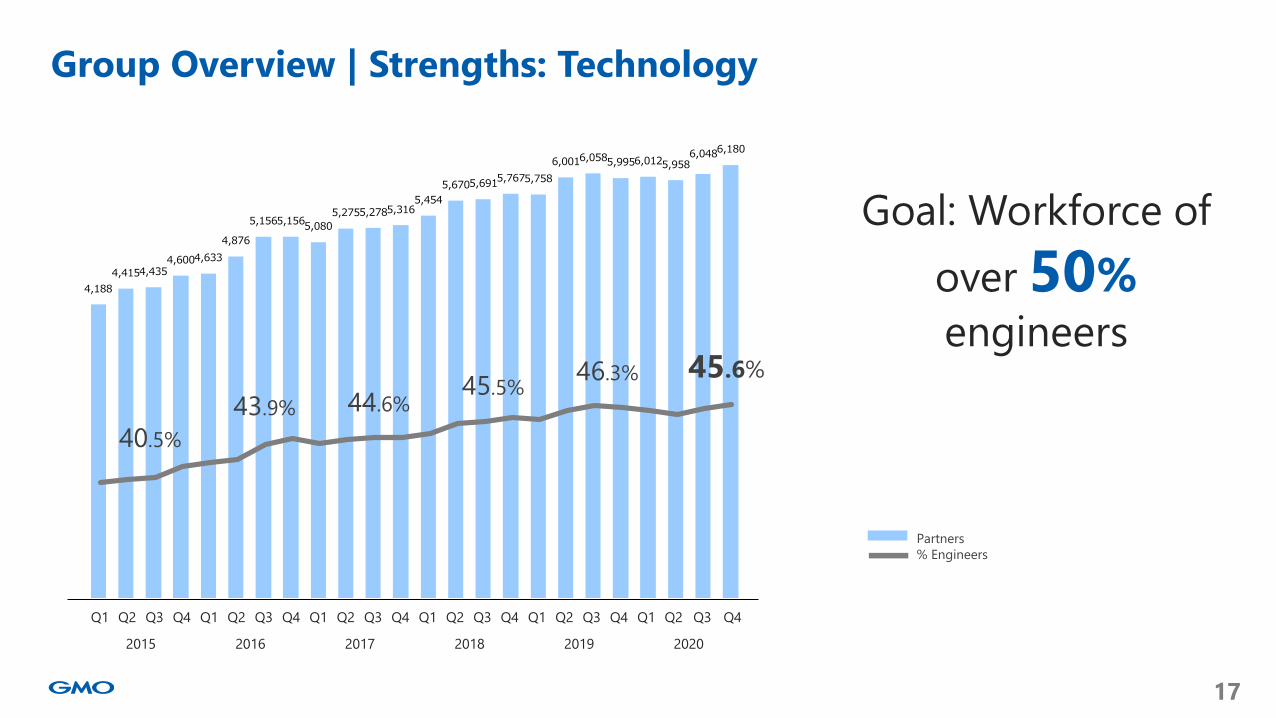
4,188
4,4154,4354,6004,633
4,876
5,1565,1565,080
5,2755,2785,3165,454
5,6705,6915,7675,758
6,0016,0585,9956,0125,9586,0486,180
Partners
% Engineers
Group Overview | Strengths: Technology
Goal: Workforce of
over 50%engineers
45.6%
40.5%
45.5%44.6%43.9%
46.3%
2015
Q1 Q2 Q3 Q4
2016 2017 2018 2019 2020
Q1 Q2 Q3 Q4 Q1 Q2 Q3 Q4 Q1 Q2 Q3 Q4 Q1 Q2 Q3 Q4 Q1 Q2 Q4Q3

18
1. Overview
2. Financial Results
3. Segment Report
i) Group Overview
ii) Internet Infrastructure
iii) Online Advertising & Media
iv) Internet Finance
v) Cryptoassets
4. E-Contract Service GMO Sign
5. Conclusion

19*1 Based on our own data *2 Based on ICANN data *3 Based on domaintools.com data *4 Country code based on Netcraft data
*5 In 2020, Oricon announced that GMO TokuToku BB became the top-ranked provider in terms of customer satisfaction
85.0%*2
Hosting & Cloud
Domain Registry 81.0%*1
Domain Registrar
ASP Cart 64,557paid stores
Security
Payment 160,535 merchants
57.1%*3
50.5%*4
Strong
No. 1
Strong
No. 1
No. 1
No. 1
No. 1
No. 1 Provider (ISP)
No. 1
No. 1*5
Electronic Contract 140K accountsNo. 1
Internet Infrastructure | Collection of No. 1 services
Domestic market share at
Domestic market share at
Domestic market share at
Domestic market share at
provider in terms of customer satisfaction
New

20
10.6 13.418.3
26.233.6
41.7
6.27.8
8.1
8.4
9.0
9.5
13.913.8
14.0
14.2
14.3
15.1
6.38.1
8.8
10.5
11.8
14.8
4.3
4.9
5.2
5.9
6.3
6.3
9.4
13.3
24.3
29.0
33.3
37.4
4.4
3.8
5.3
6.2
5.5
6.2
55.4
65.4
84.6
100.8
114.0
131.2
2015 2016 2017 2018 2019 2020 2015 2016 2017 2018 2019 2020
Other
Payment
Security
Ecommerce Solutions
Hosting & Cloud
Domain
Provider
4.31
6.59
8.47
11.44
14.06
16.28
Internet Infrastructure | Full-year results trends
Net Sales: Up 15.1% YoY Operating Profit: Up 15.8% YoY
(JPY billions) (JPY billions)

21
Revenue up
13.4%
YoY
Internet Infrastructure | Net Sales by Sub-Segment
Other
Payment
Security
Ecommerce Solutions
Hosting & Cloud
Domain
Provider
(JPY billions)
2.3 2.5 2.7 2.9 3.0 3.2 3.4 3.6 3.9 4.4 4.7 5.2 5.56.4 6.9 7.3 7.7
8.4 8.6 8.8 9.210.5 10.8 11.0
1.5 1.5 1.41.7 1.9 1.9 2.0 1.9 1.9
2.0 2.02.1 2.1
2.12.1
2.12.2
2.3 2.2 2.22.3
2.4 2.3 2.3
3.4 3.4 3.43.5 3.4 3.4 3.4 3.5 3.5
3.5 3.43.5 3.5
3.53.6
3.63.5
3.6 3.6 3.63.7
3.7 3.8 3.8
1.3 1.4 1.61.8 1.8 1.9
2.0 2.2 2.12.1 2.1
2.4 2.3
2.52.6
3.03.0
2.8 2.9 2.93.2
3.63.9 3.9
0.91.1 1.0
1.1 1.1 1.11.3
1.2 1.21.2 1.2
1.4 1.4
1.41.5
1.51.5
1.5 1.5 1.6
1.6
1.61.5 1.4
2.12.1
2.5
2.62.9 2.9
3.14.2
5.55.5
5.9
7.3 6.7
6.8
7.3
8.1 7.88.0
8.49.0
9.3
9.4 8.89.7
1.11.0
1.20.9
0.91.1
0.9
0.7
1.21.4
1.4
1.3 1.6
1.8
1.4
1.2 1.5
1.61.1
1.2
1.7
2.01.3
1.0
13.0 13.314.1
14.815.3
15.816.5
17.6
19.720.4
21.0
23.3 23.3
24.825.4
27.1 27.428.4 28.5
29.6
31.3
33.532.8
33.5
+24.9%
+23.5%
+7.7%
(+28.0%)*1
*2
*1: Value excluding overseas subsidiary (Q2 FY2020: MacroKiosk is no longer a consolidated subsidiary)
*2: MacroKiosk: JPY 1.43B
2015
Q1 Q2 Q3 Q4
2016 2017 2018 2019 2020
Q1 Q2 Q3 Q4 Q1 Q2 Q3 Q4 Q1 Q2 Q3 Q4 Q1 Q2 Q3 Q4 Q1 Q2 Q4Q3

22
Internet Infrastructure | Operating Profit
Profit up
20.2%
YoY
(JPY billions)
1.121.21
1.00 0.96
1.39
1.59
1.96
1.65
2.15
1.80
2.02
2.502.58
2.762.93
3.15
3.61 3.583.76
3.09
3.87
4.67
4.01
3.72
2015
Q1 Q2 Q3 Q4
2016 2017 2018 2019 2020
Q1 Q2 Q3 Q4 Q1 Q2 Q3 Q4 Q1 Q2 Q3 Q4 Q1 Q2 Q3 Q4 Q1 Q2 Q4Q3

23
Internet Infrastructure | Breakdown of Operating Profit
Payment business
Other
Cost distribution
(JPY billions)
0.760.810.67
0.870.87
1.07
0.86
1.201.33
1.40
1.07
1.58
1.751.731.63
2.082.19
2.422.34
2.08
2.68
3.12
2.58
3.04
0.510.570.49
0.29
0.700.68
1.26
0.66
1.06
0.66
1.161.25
1.11
1.38
1.56
1.36
1.76
1.59
1.83
1.46
1.69
1.951.82
1.18
-0.14 -0.17 -0.16 -0.20 -0.18 -0.16 -0.16 -0.21 -0.25 -0.26 -0.21 -0.33 -0.27
-0.34 -0.26 -0.29 -0.34
-0.42 -0.40 -0.45 -0.51 -0.40 -0.39
-0.49
2015
Q1 Q2 Q3 Q4
2016 2017 2018 2019 2020
Q1 Q2 Q3 Q4 Q1 Q2 Q3 Q4 Q1 Q2 Q3 Q4 Q1 Q2 Q3 Q4 Q1 Q2 Q4Q3
Increase in one-off costs, such as
bonuses linked to performance, etc.
- Aggressive marketing
- SSL‘s unit price declined due to one-
off factors

24
Solid revenue base
11.58M
customers
(millions)
Internet Infrastructure | Contracts
6.44
6.847.15
7.677.88
8.348.60
8.968.71 8.76 8.75
8.97 9.099.27
9.609.94
10.35
10.7310.92
11.2611.4311.5511.5111.58
2015
Q1 Q2 Q3 Q4
2016 2017 2018 2019 2020
Q1 Q2 Q3 Q4 Q1 Q2 Q3 Q4 Q1 Q2 Q3 Q4 Q1 Q2 Q3 Q4 Q1 Q2 Q4Q3

25
Internet Infrastructure | Number of e-contract accounts
Number of accounts
increased 37-fold YoY,
achieving No. 1!
2018 2019 2020
Q1 Q2 Q3 Q4 Q1 Q2 Q3 Q4 Q1 Q2 Q3 Q4
8
48
140
3
(thousands)

26
Ecommerce Solutions: transaction volume
(JPY billion)
Up
46.4%
YoY
Freenance
SUZURI, Canvath
minne
ASP shopping cart
80
118
2
3
5659 60
6664
6765
7267 68 68
77
72 74 73
8078 77
8183 84
117
111
122
2015
Q1 Q2 Q3 Q4
2016 2017 2018 2019 2020
Q1 Q2 Q3 Q4 Q1 Q2 Q3 Q4 Q1 Q2 Q3 Q4 Q1 Q2 Q3 Q4 Q1 Q2 Q4Q3
27
1. Overview
2. Financial Results
3. Segment Report
i) Group Overview
ii) Internet Infrastructure
iii) Online Advertising & Media
iv) Internet Finance
v) Cryptoassets
4. E-Contract Service GMO Sign
5. Conclusion

28
24.5 26.7 28.231.5 32.4 33.1
13.5 14.4 12.6
12.0 11.0 10.3 2.5
2.9 3.13.1 3.2 3.3
40.5
44.1 44.0 46.7 46.8 46.8
2015 2016 2017 2018 2019 2020 2015 2016 2017 2018 2019 2020
■ Internet Media
■ Online Advertising
■ Internet Research/Other
1.20
1.29
0.97
0.76
0.54
0.42
Online Advertising & Media | Full-year results trends
Net Sales: Up 0.1% YoY Operating Profit: Down 23.1% YoY
(JPY billions) (JPY billions)

29
7.4
5.2 5.56.2
6.86.1
6.8 6.97.3 7.1 6.8 6.9
8.3
7.07.8
8.2 8.3 8.0 7.78.2 8.5
7.78.1
8.6
3.5
3.33.2
3.4
3.8
3.5
3.6 3.43.3
3.03.1 3.0
3.1
3.2
2.82.8 2.9
2.72.7
2.62.8
2.2
2.4
2.7
0.6
0.50.7
0.6
0.7
0.7
0.6 0.70.8
0.70.7 0.8
0.7
0.70.7
0.9 0.8
0.70.8
0.8
0.9
0.6
0.7
0.911.6
9.0 9.5
10.3
11.5
10.3
11.1 11.1 11.5
11.0 10.7 10.7
12.2
11.0 11.4
12.0 12.0
11.5 11.3 11.8
12.3
10.7
11.3
12.4
■ Internet Media
■ Online Advertising
■ Internet Research/Other
(JPY billions)
Online Advertising & Media | Net Sales
Revenue up
4.7%
YoY+4.2%
+4.4%
2015
Q1 Q2 Q3 Q4
2016 2017 2018 2019 2020
Q1 Q2 Q3 Q4 Q1 Q2 Q3 Q4 Q1 Q2 Q3 Q4 Q1 Q2 Q3 Q4 Q1 Q2 Q4Q3

30
0.56
0.21
0.26
0.15
0.44
0.21
0.41
0.20
0.25
0.19
0.28
0.23
0.31
0.06 0.05
0.32
0.24
0.09 0.06
0.14 0.17
-0.05
0.04
0.25
Profit up
79.1%
YoY
Online Advertising & Media | Operating Profit
(JPY billions)
2015
Q1 Q2 Q3 Q4
2016 2017 2018 2019 2020
Q1 Q2 Q3 Q4 Q1 Q2 Q3 Q4 Q1 Q2 Q3 Q4 Q1 Q2 Q3 Q4 Q1 Q2 Q4Q3
31
1. Overview
2. Financial Results
3. Segment Report
i) Group Overview
ii) Internet Infrastructure
iii) Online Advertising & Media
iv) Internet Finance
v) Cryptoassets
4. E-Contract Service GMO Sign
5. Conclusion

32
9.66 9.62
7.98
10.75
8.51
10.6129.8
27.326.3
30.7
28.5
30.8
2015 2016 2017 2018 2019 2020 2015 2016 2017 2018 2019 2020
Internet Finance | Full-year results trends
Net Sales: Up 8.0% YoY Operating Profit: Up 24.7% YoY
(JPY billions) (JPY billions)

33
7.5 7.8
7.6
6.7 6.7
7.8
6.0
6.7
5.5
6.8 6.9 6.9
8.1
7.5 7.4 7.5
6.3
7.4
7.9
6.7
9.1 9.0
6.5
6.0
Revenue down
9.7%
Profit down
9.8%
YoY
(JPY billions)
Net
Sales
OP
Internet Finance | Historical Performance by Quarter
2.18
2.802.47
2.19 2.07
3.31
1.972.24
1.23
2.35 2.332.05
3.30
2.60 2.582.26
1.46
2.31
2.91
1.80
3.39
3.81
1.771.63
2015
Q1 Q2 Q3 Q4
2016 2017 2018 2019 2020
Q1 Q2 Q3 Q4 Q1 Q2 Q3 Q4 Q1 Q2 Q3 Q4 Q1 Q2 Q3 Q4 Q1 Q2 Q4Q3

34Prepared based on Results Presentation of GMO Financial HD for Q4 of FY2020 and “Monthly Statistical Bulletin on Over-The Counter Retail FX Margin Trading” published
by the Financial Futures Association of Japan (FFAJ)
*1: According to Finance Magnates
Trading volume (JPY trillions)
Share
Internet Finance | FX Trading Volume
Highest trading
volume globally*1
247
351
213 206
173
393
24.1%24.7%
20.7%
24.3%21.7%
2015
Q1 Q2 Q3 Q4
2016 2017 2018 2019 2020
Q1 Q2 Q3 Q4 Q1 Q2 Q3 Q4 Q1 Q2 Q3 Q4 Q1 Q2 Q3 Q4 Q1 Q2 Q4Q3

35
1. Overview
2. Financial Results
3. Segment Report
i) Group Overview
ii) Internet Infrastructure
iii) Online Advertising & Media
iv) Internet Finance
v) Cryptoassets
4. E-Contract Service GMO Sign
5. Conclusion

36
Cryptoassets business
Cryptoassets mining business
Cryptoassets exchange
businessCryptoassets
Cryptoassets payment
┗Issue stablecoin
Mining
Exchange
Payment

37
0.8
8.2
6.0
6.7
0.20
-1.36
0.95
0.76
2017 2018 2019 2020 2017 2018 2019 2020
Development
of stablecoin:
-0.38B
Cryptoassets business | Full-year results trends
Net Sales: Up 10.8% YoY Operating Profit: Down 19.8% YoY
(JPY billions)

38
0.96
0.63
2.652.61
2.33
1.29
2.10
1.57
1.09
1.43
0.84
1.66
2.77
-0.07 -0.23
0.53
-0.73
0.25 0.10
-0.98
-0.22
0.67 0.42
0.08 0.42
-0.26
0.38 0.21
Cryptoassets business | Historical performance by quarter
Net sales were up.
Producing good results.
(JPY billions)
Net
Sales
OP
2017 2018
Q2 Q3 Q4 Q1 Q1Q2 Q3 Q4
2019
Q4Q2 Q3 Q4
2020
Q1 Q2 Q3
Development
of stablecoin:
-0.38B

39
0.09
0.61
1.171.23
1.29
0.79
0.61
0.49
0.250.230.220.26
0.64
0.19
-0.36 -0.65
-1.21
-0.05 0.17 0.11
-0.12 -0.11 -0.22 -0.15 0.00
Cryptoassets Mining business | Historical performance by quarter
Net sales*
OP
*Gross figure including revaluation gain (loss) of cryptoassets, which was -0.16B in Q1
FY2018, +0.06B in Q2 FY2018, +0.01B in Q3 FY2018, -0.01B in Q4 FY2018, -0.00B in Q1
FY2019, -0.00B in Q2 FY2019, -0.00B in Q3 FY2019, -0.00B in Q4 FY2019, -0.00B in Q1
FY2020, -0.00B in Q2 FY2020, -0.00B in Q3 FY2020, and -0.01B in Q4 FY2020.
(JPY billions)
Profitability increased due to
rise in cryptoasset price
Q4 Q1 Q1Q2 Q3 Q4 Q4Q2 Q3 Q4
2017 2018 2019 2020
Q1 Q2 Q3

40
106
179
219
379392
376
489
400382
464
321
388
256247
294
160
259
296
207
137
1009980 79
9274
5780
63
95108
67
111
171
248
377
3 6 9 12 3 6 9 12 3 6 9 12
2018 2019 2020
Our hash rate (PH/s)*1
Our hash rate (monthly average) (PH/s)*1
Amount of mined Bitcoin Cash (JPY millions)*2
Amount of mined Bitcoin (JPY millions)*2
*1 GMO Internet’s mining abilities
*2 Reference value based on amount of mined Bitcoin and Bitcoin Cash and the rate as of the end of each month (i.e. not the precise mining revenue)
Amount of mined
cryptoassets is
increasing
Cryptoassets mining | Our hash rate and the amount of mined Bitcoin
551
670
479
129
384
496
219
167 169 162
549
657
391
525
454
Bitcoin halving

41
0.86
0.19
1.421.36
1.05
0.50
1.49
1.08
0.84
1.21
0.62
1.40
2.15
-0.07 -0.23
0.50
-0.76
0.55 0.74
0.24
-0.16
0.50 0.31 0.21
0.54
-0.02
0.58 0.61
(JPY billions)
Cryptoassets Trading business | Historical performance by quarter
Net
Sales
OP
Revenue was up due to
favorable market conditions.
Aggressive marketing.
2017 2018
Q2 Q3 Q4 Q1 Q1Q2 Q3 Q4
2019
Q4Q2 Q3 Q4
2020
Q1 Q2 Q3

42
1. Overview
2. Financial Results
3. Segment Report
i) Group Overview
ii) Internet Infrastructure
iii) Online Advertising & Media
iv) Internet Finance
v) Cryptoassets
4. E-Contract Service GMO Sign
5. Conclusion

43
Change of service name
GMO's e-contract service Agree changed its name to GMO Sign on February 12, 2021.

44
*1 Source: "The number of user companies," Financial Results for 3Q FY3/2021, Bengo4.com, Inc.
*2 Number of user companies of e-contract service GMO Sign. One account per operator (company or individual).
If a given operator uses multiple accounts, duplicated accounts are excluded. As of February 11, 2021.
Comparison of the major Japanese electronic contract services in 2020 (according to GMO GlobalSign HD's
research).
(thousands)
CloudSign*1
Number of electronic contract accounts
140
127
3 48
107
65
2018 2019 2020
Q1 Q2 Q3 Q4 Q1 Q2 Q3 Q4 Q1 Q2 Q3 Q4
*2
Accumulated number of companies
that introduced GMO Sign
Electronic Contract Service

45
* Source: "The number of contracts," Financial Results for 3Q FY3/2021, Bengo4.com, Inc.
(thousands)
CloudSign*
365
Increased
2.6-fold
YoY
Number of contracts
139
303
715
570
312
2018 2019 2020
Q1 Q2 Q3 Q4 Q1 Q2 Q3 Q4 Q1 Q2 Q3 Q4

46
Future of seal impression

47
Seal
impression
with a
smartphone

48
Any
document,
including
contract
⚫Bill/receipt
⚫Order sheet
⚫Medical data
⚫Diploma
⚫Certificate
4
8

49
for Everyone

50
Largest differentiation:
core verification technologies

51
Long performance history
monthly electronic
signatures
2M
Certificate Authority
with high global
market share
Employed by DocuSign (USA)
Contract, bill, receipt,
diploma, etc.
Available gobally
Operating the only Japanese Certificate Authority globally
of performance
25years
worldwide
5firmsof PC browsers is
equipped with
our product
99.8%

52
GlobalSign provides verification technologies
Financial and construction industries

53
Overall strength of
GMO Internet Group

54
Sales
expansion
utilizing
the
Group's
customer
base13M
existing customers
More than
10Knew contracts
each day

55
What GMO Internet Group can do
Server
operationMy number card
integration
Identity and
security
solutions
Payment
feature
Single
sing-on
Face
Recognition
e-KYCCustomer
base

56
Conclusion

57
Internet
Infrastructure
Existing No. 1 products are expected to see two-digit growth in
FY2021. E-contract service GMO Sign becomes No. 1.
Online Ad &
Media
Steady growth of the advertising will continue.
Continue to enhance in-house products and media.
Internet
Finance
FX: improve profitability by using the AI and the big-data and
upgrading the BtoB transaction
CFD: aggressive advertising and enhancement of cross-selling to
grow even further
Cryptoassets
Mining: payback following a restructuring
GMO Coin: become No. 1 in terms of the domestic market share
Stablecoin: issue the world’s first yen-pegged cryptoassets GYEN
Outlook
FY2021

585858
Internet for Everyone
595959
This document includes projections based on expectations, premises and plans as of February 12, 2021. These projections may differ from actual
results due to factors including changes in the global economy, competition, exchange rate fluctuations, market cap of cryptocurrency, natural
disasters and other unforeseeable events. Some of the figures given, such as market share are based on our own calculations. These figures may
differ from research agency figures.
Information contained in this document is provided for information purposes only and does not constitute solicitation of investors. Further,
results forecasts and other forward-looking statements are based on premises that include risks and factors that are largely indeterminable.
Please understand that actual results may differ significantly as a result of forces including economic conditions and market environment. No
responsibility for any reason is accepted for damage sustained as a result of actions taken based on this information.
Copyright (C) 2021 GMO Internet, Inc. All Rights Reserved.
We are planning on making an earnings announcement for FY2021 First Quarter after 3 pm on May 12, 2021.

60
Appendix

61
Significant Group Companies
- Europe
(UK)
GMO-Z.com Trade UK LTD.GMO GlobalSign Ltd.
(Belgium)
GlobalSign NV
Internet Infrastructure
GMO Internet, Inc. (TSE:9449)
GMO Payment Gateway, Inc. (TSE:3769)
GMO GlobalSign Holdings, Inc. (TSE:3788)
GMO Pepabo Inc. (TSE: 3633)
GMO Financial Gate, Inc. (Mothers: 4051)
GlobalSign K.K.
GMO CARS, Inc.
GMO MAKESHOP Co. Ltd.
GMO Commerce, Inc.
GMO Epsilon, Inc.
GMO Payment Services, Inc.
Global Card System,Inc.
GMO Data, Inc.
GMO Registry, Inc.
GMO System Consulting, Inc.
GMO Creators Network, Inc.
GMO Brights Consulting, Inc.
GMO TownWiFi, Inc. (and other companies)
61
(UAE)
GMO GlobalSign FZ-LLC
(India)
GMO GlobalSign Certificate Services Private limited; GMO Research Pvt.Ltd.
(Myanmar)
GMO-Z.com ACE Co. Ltd.
(Thailand)
GMO-Z.com Securities Thailand; GMO-Z.com NetDesign Holdings Co.,Ltd
(Singapore)
GMO-Z.com Pte. Ltd.; GMO GlobalSign Pte. Ltd.; GMO-Z.com PAYMENT GATEWAY Pte Ltd.
(Vietnam)
GMO-Z.com Runsystem JSC; GMO-Z.com Vietnam Lab Center Co. Ltd.
(Philippines)
GMO GlobalSign Inc.
- Tohoku region
GMO Internet, Inc. (Sendai Office)
- Hokkaido Pref.GMO DIGITAL Lab, Inc.
- Kyushu and Chugoku regions
GMO GlobalSign HD, Inc. (Shimonoseki Branch)
GMO Pepabo, Inc. (Fukuoka Branch)
GMO Internet, Inc. (Kokura and Miyazaki Offices)
GMO NIKKO, Inc. (Miyazaki Office)
GMO TECH, Inc. (Miyazaki Office)
- Osaka region
GMO Internet, Inc.
(Osaka Sales Office)
GMO GlobalSign HD, Inc.
GMO Payment Gateway, Inc.
GMO Solution Partner, Inc.
GMO DigiRock, Inc.
- AsiaGMO Globalsign China (PRC)
GMO-Z.com Forex HK Limited (Hong Kong)
GMO-Z.com PAYMENT GATEWAY HK Limited. (Hong Kong)
(US)
GMO GlobalSign, Inc.
GMO-Z.com USA,Inc
127 Group Companies (100 consolidated, 20 non-consolidated, 4 equity method affiliates, 3 non-equity method affiliates) *As of December 2020
Listed Company
(total 10 companies)
Cryptoassets
GMO Internet, Inc.
GMO Coin
GMO System Trade, Inc.
GMO-Z.com Trust Company, Inc.
Incubation
GMO Venture Partners, Inc.
Other
GMO ReTech, Inc.
Equity Method Affiliate
SMBC GMO PAYMENT, Inc.
GMO Aozora Net Bank, Ltd.
Online Advertising & Media
GMO AD Partners, Inc. (JASDAQ:4784)
GMO NIKKO, Inc.
GMO AD Marketing
GMO Insight, Inc.
GMO Research, Inc. (MOTHERS: 3695)
GMO Media, Inc. (MOTHERS: 6180)
GMO Solution Partner, Inc.
GMO TECH, Inc. (MOTHERS: 6026)
GMO Kumapon, Inc.
(and other companies)
Internet Finance
GMO Financial Holdings, Inc. (JASDAQ:7177)
GMO CLICK Securities, Inc.
FX PRIME by GMO Corporation

62
GMO GlobalSign HD (TSE1)
Rental server, hosting & cloud
GMO Pepabo (TSE1)
Domain registration, rental server, ecommerce
GMO Payment Gateway (TSE1)
Payment processing service
GMO Epsilon
Transaction lending
GMO Payment Service
Future payment
GMO Financial Gate (Mothers)
Offline payment
GMO Financial HD (JASDAQ)
Financial holdings company
GMO CLICK Securities
FX trading, online securities trading
FX Prime byGMO
FX trading
GMO Coin
Cryptoassets exchange, Cryptoassets FX
GMO Internet (TSE1)
Infrastructure & Ecommerce Finance
GMO GlobalSign
SSL server certificate
GMO Aozora Net Bank
(Aozora Bank 85.1% / GMO Internet 7.45% / GMO Financial HD 7.45%)
Net Bank
Cryptoassets
mining
GMO Creators Network
Content production, finance
(GMO Internet 51.8%) (GMO Internet 42.3%) (GMO Internet 65.6%)
(GMO Internet 57.8%)
Domain, hosting & cloud, provider, Cryptoassets mining
Cryptoassets
Trading
Finance, Payment, and Cryptoassets | Group relationship
(GMO Internet 25.1%)

63
Consolidated Balance Sheet
(JPY millions)End of
12/2019
End of
12/2020Change
GMO
Financial HD(End of 12/2020)
Change
Current Assets 811,083 1,005,226 194,142 717,252 119,105
Cash & Deposits 160,315 220,745 60,429 62,000 282
Fixed Assets 60,130 65,318 5,187 8,082 -266
Goodwill 2,778 657 -2,121 285 -163
Software 6,836 7,924 1,087 1,815 -104
Investment Securities 9,881 18,838 8,957 2,865 -177
Total Assets 871,214 1,070,544 199,330 725,367 118,838
Liabilities 768,944 970,429 201,485 688,035 119,311
Interest-bearing debts 155,645 212,425 56,780 109,666 13,707
Net Assets 102,269 100,114 -2,154 37,331 -472
Non-controlling Minority Equity 48,405 49,140 735 1,356 210
Shareholders' Equity 53,784 50,905 -2,878 35,974 -683
Earned Surplus 19,474 26,959 7,485 36,880 2,851
(Shareholders' Equity Ratio) 6.2% 4.8% -1.4pt 5.0% -1.1pt
Liabilities/Net Assets Total 871,214 1,070,544 199,330 725,367 118,838

64
Consolidated Profit and Loss
(JPY millions) FY2019 FY2020 Changesupplementary
information
Net Sales 196,171 210,559 7.3%
Gross Profit on Sales 95,793 105,675 10.3%
Operating Profit 25,279 27,893 10.3%
(OP Margin) 12.9% 13.2% +0.4pt
Non Operating Profit and Loss -772 -756 -
Ordinary Profit 24,506 27,136 10.7%
Extraordinary Profit or loss -1,885 2,790 -
Profit before Tax 22,621 29,926 32.3%
Corporate Taxes etc. 6,253 11,258 80.0%
non-controlling interests 8,029 8,383 4.4%
Profit attributable to
Owners of the Parent8,337 10,284 23.4%
(FY2020)
Gain on sales of investment securities: JPY 7.79 billion
Impairment loss: JPY -3.78 billion

65
(JPY billions) FY19 FY20 Significant FactorsGMO-FH(Jan.-Dec.)
Operating Cash Flow +7.5 +38.2 Income taxes: -4.8B (-14.9B in FY2019) -5.3
Investing Cash Flow -21.6 -15.9
Purchase of tangible and intangible fixed assets: -7.4B (-
11.1B in FY2019)
Acquisition of investment securities: -10.3B (-3.0B in
FY2019)
-2.1
Financing Cash Flow +30.3 +37.5Debt finance: +58.3B (+43.7B in FY2019)
Acquisition of treasury stock: -9.3B (-3.1B in FY2019) +6.5
Change in Cash and
Equivalents+16.0 +58.9 -0.9
Balance of Cash and
Equivalents159.7 218.6 60.2
Consolidated Profit and Loss

66
2019/Q4 2020/Q1 2020/Q2 2020/Q3 2020/Q4
◆Internet Infrastructure
Internet provider 8,841 9,248 10,524 10,892 11,043
Domain 2,255 2,394 2,427 2,375 2,345
Cloud & hosting 3,602 3,740 3,726 3,810 3,881
Ecommercd solutions 2,985 3,250 3,687 3,956 3,973
Security 1,655 1,647 1,651 1,574 1,486
Payment 9,042 9,303 9,471 8,896 9,740
Other 1,223 1,729 2,093 1,308 1,091
Segment total 29,607 31,313 33,582 32,815 33,562
◆Online Advertising & Media
Internet media 2,666 2,840 2,248 2,437 2,783
Online advertising 8,285 8,587 7,799 8,165 8,636
Internet research, other 895 903 694 781 983
Segment total 11,847 12,331 10,742 11,385 12,403
◆Internet Finance
Segment total 6,740 9,156 9,067 6,540 6,087
◆Cryptoassets
Cryptoassets trading 842 1,210 629 1,402 2,150
Cryptoassets mining 254 224 220 263 629
Segment total 1,096 1,435 849 1,666 2,779
◆Incubation
Segment total 951 739 233 28 -
◆Other Businesses
Segment total 328 289 255 244 298
Internal Transactions Adjustment (1,413) (1,566) (1,930) (1,869) (1,883)
Consolidated Net Sales 49,157 53,699 52,800 50,810 53,248
66
(JPY millions)
Revenue Breakdown by Segment

67
(JPY billions)Q4’19
(Oct-Dec)
Q4’20
(Oct-Dec)
YoY
ChangeChange
Net Sales 49.1 53.2 +4.0 +8.3%
Operating Profit 5.34 5.37 +0.02 +0.5%
Ordinary Profit 5.21 5.23 +0.01 +0.3%
Net Profit 1.72 3.54 +1.82 +105.7%
Executive Summary: Q4 FY2020 (Oct-Dec)

68
Executive Summary: Q4 FY2020 (Oct-Dec)
Q4’19 Q4’20
49.1+3.9
-0.5
Q4’19 Q4’20
5.34 5.37-0.17
+0.62
+1.6 53.2
+0.12
-0.78
-0.6
+0.5
-0.9
+0.11 +0.13
(JPY billions)
OP
Net sales
(JPY billions)
Infrastructure Finance Ad Cryptoassets VC Other
Infrastructure Finance Ad Cryptoassets VC Other
Revenue up
4.0B
Profit up
0.02B

69
Global Operations | Locations
19 countries, 60 locations, 1,274 global partners (“staffs”)
Infrastructure
Finance
Cryptoassets*As of Dec. 2020

70
1.111.20 1.21 1.26
1.09 1.14
1.66
1.44 1.39 1.41 1.35
1.67
1.93
2.802.88
2.98 2.973.07
2.84
3.00
3.20
2.863.01
3.42
Global Operations | Global Net Sales
Up
14.1%
YoY
(JPY billions)
Global
Sales Ratio
Net
Sales
Since Q2 FY2020, MacroKiosk is no longer a consolidated subsidiary. We deducted MacroKiosk values from net sales retroactively to Q1 FY2017 in this chart.
2015
Q1 Q2 Q3 Q4
2016 2017 2018 2019 2020
Q1 Q2 Q3 Q4 Q1 Q2 Q3 Q4 Q1 Q2 Q3 Q4 Q1 Q2 Q3 Q4 Q1 Q2 Q4Q3
6.4%
4.2%4.0%
6.4%6.3%
4.1%

71
8,044 7,654 6,633 5,968 7,020
77 160159 146
139
7,129 7,4826,514 6,971
7,282
4,067 4,712
4,709 4,8715,121
1,360 1,340
1,428 1,3611,327
6,7156,951
7,538 7,4387,520
3,1643,612
3,592 3,4853,782
2,7092,646
2,615 2,841
2,9481,7972,282
2,307 2,169
2,695
8,7428,573
9,164 9,457
10,035
0
5,000
10,000
15,000
20,000
25,000
30,000
35,000
40,000
45,000
50,000
2019/Q4 2020/Q1 2020/Q2 2020/Q3 2020/Q4
Human resources
Advertising and promotion
Depreciation and leases
Outsourcing costs
Communication costs
Rent
Commission paid
Media costs
Goodwill depreciation
others
71
Cost Composition (Consolidated)(JPY millions)

727272
Internet Infrastructure

73
1,381
1,801
2,152
Q1 Q2 Q3 Q4 Q1 Q2 Q3 Q4 Q1 Q2 Q3 Q4 Q1 Q2 Q3 Q4 Q1 Q2 Q3 Q4 Q1 Q2 Q3 Q4
2015 2016 2017 2018 2019 2020
2,941
3,653
5,205
7,333
8,841
11,043
Q1 Q2 Q3 Q4 Q1 Q2 Q3 Q4 Q1 Q2 Q3 Q4 Q1 Q2 Q3 Q4 Q1 Q2 Q3 Q4 Q1 Q2 Q3 Q4
2015 2016 2017 2018 2019 2020
73
Subscriptions(thousands)(JPY millions)
Revenue
Internet Infrastructure | Provider - KPIs

74
5,458
6,014 6,114
6,406
7,069
6,586
Q1 Q2 Q3 Q4 Q1 Q2 Q3 Q4 Q1 Q2 Q3 Q4 Q1 Q2 Q3 Q4 Q1 Q2 Q3 Q4 Q1 Q2 Q3 Q4
2015 2016 2017 2018 2019 2020
1,727
1,910
2,138 2,132
2,2552,345
Q1 Q2 Q3 Q4 Q1 Q2 Q3 Q4 Q1 Q2 Q3 Q4 Q1 Q2 Q3 Q4 Q1 Q2 Q3 Q4 Q1 Q2 Q3 Q4
2015 2016 2017 2018 2019 2020
(thousands)
74
(JPY millions)
Revenue Contracts
Internet Infrastructure | Domain Registration - KPIs

75
Registry
(wholesale)
Registrar
(registration/sale)
Japan Overseas
①1999- ③2012-
②2009-
99.4 Selected by ICANN as Asia's first registrar
99.9 Launched domain registrar business
“Onamae.com"
04.3 paperboy&co. (currently, GMO Pepabo), which
operates “MuuMuu Domain", becomes a
consolidated subsidiary
09.7 Established GMO Domain Registry
11.7 DigiRock (currently, GMO DigiRock) that operates
the "Value Domain" becomes a consolidated
subsidiary
11.11 Received support from the Tokyo Metropolitan
Government as a ".tokyo" management operator
12.4 Launched domain registration service "TENTEN.vn"
for Vietnam
14.7 ".tokyo" general registration started
14.11 “Z.com” is selected as the unified brand in
overseas strategy
16.1 ".shop" right bid at ICANN auction. The highest
bid is USD 41.5 M, the highest in the world.
16.9 ".shop" general registration started
Internet Infrastructure | Domain - New Businesses

76
・Operators of .com, .net, etc.
・Only one operator per domain Registry
ICANN
・Global domain management
・NPO
520
2,464
・Domain registration sales
Agency ・Agency
Registrar
Internet Infrastructure | Domains Industry Structure

77
Japan gTLD Operation and Management Market Share No.1in Japan
81.0%
81.0%
Others
+
Internet Infrastructure | Domains Registry Share

78
(thousands)
Renewal rate: 72.0%*
* Renewal rate for domains registered between September 2016 and November 2018 (2nd renewal)
Internet Infrastructure | “.shop”: Registration progress
71111
180
228
328
539 530
614637
603 588
696676 669
731
656
722
792
Q3 Q4 Q1 Q2 Q3 Q4 Q1 Q2 Q3 Q4 Q1 Q2 Q3 Q4 Q1 Q2 3Q 4Q
2016 2017 2018 2019 2020
7979
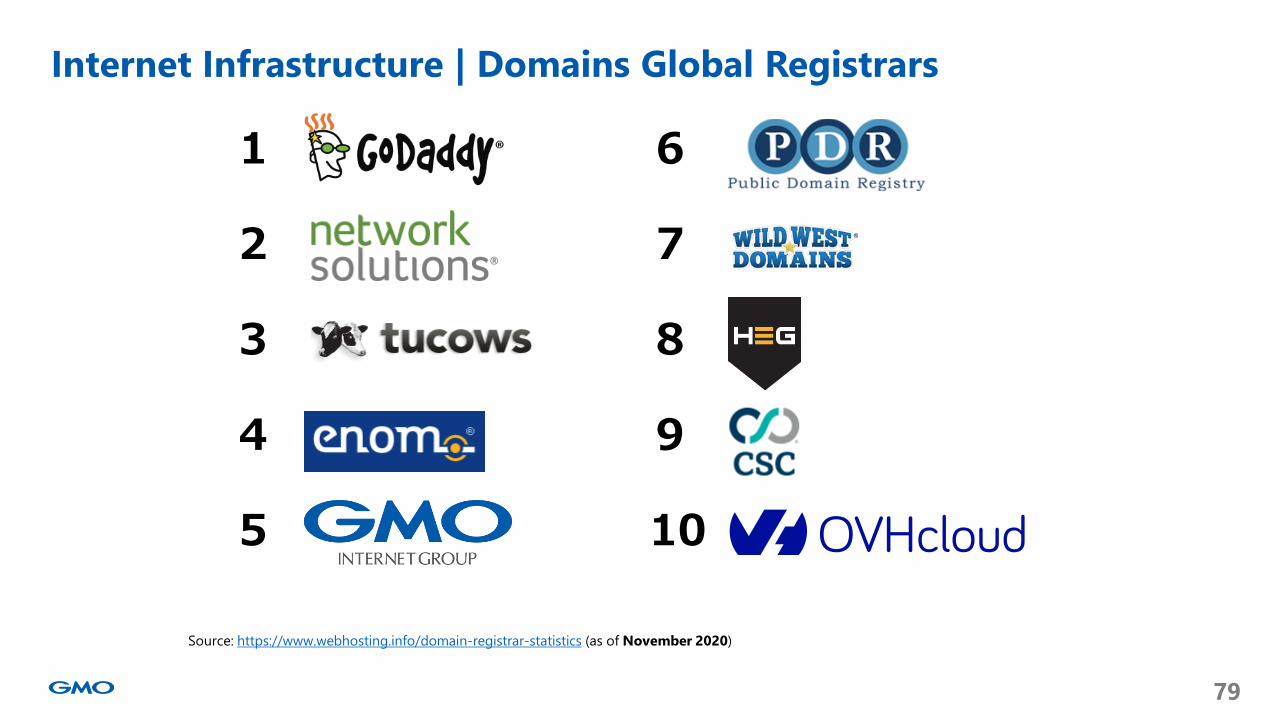
1 6
2 7
3 8
4 9
5 10
Source: https://www.webhosting.info/domain-registrar-statistics (as of November 2020)
Internet Infrastructure | Domains Global Registrars

80
765782
801
857 872
960
Q1 Q2 Q3 Q4 Q1 Q2 Q3 Q4 Q1 Q2 Q3 Q4 Q1 Q2 Q3 Q4 Q1 Q2 Q3 Q4 Q1 Q2 Q3 Q4
2015 2016 2017 2018 2019 2020
3,539 3,554 3,5113,604 3,602
3,881
Q1 Q2 Q3 Q4 Q1 Q2 Q3 Q4 Q1 Q2 Q3 Q4 Q1 Q2 Q3 Q4 Q1 Q2 Q3 Q4 Q1 Q2 Q3 Q4
2015 2016 2017 2018 2019 2020
80
Revenue Contracts(thousands)(JPY millions)
Internet Infrastructure | Hosting & Cloud - KPIs

81
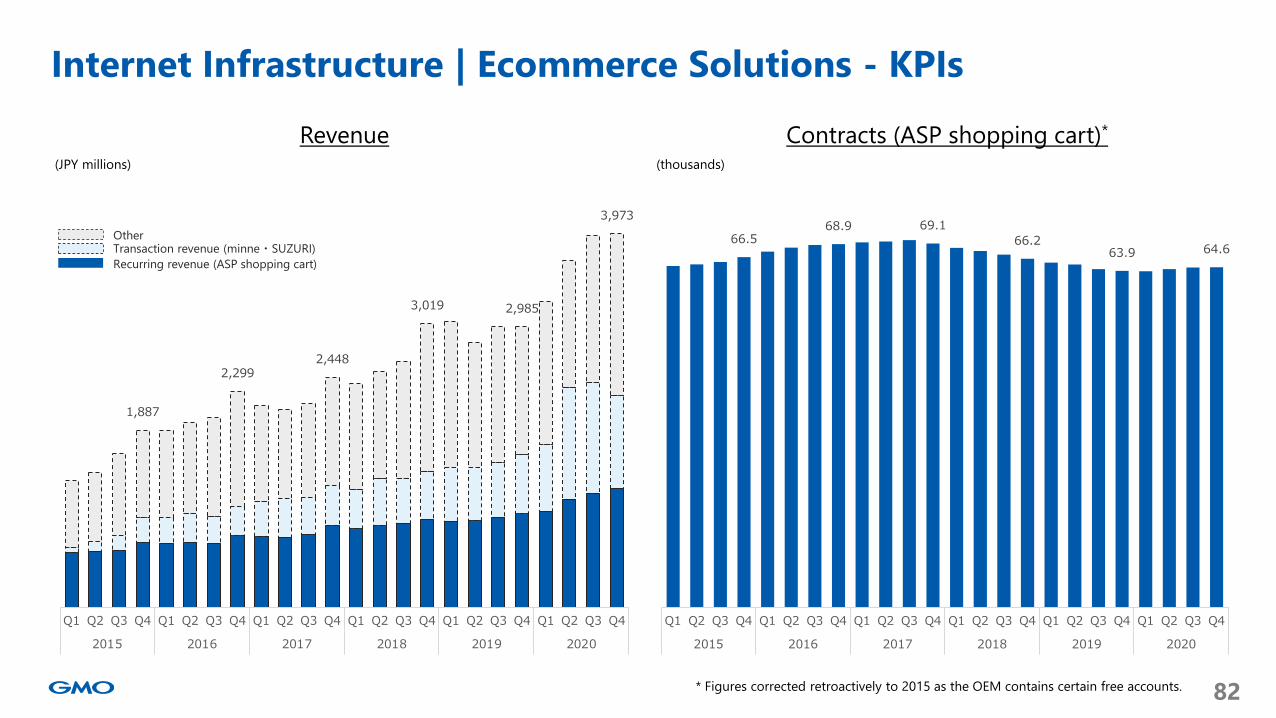
Recurring revenue and transaction revenue through a natural cross-selling
Feature Online store Payment
Service
Business model Recurring Transaction
Revenue Number of stores x unit price GMV x commission rate, etc.
Reportable segments Ecommerce Solutions Payment
Broad ASP shopping cart businesses
82
1,887
2,2992,448
3,019 2,985
3,973
Q1 Q2 Q3 Q4 Q1 Q2 Q3 Q4 Q1 Q2 Q3 Q4 Q1 Q2 Q3 Q4 Q1 Q2 Q3 Q4 Q1 Q2 Q3 Q4
2015 2016 2017 2018 2019 2020
82
Revenue Contracts (ASP shopping cart)*
OtherTransaction revenue (minne・SUZURI)
Recurring revenue (ASP shopping cart)
(thousands)(JPY millions)
Internet Infrastructure | Ecommerce Solutions - KPIs
66.5 68.9 69.1
66.2 63.9 64.6
Q1 Q2 Q3 Q4 Q1 Q2 Q3 Q4 Q1 Q2 Q3 Q4 Q1 Q2 Q3 Q4 Q1 Q2 Q3 Q4 Q1 Q2 Q3 Q4
2015 2016 2017 2018 2019 2020
* Figures corrected retroactively to 2015 as the OEM contains certain free accounts.

83
Internet Infrastructure | Ecommerce solutions business : Total transaction volume
83
1,685
2,317
2,861
3,235
3,043
3,649
Q1 Q2 Q3 Q4 Q1 Q2 Q3 Q4 Q1 Q2 Q3 Q4 Q1 Q2 Q3 Q4 Q1 Q2 Q3 Q4 Q1 Q2 Q3 Q4
2015 2016 2017 2018 2019 2020
(JPY millions)

84
Internet Infrastructure | Ecommerce solutions business : Business model
Services for individuals (customer base) Credit (expertise)
Bank
The Company created the above diagram based on GMO Pepabo‘s “Fiscal Year 2019 2nd Quarter Results Presentation“ published on August 1, 2019.
Virtual account
② Request purchase
of the receivable
③ Immediate
payment (fee)
① Receivable
④ Payment
ClientUser

85
0.03
0.07
0.16
0.32
0.38
0.43
0.39
0.43
Q1 Q2 Q3 Q4 Q1 Q2 Q3 Q4
2019 2020
Increase slowed down,
affected by COVID-19
Internet Infrastructure | Ecommerce solutions business : Total value of purchased receivables
(JPY billions)

86
0
200
400
600
800
1,000
1,200
1,400
1,600
1,800
2,000
0
500
1,000
1,500
2,000
Valid Digital Certificates (as of the end of the month) *2
海外
国内
セキュリティ売上
0
10,000
20,000
30,000
40,000
50,000
60,000
70,000
80,000
90,000
100,000
Newly issued digital certificates *1
海外 国内
*1 Adjusted number of unlimited issuance contract and monthly high-volume issuance. *2 The number of valid digital certificates is the number of certificates that are actually used.
Issued digital
certificates
(thousands)
Issued digital
certificates
Sales
(JPY millions)
Internet Infrastructure | Security - KPIs
Overseas Domestic
Overseas
Domestic
Sales of security

87
Internet Infrastructure | Payment Processing - KPIs
*GMO Payment Gateway’s presentation materials
0
10,000
20,000
30,000
40,000
50,000
60,000
70,000
80,000
90,000
0
20,000
40,000
60,000
80,000
100,000
120,000
140,000
160,000
Recurring billing TRX volume Pay-as-you go billing TRX volume opperating stores
Group-wide TRX value reaches ¥6.4 trillionOperating stores: 160,535*1; Consolidated GMV volume: 840 million; Consolidated GMV value approx:¥2.0trillion*2
TRX Value
Proportion of spread revenue
≒50%
*Annual average basis
(revised in 5% increments )
(10K cases)(stores)(¥100 Mil)
8,000
2,000
10,000
6,000
4,000
12,000
16,000
14,000
(Reference1) If excluded offline, GMV volume would be 810 million, and GMV value approx. would be ¥1.7trillion. 18,000
(Reference 2 ) Consolidated GMV value(past 12 months) : Approx. ¥6.4 trillion
GMV Value excl. GMO Financial Gate : Approx. ¥5.7 trillion
*2 Operating stores are measured on an end-of-quarter basis. GMV value and volume are the total for the respective quarter.
*1 Figure excludes a significant increase in operating stores from a specific merchant. If included, operating stores would be 214,404 outlets as of end-Dec 2020 (down 15.7% YoY).

88
Internet Infrastructure | Payment Processing - Overview
*GMO Payment Gateway’s presentation materials
Public moneyNHK,
Municipalities
(e.g. Tokyo Met. Gov.),
NTA, Automobile tax
Connecting merchants and payment companies on contract, payment data and money flow
Consumer Our Company Payment Company
etc.
ECBtoB・BtoC・CtoC
PC
160,535 stores*
(end of Dec 2020)
80,686 terminals(end of Dec 2020)
Offline
Online
Smartphones
Terminals
Merchant
Service commerceDigital goods, Donation,
Travel, Insurance
SubscriptionVideo streaming
Software, Apparel
* Excluding a significant one-off increase in operating stores from a specific merchant. If included, the total number of operating stores would reach 214,404, outlets by end-Dec 2020
GMO Payment after Delivery
40+ Credit card
company
Convenience store
QR code Payment
Carrier Billing
Multi-Currency Credit
Card Payment
Bank Transfer
E-money
Cash on Delivery
Account transfer
Prepaid Payment
ID Payment

898989
Internet Finance

90
4,856 4,8244,353
4,661 4,449
3,154
407 380
365
857
525
1,068
6,762 6,7716,974
7,512
6,740
6,087
Q1 Q2 Q3 Q4 Q1 Q2 Q3 Q4 Q1 Q2 Q3 Q4 Q1 Q2 Q3 Q4 Q1 Q2 Q3 Q4 Q1 Q2 Q3 Q4
2015 2016 2017 2018 2019 2020
(JPY 100 millions)
Securities and others
CFDs / Stock Index Binary Options
OTC-FX / Binary Options
* Prepared based on Results Presentation of GMO-FH
Internet Finance | Net sales by product

91
FX
Trading Volume
JPY393tr
Q4 FY2019: JPY173tr
Share of Trading
Volume
24.3%
Q4 FY2019: 20.9%
Customer Assets
Balance
JPY225.5B
Dec. 31, 2019: JPY192.0B
CFD
Trading value
JPY9.8tr
Q4 FY2019: JPY4.3tr
Account
147K
Dec. 31, 2019: 118K
Customer Assets
Balance
JPY45.3B
Dec. 31, 2019: JPY33.2B
Securities
Trading value
JPY3.0tr
Q4 FY2019: JPY2.7tr
Share of Trading
Value
3.5%
Q4 FY2019: 4.3%
Margin Transaction
Balance
JPY93.7B
Dec. 31, 2019: JPY98.4B
Internet Finance | FX, CFD, and Securities : KPIs
The share of trading volume for FX and securities are prepared based on Futures Association of Japan and Japan Exchange Group publication data.
Securities and CFD data are the numbers of GMO CLICK Securities.

92
Client
(Concept diagram)
GMO CLICK Securities
● ● ●
● ● ●
● ● ●
〇 〇 〇 ● ● ●
〇 〇 〇 ● ● ●
〇 〇 〇 ● ● ●
〇 〇 〇 ● ● ●
〇 〇 〇 ● ● ●
〇 〇 〇 ● ● ●
〇 〇 〇 ● ● ●
Sell Order Buy Order
Hedge the client
transactions
that exceed
acceptable limits
Matching
Cover order
Method (1)
Existing counter parties (Foreign financial institutions, etc.)
Display rate
Cost
Method (2)
BtoB Market
Revenue
BtoB transaction
Display rate
Client
Sell Order Buy Order
Display rateDisplay rate
Foreign
exchange
risk
Internet Finance | FX Business Model (over the counter derivatives)• Effective matching and thorough risk minimization with cover transactions executed with counter parties as
soon as customer orders exceed acceptable risk position.
• As a new hedging method, “BtoB” is in trial to reduce cover costs and generate profits.
93
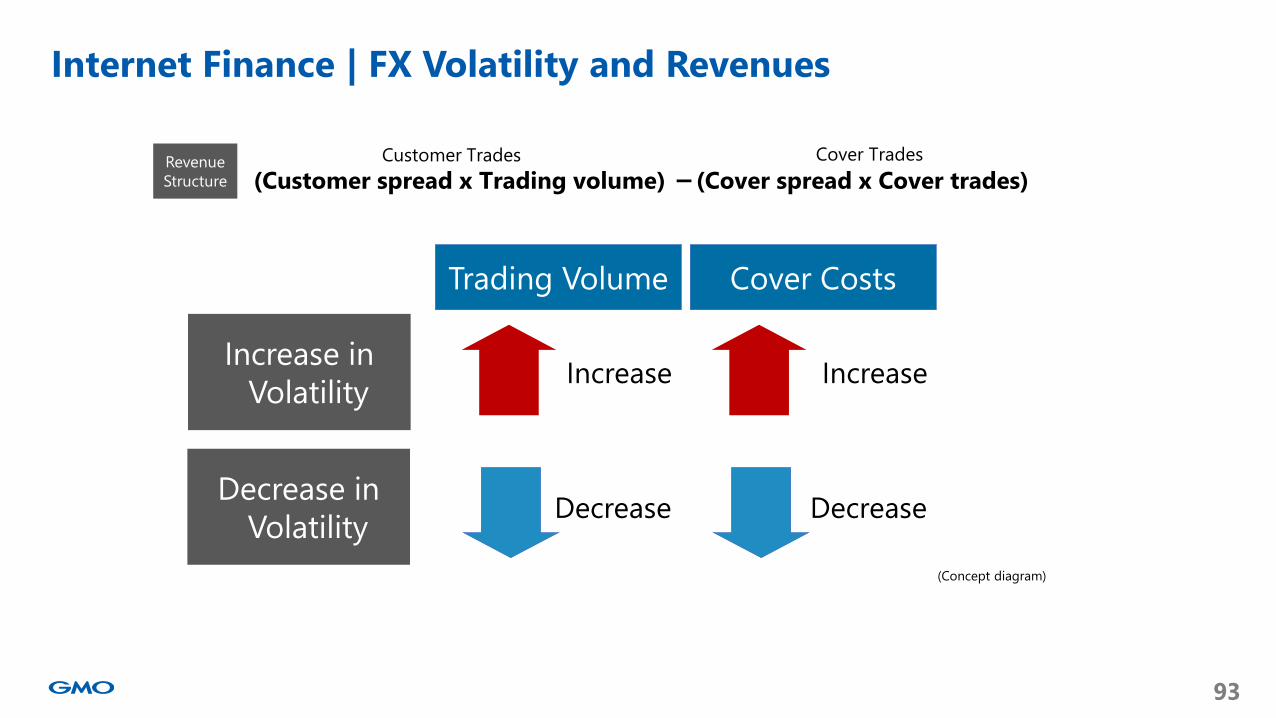
Cover CostsTrading Volume
93
Increase in
VolatilityIncrease Increase
Decrease in
VolatilityDecrease Decrease
(Customer spread x Trading volume) -(Cover spread x Cover trades)Revenue
Structure
Customer Trades Cover Trades
(Concept diagram)
Internet Finance | FX Volatility and Revenues

949494
Cryptoassets

95
0.0
10.0
20.0
30.0
40.0
50.0
60.0
70.0
153,482 PH/s
USD 28,857
Cryptoassets mining | Bitcoin macro data
Total hash rate*
Bitcoin price
* Total hash rate and Bitcoin price are graphed assuming their values at the start of 2017 are 1. Source: https://www.blockchain.com

96
144
169
197
225
245
271
289299
311319
327341
Trading value (JPY billions)
Customer accounts (thousands)
Cryptoassets Trading | Trading value and customer accounts
8,121
2,680
524 643
1,283
535
4,177
3,142
1,449
2,618
3,018
2,003
4,687
Q2 Q3 Q4 Q1 Q2 Q3 Q4 Q1 Q2 Q3 Q4 Q1 Q2 Q3 Q4
2017 2018 2019 2020

979797
GMO Aozora Net Bank

98
Customer first at any time to become the
technology bank
Our objective is a differentiation with
existing banks by utilizing technology,
offering customers 5 values.
*Source: GMO Aozora Net Bank launch presentation on July 17, 2018
New
Safe
Fast
CheapEasy-to-use
Net Bank | Vision

99
DX of banking services by strengthening API integration
Household bookkeeping application
Internal systemAccounting
software
Existing banking services Bank API integration service
ATMBranch
Net Bank

100
18
35
48
67
85
Q4 Q1 Q2 Q3 Q4
19 20
■ Private access (general business companies, etc.)
■ Public access (electronic payment processing, etc.)
Become No. 1in terms of the
number of bank
API connection
(firms)
Net Bank | Number of bank API connection
101
0
50
100
150
200
250
300
0
10
20
30
40
50
60
Q3 Q4 Q1 Q2 Q3 Q4 Q1 Q2 Q3 Q4
18/12期 19/12期 20/12期
証券コネクト口座残高(右軸)
証券コネクト口座数(左軸)
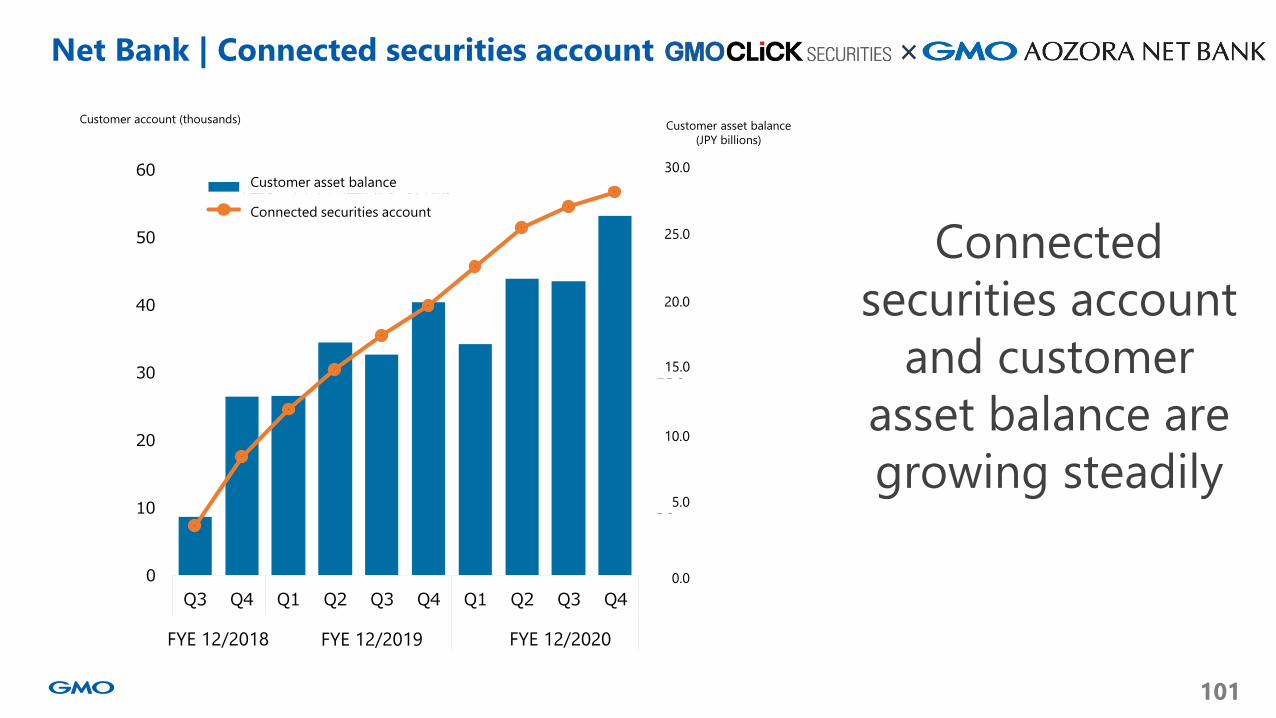
Net Bank | Connected securities account
Connected
securities account
and customer
asset balance are
growing steadily
Customer asset balance
(JPY billions)
Customer asset balance
Connected securities account
Customer account (thousands)
15.0
10.0
05.0
00.0
20.0
25.0
30.0
FYE 12/2018 FYE 12/2019 FYE 12/2020

102102102
Other

103103
Group News (1) 3 mths to December
GMO Payment Gateway supports the digitization of the payment of the power cost, etc.
promoted by TEPCO Energy Partner, Inc.: Provides payment services to a new payment method
that makes bank transfer forms unnecessary
Supporting research service digitalization through dedicated online interview panel "MO Insights
byGMO": Obtain in advance information such as participants' consent and the environment in
which they use the device and the Internet, taking an efficient approach
Regarding the radio station license applied for the introduction of a stand-alone configuration
"local 5G" in the office within the year, GMO Internet obtained Japan's first preliminary license!
FREENANCE byGMO announces "FaaS Concept": As the first initiative, the seamless same-day
settlement has now become available through the API integration with "Lancers"
GMO Payment Service (GMO-PS) has launched the GMO Pay on Credit: Future payment
service for BtoB transaction, which supports the DX of billing, with GMO-PS taking the risks
associated with the collection of overdue payments
GMO Brights Consulting launches GMO Factoring Service for Attorney
10/19
11/11
10/5
11/13
10/8
10/19

104104
Group News (2) 3mths to December
GMO MAKESHOP launches “MakeShop Payment,” a credit card payment with the lowest
commission rate in the industry of 3.14% or more, on Thursday, December 17: If an application is
made on or before Thursday, December 16, 2021, the service will not need monthly payments
for a long time
In 2020, Oricon announced that GMO TokuToku BB became the top-ranked provider in terms of
customer satisfaction for the 2nd consecutive year
The accumulated transaction volume of GMO Pepabo's handmade market "minne" has
exceeded JPY 60 billion, which is No.1 in Japan: Run tv commercial in 5 areas in Japan from
Saturday, November 28
GMO Medical Reservations Technology's Medical Kakumei byGMO, a reservation management
system specializing in the area of medicine, will do a full-scale launch of its new plan "Waiting
List Management for LINE lite version": Adopt simple, inexpensive features that help prevent
three conditions that facilitate the transmission of infectious diseases at waiting rooms of
medical institutions, reducing the risk of the novel coronavirus infection
Real estate tech business GMO ReTech's real estate tech service brand GMO CHINTAI DX: As the
first initiative, GMO ReTech launches GMO CHINTAI DX Owner Application for leasing
management company on December 24
12/10
11/27
12/1
12/9
12/24

105105
(JPY millions)
*Figures of ongoing businesses. Also applied to Q1 FYE 9/2020.
*Compiled from each companies’ quarterly P/L statements
Listed Group Companies (3mths to December)
Stock Code
TSE 1st Section 3769
Internet Infrastructure (Payment)
Q1 FYE 9/2020 Q1 FYE 9/2021 FYE 9/2021
(3mths to Dec) (3mths to Dec) Forecast (Progress)
Net Sales 7,602 9,767 39,792(24.5%)
Operating
Profit 2,105 3,122 12,985(24.0%)
Net Profit 1,729 1,704 7,930(21.5%)

106106
*Compiled from each companies’ quarterly P/L statements
(JPY millions)
Listed Group Companies (3mths to December)
Stock Code
TSE 1st Section 3788
Internet Infrastructure (Hosting & Cloud, Security)
Q4 FYE 12/2019 Q4 FYE 12/2020 Q4 FYE 12/2020 FYE 12/2021
(3mths to Dec) (3mths to Dec) (12mths to Dec) Forecast (YoY)
Net Sales 3,434 3,279 13,332 14,229(106.7%)
Operating
Profit 367 267 1,357 1,008(74.3%)
Ordinary
Profit 393 214 1,394 1,050(75.3%)
Net Profit 153 285 1,170 775(66.2%)

107107
(JPY millions)
Listed Group Companies (3mths to December)
Stock Code
TSE 1st Section 3633
Internet Infrastructure (Domain, Hosting & Cloud, Ecommerce Solutions)
Q4 FYE 12/2019 Q4 FYE 12/2020 Q4 FYE 12/2020 FYE 12/2021
(3mths to Dec) (3mths to Dec) (12mths to Dec) Forecast (YoY)
Net Sales 2,252 2,720 11,014 13,223 (120.1%)
Operating
Profit 91 -38 927 1,114(120.2%)
Ordinary
Profit 118 -38 983 1,127 (114.6%)
Net Profit 0 202 829 795(95.8%)
*Compiled from each companies’ quarterly P/L statements

108108
(JPY millions)
Listed Group Companies (3mths to December)
Stock Code
TSE MOTHERS 4051
Internet Infrastructure (Payment)
Q1 FYE 9/2020 Q1 FYE 9/2021 FYE 9/2021
(3mths to Dec) (3mths to Dec) Forecast (Progress)
Net Sales ー 1,285 4,800(26.8%)
Operating Profit ー 163 589(27.8%)
Ordinary Profit ー 163 587(27.9%)
Net Profit ー 110 368(29.9%)
*Quarterly consolidated financial statements not prepared for Q1 FYE 9/2020
*Compiled from each companies’ quarterly P/L statements

109109
*Compiled from each companies’ quarterly P/L statements
(JPY millions)
Listed Group Companies (3mths to December)
Stock Code
JASDAQ Standard 7177
Internet Finance & Cryptoaasets
Q4 FYE 12/2019 Q4 FYE 12/2020 Q4 FYE 12/2020 FYE 12/2021
(3mths to Dec) (3mths to Dec) (12mths to Dec) Forecast
Net Sales 7,581 8,049 35,988 ー
Operating
Profit 2,132 2,065 12,268 ー
Ordinary
Profit 2,267 1,869 11,806 ー
Net Profit 1,444 1,095 7,298 ー

110110
*Compiled from each companies’ quarterly P/L statements
(JPY millions)
Listed Group Companies (3mths to December)
Stock Code
JASDAQ Standard 4784
Online Advertising & Media
Q4 FYE 12/2019 Q4 FYE 12/2020 Q4 FYE 12/2020 FYE 12/2021
(3mths to Dec) (3mths to Dec) (12mths to Dec) Forecast (YoY)
Net Sales 8,758 8,895 34,519 35,500(102.8%)
Operating
Profit 165 43 365 410(112.2%)
Ordinary
Profit 199 38 573 400(69.8%)
Net Profit 43 -136 260 280(107.3%)

111111
*Compiled from each companies’ quarterly P/L statements
*1 Non-consolidated basis *2 Consolidated basis
(JPY millions)
Listed Group Companies (3mths to December)
Stock Code
TSE MOTHERS 6026
Online Advertising & Media
Q4 FYE 12/2019*1 Q4 FYE 12/2020*2 Q4 FYE 12/2020*2 FYE 12/2021*2
(3mths to Dec) (3mths to Dec) (12mths to Dec) Forecast (YoY)
Net Sales 645 729 2,696 2,800(103.8%)
Operating
Profit -14 14 16 -1,000(-)
Ordinary
Profit -2 12 18 -1,000(-)
Net Profit 2 9 14 -1,000(-)

112112
(JPY millions)
*Compiled from each companies’ quarterly P/L statements
*1 Non-consolidated basis *2 Consolidated basis
Listed Group Companies (3mths to December)
Stock Code
TSE MOTHERS 6180
Online Advertising & Media
Q4 FYE 12/2019*1 Q4 FYE 12/2020*2 Q4 FYE 12/2020*2 FYE 12/2021*2
(3mths to Dec) (3mths to Dec) (12mths to Dec) Forecast (YoY)
Net Sales 954 1,555 4,999 6,000(120%)
Operating
Profit 3 -19 -216 -150(-)
Ordinary
Profit 3 -18 -214 -150(-)
Net Profit 1 -227 -408 -175(-)

113113
*Compiled from each companies’ quarterly P/L statements
(JPY millions)
Listed Group Companies (3mths to December)
Stock Code
TSE MOTHERS 3695
Online Advertising & Media
Q4 FYE 12/2019 Q4 FYE 12/2020 Q4 FYE 12/2020 FYE 12/2021
(3mths to Dec) (3mths to Dec) (12mths to Dec) Forecast (YoY)
Net Sales 905 993 3,394 3,734(110.0%)
Operating
Profit 117 159 263 290(110.0%)
Ordinary
Profit 121 168 241 265(109.9%)
Net Profit 85 120 175 190(108.2%)

114114114
Internet for Everyone