fiscal year march 2018 financial results - mazda.com · us dollar 108 111 2 (0) ... change from...
TRANSCRIPT

FISCAL YEAR MARCH 2018 FINANCIAL RESULTS

1 Mazda Motor Corporation
Highlights
Fiscal Year March 2018 Results
Fiscal Year March 2019 Forecast
Direction of Future Framework
PRESENTATION OUTLINE

2 Mazda Motor Corporation
HIGHLIGHTS
【FY March 2018 Results】
Global sales volume was 1,631,000 units, up 5% from the prior year and the highest on record ⁃ The global launch of the new CX-5 contributed to the increase in sales ⁃ Strong sales in China, Thailand and other regions drove volume growth ⁃ Increased the production capacity of crossover vehicles at plants in
Hiroshima and Hofu
Both revenue and profit increased; revenue was ¥3,474 billion, operating profit was ¥146.4 billion and net income was ¥112.1 billion
【FY March 2019 Forecast】
Forecasting global sales of 1,662,000 units, up 2% year on year, revenue of ¥3,550 billion, operating profit of ¥105 billion and net income of ¥80 billion
Update models to enhance competitiveness and launch the new CX-8 in overseas markets
Change to two-shift operation at Hofu Plant No.2 for a more efficient and flexible production system
Proceed steadily with key initiatives for the future, including the development and introduction of next-generation products and new technologies, in order to respond to intensifying competition, stricter regulations and other changes in the business environment
Plan to pay an annual dividend of ¥35 per share

3 Mazda Motor Corporation
FISCAL YEAR MARCH 2018 RESULTS

4 Mazda Motor Corporation
Full Year
FY March FY March
(000) 2017 2018 Prior Year Feb. Forecast
Global sales volumeVolume YOY(%) Volume
Japan 203 210 8 4 % 0
North America 429 435 6 1 % 5
Europe 262 269 7 3 % 1
China 292 322 31 11 % 14
Other Markets 373 394 20 5 % 11
Total 1,559 1,631 72 5 % 31
<Breakdown>
USA 302 304 2 1 % 3
Australia 118 116 (3) (2)% (2)
ASEAN 105 116 11 11 % 4
Change from
FY MARCH 2018 GLOBAL SALES VOLUME

5 Mazda Motor Corporation
Full-year Sales Volume
JAPAN
203 210
0
100
200
(000)
4%
FY March 2017
Sales were 210,000 units, up 4% year on year
Market share was 4.0%. Registered vehicle market share was 5.1%, up 0.2 points year on year
New CX-5 achieved significantly higher sales than the prior year and contributed to full-year volume growth; an updated model was launched in March
Orders for new CX-8 continue to exceed the plan and a high percentage are for high-grade models; the model has created demand for 3-row crossover SUVs
FY March 2018
New CX-8

6 Mazda Motor Corporation
302 304
127 131
0
100
200
300
400
500
Sales were 435,000 units, up 1% year on year
USA: Sales were 304,000 units, up 1% year on year
- Higher sales of crossovers more than offset the decline in sedans
- Sales of new CX-5, up 29% year on year, and CX-9, up 28% year on year, significantly outperformed industry demand
Canada: 75,000 units, up 5% year on year
Mexico: 55,000 units, up 2% year on year
NORTH AMERICA
1% 429 435
Canada/
Others
USA
(000)
New CX-5
Full-year Sales Volume
FY March 2017 FY March 2018

7 Mazda Motor Corporation
22 27
240 242
0
100
200
300 262 269
Sales were 269,000 units, up 3% year on year
With the model’s full-scale launch, new CX-5 sales were up 17% and contributed to volume growth
Germany and Russia saw strong sales while UK sales decreased
- Germany: 68,000 units, up 8% year on year
- Russia: 27,000 units, up 20% year on year
- UK: 38,000 units, down 15% year on year due to a contraction in demand
EUROPE
3%
1%
20%
FY March 2017 FY March 2018
Europe (Excl.
Russia)
Russia
(000)
Updated Mazda6
Full-year Sales Volume

8 Mazda Motor Corporation
CHINA
11%
Sales were 322,000 units, up 11% year on year
Record full-year sales results
Sales of Mazda3 remain strong despite end of tax cuts on small cars; sales of Mazda6 outperformed the prior year
Strong sales of the CX-4 and new CX-5 crossovers contributed to volume growth
FY March 2017 FY March 2018
CX-4
(000)
Full-year Sales Volume
292
322
0
100
200
300
400

9 Mazda Motor Corporation
105 116
118 116
150 163
0
100
200
300
400
Mazda2
OTHER MARKETS
373 394
Sales were 394,000 units, up 5% year on year
Australia: 116,000 units, down 2% year on year
- Mazda remains the country’s second highest-selling brand
- Strong sales of CX-5 and CX-9; CX-5 was the top-selling vehicle in its segment
ASEAN: 116,000 units, up 11% year on year
- Thailand: 56,000 units, up 31% year on year
- Vietnam: 28,000 units, down 14% year on year
Other: Record sales in New Zealand, Chile and Peru
5%
FY March 2017 FY March 2018
Others
Australia
ASEAN
(000)
Full-year Sales Volume

10 Mazda Motor Corporation
FY MARCH 2018 FINANCIAL METRICS
Full Year
FY March FY March Change from
(Billion yen) 2017 2018 Prior Year Feb. Forecast
Amount YOY(%) Amount
Revenue 3,214.4 3,474.0 259.6 8 % (26.0)
Operating profit 125.7 146.4 20.7 16 % (3.6)
Ordinary profit 139.5 172.1 32.6 23 % 2.1
Profit before tax 128.4 157.5 29.1 23 % 2.5
Net income 93.8 112.1 18.3 19 % 12.1
3.9 4.2 0.3 (0.1)
EPS (Yen) 156.9 182.9 26.0 19.6
Exchange rate (Yen)
US Dollar 108 111 2 (0)
Euro 119 130 11 (0)
Operating ROS
*
pts pts%%
*
%
*
%
*Reflecting the increase in the number of shares issued due to the issuance of new shares by way of third-party allotment that payment was completed on Oct. 2, 2017.

11 Mazda Motor Corporation
125.7
(24.0)
+ 40.0 + 10.5
(9.1)
+ 3.3 146.4
0
50
100
150
200
Volume & Mix
Cost Improvement
Other Exchange
Change from Prior Year 20.7
Impact of reduced wholesale volume and increased marketing expenses in US, etc.
Includes hike in raw material prices
(Deterioration)
Improvement (Billion yen)
FY MARCH 2018 OPERATING PROFIT CHANGE
FY March 2018 Full Year vs. FY March 2017 Full Year
FY March 2017
FY March 2018
R&D Cost
【Exchange】 USD CAD GBP
4.1 4.0 1.7
EUR AUD
Other
17.0 9.8 3.4

12 Mazda Motor Corporation
150.0
(2.0) (0.8)
+ 0.5
+ 4.0
(5.3)
146.4
120
150
Volume & Mix
Exchange
Cost Improvement
Other
R&D Cost
Change from Feb. Forecast (3.6)
(Deterioration)
Improvement
Results
Feb. Forecast
(Billion yen)
FY MARCH 2018 OPERATING PROFIT CHANGE
FY March 2018 Full Year vs. Feb. Forecast

13 Mazda Motor Corporation
FISCAL YEAR MARCH 2019 FORECAST

14 Mazda Motor Corporation
FY MARCH 2019 GLOBAL SALES VOLUME
FY March FY March Change from
(000) 2018 2019 Prior Year
Global sales volumeVolume YOY(%)
Japan 210 215 5 2 %
North America 435 457 22 5 %
Europe 269 265 (4) (1)%
China 322 322 0 0 %
Other Markets 394 403 9 2 %
Total 1,631 1,662 31 2 %
<Breakdown>
USA 304 317 12 4 %
Australia 116 117 1 1 %
ASEAN 116 123 7 6 %
Full Year

15 Mazda Motor Corporation
FY MARCH 2019 FINANCIAL METRICS
FY March FY March Change from
(Billion yen) 2018 2019 Prior Year
Amount YOY(%)
Revenue 3,474.0 3,550.0 76.0 2 %
Operating profit 146.4 105.0 (41.4) (28)%
Ordinary profit 172.1 130.0 (42.1) (24)%
Profit before tax 157.5 120.0 (37.5) (24)%
Net income 112.1 80.0 (32.1) (29)%
4.2 3.0 (1.2)
EPS (Yen) 182.9 127.0 (55.9)
Exchange rate (Yen)
US Dollar 111 107 (4)
Euro 130 130 0
Operating ROS
Full Year
% % pts% %

16 Mazda Motor Corporation
EXCHANGE RATES
Full Year 11月公表
FY March FY March
(Yen) 2018 2019 Change
US Dollar 111 107 (4)
Euro 130 130 0
Canadian Dollar 86 84 (2)
Australian Dollar 86 84 (2)
British Pound 147 148 1

17 Mazda Motor Corporation
146.4 + 3.0
(22.0)
+ 19.0
(7.0)
(34.4)
105.0
0
50
100
150
200
Volume & Mix
Exchange
Cost Improvement
Other
R&D Cost
FY March 2019
(Deterioration)
Improvement (Billion yen)
FY MARCH 2019 OPERATING PROFIT CHANGE
FY March 2019 Full Year vs. FY March 2018 Full Year
FY March 2018
Change from Prior Year (41.4)
【Exchange】 USD CAD GBP
0.8 (5.0)
(12.7)
(0.9) (4.0) (0.2)
EUR AUD
Other
Increased marketing costs and reduced OEM supply offset profit growth from sales and wholesale volume increase Investment for US sales network
reforms and increased costs for compliance with environmental regulations

18 Mazda Motor Corporation
Forecast not to achieve Structural Reform Stage 2 final-year profit target
1.662 million units Global sales volume
Operating ROS 3.0%
Current forecast
Structural Reform Stage 2 Final year FY March 2019 Targets
Announced in April 2017
1.65 million units
5% or more
SUMMARY
- US sales network reforms
- Development and introduction of next-generation products and new technologies
Proceed steadily with key initiatives to consolidate foundation for future growth
Equity ratio
Dividend payout ratio
44%
28%
45% or more
20% or more
- Introduce updated models and next-generation models
- Start two-shift operation at Hofu Plant No.2 to increase production flexibility for crossover vehicles
- Launch the new CX-8 in Australia, New Zealand and China
Actions to enhance sales and improve profit

19 Mazda Motor Corporation
DIRECTION OF FUTURE FRAMEWORK
Review of Structural Reform Plan and Structural Reform Stage 2 (Covering seven years from FY March 2013 - 2019)
Direction of Future Framework

20 Mazda Motor Corporation
REVIEW OF STRUCTURAL REFORM PLAN & STRUCTURAL REFORM STAGE 2
– QUANTITATIVE AND QUALITATIVE GROWTH
Global sales volume: Achieved stable growth of 50,000 units/year
SKYACTIV model introduction and next-generation technology development
- Introduce new-generation products featuring KODO design and SKYACTIV technologies
- Maintain attractiveness of lineup with advanced safety technologies and product updates
- Develop new products and technologies, such as SKYACTIV-X, electrification, connectivity, autonomous driving and next-generation KODO design
FY12/3 FY13/3 FY14/3 FY15/3 FY16/3 FY17/3 FY18/3 FY19/3
1.66 mil units 1.53 mil units
1.25 mil units
Structural Reform Plan Structural Reform Stage 2
Innovation in sales approach
- Establish “right price” sales by promoting brand value
- Enhance trade cycle management by improving residual values
- Reform sales networks, improve customer care and launch new-generation dealers

21 Mazda Motor Corporation
Cost improvement through Monotsukuri Innovation and establishment of global production footprint
- Highly efficient development and production through common architecture and computer modeling-based development
- Enhance overseas production in Mexico, Thailand and elsewhere
- Enhance production flexibility to respond to changes in demand
- Begin work on joint venture plant in the US for sustainable growth
Alliance: competition and cooperation
- Business and capital alliance with Toyota (US new plant/EV technology development)
- Complementary products and technologies
Strengthen financial foundation
- Achieve net cash position and substantially improve equity ratio
- Steadily improve shareholder returns; dividends of 20% or more
- Average operating ROS of 4.8% during Structural Reform Plan and Structural Reform Stage 2 (Average 3.7% during Structural Reform Stage 2)
- Disciplined investments for future growth: based on R&D 4.0% / capital expenditure 3.5% of revenue
REVIEW OF STRUCTURAL REFORM PLAN & STRUCTURAL REFORM STAGE 2
– QUANTITATIVE AND QUALITATIVE GROWTH

22 Mazda Motor Corporation
REVIEW OF STRUCTURAL REFORM PLAN AND STRUCTURAL REFORM STAGE 2
Forecast not to achieve final year profit target
Per-unit profit fell short
due to intensifying
competition globally
Achieve both
sustainable
growth and
shareholder
returns Volume and profit targets
in the U.S. not achieved
【Countermeasures】 -Direction of Future Framework
Structural Reform Plan & Structural Reform Stage 2
Improve net revenue/profit
Revenue/volume growth
Profitability decline
*Crossover model
Raise competitiveness through next-generation products (expand CX lineup) / new technologies (including electrification technologies)
Accelerate sales network reforms
+
Successful alliances
*

23 Mazda Motor Corporation
SKYACTIV (Gen1) SKYACTIV (Gen2)
DIRECTION OF FUTURE FRAMEWORK: DEVELOPMENT AND INTRODUCTION OF NEXT-GENERATION PRODUCTS & NEW TECHNOLOGIES
Highly competitive new product lineup and increased production capacity
Sales volume (units)
New product lineup
Internal Combustion Engines
SKYACTIV-X, SKYACTIV-D GEN2 SKYACTIV-G/D Upgrade
SKYACTIV-G/D
Electrification
Architecture
Others
EV, Plug-in HEV, Mild HEV Range Extender
HEV(technology from Toyota)
Small Products (CX-3/new CX, etc.) Large Products(CX-5. etc.)
Bundled planning
Autonomous driving Co-Pilot Concept Next-generation Mazda Connect
i-ACTIVSENSE Mazda Connect
1.66 mil 1.25 mil 2.00 mil Up 410,000 units Up 340,000 units

24 Mazda Motor Corporation
SKYACTIV(Gen1) SKYACTIV(Gen2)
Optimize product strategies in terms of customer needs, segment characteristics, profit, costs, etc., by dividing next-generation products into small and large architectures
New product strategy will strengthen the business in the U.S. market, expand sales of CX-models globally and improve net revenue by strengthening high value-added products
Bundled planning (Common to small &
large vehicles)
Small products (CX-3/new CX, etc.: 1.2 mil units level)
Large products (CX-5, CX-8, CX-9, etc :
0.8 mil units level)
Established highly efficient and flexible R&D
system
Further improve cost competitiveness &
production flexibility
Enhance product competitiveness and
brand value
1.25 million → 1.66 million units
Improve net revenue by offering a wider variety of
powertrains, including electrification
Quickly respond to changes in demand for
CX vehicles at each global production site
1.66 million → 2.00 million units
Built manufacturing footprint for global swing production to cope with
demand shift
DIRECTION OF FUTURE FRAMEWORK: DEVELOPMENT AND INTRODUCTION OF NEXT-GENERATION PRODUCTS & NEW TECHNOLOGIES

25 Mazda Motor Corporation
DIRECTION OF FUTURE FRAMEWORK: ACCELERATE SALES NETWORK REFORMS (Example of the US)
Accelerate initiatives to strengthen the U.S. sales networks and make sales of 400,000 units per year possible
Actions in 2016 & 2017 (Business turnaround, reestablish sales network)
- Reestablishing sales network based on brand value management
- About 100 dealers exited, half were replaced by strong dealer owners
- Began construction of next-generation branded dealers (40 dealers completed, 50 dealers under construction)
- Prepared to implement roadmap for reestablishment of sales network in 35 priority markets
- Improving business quality
Steadily improving repurchase rate, sales of certified pre-owned vehicles, service retention, profitability at dealers

26 Mazda Motor Corporation
Actions in 2018 to 2021 (execute network enhancement, focus on growth in priority markets)
- Promote qualitative/quantitative growth through higher brand engagement
- Increase investment in network reestablishment. ¥10 billion level in the first year (roughly ¥40 billion over the next four years)
Increase next-generation branded dealers to 300, mainly in 35 priority markets
Each next-generation branded dealer to sell an average of 1,000 units per year
Aim for repurchase rate of 55% in 35 priority markets
- Overhaul marketing strategy to enhance brand value
- Increase dealership investment in local marketing
- Improve customer experience through enhanced training and trade cycle management initiatives
Improve residual values, keep incentives in check and achieve “right price” sales
DIRECTION OF FUTURE FRAMEWORK: ACCELERATE SALES NETWORK REFORMS (Example of the US)

27 Mazda Motor Corporation
DIRECTION OF FUTURE FRAMEWORK: SUCCESSFUL ALLIANCES
Next-generation technology development and alliances
Business and capital alliance with Toyota
- Joint manufacturing in the U.S., joint development of EV technologies, connectivity, complementary products, etc.
Strategic collaboration with suppliers
- Batteries, connectivity, advanced safety technologies, etc.
Advance the efficiency of development processes using computer modeling-based development and Bundled Planning
Increase competitiveness of internal combustion engines by advancing SKYACTIV engines
Electrification technology (Mild HEV/Plug-in HEV/range extender/EV)
Autonomous driving technology/Co-Pilot Concept
Connectivity
Win-win alliances enable development of next- generation technology

28 Mazda Motor Corporation
Generate cash flow and invest for growth to establish a 2 million-unit production framework
Invest around ¥250 billion for future growth, including U.S. plant (incremental to normal investment)
Maximize production efficiency (global swing production) and enhance cost improvement activities to build business and financial base for sustainable growth
R&D Cost image Capital Expenditure image
3.0%
4.1%
2018 2019 2020 2021 2022 2023 2024
3.9% 4.0%
2018 2019 2020 2021 2022 2023 2024
About ¥250 bil increment
FY March FY March
DIRECTION OF FUTURE FRAMEWORK: INVESTMENT FOR GROWTH

29 Mazda Motor Corporation
DIRECTION OF FUTURE FRAMEWORK: FOR STRONGER GROWTH FROM FY MARCH 2022
Global sales (units)
Operating Profit
ROS 3%
ROS 5% or higher
FY18/3 FY22/3 FY24/3
Stronger growth
Solid foundation
1.80 mil
FY19/3 FY12/3 FY17/3
Over next 3 years, build a foundation for strong profit growth from FY March 2022
- Profit growth limited due to increased costs from increased competition and regulatory compliance
- Maintain volume growth at 50,000 units per year and make full use of existing capacity to sell up to 1.8 million units until U.S. plant is completed
In addition to next-generation product launches and improving sales foundation, achieve stronger growth from FY March 2022 with start of operations at U.S. new plant
1.66 mil
2.00 mil
US JV plant US sales network reform
☆
SKYACTIV (Gen 1) SKYACTIV (Gen 2)
Structural Reform Plan Structural Reform
Stage 2 Next Mid-term Plan Following Mid-term Plan

30 Mazda Motor Corporation

31 Mazda Motor Corporation
APPENDIX

32 Mazda Motor Corporation
CASH FLOW AND NET CASH
FY March 2017 FY March 2018 Change from
(Billion yen) Full Year Full Year Prior FY End
Cash Flow
- From Operating activities
- From Investing activities
- Free Cash Flow
Cash and Cash Equivalents
Net Cash
41 / 43 44 / 45 3 / 2Equity Ratio
604.9
107.0
161.1
(63.8)
97.3
526.9
35.4
78.0
71.6
207.8
(160.0)
47.8
-
-
-
% % pts** *
*Reflecting “equity credit attributes” of the subordinated loan

33 Mazda Motor Corporation
215.1 256.0 239.7
307.4 221.6 254.2 264.7
319.6
281.4 236.0 291.6
264.0
288.3 274.8 285.5
265.8
154.1 145.4 140.6
149.6
155.8 177.0
179.3 183.1
125.6 132.7 130.4
144.8
136.4
148.6 161.9
157.6
0
300
600
900802.3
770.1 776.2 802.1
854.5 891.3
926.1
REVENUE BY GEOGRAPHIC AREA
865.8
1Q 2Q 3Q 4Q 1Q 2Q
FY March 2017 FY March 2018
3Q 4Q
Japan
North America
Europe
Other
(Billion yen)

34 Mazda Motor Corporation
662.8 656.3 685.8 736.2
682.2 723.3
759.3 787.7
57.4 57.4 58.5
63.2
61.7 67.5
68.3 68.6
56.1 56.4 58.0
66.4
58.2
63.7 63.8
69.8
0
300
600
900
776.2 770.1
REVENUE BY PRODUCT
1Q 2Q 3Q 4Q 1Q
802.3
865.8
802.1
FY March 2017
854.5
2Q
FY March 2018
891.3
3Q 4Q
926.1
Parts
Other
Vehicles / Parts for Overseas Production
(Billion yen)
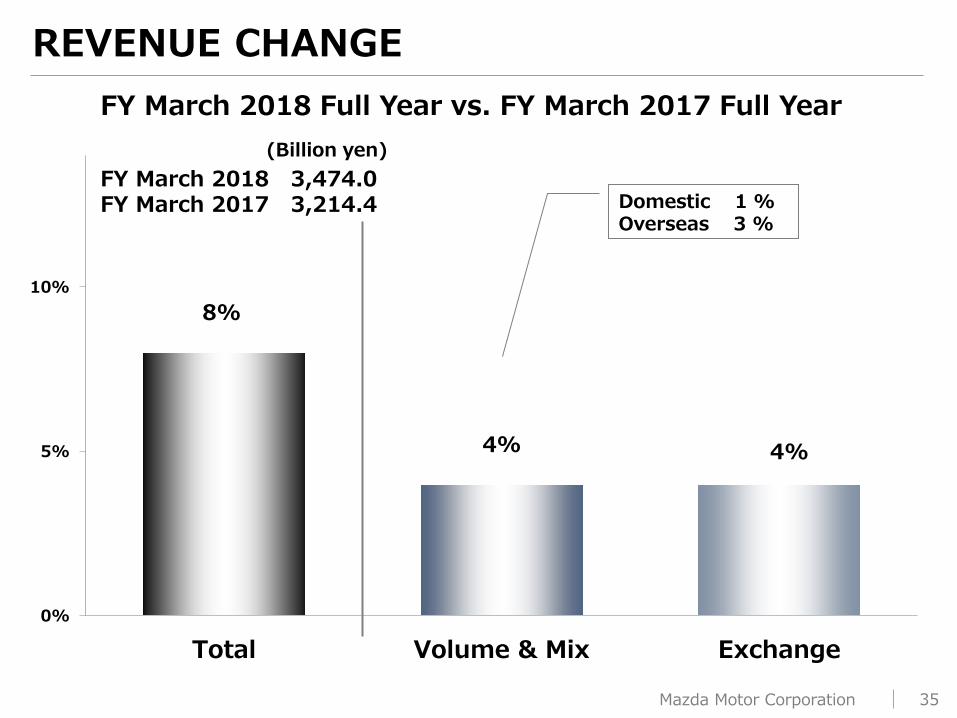
35 Mazda Motor Corporation
8%
4% 4%
0%
5%
10%
Total Volume & Mix Exchange
REVENUE CHANGE
(Billion yen)
Domestic 1 % Overseas 3 %
FY March 2018 Full Year vs. FY March 2017 Full Year
FY March 2018 3,474.0 FY March 2017 3,214.4

36 Mazda Motor Corporation
7%
6%
1%
0%
5%
10%
15%
Total Volume & Mix Exchange
REVENUE CHANGE
Domestic 1% Overseas 5%
FY March 2018 4th Quarter vs. FY March 2017 4th Quarter
(Billion yen)
FY March 2018 926.1 FY March 2017 865.8

37 Mazda Motor Corporation
GLOBAL SALES VOLUME AND CONSOLIDATED WHOLESALES
Fourth Quarter
FY March FY March Change from
(000) 2017 2018 Prior Year
Global sales volume Volume YOY(%)
Japan 71 71 1 1 %
North America 98 114 16 16 %
Europe 71 76 5 7 %
China 65 77 13 20 %
Other Markets 92 107 13 13 %
Total 397 445 47 12 %
Consolidated wholesales
Japan 67 65 (1) (1)%
North America 98 104 6 6 %
Europe 62 68 6 10 %
Other Markets 107 108 0 0 %
Total 334 345 11 3 %
<Breakdown>
USA 71 76 4 6 %

38 Mazda Motor Corporation
Fourth Quarter
FY March FY March
(Billion yen) 2017 2018
Amount YOY(%)
Revenue 865.8 926.1 60.3 7 %
Operating profit 23.7 39.3 15.6 66 %
Ordinary profit 21.6 37.3 15.7 73 %
Profit before tax 17.7 32.7 15.0 85 %
Net income 13.9 27.2 13.3 96 %0
2.7 4.2 1.5
EPS (Yen) 23.2 43.1 19.9
Exchange rate (Yen)
US Dollar 114 108 (5)
Euro 121 133 12
Operating ROS
Change from
Prior Year
*
%% pts
*
FY MARCH 2018 FINANCIAL METRICS
*Reflecting the increase in the number of shares issued due to the issuance of new shares by way of third-party allotment that payment was completed on Oct. 2, 2017.

39 Mazda Motor Corporation
23.7 +0.2
+8.5
+ 6.0
(5.7)
+ 6.6 39.3
0
25
50
FY March 2017
FY March 2018
Volume & Mix
Exchange
Cost Improvement R&D
Cost
FY MARCH 2018 OPERATING PROFIT CHANGE
Other
Change from Prior Year 15.6
FY March 2018 4th Quarter vs. FY March 2017 4th Quarter
(Billion yen) (Deterioration)
Improvement

40 Mazda Motor Corporation
2月公表
FY March FY March Change from 2018年3月期
(000) 2017 2018 Prior Year Feb. Forecast
Global sales volume Volume YOY(%) Volume
Japan 203 210 8 4 % 0
North America 429 435 6 1 % 5
Europe 262 269 7 3 % 1
China 292 322 31 11 % 14
Other Markets 373 394 20 5 % 11
Total 1,559 1,631 72 5 % 31
Consolidated wholesales
Japan 193 199 6 3 % (4)
North America 426 423 (3) (1)% (1)
Europe 255 266 11 4 % (0)
Other Markets 391 386 (5) (1)% 4
Total 1,265 1,274 9 1 % (1)
<Breakdown>
USA 308 289 (19) (6)% (1)
Full Year
GLOBAL SALES VOLUME AND CONSOLIDATED WHOLESALES

41 Mazda Motor Corporation
2月公表
FY March FY March 2018年3月期
(000) 2018 2019
Global sales volume Volume YOY(%)
Japan 210 215 5 2 %
North America 435 457 22 5 %
Europe 269 265 (4) (1)%
China 322 322 0 0 %
Other Markets 394 403 9 2 %
Total 1,631 1,662 31 2 %
Consolidated wholesales
Japan 199 209 11 5 %
North America 423 460 37 9 %
Europe 266 261 (4) (2)%
Other Markets 386 393 7 2 %
Total 1,274 1,324 51 4 %
<Breakdown>
USA 289 319 30 10%
Full Year
Change from
Prior Year
GLOBAL SALES VOLUME AND CONSOLIDATED WHOLESALES
42 Mazda Motor Corporation
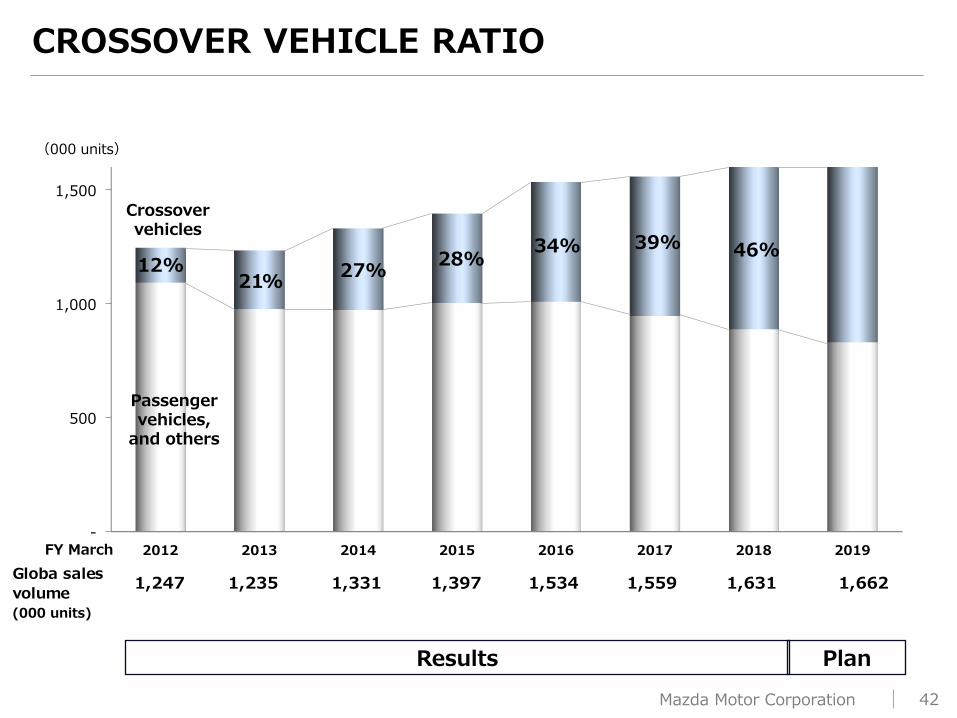
-
500
1,000
1,500
2012 2013 2014 2015 2016 2017 2018 2019
12% 27% 21%
28% 34% 39%
Globa sales
volume1,247 1,235 1,331 1,397 1,534 1,559 1,631 1,662
46%
CROSSOVER VEHICLE RATIO
(000 units)
Crossover vehicles
Passenger vehicles,
and others
(000 units)
Plan Results
FY March

43 Mazda Motor Corporation
0
50
100
150
104.1
82.4 87.0
126.9
136.0
94.4
145.0
90.0
143.0
2017 2018 2019 2017 2018 2019 2017 2018 2019
KEY DATA
(Billion yen)
Capital Expenditure
Depreciation Cost
R&D Cost
FY March
(Plan)
(Plan)
(Plan)

44 Mazda Motor Corporation
FY March 2014 FY March 2015 FY March 2016 FY March 2017 FY March 2018 FY March 2019
15 15 15 15 10
15 20 20 20
Trend of dividends per share
Interim dividends
Year-end dividends
DIVIDEND PAYMENT
Plan Results
Note) A share consolidation was implemented on common stock with a ratio of five shares to one share on August 1, 2014. Dividends per share represent actual amounts applicable to the respective years.
(forecast)
35 35 35
30
10
1

45 Mazda Motor Corporation
DISCLAIMER
The projections and future strategies shown in this presentation are based on various uncertainties including without limitation the conditions of the world economy in the future, the trend of the automotive industry and the risk of exchange-rate fluctuations. So, please be aware that Mazda's actual performance may differ substantially from the projections.
If you are interested in investing in Mazda, you are requested to make a final investment decision at your own risk, taking the foregoing into consideration. Please note that neither Mazda nor any third party providing information shall be responsible for any damage you may suffer due to investment in Mazda based on the information shown in this presentation.