fiscal years ended august 31, 2015 and 2014 the woodlands
TRANSCRIPT

Nationally recognized, globally connected, locally focused.
Trained Today,
Hired Tomorrow
Comprehensive Annual Financial Report
Fiscal Years Ended August 31, 2015 and 2014
The Woodlands, Texas
Prepared by Administration and Finance Lone Star College ∙ 5000 Research Forest Drive ∙ The Woodlands, Texas 77381
COMPREHENSIVE ANNUAL FINANCIAL REPORT
FOR THE FISCAL YEARS ENDED AUGUST 31, 2015 AND 2014
1 | P a g e
LONE STAR COLLEGE COMPREHENSIVE ANNUAL FINANCIAL REPORT
FOR THE FISCAL YEARS ENDED AUGUST 31, 2015 AND 2014
TABLE OF CONTENTS
Table of Contents ..................................................................................................................................... 2
INTRODUCTORY SECTION ......................................................................................................................... 6
Chancellor's Letter ......................................................................................................................... 7
Transmittal Letter ....................................................................................................................... 8
2014 GFOA Certificate of Achievement for Excellence in Financial Reporting .......................... 13
Organization Data ....................................................................................................................... 14
Organizational Chart ...................................................................................................... 15
Organizational Data ...................................................................................................... 16
FINANCIAL SECTION ................................................................................................................................ 17
Independent Auditors' Report ................................................................................................... 18
Management's Discussion and Analysis ..................................................................................... 22
Financial Statements ................................................................................................................. 32
1 Statements of Net Position .............................................................................. 33
2 Statements of Revenues, Expenses and Changes in Net Position ................... 34
3 Statements of Cash Flows ................................................................................ 35
Notes to Financial Statements ................................................................................................... 37
1 Reporting Entity ............................................................................................... 38
2 Summary of Significant Accounting Policies .................................................... 39
2 | P a g e

3 Authorized Investments ................................................................................... 43
4 Deposits and Investments ................................................................................ 44
5 Capital Assets .................................................................................................... 46
6 Long-Term Liabilities ........................................................................................ 48
7 Bonds Payable .................................................................................................. 49
8 Refunding & Defeased Bonds Outstanding ...................................................... 54
9 Operating Leases .............................................................................................. 55
10 Employees' Retirement Plans .......................................................................... 56
11 Compensable Absences ................................................................................... 62
12 Pending Lawsuits and Claims ........................................................................... 63
13 Disaggregation of Receivables and Payables ................................................... 64
14 Federal and State Contract and Grant Awards ................................................ 65
15 Risk Management ............................................................................................ 66
16 Post-Retirement Health Care and Life Insurance Benefits …………………………… 67
17 Ad Valorem Tax .................................................................................................. 68
18 Income Taxes ................................................................................................... 69
19 Related Parties ................................................................................................. 70
20 Post-Employment Benefits Other Than Pensions ........................................... 71
Required Supplementary Information (RSI) Schedules….………………………………………………………………...... 72
Schedule of College's Share of Net Pension Liability …………………………………………………………...… 73
Schedule of College's Contributions……………………………………….…………………………………………..…… 74
Notes to Required Supplementary Information ……………………………………………………………………… 75
3 | P a g e
Supplementary Schedules ........................................................................................................................ 76
A Schedule of Operating Revenues ..................................................................... 77
B Schedule of Operating Expenses by Object ..................................................... 79
C Schedule of Non-Operating Revenues and Expenses ...................................... 80
D Schedule of Net Position by Source and Availability ....................................... 81
E Schedule of Expenditures of Federal Awards .................................................. 82
F Schedule of Expenditures of State Awards ...................................................... 85
Statistical Section ..................................................................................................................................... 87
Statistical Section Contents ..................................................................................................................... 88
SS01 Net Position by Component ............................................................................... 89
SS02 Revenues by Source ........................................................................................... 90
SS03 Program Expenses by Function ......................................................................... 92
SS04 Tuition and Fees ............................................................................................... 94
SS05 Assessed Value and Taxable Assessed Value of Property .................................. 95
SS06 State Appropriation per FTSE and Contact Hour .............................................. 96
SS07 Principal Taxpayers ............................................................................................ 97
SS08 Property Tax Levies and Collections .................................................................. 99
SS09 Ratios of Outstanding Debt .............................................................................. 100
SS10 Legal Debt Margin Information ........................................................................ 101
SS11 Pledged Revenue Coverage ............................................................................. 102
SS12 Demographic and Economic Statistics .............................................................. 103
4 | P a g e

SS13 Principal Employers ......................................................................................... 104
SS14 Faculty, Staff and Administrators Statistics ................................................... 105
SS15 Enrollment Details ......................................................................................... 106
SS16 Student Profile .............................................................................................. 108
SS17 Transfers to Senior Institutions ..................................................................... 109
SS18 Capital Asset Information ................................................................................ 110
SINGLE AUDIT SECTION ........................................................................................................................... 111
Independent Auditors' Report on Internal Control over Financial Reporting and on Compliance and Other Matters Based on an Audit of Financial Statements Performed in Accordance with Government Auditing Standards .................................................................................................................................. 112
Independent Auditors' Report on Compliance for Each Major Program and on Internal Control over Compliance Required by OMB Circular A-133 and State of Texas Single Audit Circular ........................ 114
Schedule of Findings and Questioned Costs ........................................................................................... 116
5 | P a g e

INTRODUCTORY SECTION
6 | P a g e
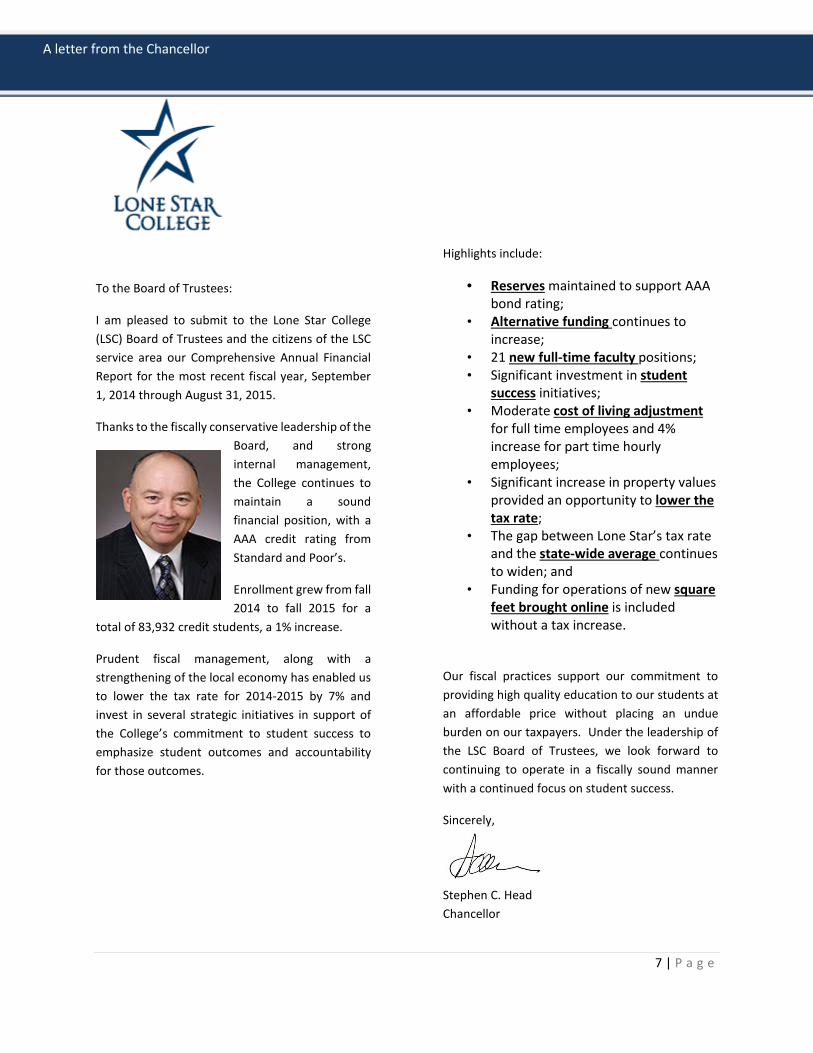
To the Board of Trustees:
I am pleased to submit to the Lone Star College (LSC) Board of Trustees and the citizens of the LSC service area our Comprehensive Annual Financial Report for the most recent fiscal year, September 1, 2014 through August 31, 2015.
Thanks to the fiscally conservative leadership of the Board, and strong internal management, the College continues to maintain a sound financial position, with a AAA credit rating from Standard and Poor’s.
Enrollment grew from fall 2014 to fall 2015 for a
total of 83,932 credit students, a 1% increase.
Prudent fiscal management, along with a strengthening of the local economy has enabled us to lower the tax rate for 2014-2015 by 7% and invest in several strategic initiatives in support of the College’s commitment to student success to emphasize student outcomes and accountability for those outcomes.
Highlights include:
• Reserves maintained to support AAA bond rating;
• Alternative funding continues to increase;
• 21 new full-time faculty positions; • Significant investment in student
success initiatives; • Moderate cost of living adjustment
for full time employees and 4% increase for part time hourly employees;
• Significant increase in property values provided an opportunity to lower the tax rate;
• The gap between Lone Star’s tax rate and the state-wide average continues to widen; and
• Funding for operations of new square feet brought online is included without a tax increase.
Our fiscal practices support our commitment to providing high quality education to our students at an affordable price without placing an undue burden on our taxpayers. Under the leadership of the LSC Board of Trustees, we look forward to continuing to operate in a fiscally sound manner with a continued focus on student success.
Sincerely,
Stephen C. Head Chancellor
A letter from the Chancellor A letter from the Chancellor
7 | P a g e
December 3, 2015 To: Chancellor Steve Head Members of the Board of Trustees Taxpayers of Harris and Montgomery Counties Citizens of the Lone Star College Community Respectfully submitted for your review is the comprehensive annual financial report of the Lone Star College (the “College”) for the fiscal years ended August 31, 2015 and August 31, 2014. The purpose of this report is to provide detailed information about the financial condition and performance of the College. Management assumes full responsibility for the completeness and reliability of the information contained in this report based upon a comprehensive framework of internal control. The objective of internal control is to provide reasonable, rather than absolute, assurance that the financial statements are free of material misstatement. The concept of reasonable assurance ensures that the costs of the controls do not exceed the benefits derived. COMPREHENSIVE ANNUAL FINANCIAL REPORT Lone Star College’s comprehensive annual financial report (CAFR) for the fiscal years ended August 31, 2015 and 2014 was prepared by the Administration and Finance Department. The financial statements are prepared in accordance with generally accepted accounting principles (GAAP) as established by the Financial Accounting Standards Board (FASB) and the Governmental Accounting Standards Board (GASB) and comply with the Annual Financial Reporting Requirements for Texas Public Community Colleges as set forth by the Texas Higher Education Coordinating Board (THECB). The notes to the financial statements are considered an integral part of the financial statements and should be read in conjunction with them. Additionally, attention should be given to Management’s Discussion and Analysis, which provides readers with a narrative introduction, overview and analysis of the financial statements. REPORTING ENTITY The College is reporting as a special purpose government engaged solely in business-type activities (BTA). In accordance with GASB Statements 34 and 35, this reporting model is intended to align government financial statements with corporate financial statements. COLLEGE PROFILE Lone Star College has been opening doors to a better community for over 40 years. With its beginning in 1973, the College remains steadfast in its commitment to student success and credential completion. In 1972, residents in the Aldine, Humble and Spring Independent School Districts elected to create a junior college district, which became known as North Harris County College. The college opened its doors in the fall of 1973 and the 16-member staff welcomed 613 students to the first classes held at Aldine High School. Fast forward 42 years and Lone Star College has grown to six colleges, multiple centers and two University Centers with 84,000 credit students and a total of more than 95,000 students. In 2008, Lone Star College became the new
8 | P a g e
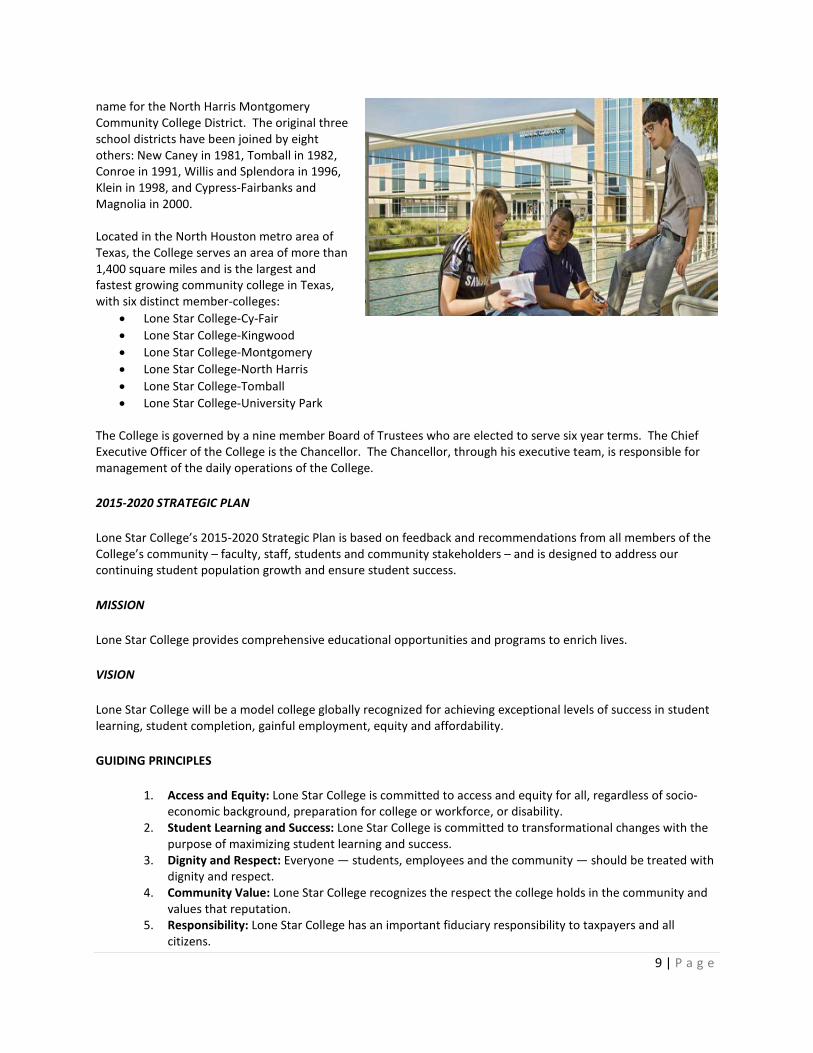
name for the North Harris Montgomery Community College District. The original three school districts have been joined by eight others: New Caney in 1981, Tomball in 1982, Conroe in 1991, Willis and Splendora in 1996, Klein in 1998, and Cypress-Fairbanks and Magnolia in 2000. Located in the North Houston metro area of Texas, the College serves an area of more than 1,400 square miles and is the largest and fastest growing community college in Texas, with six distinct member-colleges:
• Lone Star College-Cy-Fair • Lone Star College-Kingwood • Lone Star College-Montgomery • Lone Star College-North Harris • Lone Star College-Tomball • Lone Star College-University Park
The College is governed by a nine member Board of Trustees who are elected to serve six year terms. The Chief Executive Officer of the College is the Chancellor. The Chancellor, through his executive team, is responsible for management of the daily operations of the College.
2015-2020 STRATEGIC PLAN
Lone Star College’s 2015-2020 Strategic Plan is based on feedback and recommendations from all members of the College’s community – faculty, staff, students and community stakeholders – and is designed to address our continuing student population growth and ensure student success.
MISSION
Lone Star College provides comprehensive educational opportunities and programs to enrich lives.
VISION
Lone Star College will be a model college globally recognized for achieving exceptional levels of success in student learning, student completion, gainful employment, equity and affordability.
GUIDING PRINCIPLES
1. Access and Equity: Lone Star College is committed to access and equity for all, regardless of socio-economic background, preparation for college or workforce, or disability.
2. Student Learning and Success: Lone Star College is committed to transformational changes with the purpose of maximizing student learning and success.
3. Dignity and Respect: Everyone — students, employees and the community — should be treated with dignity and respect.
4. Community Value: Lone Star College recognizes the respect the college holds in the community and values that reputation.
5. Responsibility: Lone Star College has an important fiduciary responsibility to taxpayers and all citizens.
9 | P a g e

STRATEGIC GOALS
Through the strategic planning process the College identified the following top 5 strategic goals.
• Academic & Workforce Program Quality: Provide high quality academic and workforce programs that enhance students’ learning experience and prepare them for the 21st century workforce.
• Student Success: Promote student success by ensuring excellence in teaching, learning and student-centered support services.
• Financial Responsibility & Accountability: Ensure sound financial practices that are accountable to stakeholders and fairly allocate budget and resources.
• Culture: Nurture a culture that values and respects all Lone Star College members and encourages collaboration.
• Partnerships: Build strong partnerships with local ISDs and civic, charitable, higher education, industry and business organizations to promote student and community success.
CULTURAL BELIEFS The LSC 20|20 task force, a team of 115 faculty and staff representatives from across LSC, developed six cultural beliefs to help clarify and focus our actions so we can achieve the desired results.
• Students Matter – I engage and support each student to achieve their goals. • Inspire Excellence – I celebrate successes and value the contributions of all employees. • Act Intentionally – I create goals and make decisions based on meaningful data. • Better Together – I share knowledge and encourage collaboration to reach common goals. • No Fear! – I am empowered to effect positive change. • Trust! – I practice transparent communication, encourage dialogue and cultivate trust.
ECONOMIC CONDITION AND OUTLOOK The information presented in the financial statements is perhaps best understood when it is considered from the broader perspective of the local environment in which the College operates.
The College’s geographic area is comprised of portions of Harris and Montgomery Counties. Harris County is a major component of the Houston-The Woodlands-Sugar Land-TX Metropolitan Statistical Area (MSA). Houston is the fourth largest city in the U.S. With a 2010 Census of 5,920,416 residents, the Houston MSA is expected to increase 19.8% to 7,089,920 by 2020.
U.S. Comparative Population Growth Trends
1990 - 2000 2000 - 2010 2010 - 2020
Houston 25.2% 26.1% 19.8%
Texas 22.8% 20.6% 15.6%
U.S. 13.2% 9.7% 7.1%
10 | P a g e

Houston has 26 Fortune 500 companies headquartered locally, with many other companies maintaining U.S. administrative headquarters in the Houston MSA. In 2015, Houston ranked third among U.S. cities with the most Fortune 500 headquarters, behind New York and Chicago. Sources: U.S. Census Bureau, November 2015; Esri forecasts for 2015 and 2020; Fortune Magazine 2015 and Greater Houston Partnership “Corporate Headquarters” LONG-TERM FINANCIAL PLANNING The College’s financial planning is comprised of three planning processes:
• Strategic Plan • Facilities Master Plan • Annual Budget
A five year master plan was updated in 2013 to accommodate the College’s facility needs through 2018. The budget is funded primarily through student, state and tax revenues. A methodology was developed to reward colleges for positive impact activities over which they have influence, but not to penalize for activities over which they have no control.
During the annual budget process an allocation model is used that:
• Provides adequate funding for basic needs of the colleges • Recognizes the importance of a balanced full-time faculty ratio • Fairly distributes discretionary funds • Limits administrative spending • Provides funds to support enrollment increases • Provides incentive funding for improvements in key indicators
The budget is presented to the Board of Trustees for approval each August. INDEPENDENT AUDIT State statutes require an annual audit by independent certified public accountants. The College’s Board of Trustees selected the accounting firm of Whitley Penn, LLP, to perform its annual audit. In addition to meeting the requirements set forth in the state statutes, the audit was designed to meet the requirements of the Federal Single Audit Act. The auditor’s reports related to single audits are included in the Single Audit Section of the CAFR. AWARDS The Government Finance Officers Association of the United States and Canada (GFOA) awarded a Certificate of Achievement for Excellence in Financial Reporting to the College for its comprehensive annual financial report for the fiscal year ended August 31, 2014. This was the 11th consecutive year the College has achieved this prestigious award. In order to be awarded a Certificate of Achievement, a government must publish an easily readable and efficiently organized comprehensive annual financial report. This report must satisfy both generally accepted accounting principles and applicable legal requirements.
11 | P a g e
A Certificate of Achievement is valid for a period of one year only. We believe that our current comprehensive annual financial report continues to meet the Certificate of Achievement Program’s requirements and we are submitting it to the GFOA to determine its eligibility for another certificate. ACKNOWLEDGEMENTS Credit for this report must be given to the Board of Trustees for its oversight and unfailing support in maintaining the highest standards of integrity, transparency and accountability in the College’s financial operations. We would particularly like to acknowledge the Chancellor and the Chancellor’s executive leadership team for providing the resources necessary to prepare this financial report. The preparation of this report could not have been accomplished without the hard work and dedication of the entire staff of Administration and Finance. Respectfully submitted,
Cynthia F. Gilliam Vice Chancellor, Administration & Finance/Chief Financial Officer
12 | P a g e

13 | P a g e

Organization Data
14 | P a g e
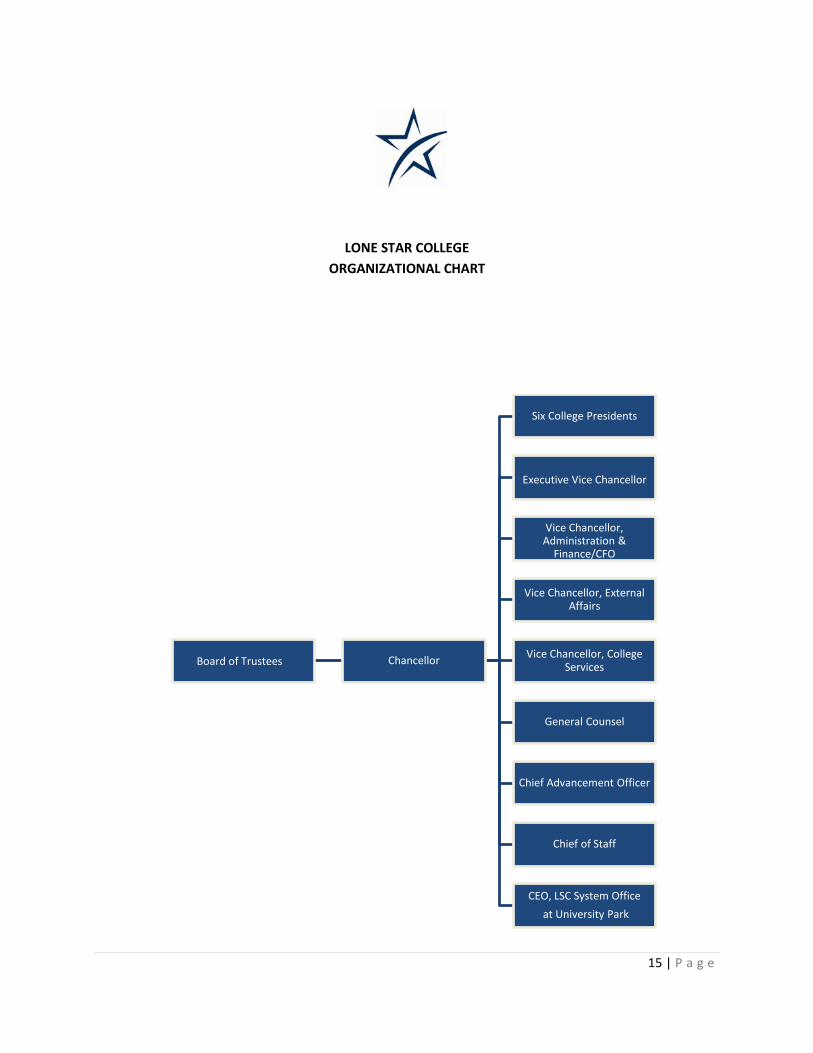
LONE STAR COLLEGE ORGANIZATIONAL CHART
Board of Trustees Chancellor
Six College Presidents
Executive Vice Chancellor
Vice Chancellor, Administration &
Finance/CFO
Vice Chancellor, External Affairs
Vice Chancellor, College Services
General Counsel
Chief Advancement Officer
Chief of Staff
CEO, LSC System Officeat University Park
15 | P a g e

ORGANIZATIONAL DATA For the Fiscal Year 2015
Board of Trustees
Term Expires May
Linda S. Good, J.D. Chair 2016 Kyle A. Scott, Ph.D. Vice Chair 2018 Ron Trowbridge, Ph.D. Secretary 2018 Alton Smith, Ed.D. Assistant Secretary 2020 David Holsey, D.D.S. 2018 David A. Vogt 2016 Ken E. Lloyd 2020 Bob Wolfe, J.D., CPA 2016 Art Murillo 2020
Principal Administrative Officers Dr. Stephen C. Head Chancellor Dr. Gerald Napoles President, Lone Star College–North Harris Dr. Katherine Persson President, Lone Star College–Kingwood Dr. Lee Ann Nutt President, Lone Star College–Tomball Dr. Rebecca Riley President, Lone Star College–Montgomery Dr. Deana Sheppard Interim President, Lone Star College–CyFair Shah Ardalan President, Lone Star College–University Park Dr. Austin Lane Executive Vice Chancellor Cynthia Gilliam Vice Chancellor, Administration & Finance/CFO Ray Laughter Vice Chancellor, External Affairs Link Alander Vice Chancellor, College Services Mario Castillo Leah Goss Helen Clougherty
General Counsel Chief Advancement Officer Chief of Staff
Rand W. Key CEO, LSC System Office at University Park
16 | P a g e

FINANCIAL SECTION
17 | P a g e

Independent Auditors’ Report
18 | P a g e

INDEPENDENT AUDITORS’ REPORT
To the Board of Trustees Lone Star College The Woodlands, Texas We have audited the accompanying financial statements of Lone Star College (the “College”), as of and for the year ended August 31, 2015 and 2014, and the related notes to the financial statements, which collectively comprise the College’s basic financial statements as listed in the table of contents. Management’s Responsibility for the Financial Statements Management is responsible for the preparation and fair presentation of these financial statements in accordance with accounting principles generally accepted in the United States of America; this includes the design, implementation, and maintenance of internal control relevant to the preparation and fair presentation of financial statements that are free from material misstatement, whether due to fraud or error. Auditor’s Responsibility Our responsibility is to express opinions on these financial statements based on our audit. We conducted our audit in accordance with auditing standards generally accepted in the United States of America and the standards applicable to financial audits contained in Government Auditing Standards, issued by the Comptroller General of the United States. Those standards require that we plan and perform the audit to obtain reasonable assurance whether the financial statements are free from material misstatement. An audit involves performing procedures to obtain audit evidence about the amounts and disclosures in the financial statements. The procedures selected depend on the auditor’s judgment, including the assessment of the risks of material misstatement of the financial statements, whether due to fraud or error. In making those risk assessments, the auditor considers internal control relevant to the entity’s preparation and fair presentation of the financial statements in order to design audit procedures that are appropriate in the circumstances, but not for the purpose of expressing an opinion on the effectiveness of the entity’s internal control. Accordingly, we express no such opinion. An audit also includes evaluating the appropriateness of accounting policies used and the reasonableness of significant accounting estimates made by management, as well as evaluating the overall presentation of the financial statements. We believe that the audit evidence we have obtained is sufficient and appropriate to provide a basis for our audit opinion.
19 | P a g e

To the Board of Trustees Lone Star College The Woodlands, Texas
Opinions
In our opinion, the financial statements referred to above present fairly, in all material respects, the financial position of the College, as of August 31, 2015 and 2014, and the respective changes in financial position and, cash flows thereof for the years then ended in accordance with accounting principles generally accepted in the United States of America.
Emphasis of Matter
As discussed in Note 2 to the financial statements, the College adopted the provisions of GASB Statement No. 68, Accounting and Financial Reporting for Pensions – an amendment of GASB Statement No. 27, and GASB Statement No. 71, Pension Transition for Contributions Made Subsequent to the Measurement Date – an amendment of GASB Statement No. 68, as of August 31, 2015. Our opinion is not modified with respect to this matter.
Other Matters
Required Supplementary Information
Accounting principles generally accepted in the United States of America require that the management’s discussion and analysis on pages 23 through 31 and pension information on pages 73 and 75 be presented to supplement the basic financial statements. Such information, although not a part of the basic financial statements, is required by the Governmental Accounting Standards Board, who considers it to be an essential part of financial reporting for placing the basic financial statements in an appropriate operational, economic, or historical context. We have applied certain limited procedures to the required supplementary information in accordance with auditing standards generally accepted in the United States of America, which consisted of inquiries of management about the methods of preparing the information and comparing the information for consistency with management’s responses to our inquiries, the basic financial statements, and other knowledge we obtained during our audit of the basic financial statements. We do not express an opinion or provide any assurance on the information because the limited procedures do not provide us with sufficient evidence to express an opinion or provide any assurance.
Other Information
Our audit was conducted for the purpose of forming an opinion on the financial statements that collectively comprise the College’s basic financial statements. The Supplemental Schedules A through D as required by the Texas Higher Education Coordinating Board’s (THECB) Budget Requirements and Annual Financial Reporting Requirements for Texas Public Community and Junior Colleges, are presented for purposes of additional analysis and are not a required part of the basic financial statements. The Schedule of Expenditures of Federal Awards, as required by Office of Management and Budget Circular A-133, Audits of States, Local Governments, and Non-Profit Organizations, the Schedule of Expenditures of State Awards as required by the State of Texas Single Audit Circular contained in the Governor’s Office of Budget and Planning Uniform Grant Management Standards, and other information such as the introductory and statistical sections are also presented for additional analysis and are not a required part of the basic financial statements.
20 | P a g e
To the Board of Trustees Lone Star College The Woodlands, Texas
The Supplemental Schedules A through D, the schedule of expenditures of federal awards, and schedule of expenditures of state awards are the responsibility of management and were derived from and relate directly to the underlying accounting and other records used to prepare the basic financial statements. Such information has been subjected to the auditing procedures applied in the audit of the basic financial statements and certain additional procedures, including comparing and reconciling such information directly to the underlying accounting and other records used to prepare the basic financial statements or to the basic financial statements themselves, and other additional procedures in accordance with auditing standards generally accepted in the United States of America. In our opinion, the Supplemental Schedules A through D, schedule of expenditures of federal awards, and the schedule of expenditures of state awards are fairly stated, in all material respects, in relation to the basic financial statements as a whole.
The introductory and statistical sections have not been subjected to the auditing procedures applied in the audit of the basic financial statements and, accordingly, we do not express an opinion or provide any assurance on them.
Other Reporting Required by Government Auditing Standards
In accordance with Government Auditing Standards, we have also issued our report dated December 3, 2015 on our consideration of the College’s internal control over financial reporting and on our tests of its compliance with certain provisions of laws, regulations, contracts, and grant agreements and other matters. The purpose of that report is to describe the scope of our testing of internal control over financial reporting and compliance and the results of that testing, and not to provide an opinion on internal control over financial reporting or on compliance. That report is an integral part of an audit performed in accordance with Government Auditing Standards in considering the College’s internal control over financial reporting and compliance.
Houston, Texas December 3, 2015
21 | P a g e
Management’s Discussion and Analysis
22 | P a g e
Lone Star College
The purpose of the annual report is to provide readers with financial information about the activities and financial condition of Lone Star College (the “College”). The report consists of three basic financial statements that provide information on the College as a whole: the Statements of Net Position, the Statements of Revenues, Expenses and Changes in Net Position, and the Statements of Cash Flows. These reports should be read in conjunction with the notes to the financial statements. The following summary and management discussion of the results is intended to provide the readers with an overview of the College’s financial activities. For purposes of the summary and discussion, the terms “2015”, “2014”, and “2013” refer to fiscal years ending August 31, 2015, August 31, 2014, and August 31, 2013, respectively. Accounting Standards The financial statements are prepared in accordance with the Governmental Accounting Standards Board (GASB) standards. The college is considered to be a special-purpose government engaged in business-type activities. Financial and Enrollment Highlights - 2015
Enrollment increased 4% while contact hours increased 2% during 2015. The College maintained its AAA rating from Standard & Poor’s on its general obligation debt. Total assets increased $121 million, a 12% increase over 2014, due to an increase in cash and investments from bond
proceeds. Operating expenses for educational activities increased $33.6 million, which represents a 9% increase. The increases
were related to the addition of new full-time faculty positions and the College’s continued emphasis on student success and completion.
The College implemented a new governmental accounting standard which requires colleges and state agencies to record their proportional share of the state’s pension liability on their books. This accounts for the decrease in net position during 2015.
Financial and Enrollment Highlights - 2014
Net position increased $3 million, which represents a 1% increase over 2013. Construction in progress balances decreased to approximately $28 million as various projects funded with bond proceeds
were completed. The College maintained its AAA rating from Standard & Poor’s on its general obligation debt. Operating expenses for educational activities increased $20 million, which represents a 6% increase. The increases were
related to the addition of new full time faculty positions and the College’s continued emphasis on student success and completion.
Enrollment and fundable contact hours remained steady during 2014.
23 | P a g e

The following chart depicts the growth in student headcount and contact hours by fiscal year:
1Student headcount for each fiscal year is the total of fall, spring, and summer terms headcount.
Source: LSC Office of Analytics & Institutional Reporting
24 | P a g e

Statements of Net Position
The Statements of Net Position present the financial position of the College at the end of the fiscal year. The statements include assets, liabilities, deferred outflows and inflows and are prepared using the accrual basis of accounting, which is similar to the accounting used by most private-sector institutions. A summary of the most recent three fiscal years’ statements is shown below.
2015 2014 2013
Current Assets: Cash and short-term investments 281,268,113$ 170,647,032$ 137,564,574$ Receivables, net 47,161,219 47,810,809 45,245,178 Inventory, prepaid expenses & other 768,074 734,995 119,196
Total current assets 329,197,406 219,192,836 182,928,948
Non-Current Assets:Capital assets, net 780,509,924 769,918,536 767,525,376
Total assets 1,109,707,330$ 989,111,372$ 950,454,324$
Deferred outflows of resourcesDeferred outflows related to pensions 8,864,100$ -$ -$
Current Liabilities:Accounts payable & accrued liabil ities 42,236,370$ 37,771,732$ 45,070,952$ Unearned revenues 46,996,647 47,962,543 43,720,399 Bonds payable-current portion 25,812,704 25,831,137 21,386,811
115,045,721 111,565,412 110,178,162
Non-Current Liabilities:Accrued compensable absences 5,295,422 6,455,039 5,994,855 Net Pension Liabil ity 48,590,997 - - Bonds payable-noncurrent portion 714,738,144 595,507,280 561,668,624
Total l iabil ities 883,670,284$ 713,527,731$ 677,841,641$
Deferred inflows of resourcesDeferred inflows related to pensions 14,864,132$ -$ -$ Deferred inflows related to gain/loss on refunding 1,445,282
Total deferred inflows of resources 16,309,414$ -$ -$
Net Position:Net Investment in capital assets 198,560,069 178,160,052 178,498,298 Restricted 48,249,611 44,889,269 37,799,941 Unrestricted (28,217,948) 52,534,320 56,314,444
Total net position 218,591,732$ 275,583,641$ 272,612,683$
August 31
25 | P a g e

Statements of Net Position (Continued)
The increase in total current assets of $110 million in 2015 relates to an increase in cash and short-term investments resulting from the investment of bond proceeds from the issuance of $150 million in general obligation bonds for the College’s capital program. Total liabilities increased $170 million during 2015. The increase is primarily relates to an increase in bonds payable from the 2015 bond issuance noted above and the recognition of a new pension liability described below. During 2015, the College implemented a new accounting standard; GASB Statement No. 68, Accounting and Financial Reporting for Pensions as amended by GASB Statement No. 71, Pension Transition for Contributions Made Subsequent to the Measurement Date. The new standard requires all colleges and state agencies to recognize their share of the Teacher’s Retirement System of Texas (TRS) pension liability on their financial statements. As a result, the College recognized a $49 million liability to comply with this standard. The various rating agencies and bond counsel have assured all TRS participating entities that there will be no negative impact upon our bond rating from this accounting change. Without this change, unrestricted net position would be $26 million at August 31, 2015. Deferred outflows and inflows of resources are two new line items for 2015 which are related to the change in accounting principle described above. The decrease in total net position of $57 million is also related to this change in accounting principle.
26 | P a g e

Statements of Revenues, Expenses and Changes in Net Position The Statements of Revenues, Expenses and Changes in Net Position present the operating results of the College, as well as the non-operating revenues and expenses. Ad valorem taxes for maintenance and operations, and state appropriations, while budgeted for operations, are not considered to be exchange transactions and are, therefore, classified as non-operating revenues according to generally accepted accounting principles. A summary of the most recent three fiscal years’ statements is shown below.
Student tuition and fees revenue is reported net of scholarships and discounts. Tuition and fee revenue increased $15.6 million for 2015, due to a fall 2014 increase in base tuition and technology fees. At $42 per credit hour the College’s tuition rate remains below the Texas average for community colleges. For 2014, student tuition and fees increased $2 million primarily due to an increase in differential fees. Grants & contracts increased $1.2 million for 2015 due to an increase in grant funding from the Texas Higher Education Coordinating Board and Texas Workforce Commission. Auxiliary enterprises and other revenue increased slightly.
2015 2014 2013Operating Revenues
Student tuition and fees 77,564,764$ 61,961,356$ 59,682,149$ Grants & contracts 15,053,707 13,842,872 13,484,181 Auxil iary enterprises 14,963,113 14,334,851 9,849,775 Other 2,779,531 2,238,929 1,467,289
Total operating revenues 110,361,115 92,378,008 84,483,394
Operating ExpensesEducational Activities 392,942,852 359,331,547 339,152,298 Auxil iary Activities 14,088,379 12,307,062 8,621,387 Depreciation Expense 25,473,371 23,587,965 22,345,642
Total operating expenses 432,504,602 395,226,574 370,119,327
Net Operating Loss (322,143,487) (302,848,566) (285,635,933)
Non-Operating RevenuesAd-valorem taxes 158,836,447 152,703,783 145,759,393 State Appropriations 90,002,374 85,708,997 75,961,961 Federal Revenue, Non-Operating 91,112,482 91,369,027 90,756,771 Investment income 662,925 450,967 556,004 Interest and fees on capital
asset - related debt (23,738,073) (27,106,038) (22,791,859) Other 3,329,230 2,692,788 (1,158,530)
Total non-operating revenues-net 320,205,385 305,819,524 289,083,740
Increase (Decrease) in Net Position (1,938,102) 2,970,958 3,447,807
Net Position, Beginning of Year 275,583,641 272,612,683 269,164,876
Prior Period Adjustment, GASB 68 restatement (55,053,807) - -
Net Position, End of Year 218,591,732$ 275,583,641$ 272,612,683$
August 31
27 | P a g e

Statements of Revenues, Expenses and Changes in Net Position (Continued)
Expenses for educational activities increased $34 million (9%) in 2015 and $20 million (6%) in 2014. The most significant increase in 2015 was in scholarships, which increased by $9.5 million. In 2014, the largest increase was in the instruction category. The College added new full-time faculty positions to maintain the current full-time/part-time ratio. In addition, enhancements were made to technology tools in reporting student outcomes as the College continues to place emphasis on student success and completion. Tax revenues increased $6 million in 2015 ($7 million in 2014) as a result of a strengthening of the local economy and the addition of new properties. Investment income increased marginally in 2015 due to slightly better interest rates. State appropriations increased $4 million in 2015. The base appropriation stayed the same however, the state contribution for insurance and retirement increased. The 83rd legislature passed an appropriations act for the 2014-15 biennium which changed the method of funding for the state’s 50 community colleges. Each college receives a base funding amount of $500,000 per year. Additionally, each college receives an allocation based on contact hours and student success points.
28 | P a g e

Total Revenues The College has four main sources of revenue: ad valorem taxes, state appropriations, student tuition and fees, and grants and contracts. The following chart illustrates the breakdown of total revenues for the College.
The largest source of revenue for both 2015 and 2014 for the College is ad valorem taxes which account for 35% and 36% of total revenues for 2015 and 2014, respectively. Auxiliary income comprises the majority of other revenues.
29 | P a g e

Total Expenses Expenses for the College can be grouped into nine functional categories: instruction, public service, academic support, student services, institutional support, operation and maintenance of plant, scholarships, auxiliary, and depreciation. The following chart illustrates the breakdown of total expenses for the College.
At 30% and 31% of the total expenses for 2015 and 2014 respectively, instruction is by far the College’s largest expense. All other expenses remained relatively consistent.
30 | P a g e
Capital Assets and Long-Term Debt Activity As depicted in Footnote 5 to the financial statements, capital assets increased from $770 million in 2014 to $781 million in 2015. The following lists some of the major projects and changes that occurred during 2015 and 2014: 2015 Projects
Bond Projects Continued construction of the 85,000 square foot/$20.2 million Creekside Satellite Center scheduled to open in
January 2016.
Completed $8 million of renovation projects across the College.
Real Estate Transactions
Acquired an 8.3 acre tract of land for $3.8 million in the Kingwood area to support the Process Technology Satellite Center.
Acquired a 135,000 square foot building on a 6.6 acre tract of land for $15.5 million in the Cy-Fair area to support the information Technology Satellite Center.
2014 Projects
Bond Projects Completed construction of the 72,000 square foot/ $16 million Energy and Manufacturing Institute Building (EMI)
on the University Park campus.
Completed construction of a 270 space/$3.6 million parking garage at the Fairbanks Satellite Center.
Completed $2.5 million of renovation projects across the College.
Continued construction on the 85,000 square foot/$20.2 million Creekside Satellite Center.
Real Estate Transactions
Acquired a 19 acre tract of land for $.7 million in the Tomball area to support the Drilling Platform Training Center. Sold a 2.4 acre tract of land with a 30,000 square foot building for $1.9 million that formerly housed the Conroe
Center.
As detailed in Footnote 7 to the financial statements, financing for the above projects has been achieved through the issuance of long-term bonds.
31 | P a g e
Financial Statements
32 | P a g e

ASSETS 2015 2014Current assets:
Cash and cash equivalents 262,828,989$ 167,240,734$ Short-term investments 18,439,124 3,406,298 Accounts receivable, net 47,161,219 47,810,809Inventories 51,382 51,478Prepaid items 716,692 683,517
Total current assets 329,197,406 219,192,836
Noncurrent assets:Capital assets, net 780,509,924 769,918,536
Total non-current assets 780,509,924 769,918,536
TOTAL ASSETS 1,109,707,330 989,111,372
Deferred outflows of resourcesDeferred outflows related to pensions 8,864,100$ -$
LIABILITIESCurrent liabilities:
Accounts payable and accrued liabilities 36,942,522$ 33,372,256$ Accrued compensable absences 736,887 663,006Funds held for others 4,556,961 3,736,470Unearned revenues 46,996,647 47,962,543Bonds payable-current portion 25,812,704 25,831,137
Total current liabilities 115,045,721 111,565,412
Noncurrent liabilities:Accrued compensable absences 5,295,422 6,455,039Net Pension Liability 48,590,997 - Bonds payable-noncurrent portion 714,738,144 595,507,280
Total non-current liabilities 768,624,563 601,962,319
TOTAL LIABILITIES 883,670,284 713,527,731
Deferred inflows of resourcesDeferred inflows related to pensions 14,864,132$ -$ Deferred inflows related to gain/loss on refunding 1,445,282 -
TOTAL DEFERRED INFLOWS OF RESOURCES 16,309,414 -
NET POSITIONNet Investment in Capital Assets 198,560,069$ 178,160,052$ Restricted:
Expendable- Restricted 208,567 198,214 Debt service 48,041,044 44,691,055
Unrestricted (28,217,948) 52,534,320
TOTAL NET POSITION (Schedule D) 218,591,732$ 275,583,641$
EXHIBIT 1Lone Star College
STATEMENTS OF NET POSITIONAUGUST 31, 2015 AND 2014
The accompanying notes are an integra l part of the financia l s tatements .
33 | P a g e

Lone Star College STATEMENTS OF REVENUES, EXPENSES AND CHANGES IN NET POSITION
FOR THE YEARS ENDED AUGUST 31, 2015 AND 2014
2015 2014OPERATING REVENUES
Tuition and fees (net of discounts of $38,302,512 in 2015and $45,019,459 in 2014) 77,564,764$ 61,961,356$
Federal grants and contracts 4,822,716 5,774,884State and local grants and contracts 10,230,991 8,067,988Auxiliary enterprises 14,963,113 14,334,851Other operating revenue 2,779,531 2,238,929
Total operating revenues (Schedule A) 110,361,115 92,378,008
OPERATING EXPENSESInstruction 128,275,969 123,466,195Public service 1,363,609 1,339,559Academic support 60,594,812 55,927,826Student services 47,340,266 41,840,156Institutional support 40,663,525 37,229,953Operation and maintenance of plant 49,375,014 43,688,005Scholarships and fellowships 65,329,657 55,839,853Auxiliary enterprises 14,088,379 12,307,062Depreciation 25,473,371 23,587,965
Total operating expenses (Schedule B) 432,504,602 395,226,574
Operating loss (322,143,487) (302,848,566)
NON-OPERATING REVENUE (EXPENSES)Ad-Valorem taxes
Maintenance and operations 112,203,019 109,040,590General obligation bonds 46,633,428 43,663,193
State appropriations 90,002,374 85,708,997 Federal revenue, non-operating 91,112,482 91,369,027 Gifts 1,902,809 297,500 Investment income, net 662,925 450,967Interest and fees on capital asset-related debt (net of capitalized
interest costs of $360,337 in 2015 and $130,012 in 2014) (23,738,073) (27,106,038)Loss on disposal of capital assets (175,810) (7,591)Other non-operating revenues 1,602,231 2,402,879
Total non-operating revenue (Schedule C) 320,205,385 305,819,524
Increase (decrease) in net position (1,938,102) 2,970,958NET POSITION, BEGINNING OF YEAR 275,583,641 272,612,683PRIOR PERIOD ADJUSTMENT, GASB 68 RESTATEMENT (55,053,807) -
NET POSITION, END OF YEAR 218,591,732$ 275,583,641$
EXHIBIT 2
The accompanying notes are an integra l part of the financia l s tatements .
34 | P a g e
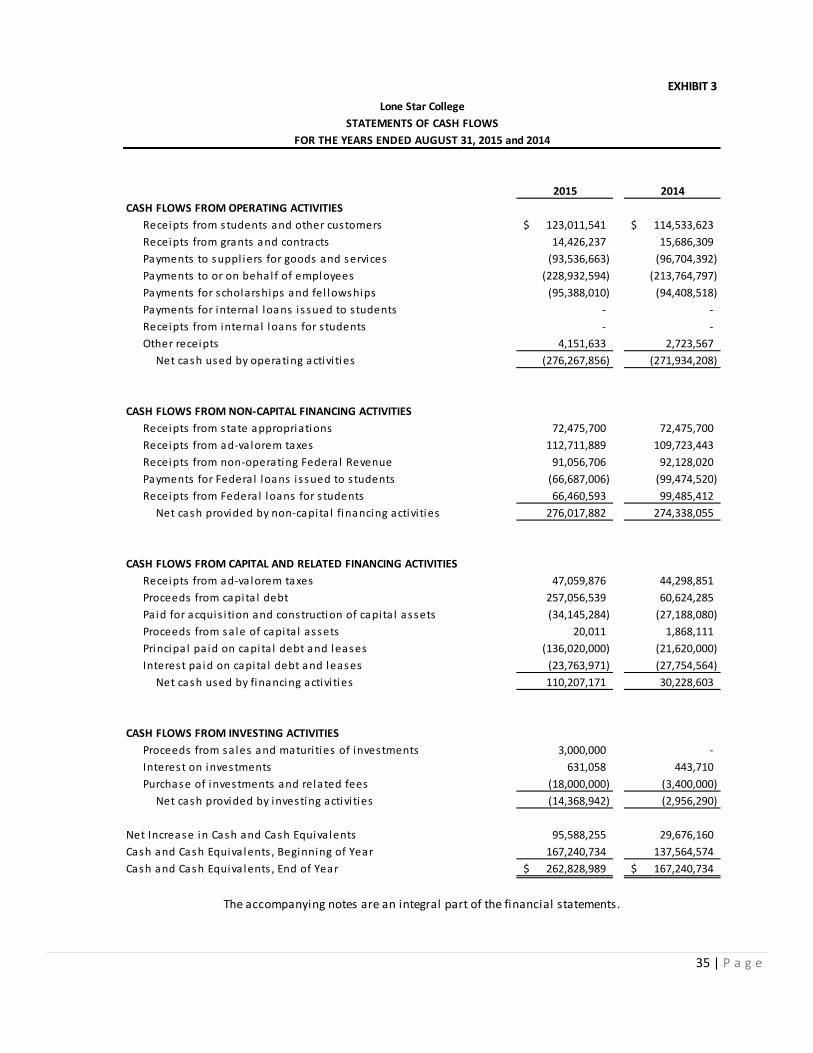
2015 2014CASH FLOWS FROM OPERATING ACTIVITIES
Receipts from students and other customers 123,011,541$ 114,533,623$ Receipts from grants and contracts 14,426,237 15,686,309Payments to suppl iers for goods and services (93,536,663) (96,704,392)Payments to or on behal f of employees (228,932,594) (213,764,797)Payments for scholarships and fel lowships (95,388,010) (94,408,518)Payments for internal loans i s sued to s tudents - - Receipts from internal loans for s tudents - - Other receipts 4,151,633 2,723,567
Net cash used by operating activi ties (276,267,856) (271,934,208)
CASH FLOWS FROM NON-CAPITAL FINANCING ACTIVITIESReceipts from state appropriations 72,475,700 72,475,700Receipts from ad-va lorem taxes 112,711,889 109,723,443Receipts from non-operating Federa l Revenue 91,056,706 92,128,020Payments for Federa l loans i s sued to s tudents (66,687,006) (99,474,520)Receipts from Federa l loans for s tudents 66,460,593 99,485,412
Net cash provided by non-capi ta l financing activi ties 276,017,882 274,338,055
CASH FLOWS FROM CAPITAL AND RELATED FINANCING ACTIVITIESReceipts from ad-va lorem taxes 47,059,876 44,298,851Proceeds from capi ta l debt 257,056,539 60,624,285Paid for acquis i tion and construction of capi ta l assets (34,145,284) (27,188,080)Proceeds from sa le of capi ta l assets 20,011 1,868,111Principa l pa id on capi ta l debt and leases (136,020,000) (21,620,000)Interest pa id on capi ta l debt and leases (23,763,971) (27,754,564)
Net cash used by financing activi ties 110,207,171 30,228,603
CASH FLOWS FROM INVESTING ACTIVITIESProceeds from sa les and maturi ties of investments 3,000,000 - Interest on investments 631,058 443,710Purchase of investments and related fees (18,000,000) (3,400,000)
Net cash provided by investing activi ties (14,368,942) (2,956,290)
Net Increase in Cash and Cash Equiva lents 95,588,255 29,676,160Cash and Cash Equiva lents , Beginning of Year 167,240,734 137,564,574Cash and Cash Equiva lents , End of Year 262,828,989$ 167,240,734$
EXHIBIT 3
STATEMENTS OF CASH FLOWSFOR THE YEARS ENDED AUGUST 31, 2015 and 2014
The accompanying notes are an integral part of the financial statements.
Lone Star College
35 | P a g e

2015 2014Reconciliation of Operating Loss to Net Cash Used by Operating ActivitiesOperating loss (322,143,487)$ (302,848,566)$
Adjustments to reconci le operating loss to net cashused by operating activi ties
Depreciation expense 25,473,371 23,587,965Bad debt expense 366,679 636,712Payments made di rectly by s tate for benefi ts 17,526,674 13,233,297Changes in assets and l iabi l i ties
Receivables , net 216,003 (4,467,801)Inventories 96 (4,004)Prepaid i tems (33,175) (611,796)Deferred outflows (8,864,100) - Accounts payable and accrued l iabi l i ties 3,657,240 (7,124,887)Unearned revenue (603,233) 5,095,217Funds held for others 820,491 81,465Accrued compensable absences (1,085,736) 488,190Net Pens ion Liabi l i ty (6,462,809) - Deferred inflows 14,864,130 - Tota l adjustments 45,875,631 30,914,358
Net cash used by operating activi ties (276,267,856)$ (271,934,208)$
NON-CASH INVESTING, CAPITAL, AND FINANCING ACTIVITIESPayments made di rectly by s tate for benefi ts 17,526,674$ 13,233,297$ Net Pens ion Liabi l i ty (462,779) - Ga in/Loss on Refunding (1,445,282) -
Net Non-cash Investing, Capi ta l , and Financing Activi ties 15,618,613$ 13,233,297$
The accompanying notes are an integral part of the financial statements.
STATEMENTS OF CASH FLOWSFOR THE YEARS ENDED AUGUST 31, 2015 and 2014
EXHIBIT 3 (Cont)Lone Star College
36 | P a g e

Notes to Financial Statements
37 | P a g e
LONE STAR COLLEGE
Notes to Financial Statements
For the Fiscal Years Ended August 31, 2015 and 2014
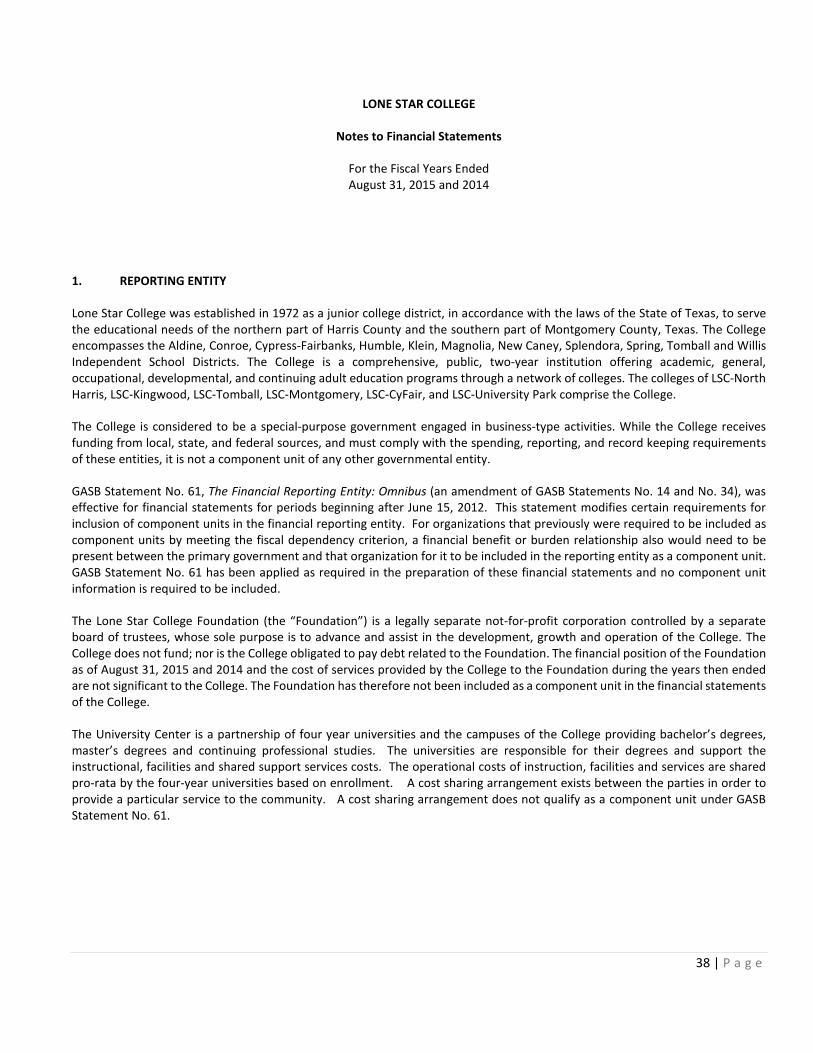
1. REPORTING ENTITY
Lone Star College was established in 1972 as a junior college district, in accordance with the laws of the State of Texas, to serve the educational needs of the northern part of Harris County and the southern part of Montgomery County, Texas. The College encompasses the Aldine, Conroe, Cypress-Fairbanks, Humble, Klein, Magnolia, New Caney, Splendora, Spring, Tomball and Willis Independent School Districts. The College is a comprehensive, public, two-year institution offering academic, general, occupational, developmental, and continuing adult education programs through a network of colleges. The colleges of LSC-North Harris, LSC-Kingwood, LSC-Tomball, LSC-Montgomery, LSC-CyFair, and LSC-University Park comprise the College.
The College is considered to be a special-purpose government engaged in business-type activities. While the College receives funding from local, state, and federal sources, and must comply with the spending, reporting, and record keeping requirements of these entities, it is not a component unit of any other governmental entity.
GASB Statement No. 61, The Financial Reporting Entity: Omnibus (an amendment of GASB Statements No. 14 and No. 34), was effective for financial statements for periods beginning after June 15, 2012. This statement modifies certain requirements for inclusion of component units in the financial reporting entity. For organizations that previously were required to be included as component units by meeting the fiscal dependency criterion, a financial benefit or burden relationship also would need to be present between the primary government and that organization for it to be included in the reporting entity as a component unit. GASB Statement No. 61 has been applied as required in the preparation of these financial statements and no component unit information is required to be included.
The Lone Star College Foundation (the “Foundation”) is a legally separate not-for-profit corporation controlled by a separate board of trustees, whose sole purpose is to advance and assist in the development, growth and operation of the College. The College does not fund; nor is the College obligated to pay debt related to the Foundation. The financial position of the Foundation as of August 31, 2015 and 2014 and the cost of services provided by the College to the Foundation during the years then ended are not significant to the College. The Foundation has therefore not been included as a component unit in the financial statements of the College.
The University Center is a partnership of four year universities and the campuses of the College providing bachelor’s degrees, master’s degrees and continuing professional studies. The universities are responsible for their degrees and support the instructional, facilities and shared support services costs. The operational costs of instruction, facilities and services are shared pro-rata by the four-year universities based on enrollment. A cost sharing arrangement exists between the parties in order to provide a particular service to the community. A cost sharing arrangement does not qualify as a component unit under GASB Statement No. 61.
38 | P a g e

2. SUMMARY OF SIGNIFICANT ACCOUNTING POLICIES
Reporting Guidelines
The significant accounting policies followed by the College in preparing these financial statements are in accordance with accounting principles generally accepted in the United States of America as prescribed by the Governmental Accounting Standards Board (GASB). The accompanying financial statements also comply with the Texas Higher Education Coordinating Board’s Annual Financial Reporting Requirements for Texas Public Community and Junior Colleges. The College is reported as a special-purpose government engaged in business-type activities.
Basis of Accounting
The financial statements of the College have been prepared using the economic resources measurement focus and the accrual basis of accounting. All revenues are recorded when earned and all expenses are recorded when they have been reduced to a legal or contractual obligation to pay.
Tuition Discounting
Texas Public Education Grants
Certain tuition amounts are required to be set aside for use as scholarships by qualifying students. This set aside, called the Texas Public Education Grant (TPEG), is shown with tuition and fee revenue amounts as a separate set aside amount (Texas Education Code § 56.033). When the award is used by the student for tuition and fees, the amount is recorded as tuition discount. If the amount is disbursed directly to the student, the amount is recorded as a scholarship expense.
Title IV, Higher Education Act Program Funds Certain Title IV HEA Program funds are received by the College to pass through to the student. These funds are initially received by the College and recorded as revenue. When the award is used by the student for tuition and fees, the amount is recorded as tuition discount. If the amount is disbursed directly to the student, the amount is recorded as a scholarship expense.
Other Tuition Discounts The College awards tuition and fee scholarships from institutional funds to students who qualify. When these amounts are used for tuition and fees, the amount is recorded as a tuition discount. If the amount is disbursed directly to the student, the amount is recorded as a scholarship expense.
Budgetary Data
Each community college in Texas is required by law to prepare an annual operating budget of anticipated revenues and expenditures for the fiscal year beginning September 1. The College’s Board of Trustees adopts the budget, which is prepared on the accrual basis of accounting. A copy of the approved budget and subsequent amendments must be filed with the Texas Higher Education Coordinating Board, Legislative Budget Board, Legislative Reference Library, and Governor’s Office of Budget and Planning by December 1.
Cash and Cash Equivalents
The College’s cash and cash equivalents are considered to be cash on hand, demand deposits, and short-term investments with original maturities of three months or less from the date of acquisition.
Investments
In accordance with GASB Statement No. 31, Accounting and Financial Reporting for Certain Investments and External Investment Pools, investments are reported at fair value. Fair values are based on published market rates. Short-term investments have an
39 | P a g e

original maturity date greater than three months but less than one year at time of purchase. The College has designated public funds investment pools comprised of $202,062,100 and $42,310,558 at 2015 and 2014, respectively, to be short-term investments. Long-term investments have an original maturity of greater than one year at the time of purchase. The College had no long-term investments at August 31, 2015 and 2014. Inventories
Inventories consist of food service supplies. Inventories are valued at cost under the “first-in, first-out” method and are charged to expense as consumed.
Capital Assets
Capital assets are recorded at cost at the date of acquisition, or fair value at the date of donation. For equipment, the College’s capitalization policy includes all items with a unit cost of $5,000 or more and an estimated useful life in excess of one year. Renovations of $100,000 to buildings and infrastructure and land improvements that significantly increase the value or extend the useful life of the structure are capitalized. The costs of normal maintenance and repairs that do not add to the value of the asset or materially extend the useful life of the asset are charged to operating expense in the year in which the expense is incurred.
Depreciation is computed using the straight-line method over the estimated useful lives of the assets, generally 50 years for buildings, 50 years for land improvements, 15 years for library books, 10 years for furniture, machinery, vehicles and other equipment and 5 years for telecommunications and peripheral equipment.
Deferred Inflows
In addition to liabilities, the statement of net position will sometimes report a separate section for deferred inflows of resources. This separate financial statement element, deferred inflows of resources, represents an acquisition of net position that applies to a future period(s) and so will not be recognized as an inflow of resources (revenue) until that time. Governments are only permitted to report deferred inflows in circumstances specifically authorized by the GASB. Typical deferred inflows for community colleges are deferred charges on refunding debt and related to pensions. All community colleges will have amounts in Deferred Inflows of Resources called “Deferred inflows related to pensions.” Changes in the net pension liability not included in pension expense in the current year are required to be reported as deferred outflows of resources or deferred inflows of resources related to pension. These deferred inflows result primarily from differences between projected and actual earnings on pension plan investments. These amounts will be amortized over a closed five year period. Deferred Outflows
In addition to assets, the statement of net position will sometimes report a separate section for deferred outflows of resources. This separate financial statement element, deferred outflows of resources, represents a consumption of net position that applies to a future period(s) and so will not be recognized as an outflow of resources (expense) until then. Governments are only permitted to report deferred outflows in circumstances specifically authorized by the GASB. All community colleges will have amounts in Deferred Outflows of Resources called “Deferred outflows related to pensions”. Changes in the net pension liability not included in pension expense in the current year are required to be reported as deferred outflows of resources or deferred inflows of resources related to pension. This deferred outflow results from pension plan contributions made after the measurement date of the net pension liability and the results of differences between expected and actual actuarial experiences. The deferred outflows of resources related to pensions resulting from College contributions subsequent to the measurement date will be recognized as a reduction of the net pension liability in the next fiscal year. The other pension related deferred outflows will be amortized over the expected remaining service lives of all employees (active and inactive employees) that are provided with pensions through the pension plan which is currently 6.94 years.
40 | P a g e
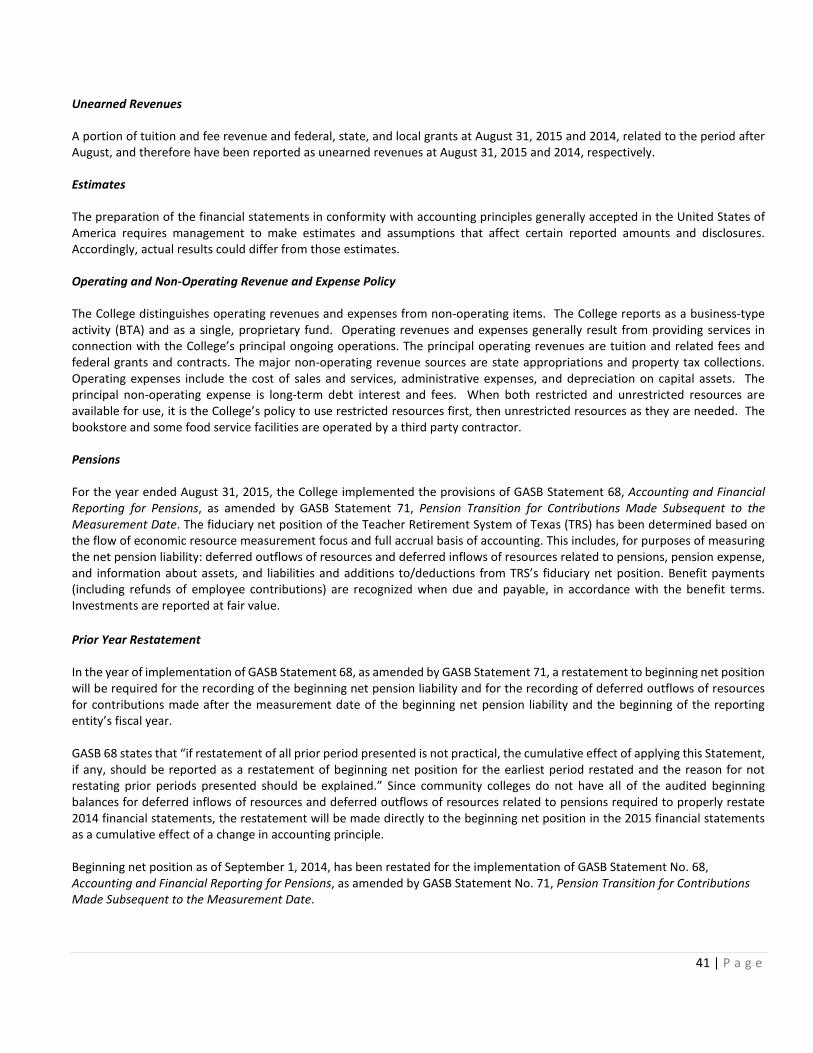
Unearned Revenues
A portion of tuition and fee revenue and federal, state, and local grants at August 31, 2015 and 2014, related to the period after August, and therefore have been reported as unearned revenues at August 31, 2015 and 2014, respectively.
Estimates
The preparation of the financial statements in conformity with accounting principles generally accepted in the United States of America requires management to make estimates and assumptions that affect certain reported amounts and disclosures. Accordingly, actual results could differ from those estimates.
Operating and Non-Operating Revenue and Expense Policy
The College distinguishes operating revenues and expenses from non-operating items. The College reports as a business-type activity (BTA) and as a single, proprietary fund. Operating revenues and expenses generally result from providing services in connection with the College’s principal ongoing operations. The principal operating revenues are tuition and related fees and federal grants and contracts. The major non-operating revenue sources are state appropriations and property tax collections. Operating expenses include the cost of sales and services, administrative expenses, and depreciation on capital assets. The principal non-operating expense is long-term debt interest and fees. When both restricted and unrestricted resources are available for use, it is the College’s policy to use restricted resources first, then unrestricted resources as they are needed. The bookstore and some food service facilities are operated by a third party contractor.
Pensions For the year ended August 31, 2015, the College implemented the provisions of GASB Statement 68, Accounting and Financial Reporting for Pensions, as amended by GASB Statement 71, Pension Transition for Contributions Made Subsequent to the Measurement Date. The fiduciary net position of the Teacher Retirement System of Texas (TRS) has been determined based on the flow of economic resource measurement focus and full accrual basis of accounting. This includes, for purposes of measuring the net pension liability: deferred outflows of resources and deferred inflows of resources related to pensions, pension expense, and information about assets, and liabilities and additions to/deductions from TRS’s fiduciary net position. Benefit payments (including refunds of employee contributions) are recognized when due and payable, in accordance with the benefit terms. Investments are reported at fair value. Prior Year Restatement In the year of implementation of GASB Statement 68, as amended by GASB Statement 71, a restatement to beginning net position will be required for the recording of the beginning net pension liability and for the recording of deferred outflows of resources for contributions made after the measurement date of the beginning net pension liability and the beginning of the reporting entity’s fiscal year. GASB 68 states that “if restatement of all prior period presented is not practical, the cumulative effect of applying this Statement, if any, should be reported as a restatement of beginning net position for the earliest period restated and the reason for not restating prior periods presented should be explained.” Since community colleges do not have all of the audited beginning balances for deferred inflows of resources and deferred outflows of resources related to pensions required to properly restate 2014 financial statements, the restatement will be made directly to the beginning net position in the 2015 financial statements as a cumulative effect of a change in accounting principle. Beginning net position as of September 1, 2014, has been restated for the implementation of GASB Statement No. 68, Accounting and Financial Reporting for Pensions, as amended by GASB Statement No. 71, Pension Transition for Contributions Made Subsequent to the Measurement Date.
41 | P a g e

New GASB Pronouncements GASB Statement No. 68, Accounting and Financial Reporting for Pensions; an amendment of GASB Statement No. 27, was implemented in fiscal year 2015. The requirements of this Statement will improve the decision-usefulness of information in employer and governmental non-employer contributing entity financial reports and will enhance its value for assessing accountability by requiring recognition of the entire net pension liability and a more comprehensive measure of pension expense. GASB Statement No. 69, Government Combinations and Disposals of Government Operations was issued for implementation in fiscal year 2015 but is not applicable to the College.
GASB Statement No. 71, Pension Transition for Contributions Made Subsequent to Measurement Date- an amendment of GASB Statement No. 68 was implemented in fiscal year 2015. The requirements of this Statement will eliminate the source of a potential significant understatement of restated beginning net position and expense in the first year of implementation of Statement 68 in the accrual-basis financial statements of employers and non-employer contributing entities. The provisions of this Statement are required to be applied simultaneously with the provisions of Statement 68.
GASB Statement No. 72, Fair Value Measurement and application. The requirements of this statement will provide guidance for determining a fair value measurement for financial reporting purposes. Implementation of this statement is planned for fiscal year 2016.
GASB Statement No. 73, Accounting and Financial Reporting for Pensions and related assets that are not within the scope of GASB Statement 68, and amendments to certain provisions of GASB Statement 67 and 68. This statement was issued for implementation in fiscal year 2016. This statement will likely not be applicable to the College.
GASB Statement No. 76, The Hierarchy of Generally Accepted Accounting Principles for State and Local Governments. The requirements of this statement improve financial reporting and as a result, governments will apply financial reporting guidance with less variation, which will improve the usefulness of financial statement information for making decisions and assessing accountability and enhance the comparability of financial statement information among governments. Implementation of this statement is planned for fiscal year 2016.
42 | P a g e
3. AUTHORIZED INVESTMENTS
The College is authorized to invest in obligations and instruments as defined in the Public Funds Investment Act (PFIA) (Sec. 2256.001 Texas Government Code) and as authorized by Board policy. The College’s Board of Trustees has adopted a written investment policy regarding the investment of its funds as defined in the PFIA. Such investments include (1) Obligations of the United States or its agencies, (2) Certificates of deposit and other forms of deposit issued by the Federal Deposit Insurance Corporation or its successor or secured by obligations in a manner consistent with State law and the Investment Policy, (3) Other obligations, the principal and interest of which are unconditionally guaranteed or insured by, or backed by the full faith and credit of the United States government, (4) Direct obligations of the State of Texas, or its agencies and instrumentalities, (5) Obligations of states, agencies, counties, cities, and other political subdivisions of any State having been rated as to investment quality by a nationally recognized investment rating firm and having received a rating of not less than "A" or its equivalent, (6) Fully collateralized repurchase agreements with a defined termination date secured by a combination of cash and obligations of the United States government or its agencies, (7) SEC registered Money Market Mutual Funds continuously rated AAAm, (8) Local government investment pools in Texas, (9) Commercial paper with a maximum maturity of 180 days, rated A1/P1 or equivalent.
43 | P a g e
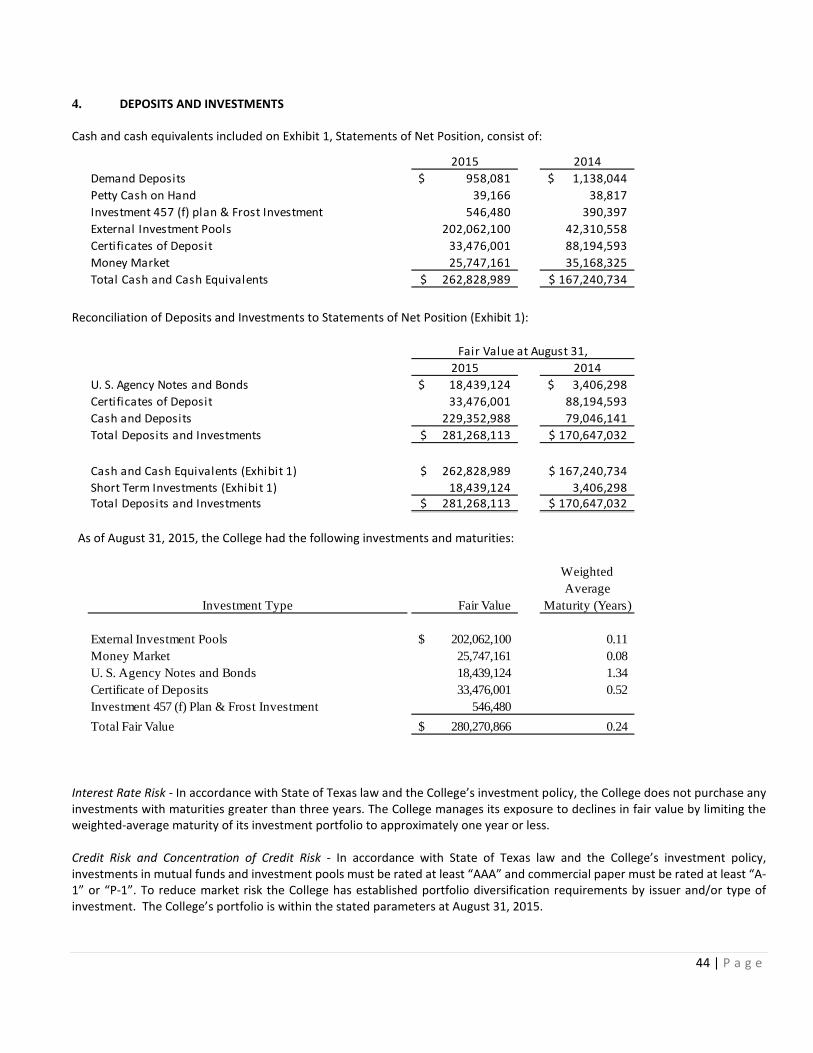
4. DEPOSITS AND INVESTMENTS
Cash and cash equivalents included on Exhibit 1, Statements of Net Position, consist of:
Reconciliation of Deposits and Investments to Statements of Net Position (Exhibit 1):
As of August 31, 2015, the College had the following investments and maturities:
Interest Rate Risk - In accordance with State of Texas law and the College’s investment policy, the College does not purchase any investments with maturities greater than three years. The College manages its exposure to declines in fair value by limiting the weighted-average maturity of its investment portfolio to approximately one year or less.
Credit Risk and Concentration of Credit Risk - In accordance with State of Texas law and the College’s investment policy, investments in mutual funds and investment pools must be rated at least “AAA” and commercial paper must be rated at least “A-1” or “P-1”. To reduce market risk the College has established portfolio diversification requirements by issuer and/or type of investment. The College’s portfolio is within the stated parameters at August 31, 2015.
2015 2014Demand Deposits 958,081$ 1,138,044$ Petty Cash on Hand 39,166 38,817 Investment 457 (f) plan & Frost Investment 546,480 390,397 External Investment Pools 202,062,100 42,310,558 Certificates of Deposit 33,476,001 88,194,593 Money Market 25,747,161 35,168,325 Total Cash and Cash Equivalents 262,828,989$ 167,240,734$
2015 2014U. S. Agency Notes and Bonds 18,439,124$ 3,406,298$ Certificates of Deposit 33,476,001 88,194,593 Cash and Deposits 229,352,988 79,046,141 Total Deposits and Investments 281,268,113$ 170,647,032$
Fair Value at August 31,
Cash and Cash Equivalents (Exhibit 1) 262,828,989$ 167,240,734$ Short Term Investments (Exhibit 1) 18,439,124 3,406,298 Total Deposits and Investments 281,268,113$ 170,647,032$
WeightedAverage
Investment Type Fair Value Maturity (Years)
External Investment Pools 202,062,100$ 0.11 Money Market 25,747,161 0.08 U. S. Agency Notes and Bonds 18,439,124 1.34 Certificate of Deposits 33,476,001 0.52 Investment 457 (f) Plan & Frost Investment 546,480 Total Fair Value 280,270,866$ 0.24
44 | P a g e
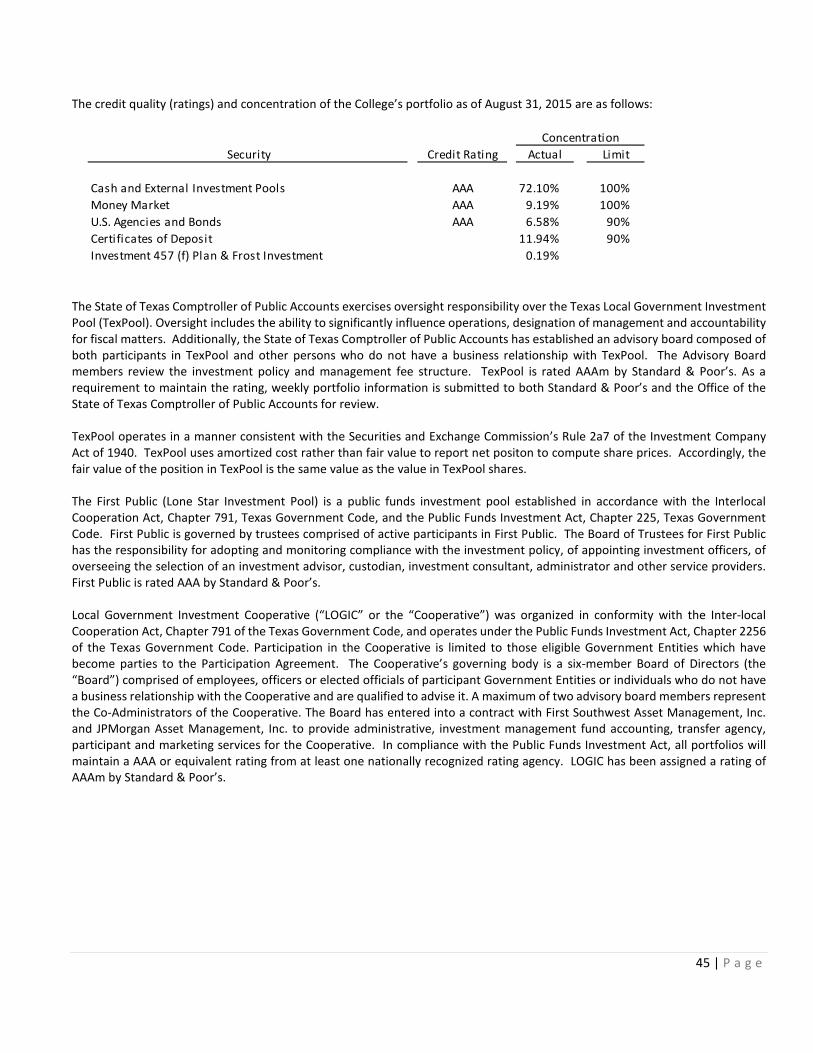
The credit quality (ratings) and concentration of the College’s portfolio as of August 31, 2015 are as follows:
The State of Texas Comptroller of Public Accounts exercises oversight responsibility over the Texas Local Government Investment Pool (TexPool). Oversight includes the ability to significantly influence operations, designation of management and accountability for fiscal matters. Additionally, the State of Texas Comptroller of Public Accounts has established an advisory board composed of both participants in TexPool and other persons who do not have a business relationship with TexPool. The Advisory Board members review the investment policy and management fee structure. TexPool is rated AAAm by Standard & Poor’s. As a requirement to maintain the rating, weekly portfolio information is submitted to both Standard & Poor’s and the Office of the State of Texas Comptroller of Public Accounts for review. TexPool operates in a manner consistent with the Securities and Exchange Commission’s Rule 2a7 of the Investment Company Act of 1940. TexPool uses amortized cost rather than fair value to report net positon to compute share prices. Accordingly, the fair value of the position in TexPool is the same value as the value in TexPool shares.
The First Public (Lone Star Investment Pool) is a public funds investment pool established in accordance with the Interlocal Cooperation Act, Chapter 791, Texas Government Code, and the Public Funds Investment Act, Chapter 225, Texas Government Code. First Public is governed by trustees comprised of active participants in First Public. The Board of Trustees for First Public has the responsibility for adopting and monitoring compliance with the investment policy, of appointing investment officers, of overseeing the selection of an investment advisor, custodian, investment consultant, administrator and other service providers. First Public is rated AAA by Standard & Poor’s. Local Government Investment Cooperative (“LOGIC” or the “Cooperative”) was organized in conformity with the Inter-local Cooperation Act, Chapter 791 of the Texas Government Code, and operates under the Public Funds Investment Act, Chapter 2256 of the Texas Government Code. Participation in the Cooperative is limited to those eligible Government Entities which have become parties to the Participation Agreement. The Cooperative’s governing body is a six-member Board of Directors (the “Board”) comprised of employees, officers or elected officials of participant Government Entities or individuals who do not have a business relationship with the Cooperative and are qualified to advise it. A maximum of two advisory board members represent the Co-Administrators of the Cooperative. The Board has entered into a contract with First Southwest Asset Management, Inc. and JPMorgan Asset Management, Inc. to provide administrative, investment management fund accounting, transfer agency, participant and marketing services for the Cooperative. In compliance with the Public Funds Investment Act, all portfolios will maintain a AAA or equivalent rating from at least one nationally recognized rating agency. LOGIC has been assigned a rating of AAAm by Standard & Poor’s.
Security Credit Rating Actual Limit
Cash and External Investment Pools AAA 72.10% 100%Money Market AAA 9.19% 100%U.S. Agencies and Bonds AAA 6.58% 90%Certificates of Deposit 11.94% 90%Investment 457 (f) Plan & Frost Investment 0.19%
Concentration
45 | P a g e

5. CAPITAL ASSETS
Capital assets activity for the year ended August 31, 2015 was as follows:
Balance Balance August 31, 2014 Increase Decrease August 31, 2015
Not Depreciated
Land 77,295,737$ 5,395,866$ (40,930)$ 82,650,673$
Construction-in-Progress 27,784,664 24,204,741 (26,100,352) 25,889,053
Subtotal 105,080,401 29,600,607 (26,141,282) 108,539,726
Buildings and Other Capital Assets
Buildings and Building Improvements 696,364,247 10,628,755 - 706,993,002
Other Real Estate Improvements 44,860,191 8,379,861 53,240,052
Total Buildings & Other Real Estate Improvements 741,224,438 19,008,616 - 760,233,054
Library Books 14,217,818 364,325 (756,783) 13,825,360
Furniture, Machinery, Vehicles & Other 71,302,203 14,247,510 (1,592,138) 83,957,575
Total Buildings and Other Capital Assets 826,744,459 33,620,451 (2,348,921) 858,015,989
Accumulated Depreciation
Buildings and Building Improvements 107,805,085 12,647,754 - 120,452,839
Other Real Estate Improvements 4,762,410 861,543 5,623,953
Total Buildings & Other Real Estate Improvements 112,567,495 13,509,297 - 126,076,792
Library Books 10,191,839 551,798 (756,784) 9,986,853
Furniture, Machinery, Vehicles & Other 39,146,990 11,412,276 (577,120) 49,982,146
Total Accumulated Depreciation 161,906,324 25,473,371 (1,333,904) 186,045,791 Net Capital Assets 769,918,536$ 37,747,687$ (27,156,299)$ 780,509,924$
46 | P a g e
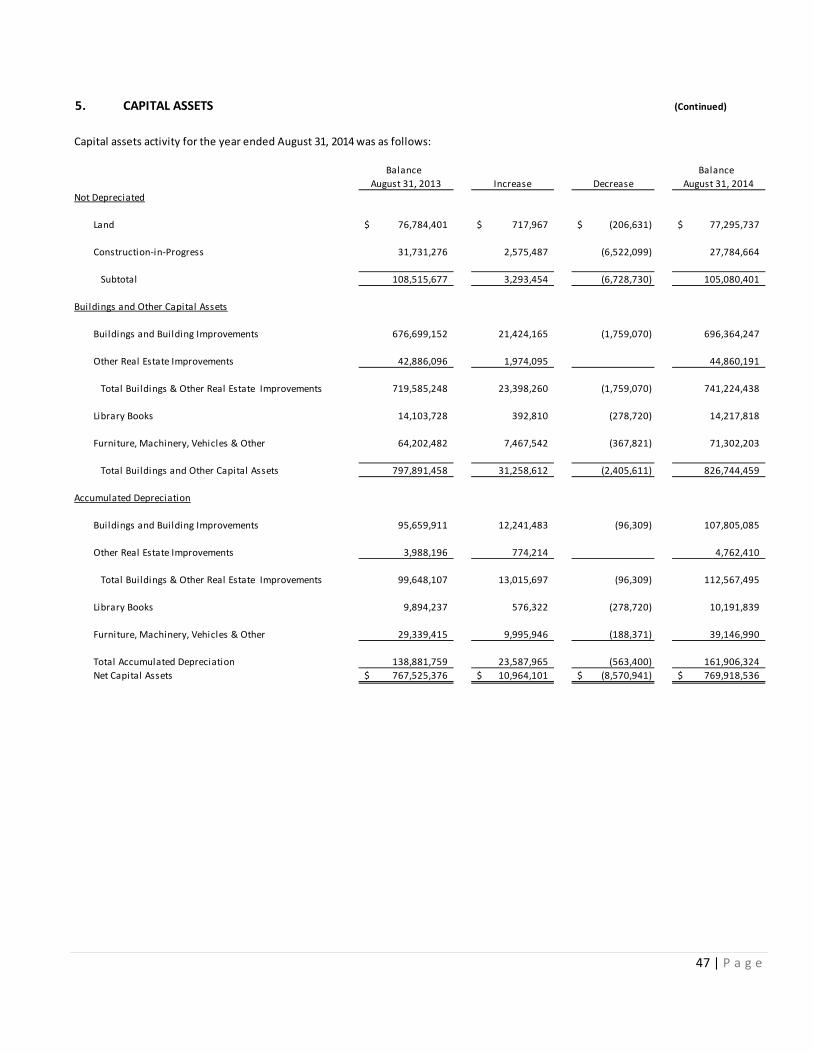
5. CAPITAL ASSETS (Continued)
Capital assets activity for the year ended August 31, 2014 was as follows:
Balance Balance August 31, 2013 Increase Decrease August 31, 2014
Not Depreciated
Land 76,784,401$ 717,967$ (206,631)$ 77,295,737$
Construction-in-Progress 31,731,276 2,575,487 (6,522,099) 27,784,664
Subtotal 108,515,677 3,293,454 (6,728,730) 105,080,401
Buildings and Other Capital Assets
Buildings and Building Improvements 676,699,152 21,424,165 (1,759,070) 696,364,247
Other Real Estate Improvements 42,886,096 1,974,095 44,860,191
Total Buildings & Other Real Estate Improvements 719,585,248 23,398,260 (1,759,070) 741,224,438
Library Books 14,103,728 392,810 (278,720) 14,217,818
Furniture, Machinery, Vehicles & Other 64,202,482 7,467,542 (367,821) 71,302,203
Total Buildings and Other Capital Assets 797,891,458 31,258,612 (2,405,611) 826,744,459
Accumulated Depreciation
Buildings and Building Improvements 95,659,911 12,241,483 (96,309) 107,805,085
Other Real Estate Improvements 3,988,196 774,214 4,762,410
Total Buildings & Other Real Estate Improvements 99,648,107 13,015,697 (96,309) 112,567,495
Library Books 9,894,237 576,322 (278,720) 10,191,839
Furniture, Machinery, Vehicles & Other 29,339,415 9,995,946 (188,371) 39,146,990
Total Accumulated Depreciation 138,881,759 23,587,965 (563,400) 161,906,324 Net Capital Assets 767,525,376$ 10,964,101$ (8,570,941)$ 769,918,536$
47 | P a g e

Balance Balance
August 31, August 31, Current
2014 Additions Reductions 2015 Portion
Bonds
General obligation bonds 473,184,077$ 268,390,666$ (144,670,496)$ 596,904,247 21,089,054$
Revenue bonds 119,850,204 - (2,963,501) 116,886,703 3,084,148
Maintenance tax note bonds 28,304,136 - (1,544,238) 26,759,898 1,639,502
Subtotal 621,338,417 268,390,666 (149,178,235) 740,550,848 25,812,704
Accrued compensable absences 7,118,045 20,557 (1,106,293) 6,032,309 736,887
Net Pension Liabil ity - 48,590,997 - 48,590,997 N/A
Total long-term liabil ities 628,456,462$ 317,002,220$ (150,284,528)$ 795,174,154$ 26,549,591$
Balance BalanceAugust 31, August 31, Current
2013 Additions Reductions 2014 Portion
Bonds General obligation bonds 490,698,803$ -$ (17,514,726)$ 473,184,077$ 21,323,397$
Revenue bonds 62,603,606 60,624,285 (3,377,687) 119,850,204 2,963,501
Maintenance tax note bonds 29,753,026 - (1,448,890) 28,304,136 1,544,239
Subtotal 583,055,435 60,624,285 (22,341,303) 621,338,417 25,831,137
Accrued compensable absences 6,629,855 1,158,412 (670,222) 7,118,045 663,006
Total long-term liabil ities 589,385,106$ 61,782,697$ (23,011,525)$ 628,456,462$ 26,494,143$
6. LONG-TERM LIABILITIES
Long-term liability activity for the year ended August 31, 2015 was as follows:
Long-term liability activity for the year ended August 31, 2014 was as follows:
48 | P a g e
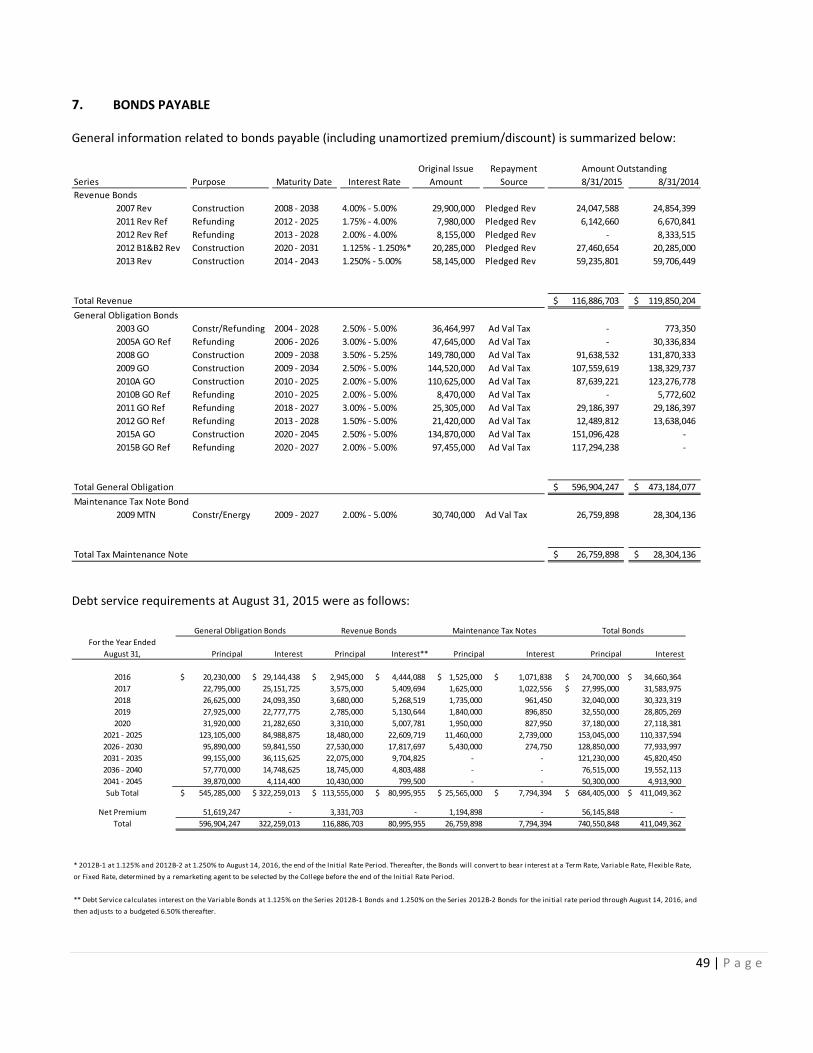
7. BONDS PAYABLE
General information related to bonds payable (including unamortized premium/discount) is summarized below:
Debt service requirements at August 31, 2015 were as follows:
Series Purpose 8/31/2015 8/31/2014Revenue Bonds
2007 Rev Construction 2008 - 2038 4.00% - 5.00% 29,900,000 Pledged Rev 24,047,588 24,854,399 2011 Rev Ref Refunding 2012 - 2025 1.75% - 4.00% 7,980,000 Pledged Rev 6,142,660 6,670,841 2012 Rev Ref Refunding 2013 - 2028 2.00% - 4.00% 8,155,000 Pledged Rev - 8,333,515 2012 B1&B2 Rev Construction 2020 - 2031 1.125% - 1.250%* 20,285,000 Pledged Rev 27,460,654 20,285,000 2013 Rev Construction 2014 - 2043 1.250% - 5.00% 58,145,000 Pledged Rev 59,235,801 59,706,449
Total Revenue 116,886,703$ 119,850,204$ General Obligation Bonds
2003 GO Constr/Refunding 2004 - 2028 2.50% - 5.00% 36,464,997 Ad Val Tax - 773,350 2005A GO Ref Refunding 2006 - 2026 3.00% - 5.00% 47,645,000 Ad Val Tax - 30,336,834 2008 GO Construction 2009 - 2038 3.50% - 5.25% 149,780,000 Ad Val Tax 91,638,532 131,870,333 2009 GO Construction 2009 - 2034 2.50% - 5.00% 144,520,000 Ad Val Tax 107,559,619 138,329,737 2010A GO Construction 2010 - 2025 2.00% - 5.00% 110,625,000 Ad Val Tax 87,639,221 123,276,778 2010B GO Ref Refunding 2010 - 2025 2.00% - 5.00% 8,470,000 Ad Val Tax - 5,772,602 2011 GO Ref Refunding 2018 - 2027 3.00% - 5.00% 25,305,000 Ad Val Tax 29,186,397 29,186,397 2012 GO Ref Refunding 2013 - 2028 1.50% - 5.00% 21,420,000 Ad Val Tax 12,489,812 13,638,046 2015A GO Construction 2020 - 2045 2.50% - 5.00% 134,870,000 Ad Val Tax 151,096,428 - 2015B GO Ref Refunding 2020 - 2027 2.00% - 5.00% 97,455,000 Ad Val Tax 117,294,238 -
Total General Obligation 596,904,247$ 473,184,077$ Maintenance Tax Note Bond
2009 MTN Constr/Energy 2009 - 2027 2.00% - 5.00% 30,740,000 Ad Val Tax 26,759,898 28,304,136
Total Tax Maintenance Note 26,759,898$ 28,304,136$
Maturity Date Interest RateOriginal Issue
AmountRepayment
SourceAmount Outstanding
Principal Interest Principal Interest** Principal Interest Principal Interest
20,230,000$ 29,144,438$ 2,945,000$ 4,444,088$ 1,525,000$ 1,071,838$ 24,700,000$ 34,660,364$ 22,795,000 25,151,725 3,575,000 5,409,694 1,625,000 1,022,556 27,995,000$ 31,583,975 26,625,000 24,093,350 3,680,000 5,268,519 1,735,000 961,450 32,040,000 30,323,319 27,925,000 22,777,775 2,785,000 5,130,644 1,840,000 896,850 32,550,000 28,805,269 31,920,000 21,282,650 3,310,000 5,007,781 1,950,000 827,950 37,180,000 27,118,381
123,105,000 84,988,875 18,480,000 22,609,719 11,460,000 2,739,000 153,045,000 110,337,594 95,890,000 59,841,550 27,530,000 17,817,697 5,430,000 274,750 128,850,000 77,933,997 99,155,000 36,115,625 22,075,000 9,704,825 - - 121,230,000 45,820,450 57,770,000 14,748,625 18,745,000 4,803,488 - - 76,515,000 19,552,113 39,870,000 4,114,400 10,430,000 799,500 - - 50,300,000 4,913,900
545,285,000$ 322,259,013$ 113,555,000$ 80,995,955$ 25,565,000$ 7,794,394$ 684,405,000$ 411,049,362$
51,619,247 - 3,331,703 - 1,194,898 - 56,145,848 - 596,904,247 322,259,013 116,886,703 80,995,955 26,759,898 7,794,394 740,550,848 411,049,362 Total
For the Year EndedAugust 31,
201620172018
2041 - 2045Sub Total
Net Premium
20192020
2021 - 20252026 - 20302031 - 20352036 - 2040
General Obligation Bonds Revenue Bonds Maintenance Tax Notes Total Bonds
* 2012B-1 at 1.125% and 2012B-2 at 1.250% to August 14, 2016, the end of the Initial Rate Period. Thereafter, the Bonds will convert to bear interest at a Term Rate, Variable Rate, Flexible Rate,or Fixed Rate, determined by a remarketing agent to be selected by the College before the end of the Initial Rate Period.
** Debt Service calculates interest on the Variable Bonds at 1.125% on the Series 2012B-1 Bonds and 1.250% on the Series 2012B-2 Bonds for the initial rate period through August 14, 2016, andthen adjusts to a budgeted 6.50% thereafter.
49 | P a g e
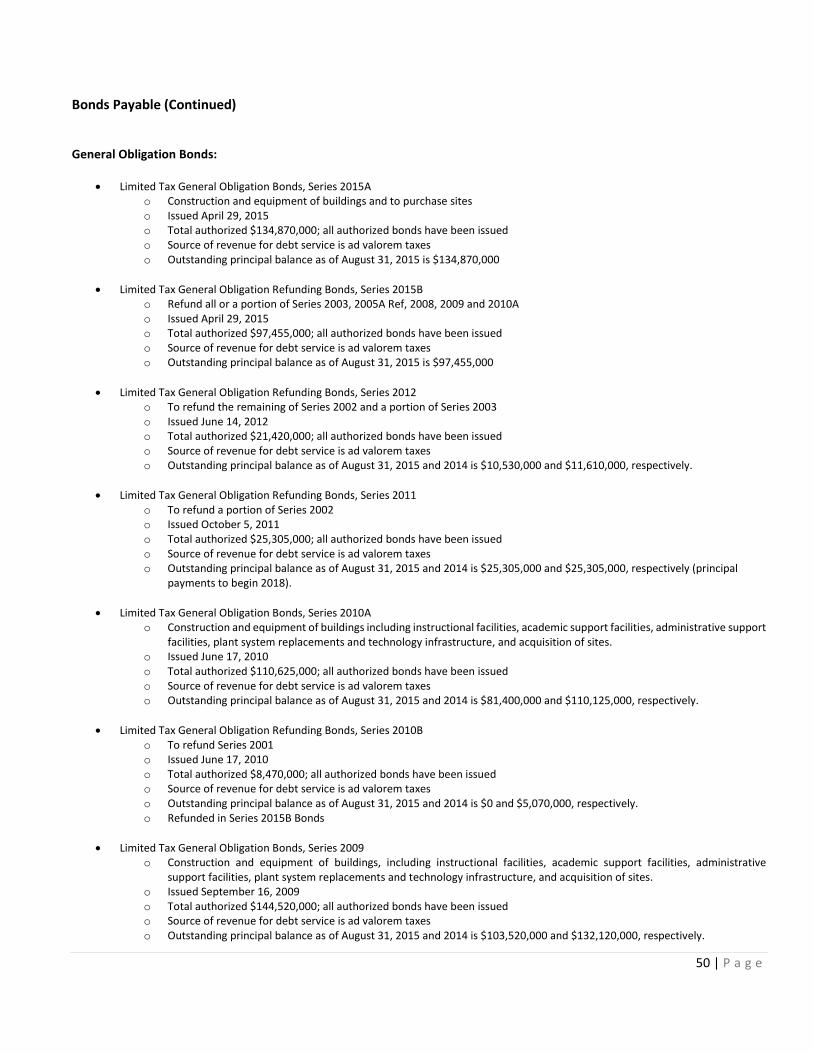
Bonds Payable (Continued) General Obligation Bonds:
• Limited Tax General Obligation Bonds, Series 2015A o Construction and equipment of buildings and to purchase sites o Issued April 29, 2015 o Total authorized $134,870,000; all authorized bonds have been issued o Source of revenue for debt service is ad valorem taxes o Outstanding principal balance as of August 31, 2015 is $134,870,000
• Limited Tax General Obligation Refunding Bonds, Series 2015B
o Refund all or a portion of Series 2003, 2005A Ref, 2008, 2009 and 2010A o Issued April 29, 2015 o Total authorized $97,455,000; all authorized bonds have been issued o Source of revenue for debt service is ad valorem taxes o Outstanding principal balance as of August 31, 2015 is $97,455,000
• Limited Tax General Obligation Refunding Bonds, Series 2012
o To refund the remaining of Series 2002 and a portion of Series 2003 o Issued June 14, 2012 o Total authorized $21,420,000; all authorized bonds have been issued o Source of revenue for debt service is ad valorem taxes o Outstanding principal balance as of August 31, 2015 and 2014 is $10,530,000 and $11,610,000, respectively.
• Limited Tax General Obligation Refunding Bonds, Series 2011
o To refund a portion of Series 2002 o Issued October 5, 2011 o Total authorized $25,305,000; all authorized bonds have been issued o Source of revenue for debt service is ad valorem taxes o Outstanding principal balance as of August 31, 2015 and 2014 is $25,305,000 and $25,305,000, respectively (principal
payments to begin 2018).
• Limited Tax General Obligation Bonds, Series 2010A o Construction and equipment of buildings including instructional facilities, academic support facilities, administrative support
facilities, plant system replacements and technology infrastructure, and acquisition of sites. o Issued June 17, 2010 o Total authorized $110,625,000; all authorized bonds have been issued o Source of revenue for debt service is ad valorem taxes o Outstanding principal balance as of August 31, 2015 and 2014 is $81,400,000 and $110,125,000, respectively.
• Limited Tax General Obligation Refunding Bonds, Series 2010B
o To refund Series 2001 o Issued June 17, 2010 o Total authorized $8,470,000; all authorized bonds have been issued o Source of revenue for debt service is ad valorem taxes o Outstanding principal balance as of August 31, 2015 and 2014 is $0 and $5,070,000, respectively. o Refunded in Series 2015B Bonds
• Limited Tax General Obligation Bonds, Series 2009
o Construction and equipment of buildings, including instructional facilities, academic support facilities, administrative support facilities, plant system replacements and technology infrastructure, and acquisition of sites.
o Issued September 16, 2009 o Total authorized $144,520,000; all authorized bonds have been issued o Source of revenue for debt service is ad valorem taxes o Outstanding principal balance as of August 31, 2015 and 2014 is $103,520,000 and $132,120,000, respectively.
50 | P a g e

Bonds Payable (Continued)
• Limited Tax General Obligation Bonds, Series 2008 o Construction and equipment of buildings, including instructional facilities, academic support facilities, administrative
support facilities, plant system replacements and technology infrastructure, and acquisition of sites. o Issued September 10, 2008 o Total authorized $149,780,000; all authorized bonds have been issued o Source of revenue for debt service is ad valorem taxes o Outstanding principal balance as of August 31, 2015 and 2014 is $92,205,000 and $130,815,000, respectively.
• Limited Tax General Obligation Refunding Bonds, Series 2005A
o Refund Series 1999 and Series 2001 o Issued May 11, 2005 o Total authorized $47,645,000; all authorized bonds have been issued o Source of revenue for debt service is ad valorem taxes o Outstanding principal balance as of August 31, 2015 and 2014 is $0 and $29,405,000, respectively. o Refunded in Series 2015B Bonds
• Limited Tax General Obligation Building and Refunding Bonds, Series 2003
o Construct, improve, renovate and equip certain facilities and acquisition of sites. o Issued December 4, 2003 o Total authorized $36,464,997; all authorized bonds have been issued o Source of revenue for debt service is ad valorem taxes o Outstanding principal balance as of August 31, 2015 and 2014 is $0 and $210,000, respectively. o Refunded in Series 2015B Bonds
Revenue Bonds:
• Revenue Financing Bonds, Series 2013 o Acquire, construct, improve, equip and maintain buildings, property, and facilities. o Issued October 17, 2013 o Total issued $58,145,000; all authorized bonds have been issued o Source of revenue for debt service is tuition and general fees o Outstanding principal balance as of August 31, 2015 and 2014 is $56,775,000 and $57,230,000, respectively.
• Variable Rate Revenue Financing Bonds, Series 2012B-1
o Acquire, construct, improve, and equip certain buildings, property, and facilities. o Issued October 23, 2012 o Total issued $11,775,000; all authorized bonds have been issued o Source of revenue for debt service is tuition and general fees o Outstanding principal balance as of August 31, 2015 and 2014 is $11,775,000 and $11,775,000, respectively (principal
payments to begin 2020).
• Variable Rate Revenue Financing Bonds, Series 2012B-2 o Acquire, construct, improve, and equip certain buildings, property, and facilities. o Issued October 23, 2012 o Total issued $8,510,000; all authorized bonds have been issued o Source of revenue for debt service is tuition and general fees o Outstanding principal balance as of August 31, 2015 and 2014 is $8,510,000 and $8,510,000, respectively (principal
payments to begin 2020).
• Revenue Financing Refunding Bonds, Series 2012 o Refund Series 2003 and Series 2003A Bonds o Issued June 14, 2012 o Total issued $8,155,000; all authorized bonds have been issued o Source of revenue for debt service is tuition and general fees
51 | P a g e

Bonds Payable (Continued)
o Outstanding principal balance as of August 31, 2015 and 2014 is $6,640,000 and $7,765,000, respectively.
• Revenue Financing Refunding Bonds, Series 2011
o Refund Series 2000 o Issued October 5, 2011 o Total issued $7,980,000; all authorized bonds have been issued o Source of revenue for debt service is tuition and general fees o Outstanding principal balance as of August 31, 2015 and 2014 is $5,955,000 and $6,465,000, respectively.
• Revenue Financing Bonds, Series 2007
o Acquisition, construction, improvement, equipment, and/or maintenance of property, buildings and facilities o Issued May 3, 2007 o Total issued $29,900,000; all authorized bonds have been issued o Source of revenue for debt service is tuition and general fees o Outstanding principal balance as of August 31, 2015 and 2014 is $23,900,000 and $24,700,000, respectively.
Maintenance Tax Notes:
• Maintenance Tax Note, Series 2009 o Acquire, finance, install, renovate, and rehabilitate certain facilities for the purpose of energy conservation, mechanical
upgrades and projects. o Issued December 3, 2009 o Total issued $30,740,000; all authorized bonds have been issued o Source of revenue for debt service is ad valorem taxes o Outstanding principal balance as of August 31, 2015 and 2014 is $25,565,000 and $26,995,000, respectively.
52 | P a g e
Arbitrage The Tax Reform Act of 1986 instituted certain arbitrage restrictions with respect to the issuance of tax-exempt bonds after August 31, 1986. Arbitrage regulations deal with the investment of all tax-exempt bond proceeds at an interest yield greater than the interest yield paid to bondholders. Generally, all interest paid to bondholders can be retroactively rendered taxable if applicable rebates are not reported and paid to the Internal Revenue Service (IRS) at least every five years. During the current year, the System performed calculations of excess investment earnings on various bonds and financings and at August 31, 2015 does not expect to incur a liability. Pledged Revenue The revenue pledged as security for the life of the revenue bond debt service includes a portion of tuition and fees, investment income and auxiliary revenues. The bond covenants require the pledge of tuition, allowable by state law, and other revenue sources to maintain a minimum debt service coverage ratio of 1.25. The pledged revenues amounted to $68,897,858 and $65,220,200 for the years ended August 31, 2015 and 2014, respectively. The pledged revenue amount equates to 69.1% and 65.6% of the above total revenue streams, respectively. Debt service on the revenue bonds was $9,967,350 and $9,936,876 for the years ended August 31, 2015 and 2014, and the debt service coverage ratio was 6.91 and 6.56, respectively. Revenue bonds are payable in annual installments varying from $210,000 to $4,390,000 with interest rates from 1.125% to 5.00% and the final installment due in 2043. The College was in compliance with all bond covenants for the years ended August 31, 2015 and 2014.
53 | P a g e
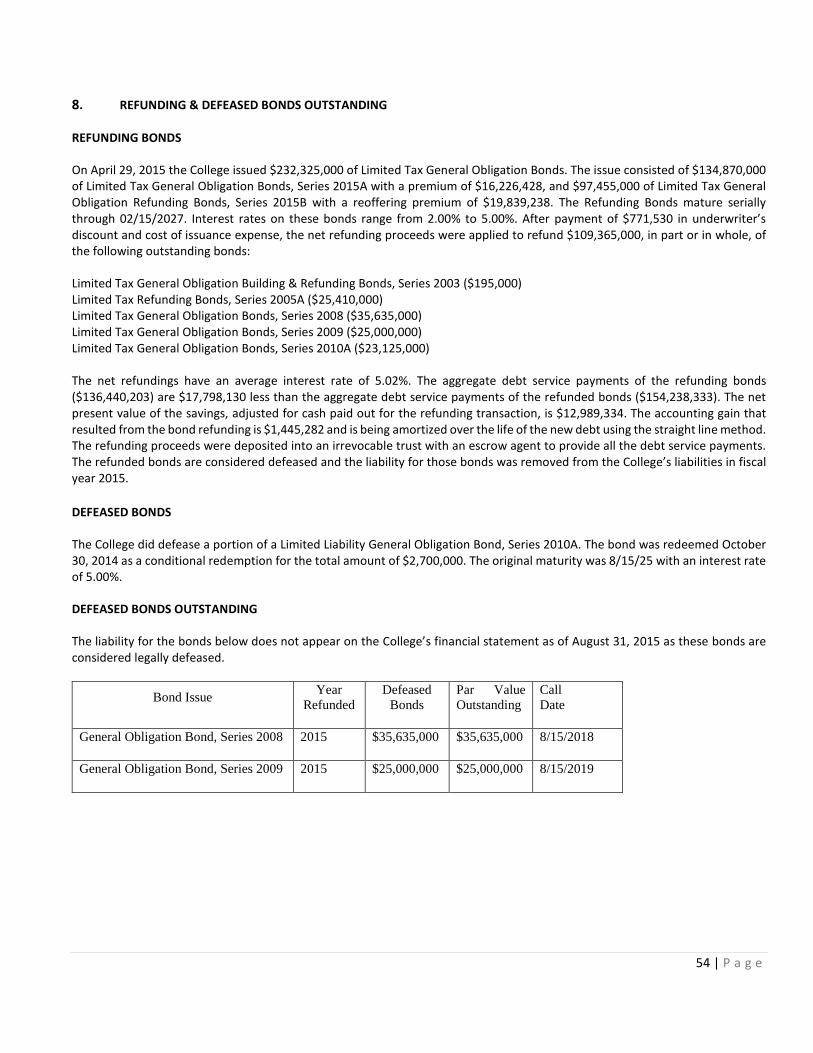
8. REFUNDING & DEFEASED BONDS OUTSTANDING
REFUNDING BONDS
On April 29, 2015 the College issued $232,325,000 of Limited Tax General Obligation Bonds. The issue consisted of $134,870,000 of Limited Tax General Obligation Bonds, Series 2015A with a premium of $16,226,428, and $97,455,000 of Limited Tax General Obligation Refunding Bonds, Series 2015B with a reoffering premium of $19,839,238. The Refunding Bonds mature serially through 02/15/2027. Interest rates on these bonds range from 2.00% to 5.00%. After payment of $771,530 in underwriter’s discount and cost of issuance expense, the net refunding proceeds were applied to refund $109,365,000, in part or in whole, of the following outstanding bonds:
Limited Tax General Obligation Building & Refunding Bonds, Series 2003 ($195,000) Limited Tax Refunding Bonds, Series 2005A ($25,410,000) Limited Tax General Obligation Bonds, Series 2008 ($35,635,000) Limited Tax General Obligation Bonds, Series 2009 ($25,000,000) Limited Tax General Obligation Bonds, Series 2010A ($23,125,000) The net refundings have an average interest rate of 5.02%. The aggregate debt service payments of the refunding bonds ($136,440,203) are $17,798,130 less than the aggregate debt service payments of the refunded bonds ($154,238,333). The net present value of the savings, adjusted for cash paid out for the refunding transaction, is $12,989,334. The accounting gain that resulted from the bond refunding is $1,445,282 and is being amortized over the life of the new debt using the straight line method. The refunding proceeds were deposited into an irrevocable trust with an escrow agent to provide all the debt service payments. The refunded bonds are considered defeased and the liability for those bonds was removed from the College’s liabilities in fiscal year 2015. DEFEASED BONDS
The College did defease a portion of a Limited Liability General Obligation Bond, Series 2010A. The bond was redeemed October 30, 2014 as a conditional redemption for the total amount of $2,700,000. The original maturity was 8/15/25 with an interest rate of 5.00%.
DEFEASED BONDS OUTSTANDING
The liability for the bonds below does not appear on the College’s financial statement as of August 31, 2015 as these bonds are considered legally defeased.
Bond Issue Year Refunded
Defeased Bonds
Par Value Outstanding
Call Date
General Obligation Bond, Series 2008 2015 $35,635,000 $35,635,000 8/15/2018
General Obligation Bond, Series 2009 2015 $25,000,000 $25,000,000 8/15/2019
54 | P a g e
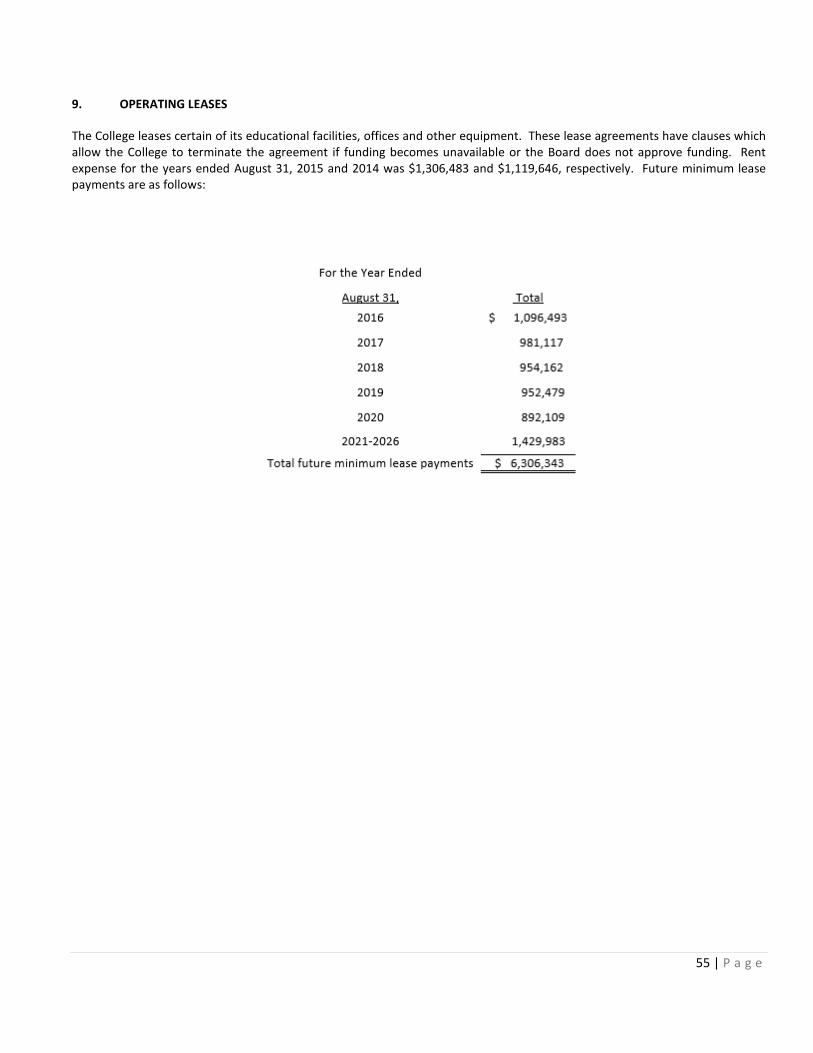
9. OPERATING LEASES
The College leases certain of its educational facilities, offices and other equipment. These lease agreements have clauses which allow the College to terminate the agreement if funding becomes unavailable or the Board does not approve funding. Rent expense for the years ended August 31, 2015 and 2014 was $1,306,483 and $1,119,646, respectively. Future minimum lease payments are as follows:
55 | P a g e
10. EMPLOYEES’ RETIREMENT PLANS The state of Texas has joint contributory retirement plans for almost all its employees. Within the first 90 days of employment, higher education employees make an irrevocable choice to be covered by· either the Teacher Retirement System (TRS) or the Optional Retirement Plan (ORP). Teacher Retirement System (Defined Benefit Plan) Plan Description The College participates in a cost-sharing multiple-employer defined benefit pension that has a special funding situation. The plan is administered by the Teacher Retirement System of Texas (TRS). TRS’s defined benefit pension plan is established and administered in accordance with the Texas Constitution, Article XVI, Section 67 and Texas Government Code, Title 8, Subtitle C. The pension trust fund is a qualified pension trust under Section 401(a) of the Internal Revenue Code. The Texas Legislature establishes benefits and contribution rates within the guidelines of the Texas Constitution. The pension’s Board of Trustees does not have the authority to establish or amend benefit terms. All employees of public, state-supported educational institutions in Texas who are employed for one-half or more of the standard work load and who are not exempted from membership under Texas Government Code, Title 8, Section 822.002 are covered by the system. Pension Plan Fiduciary Net Position Detailed information about the Teacher Retirement System’s fiduciary net position is available in a separately-issued Comprehensive Annual Financial Report that includes financial statements and required supplementary information. That report may be obtained on the Internet at http://www.trs.state.tx.us/about/documents/cafr.pdf#CAFR; by writing to TRS at 1000 Red River Street, Austin, TX, 78701-2698; or by calling (512) 542-6592. Benefits Provided TRS provides service and disability retirement, as well as death and survivor benefits, to eligible employees (and their beneficiaries) of public and higher education in Texas. The pension formula is calculated using 2.3 percent (multiplier) times the average of the five highest annual creditable salaries times years of credited service to arrive at the annual standard annuity except for members who are grandfathered, the three highest annual salaries are used. The normal service retirement is at age 65 with 5 years of credited service or when the sum of the member’s age and years of credited service equals 80 or more years. Early retirement is at age 55 with 5 years of service credit or earlier than 55 with 30 years of service credit. There are additional provisions for early retirement if the sum of the member’s age and years of service credit total at least 80, but the member is less than age 60 or 62 depending on date of employment, or if the member was grandfathered in under a previous rule. There are no automatic post-employment benefit changes; including automatic COLAs. Ad hoc post-employment benefit changes, including ad hoc COLAs can be granted by the Texas Legislature as noted in the Plan description in (A) above. Contributions Contribution requirements are established or amended pursuant to Article 16, section 67 of the Texas Constitution which requires the Texas legislature to establish a member contribution rate of not less than 6% of the member’s annual compensation and a state contribution rate of not less than 6% and not more than 10% of the aggregate annual compensation paid to members of the system during the fiscal year. Texas Government Code section 821.006 prohibits benefit improvements, if as a result of the particular action, the time required to amortize TRS’ unfunded actuarial liabilities would be increased to a period that exceeds 31 years, or, if the amortization period already exceeds 31 years, the period would be increased by such action.
56 | P a g e
Employee contribution rates are set in state statute, Texas Government Code 825.402. Senate Bill 1458 of the 83rd Texas Legislature amended Texas Government Code 825.402 for member contributions and established employee contribution rates for fiscal years 2014 thru 2017. The 83rd Texas Legislature, General Appropriations Act (GAA) established the employer contribution rates for fiscal years 2014 and 2015.
Contribution Rates
2014 2015
Member 6.4% 6.7%
Non-Employer Contributing Entity (State) 6.8% 6.8%
Employers 6.8% 6.8%
College Contributions $4,611,953 $4,954,156
Member Contributions $7,619,894 $8,778,069
State of Texas (NECE) On-behalf Contributions $ 3,417,402 $3,704,050
As the non-employer contributing entity for public education and junior colleges, the State of Texas contributes to the retirement system an amount equal to the current employer contribution rate times the aggregate annual compensation of all participating members of the pension trust fund during that fiscal year reduced by the amounts described below which are paid by the employers. Employers (public school, junior college, other entities or the State of Texas as the employer for senior universities and medical schools) are required to pay the employer contribution rate in the following instances:
• On the portion of the member's salary that exceeds the statutory minimum for members entitled to the statutory minimum under Section 21.402 of the Texas Education Code.
• During a new member’s first 90 days of employment. • When any part or all of an employee’s salary is paid by federal funding sources, a privately sponsored
source, from non-educational and general, or local funds. • When the employing district is a public junior college or junior college district, the employer shall
contribute to the retirement system an amount equal to 50% of the state contribution rate for certain instructional or administrative employees; and 100% of the state contribution rate for all other employees.
In addition to the employer contributions listed above, when employing a retiree of the Teacher Retirement System the employer shall pay both the member contribution and the state contribution as an employment after retirement surcharge.
57 | P a g e
A. Actuarial Assumptions
The total pension liability in the August 31, 2014 actuarial valuation was determined using the following actuarial assumptions: Valuation Date August 31, 2014 Actuarial Cost Method Individual Entry Age Normal Amortization Method Level Percentage of Payroll, Open Remaining Amortization Period 30 years Asset Valuation Method 5 year Market Value Discount Rate 8.00% Long-term expected Investment Rate of Return* 8.00% Salary Increases* 4.25% to 7.25% Weighted-Average at Valuation Date 5.55% Payroll Growth Rate 3.50% *Includes Inflation of 3% The actuarial methods and assumptions are primarily based on a study of actual experience for the four year period ending August 31, 2010 and adopted on April 8, 2011. With the exception of the post-retirement mortality rates for healthy lives and a minor change to the expected retirement age for inactive vested members stemming from the actuarial audit performed in the Summer of 2014, the assumptions and methods are the same as used in the prior valuation. When the mortality assumptions were adopted in 2011 they contained a significant margin for possible future mortality improvement. As of the date of the valuation there has been a significant erosion of this margin to the point that the margin has been eliminated. Therefore, the post-retirement mortality rates for current and future retirees was decreased to add additional margin for future improvement in mortality in accordance with the Actuarial Standards of Practice No. 35.
B. Discount Rate
The discount rate used to measure the total pension liability was 8.0%. There was no change in the discount rate since the previous year. The projection of cash flows used to determine the discount rate assumed that contributions from plan members and those of the contributing employers and the non-employer contributing entity are made at the statutorily required rates. Based on those assumptions, the pension plan’s fiduciary net position was projected to be available to make all future benefit payments of current plan members. Therefore, the long-term expected rate of return on pension plan investments was applied to all periods of projected benefit payments to determine the total pension liability. The long-term rate of return on pension plan investments is 8%. The long-term expected rate of return on pension plan investments was determined using a building-block method in which best-estimates ranges of expected future real rates of return (expected returns, net of pension plan investment expense and inflation) are developed for each major asset class. These ranges are combined to produce the long-term expected rate of return by weighting the expected future real rates of return by the target asset allocation percentage and by adding expected inflation. Best estimates of geometric real rates of return for each major asset class included in the Systems target asset allocation as of August 31, 2014 are summarized below:
58 | P a g e

* The Expected Contribution to Returns incorporates the volatility drag resulting from the conversion between Arithmetic and Geometric mean returns.
C. Discount Rate Sensitivity Analysis
The following schedule shows the impact of the Net Pension Liability if the discount rate used was 1% less than and 1% greater than the discount rate that was used (8%) in measuring the 2014 Net Pension Liability.
1% Decrease in Discount
Rate (7.0%) Discount Rate (8.0%) 1% Increase in Discount
Rate (9.0%) College’s proportionate share of the net pension liability:
$ 86,829,166
$ 48,590,997
$ 19,995,969
D. Pension Liabilities, Pension Expense, and Deferred Outflows of Resources and Deferred Inflows of Resources Related to Pensions
At August 31, 2015, the College reported a liability of $48,590,997 for its proportionate share of the TRS’s net pension liability. This liability reflects a reduction for State pension support provided to the College. The amount recognized by the College as its proportionate share of the net pension liability, the related State support, and the total portion of the net pension liability that was associated with the College were as follows:
Asset ClassTarget
AllocationReal Return
Geometric Basis
Long-Term Expected
Portfolio Real Rate of Return*
Global Equity U.S. 18% 7.0% 1.4% Non-U.S. Developed 13% 7.3% 1.1% Emerging Markets 9% 8.1% 0.9% Directional Hedge Funds 4% 5.4% 0.2% Private Equity 13% 9.2% 1.4%Stable Value U.S Treasuries 11% 2.9% 0.3% Absolute Return 0% 4.0% 0.0% Stable Value Hedge Funds 4% 5.2% 0.2% Cash 1% 2.0% 0.0%Real Return Global Inflation Linked Bonds 3% 3.1% 0.0% Real Assets 16% 7.3% 1.5% Energy and Natural Resources 3% 8.8% 0.3% Commodities 0% 3.4% 0.0%Risk Parity Risk Parity 5% 8.9% 0.4% Alpha 1.0%Total 100% 8.7%
59 | P a g e

The College’s Proportionate share of the collective net pension liability $ 48,590,997 State’s proportionate share that is associated with the College 36,082,142 Total $ 84,673,139
The net pension liability was measured as of August 31, 2014 and the total pension liability used to calculate the net pension liability was determined by an actuarial valuation as of that date. The employer’s proportion of the net pension liability was based on the employer’s contributions to the pension plan relative to the contributions of all employers to the plan for the period September 1, 2013 thru August 31, 2014. At August 31, 2014 the employer’s proportion of the collective net pension liability was .1819112%. The Notes to the Financial Statements for August 31, 2014 for TRS stated that the change in proportion was immaterial, and, therefore disregarded this year. There were no changes of assumptions or other inputs that affected measurement of the total pension liability during the measurement period. There were no changes of benefit terms that affected measurement of the total pension liability during the measurement period. There was a change in employer contribution requirements that occurred after the measurement date of the net pension liability and the employer’s reporting date. A 1.5% contribution for employers not paying Old Age Survivor and Disability Insurance (OASDI) on certain employees went into law effective 09/01/2014. The amount of the expected resultant change in the employer’s proportion cannot be determined at this time. For the year ended August 31, 2015, the College recognized pension expense of $3,417,402 and revenue of $3,417,402 based on the State’s measurement date of August 31, 2014. The net amounts of the employer’s balances of deferred outflows and inflows of resources related to pensions will be recognized in pension expense as follows:
Year ended August 31: Pension Expense Amount 2016 $ (3,055,391) 2017 $ (3,055,391) 2018 $ (3,055,391) 2019 $ 657,458 Thereafter $ 609,920
60 | P a g e
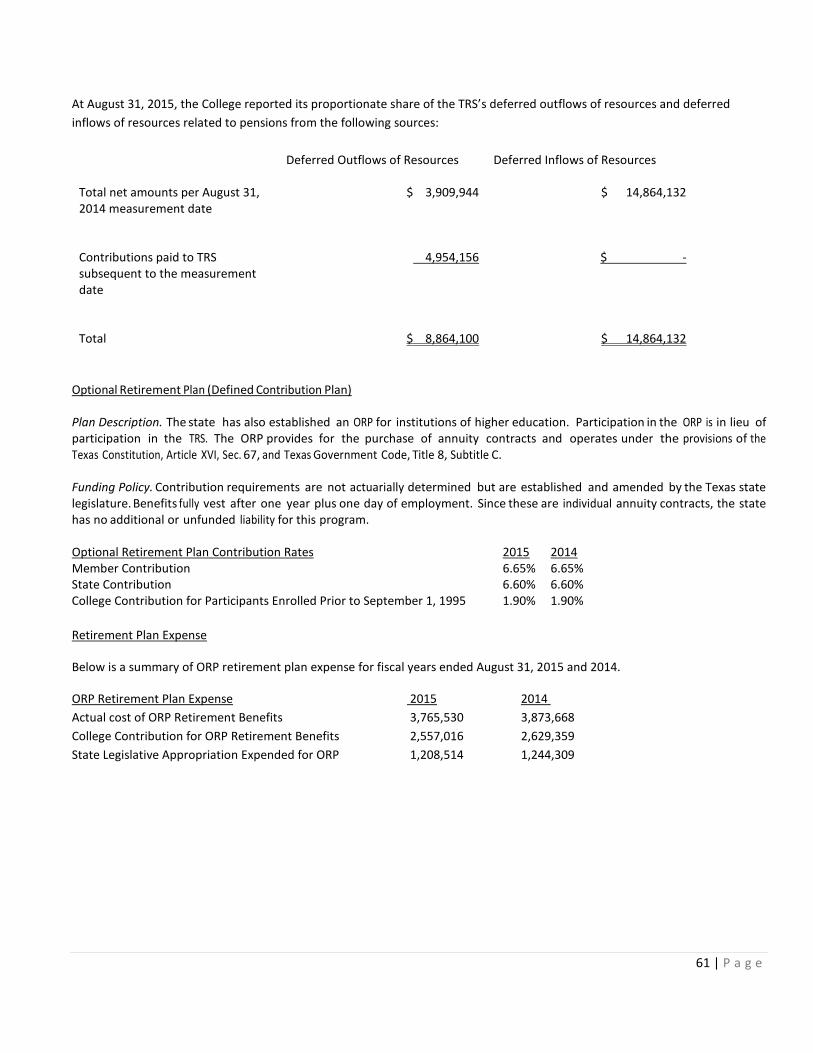
At August 31, 2015, the College reported its proportionate share of the TRS’s deferred outflows of resources and deferred inflows of resources related to pensions from the following sources:
Deferred Outflows of Resources Deferred Inflows of Resources
Total net amounts per August 31, 2014 measurement date
$ 3,909,944 $ 14,864,132
Contributions paid to TRS subsequent to the measurement date
4,954,156 $ -
Total $ 8,864,100 $ 14,864,132
Optional Retirement Plan (Defined Contribution Plan) Plan Description. The state has also established an ORP for institutions of higher education. Participation in the ORP is in lieu of participation in the TRS. The ORP provides for the purchase of annuity contracts and operates under the provisions of the Texas Constitution, Article XVI, Sec. 67, and Texas Government Code, Title 8, Subtitle C. Funding Policy. Contribution requirements are not actuarially determined but are established and amended by the Texas state legislature. Benefits fully vest after one year plus one day of employment. Since these are individual annuity contracts, the state has no additional or unfunded liability for this program. Optional Retirement Plan Contribution Rates 2015 2014 Member Contribution 6.65% 6.65% State Contribution 6.60% 6.60% College Contribution for Participants Enrolled Prior to September 1, 1995 1.90% 1.90% Retirement Plan Expense
Below is a summary of ORP retirement plan expense for fiscal years ended August 31, 2015 and 2014.
ORP Retirement Plan Expense 2015 2014 Actual cost of ORP Retirement Benefits 3,765,530 3,873,668 College Contribution for ORP Retirement Benefits 2,557,016 2,629,359 State Legislative Appropriation Expended for ORP 1,208,514 1,244,309
61 | P a g e
11. COMPENSABLE ABSENCES
Full-time non-faculty employees on a twelve month work schedule are eligible for paid annual leave. Eligible employees accrue vacation leave at different rates depending on their length of service and position. Accrual rates range from 8 hours per month to 13.33 hours per month. The College’s policy is to allow employees to carry their accrued leave forward from one fiscal year to another fiscal year with a maximum number of hours accrued equal to 400 hours. Eligible employees are entitled to payment for all accumulated annual leave up to the maximum allowed at the time employment with the College is terminated. The College recognizes an accrued liability for the unpaid compensated absences in the amounts of $6,032,309 and $7,118,045 for the fiscal years ended August 31, 2015 and 2014, respectively.
Sick leave, which is accumulated to a maximum of 600 hours, is earned at the rate of 8 hours per month. Full time employees eligible to participate in the sick leave plan are those who work a 12 month schedule and who work at least 20 hours per week. It is paid to an employee who misses work due to illness. The College’s policy is to recognize the cost of sick leave when paid. The liability is not shown in the financial statements because the benefit is budgeted annually and employees are not compensated upon termination for accrued sick leave balances.
62 | P a g e
12. PENDING LAWSUITS AND CLAIMS
On August 31, 2015, various lawsuits and claims involving the College were pending. The ultimate liability with respect to litigation and other claims asserted against the College cannot be reasonably estimated at this time. This liability, to the extent not provided for by insurance or otherwise, is not likely to have a material effect on the College.
63 | P a g e
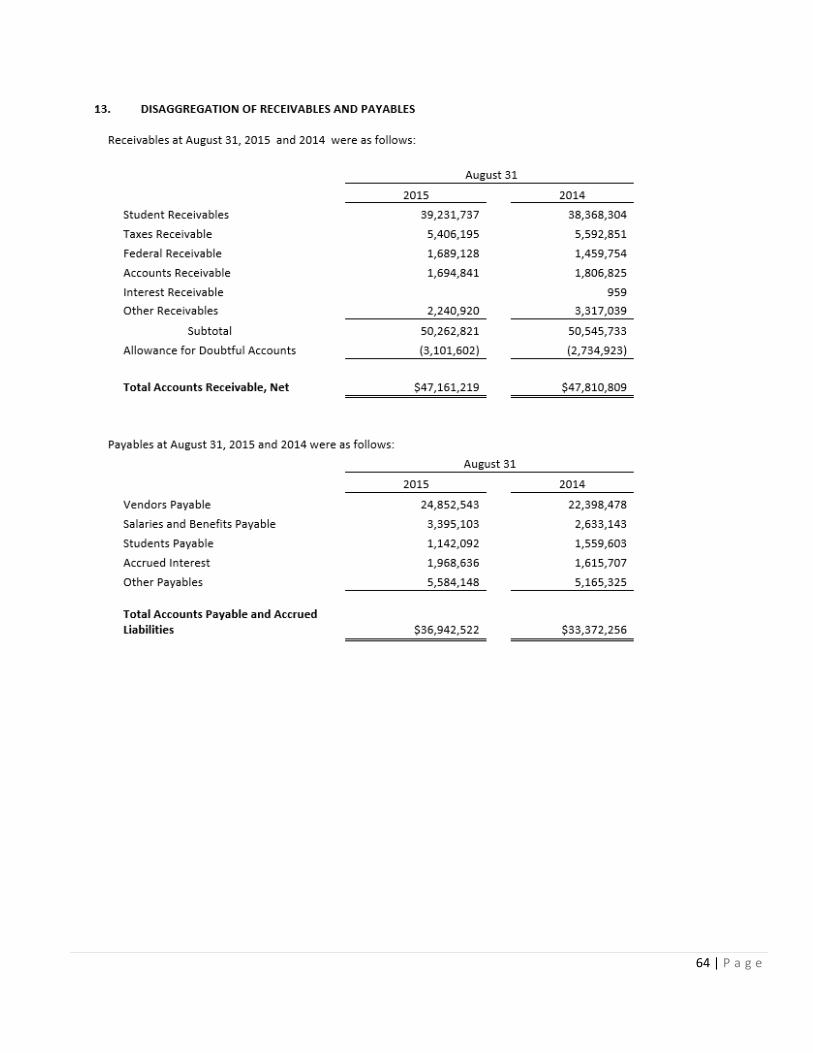
64 | P a g e
14. FEDERAL AND STATE CONTRACT AND GRANT AWARDS
Contract and grant awards are accounted for in accordance with the requirements of the AICPA Industry Audit Guide, Audits of Colleges and Universities. Revenues are disclosed on Exhibit 2 and Schedule A. For federal contract and grant awards, funds expended, but not collected, are reported as Federal Receivables on Exhibit 1. Non-federal contract and grant awards for which funds are expended, but not collected, are reported as Accounts Receivable on Exhibit 1. Contract and grant awards that are not yet funded and for which the institution has not yet performed services are not included in the financial statements. Contract and grant awards funds already committed, e.g., multi-year awards, or funds awarded during fiscal years 2015 and 2014 for which monies have not been received nor funds expended totaled $66,215,626 and $108,990,253, respectively. Of these amounts, $61,919,868 and $103,650,554 were from Federal Contract and Grant Awards; $4,295,758 and $5,339,699 were from State Contract and Grant Awards for the fiscal years ended 2015 and 2014, respectively.
65 | P a g e
15. RISK MANAGEMENT
The College is exposed to various risks of loss related to property damage, personal injury, professional errors and omissions and natural disasters. Significant losses for these risks are covered by commercial insurance. There have been no significant reductions in insurance coverage. Settlement amounts have not exceeded insurance coverage for the past three years. The College did not maintain or operate a self-insured insurance plan during the years ended August 31, 2015 and 2014.
66 | P a g e
16. POST-RETIREMENT HEALTH CARE AND LIFE INSURANCE BENEFITS In addition to providing pension benefits, the State provides certain health care and life insurance benefits for retired employees. Almost all of the employees may become eligible for those benefits if they reach normal retirement age while working for the State. Those and similar benefits for active employees are provided through an insurance company whose premiums are based on benefits paid during the previous year. The State recognizes the cost of providing these benefits by expending the annual insurance premiums. State/Employer Contribution for Health Care Insurance (includes basic life insurance rate)
HealthSelect of Texas Plan
2015 State/Employer Contribution
2015 Annualized Contribution
2014 State/Employer Contribution
2014 Annualized Contribution
Member Only $537.66 $6,451.92 $503.14 $6,037.68
The cost of retirees and active employees’ health care is provided:
Cost of Providing Health Care Insurance
2015 2014
Number of Retirees 402 370 Cost of Health Benefits for Retirees $2,995,654 $2, 541,171 Number of Active Full Time Employees 2,456 2,318 Cost of Health Benefits for Active Full Time Employees $20,534,925 $18,421,601 State Appropriation for Health Insurance $9,266,329 $8,633,493 College Expense $14,264,250 $12,329,279
67 | P a g e
17. AD VALOREM TAX
The College’s ad valorem property tax is levied each October 1 on the assessed value listed as of the prior January 1 for all real and business personal property located in the College’s taxing jurisdiction. The College’s taxable values at August 31, 2015 and 2014 are as follows:
Assessed Valuation of the College $162,036,777,808 $ 145,894,831,103 Less: Exemptions (13,195,229,250) (12,841,988,965) Less: Abatements - - Net Assessed Valuation of the College $148,841,548,558 $133,052,842,138
Tax rates for the years ending August 31, 2015 and 2014 are as follows:
2015 2014
Current Operation
Debt Service Total
Current Operation
Debt Service Total
Authorized Tax Rate per $100 valuation $0.3000 $0.5000 $0.8000 $0.3000 $0.5000 $0.8000
Assessed Tax Rate per $100 valuation $0.0765 $0.0316 $0.1081 $0.0825 $0.0335 $0.1160
Taxes levied for the year ended August 31, 2015 and 2014 amounted to $159,800,780 and $153,420,832, respectively (which includes any penalty and interest assessed, if applicable). Taxes are due on receipt of the tax bill and are delinquent if not paid before February 1st of the year following the year in which imposed.
Taxes collected for the years ended August 31, 2015 and 2014 are as follows:
_____ 2015____________ _____ ____ _ 2014 _ _ __ _____ _______
Current
Operations Debt Service Total Current
Operations Debt Service Total Current Taxes $111,532,805 $46,070,366 $157,603,171 $ 107,978,314 $ 43,826,213 $ 151,804,527 Delinquent Taxes 757,237 331,876 1,089,113 967,065 (352,995) 614,070 Penalties & Interest 437,487 180,559 618,046 454,945 183,468 638,413 Total $112,727,529 $46,582,801 $159,310,330 $ 109,400,324 $ 43,656,686 $ 153,057,010
Tax collections for the years ended August 31, 2015 and 2014 were 98.62% and 98.95%, respectively, of the current tax levy. The use of tax proceeds is restricted for the use of maintenance and general obligation debt service.
68 | P a g e
18. INCOME TAXES
The College is exempt from income taxes under Internal Revenue Code Section 115, Income of States, Municipalities, Etc., although unrelated business income may be subject to income taxes under Internal Revenue Code Section 511(a)(2)(B), Imposition of Tax on Unrelated Business Income of Charitable, Etc. Organizations. The College had no unrelated business income tax liability for the years ended August 31, 2015 and 2014.
69 | P a g e
19. RELATED PARTIES
The Lone Star College Foundation (the Foundation) is a nonprofit organization with the purpose of supporting the educational and other activities of Lone Star College (LSC). LSC does not fund; nor is LSC obligated to pay debt related to the Foundation. However, LSC does have the ability to significantly influence the policies of the Foundation. The Foundation solicits donations and acts as coordinator of gifts made by other parties. It remitted restricted gifts of $2,525,677 and $1,922,642 to the College during the years ended August 31, 2015 and 2014, respectively. The College furnished certain services, such as office space, utilities and some staff assistance, to the Foundation which totaled $503,275 and $322,409 for 2015 and 2014, respectively. There were no related receivables for the years ended August 31, 2015 and 2014.
70 | P a g e
20. POST-EMPLOYMENT BENEFITS OTHER THAN PENSIONS (In accordance with GASB Statement No. 45)
Plan Description. The College contributes to the State Retiree Health Plan (SRHP), a cost-sharing, multiple- employer, defined benefit postemployment healthcare plan administered by the Employees Retirement System of Texas (ERS). SRHP provides medical benefits to retired employees of participating universities, community colleges and state agencies in accordance with Chapter 1551, Texas Insurance Code. Benefit and contribution provisions of the SRHP are authorized by State law and may be amended by the Texas Legislature. ERS issues a publicly available financial report t h a t includes financial statements a n d required s u p p l e m e n t a r y information for SRHP. That report may be obtained from ERS via their website at http://www.ers.state.tx.us/. Funding Policy. Section 1551.055 of Chapter 1551, Texas Insurance Code provides that contribution requirements of the plan members and the participating employers are established and may be amended by the ERS Board of Trustees. Plan members or beneficiaries receiving benefits pay any premium over and above the employer contribution. The employer's share of the cost of retiree healthcare coverage for the current year is known as the implicit rate subsidy. It is the difference between the claims costs for the retirees and the amounts contributed by the retirees. The ERS Board of Trustees sets the employer contribution rate based on the implicit rate subsidy which is actuarially determined in accordance with the parameters of GASB Statement No. 45. The employer contribution rate represents a level of funding that, if paid on an-ongoing basis; is projected to cover normal costs each year and amortize any unfunded actuarial liabilities (or funding excess) of the plan over a period not to exceed thirty years. The College's contributions to SRHP for the years ended August 31, 2015, 2014 and 2013 were $2,995,654, $2,541,171, and $2,251,568 respectively. This equaled the required contributions each year and no employee contributions were required.
71 | P a g e

Required Supplementary Information (RSI) Schedules
72 | P a g e
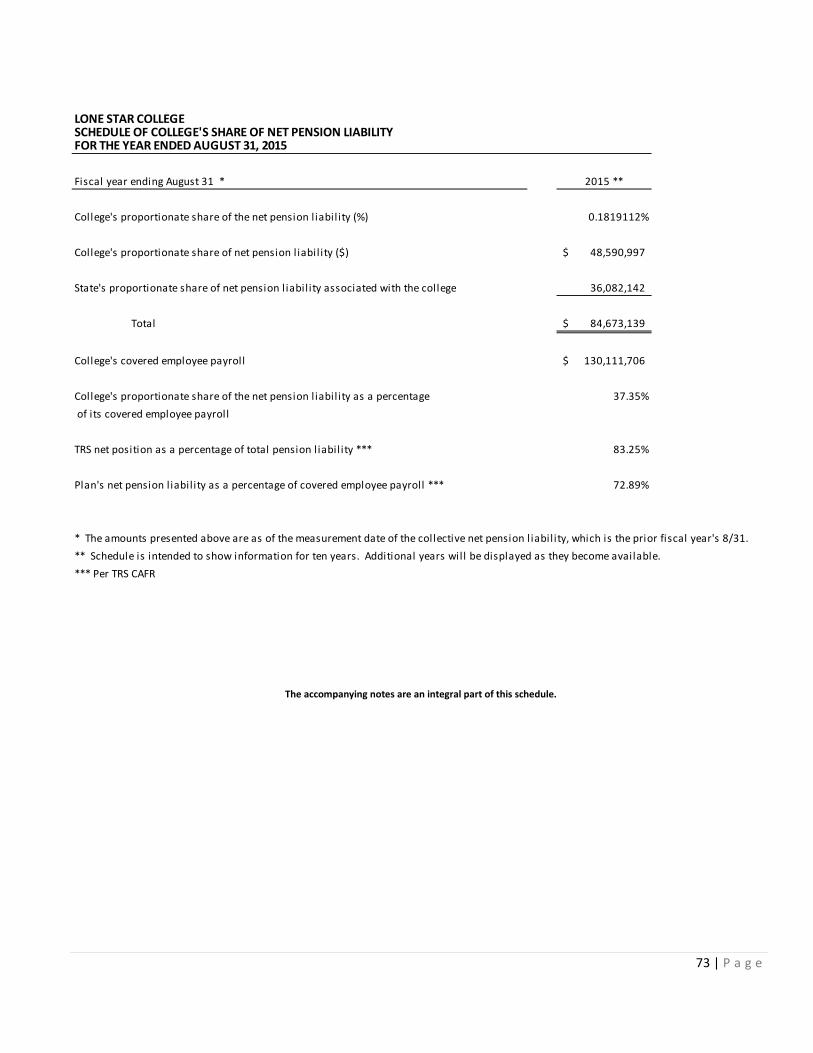
The accompanying notes are an integral part of this schedule.
LONE STAR COLLEGESCHEDULE OF COLLEGE'S SHARE OF NET PENSION LIABILITYFOR THE YEAR ENDED AUGUST 31, 2015
Fiscal year ending August 31 * 2015 **
College's proportionate share of the net pension l iabil ity (%) 0.1819112%
College's proportionate share of net pension l iabil ity ($) 48,590,997$
State's proportionate share of net pension l iabil ity associated with the college 36,082,142
Total 84,673,139$
College's covered employee payroll 130,111,706$
College's proportionate share of the net pension l iabil ity as a percentage 37.35% of its covered employee payroll
TRS net position as a percentage of total pension l iabil ity *** 83.25%
Plan's net pension l iabil ity as a percentage of covered employee payroll *** 72.89%
* The amounts presented above are as of the measurement date of the collective net pension l iabil ity, which is the prior fiscal year's 8/31.** Schedule is intended to show information for ten years. Additional years will be displayed as they become available.*** Per TRS CAFR
73 | P a g e
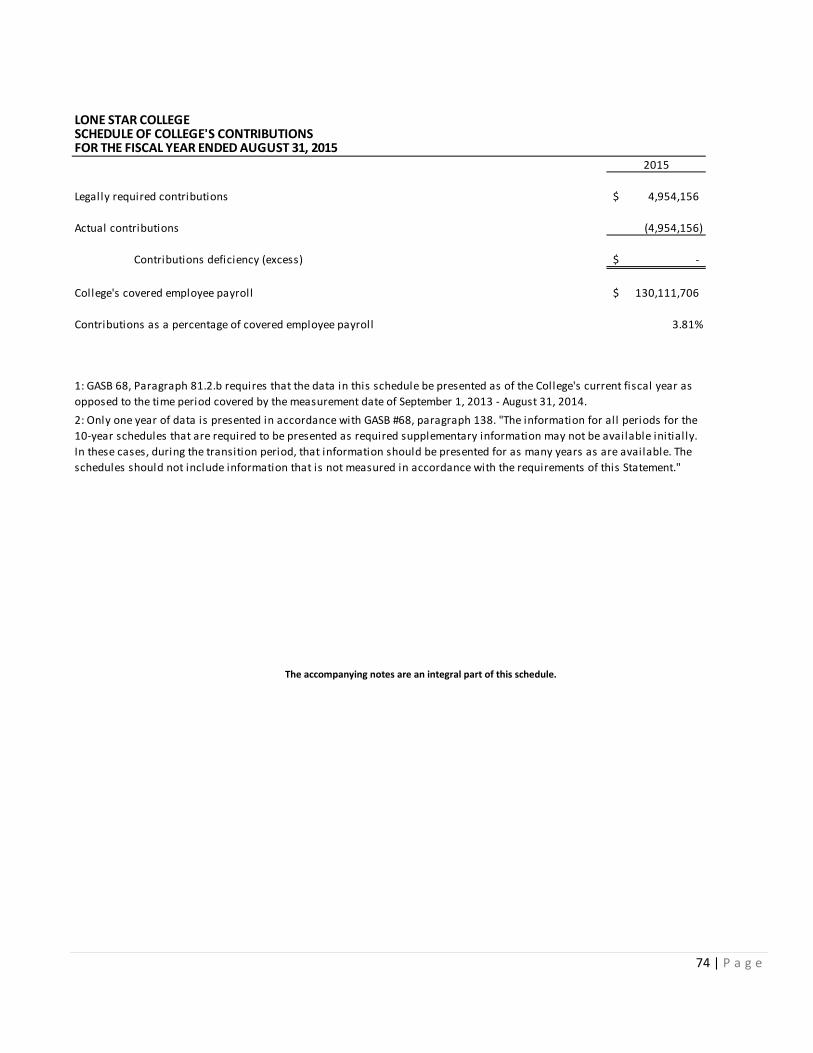
The accompanying notes are an integral part of this schedule.
LONE STAR COLLEGESCHEDULE OF COLLEGE'S CONTRIBUTIONSFOR THE FISCAL YEAR ENDED AUGUST 31, 2015
2015
Legally required contributions 4,954,156$
Actual contributions (4,954,156)
Contributions deficiency (excess) -$
College's covered employee payroll 130,111,706$
Contributions as a percentage of covered employee payroll 3.81%
1: GASB 68, Paragraph 81.2.b requires that the data in this schedule be presented as of the College's current fiscal year as opposed to the time period covered by the measurement date of September 1, 2013 - August 31, 2014.2: Only one year of data is presented in accordance with GASB #68, paragraph 138. "The information for all periods for the 10-year schedules that are required to be presented as required supplementary information may not be available initially. In these cases, during the transition period, that information should be presented for as many years as are available. The schedules should not include information that is not measured in accordance with the requirements of this Statement."
74 | P a g e

LONE STAR COLLEGENOTES TO REQUIRED SUPPLEMENTARY INFORMATIONFOR THE FISCAL YEAR ENDED AUGUST 31, 2015
Notes to Required Supplementary Information
Changes in Assumptions. Modifications to the actuarial methods and assumptions are based on a study of actual experience as adopted on April 8, 2011. The assumptions and methods used in the current valuation are the same except for the followingmodifications:
- Small reductions in the rates of retirements at most age and service combinations.- Decrease in the post-retirement rates of mortality for both males and females.- The salary increase assumption in the first year of employment was reduced.- The method for determining the actuarial value of assets was modified to a method that sets the actuarial value of assets as the expected actuarial value of assets plus 20% of the difference between the actual market value of the assets and the expected actuarial value of assets.
Amounts reported for 2014 reflect the adoption of a new mortality assumption that the average l ife expectancy for members over 65 years of age will increase by roughly nine months over the next four years.
75 | P a g e

Supplementary Schedules
76 | P a g e
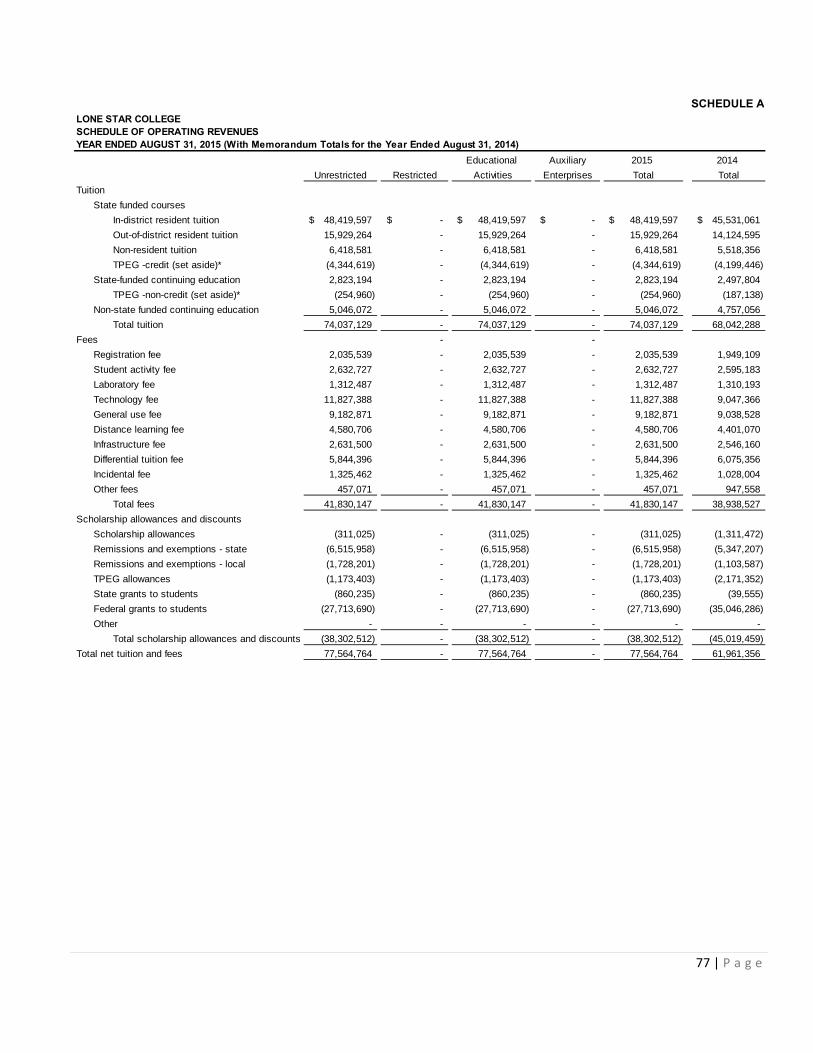
Educational Auxiliary 2015 2014Unrestricted Restricted Activities Enterprises Total Total
TuitionState funded courses
In-district resident tuition 48,419,597$ -$ 48,419,597$ -$ 48,419,597$ 45,531,061$ Out-of-district resident tuition 15,929,264 - 15,929,264 - 15,929,264 14,124,595Non-resident tuition 6,418,581 - 6,418,581 - 6,418,581 5,518,356TPEG -credit (set aside)* (4,344,619) - (4,344,619) - (4,344,619) (4,199,446)
State-funded continuing education 2,823,194 - 2,823,194 - 2,823,194 2,497,804 TPEG -non-credit (set aside)* (254,960) - (254,960) - (254,960) (187,138)
Non-state funded continuing education 5,046,072 - 5,046,072 - 5,046,072 4,757,056Total tuition 74,037,129 - 74,037,129 - 74,037,129 68,042,288
Fees - - Registration fee 2,035,539 - 2,035,539 - 2,035,539 1,949,109Student activity fee 2,632,727 - 2,632,727 - 2,632,727 2,595,183Laboratory fee 1,312,487 - 1,312,487 - 1,312,487 1,310,193Technology fee 11,827,388 - 11,827,388 - 11,827,388 9,047,366General use fee 9,182,871 - 9,182,871 - 9,182,871 9,038,528Distance learning fee 4,580,706 - 4,580,706 - 4,580,706 4,401,070Infrastructure fee 2,631,500 - 2,631,500 - 2,631,500 2,546,160Differential tuition fee 5,844,396 - 5,844,396 - 5,844,396 6,075,356 Incidental fee 1,325,462 - 1,325,462 - 1,325,462 1,028,004 Other fees 457,071 - 457,071 - 457,071 947,558
Total fees 41,830,147 - 41,830,147 - 41,830,147 38,938,527Scholarship allowances and discounts
Scholarship allowances (311,025) - (311,025) - (311,025) (1,311,472) Remissions and exemptions - state (6,515,958) - (6,515,958) - (6,515,958) (5,347,207) Remissions and exemptions - local (1,728,201) - (1,728,201) - (1,728,201) (1,103,587) TPEG allowances (1,173,403) - (1,173,403) - (1,173,403) (2,171,352) State grants to students (860,235) - (860,235) - (860,235) (39,555)Federal grants to students (27,713,690) - (27,713,690) - (27,713,690) (35,046,286) Other - - - - - -
Total scholarship allowances and discounts (38,302,512) - (38,302,512) - (38,302,512) (45,019,459)Total net tuition and fees 77,564,764 - 77,564,764 - 77,564,764 61,961,356
SCHEDULE ALONE STAR COLLEGESCHEDULE OF OPERATING REVENUESYEAR ENDED AUGUST 31, 2015 (With Memorandum Totals for the Year Ended August 31, 2014)
77 | P a g e

Educational Auxiliary 2015 2014Unrestricted Restricted Activities Enterprises Total Total
Additional operating revenuesFederal grants and contracts - 4,822,716 4,822,716 - 4,822,716 5,774,884State grants and contracts - 4,657,167 4,657,167 - 4,657,167 3,456,070Local grants and contracts 1,884,846 3,688,978 5,573,824 - 5,573,824 4,611,918Other operating revenue 2,779,531 - 2,779,531 - 2,779,531 2,238,929
Total additional operating revenues 4,664,377 13,168,861 17,833,238 - 17,833,238 16,081,801Auxiliary enterprises
Food service - - - 1,815,691 1,815,691 1,742,298Bookstore - - - 2,672,613 2,672,613 2,489,392Child care fees - - - 2,050,394 2,050,394 1,061,699Special events - - - 614,310 614,310 654,991Tenant Related 6,150,687 6,150,687 6,823,669Other - - - 1,659,418 1,659,418 1,562,802
Total auxiliary enterprises - - - 14,963,113 14,963,113 14,334,851Total operating revenues 82,229,141$ 13,168,861$ 95,398,002$ 14,963,113$ 110,361,115$ 92,378,008$
(Exhibit 2) (Exhibit 2)* In accordance with Education Code 56.033, $4,599,579 and $4,386,584 was set aside for Texas Public Education Grants in 2015 and 2014, respectively.
SCHEDULE A (Continued)LONE STAR COLLEGESCHEDULE OF OPERATING REVENUESYEAR ENDED AUGUST 31, 2015 (With Memorandum Totals for the Year Ended August 31, 2014)
78 | P a g e
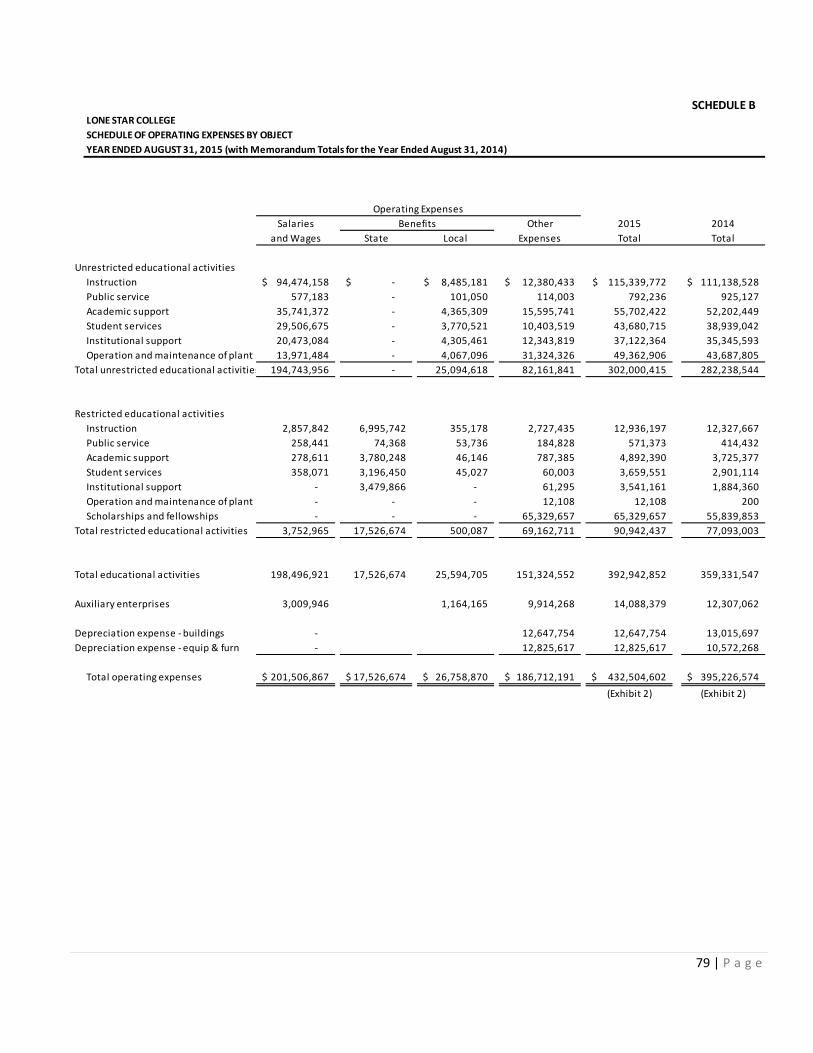
SCHEDULE B
Salaries Other 2015 2014and Wages State Local Expenses Total Total
Unrestricted educational activitiesInstruction 94,474,158$ -$ 8,485,181$ 12,380,433$ 115,339,772$ 111,138,528$ Public service 577,183 - 101,050 114,003 792,236 925,127 Academic support 35,741,372 - 4,365,309 15,595,741 55,702,422 52,202,449 Student services 29,506,675 - 3,770,521 10,403,519 43,680,715 38,939,042 Institutional support 20,473,084 - 4,305,461 12,343,819 37,122,364 35,345,593 Operation and maintenance of plant 13,971,484 - 4,067,096 31,324,326 49,362,906 43,687,805
Total unrestricted educational activities 194,743,956 - 25,094,618 82,161,841 302,000,415 282,238,544
Restricted educational activitiesInstruction 2,857,842 6,995,742 355,178 2,727,435 12,936,197 12,327,667 Public service 258,441 74,368 53,736 184,828 571,373 414,432 Academic support 278,611 3,780,248 46,146 787,385 4,892,390 3,725,377 Student services 358,071 3,196,450 45,027 60,003 3,659,551 2,901,114 Institutional support - 3,479,866 - 61,295 3,541,161 1,884,360 Operation and maintenance of plant - - - 12,108 12,108 200 Scholarships and fellowships - - - 65,329,657 65,329,657 55,839,853
Total restricted educational activities 3,752,965 17,526,674 500,087 69,162,711 90,942,437 77,093,003
Total educational activities 198,496,921 17,526,674 25,594,705 151,324,552 392,942,852 359,331,547
Auxiliary enterprises 3,009,946 1,164,165 9,914,268 14,088,379 12,307,062
Depreciation expense - buildings - 12,647,754 12,647,754 13,015,697 Depreciation expense - equip & furn - 12,825,617 12,825,617 10,572,268
Total operating expenses 201,506,867$ 17,526,674$ 26,758,870$ 186,712,191$ 432,504,602$ 395,226,574$ (Exhibit 2) (Exhibit 2)
LONE STAR COLLEGESCHEDULE OF OPERATING EXPENSES BY OBJECTYEAR ENDED AUGUST 31, 2015 (with Memorandum Totals for the Year Ended August 31, 2014)
Operating ExpensesBenefits
79 | P a g e
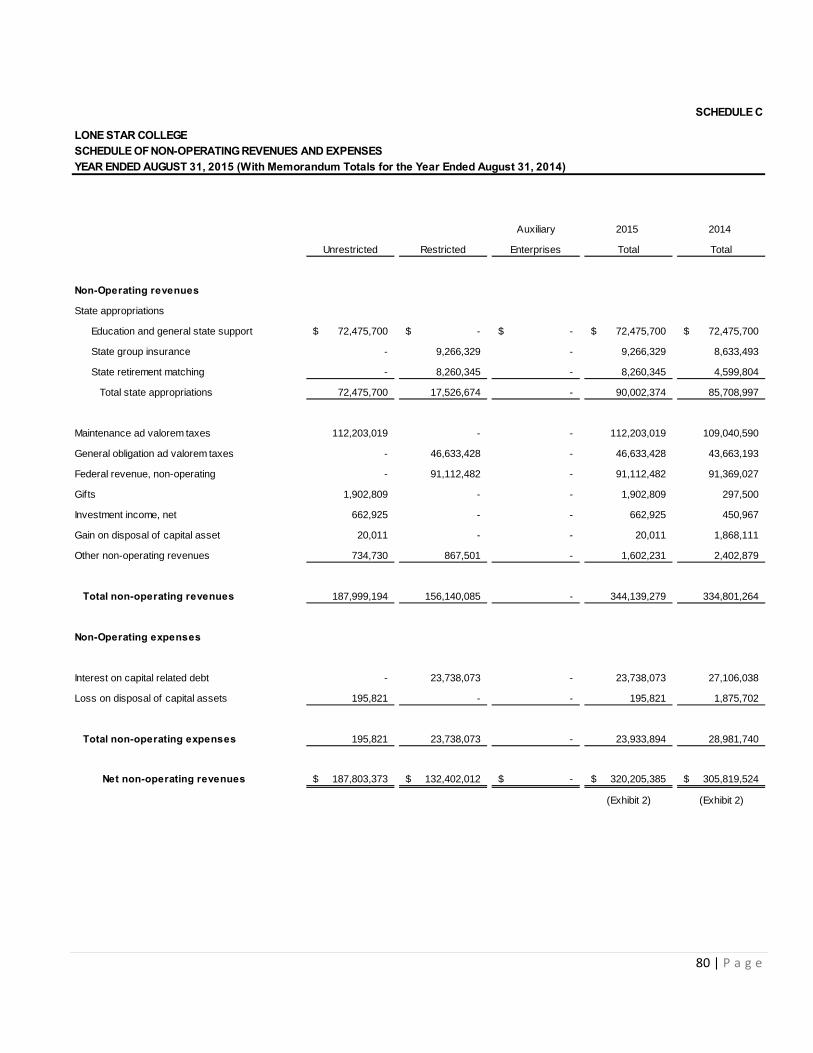
Auxiliary 2015 2014
Unrestricted Restricted Enterprises Total Total
Non-Operating revenues
State appropriations
Education and general state support 72,475,700$ -$ -$ 72,475,700$ 72,475,700$
State group insurance - 9,266,329 - 9,266,329 8,633,493
State retirement matching - 8,260,345 - 8,260,345 4,599,804
Total state appropriations 72,475,700 17,526,674 - 90,002,374 85,708,997
Maintenance ad valorem taxes 112,203,019 - - 112,203,019 109,040,590
General obligation ad valorem taxes - 46,633,428 - 46,633,428 43,663,193
Federal revenue, non-operating - 91,112,482 - 91,112,482 91,369,027
Gifts 1,902,809 - - 1,902,809 297,500
Investment income, net 662,925 - - 662,925 450,967
Gain on disposal of capital asset 20,011 - - 20,011 1,868,111
Other non-operating revenues 734,730 867,501 - 1,602,231 2,402,879
Total non-operating revenues 187,999,194 156,140,085 - 344,139,279 334,801,264
Non-Operating expenses
Interest on capital related debt - 23,738,073 - 23,738,073 27,106,038
Loss on disposal of capital assets 195,821 - - 195,821 1,875,702
Total non-operating expenses 195,821 23,738,073 - 23,933,894 28,981,740
Net non-operating revenues 187,803,373$ 132,402,012$ -$ 320,205,385$ 305,819,524$
(Exhibit 2) (Exhibit 2)
SCHEDULE C
LONE STAR COLLEGESCHEDULE OF NON-OPERATING REVENUES AND EXPENSESYEAR ENDED AUGUST 31, 2015 (With Memorandum Totals for the Year Ended August 31, 2014)
80 | P a g e
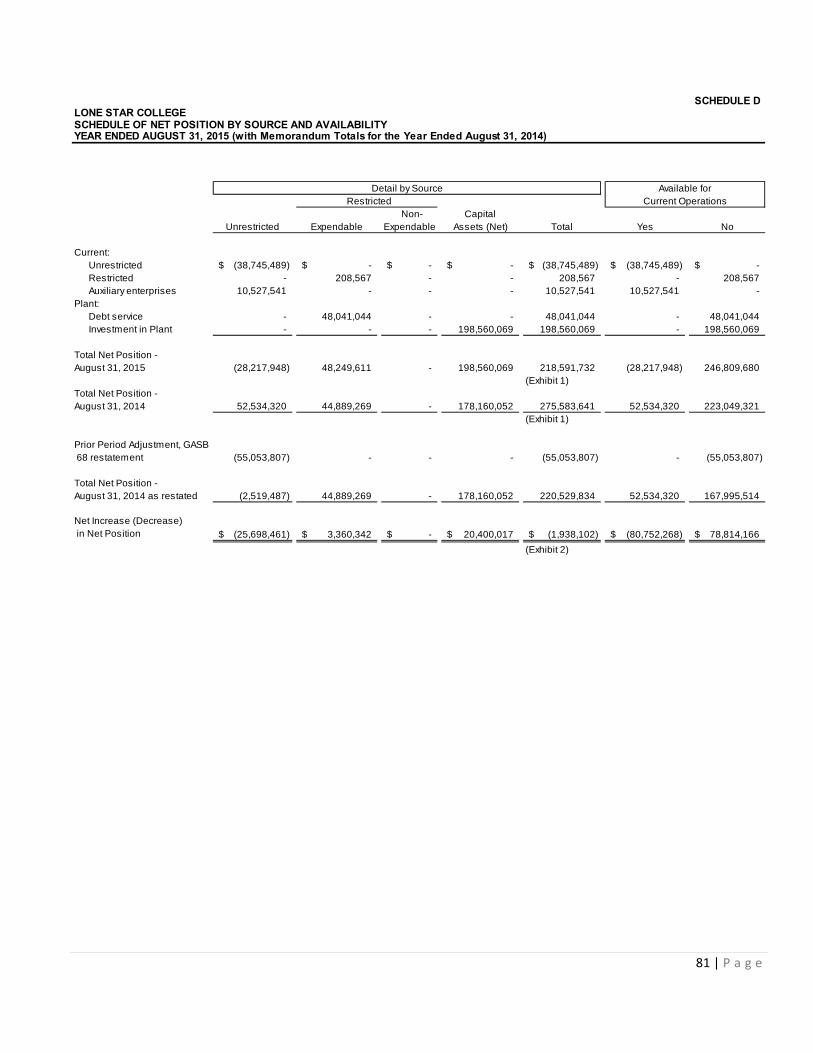
SCHEDULE D
RestrictedNon- Capital
Unrestricted Expendable Expendable Assets (Net) Total Yes No
Current: Unrestricted (38,745,489)$ -$ -$ -$ (38,745,489)$ (38,745,489)$ -$ Restricted - 208,567 - - 208,567 - 208,567 Auxiliary enterprises 10,527,541 - - - 10,527,541 10,527,541 - Plant: Debt service - 48,041,044 - - 48,041,044 - 48,041,044 Investment in Plant - - - 198,560,069 198,560,069 - 198,560,069
Total Net Position - August 31, 2015 (28,217,948) 48,249,611 - 198,560,069 218,591,732 (28,217,948) 246,809,680
(Exhibit 1)Total Net Position -August 31, 2014 52,534,320 44,889,269 - 178,160,052 275,583,641 52,534,320 223,049,321
(Exhibit 1)
Prior Period Adjustment, GASB 68 restatement (55,053,807) - - - (55,053,807) - (55,053,807)
Total Net Position -August 31, 2014 as restated (2,519,487) 44,889,269 - 178,160,052 220,529,834 52,534,320 167,995,514
Net Increase (Decrease) in Net Position (25,698,461)$ 3,360,342$ -$ 20,400,017$ (1,938,102)$ (80,752,268)$ 78,814,166$
(Exhibit 2)
Current Operations
LONE STAR COLLEGE SCHEDULE OF NET POSITION BY SOURCE AND AVAILABILITYYEAR ENDED AUGUST 31, 2015 (with Memorandum Totals for the Year Ended August 31, 2014)
Detail by Source Available for
81 | P a g e

Pass ThroughFederal Pass-Through Disbursements
Federal Grantor/Pass Through Grantor/ CFDA Grantor's and Program Title Number Number Expenditures
U.S. DEPARTMENT OF EDUCATION
Direct Programs:
Student Financial Aid ClusterFederal Supplemental Educational Opportunity Grants-FSEOG(13-14) 84.007 P007A134084 (808)$ Federal Supplemental Educational Opportunity Grants-FSEOG(14-15) 84.007 P007A144084 1,462,463 Total Federal Supplemental Educational Opportunity Grants 1,461,655
Federal Work-Study Program (14-15) 84.033 P933A144084 688,282
Federal Pell Grant Program (99-01) 84.063 P063P993422 (1,625) Federal Pell Grant Program (10-11) 84.063 P063P103422 (5) Federal Pell Grant Program (13-14) 84.063 P063P133422 (172,440) Federal Pell Grant Program (14-15) 84.063 P063P143422 89,136,615 Total Federal Pell Grant Program 88,962,545
Direct Loan Program (13-14) 84.268 P268K133422 (280,934) Direct Loan Program (14-15) 84.268 P268K143422 66,313,161 Total Direct Loan Program 66,032,227
TOTAL FINANCIAL AID CLUSTER 157,144,709 TRIO Cluster
TRIO - Student Support Services - North Harris 84.042A P042A101148 245,006 TRIO - Student Support Services - Tomball 84.042A P042A101133 232,848 Total TRIO - Student Support Services 477,854
TRIO - Talent Search 84.044 P044A110072 226,726
TRIO - Upward Bound ACE 84.047A P047A120378 246,352 TRIO - Upward Bound MAC 84.047A P047A120397 285,109 Total TRIO - Upward Bound 531,461
TOTAL TRIO CLUSTER 1,236,041 HSI Math Success STEM 84.031 P031C110072 782,364
Pass-Through:Texas Education Agency
Career and Technology Education ATC Professional Development 84.048A 154200257110001 307,245
Texas Higher Education Coordinating BoardCareer and Technical Education - Basic Grants 84.048 13451 951,106 Statewide Data System 84.372 R372A090010 10,000 Total Texas Higher Education Coordinating Board 961,106
Texas Workforce CommisionAdult Education and Family Literacy Act and TANF 84.002A 2814ABE009 65,198
Pass-Through:Houston Galveston Area Council Adult Education and Literacy 2015 84.002A 214-14 512,351
TOTAL U.S. DEPARTMENT OF EDUCATION 161,009,014
SCHEDULE ELONE STAR COLLEGESCHEDULE OF EXPENDITURES OF FEDERAL AWARDSYEAR ENDED August 31, 2015
Notes to the Schedule of Expenditures of Federal Awards are an integral part of this statement
82 | P a g e
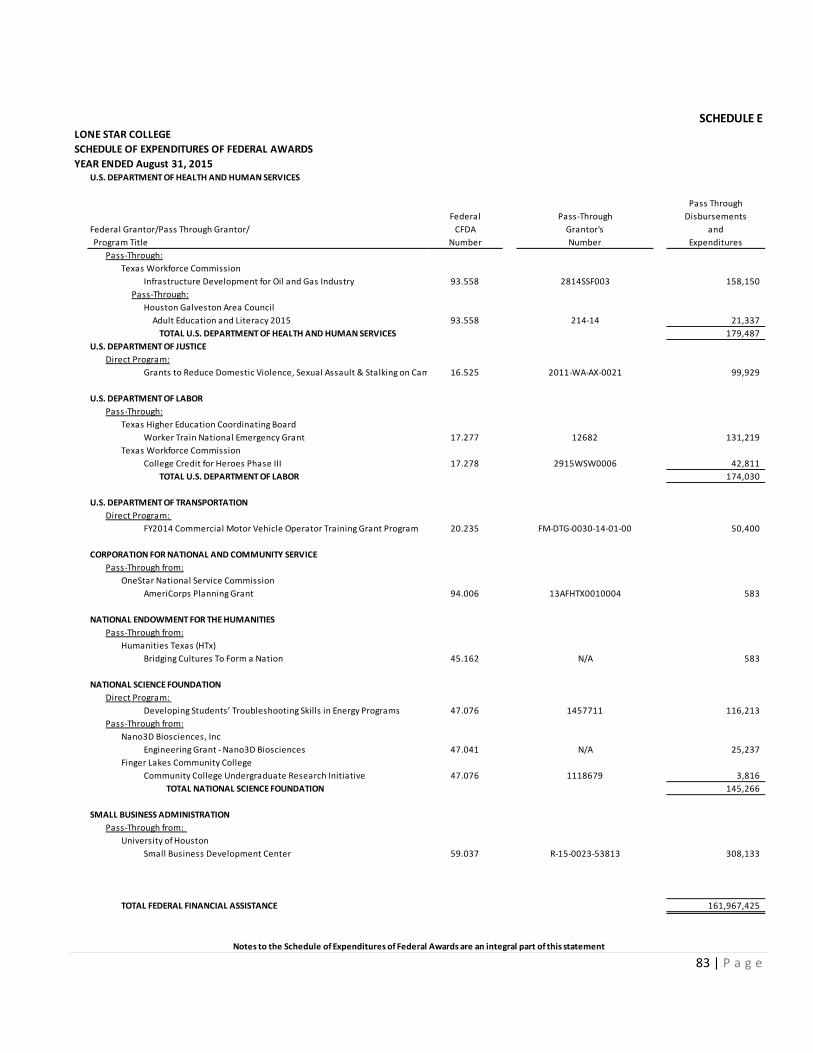
U.S. DEPARTMENT OF HEALTH AND HUMAN SERVICES
Pass ThroughFederal Pass-Through Disbursements
Federal Grantor/Pass Through Grantor/ CFDA Grantor's and Program Title Number Number Expenditures
Pass-Through:Texas Workforce Commission
Infrastructure Development for Oil and Gas Industry 93.558 2814SSF003 158,150 Pass-Through:
Houston Galveston Area Council Adult Education and Literacy 2015 93.558 214-14 21,337 TOTAL U.S. DEPARTMENT OF HEALTH AND HUMAN SERVICES 179,487
U.S. DEPARTMENT OF JUSTICEDirect Program:
Grants to Reduce Domestic Violence, Sexual Assault & Stalking on Cam 16.525 2011-WA-AX-0021 99,929
U.S. DEPARTMENT OF LABORPass-Through:
Texas Higher Education Coordinating BoardWorker Train National Emergency Grant 17.277 12682 131,219
Texas Workforce CommissionCollege Credit for Heroes Phase III 17.278 2915WSW0006 42,811 TOTAL U.S. DEPARTMENT OF LABOR 174,030
U.S. DEPARTMENT OF TRANSPORTATION
Direct Program: FY2014 Commercial Motor Vehicle Operator Training Grant Program 20.235 FM-DTG-0030-14-01-00 50,400
CORPORATION FOR NATIONAL AND COMMUNITY SERVICEPass-Through from:
OneStar National Service CommissionAmeriCorps Planning Grant 94.006 13AFHTX0010004 583
NATIONAL ENDOWMENT FOR THE HUMANITIESPass-Through from:
Humanities Texas (HTx)Bridging Cultures To Form a Nation 45.162 N/A 583
NATIONAL SCIENCE FOUNDATIONDirect Program:
Developing Students’ Troubleshooting Skills in Energy Programs 47.076 1457711 116,213Pass-Through from:
Nano3D Biosciences, IncEngineering Grant - Nano3D Biosciences 47.041 N/A 25,237
Finger Lakes Community CollegeCommunity College Undergraduate Research Initiative 47.076 1118679 3,816 TOTAL NATIONAL SCIENCE FOUNDATION 145,266
SMALL BUSINESS ADMINISTRATIONPass-Through from:
University of HoustonSmall Business Development Center 59.037 R-15-0023-53813 308,133
TOTAL FEDERAL FINANCIAL ASSISTANCE 161,967,425
Notes to the Schedule of Expenditures of Federal Awards are an integral part of this statement
SCHEDULE ELONE STAR COLLEGESCHEDULE OF EXPENDITURES OF FEDERAL AWARDSYEAR ENDED August 31, 2015
83 | P a g e

1 Basis of Presentation
2 Basis of Accounting
3 Federal Assistance Reconciliation
Federal Grants and Contracts Revenue - per Schedule of Operating Revenues (Schedule A) 4,822,716$
Federal Revenue, Non-Operating - per Schedule of Non-Operating Revenues and Expenses (Schedule C) 91,112,482
Federal Direct Student Loan Program 66,032,227
Total Federal Revenues per Schedule of Expenditures of Federal Awards (Schedule E) 161,967,425
4 Expenditures Not Subject to Federal Single Audit: NONE
5 Sub-Recipients:
None
SCHEDULE ELONE STAR COLLEGE
basis of accounting. Revenue is recognized when earned and expenditures are recognizedwhen incurred. Revenues are reported only to the extent of expenditures for the current year.Federal receivables represent amounts expended in excess of that received.
The information in this schedule is presented in accordance with the requirements ofOMB Circular A-133, Audits of States, Local Government, and Non-Profit Organizations
passed through other government agencies.
The accompanying schedule of expenditures of federal awards is presented using the accrual
and includes awards received directly from federal agencies as well as federal awards
NOTES TO SCHEDULE OF EXPENDITURES OF FEDERAL AWARDSYEAR ENDED August 31, 2015
The schedule of expenditures of federal awards presents the federal grant activity of Lone StarCollege for the year ended August 31, 2015.
84 | P a g e

State/Federal Pass-ThroughCFDA Grantor's
State Grantor/Pass Through Grantor Number Number Expenditures
Direct Programs:Jobs and Educations for Texans 5464-15 N/A 327,554$
Direct Programs:College Work - Study Program (14-15) N/A N/A 230,087
Texas Grant Program (13-14) N/A N/A 3,960 Texas Grant Renewal Program (14-15) N/A N/A 143,706 Total Texas Grant Program 147,666
Texas Educational Opportunity Grant Program (12-13) N/A N/A (945) Texas Educational Opportunity Grant Program (13-14) N/A N/A 1,320 Texas Educational Opportunity Grant Program (14-15) N/A N/A 1,725,217 Texas Educational Opportunity Grant Renewal Program (14-15) N/A N/A 154,106 Total Texas Educational Opportunity Grant Program 1,879,698
Top 10% Scholarship (14-15) N/A N/A 5,800
Fifth Year Accounting Scholarship N/A N/A 5,000
Transition TX N/A 11836 52,015
Adult Basic Education Innovation Grant N/A N/A 124,144
Nursing Innovation Grant Program - Nursing and Allied Health N/A N/A 81,879
Nursing Shortage Reduction Plan - Over 70 Programs N/A N/A 10,457 Nursing Shortage Reduction Plan - Under 70 Programs N/A N/A 339,461 Total Nursing Shortage Reduction Plan 349,918
TOTAL TEXAS HIGHER EDUCATION COORDINATING BOARD 2,876,207$
SCHEDULE FLONE STAR COLLEGESCHEDULE OF EXPENDITURES OF STATE AWARDSYEAR ENDED August 31, 2015
TEXAS HIGHER EDUCATION COORDINATING BOARD:
TEXAS COMPTROLLER OF PUBLIC ACCOUNTS
Notes to the Schedule of Expenditures of State Awards are an integral part of this statement.
85 | P a g e

TEXAS WORKFORCE COMMISSION:Direct Programs:
Veteran and Industry Partnership N/A 2814SDF005 70,102 Lone Star College in Partnership with a Manufacturing Consortium N/A 1114SDF000 197,526 Lone Star College in Partnership with the Tenaris Consortium N/A 2813SDF008 807,525 Total Skills Development Fund 1,075,153
Pass-Through:Houston Galveston Area Council
Adult Education and Literacy 2015 N/A 214-14 378,253
TOTAL TEXAS WORKFORCE COMMISSION 1,453,406
TOTAL STATE FINANCIAL ASSISTANCE 4,657,167$
1
2 State Assistance Reconciliation
State Grants and Contracts (Schedule A) 4,657,167$ Reconciling items: None - Total expenditures per Schedule of State Awards 4,657,167$
LONE STAR COLLEGE
reported in the schedule may differ from amounts used in the preparation of the basic financial statements. Separate accounts are maintained for the different awards to aid in the observance of limitations and restrictions imposed by the funding agencies. TheCollege has followed all applicable guidelines issued by various entities in the preparation
NOTES TO SCHEDULE OF EXPENDITURES OF STATE AWARDS
Significant Accounting Policies used in Preparing the Schedule
The expenditures included in the schedule are reported for the College's fiscal year.Expenditure reports to funding agencies are prepared on the award period basis. Theexpenditures reported above represent funds which have been expended by the College
of the schedule.
YEAR ENDED August 31, 2015
for the purposes of the award. The expenditures reported above may not have been reimbursed by the funding agencies as of the end of the fiscal year. Some amounts
SCHEDULE FLONE STAR COLLEGESCHEDULE OF EXPENDITURES OF STATE AWARDSYEAR ENDED August 31, 2015
86 | P a g e

Statistical Section
87 | P a g e

STATISTICAL SECTION
This part of the Lone Star College comprehensive annual financial report presents detailed information as a context for understanding what the information in the financial statements, note disclosures, and required supplementary information says about the College’s overall financial health.
Contents
Financial Trends These schedules contain trend information to help the reader understand how the College’s financial performance and well-being have changed over time.
Revenue Capacity These schedules contain information to help the reader assess the College’s most significant local revenue sources - tuition and fees, state appropriations, and ad valorem taxes.
Debt Capacity These schedules present information to help the reader assess the affordability of the College’s current levels of outstanding debt and the College’s ability to issue additional debt in the future.
Demographic and Economic Information These schedules offer demographic and economic indicators to help the reader understand the environment within which the College’s financial activities take place.
Operating Information These schedules contain service and infrastructure data to help the reader understand how the information in the College’s financial report relates to the services the College provides and the activities it performs.
Sources: unless otherwise noted, the information in these schedules is derived from the comprehensive annual financial reports for the relevant year.
88 | P a g e

Lone Star CollegeStatistical Supplement 1Net Position by ComponentLast Ten Fiscal Years(unaudited)
2015 * 2014 2013 2012 2011 2010 2009 2008 2007 2006
Net Investment in Capital Assets $198,560 $178,160 $178,498 $195,090 $190,949 $178,172 $153,534 $139,813 $119,598 $105,149
Restricted - expendable 48,250 44,889 37,800 13,886 7,574 492 7,652 5,617 6,537 3,822
Restricted - nonexpendable - - - - - - - - - - Unrestricted (28,218) 52,534 56,314 60,189 47,563 45,022 45,996 47,832 40,506 37,603
Total net position 218,592$ 275,583$ 272,612$ 269,165$ 246,086$ 223,686$ 207,182$ 193,262$ 166,641$ 146,574$
Net increase (decrease) in net position (56,991)$ 2,971$ 3,447$ 23,079$ 22,400$ 16,504$ 13,920$ 26,621$ 20,067$ 25,916$
* Net position in 2015 was impacted by GASB 68, Accounting and Financial Reporting for Pensions.
For the Fiscal Year Ended August 31,(amounts expressed in thousands)
89 | P a g e
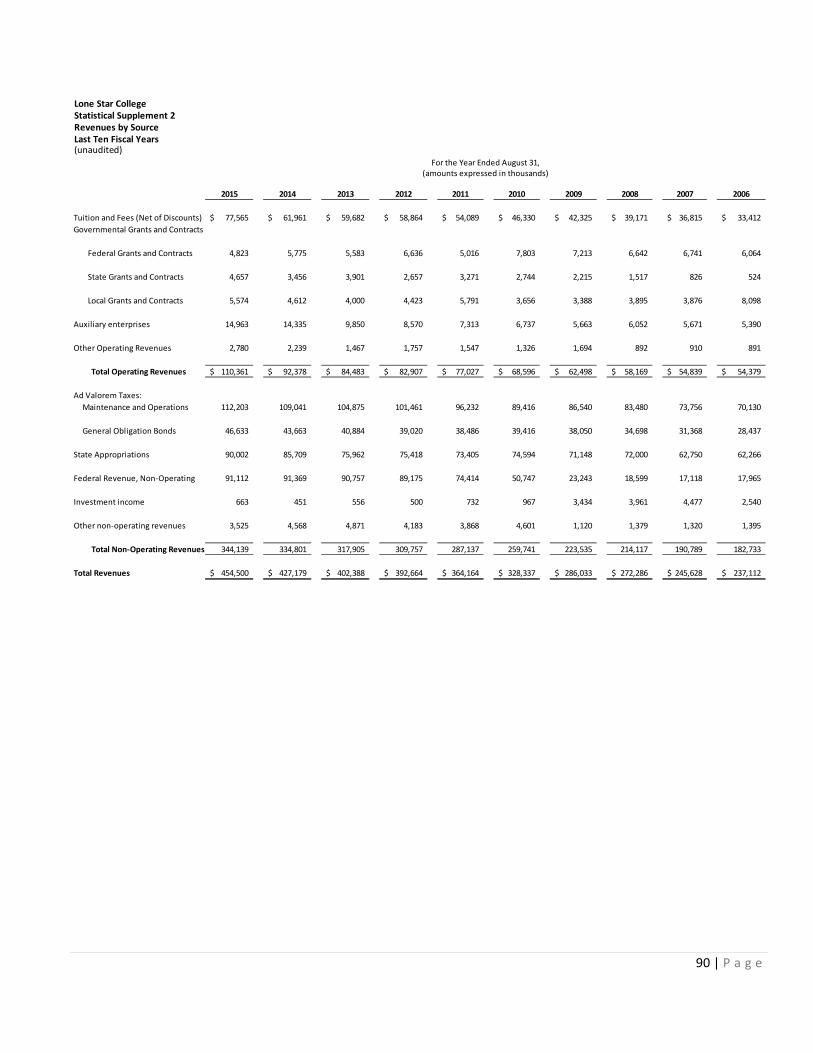
Lone Star CollegeStatistical Supplement 2Revenues by SourceLast Ten Fiscal Years(unaudited)
2015 2014 2013 2012 2011 2010 2009 2008 2007 2006
Tuition and Fees (Net of Discounts) 77,565$ 61,961$ 59,682$ 58,864$ 54,089$ 46,330$ 42,325$ 39,171$ 36,815$ 33,412$ Governmental Grants and Contracts
Federal Grants and Contracts 4,823 5,775 5,583 6,636 5,016 7,803 7,213 6,642 6,741 6,064
State Grants and Contracts 4,657 3,456 3,901 2,657 3,271 2,744 2,215 1,517 826 524
Local Grants and Contracts 5,574 4,612 4,000 4,423 5,791 3,656 3,388 3,895 3,876 8,098
Auxiliary enterprises 14,963 14,335 9,850 8,570 7,313 6,737 5,663 6,052 5,671 5,390
Other Operating Revenues 2,780 2,239 1,467 1,757 1,547 1,326 1,694 892 910 891
Total Operating Revenues 110,361$ 92,378$ 84,483$ 82,907$ 77,027$ 68,596$ 62,498$ 58,169$ 54,839$ 54,379$
Ad Valorem Taxes: Maintenance and Operations 112,203 109,041 104,875 101,461 96,232 89,416 86,540 83,480 73,756 70,130
General Obligation Bonds 46,633 43,663 40,884 39,020 38,486 39,416 38,050 34,698 31,368 28,437
State Appropriations 90,002 85,709 75,962 75,418 73,405 74,594 71,148 72,000 62,750 62,266
Federal Revenue, Non-Operating 91,112 91,369 90,757 89,175 74,414 50,747 23,243 18,599 17,118 17,965
Investment income 663 451 556 500 732 967 3,434 3,961 4,477 2,540
Other non-operating revenues 3,525 4,568 4,871 4,183 3,868 4,601 1,120 1,379 1,320 1,395
Total Non-Operating Revenues 344,139 334,801 317,905 309,757 287,137 259,741 223,535 214,117 190,789 182,733
Total Revenues 454,500$ 427,179$ 402,388$ 392,664$ 364,164$ 328,337$ 286,033$ 272,286$ 245,628$ 237,112$
For the Year Ended August 31,(amounts expressed in thousands)
90 | P a g e

Statistical Supplement 2 (Cont)
2014 2014 2013 2012 2011 2010 2009 2008 2007 2006
Tuition and Fees (Net of Discounts) 17.07% 14.50% 14.83% 14.99% 14.85% 14.11% 14.80% 14.39% 14.99% 14.09%Governmental Grants and Contracts
Federal Grants and Contracts 1.06% 1.35% 1.39% 1.69% 1.38% 2.38% 2.52% 2.44% 2.74% 2.56%
State Grants and Contracts 1.02% 0.81% 0.97% 0.68% 0.90% 0.84% 0.77% 0.56% 0.34% 0.22%
Local Grants and Contracts 1.23% 1.08% 0.99% 1.13% 1.59% 1.11% 1.18% 1.43% 1.58% 3.42%
Auxiliary enterprises 3.29% 3.36% 2.45% 2.18% 2.01% 2.05% 1.98% 2.22% 2.31% 2.27%
Other Operating Revenues 0.61% 0.52% 0.36% 0.45% 0.42% 0.40% 0.59% 0.33% 0.37% 0.38%
Total Operating Revenues 24.28% 21.63% 21.00% 21.11% 21.15% 20.89% 21.85% 21.37% 22.33% 22.93%
Ad Valorem Taxes: Maintenance and Operations 24.69% 25.53% 26.06% 25.84% 26.43% 27.23% 30.26% 30.66% 30.03% 29.58%
General Obligation Bonds 10.26% 10.22% 10.16% 9.94% 10.57% 12.00% 13.30% 12.74% 12.77% 11.99%
State Appropriations 19.80% 20.06% 18.88% 19.21% 20.16% 22.72% 24.87% 26.44% 25.55% 26.26%
Federal Revenue, Non-Operating 20.05% 21.39% 22.55% 22.71% 20.43% 15.46% 8.13% 6.83% 6.97% 7.58%
Investment income 0.15% 0.11% 0.14% 0.13% 0.20% 0.29% 1.20% 1.45% 1.82% 1.07%
Other non-operating revenues 0.78% 1.07% 1.21% 1.07% 1.06% 1.40% 0.39% 0.51% 0.53% 0.59%
Total Non-Operating Revenues 75.72% 78.37% 79.00% 78.89% 78.85% 79.11% 78.15% 78.63% 77.67% 77.07%
Total Revenues 100.00% 100.00% 100.00% 100.00% 100.00% 100.00% 100.00% 100.00% 100.00% 100.00%
For the Year Ended August 31,
91 | P a g e

Statistical Supplement 3Program Expenses by Function Last Ten Fiscal Years(unaudited)
2015 2014 2013 2012 2011 2010 2009 2008 2007 2006
Instruction 128,276$ 123,466$ 113,233$ 108,314$ 104,578$ 99,673$ 92,039$ 88,102$ 81,585$ 77,225$
Research - - - - - - - - - -
Public service 1,364 1,340 1,048 1,163 1,252 1,805 1,757 1,510 1,475 1,475
Academic support 60,595 55,928 54,998 47,383 47,497 44,995 44,796 36,140 31,411 29,010
Student services 47,340 41,840 38,498 34,101 30,101 29,942 24,065 18,469 16,705 15,551
Institutional support 40,664 37,230 32,744 29,227 29,908 30,207 27,105 33,961 30,898 28,571
Operation and maintenance of plant 49,375 43,688 42,416 42,230 36,497 35,753 38,258 31,868 27,362 23,665
Scholarships and fellowships 65,330 55,840 56,215 60,374 51,120 33,743 14,092 10,662 10,392 9,341
Auxiliary enterprises 14,088 12,307 8,621 6,772 5,748 5,297 4,952 5,696 5,304 5,132
Depreciation 25,473 23,588 22,346 19,368 12,666 10,682 9,369 8,492 8,825 8,702
Total Operating Expenses 432,505$ 395,227$ 370,119$ 348,932$ 319,367$ 292,097$ 256,433$ 234,900$ 213,957$ 198,672$
Interest on capital related debt 23,738 27,106 22,792 19,614 20,959 19,731 15,582 10,419 11,359 12,518
Loss on disposal of capital assets 196 1,876 6,030 666 1,439 5 97 347 245 6
Total Non-Operating Expenses 23,934 28,982 28,822 20,280 22,398 19,736 15,679 10,766 11,604 12,524
Total Expenses 456,438$ 424,209$ 398,941$ 369,212$ 341,765$ 311,833$ 272,112$ 245,666$ 225,561$ 211,196$
Lone Star College
For the Year Ended August 31,(amounts expressed in thousands)
92 | P a g e
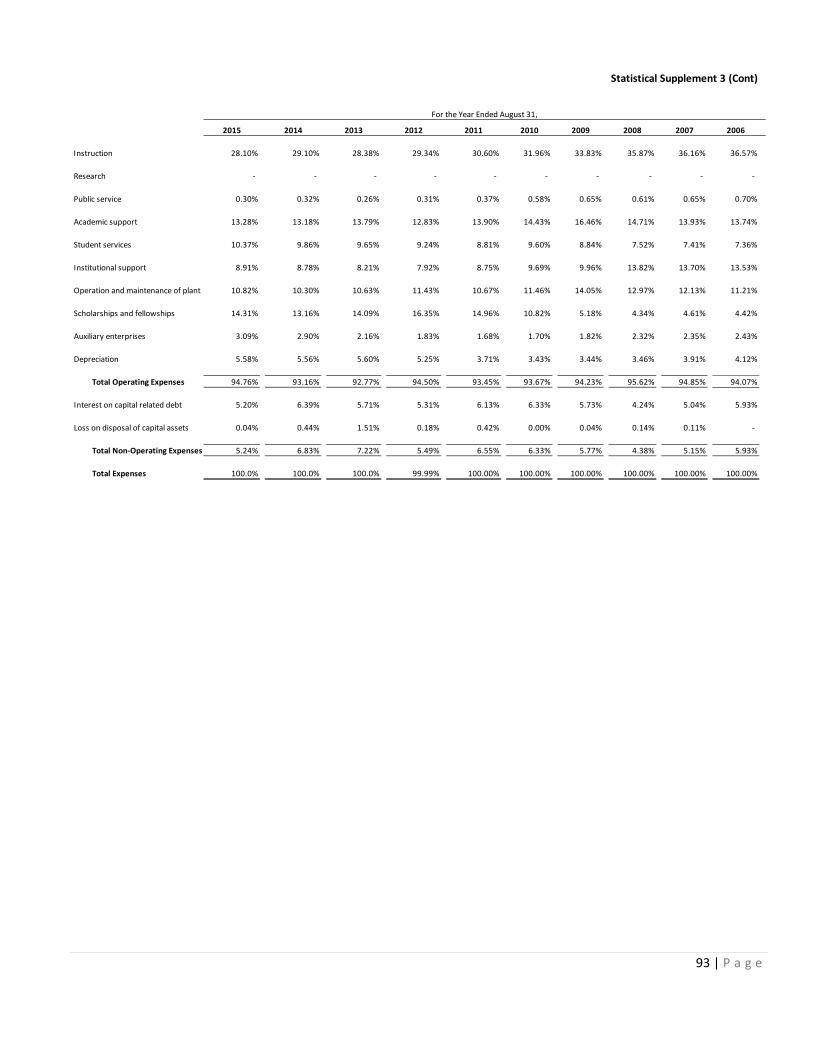
Statistical Supplement 3 (Cont)
2015 2014 2013 2012 2011 2010 2009 2008 2007 2006
Instruction 28.10% 29.10% 28.38% 29.34% 30.60% 31.96% 33.83% 35.87% 36.16% 36.57%
Research - - - - - - - - - -
Public service 0.30% 0.32% 0.26% 0.31% 0.37% 0.58% 0.65% 0.61% 0.65% 0.70%
Academic support 13.28% 13.18% 13.79% 12.83% 13.90% 14.43% 16.46% 14.71% 13.93% 13.74%
Student services 10.37% 9.86% 9.65% 9.24% 8.81% 9.60% 8.84% 7.52% 7.41% 7.36%
Institutional support 8.91% 8.78% 8.21% 7.92% 8.75% 9.69% 9.96% 13.82% 13.70% 13.53%
Operation and maintenance of plant 10.82% 10.30% 10.63% 11.43% 10.67% 11.46% 14.05% 12.97% 12.13% 11.21%
Scholarships and fellowships 14.31% 13.16% 14.09% 16.35% 14.96% 10.82% 5.18% 4.34% 4.61% 4.42%
Auxiliary enterprises 3.09% 2.90% 2.16% 1.83% 1.68% 1.70% 1.82% 2.32% 2.35% 2.43%
Depreciation 5.58% 5.56% 5.60% 5.25% 3.71% 3.43% 3.44% 3.46% 3.91% 4.12%
Total Operating Expenses 94.76% 93.16% 92.77% 94.50% 93.45% 93.67% 94.23% 95.62% 94.85% 94.07%
Interest on capital related debt 5.20% 6.39% 5.71% 5.31% 6.13% 6.33% 5.73% 4.24% 5.04% 5.93%
Loss on disposal of capital assets 0.04% 0.44% 1.51% 0.18% 0.42% 0.00% 0.04% 0.14% 0.11% -
Total Non-Operating Expenses 5.24% 6.83% 7.22% 5.49% 6.55% 6.33% 5.77% 4.38% 5.15% 5.93%
Total Expenses 100.0% 100.0% 100.0% 99.99% 100.00% 100.00% 100.00% 100.00% 100.00% 100.00%
For the Year Ended August 31,
93 | P a g e
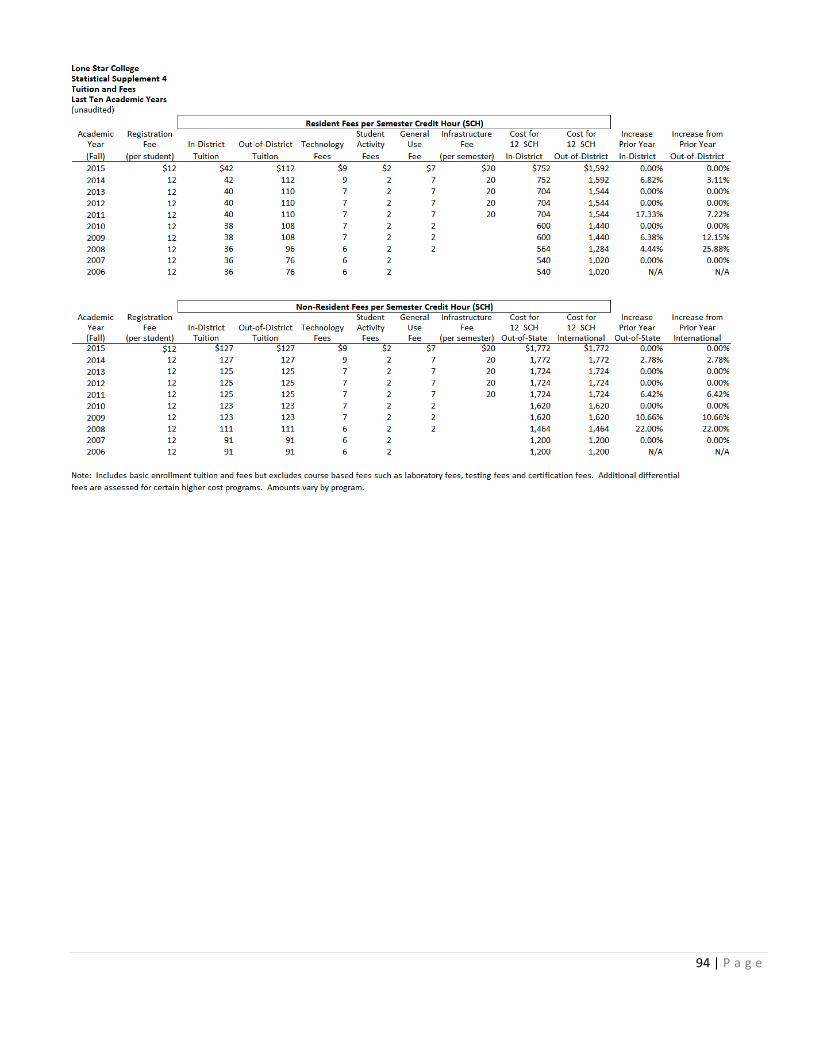
94 | P a g e
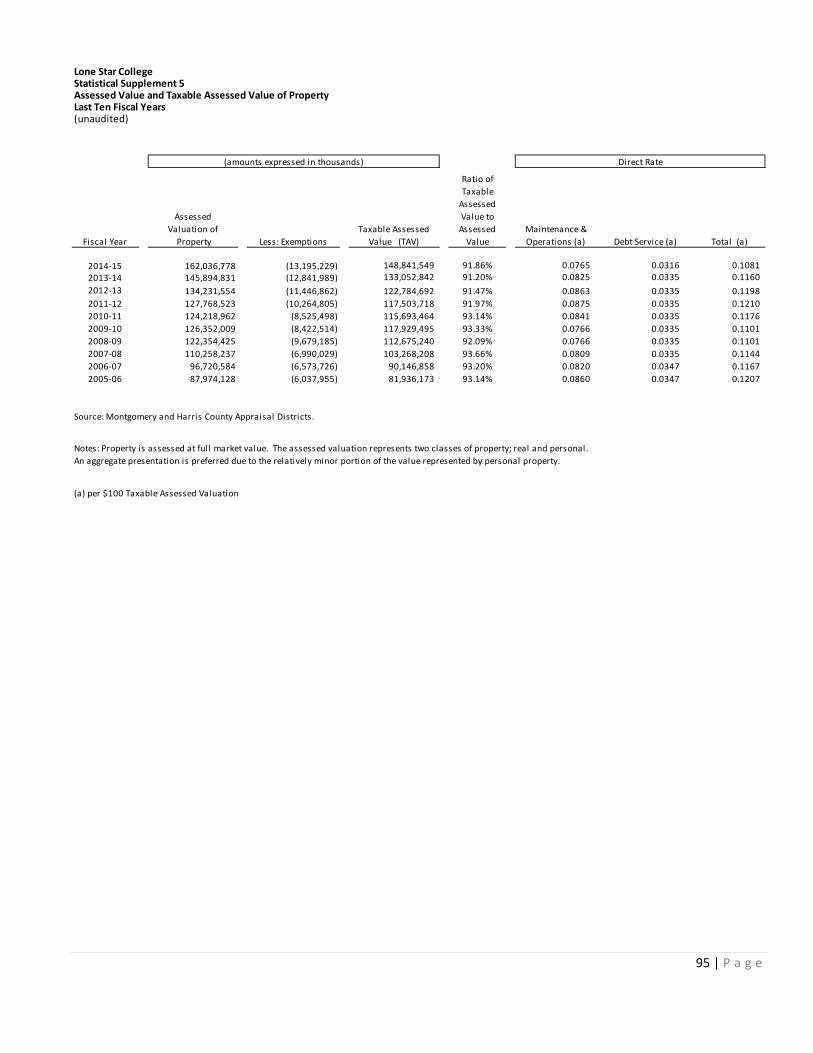
Lone Star CollegeStatistical Supplement 5Assessed Value and Taxable Assessed Value of Property Last Ten Fiscal Years(unaudited)
Fiscal Year
Assessed Valuation of
Property Less: ExemptionsTaxable Assessed
Value (TAV)
Ratio of Taxable
Assessed Value to
Assessed Value
Maintenance & Operations (a) Debt Service (a) Total (a)
2014-15 162,036,778 (13,195,229) 148,841,549 91.86% 0.0765 0.0316 0.1081 2013-14 145,894,831 (12,841,989) 133,052,842 91.20% 0.0825 0.0335 0.1160 2012-13 134,231,554 (11,446,862) 122,784,692 91.47% 0.0863 0.0335 0.1198 2011-12 127,768,523 (10,264,805) 117,503,718 91.97% 0.0875 0.0335 0.1210 2010-11 124,218,962 (8,525,498) 115,693,464 93.14% 0.0841 0.0335 0.1176 2009-10 126,352,009 (8,422,514) 117,929,495 93.33% 0.0766 0.0335 0.1101 2008-09 122,354,425 (9,679,185) 112,675,240 92.09% 0.0766 0.0335 0.1101 2007-08 110,258,237 (6,990,029) 103,268,208 93.66% 0.0809 0.0335 0.1144 2006-07 96,720,584 (6,573,726) 90,146,858 93.20% 0.0820 0.0347 0.11672005-06 87,974,128 (6,037,955) 81,936,173 93.14% 0.0860 0.0347 0.1207
(amounts expressed in thousands)
(a) per $100 Taxable Assessed Valuation
Notes: Property is assessed at full market value. The assessed valuation represents two classes of property; real and personal. An aggregate presentation is preferred due to the relatively minor portion of the value represented by personal property.
Source: Montgomery and Harris County Appraisal Districts.
Direct Rate
95 | P a g e
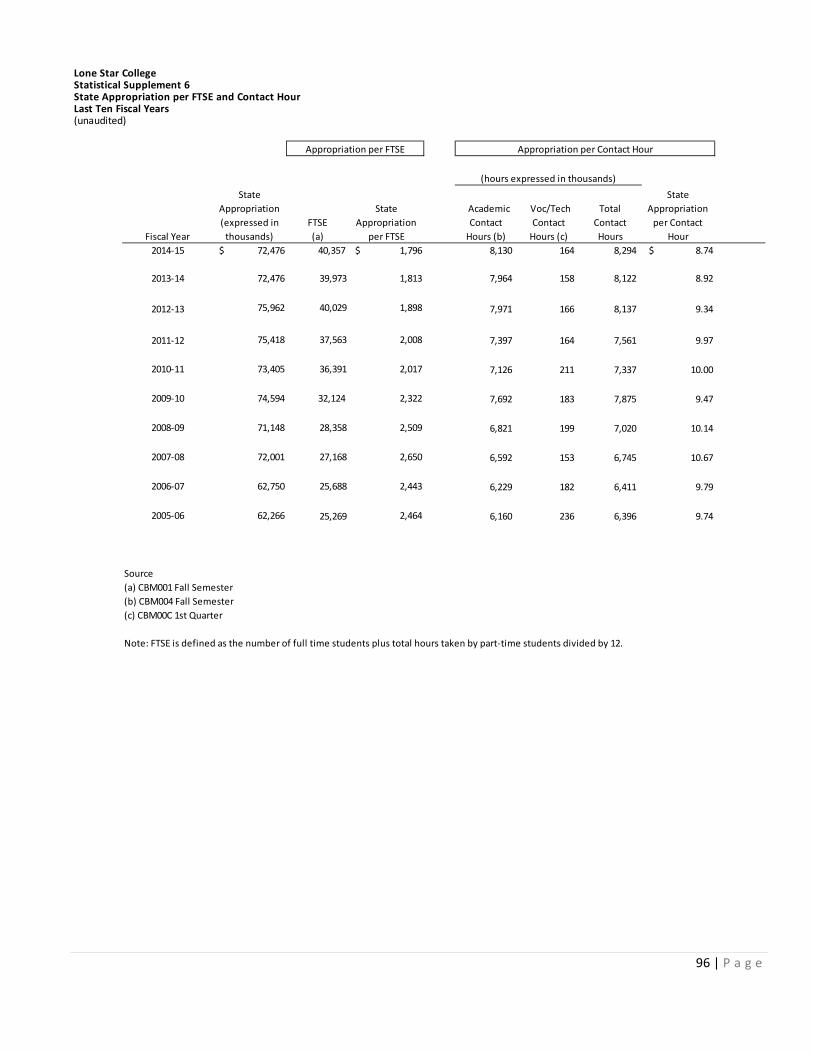
Lone Star CollegeStatistical Supplement 6State Appropriation per FTSE and Contact HourLast Ten Fiscal Years(unaudited)
Fiscal Year
State Appropriation (expressed in
thousands)FTSE (a)
State Appropriation
per FTSE
Academic Contact
Hours (b)
Voc/Tech Contact
Hours (c)
Total Contact Hours
State Appropriation
per Contact Hour
2014-15 $ 72,476 40,357 $ 1,796 8,130 164 8,294 $ 8.74
2013-14 72,476 39,973 1,813 7,964 158 8,122 8.92
2012-13 75,962 40,029 1,898 7,971 166 8,137 9.34
2011-12 75,418 37,563 2,008 7,397 164 7,561 9.97
2010-11 73,405 36,391 2,017 7,126 211 7,337 10.00
2009-10 74,594 32,124 2,322 7,692 183 7,875 9.47
2008-09 71,148 28,358 2,509 6,821 199 7,020 10.14
2007-08 72,001 27,168 2,650 6,592 153 6,745 10.67
2006-07 62,750 25,688 2,443 6,229 182 6,411 9.79
2005-06 62,266 25,269 2,464 6,160 236 6,396 9.74
Source
(c) CBM00C 1st Quarter
Note: FTSE is defined as the number of full time students plus total hours taken by part-time students divided by 12.
Appropriation per Contact Hour
(b) CBM004 Fall Semester(a) CBM001 Fall Semester
Appropriation per FTSE
(hours expressed in thousands)
96 | P a g e

Lone Star College Statistical Supplement 7Principal TaxpayersLast Ten Tax Years Per County Reports(unaudited)
Taxpayer 2015 2014 2013 2012 2011 2010 2009 2008 2007 2006
Hewlett Packard Manufacturing 970,506$ 923,268$ 950,638$ 966,995$ 773,400$ 951,681$ 851,026$ 1,070,242$ 717,813$ 612,508$
National Oi lwel l Inc. Oi l and Gas 831,228 750,757 953,362 853,978 1,029,299 542,361 344,584
Centerpoint Energy Inc Uti l i ty 697,677 726,301 627,931 612,353 607,492 631,661 634,424 629,973 669,281 627,004 Ha l l iburton Oi l and Gas 689,307 637,090 602,119 417,115 243,305 251,237 264,056 Uni ted (Continenta l ) Ai rl ines Inc Airl ine 669,438 315,198 269,573 240,493 234,462 190,396 190,101 218,579 Baker Hughes Oi l and Gas 612,975 456,648 235,261 217,842 244,222 Pa lmetto Transoceanic LLC Genera l Industria l 534,150 Cameron Oi l and Gas 413,225 406,267 339,451
Noble Dri l l ing Oi l and Gas 397,375 339,270 Anadarko Real ty Co Real Es tate 367,015
Liberty Property Real Es tate
Walmart Reta i l 343,630 333,060 340,227 532,664 562,119 540,093 512,420 272,154 194,673
Smith International Oi l and Gas 371,334 314,722 241,037 227,655 254,117 235,543 Wal -Mart Real Es tate Bus Trs t Real Es tate 230,856 220,261 HEB Grocery Co LP Reta i l grocery 252,711 223,180 158,170 LeTourneau Technologies Oi l and Gas 226,670 282,033 Comcast of Houston LLC Uti l i ty 218,045 Hines Interests Ltd Psp Real Es tate 215,407 234,733 286,343 248,302 226,654 211,493 Houston Pipel ine Co LP Uti l i ty 355,074 324,603 253,573 525,621 368,197 Schlumberger Technology Oi l and Gas 269,686 AT&T/Southwestern Bel l Uti l i ty 236,936 348,855 254,770 260,074 Nabors Dri l l ing USA LP Oi l and Gas 507,533 Express Jet Ai rl ines Inc Airl ine 200,909 Exxon Mobi l Corp Oi l and Gas 198,660 174,024 127,130 Texas Cable Partners LP Uti l i ty 136,543 Wachovia Develop Corp Real Es tate 136,277
Tota ls 6,182,896$ 5,269,763$ 4,878,828$ 4,344,076$ 4,308,399$ 4,309,238$ 3,987,294$ 4,160,863$ 3,408,849$ 2,892,478$
148,841,539$ 122,784,692$ 117,503,718$ 115,693,464$ 117,929,495$ 112,675,240$ 103,268,208$ 90,146,858$ 81,936,173$ 75,289,890$
Taxable Assessed Value (TAV) by Fiscal Year (amounts expressed in thousands)Type of Bus iness
Tota l Taxable Assessed Value
97 | P a g e

Statisical Supplement 7 (Cont)
Taxpayer Type of Bus iness 2015 2014 2013 2012 2011 2010 2009 2008 2007 2006
Hewlett Packard Manufacturing 0.65% 0.75% 0.81% 0.84% 0.66% 0.84% 0.82% 1.19% 0.88% 0.81%National Oi lwel l Inc. Oi l and Gas 0.56% 0.61% 0.81% 0.74% 0.87% 0.48% 0.33%Centerpoint Energy Inc Uti l i ty 0.47% 0.59% 0.53% 0.53% 0.52% 0.56% 0.61% 0.70% 0.82% 0.83%Hal l iburton Oi l and Gas 0.46% 0.52% 0.51% 0.36% 0.21% 0.22% 0.26%Baker Hughes Oi l and Gas 0.41% 0.37% 0.20% 0.19% 0.22%Palmetto Transoceanic LLC Genera l Industria l 0.36%Cameron Oi l and Gas 0.28% 0.33% 0.29%Noble Dri l l ing Oi l and Gas 0.27% 0.28%Anadarko Real ty Co Real Es tate 0.25%Smith International Oi l and Gas 0.30% 0.27% 0.21% 0.19% 0.23% 0.23%Walmart Reta i l 0.28% 0.28% 0.29% 0.45% 0.50% 0.52% 0.57% 0.33% 0.26%Continenta l Ai rl ines Inc Airl ine 0.45% 0.26% 0.23% 0.21% 0.20% 0.21% 0.23% 0.29%Wal-Mart Real Es tate Bus Trs t Real Es tate 0.20% 0.27%HEB Grocery Co LP Reta i l grocery 0.22% 0.19% 0.19%LeTourneau Technologies Oi l and Gas 0.19% 0.25%
Comcast of Houston LLC Uti l i ty 0.18%Hines Interests Ltd Psp Real Es tate 0.18% 0.21% 0.28% 0.28% 0.28% 0.28%Houston Pipel ine Co LP Uti l i ty 0.32% 0.31% 0.28% 0.64% 0.49%Schlumberger Technology Oi l and Gas 0.26%AT&T/Southwestern Bel l Uti l i ty 0.23% 0.39% 0.31% 0.35%Nabors Dri l l ing USA LP Oi l and Gas 0.56%Express Jet Ai rl ines Inc Airl ine 0.22%Exxon Mobi l Corp Oi l and Gas 0.22% 0.21% 0.17%Texas Cable Partners LP Uti l i ty 0.18%Wachovia Develop Corp Real Es tate 0.18%
4.15% 4.29% 4.15% 3.75% 3.65% 3.82% 3.86% 4.62% 4.16% 3.84%
Source: Harri s County and Montgomery County Appra isa l Dis tricts
% of Taxable Assessed Value (TAV) by Fiscal Year
98 | P a g e

99 | P a g e
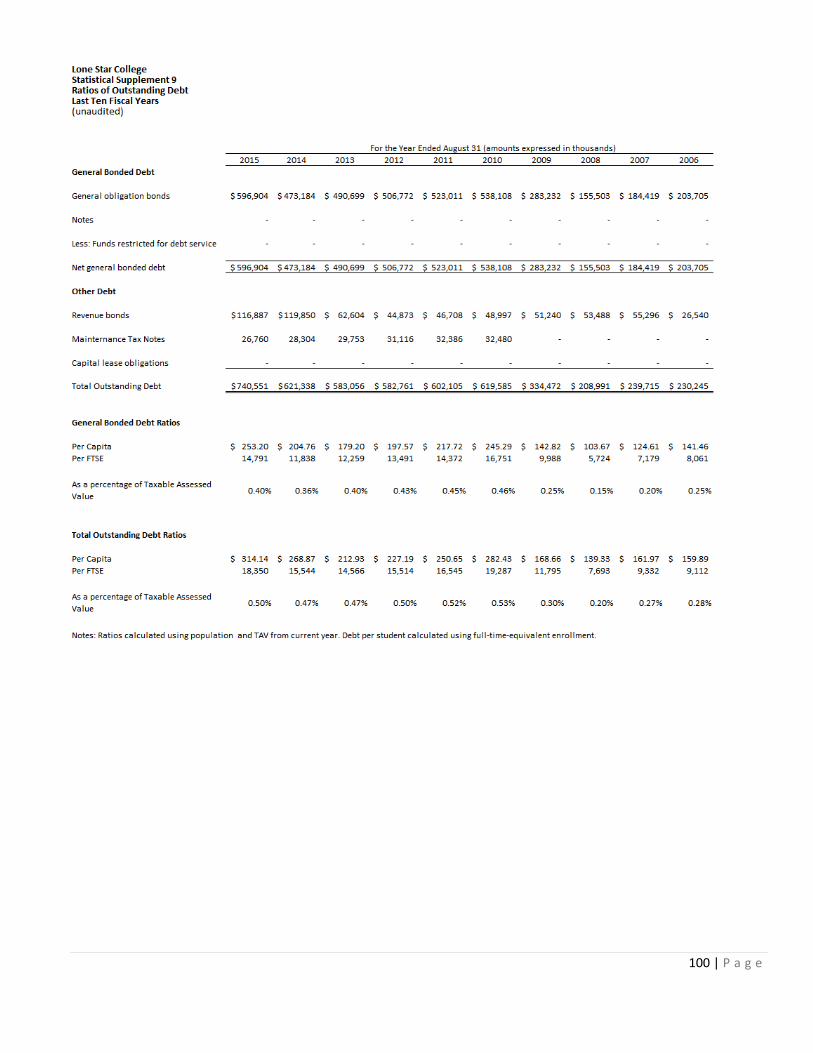
100 | P a g e
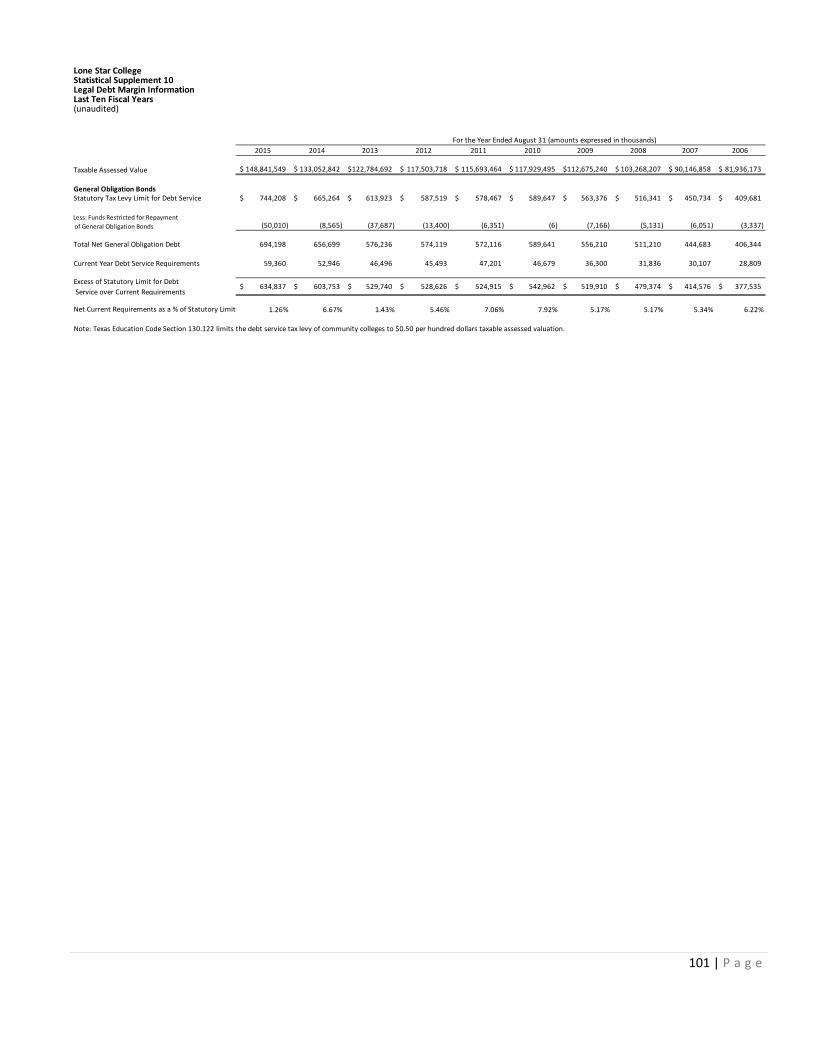
Lone Star CollegeStatistical Supplement 10Legal Debt Margin InformationLast Ten Fiscal Years(unaudited)
2015 2014 2013 2012 2011 2010 2009 2008 2007 2006
Taxable Assessed Value 148,841,549$ 133,052,842$ 122,784,692$ 117,503,718$ 115,693,464$ 117,929,495$ 112,675,240$ 103,268,207$ 90,146,858$ 81,936,173$
General Obligation BondsStatutory Tax Levy Limit for Debt Service 744,208$ 665,264$ 613,923$ 587,519$ 578,467$ 589,647$ 563,376$ 516,341$ 450,734$ 409,681$
Less: Funds Restricted for Repayment of General Obligation Bonds (50,010) (8,565) (37,687) (13,400) (6,351) (6) (7,166) (5,131) (6,051) (3,337)
Total Net General Obligation Debt 694,198 656,699 576,236 574,119 572,116 589,641 556,210 511,210 444,683 406,344
Current Year Debt Service Requirements 59,360 52,946 46,496 45,493 47,201 46,679 36,300 31,836 30,107 28,809
Excess of Statutory Limit for Debt Service over Current Requirements
634,837$ 603,753$ 529,740$ 528,626$ 524,915$ 542,962$ 519,910$ 479,374$ 414,576$ 377,535$
Net Current Requirements as a % of Statutory Limit 1.26% 6.67% 1.43% 5.46% 7.06% 7.92% 5.17% 5.17% 5.34% 6.22%
Note: Texas Education Code Section 130.122 limits the debt service tax levy of community colleges to $0.50 per hundred dollars taxable assessed valuation.
For the Year Ended August 31 (amounts expressed in thousands)
101 | P a g e
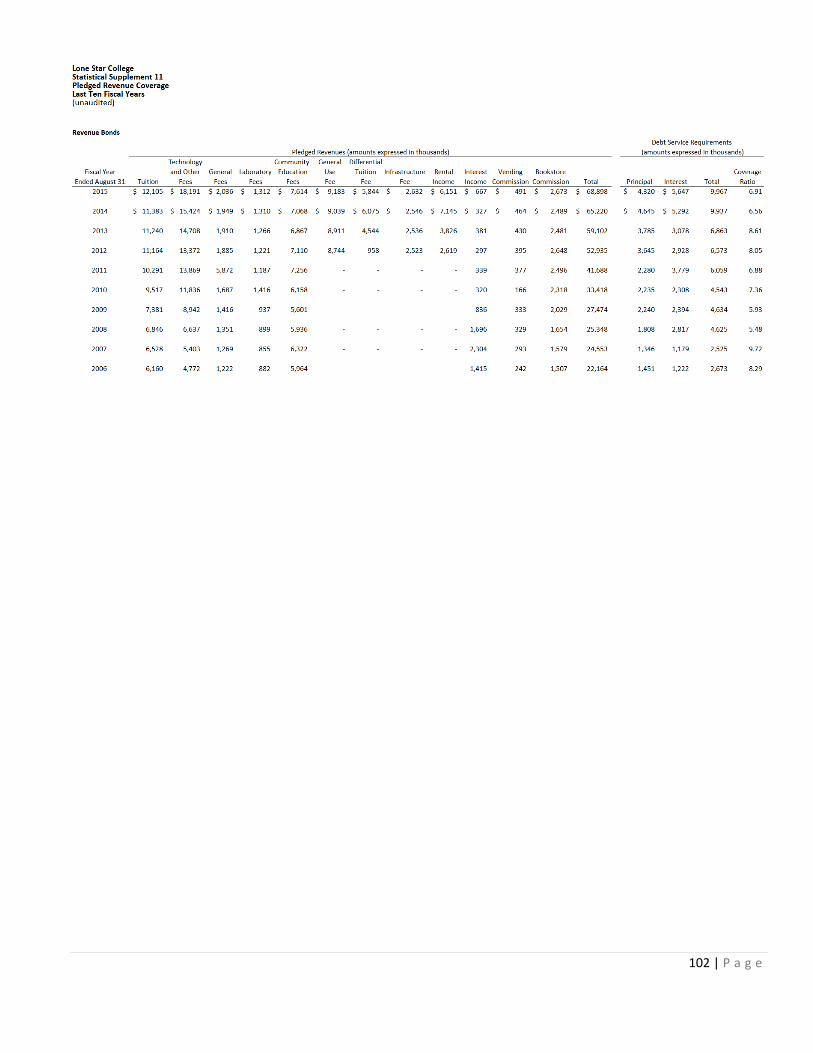
102 | P a g e
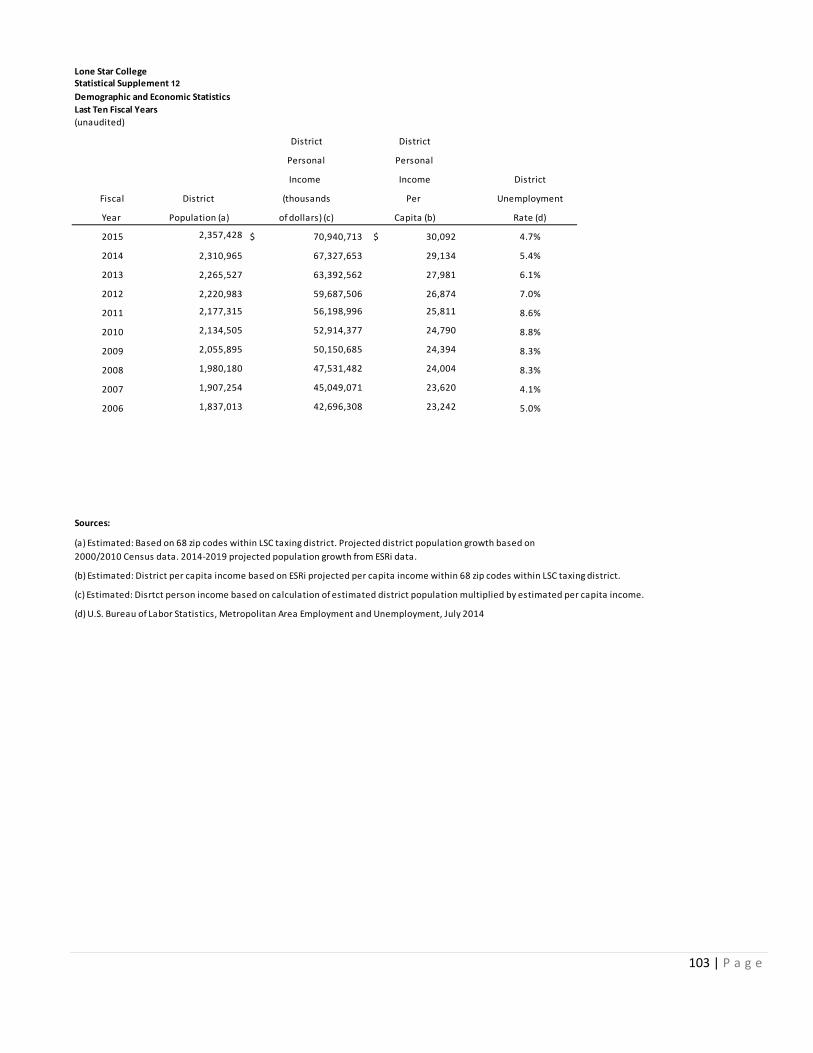
Lone Star CollegeStatistical Supplement 12Demographic and Economic StatisticsLast Ten Fiscal Years(unaudited)
District District
Personal Personal
Income Income District
Fiscal District (thousands Per Unemployment
Year Population (a) of dollars) (c) Capita (b) Rate (d)
2015 2,357,428 70,940,713$ 30,092$ 4.7%
2014 2,310,965 67,327,653 29,134 5.4%
2013 2,265,527 63,392,562 27,981 6.1%
2012 2,220,983 59,687,506 26,874 7.0%
2011 2,177,315 56,198,996 25,811 8.6%
2010 2,134,505 52,914,377 24,790 8.8%
2009 2,055,895 50,150,685 24,394 8.3%
2008 1,980,180 47,531,482 24,004 8.3%
2007 1,907,254 45,049,071 23,620 4.1%
2006 1,837,013 42,696,308 23,242 5.0%
Sources:
(b) Estimated: District per capita income based on ESRi projected per capita income within 68 zip codes within LSC taxing district.
(c) Estimated: Disrtct person income based on calculation of estimated district population multiplied by estimated per capita income.
(d) U.S. Bureau of Labor Statistics, Metropolitan Area Employment and Unemployment, July 2014
(a) Estimated: Based on 68 zip codes within LSC taxing district. Projected district population growth based on 2000/2010 Census data. 2014-2019 projected population growth from ESRi data.
103 | P a g e
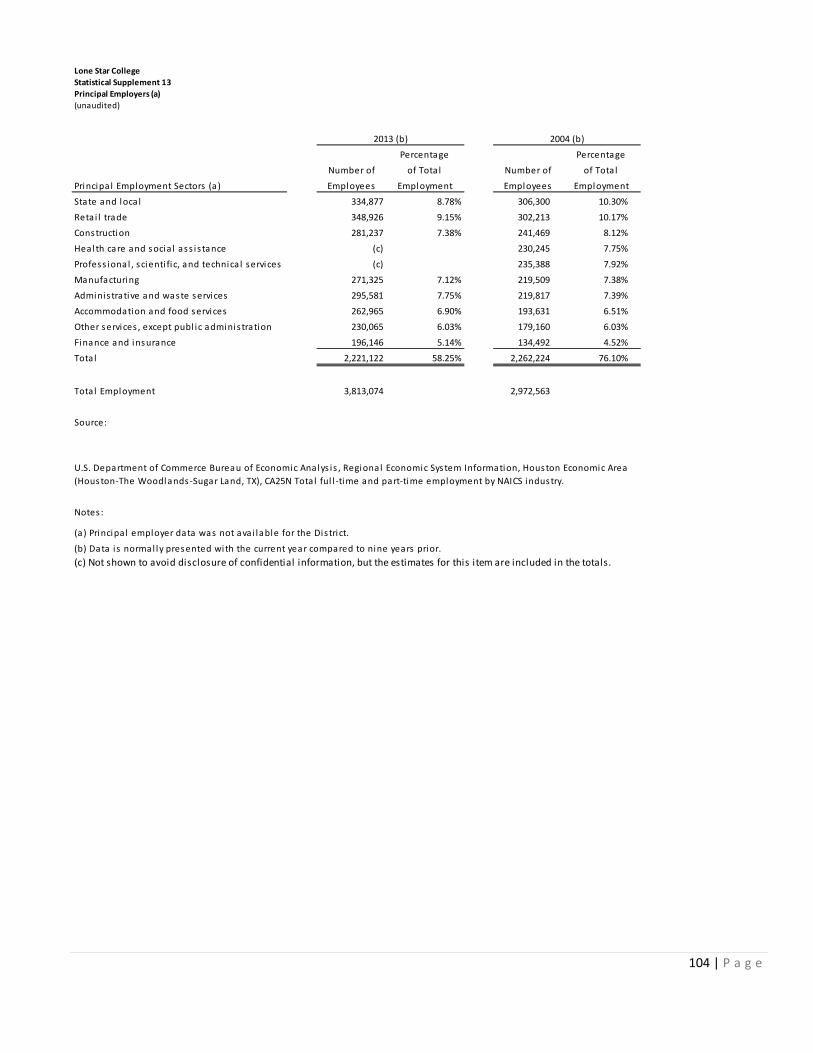
Lone Star CollegeStatistical Supplement 13Principal Employers (a)(unaudited)
Percentage Percentage
Number of of Tota l Number of of Tota l
Principa l Employment Sectors (a) Employees Employment Employees Employment
State and loca l 334,877 8.78% 306,300 10.30%
Reta i l trade 348,926 9.15% 302,213 10.17%
Construction 281,237 7.38% 241,469 8.12%
Health care and socia l ass is tance (c) 230,245 7.75%
Profess ional , scienti fi c, and technica l services (c) 235,388 7.92%
Manufacturing 271,325 7.12% 219,509 7.38%
Adminis trative and waste services 295,581 7.75% 219,817 7.39%
Accommodation and food services 262,965 6.90% 193,631 6.51%
Other services , except publ ic adminis tration 230,065 6.03% 179,160 6.03%
Finance and insurance 196,146 5.14% 134,492 4.52%
Tota l 2,221,122 58.25% 2,262,224 76.10%
Tota l Employment 3,813,074 2,972,563
Source:
Notes :
(a) Principa l employer data was not ava i lable for the Dis trict.
(c) Not shown to avoid disclosure of confidential information, but the estimates for this item are included in the totals.
2013 (b) 2004 (b)
U.S. Department of Commerce Bureau of Economic Analys is , Regional Economic System Information, Houston Economic Area (Houston-The Woodlands-Sugar Land, TX), CA25N Tota l ful l -time and part-time employment by NAICS industry.
(b) Data i s normal ly presented with the current year compared to nine years prior.
104 | P a g e

Statistical Supplement 14Faculty, Staff and Administrators StatisticsLast Ten Fiscal Years(unaudited)
2015 2014 2013 2012 2011 2010 2009 2008 2007 2006
FacultyFull-Time 875 918 842 833 742 780 756 761 704 661Part-Time 2,382 2,039 1,999 1,894 1,900 2,271 2,118 1,923 1,910 1,799Total 3,257 2,957 2,841 2,727 2,642 3,051 2,874 2,684 2,614 2,460
PercentFull-Time 26.9% 31.0% 29.6% 30.5% 28.1% 25.6% 26.3% 28.4% 26.9% 26.9%Part-Time 73.1% 69.0% 70.4% 69.5% 71.9% 74.4% 73.7% 71.6% 73.1% 73.1%
Staff and AdministratorsFull-Time 1,852 1,673 1,581 1,479 1,431 1,408 1,340 1,263 1,214 1,187Part-Time 1,376 1,483 1,642 1,476 1,297 1,334 1,472 1,480 1,260 1,078Total 3,228 3,156 3,223 2,955 2,728 2,742 2,812 2,743 2,474 2,265
PercentFull-Time 57.4% 53.0% 49.1% 50.1% 52.5% 51.3% 47.7% 46.0% 49.1% 52.4%Part-Time 42.6% 47.0% 50.9% 49.9% 47.5% 48.7% 52.3% 54.0% 50.9% 47.6%
FTSE per Full-time Faculty 48.93 45.90 49.61 49.57 52.69 45.87 33.98 33.76 36.49 38.23 FTSE per Full-Time Staff Member 23.12 25.19 26.42 27.92 27.32 25.41 19.17 20.34 21.16 21.29
Average Annual Faculty Salary 65,114$ 65,376$ 65,462$ 65,835$ 65,321$ 65,012$ 65,301$ 62,755$ 61,426$ 58,424$
Lone Star College
Fiscal Year
105 | P a g e
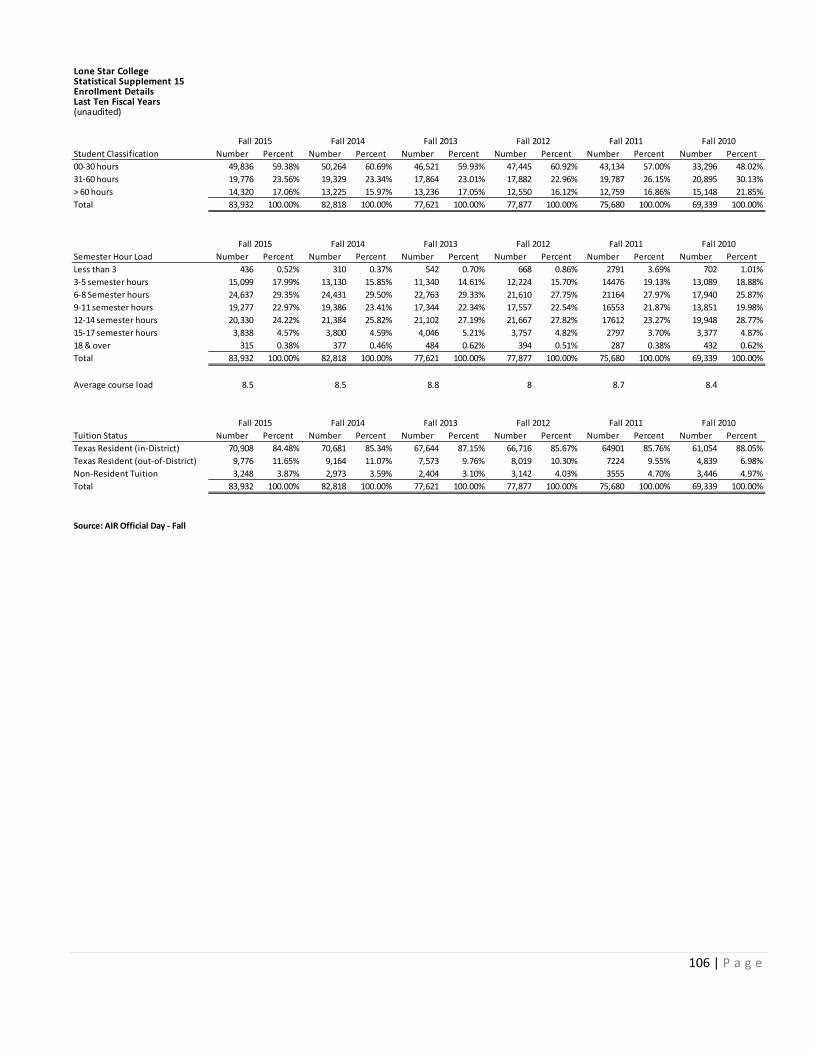
Lone Star CollegeStatistical Supplement 15Enrollment DetailsLast Ten Fiscal Years(unaudited)
Student Classification Number Percent Number Percent Number Percent Number Percent Number Percent Number Percent00-30 hours 49,836 59.38% 50,264 60.69% 46,521 59.93% 47,445 60.92% 43,134 57.00% 33,296 48.02%31-60 hours 19,776 23.56% 19,329 23.34% 17,864 23.01% 17,882 22.96% 19,787 26.15% 20,895 30.13%> 60 hours 14,320 17.06% 13,225 15.97% 13,236 17.05% 12,550 16.12% 12,759 16.86% 15,148 21.85%Total 83,932 100.00% 82,818 100.00% 77,621 100.00% 77,877 100.00% 75,680 100.00% 69,339 100.00%
Semester Hour Load Number Percent Number Percent Number Percent Number Percent Number Percent Number PercentLess than 3 436 0.52% 310 0.37% 542 0.70% 668 0.86% 2791 3.69% 702 1.01%3-5 semester hours 15,099 17.99% 13,130 15.85% 11,340 14.61% 12,224 15.70% 14476 19.13% 13,089 18.88%6-8 Semester hours 24,637 29.35% 24,431 29.50% 22,763 29.33% 21,610 27.75% 21164 27.97% 17,940 25.87%9-11 semester hours 19,277 22.97% 19,386 23.41% 17,344 22.34% 17,557 22.54% 16553 21.87% 13,851 19.98%12-14 semester hours 20,330 24.22% 21,384 25.82% 21,102 27.19% 21,667 27.82% 17612 23.27% 19,948 28.77%15-17 semester hours 3,838 4.57% 3,800 4.59% 4,046 5.21% 3,757 4.82% 2797 3.70% 3,377 4.87%18 & over 315 0.38% 377 0.46% 484 0.62% 394 0.51% 287 0.38% 432 0.62%Total 83,932 100.00% 82,818 100.00% 77,621 100.00% 77,877 100.00% 75,680 100.00% 69,339 100.00%
Average course load 8.5 8.5 8.8 8 8.7 8.4
Tuition Status Number Percent Number Percent Number Percent Number Percent Number Percent Number PercentTexas Resident (in-District) 70,908 84.48% 70,681 85.34% 67,644 87.15% 66,716 85.67% 64901 85.76% 61,054 88.05%Texas Resident (out-of-District) 9,776 11.65% 9,164 11.07% 7,573 9.76% 8,019 10.30% 7224 9.55% 4,839 6.98%Non-Resident Tuition 3,248 3.87% 2,973 3.59% 2,404 3.10% 3,142 4.03% 3555 4.70% 3,446 4.97%Total 83,932 100.00% 82,818 100.00% 77,621 100.00% 77,877 100.00% 75,680 100.00% 69,339 100.00%
Source: AIR Official Day - Fall
Fall 2015
Fall 2015
Fall 2015
Fall 2014
Fall 2014
Fall 2014
Fall 2012
Fall 2012
Fall 2013
Fall 2013
Fall 2013
Fall 2011
Fall 2011
Fall 2010
Fall 2010
Fall 2010
Fall 2012 Fall 2011
106 | P a g e
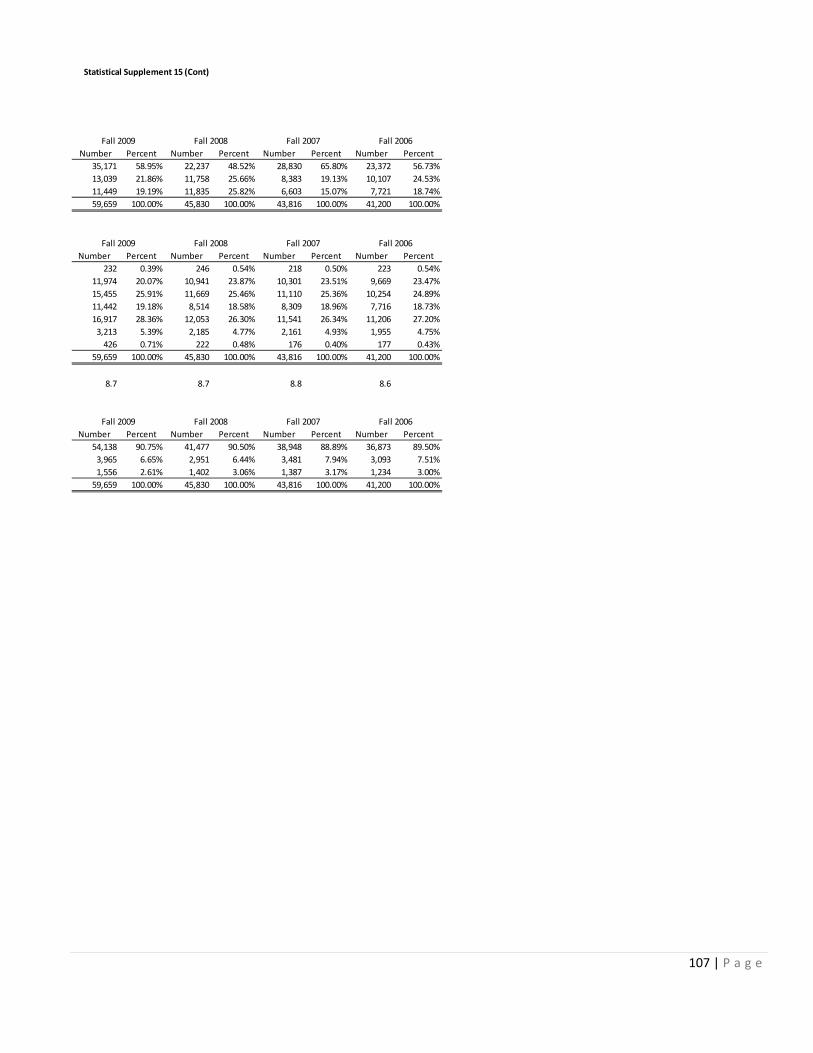
Statistical Supplement 15 (Cont)
Number Percent Number Percent Number Percent Number Percent 35,171 58.95% 22,237 48.52% 28,830 65.80% 23,372 56.73%13,039 21.86% 11,758 25.66% 8,383 19.13% 10,107 24.53%11,449 19.19% 11,835 25.82% 6,603 15.07% 7,721 18.74%59,659 100.00% 45,830 100.00% 43,816 100.00% 41,200 100.00%
Number Percent Number Percent Number Percent Number Percent232 0.39% 246 0.54% 218 0.50% 223 0.54%
11,974 20.07% 10,941 23.87% 10,301 23.51% 9,669 23.47%15,455 25.91% 11,669 25.46% 11,110 25.36% 10,254 24.89%11,442 19.18% 8,514 18.58% 8,309 18.96% 7,716 18.73%16,917 28.36% 12,053 26.30% 11,541 26.34% 11,206 27.20%
3,213 5.39% 2,185 4.77% 2,161 4.93% 1,955 4.75%426 0.71% 222 0.48% 176 0.40% 177 0.43%
59,659 100.00% 45,830 100.00% 43,816 100.00% 41,200 100.00%
8.7 8.7 8.8 8.6
Number Percent Number Percent Number Percent Number Percent54,138 90.75% 41,477 90.50% 38,948 88.89% 36,873 89.50%
3,965 6.65% 2,951 6.44% 3,481 7.94% 3,093 7.51%1,556 2.61% 1,402 3.06% 1,387 3.17% 1,234 3.00%
59,659 100.00% 45,830 100.00% 43,816 100.00% 41,200 100.00%
Fall 2008
Fall 2009 Fall 2006
Fall 2006Fall 2007Fall 2008Fall 2009
Fall 2007
Fall 2007 Fall 2006Fall 2009
Fall 2008
107 | P a g e
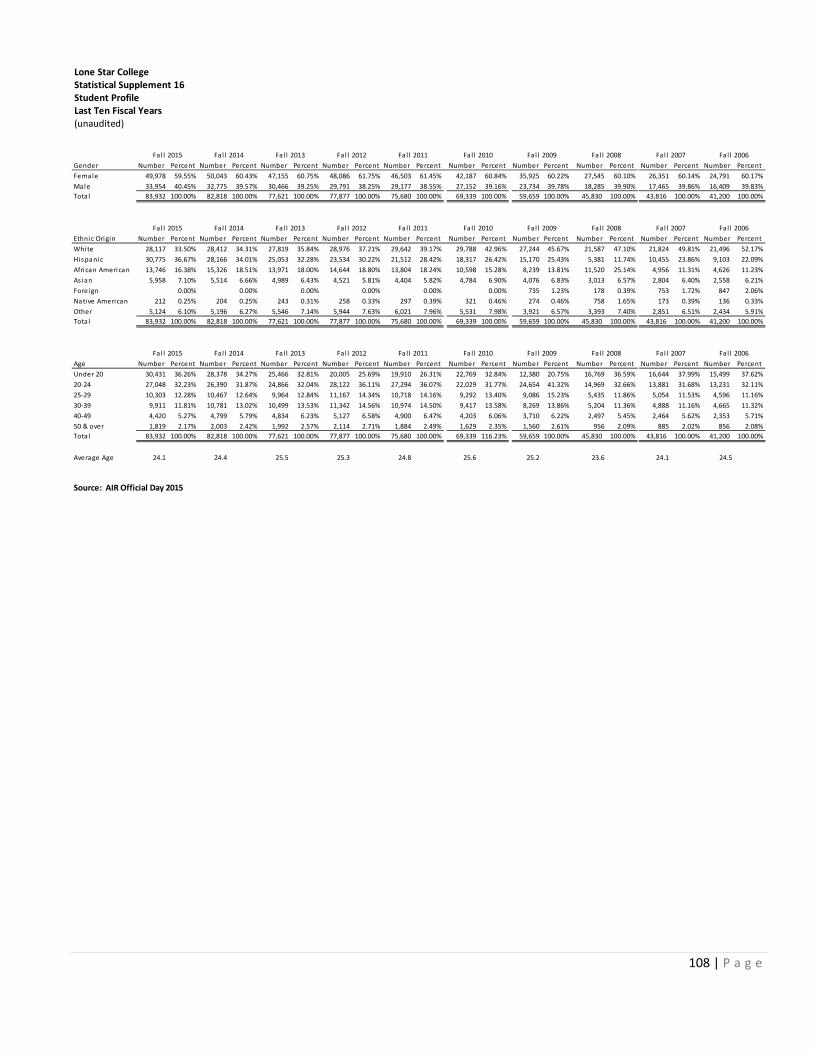
Lone Star College Statistical Supplement 16Student ProfileLast Ten Fiscal Years(unaudited)
Gender Number Percent Number Percent Number Percent Number Percent Number Percent Number Percent Number Percent Number Percent Number Percent Number PercentFemale 49,978 59.55% 50,043 60.43% 47,155 60.75% 48,086 61.75% 46,503 61.45% 42,187 60.84% 35,925 60.22% 27,545 60.10% 26,351 60.14% 24,791 60.17%Male 33,954 40.45% 32,775 39.57% 30,466 39.25% 29,791 38.25% 29,177 38.55% 27,152 39.16% 23,734 39.78% 18,285 39.90% 17,465 39.86% 16,409 39.83%Tota l 83,932 100.00% 82,818 100.00% 77,621 100.00% 77,877 100.00% 75,680 100.00% 69,339 100.00% 59,659 100.00% 45,830 100.00% 43,816 100.00% 41,200 100.00%
Ethnic Origin Number Percent Number Percent Number Percent Number Percent Number Percent Number Percent Number Percent Number Percent Number Percent Number PercentWhite 28,117 33.50% 28,412 34.31% 27,819 35.84% 28,976 37.21% 29,642 39.17% 29,788 42.96% 27,244 45.67% 21,587 47.10% 21,824 49.81% 21,496 52.17%Hispanic 30,775 36.67% 28,166 34.01% 25,053 32.28% 23,534 30.22% 21,512 28.42% 18,317 26.42% 15,170 25.43% 5,381 11.74% 10,455 23.86% 9,103 22.09%African American 13,746 16.38% 15,326 18.51% 13,971 18.00% 14,644 18.80% 13,804 18.24% 10,598 15.28% 8,239 13.81% 11,520 25.14% 4,956 11.31% 4,626 11.23%As ian 5,958 7.10% 5,514 6.66% 4,989 6.43% 4,521 5.81% 4,404 5.82% 4,784 6.90% 4,076 6.83% 3,013 6.57% 2,804 6.40% 2,558 6.21%Foreign 0.00% 0.00% 0.00% 0.00% 0.00% 0.00% 735 1.23% 178 0.39% 753 1.72% 847 2.06%Native American 212 0.25% 204 0.25% 243 0.31% 258 0.33% 297 0.39% 321 0.46% 274 0.46% 758 1.65% 173 0.39% 136 0.33%Other 5,124 6.10% 5,196 6.27% 5,546 7.14% 5,944 7.63% 6,021 7.96% 5,531 7.98% 3,921 6.57% 3,393 7.40% 2,851 6.51% 2,434 5.91%Tota l 83,932 100.00% 82,818 100.00% 77,621 100.00% 77,877 100.00% 75,680 100.00% 69,339 100.00% 59,659 100.00% 45,830 100.00% 43,816 100.00% 41,200 100.00%
Age Number Percent Number Percent Number Percent Number Percent Number Percent Number Percent Number Percent Number Percent Number Percent Number PercentUnder 20 30,431 36.26% 28,378 34.27% 25,466 32.81% 20,005 25.69% 19,910 26.31% 22,769 32.84% 12,380 20.75% 16,769 36.59% 16,644 37.99% 15,499 37.62%20-24 27,048 32.23% 26,390 31.87% 24,866 32.04% 28,122 36.11% 27,294 36.07% 22,029 31.77% 24,654 41.32% 14,969 32.66% 13,881 31.68% 13,231 32.11%25-29 10,303 12.28% 10,467 12.64% 9,964 12.84% 11,167 14.34% 10,718 14.16% 9,292 13.40% 9,086 15.23% 5,435 11.86% 5,054 11.53% 4,596 11.16%30-39 9,911 11.81% 10,781 13.02% 10,499 13.53% 11,342 14.56% 10,974 14.50% 9,417 13.58% 8,269 13.86% 5,204 11.36% 4,888 11.16% 4,665 11.32%40-49 4,420 5.27% 4,799 5.79% 4,834 6.23% 5,127 6.58% 4,900 6.47% 4,203 6.06% 3,710 6.22% 2,497 5.45% 2,464 5.62% 2,353 5.71%50 & over 1,819 2.17% 2,003 2.42% 1,992 2.57% 2,114 2.71% 1,884 2.49% 1,629 2.35% 1,560 2.61% 956 2.09% 885 2.02% 856 2.08%Tota l 83,932 100.00% 82,818 100.00% 77,621 100.00% 77,877 100.00% 75,680 100.00% 69,339 116.23% 59,659 100.00% 45,830 100.00% 43,816 100.00% 41,200 100.00%
Average Age 24.1 24.4 25.5 25.3 24.8 25.6 25.2 23.6 24.1 24.5
Source: AIR Official Day 2015
Fal l 2006
Fal l 2014
Fal l 2014
Fal l 2014
Fal l 2012
Fal l 2012
Fal l 2012
Fal l 2013 Fal l 2009 Fal l 2008
Fal l 2008
Fal l 2008
Fal l 2007
Fal l 2007Fal l 2010
Fal l 2015
Fal l 2015
Fal l 2015 Fal l 2007 Fal l 2006
Fal l 2011
Fal l 2011
Fal l 2011
Fal l 2010
Fal l 2010
Fal l 2013 Fal l 2009
Fal l 2009Fal l 2013
Fal l 2006
108 | P a g e

Lone Star College Statistical Supplement 17Transfers to Senior Institutions(Includes only public senior colleges in Texas)(unaudited)
Transfer Transfer Transfer Total of all % of allStudent Student Student Lone Star Lone StarCount Count Count Transfer Transfer
Academic Technical Tech-Prep Students StudentsUniversity of Houston 3,534 179 30 3,743 21.7%Sam Houston State University 2,703 182 32 2,917 16.9%Texas A&M University 2,317 101 23 2,441 14.1%University of Houston - Downtown 1,908 129 13 2,050 11.9%The University of Texas at Austin 1,255 58 16 1,329 7.7%Texas State University - San Marcos 911 30 9 950 5.5%Texas Tech University 590 33 9 632 3.7%Prairie View A&M University 440 37 9 486 2.8%Stephen F. Austin State University 429 12 5 446 2.6%The University of Texas at San Antonio 320 11 2 333 1.9%Texas Southern University 289 32 321 1.9%University of North Texas 211 11 3 225 1.3%The University of Texas at Arlington 196 39 2 237 1.4%The University of Texas at Dallas 145 1 1 147 0.9%University of Houston - Victoria 142 16 3 161 0.9%Texas Woman's University 118 2 2 122 0.7%Texas A&M University at Galveston 117 3 1 121 0.7%Lamar University 108 16 2 126 0.7%Texas A&M University - Corpus Christi 85 5 1 91 0.5%The University of Texas at Tyler 65 2 67 0.4%University of Houston - Clear Lake 63 7 70 0.4%Tarleton State University 45 2 2 49 0.3%Texas A&M University - Commerce 33 8 41 0.2%West Texas A&M University 28 7 35 0.2%Texas A&M University - Kingsvil le 23 2 25 0.1%Midwestern State University 18 4 1 23 0.1%The University of Texas of the Permian Basin 14 3 17 0.1%The University of Texas - Pan American 14 1 15 0.1%Angelo State University 11 1 12 0.1%The University of Texas at El Paso 9 3 12 0.1%Texas A&M International University 6 6 0.0%Texas A&M University - San Antonio 5 5 0.0%The University of Texas at Brownsvil le 1 1 2 0.0%Sul Ross State University 3 3 0.0%Grand Total 16,153 941 166 17,260 100.00%
Includes only Texas public institutionsSource:Texas Higher Education Data, ASALFS Students Pursuing Additional Education
109 | P a g e

Lone Star College Statistical Supplement 18Capital Asset InformationLast Ten Fiscal Years(unaudited)
2015 2014 2013 2012 2011 2010 2009 2008 2007 2006
Building Use Square Footage (in thousands)
Instruction/Student Services 3,140 3,106 2,994 2,969 2,969 2,080 2,080 1,814 1,814 1,814Safety, Facilities Systems 103 103 103 103 103 95 58 41 41 41Libraries 351 351 351 351 351 351 351 351 351 351Public Service 105 105 105 105 105 105 105 105 105 105Auxiliary Services 36 36 36 36 36 29 29 29 29 29Institutional Support 145 145 145 145 145 145 145 145 145 145Mixed Use 222 222 222 222 222 222 222 0 0 0
Dining Facilities Square footage (in thousands) 91 91 91 91 91 91 55 55 55 55 Average daily customers 4,550 4,550 4,550 4,550 4,300 4,100 3,900 3,900 3,900 N/A
Athletic Facilities Square footage (in thousands) 112 112 112 112 112 112 112 112 112 112 Stadiums (number of buildings) - - - - - - - - - - Gymnasiums (number of buildings) - - - - - - - - - - Fitness Centers (number of buildings) 7 7 7 6 6 6 6 6 6 6 Tennis Court (number of courts) 32 32 32 32 32 32 32 32 32 32
Transportation Cars 24 27 25 26 15 15 15 15 16 16 Light Trucks/Vans 50 42 37 33 20 20 20 20 17 17 Buses - - - - - - - - - -
Fiscal Year
110 | P a g e

SINGLE AUDIT SECTION
111 | P a g e

REPORT ON INTERNAL CONTROL OVER FINANCIAL REPORTING AND ON COMPLIANCE AND OTHER MATTERS BASED ON AN AUDIT
OF FINANCIAL STATEMENTS PERFORMED IN ACCORDANCE WITH GOVERNMENT AUDITING STANDARDS
Independent Auditors’ Report
To the Board of Trustees Lone Star College The Woodlands, Texas We have audited, in accordance with the auditing standards generally accepted in the United States of America and the standards applicable to financial audits contained in Government Auditing Standards issued by the Comptroller General of the United States, the financial statements of Lone Star College (the “College”), as of and for the year ended August 31, 2015, and the related notes to the financial statements, which collectively comprise the College’s basic financial statements, and have issued our report thereon dated December 3, 2015. Internal Control over Financial Reporting In planning and performing our audit of the financial statements, we considered the College's internal control over financial reporting (internal control) to determine the audit procedures that are appropriate in the circumstances for the purpose of expressing our opinion on the financial statements, but not for the purpose of expressing an opinion on the effectiveness of the College’s internal control. Accordingly, we do not express an opinion on the effectiveness of the College’s internal control. A deficiency in internal control exists when the design or operation of a control does not allow management or employees, in the normal course of performing their assigned functions, to prevent, or detect and correct, misstatements on a timely basis. A material weakness is a deficiency, or a combination of deficiencies, in internal control, such that there is a reasonable possibility that a material misstatement of the College’s financial statements will not be prevented, or detected and corrected on a timely basis. A significant deficiency is a deficiency, or a combination of deficiencies, in internal control that is less severe than a material weakness, yet important enough to merit attention by those charged with governance. Our consideration of internal control was for the limited purpose described in the first paragraph of this section and was not designed to identify all deficiencies in internal control that might be material weaknesses or significant deficiencies. Given these limitations, during our audit we did not identify any deficiencies in internal control that we consider to be material weaknesses. However, material weaknesses may exist that have not been identified.
112 | P a g e

To the Board of Trustees Lone Star College The Woodlands, Texas
Compliance and Other Matters
As part of obtaining reasonable assurance about whether the College's financial statements are free from material misstatement, we performed tests of its compliance with certain provisions of laws, regulations, contracts, and grant agreements, noncompliance with which could have a direct and material effect on the determination of financial statement amounts. However, providing an opinion on compliance with those provisions was not an objective of our audit, and accordingly, we do not express such an opinion. The results of our tests disclosed no instances of noncompliance or other matters that are required to be reported under Government Auditing Standards.
Purpose of this Report
The purpose of this report is solely to describe the scope of our testing of internal control and compliance and the results of that testing, and not to provide an opinion on the effectiveness of the College’s internal control or on compliance. This report is an integral part of an audit performed in accordance with Government Auditing Standards in considering the College’s internal control and compliance. Accordingly, this communication is not suitable for any other purpose.
Houston, Texas December 3, 2015
113 | P a g e
REPORT ON COMPLIANCE FOR EACH MAJOR PROGRAM AND ON INTERNAL CONTROL OVER COMPLIANCE REQUIRED BY OMB CIRCULAR A-133
AND STATE OF TEXAS SINGLE AUDIT CIRCULAR
Independent Auditors’ Report To the Board of Trustees Lone Star College The Woodlands, Texas Report on Compliance for Each Major Federal and State Program We have audited Lone Star College’s (the “College”) compliance with the types of compliance requirements described in the OMB Circular A-133 Compliance Supplement and State of Texas Single Audit Circular that could have a direct and material effect on each of the College’s major federal and state programs for the year ended August 31, 2015. The College’s major federal and state programs are identified in the summary of auditor’s results section of the accompanying schedule of findings and questioned costs. Management’s Responsibility Management is responsible for compliance with the requirements of laws, regulations, contracts, and grants applicable to its federal and state programs. Auditor’s Responsibility Our responsibility is to express an opinion on compliance for each of the College’s major federal and state programs based on our audit of the types of compliance requirements referred to above. We conducted our audit of compliance in accordance with auditing standards generally accepted in the United States of America; the standards applicable to financial audits contained in Government Auditing Standards, issued by the Comptroller General of the United States; and OMB Circular A-133, Audits of States, Local Governments, and Non-Profit Organizations and the State of Texas Single Audit Circular. Those standards, OMB Circular A-133, and State of Texas Single Audit Circular require that we plan and perform the audit to obtain reasonable assurance about whether noncompliance with the types of compliance requirements referred to above that could have a direct and material effect on a major federal or state program occurred. An audit includes examining, on a test basis, evidence about the College’s compliance with those requirements and performing such other procedures as we considered necessary in the circumstances. We believe that our audit provides a reasonable basis for our opinion on compliance for each major federal and state program. However, our audit does not provide a legal determination of the College’s compliance.
114 | P a g e

To the Board of Trustees Lone Star College The Woodlands, Texas
Opinion on Each Major Federal and State Program
In our opinion, the College complied, in all material respects, with the types of compliance requirements referred to above that could have a direct and material effect on each of its major federal and state programs for the year ended August 31, 2015.
Report on Internal Control over Compliance
Management of the College is responsible for establishing and maintaining effective internal control over compliance with the types of compliance requirements referred to above. In planning and performing our audit of compliance, we considered the College’s internal control over compliance with the types of requirements that could have a direct and material effect on each major federal and state program to determine the auditing procedures that are appropriate in the circumstances for the purpose of expressing an opinion on compliance for each major federal and state program and to test and report on internal control over compliance in accordance with OMB Circular A-133 and State of Texas Single Audit Circular, but not for the purpose of expressing an opinion on the effectiveness of internal control over compliance. Accordingly, we do not express an opinion on the effectiveness of the College’s internal control over compliance.
A deficiency in internal control over compliance exists when the design or operation of a control over compliance does not allow management or employees, in the normal course of performing their assigned functions, to prevent, or detect and correct, noncompliance with a type of compliance requirement of a federal or state program on a timely basis. A material weakness in internal control over compliance is a deficiency, or combination of deficiencies, in internal control over compliance, such that there is a reasonable possibility that material noncompliance with a type of compliance requirement of a federal or state program will not be prevented, or detected and corrected, on a timely basis. A significant deficiency in internal control over compliance is a deficiency, or a combination of deficiencies, in internal control over compliance with a type of compliance requirement of a federal or state program that is less severe than a material weakness in internal control over compliance, yet important enough to merit attention by those charged with governance.
Our consideration of internal control over compliance was for the limited purpose described in the first paragraph of this section and was not designed to identify all deficiencies in internal control over compliance that might be material weaknesses or significant deficiencies. We did not identify any deficiencies in internal control over compliance that we consider to be material weaknesses. However, material weaknesses may exist that have not been identified.
The purpose of this report on internal control over compliance is solely to describe the scope of our testing of internal control over compliance and the results of that testing based on the requirements of OMB Circular A-133 and State of Texas Single Audit Circular. Accordingly, this report is not suitable for any other purpose.
Houston, Texas December 3, 2015
115 | P a g e

Schedule of Findings and Questioned Cost
116 | P a g e
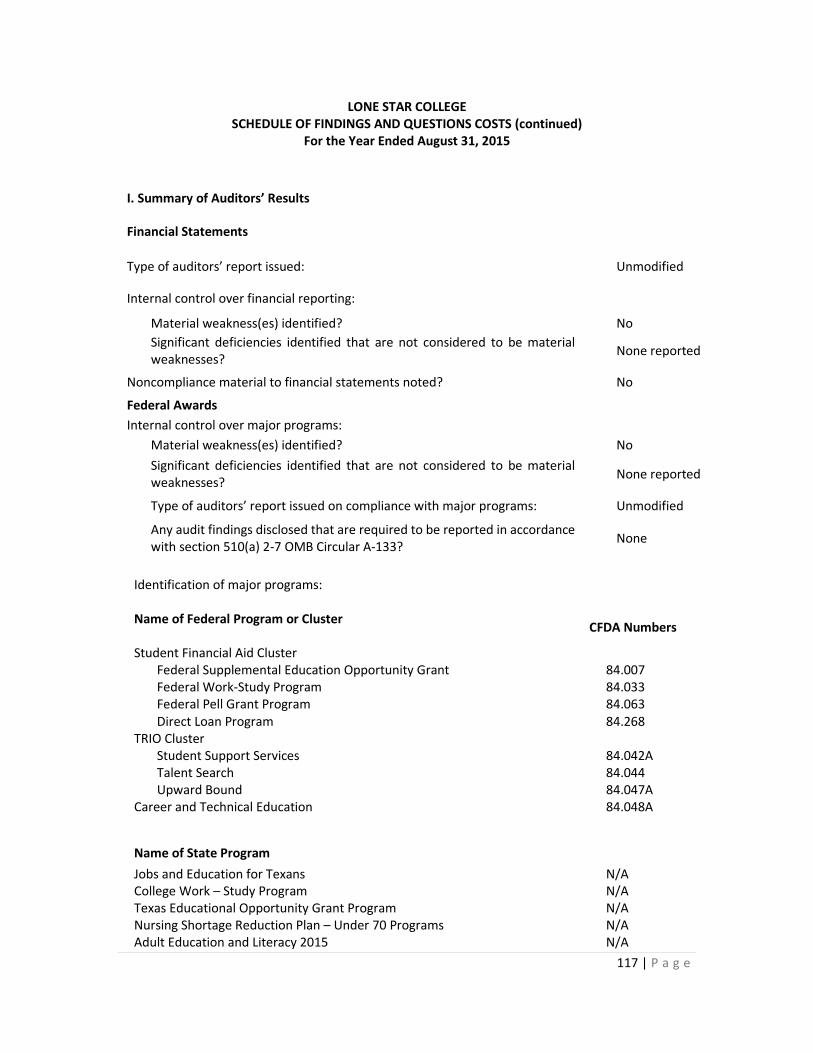
LONE STAR COLLEGE
SCHEDULE OF FINDINGS AND QUESTIONS COSTS (continued) For the Year Ended August 31, 2015
I. Summary of Auditors’ Results
Financial Statements
Type of auditors’ report issued: Unmodified
Internal control over financial reporting:
Material weakness(es) identified? No Significant deficiencies identified that are not considered to be material weaknesses? None reported
Noncompliance material to financial statements noted? No
Federal Awards Internal control over major programs:
Material weakness(es) identified? No Significant deficiencies identified that are not considered to be material weaknesses? None reported
Type of auditors’ report issued on compliance with major programs: Unmodified
Any audit findings disclosed that are required to be reported in accordance with section 510(a) 2-7 OMB Circular A-133? None
Identification of major programs: Name of Federal Program or Cluster CFDA Numbers
Student Financial Aid Cluster Federal Supplemental Education Opportunity Grant 84.007 Federal Work-Study Program 84.033 Federal Pell Grant Program 84.063 Direct Loan Program 84.268
TRIO Cluster Student Support Services 84.042A Talent Search 84.044 Upward Bound 84.047A
Career and Technical Education 84.048A
Name of State Program Jobs and Education for Texans N/A College Work – Study Program N/A Texas Educational Opportunity Grant Program N/A Nursing Shortage Reduction Plan – Under 70 Programs N/A Adult Education and Literacy 2015 N/A
117 | P a g e
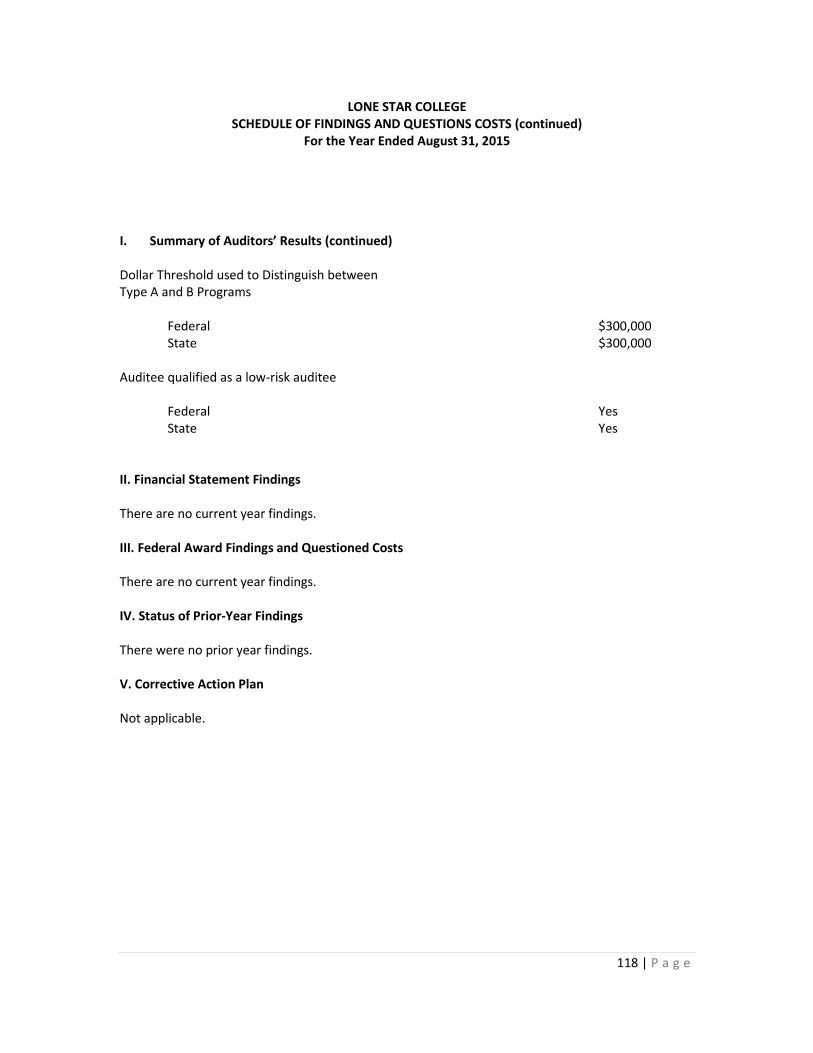
LONE STAR COLLEGE
SCHEDULE OF FINDINGS AND QUESTIONS COSTS (continued) For the Year Ended August 31, 2015
I. Summary of Auditors’ Results (continued)
Dollar Threshold used to Distinguish between Type A and B Programs Federal $300,000 State $300,000 Auditee qualified as a low-risk auditee Federal Yes State Yes II. Financial Statement Findings There are no current year findings. III. Federal Award Findings and Questioned Costs There are no current year findings. IV. Status of Prior-Year Findings There were no prior year findings. V. Corrective Action Plan Not applicable.
118 | P a g e

Lone Star College 5000 Research Forest Drive
The Woodlands, Texas 77381-4356 (832)-813-6500
www.lonestar.edu
119 | P a g e