fish and wildlife research institute …aquaticcommons.org/121/1/tr10_c.pdf · table 2 barge...
TRANSCRIPT

FWRI Technical Report TR-10 2006
TECHNICAL REPORTS
Florida Fish and WildlifeConservation Commission
A Regional Assessment of Florida Manatees (Trichechus manatus latirostris) and the
Caloosahatchee River, FloridaSara L. McDonald and Richard O. Flamm
FISH AND WILDLIFE RESEARCH INSTITUTE
TECHNICAL REPORTS
ISSN 1930-1448

Jeb BushGovernor of Florida
Florida Fish and Wildlife Conservation Commission
Kenneth D. HaddadExecutive Director
The Fish and Wildlife Research Institute (FWRI) is a division of the Florida Fish and WildlifeConservation Commission (FWC). The FWC is “managing fish and wildlife resources for theirlong-term well-being and the benefit of people.” The FWRI conducts applied research perti-nent to managing marine-fishery resources and marine species of special concern in Florida.
Programs at the FWRI focus on resource-management topics such as managing gamefish andshellfish populations, restoring depleted fish stocks and the habitats that support them,protecting coral reefs, preventing and mitigating oil-spill damage, protecting endangered andthreatened species, and managing coastal-resource information.
The FWRI publishes three series: Memoirs of the Hourglass Cruises, Florida Marine Research Pub-lications, and FWRI Technical Reports. FWRI Technical Reports contain information relevant toimmediate resource-management needs.
Gil McRae, FWRI Director
James F. Quinn, Jr., Science Editor
Judith G. Leiby, Copy Editor
Llyn C. French, Publications Production

A Regional Assessment of Florida Manatees(Trichechus manatus latirostris) and the
Caloosahatchee River, Florida
Sara L. McDonaldRichard O. Flamm
Florida Fish and Wildlife Conservation CommissionFish and Wildlife Research Institute
100 Eighth Avenue SoutheastSt. Petersburg, Florida 33701
Florida Fish and Wildlife Conservation CommissionFWRI Technical Report TR-10
2006

Cover Photographs
Aerial photography composite of the Caloosahatchee RiverFlorida Fish and Wildlife Conservation Commission, Fish and Wildlife Research Institute
Upper inset: Oblique aerial photograph of canals in Cape CoralPhoto courtesy of South Florida Water Management District
Lower inset: Underwater view of manatee and boat propellerFlorida Fish and Wildlife Conservation Commission, Fish and Wildlife Research Institute archives
Copies of this document may be obtained from
Florida Fish and Wildlife Conservation CommissionFish and Wildlife Research Institute
100 Eighth Avenue SESt. Petersburg, FL 33701-5020
Attn: Librarian
Document Citation
McDonald, S. L., and R. O. Flamm. 2006. A Regional Assessment of Florida Manatees (Trichechus manatus latirostris) and the Caloosahatchee River, Florida. Florida Fish and Wildlife Conservation Commission FWRI Technical Report TR-10. iv + 52 pp.
Document Production
This document was composed in Microsoft Word® and produced using QuarkXPress® on Apple Macintosh®
computers.The headline font is Adobe® Avant Garde, the text font is Adobe® Palatino, and the cover headlineis Adobe® Gill Sans.
The cover and text papers used in this publication meet the minimum requirements of the AmericanNational Standard for Permanence of Paper for Printed Library Materials Z39.48—1992.

Table of Contents
EXECUTIVE SUMMARY . . . . . . . . . . . . . . . . . . . . . . . . . . . . . . . . . . . . 1
INTRODUCTION . . . . . . . . . . . . . . . . . . . . . . . . . . . . . . . . . . . . . . 1
REVIEW OF VESSEL ACTIVITY . . . . . . . . . . . . . . . . . . . . . . . . . . . . . . . . . 7
HABITAT INFORMATION . . . . . . . . . . . . . . . . . . . . . . . . . . . . . . . . . . . 11
PLACES AND CORRIDORS: A SUMMARY OF TELEMETRY INFORMATION . . . . . . . . . . . . . . . . 19MANATEE MORTALITY. . . . . . . . . . . . . . . . . . . . . . . . . . . . . . . . . . . . 25MANATEE DISTRIBUTION AND RELATIVE ABUNDANCE DATA COLLECTED USING AERIAL SURVEYS . . . . 37CONCLUSIONS . . . . . . . . . . . . . . . . . . . . . . . . . . . . . . . . . . . . . . . 45ACKNOWLEDGMENTS . . . . . . . . . . . . . . . . . . . . . . . . . . . . . . . . . . . . 48LITERATURE CITED . . . . . . . . . . . . . . . . . . . . . . . . . . . . . . . . . . . . . 48
LIST OF TABLES
Table 1 Estimates of manatee life-history traits and related statistics . . . . . . . . . . . . . 3Table 2 Barge traffic servicing the FPL Ft. Myers power plant, 1997–2002 . . . . . . . . . . . . 8Table 3 Breakdown of annual manatee deaths statewide, 1976–2001 . . . . . . . . . . . . . . 27Table 4 Breakdown of annual manatee deaths in the East Region, 1976–2001 . . . . . . . . . . 29Table 5 Breakdown of annual manatee deaths in the Mid Region, 1976–2001 . . . . . . . . . . 30Table 6 Breakdown of annual manatee deaths in the West Region, 1976–2001. . . . . . . . . . 31Table 7 Annual rates of increase of manatee deaths in all regions combined, in each region,
statewide, and in southwestern Florida . . . . . . . . . . . . . . . . . . . . . . . 32Table 8 Trends in manatee deaths, calculated as weighted means . . . . . . . . . . . . . . . 33Table 9 Manatee deaths in each region and statewide, during two equal time periods . . . . . . 33Table 10 Causes of death by season in all three regions combined . . . . . . . . . . . . . . . 34Table 11 Number and percentage of manatee deaths in each cause-of-death category . . . . . . 36Table 12 Highest manatee counts recorded during synoptic aerial surveys in Lee County. . . . . 38Table 13 Manatee counts and relative seasonal density determined from distribution
aerial surveys . . . . . . . . . . . . . . . . . . . . . . . . . . . . . . . . . . 40Table 14 Monthly counts of manatees observed in each region during distribution aerial surveys . 41
LIST OF FIGURES
Figure 1 Caloosahatchee River from the mouth to the W.P. Franklin Lock and Dam, Estero Bay,and Matlacha Pass . . . . . . . . . . . . . . . . . . . . . . . . . . . . . . . . 2
Figure 2 Statewide industrial warm-water sites where manatees aggregate . . . . . . . . . . . 5Figure 3 Travel corridors used heavily by watercraft . . . . . . . . . . . . . . . . . . . . . 9Figure 4 Boat-launch sites along the lower Caloosahatchee River . . . . . . . . . . . . . . . 10Figure 5 Average January water temperatures (degrees C) at the W.P. Franklin Lock and Dam,
FPL intake pipe, and FPL discharge canal, 2000–2002 . . . . . . . . . . . . . . . . . 12Figure 6 Authorized National Pollutant Discharge Elimination System locations for the
Caloosahatchee River, updated through April 2002 . . . . . . . . . . . . . . . . . . 13Figure 7 Secondary manatee-aggregation areas along the Caloosahatchee River. . . . . . . . . 14Figure 8 Seagrass distribution in San Carlos Bay, Matlacha Pass, and a portion of Pine Island
Sound, 1999 . . . . . . . . . . . . . . . . . . . . . . . . . . . . . . . . . . . 15Figure 9 Seagrass and SAV distribution in the Caloosahatchee River and Estero Bay under
optimum conditions . . . . . . . . . . . . . . . . . . . . . . . . . . . . . . . 16
i
ii
Figure 10 Salinity gradient of the Caloosahatchee River estuary during periods of low freshwater inflow . . . . . . . . . . . . . . . . . . . . . . . . . . . . . . . . . . . . . . 17
Figure 11 Salinity gradient of the Caloosahatchee River estuary during periods of high freshwater inflow . . . . . . . . . . . . . . . . . . . . . . . . . . . . . . . . . . . . . . 18
Figure 12 Bathymetry of the Caloosahatchee River estuary, San Carlos Bay, and Matlacha Pass . . . 19Figure 13 Winter (December–February) travel paths of eight satellite-tagged manatees, 1991–1996 . 21Figure 14 Warm-season (March–November) travel paths of nine satellite-tagged manatees,
1991–1996 . . . . . . . . . . . . . . . . . . . . . . . . . . . . . . . . . . . . 22Figure 15 Manatee places and corridors in and around the Caloosahatchee River, derived
from satellite- and radio-telemetry data of 26 manatees between 1991 and 2001 . . . . . 23Figure 16 Manatee places and corridors between the Edison Bridge and Shell Point, derived
from satellite- and radio-telemetry data of 26 manatees between 1991 and 2001 . . . . . 24Figure 17 Trends in statewide manatee deaths (all causes, including and excluding red tide)
from 1976 to 2001 . . . . . . . . . . . . . . . . . . . . . . . . . . . . . . . . . 26Figure 18 Manatee carcass recovery locations from 1976 to 2001 in the study area . . . . . . . . . 28Figure 19 Trends in manatee deaths in the study area from 1976 to 2001 . . . . . . . . . . . . . 35Figure 20 Total number of manatee carcasses by month in the study area between 1976 and 2001 . . 35Figure 21 Trends in watercraft-related manatee deaths in the study area, 1976–1988
and 1989–2001 . . . . . . . . . . . . . . . . . . . . . . . . . . . . . . . . . . 37Figure 22 Flight route for distribution aerial surveys of manatees, October 1994–November
1995 and January–December 1997 . . . . . . . . . . . . . . . . . . . . . . . . . 39Figure 23 Average manatee count per survey in each region of the Caloosahatchee River,
December 1994–November 1995 and January–December 1997 . . . . . . . . . . . . . 40Figure 24 Average monthly manatee count per survey of all three regions combined,
December 1994–November 1995 and January–December 1997 . . . . . . . . . . . . . 40Figure 25 Results of applying a variable-shape spatial filter to a point coverage of winter
aerial surveys (all regions), December 1994–February 1995 and January, February,and December 1997 . . . . . . . . . . . . . . . . . . . . . . . . . . . . . . . . 42
Figure 26 Results of applying a variable-shape spatial filter to a point coverage of winter aerial surveys (Mid Region), December 1994–February 1995 and January, February,and December 1997 . . . . . . . . . . . . . . . . . . . . . . . . . . . . . . . . 43
Figure 27 Results of applying a variable-shape spatial filter to a point coverage of warm-season aerial surveys (all regions) conducted March–November 1995 and March–November 1997 . . . . . . . . . . . . . . . . . . . . . . . . . . . . . . . . . . . . . . . 44
Figure 28 Results of applying a variable-shape spatial filter to a point coverage of warm-season aerial surveys (Mid Region), March–November 1995 and March–November 1997 . . . . 45
Figure 29 Locations of manatees sighted during survey flights between the mouth of the Caloosa-hatchee River and the W.P. Franklin Lock and Dam, February–May 2002 . . . . . . . . 46

Introduction
The State of Florida has a history of protecting theFlorida manatee (Trichechus manatus latirostris) datingback to the late 19th century. Currently, the most com-mon regulatory mechanism implemented to protectmanatees is the designation of speed zones in Floridawaterways. Regulations are proposed based on thebest available information, such as manatee mortality,distribution, habitat, and other relevant data for anarea. A regional assessment is one mechanism for pro-viding comprehensive information to managers whenthey evaluate existing or future regulation of an area.
The regional assessment detailed in this reportexamines manatee use of the Caloosahatchee River inLee County, Florida, between the W.P. Franklin Lockand Dam and Matlacha Pass (including San CarlosBay). We examined human use of the river, habitatfeatures, large and fine-scale manatee movements(from telemetry data), manatee distribution and rela-tive abundance (from aerial survey data), and mana-tee deaths (from FWC carcass recovery data).
History of the Caloosahatchee River
Prior to the late 19th century, the Caloosahatchee Riverwas a meandering waterway that ran from Lake Flirtto San Carlos Bay (Gunter and Hall, 1962; Kimes andCrocker, 1998). In 1881, dredging began to connect theriver’s headwaters with Lake Okeechobee (Scholleand Foster, 1999).This procedure caused severe flood-ing downstream, especially during the hurricane sea-son.To mitigate the flooding effects, various spillways,locks, and dams were constructed, including the locksat Moore Haven and Ortona. In 1947, the Central andSouthern Florida (C&SF) Project was authorized tomanage the flood-control system and water-supplyissues of the Caloosahatchee River basin. The C&SFproject involved widening and straightening the riverand constructing the Olga Lock and Dam (now knownas the W.P. Franklin Lock and Dam).The river today is65 miles long with a 25-foot-deep channel. Figure 1 de-picts the river from the mouth to the Franklin Lock andDam.
FWRI Technical Report TR-10 1
A Regional Assessment of Florida Manatees(Trichechus manatus latirostris) and the
Caloosahatchee River, Florida
Executive SummaryWe used a “weight-of-evidence”approach to provide environmental managers with a comprehensive analysis ofFlorida manatee use of the Caloosahatchee River, Florida, and the surrounding area. A “weight-of-evidence”analy-sis is a qualitative approach to synthesizing information and data from a variety of sources to increase our un-derstanding of complex relationships.We examined human use of the river, habitat features, large- and fine-scalemanatee movements (from telemetry data), manatee distribution and relative abundance (from aerial survey data),and manatee deaths (from FWC carcass-recovery data).The section of the river between Shell Point and the EdisonBridge (Mid Region) is an important travel corridor between the secondary warm-water and feeding areas westof Shell Point (West Region) and the feeding, resting, and primary warm-water areas east of the Edison Bridge(East Region).The importance of each region changes seasonally. Manatee use of the East Region is highest dur-ing winter (December–February). While traveling up- or downriver, manatees appear to use shallow areas nearseawalls for feeding, drinking, resting, or thermoregulation. Data indicate that manatees usually travel relativelyclose to the shoreline and cross the river in the narrow areas of Redfish Point and Shell Point.While en route, man-atees sometimes stop at secondary aggregation areas. Over the past 13 years, carcass recovery locations have shownthat watercraft-related manatee deaths have increased at a faster rate in the study area than in either southwesternFlorida or statewide.The evidence suggests that the East Region may be a sink for fatally injured manatees in win-ter. Because large numbers of both manatees and boats occur at the river mouth, San Carlos Bay, Redfish Point,and Matlacha Pass, manatees are more likely to be harmed by boats in these locations than they are in other portionsof the study area.

The Study Area
The study area includes San Carlos Bay, Matlacha Pass,and the Caloosahatchee River eastward to the FranklinLock and Dam.The area from the Edison Bridge to theFranklin Lock and Dam is referred to here as the EastRegion, the area of the Caloosahatchee River fromShell Point to the Edison Bridge is the Mid Region, andthe area west of Shell Point (San Carlos Bay and Mat-lacha Pass) is the West Region.
The Florida Manatee
The Florida manatee (Trichechus manatus latirostris) isone of two subspecies of the West Indian manatee (T.manatus). Florida manatees are native to Florida, withfossil evidence dating back 2–3 million years. Manateesinhabit the southeastern United States, principally oc-cupying the marine, estuarine, and freshwater inlandwaters of Florida. They are relatively solitary, herbiv-orous marine mammals, but they will aggregate inareas with critical resources, such as warm water, freshwater, quiet resting areas, and submerged and emer-gent aquatic vegetation (marine and freshwater).
Life History
Like most large mammals, manatees have a potentiallylong life span, mature slowly, are slow to reproduce, andhave a high parental investment (O’Shea et al., 1995;USFWS, 2001). As a consequence of these characteris-tics, the manatee population is vulnerable to high mor-tality rates, especially to high rates of adult mortality(Eberhardt and O’Shea, 1995; Marmontel et al., 1997).Table 1 summarizes manatee life-history traits.
Feeding
Manatees feed on a variety of marine, freshwater, andterrestrial plants. Common forage species includeshoalgrass (Halodule wrightii), manateegrass (Sy-ringodium filiforme), turtlegrass (Thalassia testudinum),tapegrass (Vallisneria americana), and widgeongrass(Ruppia maritima) (Hartman, 1979; Packard, 1981; Bengt-son, 1981, 1983; Ledder, 1986; Lefebvre and Powell,1990; Smith, 1993; Lefebvre et al., 2000). Manatees feedon seagrass plant parts both above and below the sed-iment, depending upon the type of substrate and theplant species. Feeding strategy may also depend on veg-etation density. Rooting behavior was observed indense seagrass meadows, whereas grazing has been re-ported along the edges of previously grazed, sparsebeds (Packard, 1981; Lefebvre and Powell, 1990; Smith,1993; Lefebvre et al.,, 2000). Manatees have also beendocumented feeding on the edges of seagrass bedsnear deep water (Bengtson, 1981; Packard, 1981; Lefeb-vre and Frohlich, 1986). Such edges may provide for-age-species diversity, access to escape routes, or both(Packard, 1981; Lefebvre and Frohlich, 1986; Smith,1993). Ledder (1986), Lefebvre and Powell (1990), andLefebvre et al. (2000) reported that manatees showeda preference for shoalgrass. Hartman (1979) reportedmanatees selectively foraged on young tapegrass infreshwater systems.
Bengtson (1983) found that foraging duration de-pended upon season. Manatees spent less time foragingin spring than fall, presumably because of the higher-quality vegetation associated with spring growth and fewer physiological demands on the manatees(Bengtson, 1983).
Threats—Anthropogenic
According to the U.S. Census Bureau (2001), Florida’shuman population increased by 23% between 1990and 2000, and projections suggest the population ofFlorida will increase by 5.5 million people over thenext 25 years.To meet the increased demand for waterthat a growth in human population will entail, it islikely that spring flows and water quality will decline.If human demands on the aquifer at Blue Spring in-crease as projected, by 2010 the flow may not be suffi-cient to provide adequate thermal refuge for themanatee population that uses the run during winter(Reynolds, 2000). Another likely effect of an increasinghuman population will be additional sewage and non-point-source runoff, both of which reduce water clar-ity, causing a decline in the health and abundance ofsubmerged aquatic vegetation (SAV) (Stevenson et al.,1993). For most of the year, the availability of SAV does
Caloosahatchee Manatees McDonald and Flamm
2 FWRI Technical Report TR-10
Figure 1 Caloosahatchee River from the mouth to the W.P. FranklinLock and Dam, Estero Bay, and Matlacha Pass.

not seem to be a limiting factor for manatees. Duringcold weather, however, manatees require forage asso-ciated with warm-water aggregation sites. Withoutconservation measures to protect these winter habitats,manatees would have to travel greater distances, ag-gregate into smaller areas, and forage in suboptimalenvironments.
From 1976 to 2001, watercraft collisions accountedfor approximately 25% of all manatee deaths and werethe single greatest human-related cause of manateemortality (FWC, unpublished data). In 2001, there weremore than 943,000 registered vessels in Florida (FWC,http://myfwc.com/law/boating), and every winter manythousands of out-of-state boaters visit Florida. Thenumber of registered vessels in Florida has increasedby an average of 2.9% per year during the past 25 years
(FWC, unpublished data). Given that about 97% ofregistrations are for recreational watercraft (Wright etal., 1995), it can be expected that there will be a con-tinued increase in the use of recreational vessels on thewaterways of Florida as the human population in-creases. In addition to the expected increase in boatnumbers during the coming century, there are otherfactors that may act synergistically to increase the riskof fatal collisions between manatees and watercraft.Relatively new modifications to the design of vesselhulls and engines allow boats to travel at higher speedsin shallower waters (Wright et al., 1995), thus threat-ening manatees and scarring seagrass beds. Unfortu-nately, boater compliance with existing slow-speedzones is inconsistent (Gorzelany, 1998; Shapiro, 2001).
Although manatees seem to have adapted to urban
McDonald and Flamm Caloosahatchee Manatees
FWRI Technical Report TR-10 3
Table 1 Estimates of manatee life-history traits and related statistics. Except as noted, information was obtained from O’Shea et al., 1995 (table modified from USFWS, 2001).
Life-History Trait Data
Maximum determined age 59 yearsGestation 11–14 monthsLitter size 1% twins Upper St. Johns River 1.79%
Northwest 1.40%Sex ratio at birth 1:01Calf survivala Upper St. Johns River, 1st year 0.810 (0.727–0.873)
Upper St. Johns River, 2nd Year 0.915 (0.827–0.960)Annual adult survivala Atlantic coast 0.937 (0.008) SE
Upper St. Johns River 0.960 (0.011) SENorthwest 0.956 (0.007) SESouthwest 0.908 (0.019) SE
Age at first pregnancy (female) 3–4 yearsMean age at first reproduction (female) 5 yearsAge at spermatogenesis (male) 2–3 yearsProportion pregnant Salvaged carcasses 33%
Upper St. Johns River (photo-ID) 41%Proportion nursing, 1st-year calves during winter Mean 36%
Upper St. Johns River 30%Northwest 36%Atlantic coast 38%
Calf dependency 1.2 yearsInterbirth interval 2.5 yearsHighest number of births May–SeptHighest frequency in mating herds Feb–JulyNo. verified carcasses in Floridab 5,183 (1974–2003)No. documented in ID catalog >2,000 (1975–2003)Highest minimum count (aerial surveys)b 3,300 in Jan 5–6, 2001
aFrom Langtimm et al., 2004bData provided by the Fish and Wildlife Research Institute, FWC.

Caloosahatchee Manatees McDonald and Flamm
4 FWRI Technical Report TR-10
landscapes by exploiting industrial thermal and fresh-water effluents, marinas, and man-made canals, newdevelopment and more people will add to the numberof vessels on Florida’s waterways. Currently there is nomandatory, statewide boater-education or licensingprogram for anyone older than 21, nor does the staterequire boat-rental businesses to educate customersabout manatee speed zones. In one study at the Ho-mosassa River, rental-boat traffic violated the idlespeed zone at the mouth of the river significantly morethan all other traffic (Shapiro, 2001). Increased vesseltraffic coupled with the lack of a statewide, mandatoryboater education or licensing program and a lack offunding for additional law enforcement could increasethe likelihood of a manatee being struck by a boat.
Sublethal effects of increased vessel traffic and agrowing human population include injury and dis-turbance. Researchers do not know the extent to whichthese sublethal “takes” of manatees affect basic bio-logical functions such as reproduction and feeding.Most adult manatee carcasses bear scars from previ-ous boat strikes, and the healed, skeletal fractures ofsome indicate that they had survived previous trau-matic impacts (Wright et al., 1995). Of the more than1,000 living individuals in the manatee photo-identi-fication database (Beck and Reid, 1995), 97% had scarpatterns from multiple boat strikes (O’Shea et al., 2001).It should be noted that the photo-identification data-base contains only animals with scars or other identi-fiable features. After being struck by a boat, a manateewould have to direct its energetic resources towardhealing and maintenance before it could use them inenergetically expensive activities like reproduction.Nonlethal injuries may reduce the breeding success ofwounded females and may permanently remove someanimals from the breeding population (O’Shea, 1995;Reynolds, 1999).
Increased vessel traffic and human recreationalactivities may disturb manatees by causing them toleave preferred habitats (temporarily or permanently)or to alter biologically important behaviors such asfeeding, suckling, or resting (Powell, 1981; Bucking-ham, 1990; O’Shea, 1995). In Crystal River, Buckingham(1990), Buckingham et al. (1999), and King (2001) doc-umented increased manatee use of sanctuaries at timesof increased boat traffic. King (2001) also reported be-havioral changes of the manatees in response to thepresence of human swimmers.These changes includeddecreased resting and suckling and increased milling,swimming, and cavorting.
Other threats caused by human activities includeentanglement in fishing gear or debris; entrapment orcrushing in water-control structures, locks, and pipes;exposure to contaminants; and incidental ingestion of
debris (Beck and Barros, 1991; Ackerman et al., 1995).Indirect effects from increased vessel traffic include in-creased water turbidity from wake action and declineof seagrass beds due to scarring by propellers (Sargentet al., 1995).
Threats—Natural
Potentially catastrophic, naturally occurring threats tomanatees include exposure to cold temperatures, hur-ricanes, red tide (Karenia brevis) events, and disease.When temperatures drop below 20°C, manatees seekwarm water because they are unable to tolerate pro-longed exposure to temperatures below about 16°C(Irvine, 1983). Since 1974, major spikes in cold-relatedmanatee deaths occurred during the cold winters of1976–77, 1980–81, 1983–84, 1989–90, 1995–96, and 2000–01(O’Shea et al., 1985; Ackerman et al., 1995; FWC, un-published data). Death from exposure to cold can occurby acute exposure (hypothermia) or by chronic expo-sure. Manatees chronically exposed to water temper-atures below 20°C display a range of clinical andpathological signs such as emaciation, edema, atrophyof fats, and dehydration (Bonde et al., 1983; O’Shea etal., 1985; Bossart et al., 2003). Manatee carcasses withevidence of cold-stress often show reduced gastroin-testinal tract activity, a condition that can reduce an an-imal’s buoyancy. Juveniles and subadults are the mostvulnerable to cold-related death (Bonde et al., 1983;O’Shea et al., 1985; Ackerman et al., 1995; Bossart et al.,2003). At these life stages, inexperienced manateesmay not be able to read temperature cues as well as ma-ture animals can, and their small size can magnify themetabolic effects of cold exposure (O’Shea et al., 1985;Worthy et al., 2000). In captive experiments, Worthy etal. (2000) found that smaller manatees were unable toincrease their metabolic rates when exposed to cold,thus rendering them more susceptible to tempera-tures below 20°C.
Although cold-related deaths are a natural occur-rence, potential deregulation of the power industryand deterioration of natural artesian springs threatenmany of the warm-water refuges that manatees useduring the cold season (Reynolds, 2000). Manateesrely on the current network of warm-water sites forrefuge during the cold season (Figure 2). Continuedhigh counts at selected power plants in eastern andsouthwestern Florida highlight the manatee’s depen-dence on this network (Reynolds, 2002). Despite theirdependence on warm water, it has been well docu-mented that manatees will leave these refuges forshort periods to forage in colder water (Hartman, 1974,1979; Bengtson, 1981, 1983; Packard et al., 1989; Bartonand Reynolds, 2001; Edwards et al., 2003). Therefore,

McDonald and Flamm Caloosahatchee Manatees
FWRI Technical Report TR-10 5
managers should continue to identify and preserveareas that provide manatees with warm water as wellas with associated foraging grounds. Following a 1999workshop to discuss the status of warm-water refugia,the United States Fish and Wildlife Service (USFWS)created a Warm Water Task Force. This team of biolo-gists, managers, and industry members is exploring ap-proaches to mitigating the possibility of losing theseimportant habitat areas.
Hurricanes are another type of weather-relatedcatastrophe that can potentially affect manatee popu-lations. In northwestern Florida, adult survival rateswere lower in years with severe storms or hurricanesthan in years without them (Langtimm and Beck, 2003).Severe storms and hurricanes could also result in per-manent, large-scale emigration. In eastern Australia,for example, the simultaneous occurrence of floodingand a cyclone, combined with poor watershed-man-agement practices, resulted in the loss of 1,000 km2 ofseagrass beds and in the mass movement and mortalityof dugongs (Dugong dugon), a sirenian relative of themanatee (Preen and Marsh, 1995).
Manatees on Florida’s west coast are frequently ex-posed to brevetoxin, a potent neurotoxin, during redtide events. Manatees are exposed through inhala-tion and ingestion of the toxin. According to Lands-berg and Steidinger (1998: 97),“a unique combinationof environmental, geographical, and biological fac-tors must co-occur to cause these mortalities.”Thesefactors include high salinity, high concentrations of redtide organisms, co-occurrence of those high concen-trations of red tide organisms and manatees, and longperiods of exposure. Manatees appear to be at high-est risk in coastal southwestern Florida when salini-
ties are higher than 28 ppt and when many manateesdisperse into the algal bloom (Landsberg and Stei-dinger, 1998). West coast manatees are frequently ex-posed to brevetoxin as a consequence of red tideevents. In 1996, 151 manatees died in southwesternFlorida from brevetoxicosis (red tide poisoning).Thisepizootic was particularly detrimental to manateesbecause more adults than any other age class werekilled (Pitchford, 2002). Researchers believe another redtide epizootic killed at least 37 manatees in 1982(O’Shea et al., 1991). In 2002 and 2003 combined, 133manatees were killed by effects of red tide, and in2005, 81 manatees were suspected to have died frombrevetoxicosis.
In addition to red tide, manatees may be exposedto infectious diseases. Spread of such pathogens couldbe particularly rapid during winter, when manatees areconcentrated in warm-water refuges. Large-scale mor-tality events caused by disease or toxins, including oilspills and biotoxins, have decimated other popula-tions of marine mammals, including seals and dol-phins, sometimes eliminating 50% or more of theindividuals (Harwood and Hall, 1990).
Distribution and Movements
Telemetry (via satellite and radio tags) is one tool re-searchers use to study manatee distribution and move-ments. Deutsch et al. (1998) provided a comprehensivereview of satellite- and radio-tracked manatees.Teleme-try studies can help determine long-range movements,rates of travel, travel distances, timing of migrations,and destination places. Radio and satellite tags, how-ever, have limitations. Radio tags are difficult to locate,and tracking is limited to good weather in areas ac-cessible to humans (Deutsch et al., 1998). Historically,satellite tags have not been able to detect fine-scalemovements because of the imprecision associated withthe available technology. In addition, the tag often be-comes submerged or produces low-quality hits whena manatee travels at a quick pace. Despite the limita-tions of telemetry studies, Deutsch et al. (1998) andothers ascertained that manatees are capable of ex-tensive seasonal migrations. They have been able todocument patterns of site-fidelity and important life-history events such as mating and suckling.
In an attempt to reduce the biases of satellitetelemetry, Weigle et al. (2001) and Flamm et al. (2005)have created innovative ways of analyzing data fromtagged manatees.They calculated manatee travel paths,“places,” and corridors based on empirically deter-mined depth-preferences.The manatee travel patternscalculated by Weigle et al. (2001) and Flamm et al. (2005)support the widely established concepts that manatees
Figure 2 Statewide industrial warm-water sites where manateesaggregate.

Caloosahatchee Manatees McDonald and Flamm
6 FWRI Technical Report TR-10
prefer warm-water areas in winter and areas associatedwith fresh water in the remaining three seasons (Hart-man, 1979; Shane, 1984; Rathbun et al., 1990; O’Shea,1995; Reynolds, 1999).
Weigle et al. (2001) and Flamm et al. (2005) alsofound no differences in the travel paths of males, andfemales with calves, or females without calves. How-ever, they reported that travel rates for male manateeswere significantly faster than those of females (with orwithout calves). Moreover, a few males moved almostcontinuously, whereas small females and females withcalves tended to travel shorter distances and remainedat certain locations for protracted periods before re-peating this pattern elsewhere (Weigle et al., 2001).Large females and females without calves traveledmore extensively. On the Atlantic coast, Deutsch et al.(2000) also reported that males traveled at faster rates.
Manatees have adapted well to the urban land-scapes of coastal Florida by using man-made canals andartificial freshwater sources and by consuming exoticspecies of vegetation. Spring marks the dispersal ofmanatees from their winter aggregation areas. In thewarm months, manatees are ubiquitous throughoutFlorida and southern Georgia. Some manatees mayspend the warm season in areas that others occupy dur-ing winter (Deutsch et al., 2000; Weigle et al., 2001).Consequently, management strategies in selected areasmay affect substantial portions of the population.
Population
A workshop on the population biology of the manateewas held in April 2002. Although trends from aerial sur-veys indicated that the manatee population has in-creased during the past few decades (Ackerman, 2002),the use of aerial surveys as an indicator of populationstatus was criticized because biases are associatedwith these methods. The ability of an observer to de-tect the presence of a manatee varies widely and de-pends not only on the observer’s ability or experiencebut also on a suite of variables that include surveyconditions (water clarity, depth, and temperature; glare;cloud cover; wind; sea state; tides; air temperature), lo-cation, time of day, season, number of manatees pre-sent (group size), and manatee behavior (Packard andMulholland, 1983; Lefebvre et al., 1995; O’Shea et al.,2001). Several studies have attempted to quantify thesebiases (Packard and Mulholland, 1983; Packard et al.,1985, 1986; Lefebvre and Kochman, 1991; Garrott et al.,1994). Packard et al. (1985) investigated visibility bias bycomparing aerial counts with ground counts and bycomparing the number of observed radio-tagged an-imals to the number actually present.They found thatvisibility bias changed with habitat type and varied
even when standardized survey techniques were em-ployed. Lefebvre et al. (1995) suggested several ways toimprove aerial survey techniques to increase their util-ity: 1) develop standard sampling protocols for sur-veying aggregation sites, 2) develop standard samplingprotocols for surveying during the warm season, 3)initiate experiments to quantify bias, and 4) develop acorrection factor to account for bias.
In cooperation with Mote Marine Laboratory(MML) and North Carolina State University, scien-tists at the Fish and Wildlife Research Institute (FWRI)have initiated research to quantify biases and developa correction factor for one warm-water refuge (Edwardset al., unpublished). In winter 2002–2003, FWRI com-pleted its fourth and final field season of a study atTampa Electric Company’s (TECO) Big Bend powerplant to develop a calibration factor that will allow re-searchers to correct for biases of surveys flown at thatparticular warm-water source.This study used multi-ple regression analysis, mark-resight sampling, and in-formation about manatee diving behavior to quantifyand assess the effects of visibility and sampling biases.FWRI and MML also recently completed a joint studyto quantify perception bias by using tandem surveysin Sarasota Bay (Koelsch and Ackerman, 2001).
In 1990, the Florida legislature mandated that the[then] Florida Department of Environmental Protec-tion [now FWC, in part] conduct an annual “impartialscientific benchmark census of the manatee popula-tion.”To fulfill this requirement, in 1991 the FWC beganconducting annual synoptic aerial surveys. Becauseof the biases described above, these synoptic surveysare an unreliable gauge of population trends (Acker-man, 1995; Lefebvre et al., 1995; O’Shea et al., 2001;USFWS, 2001). Scientists have been unable to quantifythe relationships between the number of manateescounted on these surveys and the true population size(Ackerman, 1995; Lefebvre et al., 1995; O’Shea et al., 2001;USFWS, 2001).
To create an objective, measurable assessment ofthe status of the manatee population, the USFWS con-vened the Manatee Population Status Working Group(MPSWG). This group of biologists and populationexperts are a subcommittee of the Florida ManateeRecovery Team. In spring 2001, they prepared a man-atee population status statement (MPSWG, 2001).Using the long-term mark-recapture database of pho-tographically identified individuals, the MPSWG cre-ated benchmarks to assess manatee population growthand assist in evaluating the species for the federal gov-ernment’s proposed reclassification of it from endan-gered to threatened.These benchmarks did not involvea population count but rather an estimate of annual sur-vival rates determined through photo-identification

McDonald and Flamm Caloosahatchee Manatees
FWRI Technical Report TR-10 7
and sight-resight analyses.The working group deter-mined that measures of how many individuals survivefrom year to year is a better estimate of population vi-ability than is a minimum threshold population size(USFWS, 2001).
Legislation
Manatees are listed as endangered under the federalEndangered Species Act of 1973 (ESA, 16 U.S.C. 1531et seq.).They are also protected under the federal Ma-rine Mammal Protection Act of 1972 (MMPA,16 U.S.C.1361 et seq.) and the state’s Florida Manatee Sanctu-ary Act (FMSA, FS 370.12). All three statutes protectmanatees by prohibiting their “take.”“Take”is definedsimilarly in all three laws. Essentially, it is illegal to ha-rass, hunt, capture, kill, harm, pursue, shoot, wound,trap, collect, annoy, molest, or disturb a manatee or at-tempt to engage in any such conduct.The MMPA andESA allow the federal government to prohibit activi-ties that will “take”manatees.The USFWS can restrictdevelopment and create manatee speed zones, refuges,and sanctuaries.
Section 4(f) of the federal ESA requires the USFWSto “develop and implement recovery plans for the con-servation of endangered and threatened species.”TheThird Revision of the Florida Manatee Recovery Planwas completed in the fall of 2001.The plan was devel-oped with the assistance of a Recovery Team, a groupof scientists, managers, industry members, and non-governmental organizations (NGOs).The ultimate goalof the plan was to “assure the long-term viability of theFlorida manatee in the wild” (USFWS, 2001: iv). Thiscomprehensive plan details specific tasks aimed atachieving the following objectives: minimize causes ofmanatee disturbance, harassment, injury, and mortal-ity; determine and monitor the status of manatee pop-ulations; protect, identify, evaluate, and monitormanatee habitats; and facilitate manatee recoverythrough public awareness and education. In additionto creating the MPSWG, this Recovery Plan has createdthe Warm Water Task Force, which is a subset of theManatee Habitat Status Working Group (HWG). Thegoal of the HWG is parallel to that of the MPSWG: “to(1)assist managers responsible for protecting habitat;(2) help identify information needs; (3) ensure the im-plementation of tasks needed to identify, monitor, andevaluate habitat; and (4) refine and improve the re-covery criteria that address threats to manatee habi-tat”(USFWS, 2001: 84).
An outgrowth of the Federal Recovery Plan was thedevelopment of Manatee Protection Plans (MPPs) bythe FWC.These plans incorporate manatee protectionmeasures into county comprehensive plans by pro-
viding recommendations for boat-facility sitings, wa-terfront development, and manatee speed zones. A1989 Florida state policy directive required 13 keycounties to create MPPs. Although the FWC had beenresponsible for guiding those creating and for ap-proving these MPPs, it had no legal authority to requirecounties to create such plans. Starting in 2001, theFlorida Legislature stipulated that if a county could notshow significant progress toward development of anMPP, all permits in that county would be suspended.In May 2002, the Florida legislature amended the FMSAto require the 13 key counties to develop MPPs by2004. Moreover, the state now has the authority toidentify additional key counties and require thosecounties to devise MPPs. All MPPs must be approvedby the FWC and become incorporated into countycomprehensive plans.
In addition to approval of MPPs, the FMSA givesthe FWC the authority to create manatee speed zonesand safe havens (FAC Chapter 68C-22).The state is alsoresponsible for working with power companies to in-clude manatee protection measures in their NationalPoint Source Elimination Discharge System (NPDES)permits.The FMSA declared the entire state of Floridaas a manatee sanctuary and established the Save theManatee Trust Fund.This fund subsidizes FWC man-atee research, education, and management programsthrough revenues generated from sales of the mana-tee license tag. Although manatees are also listed as en-dangered under the Florida Endangered Species Act,this list does not confer added protection to the species.
Manatee Use of the Caloosahatchee River
To provide a comprehensive view of manatee use of thestudy area, we conducted an extensive literature searchand reviewed boater use, habitat, aerial survey, teleme-try, and manatee mortality information. We analyzedmanatee, vessel-traffic, and habitat data collected overthe past few decades and recent aerial survey countsfrom spring 2002.
Review of Vessel Activity
Introduction
The 2000 census reported that Lee County had 440,888residents, an increase in the population of 31.6% since1990. In 2000, there were 40,725 registered watercraftin Lee County, of which 39,217 were classified as recre-ational vessels (http://myfwc.com/law/boating). Sev-eral studies have been conducted on vessel activity in

Lee County (Gorzelany, 1998; Sidman and Flamm,2001; Sidman et al., 2000, 2001). Areas of recreationalboating activities, high-use vessel-traffic travel corri-dors, and boating travel origins and destinations wereidentified. In addition, boater compliance with postedspeed zones was examined for 12 sites in the Caloosa-hatchee River. This section summarizes informationfrom these studies on vessel traffic and boater behav-ior in Lee County.
Gorzelany (1998) collected boat traffic, boating ac-tivity, and vessel compliance data using aerial, boat, andland-based surveys. He gathered more than 500 hoursof observational data between September 1997 andAugust 1998 in Lee and Charlotte counties. Sidman andFlamm (2001) and Sidman et al. (2000, 2001) character-ized boaters’behaviors and boating travel-corridors inLee and Charlotte counties using aerial surveys madein 1998, opinions of FWC Division of Law Enforce-ment staff and local boating experts expressed in aseries of meetings in 2000, and responses to telephoneand mail surveys of boaters conducted in 2000.
Vessel Traffic
FUEL BARGE TRAFFICThere is no deepwater port associated with theCaloosahatchee River, and thus, no ship traffic. How-ever, some barge traffic crosses Florida passing throughLake Okeechobee and several locks. The maximumlength of a vessel that can lock though this system is250 feet (K. Estock, U.S. Army Corps of Engineers, per-sonal communication). Because of silting in the riverover the last few years, barges currently can draw onlyabout eight feet (B.Tibble, Florida Power and Light, per-sonal communication).The most frequent ship trafficin the study area has been barges going to and fromthe Florida Power and Light (FPL) power plant near theOrange River. These barges travel from a terminal inBoca Grande, delivering heavy and light oil to thepower plant (Table 2).
OTHER VESSEL TRAFFICIn Lee County, vessel traffic increased as the day pro-gressed, and there were roughly twice the number ofboats on the weekends than on weekdays. Gorzelany(1998) reported that the highest traffic volumes werein spring and the lowest were in winter. Sidman andFlamm (2001) reported that Lee County boaters pre-ferred to use their boats in spring and summer.
Seventy percent of the vessels observed on theCaloosahatchee River were between 16 and 25 feetlong (Gorzelany, 1998). The three most common ves-sel types were open fishermen, ski boats, and yachts.Near Centennial Park (Edison Bridge area), the majorityof the traffic consisted of ski boats. Farther down-stream, San Carlos Bay was dominated by yachts,which accounted for the greatest number of observa-tions (2,654) at any site.Yachts were characterized bytheir enclosed space, which may range from a smallcuddy cabin to larger areas for sleeping and eating.
During aerial surveys over the CaloosahatcheeRiver, Gorzelany (1998) counted the highest total num-ber of vessels in eastern San Carlos Bay, includingMiserable Mile, and the lowest numbers in the mid-upper and upper Caloosahatchee River. In a one-hourinterval, the Miserable Mile location had the highestnumber of vessels observed at any site, with 5.25 dif-ferent vessels passing by per minute. When account-ing for area, eastern San Carlos Bay had the secondhighest density of boats, with 2.15 vessels/km2. Boat traf-fic was most concentrated in the vicinity of tidal inletsand within the Intracoastal Waterway (ICW), MiserableMile, and the lower Caloosahatchee River.
In a study that examined boaters’ behavior prin-cipally in Charlotte Harbor, Sidman and Flamm (2001)noted that the lower Caloosahatchee River had thegreatest boat density and congestion. Specifically, ShellPoint (the confluence of the Caloosahatchee River andSan Carlos Bay) and the area immediately southwestof the Edison Bridge west to San Carlos Bay were iden-tified as high-use boating-travel corridors (Figure 3).
Sources and Destinations
When leaving the Caloosahatchee River, the majorityof vessels (62%) traveled south toward the Gulf ofMexico (Gorzelany, 1998). Gorzelany also recorded themajority of traffic exiting the river before 1259h (22.5vessels/hour) and entering the river in the afternoon(after 1359h; 27.2 vessels/hour). From 1300 to 1359h,roughly equal amounts of traffic traveled in both di-rections. Traffic did not have a temporal pattern nearthe Edison Bridge, however, with just over half of thetraffic traveling downriver (53%), approximately one-third traveling upriver (28%), and the remainder stay-
Caloosahatchee Manatees McDonald and Flamm
8 FWRI Technical Report TR-10
Table 2 Barge traffic servicing the FPL Ft. Myers power plant, 1997–2002.
Year Heavy-Oil Light-Oil Total Barges Barges Barge Trips
1997 163 7 1701998 241 3 2441999 247 9 2562000 235 47 2822001 150 26 1762002 0 13 13

McDonald and Flamm Caloosahatchee Manatees
FWRI Technical Report TR-10 9
ing within the immediate area (Gorzelany, 1998).Telephone and mail surveys revealed that more
than 40% of respondents docked their boats in a canalbehind their home (Sidman et al., 2001).The digitizedlaunch sites and travel routes of 192 boaters respond-ing to a mail survey showed that for the Caloosa-hatchee River, launches for approximately 70% of therespondents originated in the Cape Coral canal system;the remainder were located along the south shore ofthe Caloosahatchee River (Figure 4). These boatersthen traveled from the canals or the southern shore tothe channel and then westward out the mouth of theriver.These travel routes supported Gorzelany’s find-ings that highest vessel traffic occurred near tidal in-lets and in the ICW. Boaters who started in the CapeCoral and Ft. Myers areas identified Useppa Island andBoca Grande (North Pine Island Sound) as their favorite
destinations (Sidman et al., 2001). Consequently, boatersmost often turned north at the mouth of the river,which contradicts Gorzelany’s finding that 62% of theobserved traffic traveled south upon exiting the river.However, the boaters surveyed by Sidman et al. (2001)represented a specialized subset of the vessel traffic ob-served by Gorzelany. Moreover, Sidman et al.’s surveyrequested the destinations of the last two trips ratherthan common or favorite destinations.The timing of thesurvey (spring–summer) may have also influenced theboaters’ destinations and travel routes.
Boating Activities
In the Caloosahatchee River, Gorzelany (1998) reportedthe majority (76%) of the vessel traffic as “traveling”andapproximately 20% as “anchored/drifting.”In the Mis-
Figure 3 Travel corridors used heavily by watercraft (from Sidman et al., 2001). Darker areas indicate higher use.

Caloosahatchee Manatees McDonald and Flamm
10 FWRI Technical Report TR-10
erable Mile area of San Carlos Bay, the proportion oftraveling vessels increased to 98%. According to Sid-man and Flamm (2001), though, the confluence of theCaloosahatchee River and San Carlos Bay also sup-ported a high diversity of boating activities, such as fish-ing, cruising, and sailing. This diversity likelycontributed to the high traffic density in this area.
Sidman et al. (2001) found that personal water-craft use was highest in areas of beach access. Thesebeach-access areas often coincided with popular leisureand picnic areas and included Shell Point, RedfishPoint, and San Carlos Bay.
Vessel Compliance with Regulatory Zones
Gorzelany (1998) found that compliance with manateespeed zones was highly inconsistent among 12 sitesalong the Caloosahatchee River (12%–77%). Severalvariables were associated with compliance levels, in-cluding location, type of speed zone, vessel type, andvessel size. The interaction between these variableswas site-specific.Therefore, when contemplating man-agement options or future research, each site shouldbe examined independently. When law enforcement
Figure 4 Boat-launch sites along the lower Caloosahatchee River (from Sidman et al., 2001).

McDonald and Flamm Caloosahatchee Manatees
FWRI Technical Report TR-10 11
was present, compliance with posted speed zones in-creased significantly (Gorzelany, 1998; Shapiro, 2001).However, the probability of encountering a law en-forcement officer (local, state, or federal) at any specifictime between 0800h and 1600h in a discrete segmentof a manatee speed zone in the Caloosahatchee Riverwas 5.1% (Gorzelany, 1998).
The absolute number of speeding vessels proba-bly has a greater effect on manatees than does thepercent compliance. Despite the fact that the Shell Is-land site had almost 60% compliance, Gorzelany (1998)recorded nearly two and a half times the number of vi-olations there than at the next busiest site, which hada 39% compliance rate.
The following trends also emerged. Compliancewas highly associated with vessel type and vessel size.Personal watercraft and jonboats were the least com-pliant, whereas sailboats and pontoon boats were con-sistently the most compliant (Gorzelany, 1998). ThePersonal Watercraft Industry Association (http://www.pwia.org/) publicizes that riding PWCs is a “sport.”These vessels are designed and marketed for recre-ational use with the intent of traveling at high speedsin relatively shallow water. Pontoon boats and sail-boats, on the other hand, can be awkward and difficultto maneuver at high speeds. Many sailboats have afixed keel and are thus relegated to the deep water pro-vided by channels. Blatant noncompliance decreasedwith increasing vessel size, and larger vessels composedthe smallest proportion of the observations. Smallerboats are very maneuverable at high speeds and areable to navigate a variety of areas, whereas larger boatsare restricted to major channels and deeper water.Toavoid potential accidents in congested areas, largervessels must travel at reduced speeds.
Summary
Vessel traffic in the Caloosahatchee River is highest onweekend afternoons in spring. Yachts, ski boats, andopen fishermen boats are the three most common ves-sel types found between the Edison Bridge and Mis-erable Mile. In this area, the most common vessel sizesrange from 16 to 39 feet. Highest traffic densities occurat Shell Point, where the Caloosahatchee River andSan Carlos Bay converge.
Many of the boats observed in the lower Caloosa-hatchee River originated in the Cape Coral canal sys-tem and traveled west to the Gulf of Mexico.The highlyvariable, site-specific nature of boaters’ behavior andvessel compliance requires scientists and managers todeal with each site independently. When assessingthreats to manatees, however, compliance rates arenot as relevant as the total number of blatant violations.
An area with heavy boat traffic and relatively highcompliance may still have a greater total number of bla-tant violations that could pose a threat to manatees thanan area with less traffic and low compliance, such asShell Point, which has a maximum rate of one uniquevessel every 11.4 seconds (Gorzelany, 1998).
Habitat Information
Introduction
The estuarine portion of the Caloosahatchee River isdelimited upstream by the W.P. Franklin Lock andDam (Franklin locks).The Franklin locks lie roughly 25miles upstream from Shell Point and act as a salinitybarrier. Extreme quantities of fresh water releasedfrom Lake Okeechobee and upstream runoff followedby periods of drought have altered the estuarine ecosys-tem downstream of the locks. Since the constructionof the locks in 1968, downstream turbidity has in-creased, resulting in decreases in light penetrationand in SAV in the estuary (Science Subgroup, 1996;SFWMD, 2000).
This section examines habitat characteristics ofthe study area including water temperature, salinity,forage, and bathymetry. Specifically, we identify im-portant manatee habitats called “places,”based on thefeatures that may act as attractants for manatees or pro-vide necessary resources.
Warm-Water Aggregations
Warm-water refuges at the Florida Power and Light(FPL) power plant, Franklin locks, and Matlacha Islesplay an important role in defining manatee move-ments between Shell Point and the Edison Bridge dur-ing winter.
FPL POWER PLANT—PRIMARY WARM–WATER SITEIntake pipes for the FPL Ft. Myers power plant are lo-cated on the Caloosahatchee River approximately 1.5miles east of Interstate Route I-75.The warmed efflu-ent, roughly 7°C above ambient temperature (FPL in-take temperature), is discharged into the Orange River(FPL, 2002).The thermal plume flows down the OrangeRiver into the Caloosahatchee River. As many as 434manatees have been counted at the power plant dis-charge area in a single day (Reynolds, 1996).
In 2001, the power plant began construction to “re-power” by converting to natural gas. During winter2001–2002, the amount of warm-water effluent pro-duced by the plant was only a fraction of the normallevel.To address the decrease in warm water and pro-
vide adequate habitat for manatees,“donkey boilers”were installed on 4 January 2002 (Reynolds, 2002).Thereduction in warm-water flow at the traditional outfallprompted manatees to gather at two secondary win-ter refuge sites, the Franklin locks and Matlacha Isles.
FRANKLIN LOCK AND DAM—SECONDARY WARM–WATER SITE Immediately downstream of the Franklin Lock andDam there is a 56-foot-deep dredged channel. Al-though not warmed by a thermal effluent, this deepchannel cools more slowly than the main river does(Packard et al., 1989). Packard et al. (1989) reported in-creased manatee use of the upstream areas of theCaloosahatchee River estuary in 1985 in response to aninterruption of the FPL plant’s thermal effluent.Theseupstream areas included deep channels, places withabundant aquatic vegetation, and the Franklin locks.When temperatures at the locks and in the OrangeRiver were the same, roughly equal numbers of man-atees were counted at each location, but the numberof individuals at the power plant exceeded the num-ber at the locks when lock temperatures droppedbelow 17°C (Packard et al., 1989), so temperatures of17°–18°C seemed to trigger manatee movements be-tween the FPL plant and the locks. It is during thesetimes of frequent manatee trips between the powerplant and the lock that manatees are at the greatest riskof harmful collisions with motorboats in this area.
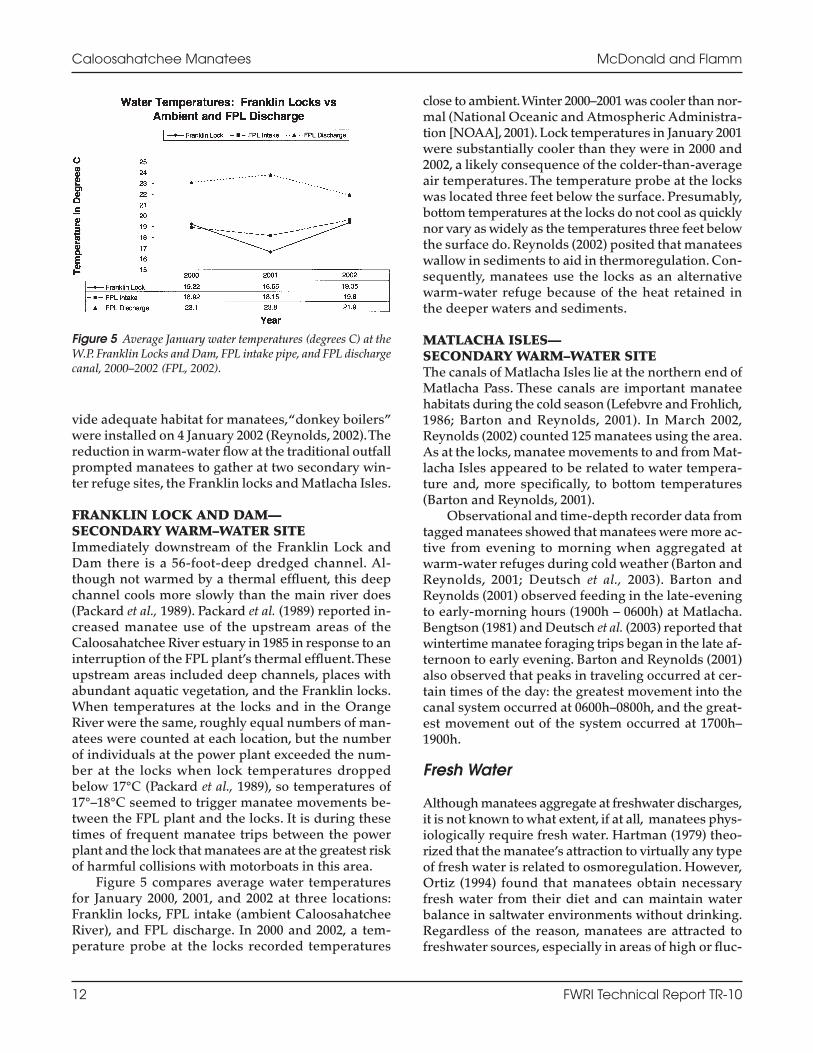
Figure 5 compares average water temperaturesfor January 2000, 2001, and 2002 at three locations:Franklin locks, FPL intake (ambient CaloosahatcheeRiver), and FPL discharge. In 2000 and 2002, a tem-perature probe at the locks recorded temperatures
close to ambient.Winter 2000–2001 was cooler than nor-mal (National Oceanic and Atmospheric Administra-tion [NOAA], 2001). Lock temperatures in January 2001were substantially cooler than they were in 2000 and2002, a likely consequence of the colder-than-averageair temperatures. The temperature probe at the lockswas located three feet below the surface. Presumably,bottom temperatures at the locks do not cool as quicklynor vary as widely as the temperatures three feet belowthe surface do. Reynolds (2002) posited that manateeswallow in sediments to aid in thermoregulation. Con-sequently, manatees use the locks as an alternativewarm-water refuge because of the heat retained inthe deeper waters and sediments.
MATLACHA ISLES—SECONDARY WARM–WATER SITEThe canals of Matlacha Isles lie at the northern end ofMatlacha Pass. These canals are important manateehabitats during the cold season (Lefebvre and Frohlich,1986; Barton and Reynolds, 2001). In March 2002,Reynolds (2002) counted 125 manatees using the area.As at the locks, manatee movements to and from Mat-lacha Isles appeared to be related to water tempera-ture and, more specifically, to bottom temperatures(Barton and Reynolds, 2001).
Observational and time-depth recorder data fromtagged manatees showed that manatees were more ac-tive from evening to morning when aggregated atwarm-water refuges during cold weather (Barton andReynolds, 2001; Deutsch et al., 2003). Barton andReynolds (2001) observed feeding in the late-eveningto early-morning hours (1900h – 0600h) at Matlacha.Bengtson (1981) and Deutsch et al. (2003) reported thatwintertime manatee foraging trips began in the late af-ternoon to early evening. Barton and Reynolds (2001)also observed that peaks in traveling occurred at cer-tain times of the day: the greatest movement into thecanal system occurred at 0600h–0800h, and the great-est movement out of the system occurred at 1700h–1900h.
Fresh Water
Although manatees aggregate at freshwater discharges,it is not known to what extent, if at all, manatees phys-iologically require fresh water. Hartman (1979) theo-rized that the manatee’s attraction to virtually any typeof fresh water is related to osmoregulation. However,Ortiz (1994) found that manatees obtain necessaryfresh water from their diet and can maintain waterbalance in saltwater environments without drinking.Regardless of the reason, manatees are attracted tofreshwater sources, especially in areas of high or fluc-
Caloosahatchee Manatees McDonald and Flamm
12 FWRI Technical Report TR-10
Figure 5 Average January water temperatures (degrees C) at theW.P. Franklin Locks and Dam, FPL intake pipe, and FPL dischargecanal, 2000–2002 (FPL, 2002).

tuating salinity. Such sources occur between the Edi-son Bridge and Shell Point, where a substantial portionof the shoreline on both sides of the river has been sta-bilized by seawalls. Figure 6 identifies National Pollu-tant Discharge Elimination System (NPDES) locationsnear the Caloosahatchee River. These areas, concen-trated along the southern shore of the river, may befocal attractants to manatees when there are no up-stream freshwater discharges in the river.
Smaller Important Places
Staff at FWC’s Charlotte Harbor field laboratory haveidentified other places important to manatees (seealso Telemetry and Aerial Survey Sections; Figure 7).These secondary sites may be important because theycontain fresh water, have deep water to aid in ther-
moregulation, have seagrass beds, or are areas of min-imal disturbance. Some canals and deep basins may beused principally during the passage of early- or late-winter cold fronts. Manatees are frequently observedin these secondary sites during rapid cooling spells thatdo not drop the ambient water temperatures greatly.These smaller places include the following areas:
Eight Lakes—Located in the southwestern por-tion of the Cape Coral canals, this area is approxi-mately 24 feet deep and is probably a secondarywarm-water aggregation area as described above.Tem-peratures recorded in Eight Lakes between Decemberand February averaged almost 1°C above the ambienttemperatures that were collected from a NOAA tem-perature probe at the Edison Bridge (FWC unpub-lished data, NOAA 2002).The Eight Lakes temperatureprobe measured temperatures three to four feet below
McDonald and Flamm Caloosahatchee Manatees
FWRI Technical Report TR-10 13
Figure 6 Authorized National Pollutant Discharge Elimination System locations for the Caloosahatchee River, updated through April2002. Coverage provided by Lee County Department of Public Works.

the surface, and it is likely that bottom and sedimenttemperatures were warmer.
Chiquita Boat Lock—This boat lock and canal liessouthwest of Eight Lakes. It contains a freshwatersource and allows boat access to Eight Lakes.
Bimini Basin—This is a shallow basin (6 ft) north-east of the Eight Lakes. It may be used for resting.
Shell Point Village lagoon—This area contains apipe believed to discharge fresh water. Local residentsfrequently report manatee sightings, and manateeshave been observed during aerial surveys here.
Punta Rassa—This area contains seagrass bedsand is a possible feeding aggregation site.
Beautiful Island—Beautiful Island is located eastof the Edison Bridge and downstream from the mouthof the Orange River.This is a probable feeding site andoften contains beds of tapegrass (Vallisneria americana).
Downtown Ft. Myers marinas—Manatees fre-
quently aggregate in marinas, presumably for the freshwater discharged from hoses.
Deep Lagoon—Located on the southern shore ofthe Caloosahatchee River, Deep Lagoon lies acrossthe river from Redfish Point.This area contains a ma-rina where manatees may seek fresh water, a placefor resting, or warm water.
Iona Cove—This cove is located on the easternportion of Shell Point. Manatees have been observedfeeding here in years past (K. Frohlich, FWC, personalcommunication). However, seagrass abundance isknown to wax and wane in this region of the estuaryin response to prolonged fluctuations in salinity.
Billy Creek—FWC staff have received reports of oc-casional winter manatee sightings here. Sediments inthis creek may retain some heat, providing a tempo-rary warm-water refuge.
Caloosahatchee Manatees McDonald and Flamm
14 FWRI Technical Report TR-10
Figure 7 Secondary manatee-aggregation areas (bold face) along the Caloosahatchee River.
McDonald and Flamm Caloosahatchee Manatees
FWRI Technical Report TR-10 15
Seagrasses, Aquatic Freshwater Vegetation, and Salinity Changes
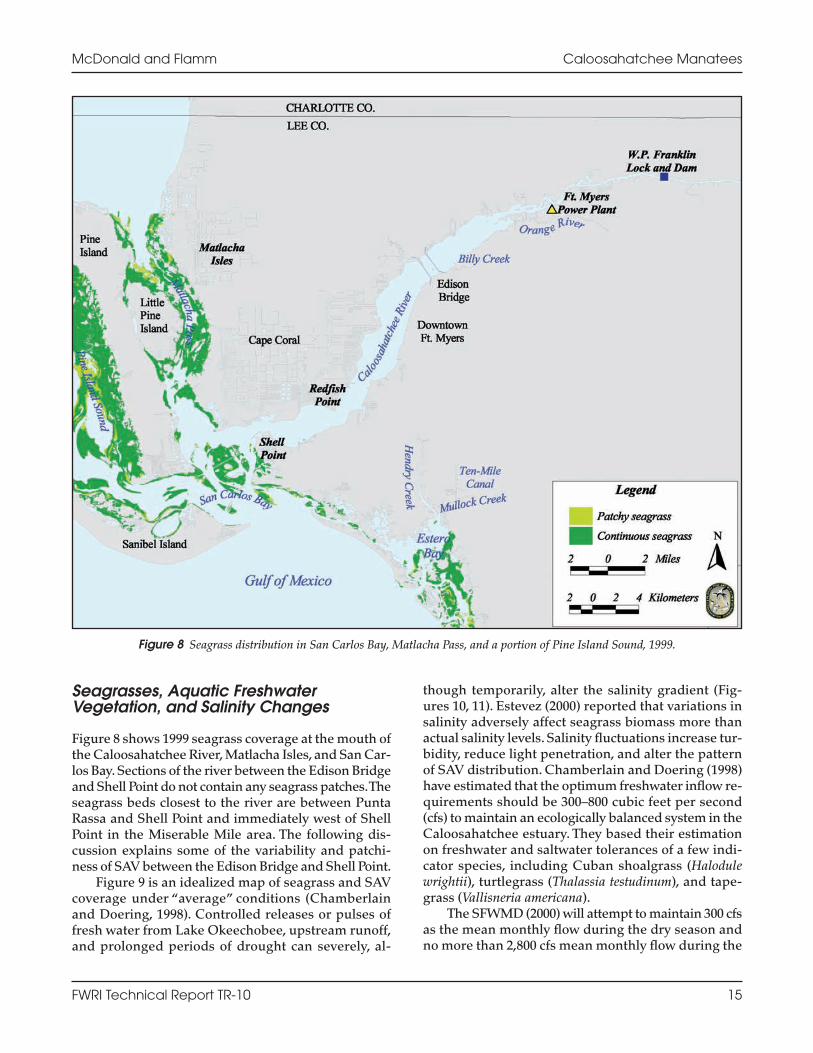
Figure 8 shows 1999 seagrass coverage at the mouth ofthe Caloosahatchee River, Matlacha Isles, and San Car-los Bay. Sections of the river between the Edison Bridgeand Shell Point do not contain any seagrass patches.Theseagrass beds closest to the river are between PuntaRassa and Shell Point and immediately west of ShellPoint in the Miserable Mile area. The following dis-cussion explains some of the variability and patchi-ness of SAV between the Edison Bridge and Shell Point.
Figure 9 is an idealized map of seagrass and SAVcoverage under “average” conditions (Chamberlainand Doering, 1998). Controlled releases or pulses offresh water from Lake Okeechobee, upstream runoff,and prolonged periods of drought can severely, al-
though temporarily, alter the salinity gradient (Fig-ures 10, 11). Estevez (2000) reported that variations insalinity adversely affect seagrass biomass more thanactual salinity levels. Salinity fluctuations increase tur-bidity, reduce light penetration, and alter the patternof SAV distribution. Chamberlain and Doering (1998)have estimated that the optimum freshwater inflow re-quirements should be 300–800 cubic feet per second(cfs) to maintain an ecologically balanced system in theCaloosahatchee estuary. They based their estimationon freshwater and saltwater tolerances of a few indi-cator species, including Cuban shoalgrass (Halodulewrightii), turtlegrass (Thalassia testudinum), and tape-grass (Vallisneria americana).
The SFWMD (2000) will attempt to maintain 300 cfsas the mean monthly flow during the dry season andno more than 2,800 cfs mean monthly flow during the
Figure 8 Seagrass distribution in San Carlos Bay, Matlacha Pass, and a portion of Pine Island Sound, 1999.

Caloosahatchee Manatees McDonald and Flamm
16 FWRI Technical Report TR-10
wet season. If the South Florida Water ManagementDistrict (SFWMD) maintains inflows within recom-mended guidelines, there should be a minimal effecton the distribution of submerged vegetation. How-ever, according to the SFWMD (2000), 31-year simula-tion models did not predict significant reductions in thenumber of high-discharge events until 2010. Even then,simulated minimum criteria (300 cfs) were not met 76times, whereas maximum criteria (2,800 cfs) were ex-ceeded 45 times.Therefore, the system will continue tobe dynamic over the next several years. Large changesin salinity will alter the distribution and abundance ofSAV. In periods of drought, marine seagrass beds mayextend along the shoreline upstream to the Cape CoralBridge (P. Doering, SFWMD, personal communica-tion). During the wet season, freshwater inflows maykill marine SAV but increase freshwater SAV growthbetween the Edison and the Mid Point Memorial
Bridges (P. Doering, SFWMD, personal communica-tion). One researcher (S. Bortone, the Conservancy ofSW Florida, personal communication) suspects theremay be beds of mixed species (freshwater and ma-rine), in areas where variable salinity would not alterthe distribution of SAV but would affect the speciescomposition. Despite salinity fluctuations, as long asother environmental conditions are not limiting, sometype of SAV will probably occupy the shelf as the salin-ity wedge moves up or downriver (Estevez, 2000).
Because scientists do not know the principal re-growth mechanism (seeds, existing rhizomes, etc.) forSAV affected by salinity variations, the time frame forrecolonization by either freshwater or marine speciesis unknown and may range from weeks to months (P.Doering, SFWMD, personal communication; S. Bortone,the Conservancy of Southwest Florida, personal com-munication). Estevez (2000) reported that widgeon-
Figure 9 Seagrass and SAV distribution in the Caloosahatchee River and Estero Bay under optimum conditions (from Chamberlain andDoering, 1998).

McDonald and Flamm Caloosahatchee Manatees
FWRI Technical Report TR-10 17
grass (Ruppia maritima) is probably the first to grow afterdenuding from extreme salinity changes, replacingCuban shoalgrass when salinity decreases and tape-grass when salinity increases. Sustained periods ofsalinity extremes could substantially reduce SAV.Tem-porary elimination of SAV would force manatees to findfood elsewhere, either upstream for freshwater speciesor downstream to San Carlos Bay, Matlacha Isles, PineIsland Sound, or Estero Bay for seagrass. Overall, man-atees probably feed opportunistically along the shal-low shelf areas between Shell Point and the EdisonBridge while en route to important habitats outside ofthese boundaries.
Although lower salinity will increase the likeli-hood of tapegrass growth, oligohaline conditions canalso decrease water clarity and darken water color.Bortone and Turpin (2000) found that tapegrass in theCaloosahatchee River actually grew faster under con-
ditions of higher salinity but better water clarity.There-fore, in addition to salinity fluctuations, water color andturbidity contribute to the unpredictable and patchydistribution of SAV in the Caloosahatchee River.
Seasonal changes in SAV abundance and qualitywill affect the duration of manatee foraging periods(Bengtson, 1983). In the Caloosahatchee River, tapegrasshas the highest quality in the form of new growth fromMay to August and the greatest quantity or biomassfrom July to October (Bortone and Turpin, 2000). Bengt-son (1983) reported increased manatee foraging ratesin the St. Johns River in fall, prior to the physiologicalstresses of winter and when vegetation was of lowerquality. Manatees in the Caloosahatchee River maybehave similarly, especially in the less variable feed-ing areas upstream of the Edison Bridge or down-stream of Shell Point.
Figure 10 Salinity gradient of the Caloosahatchee River estuary during periods of low freshwater inflow (from USGS, 2001).

Bathymetry
Figure 12 shows the bathymetry of the CaloosahatcheeRiver (FWC 2000). Manatees can travel the length andbreadth of the study area even though it is shallow.Theaverage depth of the river’s edge is 3 feet (0.9 m), andthe center, including the channel, ranges from 6 to 25feet in depth (1.8–7.6 m). Manatees are capable of tra-versing shallow areas to obtain access to warm-waterrefuges, feed on shoreline vegetation, or rest (Hartman,1979; FWC, 2002).
Summary
The Caloosahatchee River between the Edison Bridgeand Shell Point links habitats used by manatees, in-cluding warm-water refugia, feeding areas, and rest-
ing areas.The distribution of submerged aquatic veg-etation (marine and freshwater) between Shell Pointand the Edison Bridge is variable and patchy becauseof drastic fluctuations in salinity and high turbidity.Salinity changes are caused by periodic freshwaterdischarges from Lake Okeechobee, upstream runoff,and periods of drought, whereas turbidity results fromdevelopment and vessel traffic. Manatees travel be-tween more stable feeding areas found upstream(freshwater) and downstream (estuarine), althoughthey presumably feed opportunistically while pass-ing through the area. Selected areas in the Cape Coraland Ft. Myers canals likely afford manatees with freshwater through stormwater runoff and drainage, rest-ing habitats, and possible nursery areas. In winter,manatees may also use a few of these canals as tem-porary warm-water sites.
Caloosahatchee Manatees McDonald and Flamm
18 FWRI Technical Report TR-10
Figure 11 Salinity gradient of the Caloosahatchee River estuary during periods of high freshwater inflow (from USGS, 2001).

McDonald and Flamm Caloosahatchee Manatees
FWRI Technical Report TR-10 19
Places and Corridors: A Summaryof Telemetry Information
Introduction
Telemetry data provide a unique view of manatee ecol-ogy. Rather than collecting data on many animals at onetime, as in aerial surveys, biologists use telemetry togather data more intensively on a few individuals overlong periods of time. By examining the sequence oftelemetry locations, we can explore many aspects ofmanatee travel behavior, including migration, differ-ences in movement patterns between individuals, andthe locations of manatee travel corridors and places(Flamm et al., 2005). A “place” is defined as an areafrequented by manatees for extended periods. Placesinclude key habitats for manatee feeding, resting, and
thermoregulation.“Corridors”are areas visited regu-larly by manatees for brief periods as they travel fromplace to place.This section summarizes seasonal man-atee travel paths and delineates places and corridorsin and around the Caloosahatchee River.
Materials and MethodsFIELD METHODSMethods for radio-tagging and tracking manatees arewell established (Lefebvre and Frohlich, 1986; Rathbunet al., 1987, 1990; Deutsch et al., 1998, 2003; Weigle et al.,2001).We analyzed data from 26 manatees (17 femalesand 9 males) that were tracked by using satellite tagsfrom 1991–2001. Nine of the 26 (4 females, 5 males) werecaptive-born or long-term captives that were releasedinto the wild.The wild-caught manatees were taggedand tracked for studies conducted by FWC and Mote
Figure 12 Bathymetry of the Caloosahatchee River estuary, San Carlos Bay, and Matlacha Pass (data from FWC, 2000).

Marine Laboratory.Three wild manatees were taggedat Warm Mineral Springs, three were tagged at Mat-lacha Isles, and one was tagged in Collier County.Theremaining 10 individuals were tagged throughoutsouthwestern Florida, as described in Weigle et al.(2001). Tagged manatees were tracked by truck andboat.Tagging duration ranged from 2 to 128 weeks; theaverage was 37.6 weeks.
ANALYTICAL METHODSSatellite telemetry data were processed to shift ordelete points that were positioned on land.Telemetrypoints were located on land because of positional er-rors introduced during Service ARGOS’s estimation ofthe manatees’ locations and the reductions in mapresolution resulting from the conversion of the Floridashoreline vector coverage to a raster map (Weigle et al.,2001). Points located on land and within 1 km of waterwere moved to the nearest cell of water based onstraight-line distance. If several water pixels wereequidistant from the satellite-estimated position, onewas selected randomly. Points farther than 1 km fromwater were not used in this study. All points moved towater were verified by field biologists familiar with thetravel histories of the manatees and the area.
The manatee travel-path analysis transformedpoint data into raster maps displaying manatee placesand corridors (Weigle et al., 2001; Flamm et al., 2005).A raster map is similar in structure to a piece of graphpaper; it consists of evenly sized cells arranged intorows and columns. Each cell in the map has a numberassigned to it that represents a theme in the map. Forexample, in a map of the Florida shoreline, cells withthe value ‘1’ correspond with land, and cells with a ‘2’correspond with water. To generate places and corri-dors, we first delimited travel paths, calculated man-atee residence times per cell (minutes/cell), and thencombined and interpreted the results in terms of man-atee places and travel corridors. Places and corridorswere first estimated for individual animals and thencombined into a single map of places and corridors forthe study area. The analytical methods are discussedin more detail below.
TRAVEL PATH MODELA travel path is defined as the line drawn between twotelemetry locations. Travel paths were delineatedusing an approach called a cost-surface analysis(Flamm et al., 2005). A cost-surface is a raster map inwhich cell values represent the “cost”associated withthe passing of an object, in this case a manatee,through a cell.The higher the cost, the less likely thatthe cell will be crossed. In this analysis, costs werebased on the association between water depth and the
most accurate ARGOS accuracy location, class 3. In acost-path analysis, the least costly path between twopoints is mapped. The Geographic Information Sys-tem (GIS) Arc/Info (ESRI, Redlands, CA) includesprograms that draw the path between points that hasthe least “cost.”Manatee travel paths were filtered toinclude only those lines with the following attrib-utes: first, the manatees’ travel time between twotelemetry points must not have exceeded three days’duration; second, the end point of the path must notbe a location of a retagging or tag-removal episode;third, the start point must not be a location where thetag malfunctioned; fourth, neither the start point northe end point should have an ARGOS accuracy loca-tion class of 0; and fifth, the movement rate associatedwith the travel path must not exceed 3,000 metersper hour.
Paths for individual manatees were analyzed tomap “residence times,”“visit frequencies,”and “mean-residence-times-per-visit.” Residence times were theestimated number of minutes, interpolated linearly, thata manatee spent in each cell that it crossed duringmovement between two telemetry locations. For ex-ample, if a manatee crossed 15 cells over a three-hourperiod, each cell would be assigned 12 minutes ofmanatee time (180 min/15 cells).Visit frequencies werethe number of times an individual’s path was delin-eated across each cell during the entire time it wastagged. The mean-residence-time-per-visit for eachmanatee was calculated as the sum of the manatee’sresidence times spent in a cell divided by the numberof times the manatee visited that cell.
PLACES AND CORRIDORS MODELTravel-behavior patches were based on mean resi-dence times and on the number of visits. Places weredefined as cells with three or more visits of more thanfive minutes per visit. Similarly, cells with three ormore visits of five minutes or less per visit were calledcorridors. Small places and corridors, those less thanone-tenth the size of the largest place and corridor, weredeleted from the map. Maps of places for all manateesthat traveled through the study area were combined,as were the maps of corridors. Places and corridorswere then expanded by five cells in all directions to co-alesce small adjacent patches.
Results and Discussion
SEASONAL DISTRIBUTIONFigures 13 and 14 depict cold- and warm-season travelpaths, respectively, for manatees in and near theCaloosahatchee River. Their travels in the Caloosa-hatchee River composed only a small portion of their
Caloosahatchee Manatees McDonald and Flamm
20 FWRI Technical Report TR-10

total range (Weigle et al., 2001). Although the extent ofthe total range traveled by each individual varied,none of these manatees remained entirely within theCaloosahatchee River system. Lefebvre and Frohlich(1986) found that manatees who were radio-taggedwithin the Caloosahatchee River moved away from theriver in early March.This has important implicationsfor management. Activities that affect manatee ecol-ogy in the Caloosahatchee River will ultimately affectmanatees throughout much of southwestern Florida.All manatees tagged during both warm (March–No-vember) and cold (December–February) seasons spentportions of each season in the river.The warm seasonincluded the transitional months of March and No-vember, when weather can be either cold or warm.
Movements during the cold season were generallymore restricted than during the warm season and were
concentrated near the warm-water effluent of the Ft.Myers power plant and in Matlacha Isles. Some indi-viduals traveled between these two warm-water areas.One manatee also spent time in the Cape Coral Canalsystem (Weigle et al., 2001). During winter 1985, man-atees were concentrated in and around the warm-water areas of the Orange and upper Caloosahatcheerivers (Lefebvre and Frohlich, 1986). In winter 1986,however, tagged manatees spent more time in thelower Caloosahatchee River, including the Cape Coralcanals and Deep Lagoon.West of Shell Point, manateesappear to have moved between Matlacha Isles, Mat-lacha Pass, and the seagrass beds in San Carlos Bay(FWC, unpublished data). Lefebvre and Frohlich (1986)also reported that manatees used these areas, specif-ically from February to May.
In mild winter seasons such as early 2002, data in-
McDonald and Flamm Caloosahatchee Manatees
FWRI Technical Report TR-10 21
Figure 13 Winter (December–February) travel paths of eight satellite-tagged manatees, 1991–1996.

Caloosahatchee Manatees McDonald and Flamm
22 FWRI Technical Report TR-10
dicate that manatees venture out to feed more fre-quently and move farther from the refugia. Becausehigh numbers of animals use the warm-water refugesin winter, increases in manatee movements duringthis season will increase the likelihood of interactionswith boats.
Warm-season use of the Caloosahatchee River ap-pears to be extensive. Results suggest that manateesuse the portion of the river between Shell Point and theEdison Bridge primarily as a travel corridor connect-ing important habitat areas (Figure 15). The upriverareas include feeding habitats near the Orange Riverand Beautiful Island. Food resources occur downrivernear San Carlos Bay, Matlacha Pass, and MatlachaIsles. Manatees also used the extensive canal systemsof Cape Coral and Ft. Myers, most likely for obtainingfresh water and for resting.
PLACESFigures 15 and 16 display the manatee places in theCaloosahatchee River identified by the model. Someplaces could reflect data from only one manatee butother places reflect data from several manatees.The ma-jority of places mapped by the model lie east of the Edi-son Bridge and west of Shell Point. Lefebvre andFrohlich (1986) found that tagged manatees were as-sociated with seagrass beds in San Carlos Bay andMatlacha Pass in the warm season. As described in thehabitat section, more reliable manatee feeding groundslie west of Shell Point and east of the Edison Bridge.Both of these areas also contain important warm-waterrefuges: the Ft. Myers power plant and Matlacha Isles.The model again substantiates our hypothesis thatmanatees spend less time in the mid-river area.
Although primarily a travel corridor, the area be-tween the Edison Bridge and Shell Point includes some
Figure 14 Warm season (March–November) travel paths of nine satellite-tagged manatees, 1991–1996.

places within the residential canals in Cape Coral andFt. Myers (Figure 16). Canals can provide quiet areasfor resting, calving, and suckling (Shane, 1983). In ad-dition, low-energy areas, such as canals, tend to con-tain fine-grained sediments that retain heat duringwinter and are cooler in summer (Reynolds, 2002).During the cold season, deep canals may provide tem-porary shelter from sudden cold fronts or serve asstop-over areas where manatees can find warmth whiletraveling to major warm-water aggregation sites. Thebanks of this portion of the Caloosahatchee River arehighly urbanized and heavily seawalled. Seawalls canact to concentrate freshwater run-off via dischargepipes and can serve as attractants when the freshwa-ter discharge from Lake Okeechobee is low.
The following areas between the Edison Bridgeand Shell Point that were mapped as places were ver-
ified by FWRI field biologists as being important sec-ondary aggregation areas (Figure 7, habitat section):
North shore west of the Edison Bridge—This areais heavily seawalled and leads to several canals inCape Coral.This area could provide fresh water, quietresting spots, and fine-grained sediments for ther-moregulation.
Downtown Ft. Myers—This place contains severalboat slips and marinas that discharge fresh water inamounts that can attract manatees. It is also heavily sea-walled. This portion of the river is shallow enough tosupport seagrass beds, but temporal variation in salin-ity, urban run-off, and wake action limit SAV growth.Manatees are probably attracted to fresh water andpatchy forage.
Redfish Point—The Cape Coral Yacht Club is lo-cated at Redfish Point. The yacht club attracts mana-
McDonald and Flamm Caloosahatchee Manatees
FWRI Technical Report TR-10 23
Figure 15 Manatee places and corridors in and around the Caloosahatchee River, derived from satellite- and radio-telemetry data of 26manatees between 1991 and 2001.

tees because of the freshwater run-off from boat main-tenance. Redfish Cove, also used by manatees, containsseagrass beds (L. Keith, FWC, personal communica-tion).Various entrance points into the Cape Coral canalsystem line this section of the river. One interesting fea-ture here is that the river is relatively narrow (1,000 m),and the entire width was identified as an importantplace as well as a corridor for manatees (see below).Across the river from Redfish Point lies the Deep La-goon Marina and the entrance to Deep Lagoon. Evi-dence suggests that manatees travel between RedfishPoint and Deep Lagoon.
Cape Coral Canals—The Cape Coral canals pro-vide resting areas and some fresh water for manatees.Certain canals contain deep basins that serve as tem-porary warm-water sites.
Deep Lagoon and the south shore across fromRedfish Point—This area contains two marinas andnumerous NPDES locations (Figure 6, Habitat Sec-tion). There are many dead-end canals branching offfrom the lagoon. It is likely that manatees use this areafor resting, fresh water, and thermoregulation.
Iona Cove—This area was identified as a feedingarea with variable SAV availability (K. Frohlich, FWC,personal communication; see Habitat section).
CORRIDORSEvidence suggests that the area between the EdisonBridge and Shell Point is a manatee travel corridor (Fig-ures 15 and 16).The travel corridors estimated by themodel follow the shoreline of the CaloosahatcheeRiver. Flamm et al. (2005) found that travel corridors
Caloosahatchee Manatees McDonald and Flamm
24 FWRI Technical Report TR-10
Figure 16 Manatee places and corridors between the Edison Bridge and Shell Point, derived from satellite- and radio-telemetry data of26 manatees between 1991 and 2001.

also followed the shoreline in Tampa Bay. By stayingclose to the shoreline, manatees could opportunisti-cally feed, drink, or rest. In addition, much of the ves-sel traffic along the Caloosahatchee River isconcentrated in the channel. Manatees would mini-mize the likelihood of disturbance or contact withwatercraft by traveling closer to shore. We do not yetknow how manatees navigate nor how they createcognitive maps of their environment. Swimming closeto the shoreline may assist them with navigation andallow them to detect canal entrances or other impor-tant “landmarks” as well as sense salinity and tem-perature gradients.
It is difficult to assess whether travel corridors nearthe shoreline are, in part, a relic of the telemetry data.The model is limited by the frequency and accuracy ofthe telemetry gear and assumes that the depth distri-bution based on places can be used to represent depthpreferences during travel. We do not know, retrospec-tively, if a manatee took a direct route from one placeto another, if it meandered between satellite hits, or ifit used the channels while traveling between pointspicked up by the satellite near shore. Hartman (1979)reported that manatees used the deepest channels astravel corridors in Citrus County. When conductingaerial surveys of manatees in northeastern Florida andsoutheastern Georgia, however, Kinnaird (1985) re-ported that 82% of the manatees that were observedtraveling were swimming within five meters of shore.Future studies that apply satellite-linked GPS tags willincrease the accuracy of the locations, register more fre-quently, and consequently help refine our assessmentof manatee use of the Caloosahatchee River.
Two important corridors for manatees are nearRedfish Point and Shell Point. Data suggest that man-atees cross the river in these areas (Figure 16). Theriver narrows in both places (1,000 m at Redfish Pointand 710 m at Shell Point). In addition to the width,manatees may cross at Redfish Point because bothsides of the river contain important places such as theentrance to the Cape Coral Canals and Deep Lagoon.Redfish Point may also have certain features that man-atees use for navigation.
To travel up the Caloosahatchee River from the gulfor from the river to points west, vessels must pass byShell Point, thereby creating a substantial area of over-lap between boats and manatees in a comparativelynarrow portion of the river. Gorzelany (1998) recordedan average of more than five boats per minute passingShell Point. Outside the channel, the river is a bit widerand shallower than in the channel itself. Less boat traf-fic in this area would appear to provide a less danger-ous travel corridor for manatees.When approached byboats, however, manatees have been observed to head
for deeper water (Nowacek et al., 2000, 2004). Conse-quently, there would be fewer options for escape fromwatercraft when the manatee is outside the channel.
Summary
Results from recent tagging studies on manatee dis-tribution and movements in and around the Caloosa-hatchee River support findings of similar studiesconducted during the 1980s. During the cold season,manatees mostly use areas near the Ft. Myers FPLpower plant and Matlacha Isles, and their movementsare more restricted than during the warm season.Manatees principally use the Caloosahatchee Riverbetween Shell Point and the Edison Bridge as a travelcorridor between important habitats near the river’smouth (San Carlos Bay and Matlacha Pass) and thoseupriver (Beautiful Island and the Orange River). Man-atees appear to stay near the shoreline while traveling,perhaps for navigation and boat-avoidance or to max-imize their feeding, drinking, and resting opportuni-ties. While en route, manatees may stop at selectedminor aggregation areas, such as the canals in Ft.Myers and Cape Coral. They also appear to exploithighly urbanized, shallow areas near seawalls.
Manatee Mortality
Introduction
A program dedicated to Florida manatee rescue, car-cass recovery, and necropsy was instituted in 1974(Odell and Reynolds, 1979; Beck et al., 1982; Irvine et al.,1981; O’Shea et al., 1985; Ackerman et al., 1995).The long-term manatee mortality database generated from thisprogram holds information about cause of death; local,county, and statewide mortality trends over time; life-history, anatomical, pathological, histological, andphysiological information; manatee demographics;and environmental health. Between 1976 and 2001,manatee deaths increased statewide by approximately6.0% annually (r 2 = 0.83, P < 0.001; Figure 17). Table 3shows the breakdown of most of these death cate-gories statewide.
The following discussion will focus on informationgathered from manatee carcasses recovered princi-pally from the Caloosahatchee River between 1976and 2001 (FWC, unpublished data). Relevant infor-mation from areas surrounding the CaloosahatcheeRiver are also discussed to place the findings in abroader geographic context so that they are on a scaleappropriate to that of manatee movements (see Teleme-try section).
McDonald and Flamm Caloosahatchee Manatees
FWRI Technical Report TR-10 25

Materials and Methods
For the purposes of this analysis, the river was dividedinto three regions: (1) West = San Carlos Bay and Mat-lacha Pass; (2) Mid = Shell Point to the Edison Bridge;and (3) East = the Edison Bridge to the Franklin locks(Figure 18). Procedures for recovering carcasses, col-lecting information about cause of death, and analyz-ing trends are described in O’Shea et al. (1985) andAckerman et al. (1995). Causes of death were dividedinto anthropogenic (human-related) and natural.Human-related deaths included collisions with wa-tercraft, interactions with locks and flood-control struc-tures, and “other human.” Natural deaths includedcold-related, red tide, perinatal, and “other natural.”Redtide does not appear separately in the tables in this re-port because deaths attributed to this category were notdistinguished from the category of “other natural”until after the 1996 epizootic.
Temporal trends in the number of manatee deathswere analyzed by calculating weighted-means (Flamm,2001).Years were transformed so that the midpoint yearbetween 1976 and 2001 (1988.5) equaled zero.The num-ber of carcasses recovered in each year was multipliedby the value of the transformed year. We added the re-sults and divided them by the total number of carcasses:
ny = (∑iP)/C;
i = –12.5
where n = number of years (26); i = year (transformed);P = number of carcasses during year i; and C = the totalnumber of carcasses. A positive deviation from zero in-dicated increasing trends in mortality. The larger thedeviation, the faster the increase in recent years.
Trends in the number of manatee deaths per yearwere calculated by using exponential regression (Ack-erman et al., 1995).The annual percentage change in car-
casses, as percent per year, was calculated from the lin-ear coefficient of the regression (b1). If there were zerocarcasses in any year, a standard transformation of 1was added to the count of carcasses in each year[ln(Carcasses + 1)] (Ackerman et al., 1995). Regressionanalyses were conducted in MS Excel as follows:
ln(Carcasses) = b0 + b1(Year);Annual percentage rate of change (%/year) =(eb1 – 1) · 100%.
Based on the median year, we also divided the ex-ponential regression trend analyses into two equaltime-frames: 1976–1988 and 1989–2001. In some analy-ses, we adjusted for red tide by subtracting the num-ber of carcasses that were suspected to have died fromred tide in each year from the total number of carcassesfor that year (FWC, unpublished data). Sporadic redtide blooms can kill manatees unpredictably and cat-astrophically, leaving some years with unusually highnumbers of manatee deaths that can substantially alterregression trend analyses. By adjusting for red tide, theoutliers were removed from the dataset.
Seasons were defined as follows: winter (Decem-ber–February), spring (March–May), summer (June–August), and fall (September–November). We exam-ined five variables and analyzed their associationswith manatee deaths using two-way contingency tables.Pearson chi-square tests were employed to detect sig-nificant differences from an expected distribution(Sokal and Rohlf, 1997). A significant difference indi-cated that the two variables were not independent.The pairs of variables tested were cause of death andseason, cause of death and month, cause of death andcarcass size, carcass size and season, cause of death andregion, and season and region. Carcass size-classeswere defined by O’Shea et al. (1985): calves were smallerthan 176 cm and included aborted fetuses and smalldependent calves, subadults ranged from 176 cm to 275cm and included large dependent calves and inde-pendent subadults, and adults were manatees longerthan 275 cm.
Manatee carcass locations may not reflect theplaces where the animal died. In some cases, manateesmay be able to survive from days to months with an in-jury or infection and so may travel some distance be-fore expiring. Currents, tides, and wind also playimportant roles in determining where carcasses are ul-timately found.
Results and Discussion
Between 1976 and 2001, the 927 manatee carcasses re-covered from Lee County accounted for 21.4% of thestatewide total.Twenty-two percent (204) of these wererecovered between Shell Point and the Edison Bridge,
Caloosahatchee Manatees McDonald and Flamm
26 FWRI Technical Report TR-10
Figure 17 Trends in statewide manatee deaths (all causes, includingand excluding red tide) from 1976 to 2001.

including the surrounding canals of Cape Coral andFt. Myers. Figure 18 depicts where carcasses were re-covered in the study area.
REGIONAL DISTRIBUTION AND DENSITYTables 4–6 illustrate the numbers of carcasses recov-ered annually from each region. The annual rate ofincrease in the number of carcasses recovered wasgreatest in the West Region, that in the East Region wassimilar to the statewide trend, and that in the Mid Re-gion was lowest (Table 7; Figure 19).The annual rate ofincrease in the number of manatee carcasses recoveredin each of these three regions was lower than was therate for southwestern Florida (Pinellas County southto Monroe County). However, substantial fluctuationsacross years are indicated by the low r 2 values.
The weighted-means trends analysis showed thatdeaths increased in all regions (Table 8; see Flamm,
2001).The West Region had the greatest deviation fromzero for all death categories combined, with 4.1 yearsas the weighted mean. The number of carcasses re-covered in the West Region more than tripled from thefirst time period (1976–1988) to the second (1989–2001;Table 9).The weighted-means trend analysis combinedwith the number of carcasses recovered in each perioddistinguished the West Region as an area with a fasterrecent increase in the number of manatee deaths thanthe East or Mid regions.
The West Region had the largest area (130.8 km2 ofwater) but the fewest carcasses at 124. Thus, the WestRegion had the lowest density of manatee carcasses at0.95 carcasses per km2. The Mid Region, with an areaof 64.1 km2, had the greatest number of carcasses with204 but a density of only 3.2 carcasses per km2.The EastRegion was the smallest area (20.5 km2 of water), butit had 156 carcasses for a density of 7.6 per km2.
McDonald and Flamm Caloosahatchee Manatees
FWRI Technical Report TR-10 27
Table 3 Breakdown of annual manatee deaths statewide, 1976–2001.
Year Watercraft Flood Gate Other Perinatal Cold Other Verified, Not Undetermined, Undetermined Totals/Lock Human Stress Natural Recovered Too Decomposed
1976 10 4 0 14 0 2 9 7 16 621977 13 6 5 9 0 1 16 10 54 1141978 21 9 1 10 0 3 6 7 27 841979 24 8 9 9 0 4 5 0 18 771980 16 8 2 13 0 5 4 0 15 631981 24 2 4 13 0 9 2 0 62 1161982 20 3 1 14 0 41 6 0 29 1141983 15 7 5 18 0 6 2 0 28 811984 34 3 1 25 0 24 1 0 40 1281985 33 3 3 23 0 19 6 4 28 1191986 33 3 1 27 12 1 6 31 8 1221987 39 5 2 30 6 10 0 15 7 1141988 43 7 4 30 9 15 2 16 7 1331989 50 3 5 38 14 18 1 24 15 1681990 47 3 4 44 46 21 1 25 15 2061991 53 9 6 53 1 13 0 34 5 1741992 38 5 6 48 1 19 1 38 7 1631993 35 6 6 39 2 22 2 29 5 1461994 49 15 5 46 4 33 3 33 4 1921995 42 8 5 56 0 35 2 49 4 2011996 61 10 0 61 17 101 12 143 10 4151997 54 8 8 61 3 43 4 56 5 2421998 66 9 6 53 9 12 4 62 10 2311999 82 15 8 53 5 37 7 59 3 2692000 78 8 8 58 14 37 9 57 4 2732001 81 1 8 62 31 33 2 103 4 325Totals 1,061 168 113 907 174 564 113 802 430 4,332Percent 24.5% 3.9% 2.6% 20.9% 4.0% 13.0% 2.6% 18.5% 9.9%

TIME PERIODWhen combining data for the three regions, 329 deaths,or 68%, occurred in 1989–2001 compared to 155 in1976–1988 (from Table 9). Annual rates of increase forall causes of death, however, slowed from 7.4% (r 2 =0.36, P = 0.02) during 1976–1988 to 5.8% (r 2 = 0.24, P =0.05) during 1989–2001 when adjusted for red tide(Table 7).
SEASONOf the 484 deaths in the study area, 34% occurred inspring, followed closely by 32% in winter (Table 10).Thesummer months had the fewest carcasses at 15%; 44%of these were perinatals. Winter and spring had more“other natural”deaths, and summer and fall had moreperinatals (Table 10).
We found significant seasonal and monthly vari-ation in the number of deaths between the three re-gions (χ2
season = 37.9, pseason < 0.001; χ2month = 58.1, pmonth
< 0.001). There were more carcasses than expected inthe East Region during winter (especially in January),in the Mid Region in spring, and in the West Regionin October.This supports findings from telemetry stud-ies (Lefebvre and Frohlich, 1986; FWC, unpublisheddata) and aerial survey observations (FWC, 2000) of ashift in manatee distribution from winter warm-watersites and associated feeding areas upriver to springfeeding habitats downriver and in San Carlos Bay.TheOctober increase of carcasses in the West Region mayreflect a fall seasonal shift and overlap in manatee dis-tribution (see distribution section). That is, manateesusing the Caloosahatchee River in the warm season
Caloosahatchee Manatees McDonald and Flamm
28 FWRI Technical Report TR-10
Figure 18 Manatee carcass recovery locations from 1976 to 2001 in the study area, which is divided regionally: East Region (green),Mid Region (pink), and West Region (yellow).
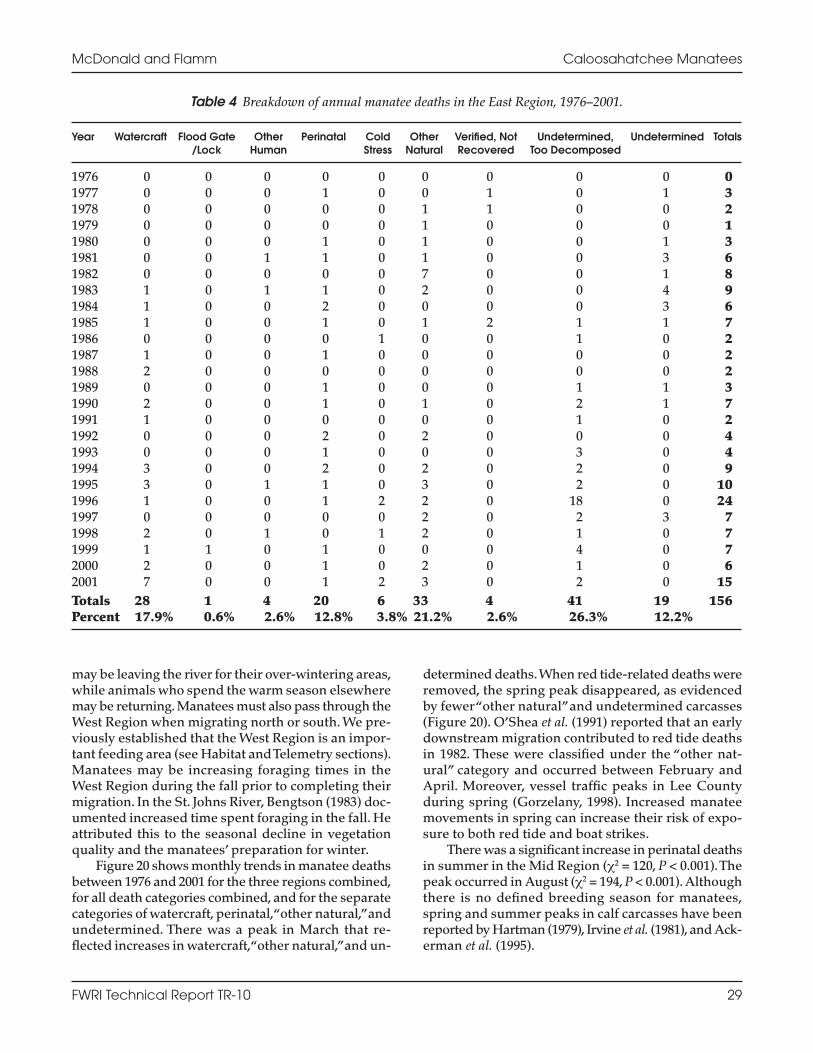
McDonald and Flamm Caloosahatchee Manatees
FWRI Technical Report TR-10 29
may be leaving the river for their over-wintering areas,while animals who spend the warm season elsewheremay be returning. Manatees must also pass through theWest Region when migrating north or south. We pre-viously established that the West Region is an impor-tant feeding area (see Habitat and Telemetry sections).Manatees may be increasing foraging times in theWest Region during the fall prior to completing theirmigration. In the St. Johns River, Bengtson (1983) doc-umented increased time spent foraging in the fall. Heattributed this to the seasonal decline in vegetationquality and the manatees’ preparation for winter.
Figure 20 shows monthly trends in manatee deathsbetween 1976 and 2001 for the three regions combined,for all death categories combined, and for the separatecategories of watercraft, perinatal,“other natural,”andundetermined. There was a peak in March that re-flected increases in watercraft,“other natural,”and un-
determined deaths.When red tide-related deaths wereremoved, the spring peak disappeared, as evidencedby fewer “other natural”and undetermined carcasses(Figure 20). O’Shea et al. (1991) reported that an earlydownstream migration contributed to red tide deathsin 1982. These were classified under the “other nat-ural” category and occurred between February andApril. Moreover, vessel traffic peaks in Lee Countyduring spring (Gorzelany, 1998). Increased manateemovements in spring can increase their risk of expo-sure to both red tide and boat strikes.
There was a significant increase in perinatal deathsin summer in the Mid Region (χ2 = 120, P < 0.001).Thepeak occurred in August (χ2 = 194, P < 0.001). Althoughthere is no defined breeding season for manatees,spring and summer peaks in calf carcasses have beenreported by Hartman (1979), Irvine et al. (1981), and Ack-erman et al. (1995).
Table 4 Breakdown of annual manatee deaths in the East Region, 1976–2001.
Year Watercraft Flood Gate Other Perinatal Cold Other Verified, Not Undetermined, Undetermined Totals/Lock Human Stress Natural Recovered Too Decomposed
1976 0 0 0 0 0 0 0 0 0 01977 0 0 0 1 0 0 1 0 1 31978 0 0 0 0 0 1 1 0 0 21979 0 0 0 0 0 1 0 0 0 11980 0 0 0 1 0 1 0 0 1 31981 0 0 1 1 0 1 0 0 3 61982 0 0 0 0 0 7 0 0 1 81983 1 0 1 1 0 2 0 0 4 91984 1 0 0 2 0 0 0 0 3 61985 1 0 0 1 0 1 2 1 1 71986 0 0 0 0 1 0 0 1 0 21987 1 0 0 1 0 0 0 0 0 21988 2 0 0 0 0 0 0 0 0 21989 0 0 0 1 0 0 0 1 1 31990 2 0 0 1 0 1 0 2 1 71991 1 0 0 0 0 0 0 1 0 21992 0 0 0 2 0 2 0 0 0 41993 0 0 0 1 0 0 0 3 0 41994 3 0 0 2 0 2 0 2 0 91995 3 0 1 1 0 3 0 2 0 101996 1 0 0 1 2 2 0 18 0 241997 0 0 0 0 0 2 0 2 3 71998 2 0 1 0 1 2 0 1 0 71999 1 1 0 1 0 0 0 4 0 72000 2 0 0 1 0 2 0 1 0 62001 7 0 0 1 2 3 0 2 0 15Totals 28 1 4 20 6 33 4 41 19 156Percent 17.9% 0.6% 2.6% 12.8% 3.8% 21.2% 2.6% 26.3% 12.2%
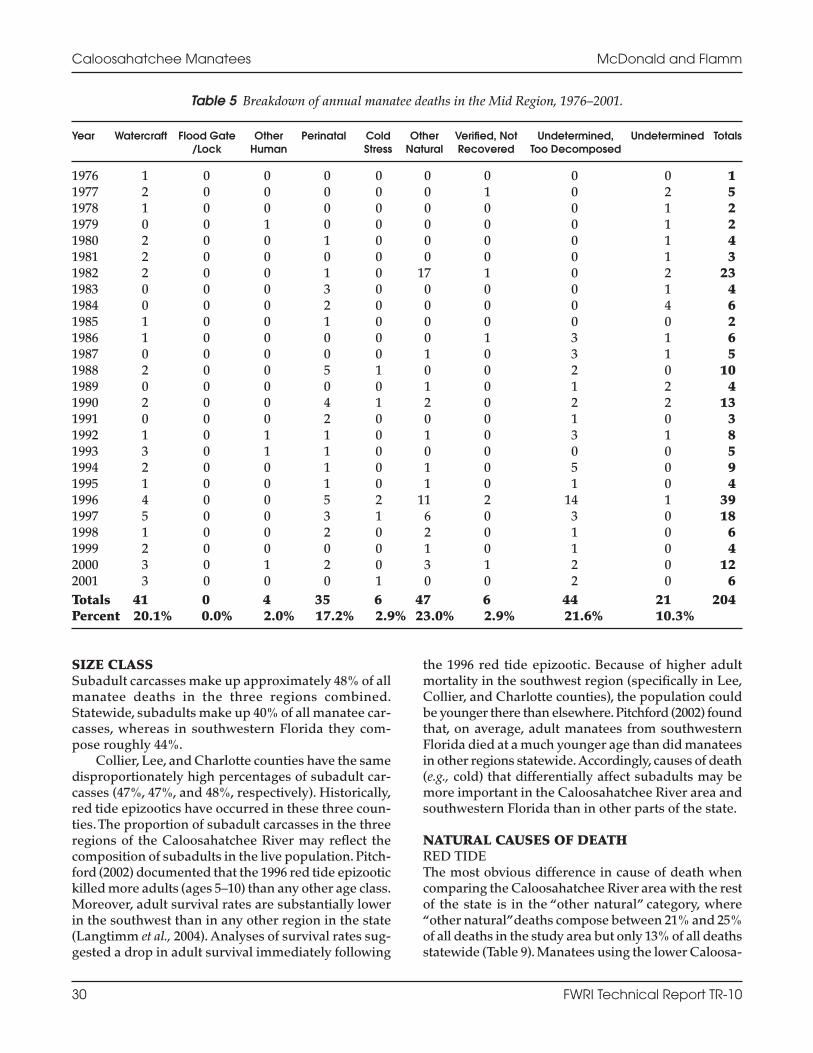
SIZE CLASSSubadult carcasses make up approximately 48% of allmanatee deaths in the three regions combined.Statewide, subadults make up 40% of all manatee car-casses, whereas in southwestern Florida they com-pose roughly 44%.
Collier, Lee, and Charlotte counties have the samedisproportionately high percentages of subadult car-casses (47%, 47%, and 48%, respectively). Historically,red tide epizootics have occurred in these three coun-ties.The proportion of subadult carcasses in the threeregions of the Caloosahatchee River may reflect thecomposition of subadults in the live population. Pitch-ford (2002) documented that the 1996 red tide epizootickilled more adults (ages 5–10) than any other age class.Moreover, adult survival rates are substantially lowerin the southwest than in any other region in the state(Langtimm et al., 2004). Analyses of survival rates sug-gested a drop in adult survival immediately following
the 1996 red tide epizootic. Because of higher adultmortality in the southwest region (specifically in Lee,Collier, and Charlotte counties), the population couldbe younger there than elsewhere. Pitchford (2002) foundthat, on average, adult manatees from southwesternFlorida died at a much younger age than did manateesin other regions statewide. Accordingly, causes of death(e.g., cold) that differentially affect subadults may bemore important in the Caloosahatchee River area andsouthwestern Florida than in other parts of the state.
NATURAL CAUSES OF DEATHRED TIDEThe most obvious difference in cause of death whencomparing the Caloosahatchee River area with the restof the state is in the “other natural” category, where“other natural”deaths compose between 21% and 25%of all deaths in the study area but only 13% of all deathsstatewide (Table 9). Manatees using the lower Caloosa-
Caloosahatchee Manatees McDonald and Flamm
30 FWRI Technical Report TR-10
Table 5 Breakdown of annual manatee deaths in the Mid Region, 1976–2001.
Year Watercraft Flood Gate Other Perinatal Cold Other Verified, Not Undetermined, Undetermined Totals/Lock Human Stress Natural Recovered Too Decomposed
1976 1 0 0 0 0 0 0 0 0 11977 2 0 0 0 0 0 1 0 2 51978 1 0 0 0 0 0 0 0 1 21979 0 0 1 0 0 0 0 0 1 21980 2 0 0 1 0 0 0 0 1 41981 2 0 0 0 0 0 0 0 1 31982 2 0 0 1 0 17 1 0 2 231983 0 0 0 3 0 0 0 0 1 41984 0 0 0 2 0 0 0 0 4 61985 1 0 0 1 0 0 0 0 0 21986 1 0 0 0 0 0 1 3 1 61987 0 0 0 0 0 1 0 3 1 51988 2 0 0 5 1 0 0 2 0 101989 0 0 0 0 0 1 0 1 2 41990 2 0 0 4 1 2 0 2 2 131991 0 0 0 2 0 0 0 1 0 31992 1 0 1 1 0 1 0 3 1 81993 3 0 1 1 0 0 0 0 0 51994 2 0 0 1 0 1 0 5 0 91995 1 0 0 1 0 1 0 1 0 41996 4 0 0 5 2 11 2 14 1 391997 5 0 0 3 1 6 0 3 0 181998 1 0 0 2 0 2 0 1 0 61999 2 0 0 0 0 1 0 1 0 42000 3 0 1 2 0 3 1 2 0 122001 3 0 0 0 1 0 0 2 0 6Totals 41 0 4 35 6 47 6 44 21 204Percent 20.1% 0.0% 2.0% 17.2% 2.9% 23.0% 2.9% 21.6% 10.3%

McDonald and Flamm Caloosahatchee Manatees
FWRI Technical Report TR-10 31
hatchee River and outer waters in late winter and springare periodically exposed to brevetoxin, a neurotoxin re-leased by the red tide organism Karenia brevis (O’Sheaet al., 1991; Bossart et al., 1998). Red tide caused highnumbers of manatee deaths in 1982, 1996, 2002, 2003, and2005 (O’Shea et al., 1985; Bossart et al., 1998; FWC un-published data). The 1982 red tide event was concen-trated at the mouth of the Caloosahatchee River and SanCarlos Bay. Above-normal temperatures led to earlymanatee migration downstream from the power plantand resulted in a large influx of manatees into the af-fected area (Beeler and O’Shea, 1988; O’Shea et al.,1991). A suite of factors including salinity, red tide con-centration, and manatee distribution makes it difficultto predict where or when an epizootic will occur (Lands-berg and Steidinger, 1998). Because capturing and re-locating exposed manatees is not feasible, even if wewere able to predict such events, there is very little wecan do to prevent manatee deaths related to red tide.
COLD–RELATEDCold-related deaths were not distinguished from “un-determined”or “other natural”prior to 1986 (Ackermanet al., 1995). Cold-related deaths accounted for a por-tion of the significant association between season andcause of death (Table 10). The FPL power plant in Ft.Myers supports one of the largest warm-water mana-tee aggregations in the state (O’Shea et al., 1985; Packardet al., 1989; Reynolds, 1996). In the winter of 1995–1996,Reynolds (1996) counted 434 manatees near the powerplant during one survey.The relatively low number ofcold-related deaths in the Caloosahatchee River (Table5) indicates that the power plant affords manatees ahigh level of protection from severe cold. Campbell andIrvine (1981) likened the configuration of the OrangeRiver discharge area to a natural spring run. Coldweather does not currently threaten manatees in thisarea to the extent that it does manatees overwinteringfarther south (e.g., in the Everglades). For example, in
Table 6 Breakdown of annual manatee deaths in the West Region, 1976–2001.
Year Watercraft Flood Gate Other Perinatal Cold Other Verified, Not Undetermined, Undetermined Totals/Lock Human Stress Natural Recovered Too Decomposed
1976 0 0 0 2 0 0 1 0 0 31977 0 0 0 1 0 0 0 1 0 21978 0 0 0 0 0 1 0 0 0 11979 0 0 0 0 0 0 0 0 0 01980 0 0 0 0 0 0 0 0 0 01981 0 0 0 2 0 0 0 0 1 31982 1 0 0 0 0 9 1 0 0 111983 0 0 0 0 0 1 0 0 0 11984 0 0 0 0 0 1 0 0 2 31985 0 0 0 0 0 1 0 0 0 11986 0 0 0 0 0 0 1 1 0 21987 2 0 0 0 0 0 0 0 0 21988 0 0 0 0 0 1 0 1 0 21989 0 0 0 2 0 0 0 1 0 31990 0 0 0 1 1 0 0 2 0 41991 1 0 0 4 0 0 0 0 0 51992 1 0 0 1 0 0 0 2 0 41993 1 0 0 2 0 1 0 0 0 41994 1 0 0 2 0 1 0 1 0 51995 0 0 0 6 0 0 0 0 1 71996 4 0 0 0 0 9 1 10 2 261997 1 0 0 2 0 1 0 1 0 51998 1 0 0 1 0 1 0 1 0 41999 3 0 1 0 0 2 0 2 0 82000 3 0 0 1 0 2 0 2 0 82001 5 0 0 1 0 0 0 3 1 10Totals 24 0 1 28 1 31 4 28 7 124Percent 19.4% 0.0% 0.8% 22.6% 0.8% 25.0% 3.2% 22.6% 5.6%

the colder-than-average winter of 2000–2001, manateesthat overwintered in the Ten Thousand Islands areashowed signs of cold-stress, while those that over-wintered at the Tampa Electric Company’s Big Bendpower plant in Tampa did not (R. Bonde, USGS, and H.Edwards, FWC, personal communication). In severelycold weather, however, a sizeable portion of the south-western Florida manatee population could be at riskof hypothermia or cold stress if the warm-water dis-charge at the Ft. Myers FPL power plant decreasedsubstantially or shut off completely. The alternativewarm-water sources discussed in the habitat section
probably would not be able to protect all the manateesthat use the power plant.
PERINATAL (CALVES LESS THAN 150 CM)Within the Mid Region, perinatal deaths were highlyvariable, ranging from zero to five per year (Table 5).They constituted 17% of all deaths but 21% of deathswhen the red tide epizootics were removed from thedata set, a percentage that mirrors the statewide av-erage of 20.9% (Tables 9 and 11).The weighted-meanstrend analysis revealed that perinatal deaths were in-creasing more recently statewide and in southwestern
Caloosahatchee Manatees McDonald and Flamm
32 FWRI Technical Report TR-10
Table 7 Annual rates of increase of manatee deaths in all regions combined, in each region, statewide, and insouthwestern Florida. Causes of death consist of all excluding red tide, watercraft, and all excluding both
watercraft and red tide. Time periods are 1976–2001, 1976–1988, and 1989–2001.
Time Location Cause of Death Rate of Adjusted P value ConfidencePeriod Increase/Year r 2 (±95%)
1976–2001 All Regions All–Red Tide Excluded 6.1% 0.64 <0.001 ±1.8%1976–2001 East All–Red Tide Excluded 5.6% 0.40 <0.001 ±2.7%1976–2001 Mid All–Red Tide Excluded 4.4% 0.34 0.001 ±2.4%1976–2001 West All–Red Tide Excluded 6.7% 0.61 <0.001 ±2.1%1976–2001 Statewide All–Red Tide Excluded 5.8% 0.86 <0.001 ±0.9%1976–2001 Southwest FL All–Red Tide Excluded 7.7% 0.80 <0.001 ±1.5%
1976–2001 All Regions Watercraft 6.8% 0.55 <0.001 ±2.5%1976–2001 East Watercraft 4.9% 0.37 <0.001 ±2.6%1976–2001 Mid Watercraft 2.9% 0.13 0.042 ±2.8%1976–2001 West Watercraft 5.8% 0.52 <0.001 ±2.2%1976–2001 Statewide Watercraft 6.9% 0.84 <0.001 ±1.2%1976–2001 Southwest FL Watercraft 10.2% 0.88 <0.001 ±1.4%
1976–1988 All Regions All–Red Tide Excluded 7.4% 0.36 0.017 ±5.8%1976–1988 Statewide All–Red Tide Excluded 4.7% 0.38 0.014 ±3.5%1976–1988 Southwest FL All–Red Tide Excluded 9.8% 0.47 0.006 ±6.2%
1989–2001 All Regions All–Red Tide Excluded 5.8% 0.24 0.052 ±5.9%1989–2001 Statewide All–Red Tide Excluded 4.8% 0.66 <0.001 ±2.1%1989–2001 Southwest FL All–Red Tide Excluded 6.2% 0.66 <0.001 ±2.7%
1976–1988 All Regions Watercraft 5.1% 0.14 0.116 ±6.6%1976–1988 Statewide Watercraft 9.9% 0.71 <0.001 ±3.9%1976–1988 Southwest FL Watercraft 15.9% 0.83 <0.001 ±4.3%
1989–2001 All Regions Watercraft 15.1% 0.61 <0.001 ±7.2%1989–2001 Statewide Watercraft 5.5% 0.54 0.003 ±3.1%1989–2001 Southwest FL Watercraft 9.2% 0.75 <0.001 ±3.2%
1976–1988 All Regions Non-watercraft, Red Tide excluded 6.9% 0.30 0.032 ±6.1%1976–1988 Statewide Non-watercraft, Red Tide excluded 3.1% 0.14 0.113 ±4.0%1976–1988 Southwest FL Non-watercraft, Red Tide excluded 7.5% 0.28 0.036 ±6.9%
1989–2001 All Regions Non-watercraft, Red Tide excluded 2.4% –0.02 0.399 ±6.2%1989–2001 Statewide Non-watercraft, Red Tide excluded 4.6% 0.60 0.001 ±2.3%1989–2001 Southwest FL Non-watercraft, Red Tide excluded 4.9% 0.44 0.008 ±3.3%
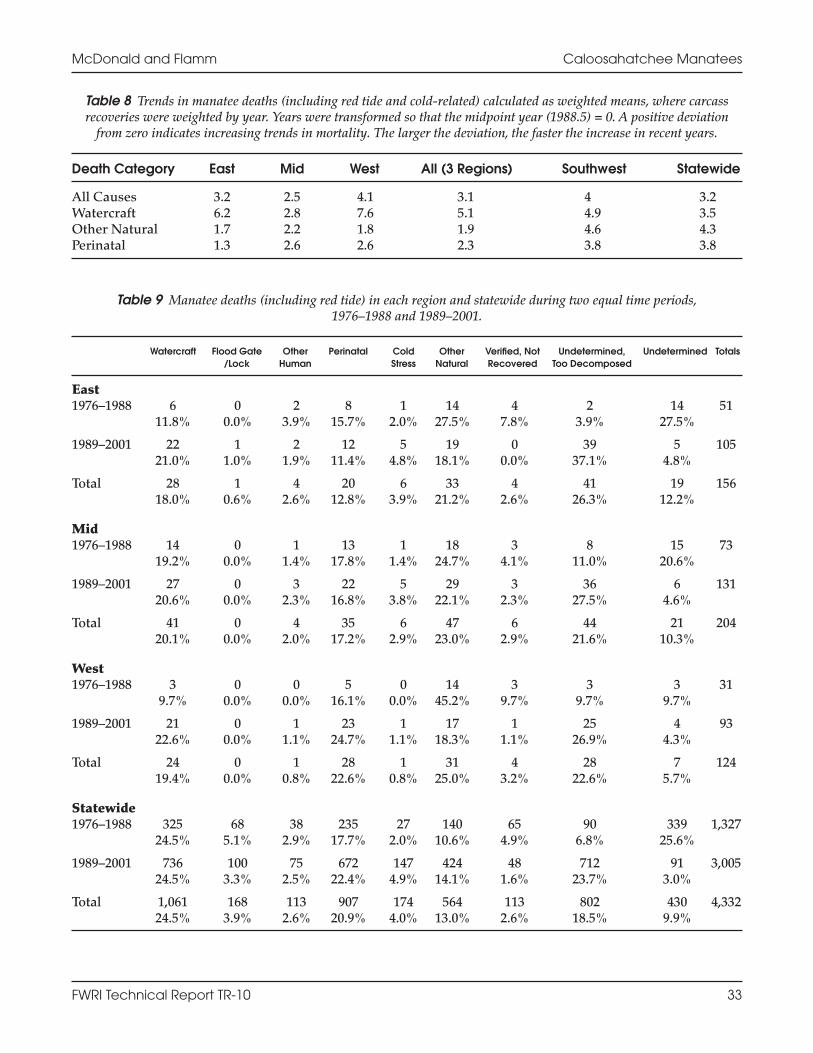
McDonald and Flamm Caloosahatchee Manatees
FWRI Technical Report TR-10 33
Table 8 Trends in manatee deaths (including red tide and cold-related) calculated as weighted means, where carcass recoveries were weighted by year. Years were transformed so that the midpoint year (1988.5) = 0. A positive deviation
from zero indicates increasing trends in mortality. The larger the deviation, the faster the increase in recent years.
Death Category East Mid West All (3 Regions) Southwest Statewide
All Causes 3.2 2.5 4.1 3.1 4 3.2Watercraft 6.2 2.8 7.6 5.1 4.9 3.5Other Natural 1.7 2.2 1.8 1.9 4.6 4.3Perinatal 1.3 2.6 2.6 2.3 3.8 3.8
Table 9 Manatee deaths (including red tide) in each region and statewide during two equal time periods,1976–1988 and 1989–2001.
Watercraft Flood Gate Other Perinatal Cold Other Verified, Not Undetermined, Undetermined Totals/Lock Human Stress Natural Recovered Too Decomposed
East1976–1988 6 0 2 8 1 14 4 2 14 51
11.8% 0.0% 3.9% 15.7% 2.0% 27.5% 7.8% 3.9% 27.5%
1989–2001 22 1 2 12 5 19 0 39 5 10521.0% 1.0% 1.9% 11.4% 4.8% 18.1% 0.0% 37.1% 4.8%
Total 28 1 4 20 6 33 4 41 19 15618.0% 0.6% 2.6% 12.8% 3.9% 21.2% 2.6% 26.3% 12.2%
Mid1976–1988 14 0 1 13 1 18 3 8 15 73
19.2% 0.0% 1.4% 17.8% 1.4% 24.7% 4.1% 11.0% 20.6%
1989–2001 27 0 3 22 5 29 3 36 6 13120.6% 0.0% 2.3% 16.8% 3.8% 22.1% 2.3% 27.5% 4.6%
Total 41 0 4 35 6 47 6 44 21 20420.1% 0.0% 2.0% 17.2% 2.9% 23.0% 2.9% 21.6% 10.3%
West1976–1988 3 0 0 5 0 14 3 3 3 31
9.7% 0.0% 0.0% 16.1% 0.0% 45.2% 9.7% 9.7% 9.7%
1989–2001 21 0 1 23 1 17 1 25 4 9322.6% 0.0% 1.1% 24.7% 1.1% 18.3% 1.1% 26.9% 4.3%
Total 24 0 1 28 1 31 4 28 7 12419.4% 0.0% 0.8% 22.6% 0.8% 25.0% 3.2% 22.6% 5.7%
Statewide1976–1988 325 68 38 235 27 140 65 90 339 1,327
24.5% 5.1% 2.9% 17.7% 2.0% 10.6% 4.9% 6.8% 25.6%
1989–2001 736 100 75 672 147 424 48 712 91 3,00524.5% 3.3% 2.5% 22.4% 4.9% 14.1% 1.6% 23.7% 3.0%
Total 1,061 168 113 907 174 564 113 802 430 4,33224.5% 3.9% 2.6% 20.9% 4.0% 13.0% 2.6% 18.5% 9.9%
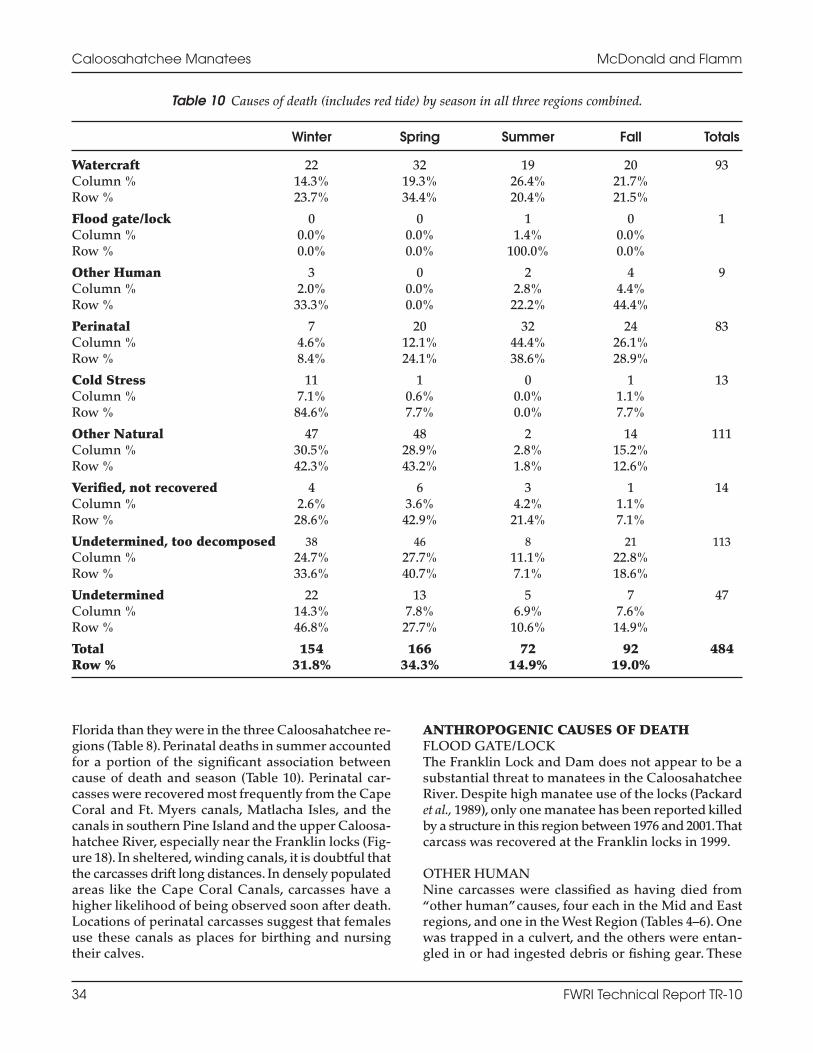
Florida than they were in the three Caloosahatchee re-gions (Table 8). Perinatal deaths in summer accountedfor a portion of the significant association betweencause of death and season (Table 10). Perinatal car-casses were recovered most frequently from the CapeCoral and Ft. Myers canals, Matlacha Isles, and thecanals in southern Pine Island and the upper Caloosa-hatchee River, especially near the Franklin locks (Fig-ure 18). In sheltered, winding canals, it is doubtful thatthe carcasses drift long distances. In densely populatedareas like the Cape Coral Canals, carcasses have ahigher likelihood of being observed soon after death.Locations of perinatal carcasses suggest that femalesuse these canals as places for birthing and nursingtheir calves.
ANTHROPOGENIC CAUSES OF DEATHFLOOD GATE/LOCKThe Franklin Lock and Dam does not appear to be asubstantial threat to manatees in the CaloosahatcheeRiver. Despite high manatee use of the locks (Packardet al., 1989), only one manatee has been reported killedby a structure in this region between 1976 and 2001.Thatcarcass was recovered at the Franklin locks in 1999.
OTHER HUMANNine carcasses were classified as having died from“other human”causes, four each in the Mid and Eastregions, and one in the West Region (Tables 4–6). Onewas trapped in a culvert, and the others were entan-gled in or had ingested debris or fishing gear. These
Caloosahatchee Manatees McDonald and Flamm
34 FWRI Technical Report TR-10
Table 10 Causes of death (includes red tide) by season in all three regions combined.
Winter Spring Summer Fall Totals
Watercraft 22 32 19 20 93Column % 14.3% 19.3% 26.4% 21.7%Row % 23.7% 34.4% 20.4% 21.5%
Flood gate/lock 0 0 1 0 1Column % 0.0% 0.0% 1.4% 0.0%Row % 0.0% 0.0% 100.0% 0.0%
Other Human 3 0 2 4 9Column % 2.0% 0.0% 2.8% 4.4%Row % 33.3% 0.0% 22.2% 44.4%
Perinatal 7 20 32 24 83Column % 4.6% 12.1% 44.4% 26.1%Row % 8.4% 24.1% 38.6% 28.9%
Cold Stress 11 1 0 1 13Column % 7.1% 0.6% 0.0% 1.1%Row % 84.6% 7.7% 0.0% 7.7%
Other Natural 47 48 2 14 111Column % 30.5% 28.9% 2.8% 15.2%Row % 42.3% 43.2% 1.8% 12.6%
Verified, not recovered 4 6 3 1 14Column % 2.6% 3.6% 4.2% 1.1%Row % 28.6% 42.9% 21.4% 7.1%
Undetermined, too decomposed 38 46 8 21 113Column % 24.7% 27.7% 11.1% 22.8%Row % 33.6% 40.7% 7.1% 18.6%
Undetermined 22 13 5 7 47Column % 14.3% 7.8% 6.9% 7.6%Row % 46.8% 27.7% 10.6% 14.9%
Total 154 166 72 92 484Row % 31.8% 34.3% 14.9% 19.0%

deaths occurred sporadically, and no more than one peryear died in the study area as a whole.
COLLISIONS WITH WATERCRAFTDeaths attributed to collisions with watercraft ac-counted for 19% of all deaths in the study area and23.5% of deaths with red tide removed (Table 11). Allregions showed increases in the number and propor-tion of watercraft-related deaths between 1976–1988and 1989–2001 (Table 9). The West Region had thelargest increase in the number of watercraft-relateddeaths between the two time periods, from 3 (9.7%) to21 (22.6%). Weighted-means trend analysis identifiedthe West Region as the area with the most recent in-crease in manatees killed by collisions with motor-boats (Table 8). Gorzelany (1998) documented thehighest vessel counts and densities of boats in easternSan Carlos Bay, which is part of the West Region. Herecorded more than five vessels per minute travelingin this area. Sidman and Flamm (2001) and Sidman etal. (2000, 2001) determined that the confluence of theCaloosahatchee River and San Carlos Bay had thegreatest boat density and congestion in Lee County.They identified this area as a boating “hot spot”and ahigh-use travel corridor (Figure 3). Sidman and Flamm
(2001) also found Matlacha Pass to be an area withhigh relative boat densities (Figure 3).
The East Region had the second greatest deviationfrom the median year (6.2 years), with more than triplethe number of watercraft carcasses in the second timeperiod of 1989–2001 (Tables 8, 9).The Mid Region is clos-est to the median (2.8 years) and had the smallest per-cent increase in watercraft-related deaths (Tables 7, 8).Between the two time periods,vessel-strike deaths in theother two regions increased more than the Mid Region(Table 9).These data suggest a shift in carcass locationsto the East and West regions in the most recent 13 years.
A combination of the following factors may con-tribute to the distribution of boat-strike manatee car-casses among the three regions. First, carcassdistribution may reflect the distribution of live mana-tees.The Mid Region is most likely a travel corridor con-necting important habitats to the east and west. Boththe East and West regions have manatee attractantssuch as SAV and warm-water refugia. Analysis oftelemetry data revealed that the East and West re-gions contain important places and corridors, and aer-ial survey results showed the changing seasonalimportance of each region (see Telemetry and AerialSurvey Sections). Second, environmental variablesmay cause manatee carcasses to drift upstream or
McDonald and Flamm Caloosahatchee Manatees
FWRI Technical Report TR-10 35
Figure 19 Tends in manatee deaths in the study area from 1976to 2001 (all causes excluding red tide) in a) Mid, b) East, and c) West regions.
Figure 20 Total number of manatee carcasses by month in the studyarea between 1976 and 2001 in watercraft, perinatal,“other nat-ural,”undetermined, and all death categories combined includingred tide (top) and excluding red tide (bottom).

downstream.Third, manatees suffering from a chronic,and ultimately fatal, injury may travel from one regionto another before dying. For example, manatees thatare fatally struck during winter feeding bouts may dieat the power plant. Finally, it is possible that the con-figuration of manatee speed zones influences water-craft-related mortality rates by changing both thevolume of vessel traffic and the configuration of boattraffic patterns. Buffer zones along the sides of theCaloosahatchee River may have decreased the risk ofmanatees being harmed by collisions with motorboatsin the Mid Region. In addition, changes were made tothe speed zone in the area near Shell Island (betweenmarkers 93 and 99). The previous slow-speed zone inthe ICW between 8:00 am and 6:00 pm became shore-to-shore slow speed, with a 25-mph speed zone in theICW. Gorzelany (1998) documented a change in boattraffic patterns that may have altered the risk to man-atees by concentrating all high-speed traffic into anarrow channel.
Between 1976 and 2001, the trend of the annual rateof increase of watercraft-related deaths for the threeregions combined was similar to the statewide trend
but substantially lower than the trend in southwesternFlorida (Table 7). During the most recent time period(1989 to 2001), however, the annual trend in water-craft-related deaths for the three regions combined in-creased by 15.1% per year (r 2 = 0.64, P < 0.001; Figure21). This rate of increase is higher than the rate insouthwestern Florida and almost triple the statewiderate during the same time frame (Table 7).
Increases in the number of human-caused mana-tee deaths and in annual mortality resulting from in-creased urban development in southwestern Floridawere predicted by O’Shea et al. (1985). As a result,O’Shea et al. (1985: 8) recommended the “establishmentof large manatee sanctuaries in western Florida beforerapid development leads to an increase in the fre-quency of human-related deaths.”
The 2000 census reported that the human popu-lation in Lee County had increased by 31.6% since1990 (http://quickfacts.census.gov/qfd/states/12000.html).This exceeded the average statewide populationgrowth of 23.5%. Nearby Collier County increased bymore than 65%.This may help explain the high (9.2%)annual rate of increase of watercraft-related deaths
Caloosahatchee Manatees McDonald and Flamm
36 FWRI Technical Report TR-10
Table 11 Number and percentage of manatee deaths in each cause-of-death category (unadjusted and adjusted for red tide) in East, West, and Mid regions and in all regions combined.
Watercraft Flood Gate Other Perinatal Cold Other Verified, Not Undetermined, Undetermined Totals/Lock Human Stress Natural Recovered Too Decomposed
EastUnadjusted 28 1 4 20 6 33 4 41 19 156
18.0% 0.6% 2.6% 12.8% 3.9% 21.2% 2.6% 26.3% 12.2%
Adjusted for 28 1 4 20 6 25 4 30 19 137Red Tide 20.4% 0.7% 2.9% 14.6% 4.4% 18.3% 2.9% 21.9% 13.9%
MidUnadjusted 41 0 4 35 6 47 6 44 21 204
20.1% 0.0% 2.0% 17.2% 2.9% 23.0% 2.9% 21.6% 10.3%
Adjusted for 41 0 4 34 6 17 6 34 20 162Red Tide 25.3% 0.0% 2.5% 21.0% 3.7% 10.5% 3.7% 21.0% 12.4%
WestUnadjusted 24 0 1 28 1 31 4 28 7 124
19.4% 0.0% 0.8% 22.6% 0.8% 25.0% 3.2% 22.6% 5.7%
Adjusted for 24 0 1 28 1 12 4 21 5 96Red Tide 25.0% 0.0% 1.0% 29.2% 1.0% 12.5% 4.2% 21.9% 5.2%
All 3 RegionsUnadjusted 93 1 9 83 13 111 14 113 47 484
19.2% 0.2% 1.9% 17.2% 2.7% 22.9% 2.9% 23.4%
Adjusted for 93 1 9 82 13 54 14 85 44 395Red Tide 23.5% 0.3% 2.3% 20.8% 3.3% 13.7% 3.5% 21.5% 11.1%

in southwestern Florida between 1989 and 2001.Although increases in deaths caused by collisions
with boats may suggest the presence of more mana-tees, the 15.1% annual rate of increase in watercraftmortality far exceeds the rate of increase of total deathsand the increase in natural deaths during the same timeperiod (Table 7).These comparisons suggest that ves-sel abundance increased or that the behaviors ofboaters or manatees, or both, changed.
SummaryManatee deaths from all causes increased in all re-gions of the Caloosahatchee River.The rates of increase,however, are comparable to statewide rate increases butare slower than those in southwestern Florida as awhole. Red tide may have caused a decrease in the ageof the population, as reflected by the higher proportionof subadult carcasses. Adult survival rates decreased im-mediately after the 1996 red-tide event. The Ft. Myerspower plant, and to some extent Matlacha Isles, haveprotected many manatees from exposure to cold; lossof the power plant could severely threaten manatees inthis area. The rate of increase in watercraft-relatedmanatee deaths between 1989 and 2001 in all three re-gions combined is higher than the rates of increase ofall death categories in all three regions combined, of allnon-human-related deaths in all three regions com-bined, of watercraft-related deaths in southwesternFlorida, and of watercraft-related deaths statewide.TheEast and West regions are areas with recent increasesin watercraft-related manatee deaths. The West Re-gion had the highest boat density of the three regions(Gorzelany, 1998; Sidman et al., 2000, 2001; Sidman andFlamm, 2001; Figure 3). Habitat, boating, telemetry, and
carcass data indicate that manatees in the West Re-gion may be at a higher risk of harmful collisions withwatercraft than those in either the Mid or East regions.
Manatee Distribution and Relative Abundance Data Collected Using Aerial Surveys
Introduction
Biologists use aerial surveys as a standard techniqueto assess manatee distribution and estimate manateeabundance. A distribution aerial survey is a series offlights over the same flight path once or twice permonth for one year or more (Ackerman, 1995). Synopticsurveys are winter aerial and ground surveys thatcover the manatees’ wintering habitats in Florida andsoutheastern Georgia (Ackerman, 1995). Aerial sur-veys have also been conducted over power plants, in-cluding the FPL Ft. Myers plant, to obtain informationabout long-term trends in the population at the plants.In contrast to telemetry data, which document thetravel history of individual animals over a long periodof time, aerial surveys record the instantaneous loca-tions of many manatees during one flight.
The U.S. Fish and Wildlife Service (FWS) con-ducted the first aerial surveys of manatees in theCaloosahatchee River in 1976 (Irvine and Campbell,1978). Since 1977, the Florida Power and Light Company(FPL) has sponsored winter surveys of the area aroundthe Ft. Myers power plant (Reynolds and Wilcox, 1994).The first distribution surveys in Lee County were con-ducted from January 1984 through December 1985(Frohlich et al., 1991). Additional surveys of Deep La-goon were made from 1986 to 1988. In Lee County,synoptic surveys included the FPL Ft. Myers powerplant, Eight Lakes, Shell Point, Matlacha Isles, andTen-Mile Canal. Annual highest counts from synopticsurveys in Lee County from 1991 and 1995 to 2001 arepresented in Table 12. Counts varied substantially be-tween flights of synoptic surveys, depending on the ob-server, weather conditions, and time of day. The twocoldest winters (1996 and 2001) yielded the highestcounts. Researchers, therefore, have found the syn-optic numbers to be unsuitable for population trendanalyses (Lefebvre et al., 1995).
Manatee distribution surveys can convey a broadpicture of seasonal manatee locations and identify im-portant habitat features that attract manatees. Thissection discusses manatee distribution and relativeabundance data collected during aerial surveys con-ducted in the 1990s over the Caloosahatchee River(FWC, 2000).
McDonald and Flamm Caloosahatchee Manatees
FWRI Technical Report TR-10 37
Figure 21 Trends in watercraft-related manatee deaths in thestudy area, 1976–1988 and 1989–2001.

Materials and Methods
Distribution aerial surveys that included the studyarea were made twice monthly from December 1994to November 1995 and from January to December 1997for a total of 48 flights (Ackerman, 1995; FWC, 2000).Thesurvey route is shown in Figure 22. In 2002, researchersfrom Mote Marine Laboratory made four additionalaerial surveys of the Caloosahatchee River from ShellPoint to the Edison Bridge (9 February, 10 and 24 April,and 29 May). Methods for conducting distribution aer-ial surveys are explained in Ackerman (1995) andLefebvre et al. (1995). Data recorded for each sightingincluded the number of manatees associated with thepoint location, number of calves if present, and man-atee behavior (Ackerman, 1995). Manatee distributiondata from surveys conducted in the 1990s were mappedin a Geographic Information System (GIS) database(FWC, 2000) and analyzed by applying a variable-shape spatial filter to make a contour map of manateeabundance (Flamm et al., 2001).
Spatial filtering is a method for transforming pointdata mapped in a two-dimensional space into a sur-face that has characteristics similar to a contour map.In a GIS, spatial filters are applied to raster maps. Araster map is similar in structure to a piece of graphpaper in that it consists of evenly sized cells arrangedinto rows and columns. Each cell in the map has avalue that corresponds to one of several attributes ofthe theme being mapped. For example, in a map of thetheme “Florida shoreline,” the attributes are land orwater. In the raster map, cells that correspond spa-tially to land are assigned a value, “1,” for instance,and those cells corresponding to water might be as-signed a value of “2.”
Applying a traditional spatial filter involves posi-tioning the center of a polygon over each cell in araster map, performing a mathematical operation ateach position with the values of cells located inside thepolygon, and storing the result of the operation in oneor more cells in the polygon. An example would be tocalculate the average value of all cells within the spa-tial filter polygon and store the result in the centercell. Usually the result of the mathematical operationis stored either in the cell positioned in the center ofthe polygon or all cells falling inside the polygon, de-pending on the goals of the filtering.
A key element of spatial filtering is the shape andsize of the polygon.Polygons tend to be isometric shapes,such as squares. Polygon size depends on the questionbeing addressed, because the larger the polygon, thelower the heterogeneity of the landscape—the upper andlower extreme values are smoothed out. In conven-tional filtering, the shape and size of the polygon arefixed. Although a fixed-shape approach is satisfactoryin many instances, it is less appropriate when we wantto exclude parts of the landscape from filtering (land inthe case of manatees) and guarantee that the polygonsare contiguous and not split apart by land.
The type of spatial filter and the method that weused in applying the spatial filter differs from the typeof spatial filter and method traditionally used in twoways. First, in contrast to positioning the filter polygonover every cell in the map and performing the math-ematical operation, we centered the polygon over theaerial survey point.This approach proved more efficientthan the traditional one because we did not filter areaswhere manatees were not present. Second, to addressthe constraint that manatees are restricted to the water,we applied a filter that varied in shape to avoid landand always contained the same area of water; this is incontrast to the fixed-shape polygon filter traditionallyused. When near land, the shape of the polygon devi-ated from a circle by expanding along and out from theshoreline until the specified water surface area had ac-cumulated. Only the nearest, contiguous cells to theaerial survey point that satisfied the area criteria wereincluded in the polygon. In this study, the spatial fil-ter polygon had an area of 0.332 km2 (532 25-m by25-m cells in the raster map) (Flamm et al., 1991).
The spatial filter worked as follows. Aerial surveypoints were processed incrementally. First, a polygonhaving an area of 0.332 km2 was delineated aroundthe aerial survey point. Only cells that were categorizedas water and were contiguous were included in thepolygon. Second, the number of animals that the pointrepresented was divided evenly among all 532 cells inthe polygon. For example, if the point representedthree animals, then each cell in the filter polygon was
Caloosahatchee Manatees McDonald and Flamm
38 FWRI Technical Report TR-10
Table 12 Highest manatee counts recorded during synoptic aerial surveys in Lee County.
Survey Adults Calves TotalYear_Number
1991_2 105 13 1181992_1 177 17 1941995_2 304 30 3341996_1 429 45 4741997_1 380 37 4171998_1 191 31 2221999_3 315 59 3742000_1 284 32 3162001_1 446 39 4852002_1 330 17 3472003_3 438 5 4432004_1 299 56 355
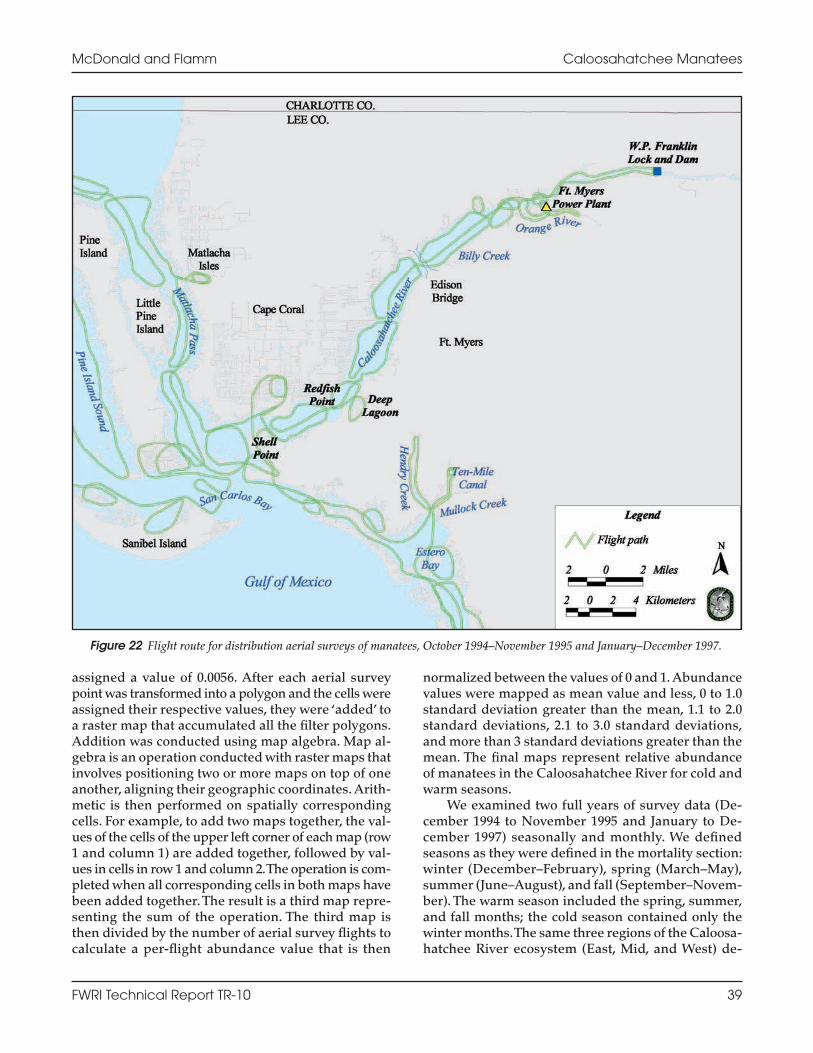
assigned a value of 0.0056. After each aerial surveypoint was transformed into a polygon and the cells wereassigned their respective values, they were ‘added’ toa raster map that accumulated all the filter polygons.Addition was conducted using map algebra. Map al-gebra is an operation conducted with raster maps thatinvolves positioning two or more maps on top of oneanother, aligning their geographic coordinates. Arith-metic is then performed on spatially correspondingcells. For example, to add two maps together, the val-ues of the cells of the upper left corner of each map (row1 and column 1) are added together, followed by val-ues in cells in row 1 and column 2.The operation is com-pleted when all corresponding cells in both maps havebeen added together.The result is a third map repre-senting the sum of the operation. The third map isthen divided by the number of aerial survey flights tocalculate a per-flight abundance value that is then
normalized between the values of 0 and 1. Abundancevalues were mapped as mean value and less, 0 to 1.0standard deviation greater than the mean, 1.1 to 2.0standard deviations, 2.1 to 3.0 standard deviations,and more than 3 standard deviations greater than themean. The final maps represent relative abundanceof manatees in the Caloosahatchee River for cold andwarm seasons.
We examined two full years of survey data (De-cember 1994 to November 1995 and January to De-cember 1997) seasonally and monthly. We definedseasons as they were defined in the mortality section:winter (December–February), spring (March–May),summer (June–August), and fall (September–Novem-ber). The warm season included the spring, summer,and fall months; the cold season contained only thewinter months.The same three regions of the Caloosa-hatchee River ecosystem (East, Mid, and West) de-
McDonald and Flamm Caloosahatchee Manatees
FWRI Technical Report TR-10 39
Figure 22 Flight route for distribution aerial surveys of manatees, October 1994–November 1995 and January–December 1997.

scribed in the mortality section were used in theseanalyses (see Figure 18 for region boundaries). We di-vided the total number of individuals counted on allflights in each region by the area of water in the region(Table 13).This was calculated to convey relative den-sity (counts per km2) as a means for comparing re-gions. We could not calculate absolute densitiesbecause we cannot quantify the number of manateescounted multiple times between surveys or because ofimmigration or emigration. Using two-way contin-gency tables, we analyzed the associations betweenmanatee sightings and season and month. Pearsonchi-square tests were employed to detect significant dif-ferences from an expected distribution (StatisticaTM,1996). A significant difference indicated that the twovariables were not completely independent and thata pattern existed.
Results and Discussion
Aerial survey results supported telemetry findingsthat manatees spend more time in the East and Westregions of the Caloosahatchee River and used the MidRegion principally as a travel corridor (Figure 23).Because of heavy use during winter and spring and itssmall area, the East Region had highest cold and warmseason counts per km2, but in summer and fall, the Easthad the lowest counts observed in all regions of theCaloosahatchee River (Table 13).
The monthly distribution of manatee sightingsfrom aerial surveys of all three regions revealed thegreatest number of manatees from January to March,with smaller peaks in May and August (Figure 24).Significantly more sightings than expected occurred inthe East Region in January and February and in theWest Region in September and October (χ2 = 1,021, P< 0.001; Table 14).The mortality data reported in the pre-vious section showed these same patterns, suggesting
Caloosahatchee Manatees McDonald and Flamm
40 FWRI Technical Report TR-10
Figure 23 Average manatee count per survey in each region ofthe Caloosahatchee River, recorded during 48 distribution aerialsurveys conducted December 1994–November 1995 andJanuary–December 1997.
Figure 24 Average monthly manatee count per survey of allthree regions combined, recorded during 48 distribution aerialsurveys conducted December 1994–November 1995 and Janu-ary–December 1997.
Table 13 Manatee counts and relative seasonal densitydetermined from distribution aerial surveys (December
1994–November 1995 and January–December 1997). Thistable does not reflect absolute densities because we are
unable to quantify the number of manatees counted mul-tiple times between surveys, immigration, or emigration.
Region Count Area (km2) Count/km2
All SeasonsEast 1,665 20.5 81.2Mid 818 64.1 12.8West 2,140 130.8 16.4
Warm (Mar–Nov)East 436 20.5 21.3Mid 441 64.1 6.9West 1,532 130.8 11.7
Winter (Dec–Feb)East 1,229 20.5 60.0Mid 377 64.1 5.9West 608 130.8 4.6
Spring (Mar–May)East 260 20.5 12.68Mid 202 64.1 3.15West 561 130.8 4.29
Summer (Jun–Aug)East 124 20.5 6.0Mid 134 64.1 2.1West 392 130.8 3.0
Fall (Sep–Nov)East 52 20.5 2.5Mid 105 64.1 1.6West 579 130.8 4.4

an association between areas of high manatee abun-dance and manatee deaths.
WINTER DISTRIBUTIONFigures 25 and 26 depict the relative abundance ofmanatees in the Caloosahatchee River in winter. Areaswith warm water discussed in the habitat section, in-cluding the Orange River and Matlacha Isles, have thehighest relative abundances (Figure 25). Other placesof interest include Eight Lakes, Chiquita Canal, IonaCove, and Deep Lagoon in the Mid Region and Beau-tiful Island and the Franklin locks in the East Region.
Matlacha Isles provides an important warm-waterrefuge for manatees, as discussed in previous sections.In addition to thermoregulation, manatees use the WestRegion in winter to travel between Matlacha Isles andthe seagrass beds in Matlacha Pass and San Carlos Bayand between Matlacha Isles and the power plant.
Eight Lakes appears to be not only a stop-oversite between warm-water refuges and feeding groundsbut also a place to seek temporary shelter during sud-den cold fronts. Chiquita Canal, Iona Cove, and DeepLagoon are also used in winter but not extensively.Manatees presumably use Chiquita Canal to travelbetween the Caloosahatchee River and Eight Lakes.Iona Cove is a possible feeding ground, whereas DeepLagoon probably stays warmer than the river and pro-vides fresh water.
As discussed in previous sections, the focus ofmanatee activity in the East Region during the winteris the Fort Myers power plant, and to a lesser extent,the Franklin locks.Winter temperatures in the OrangeRiver commonly exceed those of the Franklin locks.Consequently, more manatees are found near thepower plant than the locks (Packard et al., 1989;Reynolds, 2002). When water temperatures are17°–18°C, manatees frequently move between the locksand the power plant (Packard et al., 1989). On the rareoccasions when water temperatures were equal in theOrange River and the Franklin locks, roughly equalnumbers of manatees can occur in each area (Packardet al., 1989). It is during these times that manatees areat increased risk of harmful collisions with motorboatsbetween the Orange River and the Franklin locks.
In the East Region, manatees also travel betweenthe warm-water refuges and feeding grounds aroundBeautiful Island and areas upstream. Although re-searchers have reported evening and nighttime feed-ing in winter, manatees presumably forage duringthe day in milder weather (Bengtson, 1981; Bartonand Reynolds, 2001; Edwards et al., 2002). The EastRegion is critical to manatees overwintering in theCaloosahatchee River ecosystem. In the mortality sec-tion, it was reported that there were significantly more
winter deaths in this region and suggested that dur-ing winter, the power plant may act as a sink for deadmanatees.
WARM–SEASON DISTRIBUTIONAerial-survey data showed a springtime shift in man-atee distribution away from the East Region (Figures27 and 28). The relative abundance of manatees wasmoderate throughout the Caloosahatchee River, andmanatees were observed principally along the shoreof the river (Figure 27). Areas of interest included Mat-lacha Pass and San Carlos Bay in the West Region;Eight Lakes and Chiquita Canal, Deep Lagoon, andIona Cove in the Mid Region; and Beautiful Island, Or-ange River, a few oxbows on the north shore, and thelocks of the East Region.
McDonald and Flamm Caloosahatchee Manatees
FWRI Technical Report TR-10 41
Table 14 Monthly counts of manatees observed in eachregion during distribution aerial surveys, December1994–November 1995 and January–December 1997.
Month Region Row TotalsEast Mid West
January 635 145 272 1,052Row % 60.4% 13.8% 25.9%
February 401 133 234 768Row % 52.2% 17.3% 30.5%
March 106 108 324 538Row % 19.7% 20.1% 60.2%
April 41 41 73 155Row % 26.5% 26.5% 47.1%
May 113 53 164 330Row % 34.2% 16.1% 49.7%
June 27 20 84 131Row % 20.6% 15.3% 64.1%
July 54 54 106 214Row % 25.2% 25.2% 49.5%
August 43 60 202 305Row % 14.1% 19.7% 66.2%
September 24 10 242 276Row % 8.7% 3.6% 87.7%
October 7 20 154 181Row % 3.9% 11.1% 85.1%
November 21 75 183 279Row % 7.5% 26.9% 65.6%
December 193 99 102 394Row % 49.0% 25.1% 25.9%
Total 1,665 818 2,140 4,623Row % 36.0% 17.7% 46.3%

During the warm season, the number of manateesincreased substantially in the West Region, which hadseveral moderate- and high-abundance areas. Areas ofhighest use were San Carlos Bay, particularly near Mis-erable Mile, and the northeast side of Matlacha Pass.As mentioned previously, these sites contain numerousseagrass beds. Lefebvre and Frohlich (1986) reportedmanatees feeding in these regions. It is likely that man-atees use most of the West Region for feeding duringthe warm season. In addition to being a feeding area,Matlacha Pass acts as a manatee travel corridor, con-necting the Caloosahatchee River with Charlotte Har-bor. Manatee use of Matlacha Isles in the warm seasonis probably reflected by data collected during the tran-sitional months of March and November.
The high-density areas identified by the aerialspatial filter (Figures 27 and 28) correspond well with
the places and corridors discussed in the telemetrysection (Figure 15). In the Mid Region, highest densi-ties were recorded along the north shore west of theEdison Bridge, near downtown Ft. Myers, and at EightLakes, Chiquita Canal, Deep Lagoon, and Iona Cove.The importance of these locations as freshwatersources, resting areas, and nurseries was discussed inboth the Telemetry and Habitat sections. Moderaterelative abundance occurred on both shores wherethe river narrows at Shell Point and Redfish Point.Thisfinding agrees with other data indicating that mana-tees may cross the Caloosahatchee River at thesenarrow points.
During aerial surveys, manatees were most fre-quently seen along the shoreline. The survey route(Figure 22) shows that the center of the river was alsosurveyed, but depth, sea-state, turbidity, and water
Caloosahatchee Manatees McDonald and Flamm
42 FWRI Technical Report TR-10
Figure 25 Results of applying a variable-shape spatial filter to a point coverage of winter aerial surveys (all regions), December1994–February 1995 and January, February, and December 1997. The filter depicts relative abundance.

color in the center of the river make it difficult to seemanatees there (B. Ackerman, FWC personal com-munication). We believe that manatees travel alongthe shoreline, as indicated by the telemetry travelcorridor maps (Figures 15 and 16). However, lack ofaerial survey sightings in the center does not neces-sarily mean that manatees are not using it.The travelpaths, places, and corridors discussed in the teleme-try section show manatees crossing the river, espe-cially near Redfish Point and Shell Point. Few aerialsightings of manatees in the center may simply indi-cate that we were unable to see them there.
Manatees use the East Region less intensively insummer and fall than in winter and spring. Only 26%of the aerial survey sightings in the East Region oc-curred during the nine-month warm season. Manatees
were more widespread over their range during thewarm season (Figures 27 and 28). At this time mana-tees are likely feeding on tapegrass and widgeongrassor wallowing in the cooler sediments of the locks orother deeper areas (J. E. Reynolds, Mote Marine Lab-oratory, personal communication).
2002 SURVEYS OF THE CALOOSAHATCHEERIVER FROM SHELL POINT TO THEFRANKLIN LOCKSFigure 29 plots sightings from February to May 2002.Feb-ruary sightings were concentrated upriver, whereas theApril and May sightings were more dispersed. Lefeb-vre and Frohlich (1986) reported the same shift in man-atee distribution when they followed tagged animals.Water clarity in the Caloosahatchee River is poor, and
McDonald and Flamm Caloosahatchee Manatees
FWRI Technical Report TR-10 43
Figure 26 Results of applying a variable-shape spatial filter to a point coverage of winter aerial surveys (Mid Region), December1994–February 1995 and January, February, and December 1997. The filter depicts manatee relative abundance. Red lines indicate MidRegion boundaries.
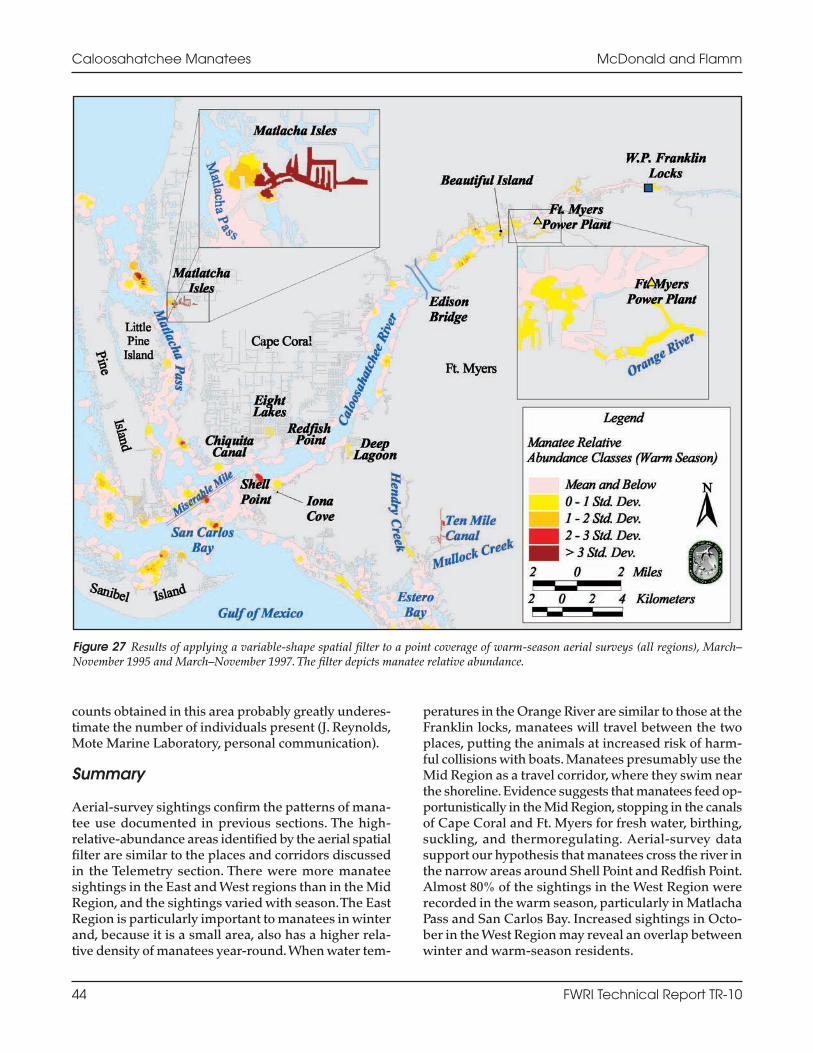
counts obtained in this area probably greatly underes-timate the number of individuals present (J. Reynolds,Mote Marine Laboratory, personal communication).
Summary
Aerial-survey sightings confirm the patterns of mana-tee use documented in previous sections. The high-relative-abundance areas identified by the aerial spatialfilter are similar to the places and corridors discussedin the Telemetry section. There were more manateesightings in the East and West regions than in the MidRegion, and the sightings varied with season.The EastRegion is particularly important to manatees in winterand, because it is a small area, also has a higher rela-tive density of manatees year-round.When water tem-
peratures in the Orange River are similar to those at theFranklin locks, manatees will travel between the twoplaces, putting the animals at increased risk of harm-ful collisions with boats. Manatees presumably use theMid Region as a travel corridor, where they swim nearthe shoreline. Evidence suggests that manatees feed op-portunistically in the Mid Region, stopping in the canalsof Cape Coral and Ft. Myers for fresh water, birthing,suckling, and thermoregulating. Aerial-survey datasupport our hypothesis that manatees cross the river inthe narrow areas around Shell Point and Redfish Point.Almost 80% of the sightings in the West Region wererecorded in the warm season, particularly in MatlachaPass and San Carlos Bay. Increased sightings in Octo-ber in the West Region may reveal an overlap betweenwinter and warm-season residents.
Caloosahatchee Manatees McDonald and Flamm
44 FWRI Technical Report TR-10
Figure 27 Results of applying a variable-shape spatial filter to a point coverage of warm-season aerial surveys (all regions), March–November 1995 and March–November 1997. The filter depicts manatee relative abundance.

Conclusions
All data indicate that the Caloosahatchee River is an im-portant place for large numbers of manatees in south-western Florida. Manatees are supported by the riveryear-round because of ample fresh water, numerousquiet canals, warm-water refugia, and areas of abun-dant submerged aquatic vegetation.Travel paths derivedfrom telemetry data show that for some manatees, theriver composes only a small portion of their total range(Weigle et al., 2001). Consequently, any impacts to man-atees in the Caloosahatchee River could ultimately af-fect manatees throughout southwestern Florida andthose who cross the state via Lake Okeechobee.
Distribution of Manatees
Manatees use the Mid Region, between Shell Pointand the Edison Bridge, principally as a travel corridor.Requisites such as warm water are found more abun-dantly west of Shell Point (West Region) and east of theEdison Bridge (East Region). Food is patchy in the MidRegion because fluctuations in salinity and increasedturbidity have caused a reduction in SAV. However,manatees opportunistically exploit some resourcesduring their travels. Minor aggregation areas includeEight Lakes, Chiquita Canal, Cape Coral Canals (ingeneral), Iona Cove, Deep Lagoon, and downtown Ft.Myers.Two places of particular importance in the Mid
McDonald and Flamm Caloosahatchee Manatees
FWRI Technical Report TR-10 45
Figure 28 Results of applying a variable-shape spatial filter to a point coverage of warm-season aerial surveys (Mid Region), March–November 1995 and March–November 1997. The filter depicts manatee relative abundance. Red lines indicate Mid Region boundaries.

Region are Redfish Point and Shell Point. Manateesmust pass Shell Point to enter or leave the river. Red-fish Point contains fresh water and many entrances intothe canals of Cape Coral. Based on this information andthat derived from telemetry, manatees presumablycross the river in these narrow areas and spend timein the center of the river between Redfish Point andDeep Lagoon.
Telemetry studies by Lefebvre and Frohlich (1986)and Weigle et al. (2001) reported seasonal changes inmanatee distribution in the Caloosahatchee River.During spring (March–June), winter residents (De-cember–February) migrate downriver from east of theEdison Bridge. Aerial survey sightings and carcass re-covery locations reflect this pattern of changing sea-sonal distribution. Manatee travel paths show
restricted, wintertime movements that are concen-trated upriver, near Matlacha Isles, and occasionally be-tween the two refugia. During the warm season,manatees use the river extensively, taking advantageof available resources such as SAV, fresh water, and rest-ing areas.
Distribution of Humans
Data indicate that large areas of overlap between boatsand manatees exist in and around the CaloosahatcheeRiver. One area of particular importance is the mouthof the Caloosahatchee River. This section was identi-fied as a boating “hot spot,” with the highest vesselcounts, most congestion, and greatest density of boatsin Lee County (Gorzelany, 1998; Sidman and Flamm,
Caloosahatchee Manatees McDonald and Flamm
46 FWRI Technical Report TR-10
Figure 29 Locations of manatees sighted during survey flights between the mouth of the Caloosahatchee River and the W.P. FranklinLock and Dam, February–May 2002. Each point represents 1 to 12 manatees (Mote Marine Laboratory, unpublished data).

2001). Much of the traffic originates in the Cape Coraland Ft. Myers canals and travels out the mouth of theriver. Gorzelany (1998) recorded highest traffic vol-umes in the spring (March–May), which coincides withthe shift and dispersal of manatees from winter refu-gia to warm-weather habitats and feeding areas. Si-multaneous increases in vessel traffic and manateemovements can result in a high risk of manatee-mo-torboat collisions. Mortality data show a peak in man-atee boat-strike deaths from March to May (Table 10).
Mortality and Injury
There is a trend of an increasing number of manateedeaths in and around the Caloosahatchee River.Whencomparing the first 13 study years (1976–1988) withthe most recent 13 years (1989–2001), the annual rateof increase of manatee deaths (all categories) in theCaloosahatchee River (East, Mid, and West regionscombined) has actually slowed from 7.4% per year to5.8% per year. Between 1989 and 2001, however, the an-nual rate of increase for watercraft-related manateedeaths was 15.1%. Although increases in boat-strikedeaths may suggest the presence of more manatees, the15.1% annual rate of increase of watercraft-relateddeaths far exceeds the rate of increase of total deathsin the same time period (5.8%), suggesting a change inboater abundance and/or behavior.
In winter, data indicate that the East Region is a sinkfor fatally injured manatees. In some winters, increasedmanatee movements between the power plant andthe Franklin locks also increase the likelihood of harm-ful collisions with boats in this area. Evidence sug-gests that the mouth of the river, San Carlos Bay,Redfish Point, and Matlacha Pass are other areas wheremanatees are at risk of being struck by a boat.
Between time periods one (1976–1988) and two(1989–2001) there were fewer watercraft-related man-atee deaths in the Mid Region than in either the Eastor West regions. We discussed several possibilities forexplaining this pattern: carcass distribution may reflectdistribution of live manatees; manatees may be struckelsewhere, then swim to these areas and die there;carcasses may drift into these areas; or the configura-tion of the speed zones may have changed boat traf-fic, putting manatees at greater risk of being struck bya boat near the mouth and decreasing that risk in theMid Region. Because of limitations in determiningwhere manatees are actually struck and killed, it isextremely difficult to attribute increasing trends inwatercraft-related deaths to one particular source.Moreover, none of the possibilities mentioned explainwhy watercraft-related deaths since 1989 are increas-ing in the Caloosahatchee River area faster than in
southwestern Florida or in the state as a whole. Con-sequently, biologists and managers are often askedthe question, Do manatee speed zones work?
Research Needs
At this time, answering that question with any certaintyis not possible. We know that assessment of mortalityrates is not a direct measure of speed zone effective-ness. Even if a manatee speed zone achieved a very highlevel of compliance (e.g., 90%), extremely high trafficvolumes would still create a substantial threat to man-atees (e.g., at the mouth of the Caloosahatchee River).Conversely, a low rate of boater compliance wouldalso put manatees at risk of harmful collisions with wa-tercraft. As the human population continues to in-crease in southwestern Florida, we are probablyrecovering a higher proportion of carcasses than be-fore, but we are still unable to determine the numberof carcasses that go unreported. Furthermore, we donot know what would have happened if the speedzone rules were never enacted. In other words, thereis no way to control for the many variables that con-tribute to watercraft-related manatee deaths, so it is dif-ficult to assess the effect of one variable—the presenceor absence of speed zones. Most carcasses bear scarsfrom multiple boat strikes, and we do not know the ex-tent to which nonlethal injuries affect manatee healthand reproduction (O’Shea et al., 2001; Wright et al.,1995).
Some of the variables that are involved in tryingto address the question, Do speed zones work? arethe following: exact location of death, habitat charac-teristics, vessel traffic, compliance levels, manatee be-havior, manatee travel paths, and boat speed, size, andtype. The best way to address this question is by ap-plying a simulation model to a risk analysis. Simula-tion models can incorporate a multitude of variablesand an infinite number of scenarios and replicationsthat would take years to assess without the use ofmodels. Through multiple simulations, the modelwould create risk maps of particular areas under thedifferent chosen scenarios. FWRI staff are beginningto investigate the use of risk analysis. Currently, how-ever, our best method may be through a “weight-of-ev-idence”approach. By examining the variables describedin this report (habitat, manatee distribution, move-ments, and hot spots; and human use) we can get a bet-ter understanding of how the living manatee andhuman populations behave and the risks that mana-tees encounter.
To improve our understanding of human behaviorand attitudes,we should continue investigating boat traf-fic patterns and the effects of manatee speed zones on
McDonald and Flamm Caloosahatchee Manatees
FWRI Technical Report TR-10 47

these patterns. Are some speed zones shifting traffic insuch a way as to increase risk to manatees? Past stud-ies have focused on boater behavior but lacked exami-nation of the reasons behind the observed behavior.Sociologists have the ability to question the resource userto determine why he or she chooses to behave in a cer-tain manner (i.e., comply with a speed zone). Attitudes,motivations, and behaviors of the public are not only im-portant components of a risk assessment model,but theycan provide managers and law enforcement with in-formation to better seek alternative means of influenc-ing human behavior (Sorice et al., 2004).
Improvements in manatee research methods willalso provide better parameters for the risk assessmentmodel.The scientific community involved in manateeresearch continues to explore different ways of min-ing, collecting, and analyzing data about manatees.Newly available, satellite-linked GPS tags allow us tomap fine-scale movements. By using GPS-tags inconjunction with time-depth data loggers and behav-ioral observations, we can create a more complete, de-tailed picture about when manatees travel, where theygo, and what they are doing. Improved spatial filterswill more accurately depict relative abundance, andsimulation models will give us a better method of as-sessing risks to manatees under an unlimited numberof scenarios.These risk assessments are currently themost appropriate and effective way to answer theprevalent question, Do manatee speed zones work?
Acknowledgments
The authors thank the following people for theirassistance, insights, and prompt responses to datarequests: Dr. John E. Reynolds, III and Rachel Nostrom(Mote Marine Laboratory),Tracy McCord and WinifredPerkins (Florida Power and Light Corporation), AmyHoyt (Lee County Department of Public Works),Catherine Corbett (Charlotte Harbor National Estu-ary Program), Dr. Peter Doering (South Florida WaterManagement District), and Dr. Steve Bortone (theConservancy of Southwest Florida). We thank the fol-lowing former and current employees of the FloridaFish and Wildlife Conservation Commission (FWC):Bruce Ackerman, Margie Barlas, Holly Edwards, PattiHaase, Elsa Haubold, Lucy Keith, Gil McRae, MeghanPitchford, Thomas Pitchford, Tanya Pulfer, Sentiel“Butch”Rommel, William Sargent, Alexander Smith,and Earnest Truby for their assistance and insights.Wealso wish to thank the following former and currentFWC staff for editorial review and expertise: BruceAckerman, Kristin Child, Mary Duncan, Charles“Chip” Deutsch, Holly Edwards, Llyn French, KippFrohlich, Elsa Haubold, Judy Leiby, Ron Mezich,
Thomas Pitchford, Tanya Pulfer, James Quinn, KellySchratwieser, Kent Smith, Michael Sorice, Linda Torres,and Leslie Ward-Geiger.
Literature Cited
ACKERMAN, B. B. 1995. Aerial surveys of manatees: a sum-mary and progress report. Pp. 13–33 in T. J. O’Shea, B. B.Ackerman, and H. F. Percival, eds. Population Biology of theFlorida Manatee. National Biological Service Informationand Technology Report 1. Washington, D.C. 289 pp.
ACKERMAN, B. B. 2002. Use of aerial survey and carcass datato model manatee population growth. Presented at the Man-atee Population Ecology and Management Workshop, 1–4April 2002, Gainesville, Florida.
ACKERMAN, B. B., S. D. WRIGHT, R. K. BONDE, D. K.ODELL, and D. J. BANOWETZ. 1995.Trends and patterns inmortality of manatees in Florida, 1974–1992. Pp. 223–258 inT. J. O’Shea, B. B. Ackerman, and H.F. Percival, eds. Popula-tion Biology of the Florida Manatee. National Biological Ser-vice Information and Technology Report 1.Washington, D.C.289 pp.
BARTON, S. L., and J. E. REYNOLDS, III. 2001. Manatee useof Matlacha Isles, a secondary winter refuge site in south-western Florida. Mote Marine Laboratory Technical ReportNo. 778. Sarasota, Florida. 25 pp.
BECK, C. A., and N. B. BARROS. 1991. The impact of debrison the Florida manatee. Marine Pollution Bulletin 22: 508–510.
BECK, C. A., and J. P. REID. 1995. An automated photo-iden-tification catalog for studies of the life history of the Floridamanatee. Pp. 120–134 in T. J. O’Shea, B. B. Ackerman, and H.F. Percival, eds. Population Biology of the Florida Manatee.National Biological Service Information and Technology Re-port 1. Washington, D.C. 289 pp.
BECK, C. A., R. K. BONDE, and G. B. RATHBUN. 1982. Analy-ses of propeller wounds on manatees in Florida. Journal ofWildlife Management 46(2): 531–535.
BEELER, I. E., and T. J. O’SHEA. 1988. Distribution and mor-tality of the West Indian manatee (Trichechus manatus) in thesoutheastern United States: A compilation and review ofrecent information. National Ecology Research Center. Re-port No. 88-09. Pp. 478–518.
BENGTSON, J. L. 1981. Ecology of manatees (Trichechus man-atus) in the St. Johns River, Florida. Ph.D. Dissertation, Uni-versity of Minnesota, Minneapolis. 126 pp.
BENGTSON, J. L. 1983. Estimating food consumption of free-ranging manatees in Florida. Journal of Wildlife Management47(4): 1186–1192.
BONDE, R. K., T. J. O’SHEA, and C. A. BECK. 1983. Manualof procedures for the salvage and necropsy of carcasses ofthe West Indian manatee (Trichechus manatus). National Tech-nical Information Service, No. PB83-255273, Springfield,VA.175 pp.
Caloosahatchee Manatees McDonald and Flamm
48 FWRI Technical Report TR-10

BORTONE, S. A., and R. K.TURPIN. 2000.Tapegrass life his-tory metrics associated with environmental variables in a con-trolled estuary. Pp. 65–79 in S. A. Bortone, ed. Seagrassesmonitoring, ecology, physiology, and management. CRCPress, Boca Raton, Florida. 336 pp.
BOSSART, G. D., D. G. BADEN, R.Y. EWING, B. ROBERTS,and S. D. WRIGHT. 1998. Brevetoxicosis in manatees(Trichechus manatus latirostris) from the 1996 epizootic: gross,histologic, and immunohistochemical features. ToxicologicPathology 26(2): 276–282.
BOSSART, G. D., R. A. MEISNER, S. A. ROMMEL, S-J. GHIM,and A. B. JENSON. 2003. Pathological features of the Floridamanatee cold stress syndrome. Aquatic Mammals 29(1):9–17.
BUCKINGHAM, C. A. 1990. An evaluation of manatee dis-tribution patterns in response to public use activities inKings Bay, Crystal River, Florida. Florida Cooperative Fish andWildlife Research Unit, University of Florida, Gainesville,Florida. 49 pp.
BUCKINGHAM, C. A., L. W. LEFEBVRE, J. M. SCHAEFER,and H. I. KOCHMAN. 1999. Manatee response to boating ac-tivity in a thermal refuge. Wildlife Society Bulletin 27(2):514–522.
CAMPBELL, H.W., and A. B. IRVINE. 1981. Manatee mortalityduring the unusually cold winter of 1976–1977. Pp. 86–91 inR. L. Brownell, Jr., and K. Ralls, eds.The West Indian mana-tee in Florida. Proceedings of a workshop, 27–29 March 1978,Orlando, Florida .
CHAMBERLAIN, R. H., and P. H. DOERING. 1998. Prelimi-nary estimate of optimum freshwater inflow to the Caloosa-hatchee Estuary: A resource-based approach. South FloridaWater Management District Report.West Palm Beach, Florida.21 pp.
DEUTSCH, C. J., R. K. BONDE, and J. P. REID. 1998. Radio-tracking manatees from land and space: tag design, imple-mentation, and lessons learned from long-term study. MarineTechnology Society Journal 32(1): 18–29.
DEUTSCH, C. J., H. H. EDWARDS, and A. J. SMITH. 2003.Argos-linked GPS tags as a new tool to investigate manateebehavior: preliminary results on winter use of a warm-waterrefuge. In Proceedings of the Argos Animal Tracking Sym-posium, March 24–26 2003, Annapolis, Maryland. 6 pp.
DEUTSCH, C. J., J. P. REID, R. K. BONDE, D. E. EASTON, H.I. KOCHMAN, and T. J. O’SHEA. 2000. Seasonal movements,migratory behavior, and site fidelity of West Indian mana-tees along the Atlantic coast of the United States as deter-mined by radio-telemetry. Final Report. Research WorkOrder No. 163. Florida Cooperative Fish and Wildlife ResearchUnit, U.S. Geological Survey and University of Florida. 254pp. + xii.
DEUTSCH, C. J., J. P. REID, R. K. BONDE, D. E. EASTON, H.I. KOCHMAN, and T. J. O’SHEA. 2003. Seasonal movements,migratory behavior, and site fidelity of West Indian mana-
tees along the Atlantic coast of the United States. WildlifeMonographs 151: 1–77.
EBERHARDT, L. L., and T. J. O’SHEA. 1995. Integration ofmanatee life-history data and population modeling. Pp.269–279 inT. J. O’Shea, B. B. Ackerman, and H. F. Percival, eds.Population Biology of the Florida Manatee. National Bio-logical Service Information and Technology Report 1.Wash-ington, D.C. 289 pp.
EDWARDS, H. H., B. B. ACKERMAN, J. E. REYNOLDS, III,and J. A. POWELL. 2002. Calibrating aerial manatee countsat Tampa Bay power plants using a numeric correction factor.Presented at the Manatee Population Ecology and Manage-ment Workshop, 1–4 April 2002, Gainesville, Florida.
EDWARDS, H. H., B. B. ACKERMAN, J. E. REYNOLDS, III,and J. A. POWELL. 2003. Calibrating aerial counts of mana-tees at a Tampa Bay power plant. Presented at the 15thBiennial Conference on the Biology of Marine Mammals,14–19 December 2003, Greensboro, North Carolina.
ESTEVEZ, E. D. 2000. Matching salinity metrics to estuarineseagrasses for freshwater inflow management. Pp. 295–307in S. A. Bortone, ed. Seagrasses Monitoring, Ecology, Phys-iology, and Management. CRC Press, Boca Raton, Florida.336 pp.
FLAMM, R. O. 2001. Alternative methods for characterizingstatewide boat-strike mortality to manatees. Final Reportsubmitted to the U.S. Fish and Wildlife Service. Florida Ma-rine Research Institute, St. Petersburg, Florida. 19 pp.
FLAMM, R. O., L. I. WARD, and B. L. WEIGLE. 2001. Apply-ing a variable-shape spatial filter to map relative abundanceof manatees (Trichechus manatus latirostris). Landscape Ecol-ogy 16: 279–288.
FLAMM, R. O., B. L. WEIGLE, I. E. WRIGHT, M. ROSS, andS. AGLIETTI. 2005. Estimation of manatee (Trichechus man-atus latirostris) places and movement corridors using teleme-try data. Ecological Applications 15(4): 1415–1426.
FPL (FLORIDA POWER AND LIGHT COMPANY) ENVI-RONMENTAL SERVICES DEPARTMENT. 2002. Raw data,intake and discharge temperatures. Ft. Myers plant,1999–2002. Juno Beach, Florida.
FROHLICH, R. K., B. B. ACKERMAN, and M. A. CLEMONS.1991. Manatee abundance and distribution in Lee County,Florida, 1984–85. U.S. Fish and Wildlife Service and FloridaDepartment of Natural Resources Draft Report: 1–19.
FLORIDA FISH AND WILDLIFE CONSERVATION COM-MISSION. 2000. Atlas of marine resources. R. O. Flamm, L.I. Ward, and M. White, eds.Version 1.3.
FLORIDA FISH AND WILDLIFE CONSERVATION COM-MISSION. 2002. Florida Fish and Wildlife Conservation Com-mission’s Proposed Final Order at (pp. 11, 12). Thomas D.McGill et al. v. Fla. Fish & Wildlife Conservation Comm.,Case No. 01-2114RP (Florida Division of AdministrativeHearings), January 22, 2002.
McDonald and Flamm Caloosahatchee Manatees
FWRI Technical Report TR-10 49

Caloosahatchee Manatees McDonald and Flamm
50 FWRI Technical Report TR-10
GARROTT, R. A., B. B. ACKERMAN, J. R. CARY, D. M.HEISEY, J. E. REYNOLDS, III, P. M. ROSE, and J. R.WILCOX.1994.Trends in counts of Florida manatees at winter aggre-gation sites. Journal of Wildlife Management 58(4): 642–654.
GORZELANY, J. 1998. Evaluation of boat traffic patterns andboater compliance in Lee County, Florida. Final grant reportsubmitted to the Florida Department of Environmental Pro-tection.Tallahassee, Florida. 106 pp.
GUNTER, G., and G. E. HALL. 1962. Biological investigationsof Caloosahatchee estuary in connection with Lake Okee-chobee discharges through Caloosahatchee River. A Reportto the District Engineer, Jacksonville District, Corps of En-gineers. Serial No. 39. 59pp. + appendices.
HARTMAN, D. S. 1974. Distribution, status, and conserva-tion of the manatee in the United States. National TechnicalInformation Service No. PB81-140725. Springfield,Virginia.247 pp.
HARTMAN, D. S. 1979. Ecology and behavior of the man-atee (Trichechus manatus) in Florida. American Society ofMammalogists Special Publication No. 5. 153 pp.
HARWOOD, J., and A. HALL. 1990. Mass mortality in ma-rine mammals: its implications for population dynamicsand genetics.Trends in Ecology and Evolution 5: 254–257.
IRVINE, A. B. 1983. Manatee metabolism and its influence ondistribution in Florida. Biological Conservation 25: 315–334.
IRVINE A. B. and H. W. CAMPBELL. 1978. Aerial census ofthe West Indian manatee, Trichechus manatus, in the south-eastern United States. Journal of Mammalogy 59: 13–617.
IRVINE, A. B., D. K. ODELL, and H. W. CAMPBELL. 1981.Manatee mortality in the southeastern United States from1974 through 1977. Pp. 67–75 in R. L. Brownell, Jr., and K. Ralls,eds. The West Indian manatee in Florida. Proceedings of aworkshop, 27–29 March 1978, Orlando, Florida.
KIMES, C. A., and L. C. CROCKER. 1998.The CaloosahatcheeRiver and its watershed. A historical overview submitted toFlorida Gulf Coast University Library Services. Florida Cen-ter for Environmental Studies.
KING, J. M. 2002. An Assessment of manatee behavior as af-fected by human interactions at two sites in Crystal River,Florida. Master’s Thesis. Florida International University.Miami, Florida. 66 pp.
KINNAIRD, M. F. 1985. Aerial census of manatees in north-eastern Florida. Biological Conservation 32: 59–79
KOELSCH, J., and B. ACKERMAN. 2001. Do you see what Isee? Use of tandem aerial surveys to estimate manatee vis-ibility biases. Presented at the 14th Biennial Conference onthe Biology of Marine Mammals, 28 November–3 DecemberVancouver, B.C., Canada.
LANDSBERG, J. H., and K. A. STEIDINGER. 1998. A histor-ical review of Gymnodinium breve, red tides implicated inmass mortalities of the manatee (Trichechus manatus latirostris)
in Florida, USA. Pp. 97–100 in B. Reguera, J. Blanco, M. L.Fernandez, and T.Wyatt. Harmful Algae. Xunta de Galicia andIntergovernmental Oceanographic Commission of UNESCO1998.
LANGTIMM, C. A., and C. A. BECK. 2003. Lower survivalprobabilities for adult Florida manatees in years with intensecoastal storms. Ecological Applications 13: 257–268.
LANGTIMM, C., C. BECK, H. EDWARDS, B. ACKERMAN,K. FICK, and S. BARTON. 2002. Survival estimates for Floridamanatees from the photo-identification of marked individ-uals. Manatee Population Ecology and Management Work-shop, 1–4 April 2002, Gainesville, Florida.
LANGTIMM, C. A., C. A. BECK, H. H. EDWARDS, K. J.FICK–CHILD, B. B. ACKERMAN, S. L. BARTON, and W. C.HARTLEY. 2004. Survival estimates for Florida manateesfrom the photo-identification of individuals. Marine Mam-mal Science 20(3): 438–463.
LEDDER, D. A. 1986. Food habits of the West Indian mana-tee, Trichechus manatus latirostris, in south Florida. M.S. the-sis.The University of Miami. Coral Gables, Florida. 114 pp.
LEFEBVRE, L.W., and R.K. FROHLICH. 1986. Movements ofradio-tagged manatees in southwest Florida, January1985–March 1986. U.S. Fish and Wildlife Service and FloridaDepartment of Natural Resources, unpublished report. 87 pp.
LEFEBVRE, L.W., and H. I. KOCHMAN. 1991. An evaluationof aerial survey replicate count methodology to determinetrends in manatee abundance. Wildlife Society Bulletin 19:298–309.
LEFEBVRE, L. W., and J. A. POWELL. 1990. Manatee graz-ing impacts on seagrasses in Hobe Sound and Jupiter Soundin southeast Florida during the winter of 1988–1989. U.S.Fish and Wildlife Service Report PB90-271883. 36 pp.
LEFEBVRE, L. W., B. B. ACKERMAN, K. M. PORTIER, andK. H. POLLOCK. 1995. Aerial survey as a technique forestimating trends in manatee population size-problems andprospects. Pp. 63–74 in T. J. O’Shea, B. B. Ackerman, and H.F. Percival, eds. Population Biology of the Florida Manatee.National Biological Service Information and Technology Re-port 1. Washington, D.C. 289 pp.
LEFEBVRE, L. W., J. P. REID, W. J. KENWORTHY, and J. A.POWELL. 2000. Characterizing manatee habitat use andseagrass grazing in Florida and Puerto Rico: implications forconservation and management. Pacific Conservation Biology5: 289–298.
MARMONTEL, M., S. R. HUMPHREY, and T. J. O’SHEA. 1997.Population viability analysis of the Florida manatee (Trichechusmanatus latirostris), 1976–1991. Conservation Biology 11(2):467–481.
MPSWG (MANATEE POPULATION STATUS WORKINGGROUP). 2001. Florida manatee status statement. MarineMammal Society Newsletter 9(1): 1–2.

McDonald and Flamm Caloosahatchee Manatees
FWRI Technical Report TR-10 51
NOAA (NATIONAL OCEANIC AND ATMOSPHERIC AD-MINISTRATION). 2001. Winter 2001: cooler than normalwinter in much of the U.S. NOAA News Online, Story No.599. Silver Spring, Maryland. http://www.noaanews.noaa.gov/stories/s599.htm.
NOAA (NATIONAL OCEANIC AND ATMOSPHERICADMINISTRATION), NATIONAL OCEAN SERVICE. 2002.CO–OPS database, Caloosahatchee River water tempera-tures. Data collection platform (DCP) station no. 8725520, FortMyers, Florida. http://co-ops.nos.noaa.gov/data_retrieve.shtml?input_code=001000111pan&station=8725520+Fort+Myers,+FL.
NOWACEK, S. M., R. S. WELLS, D. P. NOWACEK, E. C. G.OWEN, T. R. SPEAKMAN, and R. O. FLAMM. 2000. Mana-tee behavioral responses to vessel approaches. Final contractreport to the Florida Fish and Wildlife Conservation Com-mission, Contract No. 99023. Mote Marine Laboratory Tech-nical Report No. 742. 12 pp + 3 appendices.
NOWACEK, S. M., R. S.WELLS, E. C. G. OWEN,T. R. SPEAK-MAN, R. O. FLAMM, and D. P. NOWACEK. 2004. Floridamanatees, Trichechus manatus latirostris, respond toapproaching vessels. Biological Conservation 119: 517–523.
ODELL, D. K., and J. E. REYNOLDS, III. 1979. Observationson manatee mortality in south Florida. Journal of WildlifeManagement 43(2): 572–577.
ORTIZ, R. M. 1994. Water flux and osmoregulatory physiol-ogy of the West Indian Manatee (Trichechus manatus). M.S.Thesis.Texas A&M University, College Station,Texas.
O’SHEA, T. J. 1995. Waterborne recreation and the Floridamanatee. Pp. 297–311 in R. L. Knight, and K. J. Gutzwiler, eds.Wildlife and recreationists: coexistence through manage-ment and research. Island Press, Washington, D.C.
O’SHEA,T. J., B. B. ACKERMAN, and H. F. PERCIVAL, eds.1995. Population biology of the Florida manatee. NationalBiological Service Information and Technology Report No. 1.Washington, D.C. 289 pp.
O’SHEA, T. J., C. A. BECK, R. K. BONDE, H. I. KOCHMAN,and D. K. ODELL. 1985. An analysis of manatee mortalitypatterns in Florida, 1976–1981. Journal of Wildlife Manage-ment 49(1): 1–11.
O’SHEA,T. J., L.W. LEFEBVRE, and C. A. BECK. 2001. Floridamanatees; perspectives on populations, pain, and protec-tion. Pp. 31–43 in L. A. Dierauf and F. M. D. Gulland, eds. CRCHandbook of Marine Mammal Medicine, Second Edition.CRC Press, Boca Raton, Florida.
O’SHEA, T. J., G. B. RATHBUN, R. K. BONDE, C. D.BUERGELT, and D. K. ODELL. 1991. An epizootic of Floridamanatees associated with a dinoflagellate bloom. MarineMammal Science 7(2): 165–179.
PACKARD, J. M. 1981. Abundance, distribution, and feedinghabits of manatees (Trichechus manatus) wintering betweenSt. Lucie and Palm Beach inlets, Florida. U.S. Fish and WildlifeService Report 14-16-0004-80-105. Pp. 40–103.
PACKARD, J. M., and R. MULHOLLAND. 1983. Analysis ofmanatee aerial surveys: A compilation and preliminaryanalysis of winter aerial surveys conducted in Florida between1977 and 1982. Manatee Population Research Report No. 2.Technical Report No. 8-2. Florida Cooperative Fish andWildlife Research Unit. University of Florida, Gainesville,Florida. 119 pp.
PACKARD, J. M., R. K. FROHLICH, J. E. REYNOLDS, III,and J. R. WILCOX. 1989. Manatee response to interruptionof a thermal effluent. Journal of Wildlife Management 53(3):692–700.
PACKARD, J. M., D. B. SINIFF, and J. A. CORNELL. 1986. Useof replicate counts to improve indices of trends in manateeabundance. Wildlife Society Bulletin 14(3): 265–275.
PACKARD, J. M., R. C. SUMMERS, and L. B. BARNES. 1985.Variation of visibility bias during aerial surveys of manatees.Journal of Wildlife Management 49(2): 347–351.
PITCHFORD, M. 2002. Life in the breakdown lane: age andlife history analyses of the Florida manatee. Presented atthe Manatee Population Workshop, 1–4 April 2002,Gainesville, Florida.
POWELL, J. A. 1981. The manatee population in CrystalRiver, Citrus County, Florida, Pp. 33–40 in R. L. Brownell, Jr.,and K. Ralls, eds. The West Indian manatee in Florida. Pro-ceedings of a workshop, 27–29 March 1978, Orlando, Florida.
PREEN, A. R., and H. MARSH. 1995. Response of dugongsto large-scale loss of seagrass from Hervey Bay, Queens-land, Australia. Wildlife Research 22: 507–519.
RATHBUN, G. B., J. P. REID, and J. B. BOURASSA. 1987.Design and construction of a tethered, floating radio-tagassembly for manatees. National Technical Information Ser-vice. Springfield,Virginia. Document PB 87-161345/AS. 49 pp.
RATHBUN, G. B., J. P. REID, and G. CAROWAN. 1990. Dis-tribution and movement patterns of manatees (Trichechusmanatus) in Northwestern peninsular Florida. Florida MarineResearch Publication No. 48. 33 pp.
REYNOLDS, J. E., III. 1996. Distribution and abundance ofFlorida manatees (Trichechus manatus latirostris) aroundselected power plants following winter cold fronts: 1995–1996.Final Report. Florida Power and Light Company, Juno Beach,Florida. Contract No. 93135-00139. 38 pp.
REYNOLDS, J. E., III. 1999. Efforts to conserve the manatees.Pp. 267–295 in J. R. Twiss, Jr., and R. R. Reeves, eds. Conser-vation and management of marine mammals. SmithsonianInstitution Press, Washington, D.C.
REYNOLDS, J. E., III. 2000. Possible locations for long-termwarm-water refugia for manatees in Florida: alternatives topower plants. Final Report prepared for the Department ofEnvironmental Services, Florida Power and Light Company.68 pp.
REYNOLDS, J. E., III. 2002. Distribution and abundance ofFlorida manatees (Trichechus manatus latirostris) around

Caloosahatchee Manatees McDonald and Flamm
52 FWRI Technical Report TR-10
selected power plants following winter cold fronts: 2001–2002.Final Report, Florida Power and Light Company, Juno Beach,Florida. Contract No. 4500074487. 49 pp.
REYNOLDS, J. E., III, and J. R. WILCOX. 1994. Observationsof Florida manatees (Trichechus manatus latirostris) aroundselected power plants in winter. Marine Mammal Science10(2): 163–177.
SARGENT, F. J.,T. J. LEARY, D.W. CREWZ, and C. R. KRUER.1995. Scarring of Florida’s seagrasses: assessment and man-agement options. Florida Department of EnvironmentalProtection, St. Petersburg, Florida, USA. FMRI TechnicalReport TR-1.
SCHOLLE, R. A., and C. E. FOSTER. 1999. Legacy of theCaloosahatchee. Charlotte Harbor National Estuary ProgramNewsletter 3(1): 16–17.
SCIENCE SUBGROUP. 1996. Caloosahatchee river basinand southwest Florida. Pp. 470–487 in South Florida Ecosys-tem Restoration: Scientific Information Needs. Report tothe Working Group of the South Florida Ecosystem TaskForce.
SFWMD (SOUTH FLORIDA WATER MANAGEMENT DIS-TRICT), WATER SUPPLY PLANNING AND DEVELOP-MENT DEPARTMENT. 2000. Analysis and Evaluation ofModel Results. Lower East Coast Regional Water SupplyPlan. West Palm Beach, Florida. 92 pp.
SHANE, S. H. 1983. Abundance, distribution, and move-ments of manatees (Trichechus manatus) in Brevard County,Florida. Bulletin of Marine Science 33(1): 1–9.
SHANE, S. H. 1984. Manatee use of power plant effluents inBrevard County, Florida. Florida Scientist 3: 180–188.
SHAPIRO, S. L. 2001. Assessing boater compliance withmanatee speed zones in Florida. Final Report submitted tothe U.S. Fish and Wildlife Service. Grant No. 2280. St.Petersburg, Florida. 73 pp. + appendices.
SIDMAN, C., and R. O. FLAMM. 2001. A survey of methodsfor characterizing recreational boating in Charlotte Harbor,Florida. Final Report submitted to Florida Sea Grant (Pro-ject No. E/WCIND-1). Gainesville, Florida. 50 pp.
SIDMAN, C., R. O. FLAMM, and W. SARGENT. 2001. FloridaBlueways—recreational boating in Charlotte Harbor, Florida;phase three: refining characterization analyses. Report sub-mitted to the Florida Marine Research Institute. St. Peters-burg, Florida. 17 pp.
SIDMAN, C., R. O. FLAMM, M. SCICCHITANO,T. FIK, andJ. GORZELANY. 2000. A recreational boating characteriza-tion for Charlotte Harbor, Florida. Report submitted to theFlorida Marine Research Institute and the West Coast InlandNavigation District (Grant Numbers 733613313 and733613513). St. Petersburg, Florida. 49 pp.
SMITH, K. N. 1993. Manatee habitat and human-relatedthreats to seagrass in Florida: a review. Report for the FloridaDepartment of Environmental Protection. Tallahassee,Florida. 33 pp.
SOKAL, R. R., and F. J. ROHLF. 1997. Biometry,Third Edition.W. H. Freeman and Company, New York. 887 pp.
SORICE, M. G., R. O. FLAMM, and S. L. MCDONALD. 2004.Evaluation of vessel compliance with manatee speed zonesand an investigation of methods to improve compliancerates. Final grant report submitted to the U.S. Fish andWildlife Service. Grant number 2335. St. Petersburg, Florida.90 pp.
STEVENSON, J. C., L. W. STAVER, and K. W. STAVER. 1993.Water quality associated with survival of submerged aquaticvegetation along an estuarine gradient. Estuaries 16: 346–361.
U.S. CENSUS BUREAU. 2001. http://www.census.gov/population.
U.S. FISH AND WILDLIFE SERVICE. 2001. Florida manateerecovery plan (Trichechus manatus latirostris), third revision.U.S. Fish and Wildlife Service. Atlanta, Georgia. 144 pp. + ap-pendices.
WEIGLE, B. L., I. E.WRIGHT, M. ROSS, and R. FLAMM. 2001.Movements of radio-tagged manatees in Tampa Bay andalong Florida’s west coast, 1991–1996. Florida Marine ResearchInstitute Technical Report TR-7. St. Petersburg, Florida. 156pp.
WORTHY, G. A. J.,T. A. MICULKA, and S. D.WRIGHT. 2000.Manatee response to cold: how cold is too cold? Pp. 1–6 inU.S. Fish and Wildlife Service. Florida Manatees and WarmWater: Proceedings of the Warm-Water Workshop, 24–25August 1999, Jupiter, Florida.
WRIGHT, S. C., B. B. ACKERMAN, R. K. BONDE, C. A.BECK, and D. J. BANOWETZ. 1995. Analysis of watercraft-related mortality of manatees in Florida 1979–1991, Pp.259–268 inT. J. O’Shea, B. B. Ackerman, and H. F. Percival, eds.Population Biology of the Florida Manatee. National Bio-logical Service Information and Technology Report 1.Wash-ington, D.C. 289 pp.