fish assemblage structure of koycegiz lagooneestuary...
TRANSCRIPT
Estuarine, Coastal and Shelf Science 64 (2005) 671e684
www.elsevier.com/locate/ECSS
Fish assemblage structure of Koycegiz LagooneEstuary,Turkey: Spatial and temporal distribution patterns
in relation to environmental variation
S. Akin a,*, E. Buhan a, K.O. Winemiller b, H. Yilmaz c
a Faculty of Agriculture, Department of Fisheries, Gaziosmanpasa University, 60240 Tokat, Turkeyb Section of Ecology and Evolutionary Biology, Texas A&M University 2258 TAMU College Station, TX 77843-2258, USA
c Faculty of Fisheries, Department of Aquaculture, Mersin University, 33169 Mersin, Icel-Turkey
Received 20 September 2004; accepted 18 March 2005
Available online 21 June 2005
Abstract
Spatial and temporal variation in fish assemblage structure of Koycegiz LagooneEstuarine System (KLES), located on thenorthwestern Turkish coast of Mediterranean, was investigated along an estuarine gradient where salinity ranged from 5 in upperreaches to 40 in lower reaches during October 1993eSeptember 1994. Throughout the study, 42 species, consisting of marine (25),marineeestuarine-dependent (12), freshwater (3), catadromous (1), and estuarine resident (1) forms, were collected in trammel nets.
Although species richness of marine species was greater than that of other groups, numerical contribution by marine species to thetotal catch was only 16%. Tilapia spp., the most abundant species mostly during summer and early spring at upper reaches,contributed 17% of the total samples. Among the seven species of Mugilidae, which contributed 42% of the total catch, Mugil
cephalus, Liza aurata, and Liza salines contributed 10, 13, and 10% of the total catch, respectively. Consistent with findings fromother studies, species richness and abundance were highest during late spring and summer and the lowest during winter and earlyspring. Samples from sites at or near the sea had more marine species. Samples from upper reaches had more freshwater and
marineeestuarine-dependent species. Canonical correspondence analysis (CCA) indicated that salinity and turbidity were the mostimportant environmental parameters affecting fishes. Sites near the sea were associated with high salinity and low turbidity, and sitesin upper reaches had low salinity and high turbidity. Thus, the pattern observed in fish assemblage structure appears to be strongly
influenced by species’ responses to dominant salinity and turbidity gradients.� 2005 Elsevier Ltd. All rights reserved.
Keywords: canonical correspondence analysis; turbidity; salinity; fish assemblage; lagooneestuarine system; Mediterranean; Turkey
1. Introduction
Estuaries are transition zones between seas andfreshwater that are occupied by a combination offreshwater and marine species including many juveniles(Claridge et al., 1986). Fish assemblage structure ofestuaries is characterized by low diversity but high
* Corresponding author.
E-mail address: [email protected] (S. Akin).
0272-7714/$ - see front matter � 2005 Elsevier Ltd. All rights reserved.
doi:10.1016/j.ecss.2005.03.019
abundance, especially for juveniles (Whitfield, 1999).Examination of the ecological factors important indefining habitats for fishes has been the main focus ofmany previous studies (Able, 1999; Martino and Able,2003). Most estuaries are characterized by high bio-logical productivity associated with relatively extremeand varying environmental conditions (Day et al., 1989;Kennish, 1990; Whitfield, 1999). The fact that estuariesserve as nurseries for many fishes and macrocrustaceans,including many important fishery species (Shenker and
672 S. Akin et al. / Estuarine, Coastal and Shelf Science 64 (2005) 671e684
Dean, 1979; Weinstein, 1979; Rakocinski et al., 1996;Blaber, 2000; Elliott and Hemingway, 2002; Akin et al.,2003) is another important reason for examining factorsthat shape fish assemblage structure.
Fish distributions within biologically and physicallycomplex estuarine systems may be influenced by manymechanisms. Several estuarine ecologists have pointedout that biotic processes, such as competition andpredation, may be important in driving the occurrenceof spatial and temporal patterns of fishes in estuaries(Holbrook and Schmitt, 1989; Ogburn-Matthews andAllen, 1993; Lankford and Targett, 1994; Barry et al.,1996). The consistency of temporal occurrence of fisheswithin the estuaries implies the importance of species-specific reproductive biology (Potter et al., 1986, 2001;Drake and Arias, 1991; Thiel and Potter, 2001; Haganand Able, 2003). In addition to biological factors, abioticfactors affect occurrences of fishes within estuaries. Thesefactors include salinity (Gunter, 1961; Weinstein et al.,1980; Peterson and Ross, 1991; Rakocinski et al., 1992;Szedlmayer and Able, 1996; Wagner and Austin, 1999;Hagan and Able, 2003; Jaureguizar et al., 2003; Martinoand Able, 2003), temperature (Peterson and Ross, 1991;Rakocinski et al., 1992; Szedlmayer and Able, 1996;Marshall and Elliott, 1998; Araujo et al., 1999), turbidity(Peterson andRoss, 1991; Cyrus andBlaber, 1992;Haganand Able, 2003), dissolved oxygen (DO) (Blaber andBlaber, 1980; Rakocinski et al., 1992; Fraser, 1997; Maeset al., 1998; Whitfield, 1999), freshwater inflow (Rogerset al., 1984; Fraser, 1997; Whitfield, 1999), structuralattributes of habitat (Weinstein et al., 1980; Thorman,1986; Sogard and Able, 1991; Everett and Ruiz, 1993;Szedlmayer and Able, 1996; Wagner and Austin, 1999),depth (Zimmerman and Minello, 1984; Rakocinskiet al., 1992), geographic distance from the estuarymouth (Martino and Able, 2003), and hydrography(Cowen et al., 1993).
Remmert (1983) proposed that large-scale (kilo-meters) patterns of fish distribution are the results ofspecies response to their physical environment. Abioticfactors (salinity, temperature, turbidity, DO, etc.) oper-ating over large spatial scale are believed to determinecoarse community structure, whereas biotic interactionsrefine species abundance and distribution patterns withinthat structure (Sanders, 1968; Menge and Olson, 1990).Here we report findings from an investigation of as-sociations between environmental factors and fishdistribution patterns in a relatively deep estuary on thesouthern coast of the Mediterranean Sea, the KoycegizLagooneEstuarine System (KLES).
Fish assemblage structure in European estuaries hasbeen well studied (Wheeler, 1969; Drake and Arias, 1991;Elliott and Dewailly, 1995; Marshall and Elliott, 1998;Araujo et al., 1999; Thiel and Potter, 2001). In spite of thislarge number of studies inwestern European estuaries, weare not aware of any published accounts of assemblage
structure in estuaries of Eastern Europe. Although thereare quite large numbers of studies investigating differentaspects of the KLES (Geldiay, 1977; Ozhan, 1988; Yerli,1991; Kazanci et al., 1992; Buhan, pers. comm.), none ofthem examined relationships between fish assemblagestructure and environmental variables. The current studywas designed to fill this gap. The purpose of this studywas to investigate the effects of physical water qualityparameters on spatial and seasonal variation in fishassemblage of KLES in Turkey.
2. Material and methods
2.1. Study area
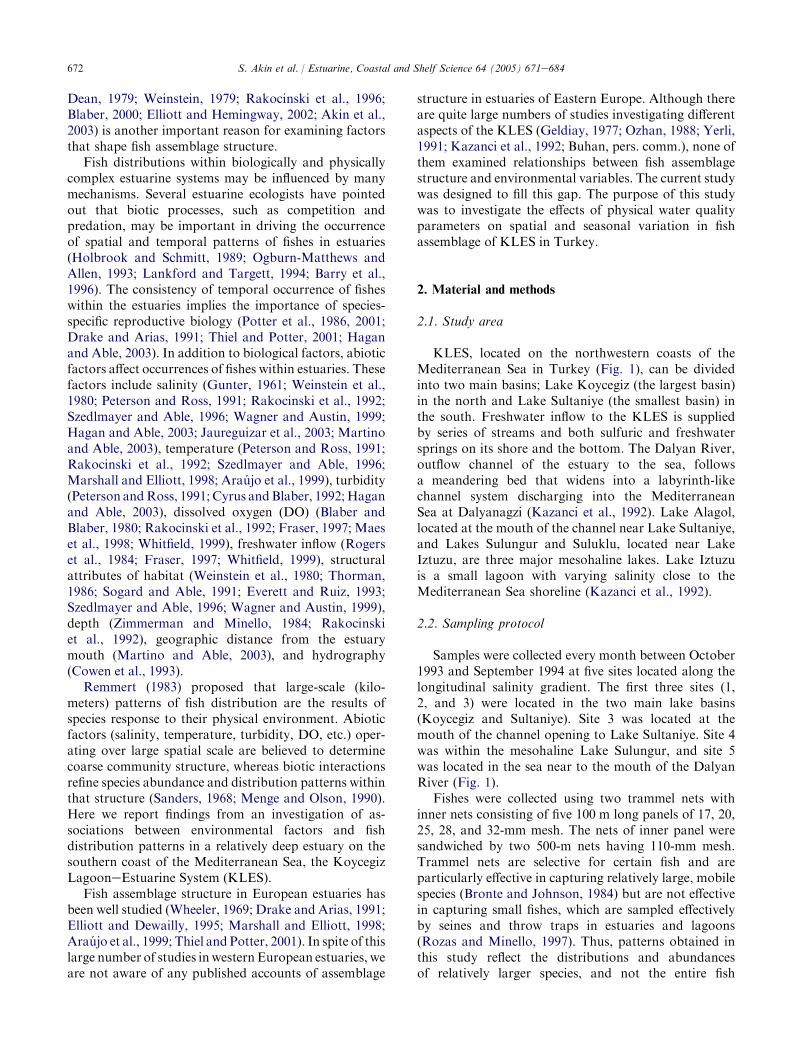
KLES, located on the northwestern coasts of theMediterranean Sea in Turkey (Fig. 1), can be dividedinto two main basins; Lake Koycegiz (the largest basin)in the north and Lake Sultaniye (the smallest basin) inthe south. Freshwater inflow to the KLES is suppliedby series of streams and both sulfuric and freshwatersprings on its shore and the bottom. The Dalyan River,outflow channel of the estuary to the sea, followsa meandering bed that widens into a labyrinth-likechannel system discharging into the MediterraneanSea at Dalyanagzi (Kazanci et al., 1992). Lake Alagol,located at the mouth of the channel near Lake Sultaniye,and Lakes Sulungur and Suluklu, located near LakeIztuzu, are three major mesohaline lakes. Lake Iztuzuis a small lagoon with varying salinity close to theMediterranean Sea shoreline (Kazanci et al., 1992).
2.2. Sampling protocol
Samples were collected every month between October1993 and September 1994 at five sites located along thelongitudinal salinity gradient. The first three sites (1,2, and 3) were located in the two main lake basins(Koycegiz and Sultaniye). Site 3 was located at themouth of the channel opening to Lake Sultaniye. Site 4was within the mesohaline Lake Sulungur, and site 5was located in the sea near to the mouth of the DalyanRiver (Fig. 1).
Fishes were collected using two trammel nets withinner nets consisting of five 100 m long panels of 17, 20,25, 28, and 32-mm mesh. The nets of inner panel weresandwiched by two 500-m nets having 110-mm mesh.Trammel nets are selective for certain fish and areparticularly effective in capturing relatively large, mobilespecies (Bronte and Johnson, 1984) but are not effectivein capturing small fishes, which are sampled effectivelyby seines and throw traps in estuaries and lagoons(Rozas and Minello, 1997). Thus, patterns obtained inthis study reflect the distributions and abundancesof relatively larger species, and not the entire fish

673S. Akin et al. / Estuarine, Coastal and Shelf Science 64 (2005) 671e684
1 km
W
N
E
S
28º34 E 28º45 E
Mediterranean Sea
Turkey
Ankara
Istanbul
Izmir
4
Koycegiz Basin
Sultaniye Basin
Lake Iztuzu
Dalyan River
MediterraneanSea
36º45 N
36º58 N
Black Sea
Fig. 1. Map of the Koycegiz LagooneEstuarine System with sampling sites.
assemblage. Two trammel nets were deployed at sitesover three consecutive days, and remained in place ata given site from 20:00 to 08:00 hour. The duration ofeach trammel net set was recorded, and catch data wererecorded as number of individuals captured per hour.Captured fishes were anesthetized in MS-222 then fixedin 4% formalin in the field. In the laboratory, sampleswere sorted, identified to species, and counted. Atherinaand Tilapia were reported at genus level due todifficulties in identifying individuals to species levelsince both Atherina and Tilapia had three differentspecies in KLES (Atherina boyeri, Atherina heptesus,Atherina lacunosus, Tilapia zilli, Oreochromis aurea,Oreochromis nilotica). Among these species, A. boyeriand T. zilli, however, are the most abundant species inKLES (E. Buhan, Personal Observation). Reporting ofAtherina and Tilapia at genus level probably did notaffect the interpretation of results, because thesecongeneric species at KLES have been shown to have
similar ecological response to environmental variables(E. Buhan, Personal Observation).
Prior to trammel netting, water quality parameterswere measured at each survey site. Temperature ( �C),salinity (practical salinity scale) and conductivity weremeasured with a YSI-33 SCT meter. When the YSI-33was not available, a mercury thermometer and reflec-trometer were used to measure temperature and salinity,respectively. A Schott Gerate CG 817 model pH meterwas used to measure total alkalinity of the water (pH)and oxygen concentration was determined by usingeither a YSI 5514 oxygen meter or Winkler Method inthe laboratory.
2.3. Data analysis
Taxon numerical abundance for trammel net datawas standardized to CPUE (Catch Per Unit Effort) as
674 S. Akin et al. / Estuarine, Coastal and Shelf Science 64 (2005) 671e684
abundance per trammel net hour. Species richness (S)was recorded as the total number of species occurring ata given site. A two-way ANOVA was used to test forsignificant differences in environmental variables, spe-cies richness, and abundance among sites and months.Prior to analysis of variance, all variables were tested fornormality (KolmogoroveSmirnov test) and homogene-ity of variances (Cochran tests). Temperature, salinity,and Secchi depth data did not meet the assumptions ofnormality and homogeneity of variances even thoughperforming diverse data transformations. These varia-bles, thus, were tested with KruskaleWallis test. Sincethe data were not replicated at a given site, in addition tochecking the data for normality and homogeneity ofvariances, possible interactions between site and monthwere tested using Tukey’s 1 degree-of-freedom test(Sokal and Rolf, 1998). Significant interaction betweenmonth and site was detected for abundance data only.When a significant (P! 0.05) difference for main effectswas detected, Student NewmaneKeul (SNK) multiplecomparison test was used to test for significant meandifferences. Tukey multiple comparison tests wereperformed to test for significant mean differences ofnon-normal distributed variables (i.e., temperature,salinity, and Secchi depth) using WINKS statisticalsoftware. Spearman’s rank correlation (partial correla-tion) was used to examine simple relationship betweenenvironmental variables and CPUE.
Fishes inhabiting in the KLES were categorizedas marine, marineeestuarine-dependent, freshwater, es-tuarine resident, and catadromous, based on their lifehistories. According to Whitfield’s (1999) life cycleterminology, we defined: (a) marineeestuarine-depen-dent (Potter et al., 1990), also called marine migrants(Whitfield, 1999), as those species extensively useestuaries during juvenile and/or adult life stages; (b)marine species, which are also named as occasionalmarine visitors (Day et al., 1989) or marine stragglers(Potter et al., 1990; Whitfield, 1999), as those onlya small proportion of the overall population use estuaries(Whitfield, 1999); (c) freshwater species (Day et al., 1989),as those restricted to rivers but sometimes enter theestuaries when conditions are favorable; (d) estuarineresident (Whitfield, 1999), as species of marine origin thatreside in estuaries and can complete their life cycle withinthese systems; and (e) catadromous (Whitfield, 1999), asthose spawn at the sea but use freshwater catchment areasduring the juvenile and sub-adult life stages.
Associations between species CPUE (log (CPUEC 1)),and log-transformed environmental variableswere examinedwith the canonical correspondence analysis (CCA)using CANOCO. CCA is a weighted averaging methodthat directly relates community data to environmentalvariables by constraining species ordination to a patternthat correlates maximally with environmental variables.To reduce the effects of rare species, only species
having CPUEZ 1% of the total based on all speciesand samples were included in CCA. Inter-set correla-tions between environmental variables (salinity, tem-perature, DO, pH, and Secchi depth) and CCA axeswere used to assess each variable’s contribution. MonteCarlo permutation analysis simulation and the forwardselection option within the CANOCO package were usedto test the significance (PZ 0.05) of each variable’scontribution to each CCA axis.
3. Results
3.1. Environmental variation
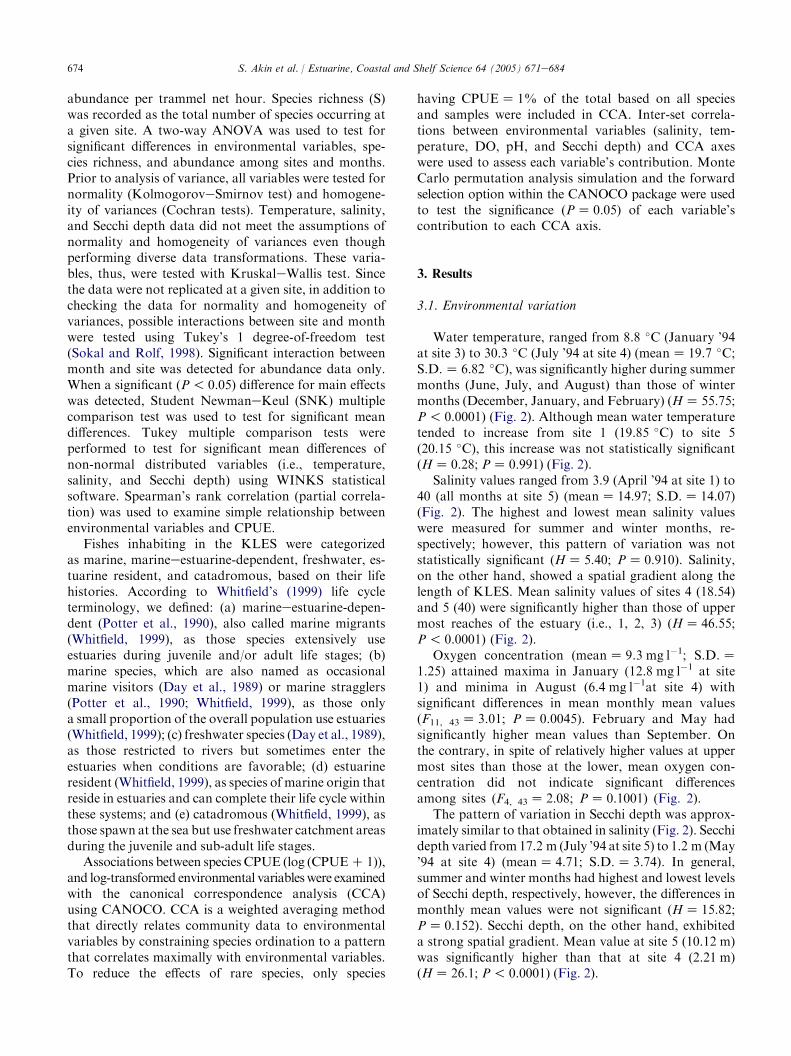
Water temperature, ranged from 8.8 �C (January ’94at site 3) to 30.3 �C (July ’94 at site 4) (meanZ 19.7 �C;S.D.Z 6.82 �C), was significantly higher during summermonths (June, July, and August) than those of wintermonths (December, January, and February) (HZ 55.75;P! 0.0001) (Fig. 2). Although mean water temperaturetended to increase from site 1 (19.85 �C) to site 5(20.15 �C), this increase was not statistically significant(HZ 0.28; PZ 0.991) (Fig. 2).
Salinity values ranged from 3.9 (April ’94 at site 1) to40 (all months at site 5) (meanZ 14.97; S.D.Z 14.07)(Fig. 2). The highest and lowest mean salinity valueswere measured for summer and winter months, re-spectively; however, this pattern of variation was notstatistically significant (HZ 5.40; PZ 0.910). Salinity,on the other hand, showed a spatial gradient along thelength of KLES. Mean salinity values of sites 4 (18.54)and 5 (40) were significantly higher than those of uppermost reaches of the estuary (i.e., 1, 2, 3) (HZ 46.55;P! 0.0001) (Fig. 2).
Oxygen concentration (meanZ 9.3 mg l�1; S.D.Z1.25) attained maxima in January (12.8 mg l�1 at site1) and minima in August (6.4 mg l�1at site 4) withsignificant differences in mean monthly mean values(F11, 43Z 3.01; PZ 0.0045). February and May hadsignificantly higher mean values than September. Onthe contrary, in spite of relatively higher values at uppermost sites than those at the lower, mean oxygen con-centration did not indicate significant differencesamong sites (F4, 43Z 2.08; PZ 0.1001) (Fig. 2).
The pattern of variation in Secchi depth was approx-imately similar to that obtained in salinity (Fig. 2). Secchidepth varied from 17.2 m (July ’94 at site 5) to 1.2 m (May’94 at site 4) (meanZ 4.71; S.D.Z 3.74). In general,summer and winter months had highest and lowest levelsof Secchi depth, respectively, however, the differences inmonthly mean values were not significant (HZ 15.82;PZ 0.152). Secchi depth, on the other hand, exhibiteda strong spatial gradient. Mean value at site 5 (10.12 m)was significantly higher than that at site 4 (2.21 m)(HZ 26.1; P! 0.0001) (Fig. 2).

675S. Akin et al. / Estuarine, Coastal and Shelf Science 64 (2005) 671e684
05
101520253035
Oct Nov Dec Jan
Feb Mar AprMay Ju
nJu
lAug Sep
Oct Nov Dec Jan
Feb Mar AprMay Ju
nJu
lAug Sep
Oct Nov Dec Jan
Feb Mar AprMay Ju
nJu
lAug Sep
Oct Nov Dec Jan
Feb Mar AprMay Ju
nJu
lAug Sep
OctNov Dec Jan
Feb Mar AprMay Ju
nJu
lAug Sep
Tem
pera
ture
(°C
)
Tem
pera
ture
(°C
)0
5
10
15
20
25
1 2 3 4 5
1 2 3 4 5
1 2 3 4 5
1 2 3 4 5
1 2 3 4 5
05
1015202530
Salin
ity
05
1015202530354045
02468
1012
DO
(mgl
-1)
02468
1012
7.88
8.28.48.68.8
9
pH pH
8.18.28.38.48.58.68.7
0
24
68
10
Secc
hi d
epth
(m)
Salin
ityD
O (m
gl-1
)Se
cchi
dep
th (m
)
02468
101214
Fig. 2. Temporal and spatial variations in mean temperature, salinity, DO, Secchi depth, and pH at Koycegiz LagooneEstuarine System (barsG 1SE).
pH ranged from 8.1 to 8.9 (meanZ 8.52; S.D.Z0.22) and varied significantly among months, attainingthe highest and lowest mean values in August (8.76) andFebruary (8.24), respectively (F11, 43Z 4.59; P! 0.0001)(Fig. 2). In general, pH followed a decreasing trendtowards the lower reaches of the estuary. Lower sites (i.e.,4, and 5) had significantly lower values than the uppersites (1, 2, and 3) (F4, 43Z 6.46; PZ 0.0004) (Fig. 2).
3.2. Fish community composition
A total of 42 fish species, representatives of 29families, were collected during the period of the study
(Table 1). Most of these species were within the groupsof marine and marineeestuarine-dependent, representedby 25 and 12 species, respectively. On the other hand,the number of species belonging to freshwater, estuarineresidents, and catadromous groups was low, representedby only 3, 1, and 1 species, respectively (Table 1). Inspite of being represented by highest number of species,numerical abundance of the marine species (#h�1) waslower than the abundances of other groups. Marinespecies contribution to the total abundance of the fisheswas 13% only, a percentage lower than the contributionmade by 3 freshwater species (27%) and 12 marineeestuarine-dependent species (52%). The numerical

676 S. Akin et al. / Estuarine, Coastal and Shelf Science 64 (2005) 671e684
Table 1
Frequency, CPUE rank, mean, minimum, and maximum values of species abundance (#h�1) at Koycegiz LagooneEstuarine System. MED: marinee
estuarine-dependent; M: marine; F: freshwater; CA: catadromous; ES: estuarine resident
Family Scientific name Frequency CPUE
rank
Mean
CPUE
Min.
CPUE
Max.
CPUE
Mugilidae Mugil cephalus (MED) 73 4 0.96 0.18 4.55
Liza aurata (MED) 70 2 1.36 0.18 6.00
Liza ramada (MED) 67 7 0.66 0.18 3.00
Liza saliens (MED) 58 3 1.23 0.18 5.27
Liza carinata (MED) 2 41 0.18 0.18 0.18
Odeachilus labeo (M) 3 39 0.27 0.27 0.27
Chelon labrosus (MED) 18 10 0.91 0.18 2.45
Cyprinidae C. Capoeta bergamea (FW) 33 5 1.78 0.18 8.00
Anguillidae Anguilla anguilla (CA) 33 13 0.39 0.18 1.00
Cyprinodontidae Cyprinus carpio (FW) 25 11 0.64 0.18 1.00
Cichlidae Tilapia spp. (FW) 30 1 4.02 0.18 17.00
Atherinidae Atherina spp. (ES) 75 6 0.61 0.18 2.73
Sparidae Sparus aurata (MED) 22 12 0.64 0.18 1.73
Diplodus annuralis (MED) 7 29 0.48 0.27 1.00
Diplodus sargus (MED) 7 20 0.80 0.18 2.00
Lithognathus mormyrus (MED) 22 9 0.91 0.18 3.00
Sarpa salpa (M) 3 31 0.68 0.36 1.00
Pagellus acarne (M) 10 17 0.71 0.18 1.00
Boops boops (M) 2 38 1.00 1.00 1.00
Diplodus vulgaris (M) 3 33 0.59 0.18 1.00
Moronidae Dicentrarchus labrax (MED) 3 28 1.00 1.00 1.00
Sphyraenidae Sphyraena sphyraena (M) 5 21 1.00 1.00 1.00
Synodontidae Synodus saurus (M) 5 30 0.45 0.18 1.00
Scombridae Scomber scombrus (M) 2 36 1.00 1.00 1.00
Scaridae Sparisoma cretense (M) 3 25 1.00 1.00 1.00
Centracanthidae Spicara smaris (M) 2 34 1.00 1.00 1.00
Clupeidae Sardinella aurita (M) 7 19 0.86 0.45 1.00
Engraulidae Engraulis encrasicolus (MED) 27 8 1.35 0.27 4.73
Scorpaenidae Scorpanea scrofa (M) 2 35 1.00 1.00 1.00
Lichiidae Lichia amia (M) 2 38 1.00 1.00 1.00
Mullidae Mullus barbatus (M) 12 14 0.88 0.18 1.00
Triglidae Trigla lyra (M) 8 23 0.53 0.18 1.00
Trichiudae Trachinus areneus (M) 7 24 0.59 0.18 1.00
Uranoscopidae Uranoscopus scaber (M) 12 18 0.51 0.18 1.00
Phycidae Physic physic (M) 3 27 1.00 1.00 1.00
Labridae Xyricthys novacula (M) 3 32 0.59 0.18 1.00
Echeneidae Remora remora (M) 3 26 1.00 1.00 1.00
Bothidae Bothus podas (M) 10 16 0.86 0.18 1.27
Dasyatidae Dasyatis pastinaca (M) 12 22 0.40 0.18 1.00
Sepiidae Sepia officinalis (M) 18 15 0.53 0.18 1.00
Loliginidae Loligo vulgaris (M) 2 37 1.00 1.00 1.00
Octopodidae Octopus vulgaris (M) 2 40 0.18 0.18 0.18
abundance of the other fish group, i.e. estuarine residentand catadromous species solely represented by Atheri-nidae and Anguillidae families, was 6 and 2% of thetotal catch, respectively. Mugilidae, represented by 7species, contributed 41% of numerical abundance ofthe total catch, and mostly consisted of Liza aurata(13.08%), Liza saliens (9.82%), and Mugil cephalus(9.63%). Although Sparidae was represented by 7species, the contribution of these species to thenumerical abundance of samples was quite low (7.5%).Tilapia spp. was the most abundant freshwater speciescomprising 17% of the numerical abundance. The othercommon species were the sole representatives of the
Atherinadae and Engraulidae: silversides (Atherina spp.)and anchovy (Engraulis encrasicolus), which comprised6.3% and 5% of the total catch, respectively. Theremaining species were mostly collected at site 5 andeach contributed almost 1% of the total catch (Table 2).
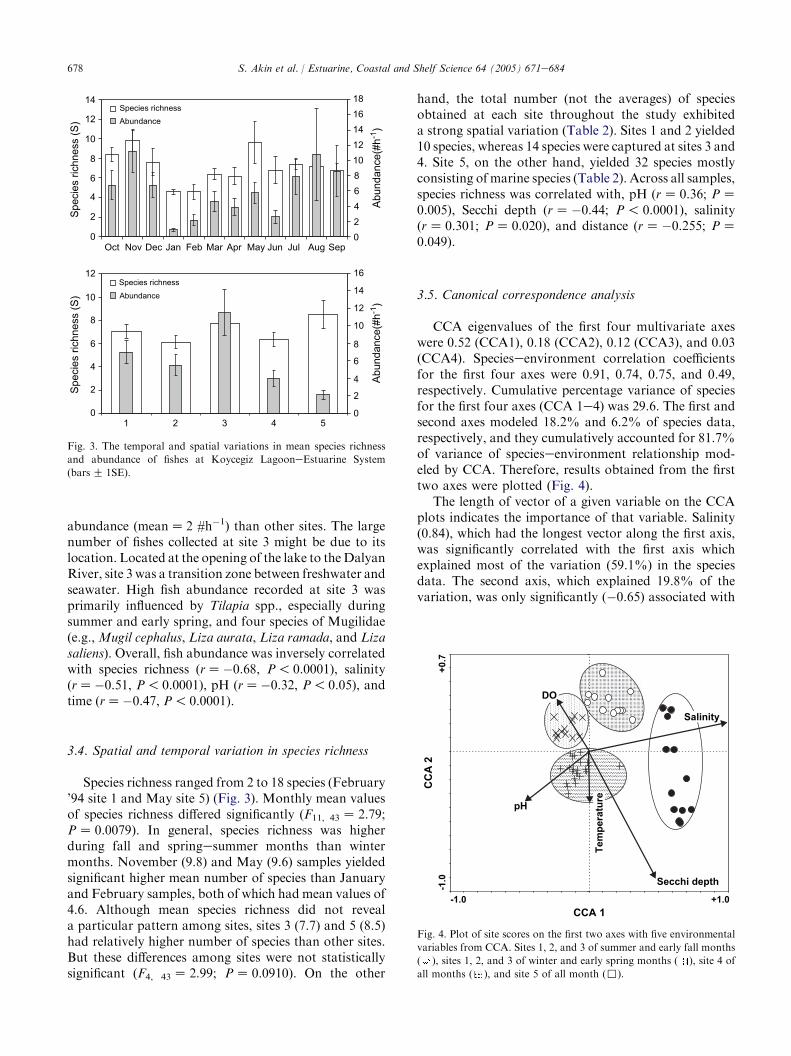
3.3. Spatial and temporal variation in fish abundance
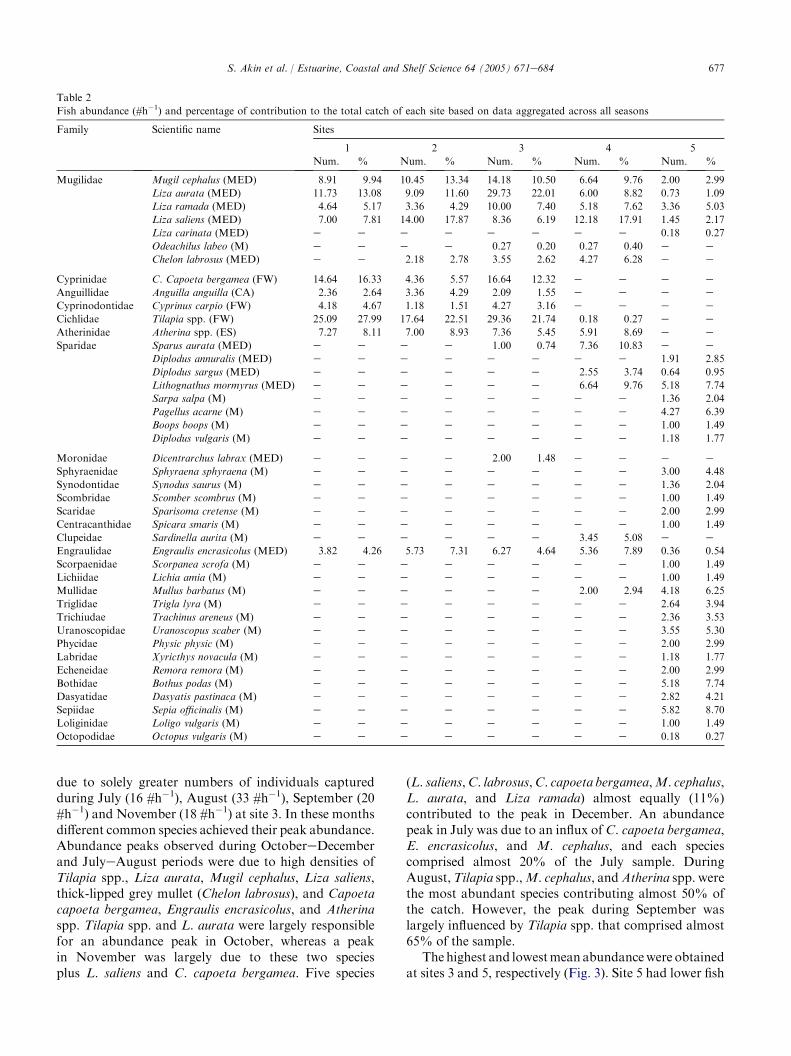
Fish abundance (CPUE) was the highest between sites1 and 3 during SeptembereDecember and JulyeAugustperiods (Fig. 3), with a significant site! time interaction(F1, 43Z 11.97;P! 0.0001). This interactionwasprobably
677S. Akin et al. / Estuarine, Coastal and Shelf Science 64 (2005) 671e684
Table 2
Fish abundance (#h�1) and percentage of contribution to the total catch of each site based on data aggregated across all seasons
Family Scientific name Sites
1 2 3 4 5
Num. % Num. % Num. % Num. % Num. %
Mugilidae Mugil cephalus (MED) 8.91 9.94 10.45 13.34 14.18 10.50 6.64 9.76 2.00 2.99
Liza aurata (MED) 11.73 13.08 9.09 11.60 29.73 22.01 6.00 8.82 0.73 1.09
Liza ramada (MED) 4.64 5.17 3.36 4.29 10.00 7.40 5.18 7.62 3.36 5.03
Liza saliens (MED) 7.00 7.81 14.00 17.87 8.36 6.19 12.18 17.91 1.45 2.17
Liza carinata (MED) e e e e e e e e 0.18 0.27
Odeachilus labeo (M) e e e e 0.27 0.20 0.27 0.40 e eChelon labrosus (MED) e e 2.18 2.78 3.55 2.62 4.27 6.28 e e
Cyprinidae C. Capoeta bergamea (FW) 14.64 16.33 4.36 5.57 16.64 12.32 e e e e
Anguillidae Anguilla anguilla (CA) 2.36 2.64 3.36 4.29 2.09 1.55 e e e eCyprinodontidae Cyprinus carpio (FW) 4.18 4.67 1.18 1.51 4.27 3.16 e e e e
Cichlidae Tilapia spp. (FW) 25.09 27.99 17.64 22.51 29.36 21.74 0.18 0.27 e e
Atherinidae Atherina spp. (ES) 7.27 8.11 7.00 8.93 7.36 5.45 5.91 8.69 e e
Sparidae Sparus aurata (MED) e e e e 1.00 0.74 7.36 10.83 e eDiplodus annuralis (MED) e e e e e e e e 1.91 2.85
Diplodus sargus (MED) e e e e e e 2.55 3.74 0.64 0.95
Lithognathus mormyrus (MED) e e e e e e 6.64 9.76 5.18 7.74
Sarpa salpa (M) e e e e e e e e 1.36 2.04
Pagellus acarne (M) e e e e e e e e 4.27 6.39
Boops boops (M) e e e e e e e e 1.00 1.49
Diplodus vulgaris (M) e e e e e e e e 1.18 1.77
Moronidae Dicentrarchus labrax (MED) e e e e 2.00 1.48 e e e e
Sphyraenidae Sphyraena sphyraena (M) e e e e e e e e 3.00 4.48
Synodontidae Synodus saurus (M) e e e e e e e e 1.36 2.04
Scombridae Scomber scombrus (M) e e e e e e e e 1.00 1.49
Scaridae Sparisoma cretense (M) e e e e e e e e 2.00 2.99
Centracanthidae Spicara smaris (M) e e e e e e e e 1.00 1.49
Clupeidae Sardinella aurita (M) e e e e e e 3.45 5.08 e eEngraulidae Engraulis encrasicolus (MED) 3.82 4.26 5.73 7.31 6.27 4.64 5.36 7.89 0.36 0.54
Scorpaenidae Scorpanea scrofa (M) e e e e e e e e 1.00 1.49
Lichiidae Lichia amia (M) e e e e e e e e 1.00 1.49
Mullidae Mullus barbatus (M) e e e e e e 2.00 2.94 4.18 6.25
Triglidae Trigla lyra (M) e e e e e e e e 2.64 3.94
Trichiudae Trachinus areneus (M) e e e e e e e e 2.36 3.53
Uranoscopidae Uranoscopus scaber (M) e e e e e e e e 3.55 5.30
Phycidae Physic physic (M) e e e e e e e e 2.00 2.99
Labridae Xyricthys novacula (M) e e e e e e e e 1.18 1.77
Echeneidae Remora remora (M) e e e e e e e e 2.00 2.99
Bothidae Bothus podas (M) e e e e e e e e 5.18 7.74
Dasyatidae Dasyatis pastinaca (M) e e e e e e e e 2.82 4.21
Sepiidae Sepia officinalis (M) e e e e e e e e 5.82 8.70
Loliginidae Loligo vulgaris (M) e e e e e e e e 1.00 1.49
Octopodidae Octopus vulgaris (M) e e e e e e e e 0.18 0.27
due to solely greater numbers of individuals capturedduring July (16 #h�1), August (33 #h�1), September (20#h�1) and November (18 #h�1) at site 3. In these monthsdifferent common species achieved their peak abundance.Abundance peaks observed during OctobereDecemberand JulyeAugust periods were due to high densities ofTilapia spp., Liza aurata, Mugil cephalus, Liza saliens,thick-lipped grey mullet (Chelon labrosus), and Capoetacapoeta bergamea, Engraulis encrasicolus, and Atherinaspp. Tilapia spp. and L. aurata were largely responsiblefor an abundance peak in October, whereas a peakin November was largely due to these two speciesplus L. saliens and C. capoeta bergamea. Five species
(L. saliens,C. labrosus,C. capoeta bergamea,M. cephalus,L. aurata, and Liza ramada) almost equally (11%)contributed to the peak in December. An abundancepeak in July was due to an influx of C. capoeta bergamea,E. encrasicolus, and M. cephalus, and each speciescomprised almost 20% of the July sample. DuringAugust,Tilapia spp.,M. cephalus, andAtherina spp. werethe most abundant species contributing almost 50% ofthe catch. However, the peak during September waslargely influenced by Tilapia spp. that comprised almost65% of the sample.
The highest and lowestmean abundancewere obtainedat sites 3 and 5, respectively (Fig. 3). Site 5 had lower fish
678 S. Akin et al. / Estuarine, Coastal and Shelf Science 64 (2005) 671e684
abundance (meanZ 2 #h�1) than other sites. The largenumber of fishes collected at site 3 might be due to itslocation. Located at the opening of the lake to theDalyanRiver, site 3 was a transition zone between freshwater andseawater. High fish abundance recorded at site 3 wasprimarily influenced by Tilapia spp., especially duringsummer and early spring, and four species of Mugilidae(e.g.,Mugil cephalus, Liza aurata, Liza ramada, and Lizasaliens). Overall, fish abundance was inversely correlatedwith species richness (rZ�0.68, P! 0.0001), salinity(rZ�0.51, P! 0.0001), pH (rZ�0.32, P! 0.05), andtime (rZ�0.47, P! 0.0001).
3.4. Spatial and temporal variation in species richness
Species richness ranged from 2 to 18 species (February’94 site 1 and May site 5) (Fig. 3). Monthly mean valuesof species richness differed significantly (F11, 43Z 2.79;PZ 0.0079). In general, species richness was higherduring fall and springesummer months than wintermonths. November (9.8) and May (9.6) samples yieldedsignificant higher mean number of species than Januaryand February samples, both of which had mean values of4.6. Although mean species richness did not reveala particular pattern among sites, sites 3 (7.7) and 5 (8.5)had relatively higher number of species than other sites.But these differences among sites were not statisticallysignificant (F4, 43Z 2.99; PZ 0.0910). On the other
0
2
4
6
8
10
12
14
Oct Nov Dec Jan Feb Mar Apr May Jun Jul Aug Sep
Spec
ies
richn
ess
(S)
Spec
ies
richn
ess
(S)
Species richness
024681012141618
Abun
danc
e(#h
-1)
Abun
danc
e(#h
-1)
Abundance
Species richnessAbundance
0
2
4
6
8
10
12
1 2 3 4 50
2
4
6
8
10
12
14
16
Fig. 3. The temporal and spatial variations in mean species richness
and abundance of fishes at Koycegiz LagooneEstuarine System
(barsG 1SE).
hand, the total number (not the averages) of speciesobtained at each site throughout the study exhibiteda strong spatial variation (Table 2). Sites 1 and 2 yielded10 species, whereas 14 species were captured at sites 3 and4. Site 5, on the other hand, yielded 32 species mostlyconsisting of marine species (Table 2). Across all samples,species richness was correlated with, pH (rZ 0.36; PZ0.005), Secchi depth (rZ�0.44; P! 0.0001), salinity(rZ 0.301; PZ 0.020), and distance (rZ�0.255; PZ0.049).
3.5. Canonical correspondence analysis
CCA eigenvalues of the first four multivariate axeswere 0.52 (CCA1), 0.18 (CCA2), 0.12 (CCA3), and 0.03(CCA4). Specieseenvironment correlation coefficientsfor the first four axes were 0.91, 0.74, 0.75, and 0.49,respectively. Cumulative percentage variance of speciesfor the first four axes (CCA 1e4) was 29.6. The first andsecond axes modeled 18.2% and 6.2% of species data,respectively, and they cumulatively accounted for 81.7%of variance of specieseenvironment relationship mod-eled by CCA. Therefore, results obtained from the firsttwo axes were plotted (Fig. 4).
The length of vector of a given variable on the CCAplots indicates the importance of that variable. Salinity(0.84), which had the longest vector along the first axis,was significantly correlated with the first axis whichexplained most of the variation (59.1%) in the speciesdata. The second axis, which explained 19.8% of thevariation, was only significantly (�0.65) associated with
-1.0
CCA 1
CC
A 2
-1
.0
+0.7
pH
DO
+1.0
Salinity
Secchi depth
Tem
peratu
re
Fig. 4. Plot of site scores on the first two axes with five environmental
variables from CCA. Sites 1, 2, and 3 of summer and early fall months
( ), sites 1, 2, and 3 of winter and early spring months ( ), site 4 of
all months ( ), and site 5 of all month (,).
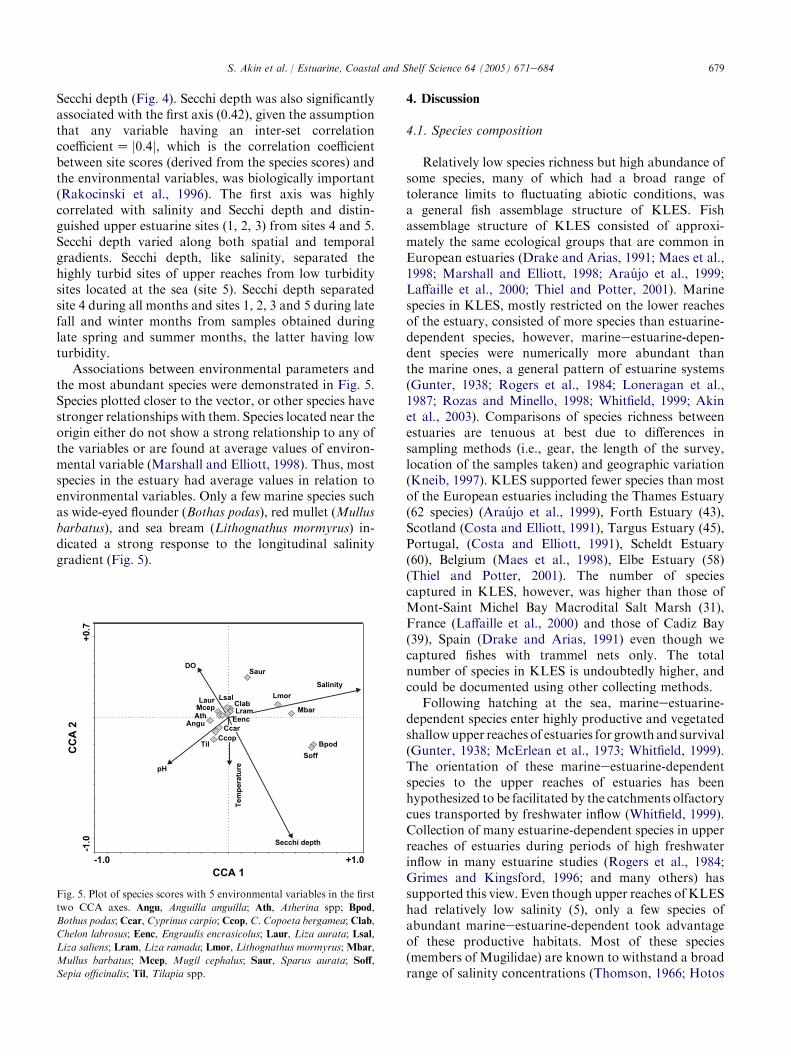
679S. Akin et al. / Estuarine, Coastal and Shelf Science 64 (2005) 671e684
Secchi depth (Fig. 4). Secchi depth was also significantlyassociated with the first axis (0.42), given the assumptionthat any variable having an inter-set correlationcoefficientZ j0.4j, which is the correlation coefficientbetween site scores (derived from the species scores) andthe environmental variables, was biologically important(Rakocinski et al., 1996). The first axis was highlycorrelated with salinity and Secchi depth and distin-guished upper estuarine sites (1, 2, 3) from sites 4 and 5.Secchi depth varied along both spatial and temporalgradients. Secchi depth, like salinity, separated thehighly turbid sites of upper reaches from low turbiditysites located at the sea (site 5). Secchi depth separatedsite 4 during all months and sites 1, 2, 3 and 5 during latefall and winter months from samples obtained duringlate spring and summer months, the latter having lowturbidity.
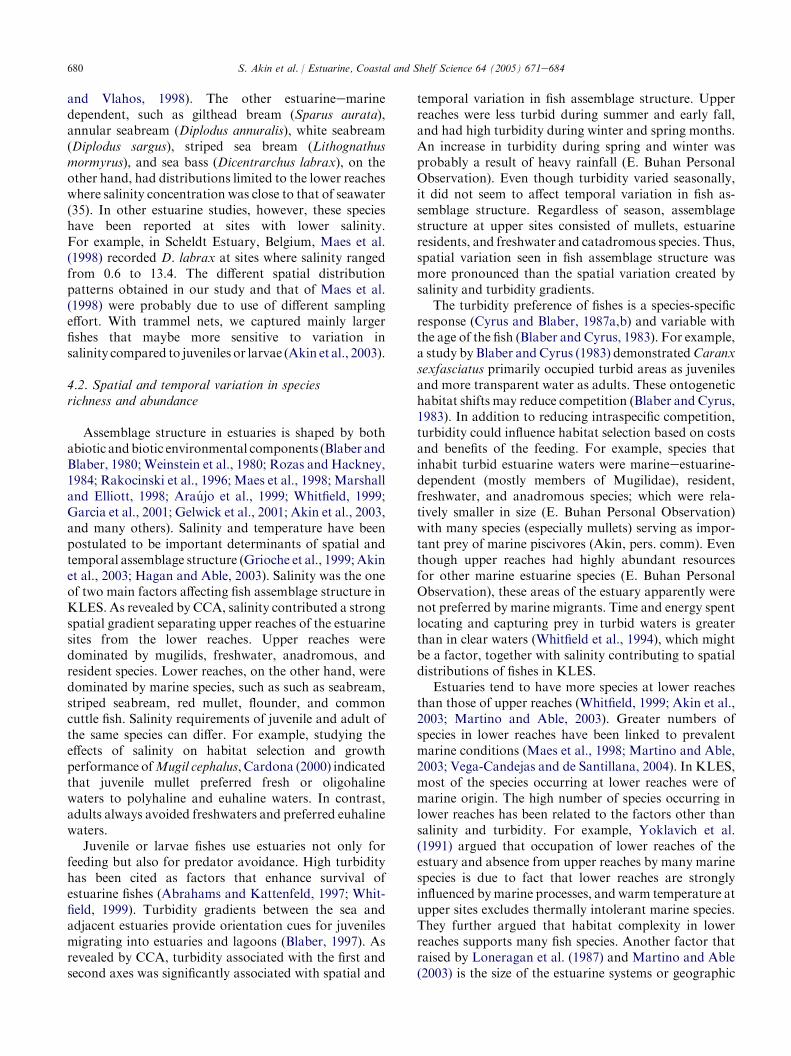
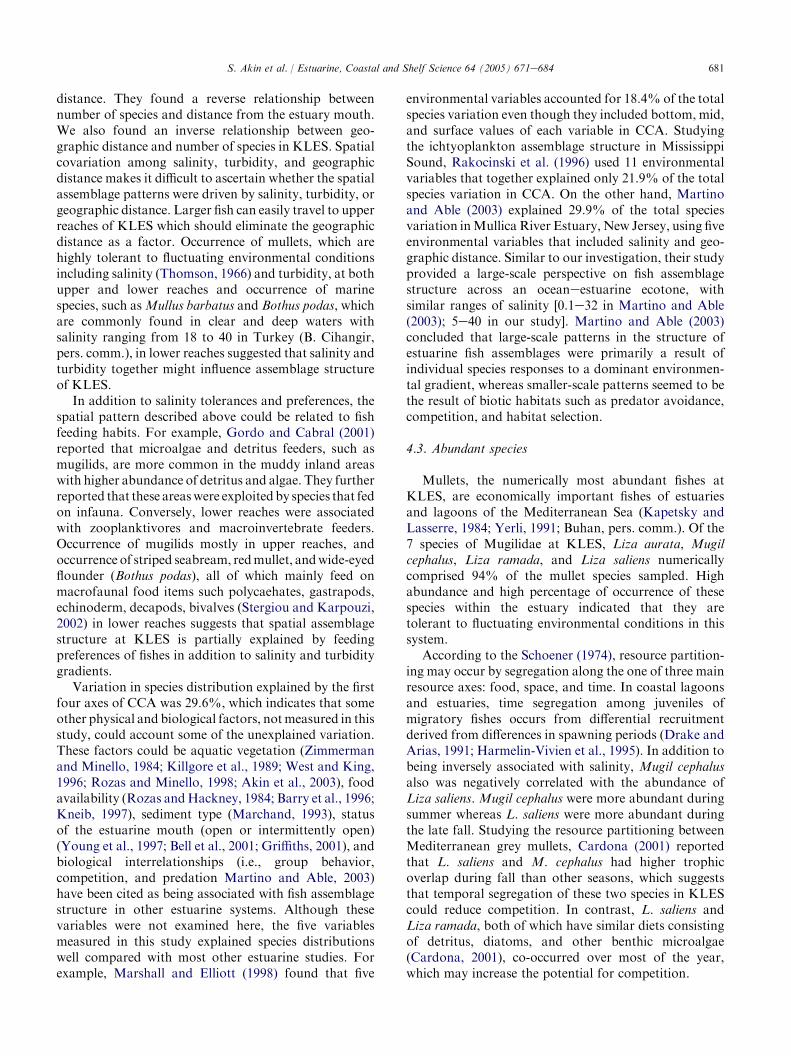
Associations between environmental parameters andthe most abundant species were demonstrated in Fig. 5.Species plotted closer to the vector, or other species havestronger relationships with them. Species located near theorigin either do not show a strong relationship to any ofthe variables or are found at average values of environ-mental variable (Marshall and Elliott, 1998). Thus, mostspecies in the estuary had average values in relation toenvironmental variables. Only a few marine species suchas wide-eyed flounder (Bothas podas), red mullet (Mullusbarbatus), and sea bream (Lithognathus mormyrus) in-dicated a strong response to the longitudinal salinitygradient (Fig. 5).
-1.0
CCA 1
CC
A 2
+1.0
-1.0
+0.7
Salinity
Secchi depth
pH
DO
Tem
peratu
re
Bpod
Soff
Mbar
Lmor
Saur
Angu
Til
Laur
Ath
McepClab
Lram
Lsal
Eenc
Ccar
Ccop
Fig. 5. Plot of species scores with 5 environmental variables in the first
two CCA axes. Angu, Anguilla anguilla; Ath, Atherina spp; Bpod,
Bothus podas; Ccar, Cyprinus carpio; Ccop, C. Copoeta bergamea; Clab,
Chelon labrosus; Eenc, Engraulis encrasicolus; Laur, Liza aurata; Lsal,
Liza saliens; Lram, Liza ramada; Lmor, Lithognathus mormyrus; Mbar,
Mullus barbatus; Mcep, Mugil cephalus; Saur, Sparus aurata; Soff,
Sepia officinalis; Til, Tilapia spp.
4. Discussion
4.1. Species composition
Relatively low species richness but high abundance ofsome species, many of which had a broad range oftolerance limits to fluctuating abiotic conditions, wasa general fish assemblage structure of KLES. Fishassemblage structure of KLES consisted of approxi-mately the same ecological groups that are common inEuropean estuaries (Drake and Arias, 1991; Maes et al.,1998; Marshall and Elliott, 1998; Araujo et al., 1999;Laffaille et al., 2000; Thiel and Potter, 2001). Marinespecies in KLES, mostly restricted on the lower reachesof the estuary, consisted of more species than estuarine-dependent species, however, marineeestuarine-depen-dent species were numerically more abundant thanthe marine ones, a general pattern of estuarine systems(Gunter, 1938; Rogers et al., 1984; Loneragan et al.,1987; Rozas and Minello, 1998; Whitfield, 1999; Akinet al., 2003). Comparisons of species richness betweenestuaries are tenuous at best due to differences insampling methods (i.e., gear, the length of the survey,location of the samples taken) and geographic variation(Kneib, 1997). KLES supported fewer species than mostof the European estuaries including the Thames Estuary(62 species) (Araujo et al., 1999), Forth Estuary (43),Scotland (Costa and Elliott, 1991), Targus Estuary (45),Portugal, (Costa and Elliott, 1991), Scheldt Estuary(60), Belgium (Maes et al., 1998), Elbe Estuary (58)(Thiel and Potter, 2001). The number of speciescaptured in KLES, however, was higher than those ofMont-Saint Michel Bay Macrodital Salt Marsh (31),France (Laffaille et al., 2000) and those of Cadiz Bay(39), Spain (Drake and Arias, 1991) even though wecaptured fishes with trammel nets only. The totalnumber of species in KLES is undoubtedly higher, andcould be documented using other collecting methods.
Following hatching at the sea, marineeestuarine-dependent species enter highly productive and vegetatedshallowupper reaches of estuaries for growth and survival(Gunter, 1938; McErlean et al., 1973; Whitfield, 1999).The orientation of these marineeestuarine-dependentspecies to the upper reaches of estuaries has beenhypothesized to be facilitated by the catchments olfactorycues transported by freshwater inflow (Whitfield, 1999).Collection of many estuarine-dependent species in upperreaches of estuaries during periods of high freshwaterinflow in many estuarine studies (Rogers et al., 1984;Grimes and Kingsford, 1996; and many others) hassupported this view. Even though upper reaches of KLEShad relatively low salinity (5), only a few species ofabundant marineeestuarine-dependent took advantageof these productive habitats. Most of these species(members of Mugilidae) are known to withstand a broadrange of salinity concentrations (Thomson, 1966; Hotos
680 S. Akin et al. / Estuarine, Coastal and Shelf Science 64 (2005) 671e684
and Vlahos, 1998). The other estuarineemarinedependent, such as gilthead bream (Sparus aurata),annular seabream (Diplodus annuralis), white seabream(Diplodus sargus), striped sea bream (Lithognathusmormyrus), and sea bass (Dicentrarchus labrax), on theother hand, had distributions limited to the lower reacheswhere salinity concentration was close to that of seawater(35). In other estuarine studies, however, these specieshave been reported at sites with lower salinity.For example, in Scheldt Estuary, Belgium, Maes et al.(1998) recorded D. labrax at sites where salinity rangedfrom 0.6 to 13.4. The different spatial distributionpatterns obtained in our study and that of Maes et al.(1998) were probably due to use of different samplingeffort. With trammel nets, we captured mainly largerfishes that maybe more sensitive to variation insalinity compared to juveniles or larvae (Akin et al., 2003).
4.2. Spatial and temporal variation in speciesrichness and abundance
Assemblage structure in estuaries is shaped by bothabiotic andbiotic environmental components (Blaber andBlaber, 1980; Weinstein et al., 1980; Rozas and Hackney,1984; Rakocinski et al., 1996; Maes et al., 1998; Marshalland Elliott, 1998; Araujo et al., 1999; Whitfield, 1999;Garcia et al., 2001; Gelwick et al., 2001; Akin et al., 2003,and many others). Salinity and temperature have beenpostulated to be important determinants of spatial andtemporal assemblage structure (Grioche et al., 1999; Akinet al., 2003; Hagan and Able, 2003). Salinity was the oneof two main factors affecting fish assemblage structure inKLES. As revealed by CCA, salinity contributed a strongspatial gradient separating upper reaches of the estuarinesites from the lower reaches. Upper reaches weredominated by mugilids, freshwater, anadromous, andresident species. Lower reaches, on the other hand, weredominated by marine species, such as such as seabream,striped seabream, red mullet, flounder, and commoncuttle fish. Salinity requirements of juvenile and adult ofthe same species can differ. For example, studying theeffects of salinity on habitat selection and growthperformance ofMugil cephalus, Cardona (2000) indicatedthat juvenile mullet preferred fresh or oligohalinewaters to polyhaline and euhaline waters. In contrast,adults always avoided freshwaters and preferred euhalinewaters.
Juvenile or larvae fishes use estuaries not only forfeeding but also for predator avoidance. High turbidityhas been cited as factors that enhance survival ofestuarine fishes (Abrahams and Kattenfeld, 1997; Whit-field, 1999). Turbidity gradients between the sea andadjacent estuaries provide orientation cues for juvenilesmigrating into estuaries and lagoons (Blaber, 1997). Asrevealed by CCA, turbidity associated with the first andsecond axes was significantly associated with spatial and
temporal variation in fish assemblage structure. Upperreaches were less turbid during summer and early fall,and had high turbidity during winter and spring months.An increase in turbidity during spring and winter wasprobably a result of heavy rainfall (E. Buhan PersonalObservation). Even though turbidity varied seasonally,it did not seem to affect temporal variation in fish as-semblage structure. Regardless of season, assemblagestructure at upper sites consisted of mullets, estuarineresidents, and freshwater and catadromous species. Thus,spatial variation seen in fish assemblage structure wasmore pronounced than the spatial variation created bysalinity and turbidity gradients.
The turbidity preference of fishes is a species-specificresponse (Cyrus and Blaber, 1987a,b) and variable withthe age of the fish (Blaber and Cyrus, 1983). For example,a study by Blaber andCyrus (1983) demonstratedCaranxsexfasciatus primarily occupied turbid areas as juvenilesand more transparent water as adults. These ontogenetichabitat shifts may reduce competition (Blaber and Cyrus,1983). In addition to reducing intraspecific competition,turbidity could influence habitat selection based on costsand benefits of the feeding. For example, species thatinhabit turbid estuarine waters were marineeestuarine-dependent (mostly members of Mugilidae), resident,freshwater, and anadromous species; which were rela-tively smaller in size (E. Buhan Personal Observation)with many species (especially mullets) serving as impor-tant prey of marine piscivores (Akin, pers. comm). Eventhough upper reaches had highly abundant resourcesfor other marine estuarine species (E. Buhan PersonalObservation), these areas of the estuary apparently werenot preferred by marine migrants. Time and energy spentlocating and capturing prey in turbid waters is greaterthan in clear waters (Whitfield et al., 1994), which mightbe a factor, together with salinity contributing to spatialdistributions of fishes in KLES.
Estuaries tend to have more species at lower reachesthan those of upper reaches (Whitfield, 1999; Akin et al.,2003; Martino and Able, 2003). Greater numbers ofspecies in lower reaches have been linked to prevalentmarine conditions (Maes et al., 1998; Martino and Able,2003; Vega-Candejas and de Santillana, 2004). In KLES,most of the species occurring at lower reaches were ofmarine origin. The high number of species occurring inlower reaches has been related to the factors other thansalinity and turbidity. For example, Yoklavich et al.(1991) argued that occupation of lower reaches of theestuary and absence from upper reaches by many marinespecies is due to fact that lower reaches are stronglyinfluenced bymarine processes, and warm temperature atupper sites excludes thermally intolerant marine species.They further argued that habitat complexity in lowerreaches supports many fish species. Another factor thatraised by Loneragan et al. (1987) and Martino and Able(2003) is the size of the estuarine systems or geographic
681S. Akin et al. / Estuarine, Coastal and Shelf Science 64 (2005) 671e684
distance. They found a reverse relationship betweennumber of species and distance from the estuary mouth.We also found an inverse relationship between geo-graphic distance and number of species in KLES. Spatialcovariation among salinity, turbidity, and geographicdistance makes it difficult to ascertain whether the spatialassemblage patterns were driven by salinity, turbidity, orgeographic distance. Larger fish can easily travel to upperreaches of KLES which should eliminate the geographicdistance as a factor. Occurrence of mullets, which arehighly tolerant to fluctuating environmental conditionsincluding salinity (Thomson, 1966) and turbidity, at bothupper and lower reaches and occurrence of marinespecies, such asMullus barbatus and Bothus podas, whichare commonly found in clear and deep waters withsalinity ranging from 18 to 40 in Turkey (B. Cihangir,pers. comm.), in lower reaches suggested that salinity andturbidity together might influence assemblage structureof KLES.
In addition to salinity tolerances and preferences, thespatial pattern described above could be related to fishfeeding habits. For example, Gordo and Cabral (2001)reported that microalgae and detritus feeders, such asmugilids, are more common in the muddy inland areaswith higher abundance of detritus and algae. They furtherreported that these areaswere exploitedby species that fedon infauna. Conversely, lower reaches were associatedwith zooplanktivores and macroinvertebrate feeders.Occurrence of mugilids mostly in upper reaches, andoccurrence of striped seabream, redmullet, andwide-eyedflounder (Bothus podas), all of which mainly feed onmacrofaunal food items such polycaehates, gastrapods,echinoderm, decapods, bivalves (Stergiou and Karpouzi,2002) in lower reaches suggests that spatial assemblagestructure at KLES is partially explained by feedingpreferences of fishes in addition to salinity and turbiditygradients.
Variation in species distribution explained by the firstfour axes of CCA was 29.6%, which indicates that someother physical and biological factors, notmeasured in thisstudy, could account some of the unexplained variation.These factors could be aquatic vegetation (Zimmermanand Minello, 1984; Killgore et al., 1989; West and King,1996; Rozas and Minello, 1998; Akin et al., 2003), foodavailability (Rozas andHackney, 1984; Barry et al., 1996;Kneib, 1997), sediment type (Marchand, 1993), statusof the estuarine mouth (open or intermittently open)(Young et al., 1997; Bell et al., 2001; Griffiths, 2001), andbiological interrelationships (i.e., group behavior,competition, and predation Martino and Able, 2003)have been cited as being associated with fish assemblagestructure in other estuarine systems. Although thesevariables were not examined here, the five variablesmeasured in this study explained species distributionswell compared with most other estuarine studies. Forexample, Marshall and Elliott (1998) found that five
environmental variables accounted for 18.4% of the totalspecies variation even though they included bottom, mid,and surface values of each variable in CCA. Studyingthe ichtyoplankton assemblage structure in MississippiSound, Rakocinski et al. (1996) used 11 environmentalvariables that together explained only 21.9% of the totalspecies variation in CCA. On the other hand, Martinoand Able (2003) explained 29.9% of the total speciesvariation inMullica River Estuary, New Jersey, using fiveenvironmental variables that included salinity and geo-graphic distance. Similar to our investigation, their studyprovided a large-scale perspective on fish assemblagestructure across an oceaneestuarine ecotone, withsimilar ranges of salinity [0.1e32 in Martino and Able(2003); 5e40 in our study]. Martino and Able (2003)concluded that large-scale patterns in the structure ofestuarine fish assemblages were primarily a result ofindividual species responses to a dominant environmen-tal gradient, whereas smaller-scale patterns seemed to bethe result of biotic habitats such as predator avoidance,competition, and habitat selection.
4.3. Abundant species
Mullets, the numerically most abundant fishes atKLES, are economically important fishes of estuariesand lagoons of the Mediterranean Sea (Kapetsky andLasserre, 1984; Yerli, 1991; Buhan, pers. comm.). Of the7 species of Mugilidae at KLES, Liza aurata, Mugilcephalus, Liza ramada, and Liza saliens numericallycomprised 94% of the mullet species sampled. Highabundance and high percentage of occurrence of thesespecies within the estuary indicated that they aretolerant to fluctuating environmental conditions in thissystem.
According to the Schoener (1974), resource partition-ing may occur by segregation along the one of three mainresource axes: food, space, and time. In coastal lagoonsand estuaries, time segregation among juveniles ofmigratory fishes occurs from differential recruitmentderived from differences in spawning periods (Drake andArias, 1991; Harmelin-Vivien et al., 1995). In addition tobeing inversely associated with salinity, Mugil cephalusalso was negatively correlated with the abundance ofLiza saliens. Mugil cephalus were more abundant duringsummer whereas L. saliens were more abundant duringthe late fall. Studying the resource partitioning betweenMediterranean grey mullets, Cardona (2001) reportedthat L. saliens and M. cephalus had higher trophicoverlap during fall than other seasons, which suggeststhat temporal segregation of these two species in KLEScould reduce competition. In contrast, L. saliens andLiza ramada, both of which have similar diets consistingof detritus, diatoms, and other benthic microalgae(Cardona, 2001), co-occurred over most of the year,which may increase the potential for competition.

682 S. Akin et al. / Estuarine, Coastal and Shelf Science 64 (2005) 671e684
5. Conclusions
High species richness at lower reaches of the estuary,high abundance of estuarine-dependent species, andhigh numbers of species during spring, summer-earlyautumn were dominant features of KLES. The spatialand temporal distributions of fishes were negativelyassociated with Secchi depth and positively associatedwith salinity. Less turbid waters at freshwatereseawaterinterface zone were occupied by mostly marine speciesthat apparently avoided low salinity and high turbidity.In contrast, mullets and several other fishes known totolerate a broad range of salinity concentrations werebroadly distributed. Thus, patterns in fish assemblagestructure of this large-scale lagooneestuarine systemseemed to be influenced primarily by species-specificresponses to dominant environmental gradients. Theresults of this study together with those of Martino andAble (2003) are consistent with the theoretical assump-tions of community structure which imply that physio-logical tolerances of organisms to the dominant gradientdetermine the frame of the structure, while biotic in-teractions determine the species distribution within thisframe (Menge and Olson, 1990). Biotic interactions mayaccount some of the unexplained variation in fishassemblage structure of KLES, however, the quantityof this variation needs to be determined by furtherinvestigations of fish assemblage structure in KLES.
Acknowledgments
We thank Yavuz Morkan, Murat Topgul, and ZaferAkpinar for assistance with data and specimen collec-tion in the field. Funding was provided by TurkishMinistry of Agriculture, Bodrum Fisheries ResearchInstitute. The comments of Professors Whitfield, Cyrusand Elliott were greatly appreciated.
References
Abrahams, M.V., Kattenfeld, M.G., 1997. The role of turbidity as
a constraint on predator-prey interactions in aquatic environments.
Behavioral Ecology and Sociobiology 40, 169e174.Able, K.W., 1999. Measures of juvenile fish habitat quality: examples
from a National Estuarine Research Reserve. In: Beneka, L.R.
(Ed.), Fish habitat: Essential Fish Habitat and Rehabilitation.
American Fisheries Society Symposium 22, Bethesda, MD,
pp. 207e232.
Akin, S., Winemiller, K.O., Gelwick, F.P., 2003. Seasonal and temporal
variation in fish and macrocrustecean assemblage structure in Mad
Island Marsh Estuary, Texas. Estuarine, Coastal and Shelf Science
57, 269e282, doi:10.1016/S0272-7714(02)00354-2.
Araujo, F.G., Bailey, R.G., Williams, W.P., 1999. Spatial and temporal
variations in fish populations in the upper Thames estuary. Journal
of Fish Biology 55, 836e853, doi:10.1006/jfbi.1999.1042.
Barry, J.P., Yoklavich, M.M., Cailliet, G.M., Ambrose, D.A.,
Antrim, B.S., 1996. Trophic ecology of the dominant fishes in
Elkhorn Slough, California, 1974e1980. Estuaries 19, 115e118.
Bell, K.N.I., Cowley, P.D., Whitfield, K., 2001. Seasonality in
frequency of marine access to an intermittently open estuary:
implications for recruitment strategies. Estuarine, Coastal and
Shelf Science 52, 327e337, doi:10.1006/ecss.2000-0709.
Blaber, S.J.M., 2000. Tropical Estuarine Fishes: Ecology, Exploita-
tion, and Conservation. Blackwell Science, London, 384 pp.
Blaber, S.J.M., 1997. Fish and fisheries of tropical estuaries. Fish and
Fisheries Series, vol. 22. Chapman and Hall, London, 367 pp.
Blaber, S.J.M., Cyrus, D.P., 1983. The biology of Carangidae
(Teleostei) in Natal estuaries. Journal of Fish Biology 22,
173e188.
Blaber, S.J.M., Blaber, T.G., 1980. Factors affecting the distribution of
juvenile estuarine and inshore fish. Journal of Fish Biology 17,
143e162.
Bronte, C.R., Johnson, D.W., 1984. Evaluation of the commercial
entanglement-gear fishery in Lake Barkley and Kentucky Lake,
Kentucky. North American Journal of Fisheries Management 4,
75e83.
Cardona, L., 2001. Non-competitive coexistence between Mediterra-
nean grey mullet: evidence from seasonal changes in food
availability, niche breadth and trophic overlap. Journal of Fish
Biology 59, 729e744, doi:10.1006/jfbi.2001.1685.
Cardona, L., 2000. Effects of salinity on the habitat selection and
growth performance of Mediterranean Flathead Grey Mullet
Mugil cephalus (Osteichthyes, Mugilidae). Estuarine, Coastal and
Shelf Science 50, 727e737, doi:10.1006/ecss.1999.0594.
Claridge, P.N., Potter, I.C., Hardisty, M.W., 1986. Seasonal changes
in movements, abundance, size composition and diversity of the
fish fauna of the Severn Estuary. Journal of the Marine Biological
Association of the United Kingdom 66, 229e258.
Costa, M.J., Elliott, M., 1991. Fish usage and feeding in two
industrialized estuaries e the Targus, Portugal, and the Forth,
Scotland. In: Elliott, M., Ducrotoy, J.P. (Eds.), Estuaries and
Coasts: Spatial and Temporal Intercomparisons. Olsen & Olsen,
Fredensborg, pp. 289e297.Cowen, R.K., Hare, J.A., Fahay, M.P., 1993. Beyond hydrography:
can physical processes explain larval fish assemblages within the
Middle Atlantic Bight? Bulletin of Marine Science 53, 567e587.Cyrus, D.P., Blaber, S.J.M., 1992. Turbidity and salinity in a tropical
Northern estuary and their influence on fish distribution. Estua-
rine, Coastal and Shelf Science 35, 545e563.
Cyrus, D.P., Blaber, S.J.M., 1987a. The influence of turbidity on
juvenile marine fishes in estuaries. Part 1. Field studies at Lake St.
Lucia on the southeastern coast of Africa. Southern African
Journal of Aquatic Sciences 109, 53e70.
Cyrus, D.P., Blaber, S.J.M., 1987b. The influence of turbidity on
juvenile marine fishes in estuaries. Part 2. Laboratory studies,
comparisons, with field data and conclusions. Southern African
Journal of Aquatic Sciences 18, 71e91.
Day Jr., J.W., Hall, C.A.S., Kemp, W.M., Yanez-Arancibia, A., 1989.
Estuarine Ecology. Wiley, New York, 558 pp.
Drake, P., Arias, A.M., 1991. Composition and seasonal fluctuations
of ichthyoplankton community in a shallow tidal channel of Cadiz
Bay (S.W. Spain). Journal of Fish Biology 39, 347e364.
Elliott, M., Hemingway, K.L. (Eds.), 2002. Fishes in Estuaries.
Blackwell Science, Oxford, 636 pp.
Elliott, M., Dewailly, F., 1995. The structure and components of
European fish assemblages. Journal of Netherlands Aquatic
Ecology 29, 397e417.
Everett, R.A., Ruiz, G.M., 1993. Coarse woody debris as a refuge from
predation in aquatic communities: an experimental test. Oecologia
93, 475e486.
Fraser, T.H., 1997. Abundance, seasonality, community indices, trends
and relationships with physicochemical factors of trawled fish in

683S. Akin et al. / Estuarine, Coastal and Shelf Science 64 (2005) 671e684
upper Charlotte Harbor, Florida. Bulletin of Marine Science 60,
739e763.
Garcia, A.M., Vieira, J.P., Winemiller, K.O., 2001. Dynamics of the
shallow-water fish assemblage of the Patos Lagoon estuary (Brazil)
during cold and warm ENSO episodes. Journal of Fish Biology 59,
1218e1238, doi:10.1006/jfbi.2001.1734.
Geldiay, R., 1977. Ecological aspects of grey mullet living along the
coast of Turkey. Ege University, Journal of the Faculty of Science
B, 155e170.
Gelwick, F.P., Akin, S., Arrington, D.A., Winemiller, K.O., 2001. Fish
assemblage structure in relation to environmental variation in
a Texas Gulf coastal wetland. Estuaries 24, 285e296.Gordo, L.S., Cabral, H.N., 2001. The fish assemblage structure of a
hydrologically altered coastal lagoon: the Obidos lagoon (Portu-
gal). Hydrobiologia 459, 125e133.
Griffiths, S.P., 2001. Factors influencing fish composition in an
Australian intermittently open estuary. Is stability salinity-
dependent? Estuarine, Coastal and Shelf Science 52, 739e751,
doi:10.1006/ecss.2000.0756.
Grimes, C.B., Kingsford, M.J., 1996. How do riverine plumes of
different size influence fish larvae: do they enhance recruitment?
Marine and Freshwater Research 47, 191e208.
Grioche, A., Koubbi, P., Harlay, X., 1999. Spatial patterns of
ichthyoplankton assemblage along the eastern English Channel
French coast during the Spring 1995. Estuarine, Coastal and Shelf
Science 49, 141e152, doi:10.1006/ecss.1999.0483.
Gunter, G., 1961. Some relations of estuarine organisms to salinity.
Limnology and Oceanography 6, 182e190.
Gunter, G., 1938. Seasonal variations in abundance of certain
estuarine and marine fishes in Louisiana, with particular reference
to life histories. Ecological Monographs 8, 313e346.
Hagan, S.M., Able, K.W., 2003. Seasonal changes of the pelagic fish
assemblage in a temperate estuary. Estuarine, Coastal and Shelf
Science 56 (1), 15e29, doi:10.1016/S0272.7714(02)00116-6.
Harmelin-Vivien, M.L., Harmelin, J.G., Leboulleux, V., 1995.
Microhabitat requirements for settlement of juvenile sparid fishes
on Mediterranean rocky shores. Hydrobiologia 300, 309e320.
Holbrook, S.J., Schmitt, R.J., 1989. Resource overlap, prey dynamics,
and the strength of competition. Ecology 706, 1943e1953.
Hotos, G.N., Vlahos, N., 1998. Salinity tolerance ofMugil cephalus and
Chelon labrosus (Pisces: Mugilidae) fry in experimental conditions.
Aquaculture 167, 329e338, doi:10.1016/S0044-8486(98)00314-7.Jaureguizar, A.J., Menni, R., Bremec, C., Mianza, H., Lasta, C., 2003.
Fish assemblage and environmental patterns in the Rıo de la Plata
estuary. Estuarine, Coastal and Shelf Science 56, 921e933,doi:10.1016/S0272-7714(02)00288-3.
Kapetsky, J.M., Lasserre, G., 1984. Management of coastal lagoon
fisheries. Studies and Reviews, vol. 61. FAO, Rome.
Kazanci, N., Plasa, R.H., Neubert, E., Izbirak, A., 1992. On the
limnology of Lake Koycegiz (SW Anatolia). Zoology in the Middle
East 6, 109e126.
Kennish, M.J., 1990. Ecology of estuaries. Biological Aspects, vol. 2.
CRC Press, Boca Raton, 380 pp.
Killgore, K.J., Morgan II, R.P., Rybicki, N.B., 1989. Distribution and
abundances of fishes associated with submerged aquatic plants in
Potomoc River. North American Journal of Fisheries Management
9, 101e111.
Kneib, R.T., 1997. Early life stages of resident nekton in intertidal
marshes. Estuaries 20, 214e230.
Laffaille, P., Feunteum, E., Lefeuvre, L.C., 2000. Composition of fish
communities in a European salt marsh (the Mont Saint-Michel
Bay, France). Estuarine, Coastal and Shelf Science 51,
429e438, doi:10.1006/ecss.2000.0675.
Lankford Jr., T.E., Targett, T.E., 1994. Suitability of estuarine nursery
zones for juvenile weakfish (Cynoscion regalis): effects of temper-
ature and salinity on feeding, growth and survival. Marine Biology
119, 611e620.
Loneragan, N.R., Potter, I.C., Lenanton, R.C., Caputi, N., 1987.
Influence of environmental variables on fish fauna of the deeper
waters of large Australian estuary. Marine Biology 94, 631e641.
Maes, J., Van Damme, P.A., Taillieu, A., Ollevier, F., 1998. Fish
communities along an oxygen-poor salinity gradient (Zeeschelde
Estuary, Belgium). Journal of Fish Biology 52, 534e546,
doi:10.1006/jfbi.1997.0602.
Marchand, J., 1993. The influence of seasonal salinity and turbidity
maximum variations on nursery function of the Loire estuary
(France). Netherlands Journal of Aquatic Ecology 27, 427e436.
Marshall, S., Elliott, M., 1998. Environmental influences on the fish
assemblages of the Humber Estuary, U.K. Estuarine, Coastal and
Shelf Science 46, 175e184, doi:10.1006/ecss.1997.0268.
Martino, E.J., Able, K.W., 2003. Fish assemblages across the marine
to low salinity transition zone of a temperate estuary. Estuarine,
Coastal and Shelf Science 56, 969e987, doi:10.1016/S0272-
7714(02)00305-0.
McErlean, A.J., O’Connor, S.G., Mihursky, J.A., Gibson, C.I., 1973.
Abundance, diversity and seasonal patterns of estuarine fish
populations. Estuarine and Coastal Marine Science 1, 19e36.
Menge, B.A., Olson, A.M., 1990. Role of scale and environmental
factors in regulation of community structure. Trends in Ecology
and Evolution 5, 52e57.Ogburn-Matthews, V., Allen, D.M., 1993. Interactions among some
dominant estuarine nekton species. Estuaries 16, 840e850.
Ozhan, E., 1988. Flow regimes and dynamics equilibrium of
morphological changes at Koycegiz Lake Inlet. Turkey Coastal
Engineering 12, 109e132.
Peterson, M.S., Ross, S.T., 1991. Dynamics of littoral fishes and
decapods along a coastal river-estuarine gradient. Estuarine,
Coastal and Shelf Science 33, 467e483.
Potter, I.C., Bird, D.J., Claridge, P.N., Clarke, K.R., Hyndes, G.A.,
Newton, L.C., 2001. Fish fauna of the Severn Estuary. Are there
long-term changes in abundance and species composition and are
the recruitment patterns of the main marine species correlated?
Journal of Experimental Marine Biology and Ecology 258, 15e37.
Potter, I.C., Beckley, L.E., Whitfield, A.K., Lenanton, R.C.J., 1990.
Comparisons between the roles played by estuaries in the life cycles
of fishes in temperate Western Australia and southern Africa.
Environmental Biology of Fishes 28, 143e178.
Potter, I.C., Claridge, P.N., Warwick, R.M., 1986. Consistency of
seasonal changes in an estuarine fish assemblages. Marine Ecology
Progress Series 32, 217e228.
Rakocinski, C.F., Lyczkowski-Shulz, J., Richardson, S.L., 1996.
Ichthyoplankton assemblage structure in Mississippi Sound as
revealed by canonical correspondence analysis. Estuarine, Coastal
and Shelf Science 43, 237e257, doi:10.1006/ecss.1996.0067.
Rakocinski, C.F., Baltz, D.M., Fleeger, J.W., 1992. Correspondence
between environmental gradients and the community structure
in Mississippi Sound as revealed by canonical correspondence
analysis. Marine Ecology Progress Series 80, 135e257.
Remmert, H., 1983. Studies and thoughts about the zonation along the
rocky shores of the Baltic. Zoologica 22, 121e125.Rogers, S.G., Targett, T.E., Von Sant, S.B., 1984. Fish nursery use in
Georgia salt marsh estuaries: the influence of springtime freshwater
conditions. Transactions of American Fisheries Society 113,
595e606.
Rozas, L.P., Minello, T.J., 1998. Nekton use of salt marsh, seagrass,
and nonvegetated habitats in a south Texas estuary (USA). Bulletin
of Marine Science 63, 481e501.Rozas, L.P., Minello, T.J., 1997. Estimating densities of small fish and
decapod crustaceans in shallow estuarine habitats: a review of
sampling design with focus on gear selectivity. Estuaries 20, 199e213.
Rozas, L.P., Hackney, C.T., 1984. Use of oligohaline marshes by fishes
andmacrofaunal crustaceans inNorthCarolina. Estuaries 7, 213e224.
Sanders, H.L., 1968. Marine benthic diversity: a comparative study.
American Naturalist 102, 243e282.
684 S. Akin et al. / Estuarine, Coastal and Shelf Science 64 (2005) 671e684
Schoener, T.W., 1974. Resource partitioning in natural communities.
Science 185, 27e39.
Shenker, J.M., Dean, J.M., 1979. The utilization of an intertidal salt
marsh creek by larval and juvenile fishes: abundance, diversity and
temporal variation. Estuaries 2, 154e163.
Sogard, S.M., Able, K.W., 1991. A comparison of eelgrass, sea lettuce
macroalgae, and marsh creeks as habitats for epibenthic fishes and
decapods. Estuarine, Coastal and Shelf Science 33, 501e519.Sokal, R.R., Rolf, F.J., 1998. Biometry: The Principles and Practice of
Statistics in Biological Research. W.H. Freeman and Company,
New York, 850 pp.
Stergiou, K.I., Karpouzi, V.S., 2002. Feeding habits and trophic levels
of Mediterranean fish. Reviews in Fish Biology and Fisheries 11,
217e254.
Szedlmayer, S.T., Able, K.W., 1996. Patterns of seasonal availability
and habitat use by fishes and decapod crustaceans in a southern
New Jersey estuary. Estuaries 19, 697e709.
Thiel, R., Potter, I.C., 2001. The ichthyofaunal composition of the
Elbe Estuary: an analysis in space and time. Marine Biology 138,
603e616.
Thomson, J.M., 1966. The grey mullets. Oceanography and Marine
Biology. An Annual Review 4, 301e335.
Thorman, S., 1986. Physical factors affecting the abundance and
species richness of fishes in the shallow waters of the southern
Bothnian Sea (Sweden). Estuarine, Coastal and Shelf Science 22,
357e369.
Vega-Cendejas, Ma.E., de Santillana, M.H., 2004. Fish community
structure and dynamics in a coastal hypersaline lagoon: Rio
Lagartos, Yucatan, Mexico. Estuarine, Coastal and Shelf Sciences
60, 285e294, doi:10.1016/j.ecss.2004.01.005.Wagner, M.C., Austin, H.M., 1999. Correspondence between envi-
ronmental gradients and summer littoral fish assemblages in low
salinity reaches of the Chesapeake Bay, USA. Marine Ecology
Progress Series 177, 197e212.
Weinstein, M.P., Weiss, S.L., Walters, M.F., 1980. Multiple determi-
nants of community structure in shallow marsh habitats, Cape
Fear River Estuary, North Carolina, USA. Marine Biology 58,
227e243.Weinstein, M.P., 1979. Shallow marsh habitats as primary nursery
for fishes and shellfish in Cape Fear River estuary, North
Carolina, USA. US Fish and Wildlife Service Fishery Bulletin 77,
339e357.West, R.J., King, R.J., 1996. Marine, brackish, and freshwater fish
communities in vegetated and bare shallows of an Australian
coastal river. Estuaries 19, 31e41.
Wheeler, A., 1969. The Fishes of The British Isles and North-West
Europe. Macmillan, London, 613 pp.
Whitfield, A.K., 1999. Ichthyofaunal assemblages in estuaries: a South
African case study. Reviews in Fish Biology and Fisheries 9,
151e186.
Whitfield, A.K., Paterson, A.W., Bok, A.H., Kok, H.M., 1994.
A comparison of ichthyofaunas in two permanently open eastern
Cape estuaries. South African Journal of Marine Sciences 29,
175e185.
Yerli, S., 1991. Koycegiz Lagun Sistemi’ndeki Chelon labrosus (RISSO,
1826)’nyn bazy biyolojik ozelliklerinin incelenmesi. Hacettepe
Universitesi Fen ve Muhendislik Bilimleri Dergisi 1 (12), 13e27.Yoklavich, M.M., Cailliet, G.M., Barry, J.B., Ambrose, D.A.,
Antrim, B.S., 1991. Temporal and spatial patterns in abundance
and diversity of fish assemblages in Elkhorn Slough, California.
Estuaries 14, 465e480.Young, G.C., Potter, I.C., Hyndes, G.A., de Lestang, S., 1997. The
ichthyofauna of an intermittently open estuary: implications of bar
breaching and low salinities on faunal composition. Estuarine,
Coastal and Shelf Science 45, 53e68, doi:10.1006/ecss.1996.0165.
Zimmerman, R.J., Minello, T.J., 1984. Densities of Penaeus aztecus,
Penaeus setiferus and other natant macrofauna in a Texas salt
marsh. Estuaries 7, 421e433.