fish passage and reintroduction phase 1 report
TRANSCRIPT
Fish Passage and Reintroduction Phase 1 Report:
Investigations Upstream of Chief Joseph and
Grand Coulee Dams
Prepared by the Upper Columbia United Tribes
May 2, 2019
Table of Contents
1.0 INTRODUCTION ........................................................................................................................ 8
1.1 REFERENCES.......................................................................................................................... 11
2.0 PURPOSE ................................................................................................................................... 12
3.0 GOALS ....................................................................................................................................... 13
4.0 DONOR STOCK AND RISK ASSESSMENT .......................................................................... 15
4.1 GENERAL METHODS ............................................................................................................ 15
4.2 RESULTS ................................................................................................................................. 17
4.2.1 Donor Sources ............................................................................................................... 17
4.2.2 Ecological Impacts ........................................................................................................ 21
4.2.3 Summary ....................................................................................................................... 23
4.3 REFERENCES.......................................................................................................................... 27
5.0 HABITAT ASSESSMENTS ...................................................................................................... 29
5.1 INTRODUCTION .................................................................................................................... 29
5.2 INTRINSIC POTENTIAL FOR CHINOOK AND STEELHEAD .......................................... 30
5.3 EDT MODELING OF CHINOOK AND STEELHEAD IN SELECT TRIBUTARIES .......... 37
5.4 LARGE RIVER CHINOOK SPAWNING HABITAT AND REDD CAPACITY .................. 42
5.5 CHINOOK REDD AND ADULT SPAWNER CAPACITY ESTIMATES ............................ 44
5.5.1 Caveats and Considerations ........................................................................................... 46
5.6 POTENTIAL SOCKEYE SALMON SPAWNER CAPACITY IN THE SANPOIL SUBBASIN
.......................................................................................................................................... 47
5.7 SOCKEYE SALMON REARING CAPACITY OF LAKE ROOSEVELT ............................. 50
5.8 CLIMATE CHANGE ............................................................................................................... 53
5.9 REFERENCES.......................................................................................................................... 55
6.0 LIFE-CYCLE MODELING ....................................................................................................... 59
6.1 INTRODUCTION .................................................................................................................... 59
6.2 OVERVIEW OF LCM .............................................................................................................. 67
6.2.1 Natural Production......................................................................................................... 67
6.2.2 Hatchery Production ...................................................................................................... 69
6.2.3 Harvest ........................................................................................................................... 70
6.2.4 Fish Passage .................................................................................................................. 71
6.2.5 Monte Carlo Sensitivity Analysis .................................................................................. 72
6.3 BASELINE SCENARIOS AND KEY LCM MODELING ASSUMPTIONS ......................... 72
6.3.1 Natural Production......................................................................................................... 73
6.3.2 Hydro Operations and Fish Passage .............................................................................. 73
6.3.3 Harvest ........................................................................................................................... 73
6.3.4 Hatchery ........................................................................................................................ 77
6.4 LCM RESULTS ........................................................................................................................ 78
6.4.1 Baseline LCM Results for Summer/Fall Chinook and Sockeye ................................... 78
6.4.2 Summer/Fall Chinook Modeling Variants .................................................................... 81
6.4.3 Sockeye Modeling Variants .......................................................................................... 87
6.4.4 Sensitivity Analysis for Summer/Fall Chinook and Sockeye ....................................... 90
6.5 REFERENCES.......................................................................................................................... 94
7.0 ADULT AND JUVENILE FISH PASSAGE ............................................................................. 95
7.1 INTRODUCTION .................................................................................................................... 95
7.2 ADULT PASSAGE FACILITIES ............................................................................................ 95
7.3 JUVENILE PASSAGE FACILITIES ....................................................................................... 97
7.3.1 The Floating Surface Collector (FSC) ........................................................................... 97
7.4 RESERVOIR PASSAGE AND SURVIVAL ........................................................................... 99
7.5 CHIEF JOSEPH PROJECT CONDITIONS AND IMPLICATIONS FOR FISH PASSAGE103
7.5.1 Project Conditions ....................................................................................................... 103
7.5.2 Implications for Fish Passage ...................................................................................... 106
7.5.3 Initial Juvenile Passage Facility Concept at Chief Joseph Dam .................................. 107
7.5.4 Initial Adult Passage Facility Concept at Chief Joseph Dam ...................................... 110
7.6 GRAND COULEE DAM PROJECT CONDITIONS AND IMPLICATIONS FOR FISH
PASSAGE ....................................................................................................................... 113
7.6.1 Project Conditions ....................................................................................................... 113
7.6.2 Implications for Fish Passage ...................................................................................... 115
7.6.3 Initial Juvenile Passage Facility Concept at Grand Coulee Dam ................................ 117
7.6.4 Initial Adult Passage Facility Concept at Grand Coulee Dam .................................... 121
7.7 FISH PASSAGE FINDINGS .................................................................................................. 122
7.7.1 Chief Joseph Dam........................................................................................................ 122
7.7.2 Grand Coulee Dam ...................................................................................................... 124
7.8 REFERENCES........................................................................................................................ 127
8.0 FUTURE FIELD STUDIES AND RECOMMENDATIONS .................................................. 130
8.1 CHIEF JOSEPH ACTIVITIES ............................................................................................... 130
8.1.1 Testing Key Assumptions ............................................................................................ 130
8.1.2 Interim Fish Facilities .................................................................................................. 132
8.2 GRAND COULEE DAM ACTIVITIES ................................................................................ 133
8.2.1 Testing Key Assumptions ............................................................................................ 133
8.2.2 Interim Fish Facilities .................................................................................................. 143
8.3 REFERENCES........................................................................................................................ 145
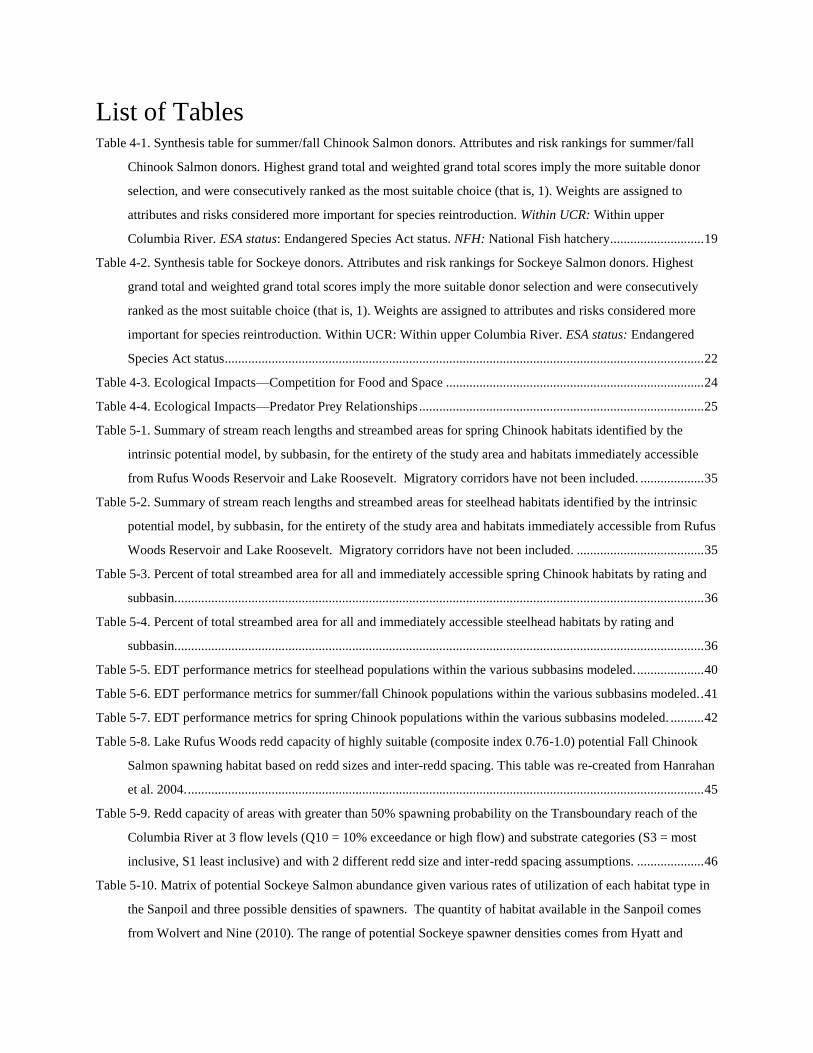
List of Tables Table 4-1. Synthesis table for summer/fall Chinook Salmon donors. Attributes and risk rankings for summer/fall
Chinook Salmon donors. Highest grand total and weighted grand total scores imply the more suitable donor
selection, and were consecutively ranked as the most suitable choice (that is, 1). Weights are assigned to
attributes and risks considered more important for species reintroduction. Within UCR: Within upper
Columbia River. ESA status: Endangered Species Act status. NFH: National Fish hatchery ............................ 19
Table 4-2. Synthesis table for Sockeye donors. Attributes and risk rankings for Sockeye Salmon donors. Highest
grand total and weighted grand total scores imply the more suitable donor selection and were consecutively
ranked as the most suitable choice (that is, 1). Weights are assigned to attributes and risks considered more
important for species reintroduction. Within UCR: Within upper Columbia River. ESA status: Endangered
Species Act status ............................................................................................................................................... 22
Table 4-3. Ecological Impacts—Competition for Food and Space ............................................................................. 24
Table 4-4. Ecological Impacts—Predator Prey Relationships ..................................................................................... 25
Table 5-1. Summary of stream reach lengths and streambed areas for spring Chinook habitats identified by the
intrinsic potential model, by subbasin, for the entirety of the study area and habitats immediately accessible
from Rufus Woods Reservoir and Lake Roosevelt. Migratory corridors have not been included. ................... 35
Table 5-2. Summary of stream reach lengths and streambed areas for steelhead habitats identified by the intrinsic
potential model, by subbasin, for the entirety of the study area and habitats immediately accessible from Rufus
Woods Reservoir and Lake Roosevelt. Migratory corridors have not been included. ...................................... 35
Table 5-3. Percent of total streambed area for all and immediately accessible spring Chinook habitats by rating and
subbasin.............................................................................................................................................................. 36
Table 5-4. Percent of total streambed area for all and immediately accessible steelhead habitats by rating and
subbasin.............................................................................................................................................................. 36
Table 5-5. EDT performance metrics for steelhead populations within the various subbasins modeled. .................... 40
Table 5-6. EDT performance metrics for summer/fall Chinook populations within the various subbasins modeled. . 41
Table 5-7. EDT performance metrics for spring Chinook populations within the various subbasins modeled. .......... 42
Table 5-8. Lake Rufus Woods redd capacity of highly suitable (composite index 0.76-1.0) potential Fall Chinook
Salmon spawning habitat based on redd sizes and inter-redd spacing. This table was re-created from Hanrahan
et al. 2004. .......................................................................................................................................................... 45
Table 5-9. Redd capacity of areas with greater than 50% spawning probability on the Transboundary reach of the
Columbia River at 3 flow levels (Q10 = 10% exceedance or high flow) and substrate categories (S3 = most
inclusive, S1 least inclusive) and with 2 different redd size and inter-redd spacing assumptions. .................... 46
Table 5-10. Matrix of potential Sockeye Salmon abundance given various rates of utilization of each habitat type in
the Sanpoil and three possible densities of spawners. The quantity of habitat available in the Sanpoil comes
from Wolvert and Nine (2010). The range of potential Sockeye spawner densities comes from Hyatt and
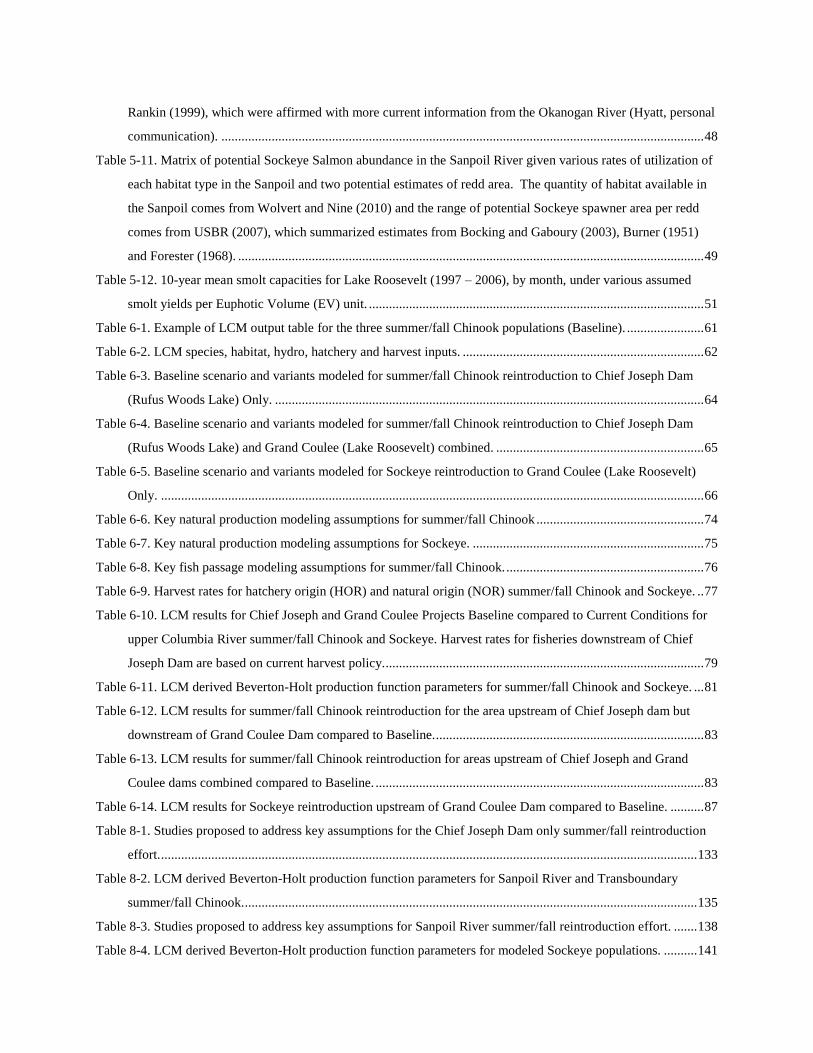
Rankin (1999), which were affirmed with more current information from the Okanogan River (Hyatt, personal
communication). ................................................................................................................................................ 48
Table 5-11. Matrix of potential Sockeye Salmon abundance in the Sanpoil River given various rates of utilization of
each habitat type in the Sanpoil and two potential estimates of redd area. The quantity of habitat available in
the Sanpoil comes from Wolvert and Nine (2010) and the range of potential Sockeye spawner area per redd
comes from USBR (2007), which summarized estimates from Bocking and Gaboury (2003), Burner (1951)
and Forester (1968). ........................................................................................................................................... 49
Table 5-12. 10-year mean smolt capacities for Lake Roosevelt (1997 – 2006), by month, under various assumed
smolt yields per Euphotic Volume (EV) unit. .................................................................................................... 51
Table 6-1. Example of LCM output table for the three summer/fall Chinook populations (Baseline). ....................... 61
Table 6-2. LCM species, habitat, hydro, hatchery and harvest inputs. ........................................................................ 62
Table 6-3. Baseline scenario and variants modeled for summer/fall Chinook reintroduction to Chief Joseph Dam
(Rufus Woods Lake) Only. ................................................................................................................................ 64
Table 6-4. Baseline scenario and variants modeled for summer/fall Chinook reintroduction to Chief Joseph Dam
(Rufus Woods Lake) and Grand Coulee (Lake Roosevelt) combined. .............................................................. 65
Table 6-5. Baseline scenario and variants modeled for Sockeye reintroduction to Grand Coulee (Lake Roosevelt)
Only. .................................................................................................................................................................. 66
Table 6-6. Key natural production modeling assumptions for summer/fall Chinook .................................................. 74
Table 6-7. Key natural production modeling assumptions for Sockeye. ..................................................................... 75
Table 6-8. Key fish passage modeling assumptions for summer/fall Chinook. ........................................................... 76
Table 6-9. Harvest rates for hatchery origin (HOR) and natural origin (NOR) summer/fall Chinook and Sockeye. .. 77
Table 6-10. LCM results for Chief Joseph and Grand Coulee Projects Baseline compared to Current Conditions for
upper Columbia River summer/fall Chinook and Sockeye. Harvest rates for fisheries downstream of Chief
Joseph Dam are based on current harvest policy................................................................................................ 79
Table 6-11. LCM derived Beverton-Holt production function parameters for summer/fall Chinook and Sockeye. ... 81
Table 6-12. LCM results for summer/fall Chinook reintroduction for the area upstream of Chief Joseph dam but
downstream of Grand Coulee Dam compared to Baseline................................................................................. 83
Table 6-13. LCM results for summer/fall Chinook reintroduction for areas upstream of Chief Joseph and Grand
Coulee dams combined compared to Baseline. .................................................................................................. 83
Table 6-14. LCM results for Sockeye reintroduction upstream of Grand Coulee Dam compared to Baseline. .......... 87
Table 8-1. Studies proposed to address key assumptions for the Chief Joseph Dam only summer/fall reintroduction
effort. ................................................................................................................................................................ 133
Table 8-2. LCM derived Beverton-Holt production function parameters for Sanpoil River and Transboundary
summer/fall Chinook. ....................................................................................................................................... 135
Table 8-3. Studies proposed to address key assumptions for Sanpoil River summer/fall reintroduction effort. ....... 138
Table 8-4. LCM derived Beverton-Holt production function parameters for modeled Sockeye populations. .......... 141

Table 8-5. Studies proposed to address key assumptions for the Grand Coulee Dam Sockeye reintroduction effort for
Sockeye. ........................................................................................................................................................... 144
List of Figures
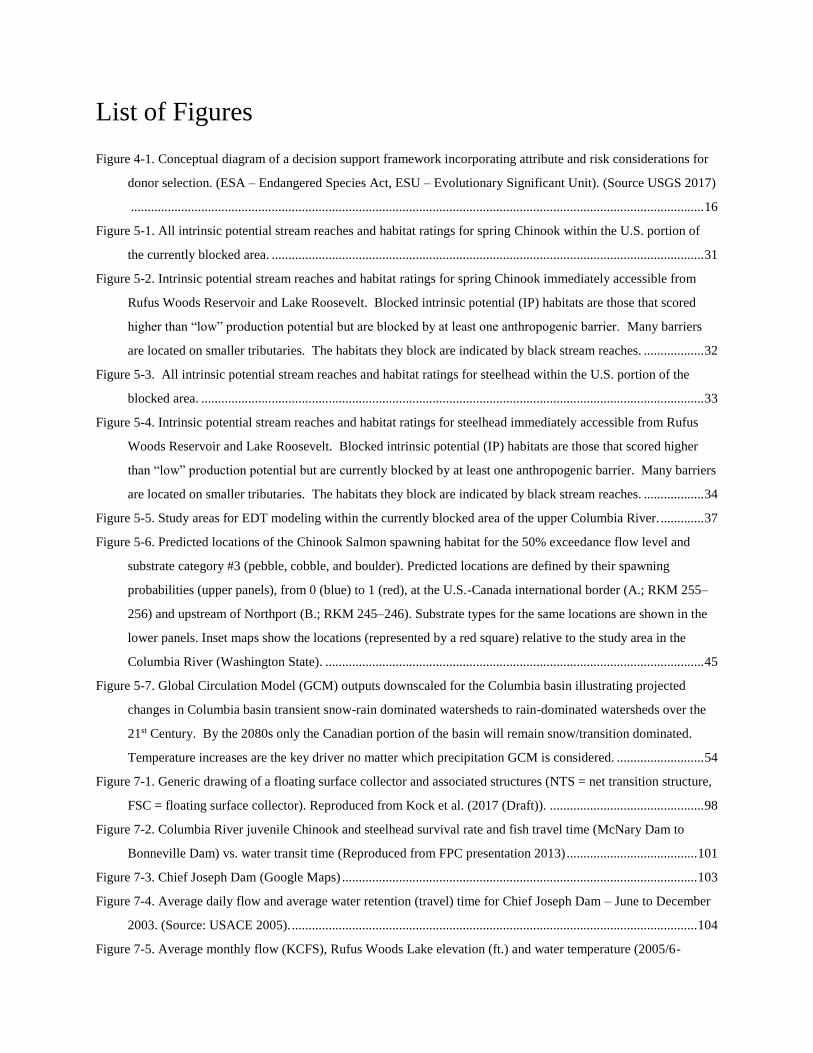
Figure 4-1. Conceptual diagram of a decision support framework incorporating attribute and risk considerations for
donor selection. (ESA – Endangered Species Act, ESU – Evolutionary Significant Unit). (Source USGS 2017)
........................................................................................................................................................................... 16
Figure 5-1. All intrinsic potential stream reaches and habitat ratings for spring Chinook within the U.S. portion of
the currently blocked area. ................................................................................................................................. 31
Figure 5-2. Intrinsic potential stream reaches and habitat ratings for spring Chinook immediately accessible from
Rufus Woods Reservoir and Lake Roosevelt. Blocked intrinsic potential (IP) habitats are those that scored
higher than “low” production potential but are blocked by at least one anthropogenic barrier. Many barriers
are located on smaller tributaries. The habitats they block are indicated by black stream reaches. .................. 32
Figure 5-3. All intrinsic potential stream reaches and habitat ratings for steelhead within the U.S. portion of the
blocked area. ...................................................................................................................................................... 33
Figure 5-4. Intrinsic potential stream reaches and habitat ratings for steelhead immediately accessible from Rufus
Woods Reservoir and Lake Roosevelt. Blocked intrinsic potential (IP) habitats are those that scored higher
than “low” production potential but are currently blocked by at least one anthropogenic barrier. Many barriers
are located on smaller tributaries. The habitats they block are indicated by black stream reaches. .................. 34
Figure 5-5. Study areas for EDT modeling within the currently blocked area of the upper Columbia River. ............. 37
Figure 5-6. Predicted locations of the Chinook Salmon spawning habitat for the 50% exceedance flow level and
substrate category #3 (pebble, cobble, and boulder). Predicted locations are defined by their spawning
probabilities (upper panels), from 0 (blue) to 1 (red), at the U.S.-Canada international border (A.; RKM 255–
256) and upstream of Northport (B.; RKM 245–246). Substrate types for the same locations are shown in the
lower panels. Inset maps show the locations (represented by a red square) relative to the study area in the
Columbia River (Washington State). ................................................................................................................. 45
Figure 5-7. Global Circulation Model (GCM) outputs downscaled for the Columbia basin illustrating projected
changes in Columbia basin transient snow-rain dominated watersheds to rain-dominated watersheds over the
21st Century. By the 2080s only the Canadian portion of the basin will remain snow/transition dominated.
Temperature increases are the key driver no matter which precipitation GCM is considered. .......................... 54
Figure 7-1. Generic drawing of a floating surface collector and associated structures (NTS = net transition structure,
FSC = floating surface collector). Reproduced from Kock et al. (2017 (Draft)). .............................................. 98
Figure 7-2. Columbia River juvenile Chinook and steelhead survival rate and fish travel time (McNary Dam to
Bonneville Dam) vs. water transit time (Reproduced from FPC presentation 2013) ....................................... 101
Figure 7-3. Chief Joseph Dam (Google Maps) .......................................................................................................... 103
Figure 7-4. Average daily flow and average water retention (travel) time for Chief Joseph Dam – June to December
2003. (Source: USACE 2005). ......................................................................................................................... 104
Figure 7-5. Average monthly flow (KCFS), Rufus Woods Lake elevation (ft.) and water temperature (2005/6-

2017/18) (Source: DART database) (http://www.cbr.washington.edu/dart/query/river_graph_text ). ............ 105
Figure 7-6. Average percent of total river flow spilled by month for Chief Joseph Dam (2008-2017) (Source Dart
Database) (http://www.cbr.washington.edu/dart/query/river_graph_text ). ..................................................... 106
Figure 7-7. Concept for possible Location of Chief Joseph FSC (blue box). White line denotes powerhouse effective
forebay area. Total effective forebay area is 51 acres. ..................................................................................... 108
Figure 7-8. Aerial view of Rocky Reach corner collector. White line denotes effective forebay area (12 acres).
Corner collector is in the lower left corner of the figure. ................................................................................. 110
Figure 7-9. Aerial view of Chief Joseph Hatchery adult fish ladder. The fish ladder is located on the right bank 0.5
miles downstream of Chief Joseph Dam. ......................................................................................................... 111
Figure 7-10. Aerial view of possible adult fish ladder at Foster Creek with secondary entrance in tailrace. Line in red
shows site of adult fish ladder and entrances. Facility would be like that shown in Figure 7-9....................... 112
Figure 7-11. Grand Coulee Dam (Google Maps) ...................................................................................................... 113
Figure 7-12. Average monthly flow (KCFS), Lake Roosevelt elevation (ft.) and water temperature (0C) (2007-
2016). ............................................................................................................................................................... 114
Figure 7-13. Average percent of total river flow spilled by month for Grand Coulee Dam (2007-2016) (Source: Dart
Database). (http://www.cbr.washington.edu/dart/query/river_graph_text ) ..................................................... 115
Figure 7-14. Average monthly water retention time of Lake Roosevelt presented in terms of the ratio between
storage volume and flow rate for the 2000-2015 water years. Gray bounds represent the 20th- and 80th-
percentile bounds. (Reproduced from USDOI 2018). ...................................................................................... 116
Figure 7-15. Inflow, outflow and water retention time for Grand Coulee Dam for years 2015 to 2017. The range of
water retention time for the period March 1 to June 1 ranged from 22-45 days, 16-50 days and 14-31 days for
years 2015, 2016 and 2017, respectively. (http://spokanetribalfisheries.droppages.com/) .............................. 116
Figure 7-16. Possible location of Grand Coulee Third Powerhouse FSC (blue box). White line denotes effective
forebay area. Total effective forebay area is 11 acres. ..................................................................................... 119
Figure 7-17. Total monthly fish entrainment by power plants at Grand Coulee Dam (1996-1999) (reproduced from
LeCaire 2000). ................................................................................................................................................. 120
Figure 7-18. Possible locations of Grand Coulee left and right bank fish ladders (blue rectangles). ........................ 122
P a g e | 1
Executive Summary
At the turn of the 20th century, salmon runs into the upper Columbia River watershed supported the culture
and livelihood of indigenous peoples and provided an immeasurable ecological benefit throughout the
region. Upon completion of multiple hydroelectric facilities including Grand Coulee Dam in 1941 and Chief
Joseph Dam in 1961, salmon runs were extirpated from the upper Columbia River and sovereign tribes
experienced a complete loss of their way of life.
In 2015, the Columbia Basin Tribes and First Nations developed the Joint Paper “Fish Passage and
Reintroduction into the U.S. and Canadian Upper Columbia Basin” (CBTFN 2015) to inform the federal
governments, and other sovereigns and stakeholders on how anadromous salmon can be reintroduced into
the upper Columbia River Basin. This paper outlined a phased approach to reintroduction which was further
refined and adopted by the Northwest Power and Conservation Council (NPCC) in the 2014 Columbia
River Basin Fish and Wildlife Program. The intent of this approach is to pursue reintroduction using the
knowledge gained and successful outcomes derived from sequential phases of research and evaluation as
listed below:
• Phase 1: Pre-assessment planning for reintroduction and fish passage.
• Phase 2: Experimental, pilot-scale salmon reintroductions and interim passage facilities.
• Phase 3: Construct permanent juvenile and adult passage facilities and supporting propagation
facilities. Implement priority habitat improvements.
• Phase 4: Monitoring, evaluation, and adaptive management. Continue needed habitat
improvements.
The Upper Columbia United Tribes (UCUT) – which include Coeur d’Alene Tribe of Indians, Confederated
Tribes of the Colville Reservation, Kalispel Tribe of Indians, Kootenai Tribe of Idaho, and Spokane Tribe
of Indians – with support from the United States Geological Survey (USGS) and Washington Department
of Fish and Wildlife (WDFW), have initiated an extensive investigation into the reintroduction of
anadromous fish to accessible habitats upstream of Chief Joseph and Grand Coulee dams. This report
presents the findings of research activities consistent with Phase 1: Pre-assessment planning for
reintroduction and fish passage.
Two goals for reintroduction that were initially identified in the Joint Paper (CBTFN 2015) are addressed
in this report:
P a g e | 2
1. Restore naturally spawning and hatchery-based runs of Sockeye and Chinook Salmon into the
upper Columbia River basin, above Chief Joseph, Grand Coulee and Canadian dams to meet native
peoples’ cultural and spiritual values and benefits for all, including subsistence and harvest
opportunities.
2. Establish and increase ceremonial and subsistence, sport and commercial fish harvest opportunities
for all communities and citizens along the Columbia River in the U.S. and Canada – for the benefit
of all.
These goals were considered for the U.S. portion of the basin only, with respect to:
• Riverine and reservoir habitat condition;
• Donor stock availability;
• Reintroduction risk to resident species;
• Key assumptions regarding fish survival, life cycle modeling and potential passage facilities;
• Effectiveness of state-of-the-art juvenile and adult passage technology; and
• Current dam operations.
Habitat Assessments
Evaluation of habitat availability and its suitability for salmon spawning, rearing and migration are
foundational in assessing the feasibility of reintroducing anadromous species to the waters upstream of
Chief Joseph and Grand Coulee dams. Multiple models were utilized to assess the current and potential
habitat conditions for anadromous fish throughout the blocked area using the best available data. Output
from these models was then used to inform the Life Cycle Model (LCM) developed specifically for the
reintroduction effort.
Intrinsic potential modeling was performed to provide an estimate of potential tributary habitat for spring
Chinook and steelhead. Results from this model revealed significant amounts of habitat within the U.S.
portion of the blocked area, totaling 711 miles for spring Chinook and 1,610 miles for summer steelhead
for spawning, rearing, and migration. In addition, 80% of the spring Chinook habitat and 53% of the
steelhead habitat was rated as having moderate to high intrinsic productivity potential.
Ecosystem Diagnosis and Treatment (EDT) modeling was used to summarize the potential performance of
spring and summer/fall Chinook, as well as steelhead, given current habitat conditions in select tributaries.
P a g e | 3
Extensive habitat data along with regional fisheries expertise and assumed survival rates during passage
through Chief Joseph and Grand Coulee dams were used to populate this model. Results of EDT analyses
suggest that currently accessible tributary habitats may produce 2,300 natural origin adult steelhead, 600
spring Chinook and 8,500 summer/fall Chinook.
Large river spawning habitat was estimated throughout the free-flowing stretches of the Columbia River
upstream of Chief Joseph and Grand Coulee dams using hydraulic data, riverbed morphology, substrate
composition, water temperature and known redd characteristics. Spawner capacities for summer/fall
Chinook were then developed for the mainstem habitats present in Rufus Woods Lake and the
Transboundary reach. These two areas – Rufus Woods Lake and the Transboundary reach – could support
800–15,000 and 5,000–61,000 adult spawners, respectively.
Sockeye spawning habitat availability was estimated in the Sanpoil River using extensive habitat
measurements originally intended to estimate kokanee spawning habitat. The model was adjusted to reflect
habitat preferences and spawning characteristics of Sockeye Salmon. Results indicate adult Sockeye
production for the Sanpoil River and associated tributaries could range from 34,000 to 216,000 depending
on assumptions regarding habitat utilization.
An assessment of limnological characteristics in Lake Roosevelt was used to determine potential rearing
capacity for juvenile Sockeye Salmon. Based on the results of the euphotic volume model, Sockeye smolt
capacity for Lake Roosevelt ranges from 12 million to 49 million.
Life Cycle Modeling of Summer/Fall Chinook and Sockeye Adult Production
Life cycle modeling was performed for populations of summer/fall Chinook and Sockeye that may colonize
habitats made accessible by providing fish passage at only Chief Joseph and Grand Coulee dams. These
habitats include Rufus Woods Lake, the Sanpoil River and tributaries, the Transboundary reach of the
mainstem Columbia from the head of Lake Roosevelt to Hugh L. Keenlyside Dam, and Christina Lake
(British Columbia) as well as tributaries to Lake Roosevelt. Canadian habitats were included in the analysis
as it is expected that adults will ultimately use those habitats once passage at Grand Coulee is provided.
Fish passage at Canadian dams was not included in this analysis. Life cycle modeling is essential for
projecting the survival and productivity at all life stages within the blocked area under a variety of scenarios
and to determine the limiting factors associated with the survival of reintroduced salmon. Reintroduced
populations in the Spokane subbasin have not yet been assessed with the life cycle model as the presence
of multiple hydroelectric dams on the Spokane River will require a unique modeling scenario that is under
development.
P a g e | 4
Results from life cycle modeling of a baseline scenario estimate an additional 41,000 (+24%) and 76,000
(+37%) summer/fall Chinook and Sockeye, respectively. Under the baseline scenario annual outplants of
3,000 adult summer/fall Chinook and 2,000 Sockeye occur, supplemented with local hatchery production
of 1.5 million and 6.5 million juvenile summer/fall chinook and Sockeye. It was assumed that river reach
mortality will be greater than that currently experienced downstream reaches of the mainstem Columbia;
that fish passage facilities for juveniles and adults are present at Chief Joseph and Grand Coulee dams with
survival rates similar to those at other high-head passage facilities; and that fish are harvested at their current
rates in existing fisheries, with new harvest fisheries included in the blocked area. Under this and other
scenarios the model consistently predicted thousands of adults escaping to the newly accessible spawning
grounds.
Donor Stock Sources and Risk Assessment
An assessment of potential donor stocks and the risks associated with reintroducing these stocks was
conducted to guide UCUT and other action agencies to stocks of fish which would be readily available and
have the highest potential for successful reintroduction. Each stock of salmon was additionally evaluated
on their endangered or threatened status, ancestry, local adaptation, life history and their potential for
ecological impacts to the upper Columbia River basin.
Potentially-available spring Chinook from upper Columbia River segregated hatchery programs pose a
genetic risk to extant upper Columbia populations. Additionally, constraints associated with natural and
hatchery origin ESA-listed stocks of spring Chinook are expected to be burdensome and would likely
constrain reintroduction efforts. Steelhead pose unique disease and genetic risks to native Redband Trout.
Because these risks and policies are still poorly understood, this Phase 1 report and the subsequent Phase 2
studies should be specific to summer/fall Chinook and Sockeye and exclude spring Chinook and steelhead
salmon, at least until there is better understanding of these issues.
Multiple donor sources are available for the reintroduction of summer/fall Chinook and Sockeye to areas
upstream of Chief Joseph Dam and Grand Coulee Dam. Most stocks from within the Columbia River
Evolutionarily Significant Unit (ESU) had similar scores and would be acceptable donors, if or when they
are available. Natural origin fish are preferable with respect to genetics and productivity, but generally are
not available in sufficient numbers in most years.
The Chief Joseph Hatchery summer/fall Chinook population is the highest ranked stock available for
reintroduction. This program uses a high proportion of natural-origin broodstock from the Okanogan River
which is the nearest neighbor to the blocked area. Chief Joseph hatchery has also been meeting the Hatchery
P a g e | 5
Scientific Review Group targets for percent hatchery-origin spawners (pHOS) and proportionate natural
influence (PNI), which should improve productivity of the natural-origin (NOR) spawners.
Lake Roosevelt native kokanee were the highest ranked donor stock for Sockeye due to their local
adaptation, low genetic risk, and low disease risk. However, Lake Roosevelt kokanee are not readily
available as a brood source making them impractical as a donor stock for feasibility testing. The second
highest ranked donor was the Okanogan River natural-origin Sockeye Salmon (followed by the Lake
Wenatchee Sockeye Salmon and the Penticton Hatchery (Okanogan River) Sockeye Salmon).
The ecological implications of reintroducing anadromous fish will be widespread. Competition between
resident species and reintroduced salmonids for space likely will occur in tributary habitats, whereas
competition for food is more likely to occur in reservoir habitats. Competition between Redband Trout and
reintroduced salmonids is more likely in tributary habitats, whereas competition between reintroduced
salmonids and kokanee would occur in reservoir habitats. Current data suggests that food is not limiting to
planktivores in Lake Roosevelt. Predation risk to introduced juvenile salmon probably will be high overall
but will vary greatly depending on spatial and temporal overlap with potential predators. Smallmouth Bass,
Walleye, and Northern Pike were identified as the primary predators of juvenile salmon in Lake Roosevelt
and its tributaries.
Adult and Juvenile Fish Passage
The environmental, operational and structural conditions at Chief Joseph Dam and Grand Coulee Dam are
conducive for a system that provides safe, timely and effective fish passage for summer/fall Chinook and
Sockeye Salmon. Recent analyses of existing floating surface collectors (FSC) indicate that fish collection
efficiency (FCE) is higher for systems located at projects with an effective forebay size of less than 50
acres. The effective forebay size at Chief Joseph and Grand Coulee dams are 51 acres, and 11 acres,
respectively. Thus, an FSC operated at either project has potential to exhibit high collection efficiency;
especially if attraction flow created by these systems is sufficient (>1,000 cfs).
Migration timing and survival of emigrants through reservoirs is directly correlated to water retention time
and the starting location of juvenile salmon using the reservoir. Water travel time through Rufus Woods
Lake and Lake Roosevelt ranges from about 2-6 days and 30-80 days, respectively. Although, during high
flow years water travel time can be as low as 14 days. Dam operations at Chief Joseph and Grand Coulee
dams are compatible with expected juvenile migration periods (spring/early summer). Draw down reduces
reservoir capacity which results in the fastest water travel times of the year.
P a g e | 6
Adult migrations through hydrosystems without integrated volitional passage currently rely on labor-
intensive trap and haul methods. However current and upcoming technologies are available and could lead
to low long-term costs and reduced handling exposure of adult salmonids. There is a need to investigate all
options for efficient and cost-effective passage of adults across Chief Joseph and Grand Coulee dams.
Multiple options are outlined in this report in order to guide likely studies that will need to be implemented
in the future which include but are not limited to retrofitted fish ladders, a negative pressure salmon
transport system, or a combination of the two. The studies will provide important data for selecting preferred
fish passage alternatives for further scoping, engineering and development.
Recommendations and Future Field Studies
Life cycle model results indicate that summer/fall Chinook and Sockeye adult production could be
substantial under the baseline scenario. Actual adult production depends on the accuracy of the assumptions
that went into modeling and the level of hatchery supplementation that occurs. The key assumptions used
in modeling form the working hypotheses that capture our understanding of how the system may work to
achieve identified goals. Studies in the future would be focused on testing those assumptions and associated
metrics that 1) affect management decisions, 2) are uncertain and 3) are feasible to observe and estimate.
The key assumptions to be tested are associated with juvenile and adult fish passage, early life stage and
migratory survival, and spawner success.
A degree of infrastructure will be necessary to support future studies and begin the salmon reintroduction
program. Recommended facilities include:
• Hatchery capacity for incubation and early rearing of summer/fall Chinook and Sockeye.
• Net pens for rearing fish needed for testing and production.
• Prototype juvenile and adult collection/transport/bypass systems at dams.
Conclusion
This Phase 1 report confirms that the reintroduction of salmon to the United States portion of the upper
Columbia River upstream of Chief Joseph Dam is likely to achieve identified tribal goals given current dam
operations, existing riverine and reservoir habitat conditions, donor stock availability, risks to resident fish
species, and the likely effectiveness of state-of-the-art juvenile and adult passage technology that could be
built at both Chief Joseph Dam and Grand Coulee Dam.
Results from the investigations have shown that reintroduction is viable for these species of salmon. The

P a g e | 7
UCUT and their partners will proceed to a second phase of research where field studies will be implemented
to address key assumptions and, with Federal Action Agency involvement, interim passage facilities will
be built, operated and tested to further evaluate the reintroduction effort. The UCUT will present the
findings of this report to the NPCC and looks forward to discussions regarding next steps and timeline for
NPCC and federal partners to join us in future studies.
P a g e | 8
1.0 INTRODUCTION
Since time immemorial, indigenous peoples in the Columbia basin lived a culture – a way of life – that was
sustained by a healthy ecosystem. Fish were a mainstay of their diet – sustaining them physically, and
spiritually. The Columbia basin tribes have suffered the loss of anadromous and other migrating fish due
to dam construction and reservoir inundation since the early 20th century. The magnitude of the loss
progressively increases with each successive upstream project. Large storage dams in the upper basin
completely blocked fish runs. Directly proportional to diminished and eliminated fish runs is cultural loss,
genocide, of the sovereign tribes – the very way of life that uniquely identifies and sustains each culture.
Salmon reintroduction is critical to restoring indigenous peoples’ cultural and spiritual values and harvest
of First Foods taken through river development for power and flood risk management. Fish passage
technology has improved significantly in the past several years, particularly for juvenile fish. These newer
technologies have recently been successfully implemented at several other dams in the Pacific Northwest.
Also, improvements to the scientific tools for monitoring fish survival now provide the means to plan and
design passage and reintroduction with greater certainty of success (see Future of Our Salmon Conference,
www.critfc.org/future). These passage technologies allow existing project operations to continue largely
unencumbered by these new fish passage, reintroduction, and monitoring facilities.
The Columbia Bain Tribes and First Nations developed the Joint Paper “Fish Passage and Reintroduction
into the U.S. and Canadian Upper Columbia Basin” (CBTFN 2015) to inform the federal governments, and
other sovereigns and stakeholders on how anadromous salmon can be reintroduced into the upper Columbia
River basin. The Joint Paper of the Tribes and First Nations proposed reintroduction of salmon through a
pragmatic and phased approach of planning, research, testing, and design/construction followed by
monitoring, evaluation, and adaptive management. Each phase of this effort would be pursued based on the
knowledge gained and successful outcomes from previous phases.
• Phase 1: Pre-assessment planning for reintroduction and fish passage.
• Phase 2: Experimental, pilot-scale salmon reintroductions and interim passage facilities.
• Phase 3: Construct permanent juvenile and adult passage facilities and supporting propagation
facilities. Implement priority habitat improvements.
• Phase 4: Monitoring, evaluation, and adaptive management. Continue needed habitat
improvements.

P a g e | 9
The CBTFN paper (2015) developed reintroduction goals and identified the analyses needed in Phase 1 to
determine if the goals were achievable. The analyses basically fell into the following topics:
• Existing dam operations.
• Riverine and reservoir habitat conditions and expected fish production upstream of Chief Joseph
and Grand Coulee dams.
• Theoretical effectiveness of fish passage facilities.
• Donor stock availability and reintroduction risk to native species.
Building on a late draft of the tribes’ Joint Paper, The Northwest Power and Conservation Council’s
Columbia River Basin Fish and Wildlife Program has identified measures that support fish passage
above/through man-caused barriers for decades. During the 2014/2024 Columbia River Treaty Review, the
NPCC (representing the States) specifically addressed losses of salmon in blocked areas of the Columbia
River basin that historically supported anadromous fish (NPCC 2014) with direct, in-kind/in-place
“anadromous fish mitigation in blocked areas.” Specifically, the program identified the need to investigate
the feasibility of reintroducing anadromous fish upstream of Chief Joseph and Grand Coulee dams on the
Columbia River. The rationale for undertaking this effort is that substantial anadromous fish production
was lost with the construction of these projects. An estimated 11% of steelhead, 15% of spring Chinook,
17% of summer Chinook, 14% of fall Chinook, and 65% of the basin’s Sockeye production originated
upstream of Chief Joseph Dam (CBTFN 2015). Estimated historical Columbia basin tribes and Canada
First Nations annual harvest of salmon that originated from the upper Columbia River is estimated at
86,500–803,000 steelhead, 1,076,000–1,564,000 chinook, and 1,987,000–3,448,000 Sockeye (CBTFN
2015).
Based on the recommendations from the Region’s fish and wildlife managers, including many tribes and
tribal organizations that developed the CBTFN fish passage paper (CBTFN 2015), the Council adopted a
three phased process for determining the feasibility of reintroducing anadromous fish upstream of Chief
Joseph and Grand Coulee dams. In Phase 1, an analysis on habitat conditions, donor stock identification
and effectiveness of upstream and downstream fish passage facilities at other projects was called for among
other tasks including selective releases. If the results of Phase 1 showed promise, Phase 2 activities would
consist of the design and testing of salmon reintroduction activities and interim fish passage facilities at
Chief Joseph Dam and Grand Coulee Dam. Given a successful outcome of Phase 2 work, the Council would
work with state, federal and tribal entities to determine whether and how to proceed to Phase 3 wherein fish

P a g e | 10
reintroduction, fish passage and monitoring and evaluation structures and activities would be fully
implemented and funded.
In general, the NPCC adopted the phased approach from the CBTFN (2015) and suggested that in Phase 1
of the NPCC Fish and Wildlife Program, the following tasks are to be undertaken:
1. Evaluate information from fish passage studies at other blockages and from previous assessments
of passage at Grand Coulee and Chief Joseph dams.
2. Investigate habitat availability, suitability and salmon survival potential in habitat upstream of
Grand Coulee dam. This might include selective releases of salmon and steelhead. Investigate the
scientific feasibility and possible cost of upstream and downstream passage options for salmon and
steelhead. Before funding new investigations, provide the Council with a report for consideration
of subsequent work to advance the fish passage planning process.
3. As part of Phase 1, the Council will engage discussion with tribal, state and federal agencies and
others regarding the purpose, scope and progress of reintroduction efforts above Chief Joseph and
Grand Coulee dams.
Based on the results in the first phase, the Council in collaboration with the relevant entities will decide
how to proceed to Phase 2.
Phase 2 activities may include one or more of the following:
• Design and test salmon and steelhead reintroduction strategies and interim fish passage facilities at
Chief Joseph and Grand Coulee dams.
• Investigate alternative approaches to passage.
• Identify additional studies necessary to advance the fish passage planning process.
• Salmon reintroduction pilot projects to address key assumptions
• Monitoring, evaluation and adaptive management of the Phase 2 activities.
Phase 3 is based on the results of Phase 2. The Council in collaboration with the other relevant entities will
decide whether and how to proceed to implement and fund reintroduction measures as a permanent part of
the program. This would include the construction and operation of passage facilities, monitor, evaluate, and

P a g e | 11
adaptively manage the reintroduction efforts.
In a subsequent report, Council staff began Phase 1 activities by reviewing regional fish passage facilities,
their effectiveness and associated costs (NPCC 2016). This report effectively completed Task 1 of Phase 1
with partial completion of the cost’s analysis called for in Task 2.
UCUT with their partners WDFW and USGS have largely performed analyses to meet the goals presented
in their 2015 framework and the remaining Phase 1 tasks of the Council’s approach. These analyses and
their findings have been briefly summarized and presented by UCUT in this report. Each of the studies
herein are described in more detail in individual technical reports that can be found at www.UCUT.org.
1.1 REFERENCES
Columbia Basin Tribes & First Nations (CBTFN). 2015. Fish Passage and Reintroduction into the U.S. and
Canadian Upper Columbia Basin.
Northwest Power and Conservation Council (NPCC). 2014. Columbia River Basin Fish and
Wildlife Program. Portland, OR. https://www.nwcouncil.org/fw/program/2014-12/program
Northwest Power and Conservation Council (NPCC). 2016. Staff Paper: Review of Fish Passage
Technologies at High Head Dams. Final: December 2016. Document Number 2016-14.

P a g e | 12
2.0 PURPOSE
The purpose of this analysis is to determine if the reintroduction of salmon to the United States portion of
the upper Columbia River upstream of Chief Joseph Dam is likely to achieve identified goals given current
dam operations, riverine and reservoir habitat condition, donor stock availability, reintroduction risk to
native species and effectiveness of state-of-the-art juvenile and adult passage technology.

P a g e | 13
3.0 GOALS
The Joint Paper (CBTFN 2015) identifies four initial goals for reintroducing anadromous salmon to habitat
located upstream of Chief Joseph and Grand Coulee dams. Although goals 2 and 4 are indirectly assisted
by efforts to provide fish passage and salmon reintroduction above these two dams, this Report does not
specifically address these two goals. The four goals are:
1. Restore naturally spawning and hatchery-based runs of Sockeye and Chinook Salmon into the
upper Columbia River basin, above Chief Joseph, Grand Coulee and Canadian dams to meet native
peoples’ cultural and spiritual values and benefits for all, including subsistence and harvest
opportunities.
2. Increase Columbia River basin fish abundance, habitat diversity, ecosystem health and long-term
sustainability of salmon and other fish species.
3. Establish and increase ceremonial and subsistence, sport and commercial fish harvest opportunities
for all communities and citizens along the Columbia River in the U.S. and Canada – for the benefit
of all.
4. Restoring access and population structure of resident bull trout, lamprey, sturgeon and other native
fish species to historical habitat.
This report examines spring and summer/fall Chinook, Sockeye, and steelhead; however, the possible
achievement of goals is specific to summer/fall Chinook and Sockeye Salmon while considering passage
at only Chief Joseph and Grand Coulee dams. Passage at Spokane River and Canadian dams, and resulting
population dynamics, has not yet been assessed with life cycle modeling but will be analyzed as part of
future work in appropriate forums1.
1 The Spokane River has not yet been assessed with the LCM; however, an analysis of habitat quantity and quality
present in this subbasin are presented in Section 5

P a g e | 14
The goals will be achieved by providing salmon access to the hundreds of miles of stream habitat in areas
of the upper Columbia River basin currently blocked by Chief Joseph and Grand Coulee dams. Ideally, this
will be accomplished by providing adult and juvenile fish passage at all anthropogenic barriers that
currently prevent Chinook, Sockeye, Coho and steelhead access to historical habitat. The UCUT recognizes
that the development of such a system will require stepwise feasibility studies and take substantial time to
implement due to funding limitations. However, extensive advancements have been made in fish passage
technology for both juvenile and adult salmon in recent years. Interim actions to meet cultural needs (e.g.,
trap and haul) can be implemented to partially achieve the goals in the short-term. This can occur
concurrent with testing feasibility in future studies and building support and funding opportunities for
permanent passage facilities (if warranted based on the feasibility testing).
An important component of this effort is to further develop the sources of fish needed for the reintroduction.
It is envisioned that a combination of hatchery production and translocation of surplus adults returning to
rivers and hatchery facilities located downstream of Chief Joseph Dam will be the methods of choice but
may vary by species. Natural and hatchery production of fish from the blocked area will then generate more
fish returning to CJD which will increase the abundance of fish available to further seed the reintroduction
effort. Whenever and wherever possible, methods that utilize existing riverine and reservoir habitats to rear
and produce fish will be preferred. This approach is expected to reduce costs associated with the
reintroduction effort.
Both Grand Coulee Dam and Chief Joseph Dam operations provide significant flood control, irrigation and
power benefits to the region. Therefore, an important consideration of the effort is to minimize any negative
impacts the reintroduction effort may have on these benefits, while still achieving identified goals to the
extent possible.
The creation of abundant salmon runs in the upper Columbia River will support tribal ceremonies, rights,
and traditions, increase First Foods abundance and bolster tribal and local economies. It will increase
harvest opportunities for downstream tribes, sport and commercial fishermen in river and ocean fisheries.
It will provide food to the struggling Southern Resident Killer Whale population that desperately needs
more Chinook Salmon to improve their survival. It will begin to address the issue of inadequate mitigation
for the people most affected by the Federal Columbia River Power System. Finally, it will begin the healing
process from a historic wrong that the United States Government has bestowed upon the native people of
the region when they decided not to provide fish passage at Chief Joseph and Grand Coulee dams.
P a g e | 15
4.0 DONOR STOCK AND RISK ASSESSMENT
The UCUT and WDFW collaborated with the U.S. Geological Survey (USGS) to assess risks to resident
taxa and reintroduced salmon associated with their reintroduction to historical stream and reservoir habitat
upstream of Chief Joseph Dam and Grand Coulee Dam (Hardiman et al. 2017). A brief description of the
methods used and results of the USGS study are presented below. Much of the text for this section came
directly from the USGS report.
4.1 GENERAL METHODS
Donor sources of anadromous Redband Trout (steelhead: Oncorhynchus mykiss gairdneri), Chinook
Salmon (O. tshawytscha,), Sockeye Salmon (O. nerka), and Coho salmon (O. kisutch) were identified and
ranked in two workshops by regional scientists.
In workshop 1, attendees identified resident fish species of interest and their primary habitat uses by life
stage, population status, pathogen concern, primary location and additional information needs. A species
was deemed of interest based on resource management (conservation or harvest) and competition and
predation (ecological) interactions with the reintroduced species. Attendees ranked the following risks to
resident species that might result from reintroduction:
• Pathogen risks to resident species,
• Genetic risks to resident and downstream anadromous conspecifics,
• Competition with resident species, and
• Predation on reintroduced salmonids by resident species.
In workshop 2, a list of possible donor stocks was developed by species and each donor source was ranked
based on:
• Abundance/Viability – demographic risk to source and feasibility of collection,
• Ancestral/Genetic similarity – evolutionary similarity to historical populations,
• Local adaptation – geographic proximity/similarity of source habitat conditions to reintroduction
habitat conditions, and
P a g e | 16
• Life history compatibility – including migration; spawn timing; and relative usage of reservoir,
main-stem, or tributary habitats with environmental conditions in the reintroduction area
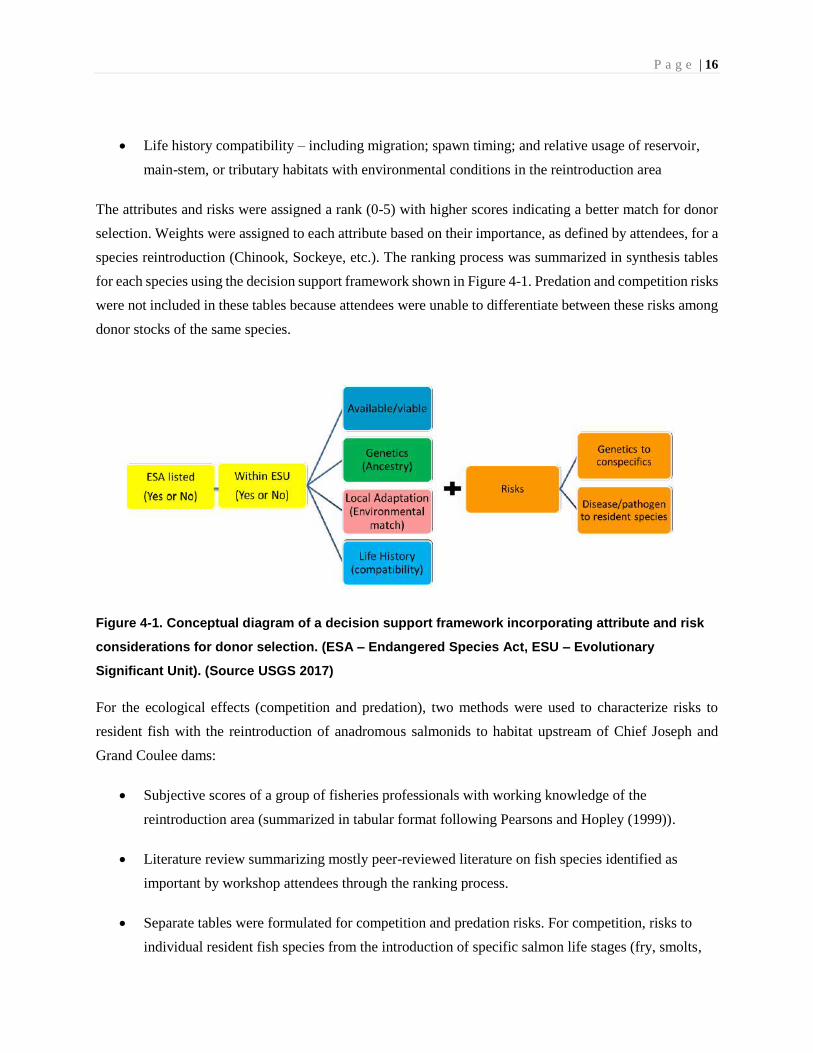
The attributes and risks were assigned a rank (0-5) with higher scores indicating a better match for donor
selection. Weights were assigned to each attribute based on their importance, as defined by attendees, for a
species reintroduction (Chinook, Sockeye, etc.). The ranking process was summarized in synthesis tables
for each species using the decision support framework shown in Figure 4-1. Predation and competition risks
were not included in these tables because attendees were unable to differentiate between these risks among
donor stocks of the same species.
Figure 4-1. Conceptual diagram of a decision support framework incorporating attribute and risk
considerations for donor selection. (ESA – Endangered Species Act, ESU – Evolutionary
Significant Unit). (Source USGS 2017)
For the ecological effects (competition and predation), two methods were used to characterize risks to
resident fish with the reintroduction of anadromous salmonids to habitat upstream of Chief Joseph and
Grand Coulee dams:
• Subjective scores of a group of fisheries professionals with working knowledge of the
reintroduction area (summarized in tabular format following Pearsons and Hopley (1999)).
• Literature review summarizing mostly peer-reviewed literature on fish species identified as
important by workshop attendees through the ranking process.
• Separate tables were formulated for competition and predation risks. For competition, risks to
individual resident fish species from the introduction of specific salmon life stages (fry, smolts,
P a g e | 17
etc.) were identified by fisheries professionals. For predation, scores represent a risk to salmon
from a particular predator species.
4.2 RESULTS
4.2.1 Donor Sources
Donor sources were identified and ranked for steelhead, Chinook (spring and summer/fall), coho, and
Sockeye. Results are presented herein only for summer/fall Chinook and Sockeye as these are the two
species with the least risk that appear available for testing feasibility in future studies. ESA listing, genetics
and disease concerns with steelhead from downstream sources suggest with the least risk that they should
not be utilized for testing. Spring Chinook may have important near-term objectives related to cultural and
educational objectives for some UCUT tribes, so non-ESA stocks (Leavenworth National Fish Hatchery
and Chief Joseph Hatchery) may be pursued under a parallel path of cultural releases.
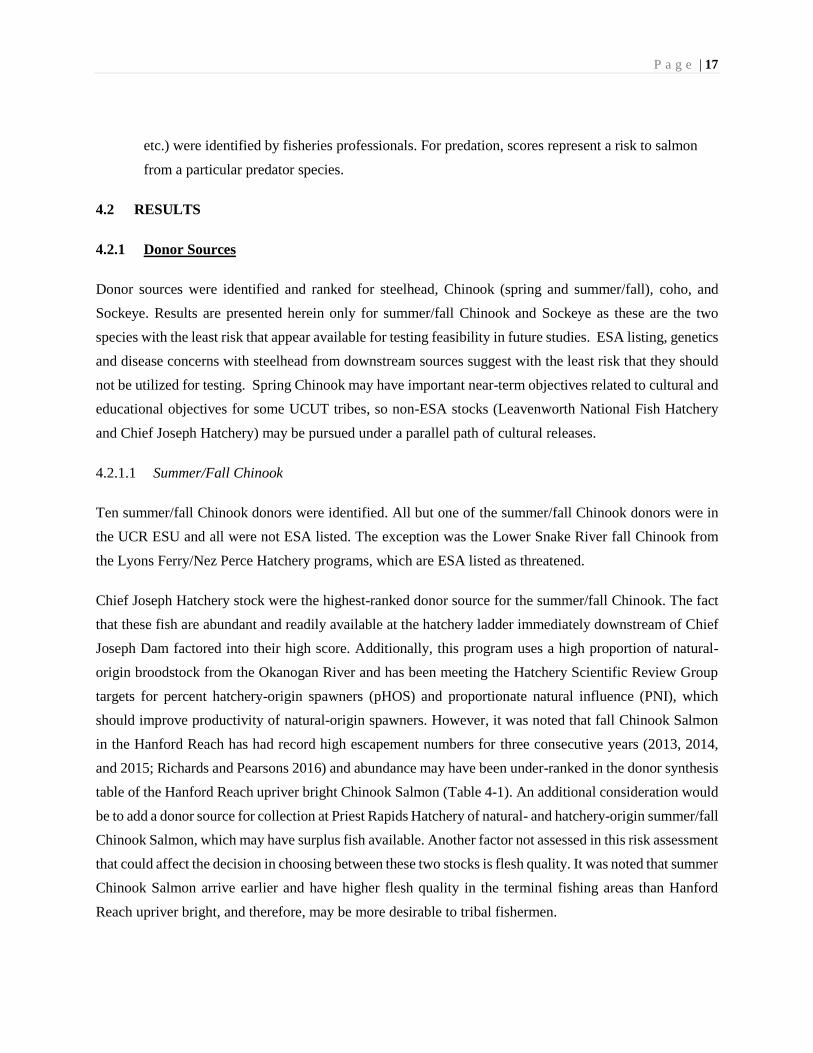
4.2.1.1 Summer/Fall Chinook
Ten summer/fall Chinook donors were identified. All but one of the summer/fall Chinook donors were in
the UCR ESU and all were not ESA listed. The exception was the Lower Snake River fall Chinook from
the Lyons Ferry/Nez Perce Hatchery programs, which are ESA listed as threatened.
Chief Joseph Hatchery stock were the highest-ranked donor source for the summer/fall Chinook. The fact
that these fish are abundant and readily available at the hatchery ladder immediately downstream of Chief
Joseph Dam factored into their high score. Additionally, this program uses a high proportion of natural-
origin broodstock from the Okanogan River and has been meeting the Hatchery Scientific Review Group
targets for percent hatchery-origin spawners (pHOS) and proportionate natural influence (PNI), which
should improve productivity of natural-origin spawners. However, it was noted that fall Chinook Salmon
in the Hanford Reach has had record high escapement numbers for three consecutive years (2013, 2014,
and 2015; Richards and Pearsons 2016) and abundance may have been under-ranked in the donor synthesis
table of the Hanford Reach upriver bright Chinook Salmon (Table 4-1). An additional consideration would
be to add a donor source for collection at Priest Rapids Hatchery of natural- and hatchery-origin summer/fall
Chinook Salmon, which may have surplus fish available. Another factor not assessed in this risk assessment
that could affect the decision in choosing between these two stocks is flesh quality. It was noted that summer
Chinook Salmon arrive earlier and have higher flesh quality in the terminal fishing areas than Hanford
Reach upriver bright, and therefore, may be more desirable to tribal fishermen.

P a g e | 18
The remaining stocks scored fairly close to each other on a continuum that was driven by a combination of
factors including availability, geographic proximity, and disease history (Table 4-1). The only stock that
was separated from the group by a considerable margin was Lyons Ferry, which is from outside the ESU.
In general, hatchery stocks scored higher than natural stocks with respect to availability because, in most
years, there is not an over-escapement of natural-origin fish so mining spawners from those populations
would pose some demographic risk to the extant population. Conversely, natural-origin stocks scored
higher than hatchery stocks with respect to genetics and local adaptation. Finally, stocks that were closer
(geographically) to the blocked area tended to score higher for local adaptation and life history
compatibility.
4.2.1.2 Sockeye
Four Sockeye and three kokanee donors were reviewed (Table 4-2). Three Sockeye populations were in the
UCR ESU and not ESA listed. Redfish Lake Sockeye Salmon (Springfield Hatchery on the Salmon River,
Idaho), located outside the UCR ESU and listed as endangered under the ESA, were not further considered
for reintroduction to the UCR. Three native kokanee populations in the UCR were reviewed as donors
because of the potential presence of an anadromous life history trait. Chain Lake kokanee were considered
genetically unique, divergent from other populations (Kassler and others, 2010) and with low
abundance/viability. Therefore, they were excluded from further consideration as a viable donor.
P a g e | 19
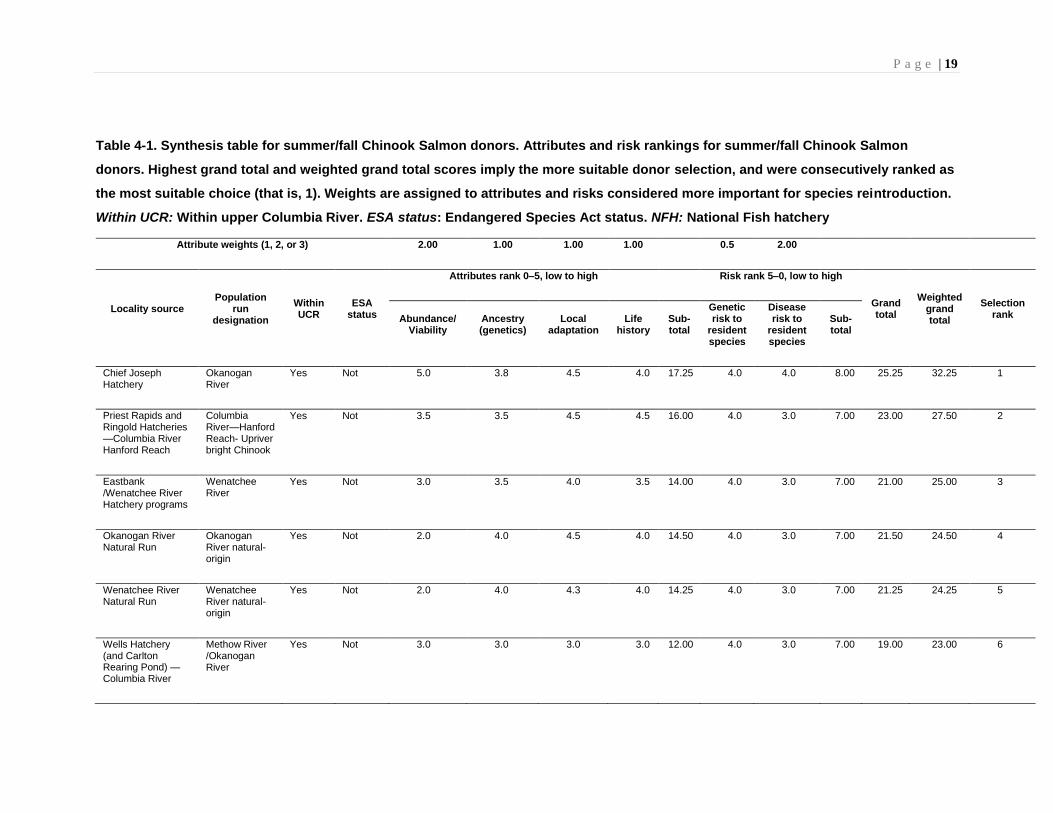
Table 4-1. Synthesis table for summer/fall Chinook Salmon donors. Attributes and risk rankings for summer/fall Chinook Salmon
donors. Highest grand total and weighted grand total scores imply the more suitable donor selection, and were consecutively ranked as
the most suitable choice (that is, 1). Weights are assigned to attributes and risks considered more important for species reintroduction.
Within UCR: Within upper Columbia River. ESA status: Endangered Species Act status. NFH: National Fish hatchery
Attribute weights (1, 2, or 3) 2.00 1.00 1.00 1.00
0.5 2.00
Locality source Population
run designation
Within UCR
ESA status
Attributes rank 0–5, low to high Risk rank 5–0, low to high
Grand total
Weighted grand total
Selection rank Abundance/
Viability Ancestry (genetics)
Local adaptation
Life history
Sub-total
Genetic risk to
resident species
Disease risk to
resident species
Sub-total
Chief Joseph Hatchery
Okanogan River
Yes Not 5.0 3.8 4.5 4.0 17.25 4.0 4.0 8.00 25.25 32.25 1
Priest Rapids and Ringold Hatcheries —Columbia River Hanford Reach
Columbia River—Hanford Reach- Upriver bright Chinook
Yes Not 3.5 3.5 4.5 4.5 16.00 4.0 3.0 7.00 23.00 27.50 2
Eastbank /Wenatchee River Hatchery programs
Wenatchee River
Yes Not 3.0 3.5 4.0 3.5 14.00 4.0 3.0 7.00 21.00 25.00 3
Okanogan River Natural Run
Okanogan River natural-origin
Yes Not 2.0 4.0 4.5 4.0 14.50 4.0 3.0 7.00 21.50 24.50 4
Wenatchee River Natural Run
Wenatchee River natural-origin
Yes Not 2.0 4.0 4.3 4.0 14.25 4.0 3.0 7.00 21.25 24.25 5
Wells Hatchery (and Carlton Rearing Pond) —Columbia River
Methow River /Okanogan River
Yes Not 3.0 3.0 3.0 3.0 12.00 4.0 3.0 7.00 19.00 23.00 6

P a g e | 20
Attribute weights (1, 2, or 3) 2.00 1.00 1.00 1.00
0.5 2.00
Locality source Population
run designation
Within UCR
ESA status
Attributes rank 0–5, low to high Risk rank 5–0, low to high
Grand total
Weighted grand total
Selection rank Abundance/
Viability Ancestry (genetics)
Local adaptation
Life history
Sub-total
Genetic risk to
resident species
Disease risk to
resident species
Sub-total
Chelan Falls Hatchery—Columbia River
Columbia River Yes Not 3.0 3.0 3.0 3.0 12.00 4.0 3.0 7.00 19.00 23.00 6
Methow River natural run
Methow River natural-origin
Yes Not 1.0 4.0 4.5 4.0 13.50 4.0 3.0 7.00 20.50 22.50 8
Entiat NFH Entiat River Yes Not 2.0 3.0 3.0 3.0 11.00 4.0 1.0 5.00 16.00 17.00 9
Snake River fall—Lyons Ferry and Nez Perce Hatchery programs
Lower Snake River fall Chinook
No Threat-ened
1.0 1.0 0.5 2.5 5.00 2.0 1.0 3.00 8.00 9.00 10
P a g e | 21
Lake Roosevelt native kokanee were the highest ranked donor stock because of their local adaptation, low
genetic risk, and low disease risk (but only by a very narrow margin over Okanogan Sockeye). However,
Lake Roosevelt kokanee are not readily available as a brood source making them impractical as a donor
source for conducting feasibility tests. The second-highest ranked donor was the Okanogan River natural-
origin Sockeye Salmon, followed by the Lake Wenatchee Sockeye and the Penticton Hatchery (Okanogan
River) Sockeye (Table 4-2). Okanogan Sockeye are very abundance in some years and a mixed stock of
Okanogan and Wenatchee Sockeye are already being mined to supply adults for reintroduction into Lake
Cle Elum, Washington. The Penticton hatchery uses brood from the Okanogan River and does not
externally mark their releases so it would not be possible to intentionally collect only hatchery fish to
support the reintroduction.
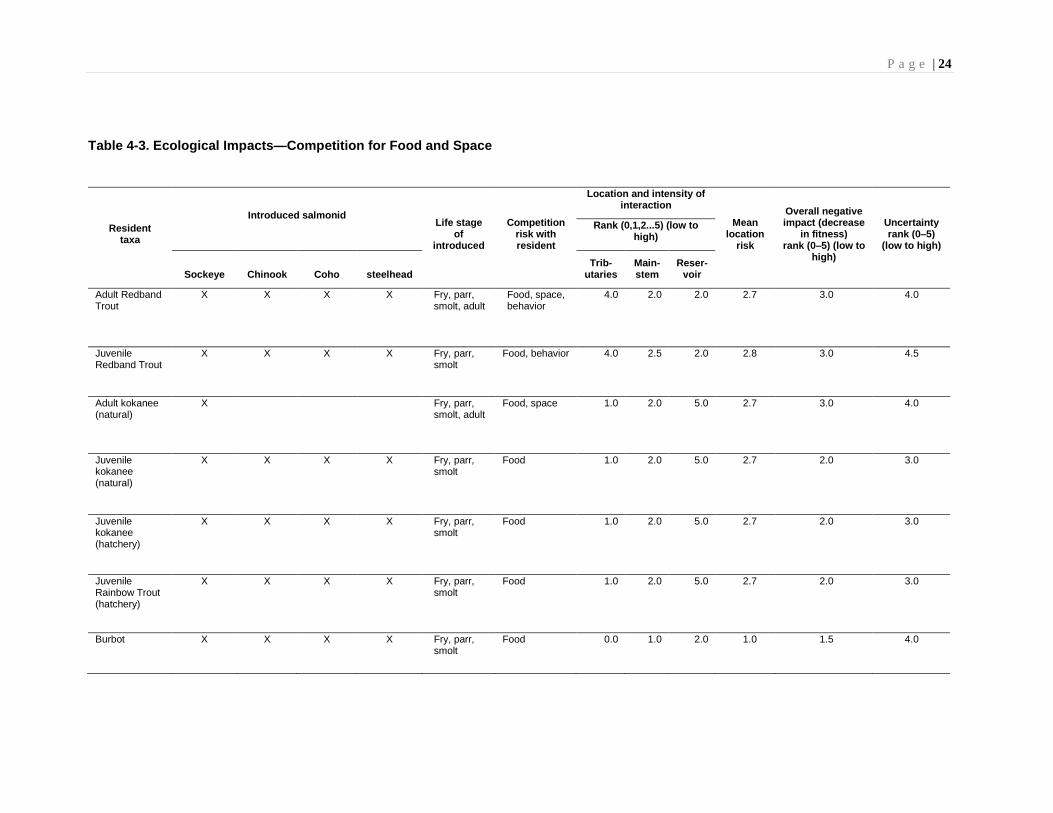
4.2.2 Ecological Impacts
Summary tables for competition and predation risks resident species pose to introduced salmon are provided
in Table 4-3 and Table 4-4. Redband Trout, kokanee and triploid rainbow trout were identified as the
primary competitors of reintroduced salmonids.
Competition for space likely will occur in tributary habitats, whereas competition for food is more likely to
occur in reservoir habitats. Sockeye Salmon are the only species that are likely to spend an entire year
feeding in Lake Roosevelt, potentially competing with kokanee and Redband Trout for zooplankton. Other
smolts and transient parr may feed for days to months while migrating through the reservoirs. Estimating
the prey demand for a hypothesized population of Sockeye Salmon relative to other fish that consume
zooplankton, although not estimated as part of this risk assessment, would characterize the rearing capacity
for both resident and introduced salmonids. However, current data suggests that food is not limiting to
planktivores in Lake Roosevelt.
P a g e | 22
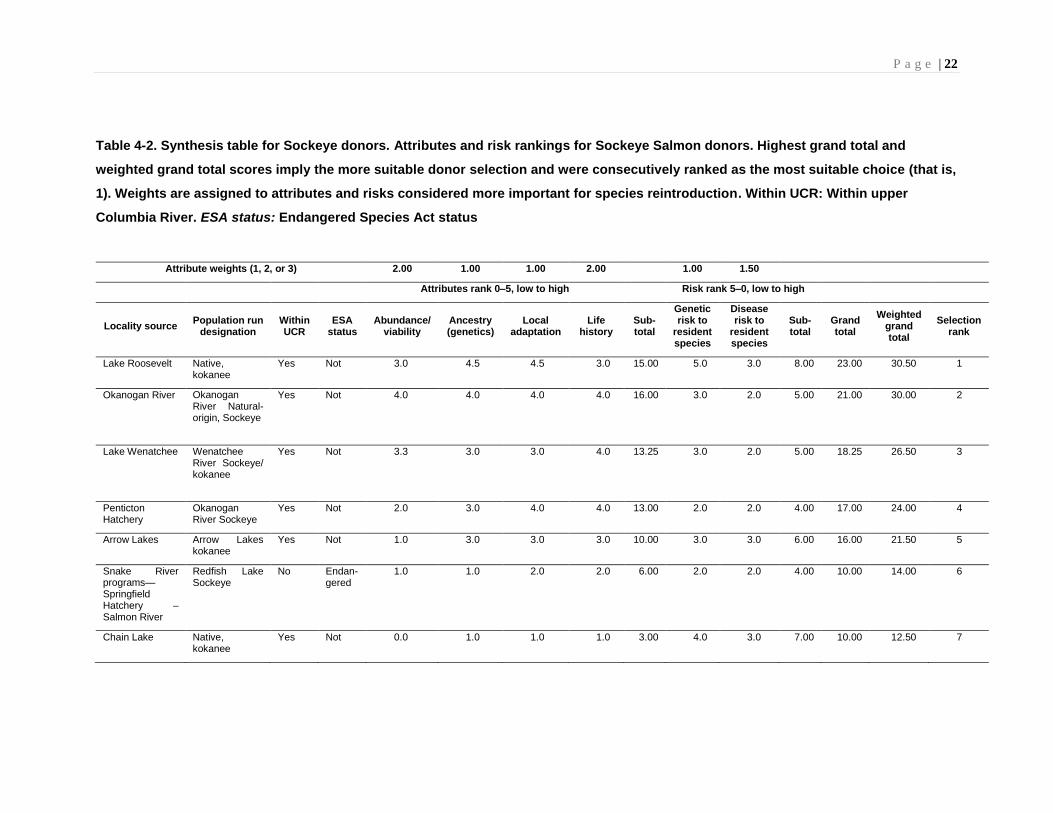
Table 4-2. Synthesis table for Sockeye donors. Attributes and risk rankings for Sockeye Salmon donors. Highest grand total and
weighted grand total scores imply the more suitable donor selection and were consecutively ranked as the most suitable choice (that is,
1). Weights are assigned to attributes and risks considered more important for species reintroduction. Within UCR: Within upper
Columbia River. ESA status: Endangered Species Act status
Attribute weights (1, 2, or 3) 2.00 1.00 1.00 2.00 1.00 1.50
Attributes rank 0–5, low to high Risk rank 5–0, low to high
Locality source Population run
designation Within UCR
ESA status
Abundance/ viability
Ancestry (genetics)
Local adaptation
Life history
Sub-total
Genetic risk to
resident species
Disease risk to
resident species
Sub-total
Grand total
Weighted grand total
Selection rank
Lake Roosevelt Native, kokanee
Yes Not 3.0 4.5 4.5 3.0 15.00 5.0 3.0 8.00 23.00 30.50 1
Okanogan River Okanogan River Natural-origin, Sockeye
Yes Not 4.0 4.0 4.0 4.0 16.00 3.0 2.0 5.00 21.00 30.00 2
Lake Wenatchee Wenatchee River Sockeye/ kokanee
Yes Not 3.3 3.0 3.0 4.0 13.25 3.0 2.0 5.00 18.25 26.50 3
Penticton Hatchery
Okanogan River Sockeye
Yes Not 2.0 3.0 4.0 4.0 13.00 2.0 2.0 4.00 17.00 24.00 4
Arrow Lakes Arrow Lakes kokanee
Yes Not 1.0 3.0 3.0 3.0 10.00 3.0 3.0 6.00 16.00 21.50 5
Snake River programs—Springfield Hatchery – Salmon River
Redfish Lake Sockeye
No Endan-gered
1.0 1.0 2.0 2.0 6.00 2.0 2.0 4.00 10.00 14.00 6
Chain Lake Native, kokanee
Yes Not 0.0 1.0 1.0 1.0 3.00 4.0 3.0 7.00 10.00 12.50 7
P a g e | 23
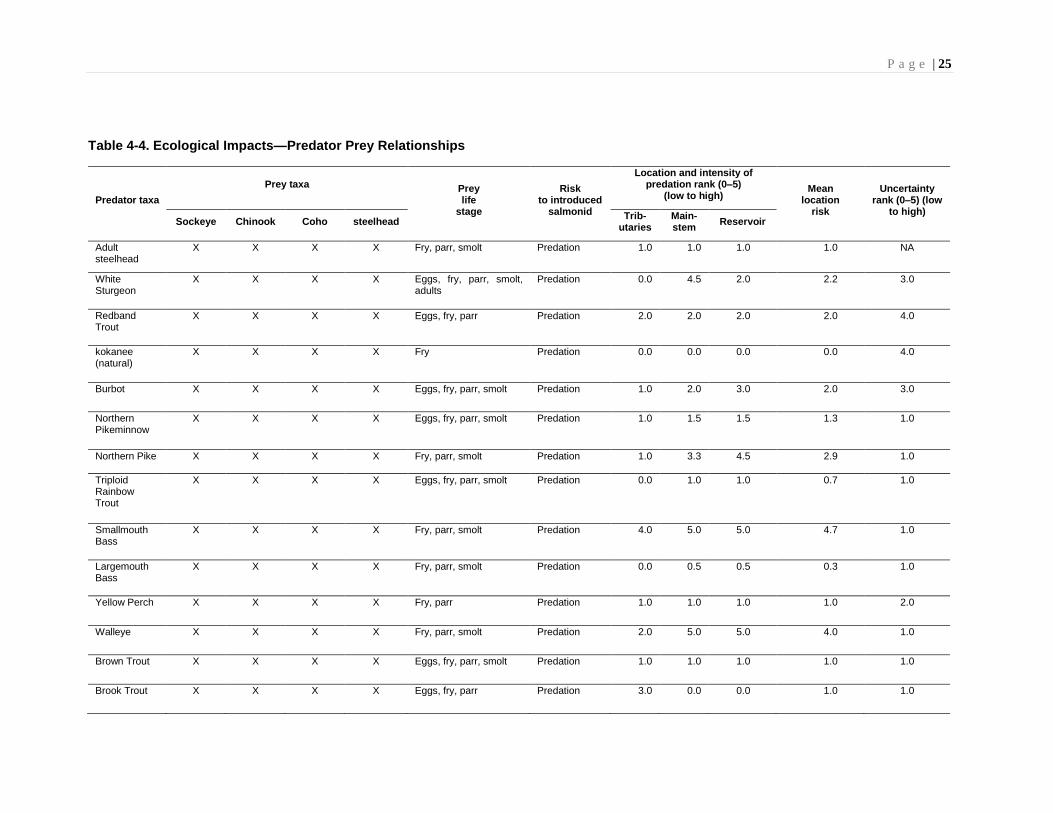
Predation risk to introduced juvenile salmon probably will be high overall, but will vary greatly depending
on spatial and temporal overlap with potential predators. Smallmouth Bass, Walleye, and Northern Pike
were identified as the primary predators of juvenile salmon in Lake Roosevelt and its tributaries.
Unfortunately, few formal studies document the predator population’s abundance, age structure, diet and
consumption rate. Even if data existed on current diet and consumption rates, there would be considerable
uncertainty in potential overlap in time and space with re-introduced salmon. In the lower Columbia River,
Rieman and others (1991) did an analysis of juvenile salmonid predation loss in John Day Reservoir and
estimated 2.7 million salmonids were consumed annually. Of the mean total, 78% were consumed by
Northern Pikeminnow, 12% by Walleyes, and 9% by Smallmouth Bass. Overall, 14% of all juvenile
salmonids were consumed and predation was highest for Chinook Salmon juveniles during July and
August—presumably, sub-yearlings.
4.2.3 Summary
Disease, genetic, and policy constraints associated with ESA have led managers to focus on summer/fall
Chinook and Sockeye Salmon for reintroduction activities.
There are multiple donor sources available for reintroducing summer/fall Chinook and Sockeye to areas
upstream of Chief Joseph and Grand Coulee. Most stocks from within the ESU had similar scores and
would be acceptable donors, if/when they are available. Natural origin fish are preferable with respect to
genetics and productivity, but generally are not available in enough numbers in most years.
The Chief Joseph hatchery population of summer/fall Chinook was the highest ranked stock because the
program uses a high proportion of natural-origin broodstock from the Okanogan River and high
abundances. Hanford Reach and Wenatchee River hatchery programs were the next highest ranked donor
stocks for summer/fall Chinook followed by natural-origin Okanogan River fish, which were ranked lower
due to limited availability.
Lake Roosevelt native kokanee were the highest ranked donor stock because of their local adaptation, low
genetic risk, and low disease risk (but only by a very narrow margin over Okanogan Sockeye). However,
Lake Roosevelt kokanee are not readily available as a brood source making them impractical as a donor
source for testing feasibility. The second-highest ranked donor was the Okanogan River natural-origin
Sockeye Salmon, followed by the Lake Wenatchee Sockeye Salmon and the Penticton Hatchery (Okanogan
River) Sockeye Salmon (Table 4-2).
P a g e | 24
Table 4-3. Ecological Impacts—Competition for Food and Space
Resident taxa
Introduced salmonid Life stage
of introduced
Competition risk with resident
Location and intensity of interaction
Mean location
risk
Overall negative impact (decrease
in fitness) rank (0–5) (low to
high)
Uncertainty rank (0–5)
(low to high)
Rank (0,1,2...5) (low to high)
Sockeye Chinook Coho steelhead Trib-
utaries Main-stem
Reser-voir
Adult Redband Trout
X X X X Fry, parr, smolt, adult
Food, space, behavior
4.0 2.0 2.0 2.7 3.0 4.0
Juvenile Redband Trout
X X X X Fry, parr, smolt
Food, behavior 4.0 2.5 2.0 2.8 3.0 4.5
Adult kokanee (natural)
X
Fry, parr, smolt, adult
Food, space 1.0 2.0 5.0 2.7 3.0 4.0
Juvenile kokanee (natural)
X X X X Fry, parr, smolt
Food 1.0 2.0 5.0 2.7 2.0 3.0
Juvenile kokanee (hatchery)
X X X X Fry, parr, smolt
Food 1.0 2.0 5.0 2.7 2.0 3.0
Juvenile Rainbow Trout (hatchery)
X X X X Fry, parr, smolt
Food 1.0 2.0 5.0 2.7 2.0 3.0
Burbot X X X X Fry, parr, smolt
Food 0.0 1.0 2.0 1.0 1.5 4.0
P a g e | 25
Table 4-4. Ecological Impacts—Predator Prey Relationships
Predator taxa
Prey taxa Prey life
stage
Risk to introduced
salmonid
Location and intensity of predation rank (0–5)
(low to high) Mean
location risk
Uncertainty rank (0–5) (low
to high) Sockeye Chinook Coho steelhead
Trib-utaries
Main-stem
Reservoir
Adult steelhead
X X X X Fry, parr, smolt Predation 1.0 1.0 1.0 1.0 NA
White Sturgeon
X X X X Eggs, fry, parr, smolt, adults
Predation 0.0 4.5 2.0 2.2 3.0
Redband Trout
X X X X Eggs, fry, parr Predation 2.0 2.0 2.0 2.0 4.0
kokanee (natural)
X X X X Fry Predation 0.0 0.0 0.0 0.0 4.0
Burbot X X X X Eggs, fry, parr, smolt Predation 1.0 2.0 3.0 2.0 3.0
Northern Pikeminnow
X X X X Eggs, fry, parr, smolt Predation 1.0 1.5 1.5 1.3 1.0
Northern Pike X X X X Fry, parr, smolt Predation 1.0 3.3 4.5 2.9 1.0
Triploid Rainbow Trout
X X X X Eggs, fry, parr, smolt Predation 0.0 1.0 1.0 0.7 1.0
Smallmouth Bass
X X X X Fry, parr, smolt Predation 4.0 5.0 5.0 4.7 1.0
Largemouth Bass
X X X X Fry, parr, smolt Predation 0.0 0.5 0.5 0.3 1.0
Yellow Perch X X X X Fry, parr Predation 1.0 1.0 1.0 1.0 2.0
Walleye X X X X Fry, parr, smolt Predation 2.0 5.0 5.0 4.0 1.0
Brown Trout X X X X Eggs, fry, parr, smolt Predation 1.0 1.0 1.0 1.0 1.0
Brook Trout X X X X Eggs, fry, parr Predation 3.0 0.0 0.0 1.0 1.0

P a g e | 26
P a g e | 27
One factor not considered during the risk assessment was using a collection location that would yield a
mixed stock. Given salmon propensity to wander and stray (particularly Chinook from the multiple
hatchery programs downstream), it would be nearly impossible to select only one stock or entirely eliminate
the possibility of excluding a particular stock. Fortunately, there did not appear to be any ‘red flags’ with
the summer/fall Chinook stocks that were evaluated (except perhaps the out-of-ESU stock from Lyons
Ferry) and therefore feasibility, logistics, availability and preferences of co-managers are likely to be the
determining factors on which (or collection locations) to use.
Genetic and disease concerns for resident Redband Trout suggest managers should not utilize steelhead
from downstream sources at this time. Additionally, the downstream steelhead stocks are all ESA-listed,
and the UCUT remain committed to implementing reintroduction testing with fish that are not ESA-listed.
Competition between resident species and reintroduced salmonids for space likely will occur in tributary
habitats, whereas competition for food is more likely to occur in reservoir habitats. Competition between
Redband Trout and reintroduced salmonids is more likely in tributary habitats, whereas competition
between reintroduced salmonids and kokanee would occur in reservoir habitats.
Predation risk to introduced juvenile salmon probably will be high overall but will vary greatly depending
on spatial and temporal overlap with potential predators. Smallmouth Bass, Walleye, and Northern Pike
were identified as the primary predators of juvenile salmon in Lake Roosevelt and its tributaries.
4.3 REFERENCES
Hardiman, J.M., Breyta, R.B., Haskell, C.A., Ostberg, C.O., Hatten, J.R., and Connolly, P.J., 2017, Risk
assessment for the reintroduction of anadromous salmonids upstream of Chief Joseph and Grand Coulee
Dams, northeastern Washington: U.S. Geological Survey Open-File Report 2017–1113, 87 p.,
https://doi.org/10.3133/ofr20171113.
Kassler, T., Bowman, C., and Nine, B., 2010. Genetic characterization of kokanee within Lake Roosevelt,
Arrow Lakes, B.C., and surrounding basins: Report prepared by Washington Department of Fish and
Wildlife and Confederated Colville Tribes, 29 p
Pearsons, N., and Hopley, C.W., 1999. A practical approach for assessing ecological risks associated with
fish stocking programs: Fisheries Management, v. 24, p. 16–23.
Richards, S.P., and Pearsons, T.N., 2016. Priest Rapids Hatchery monitoring and evaluation—Annual
report for 2015–16: Public Utility District Number 2 of Grant County, Ephrata, Washington.

P a g e | 28
Rieman, B.E., Beamesderfer, R.C., Vigg, S., and Poe, T.P., 1991. Estimated loss of juvenile salmonids to
predation by Northern Squawfish, Walleyes, and Smallmouth Bass in John Day Reservoir, Columbia River:
Transactions of the American Fisheries Society, v. 120, p. 448–458.

P a g e | 29
5.0 HABITAT ASSESSMENTS
5.1 INTRODUCTION
Habitat availability and suitability are foundational in evaluating the feasibility of reintroducing
anadromous species to the waters upstream of Chief Joseph and Grand Coulee dams. A multitude of studies
were performed to assess specific areas for one or more species as a means to determine the quantity and
suitability of tributary, mainstem, and reservoir habitats for anadromous salmonids. Models had to be
employed because the species do not exist in their anadromous life history forms in the blocked area.
Assumptions were made and uncertainties were identified within each method. These assumptions can be
verified, and the uncertainties will be filled with empirical data with the implementation of experimental
reintroduction. Results from these habitat assessments have been included as inputs to life cycle modeling,
which further evaluates density dependence and mortality across multiple life stages (presented in Section
6).
There are five subsections in this section of the report which cover the various methods and analyses
(assessments) used to evaluate the habitats. Comprehensive reports for each of the assessments can be
found at www.UCUT.org.
The habitat assessments include:
1. Intrinsic potential model of tributary habitats to identify and quantify streams and reaches that
may support spawning and rearing activity for Chinook and steelhead (Giorgi 2018).
2. An Ecosystem Diagnosis and Treatment (EDT) model to summarize the potential performance of
spring Chinook, summer/fall Chinook and steelhead in select tributaries, given current habitat
conditions (ICF 2017 and 2018).
3. An assessment of the quantity of potential spawning habitat for summer/fall Chinook in free-
flowing large mainstem sections of the Columbia River, in Lake Rufus Woods and the
Transboundary reach (Hanrahan et al. 2004, Baldwin and Bellgraph 2017, Garavelli et al. in prep,
Golder Associates 2016 and 2017).
4. Estimations of potential Sockeye spawner abundance in the Sanpoil River (Baldwin 2018).
5. An assessment of the rearing capacity of Lake Roosevelt for juvenile Sockeye based on recent
trends of reservoir productivity (Giorgi and Kain 2018).

P a g e | 30
The final section presented in this section deals with possible climate change effects to habitat upstream
of Chief Joseph and Grand Coulee dams and its importance for long term salmon production in the
Columbia River basin.
5.2 INTRINSIC POTENTIAL FOR CHINOOK AND STEELHEAD
An intrinsic potential stream habitat model was used to identify tributaries and quantify spawning and early
rearing habitats for stream-type spring Chinook and steelhead within the United States portion of the
blocked area of the upper Columbia River (Figure 5-1 through Figure 5-4). Intrinsic potential is a coarse-
scale geographic information systems (GIS) based model that evaluates stream reaches and their relative
potential to support spawning and rearing activity dependent on geomorphic constraints. The model was
originally developed by the Northwest Fisheries Science Center (NWFSC) and used in the recovery
planning process of the mid-2000’s (e.g., ICTRT 2005, 2006, and 2007)
Using publicly available GIS data, measures of stream bank full width, gradient, and valley confinement
are calculated for each 200m stream reach. The model aligns these habitat parameters with species specific
habitat criteria to assign a reach-level rating of relative habitat potential. The species-specific habitat
criteria were developed by the ICTRT, informed by adult spawner and juvenile distribution data collected
within the Interior Columbia. Stream reaches are rated as having none/negligible, low, moderate, or high
relative potential dependent on the values of each parameter for a given reach. Additional habitat screens
for sedimentation and water velocity are then applied to the reach network to identify habitats that, although
fitting the criteria, may be unsuitable for spawning and rearing. Where violations of the habitat screens are
found the model adjusts the habitat ratings accordingly. The model does not account for anthropogenic
changes to the environment and thus is not considered an assessment of current stream condition but is
more representative of historic fish distribution and population productivity.
The Spokane Tribe of Indians (STI) and co-managers of the blocked area reviewed the NWFSC intrinsic
potential model. It was determined that the original model did not adequately account for natural barriers
to fish passage. Eleven fish passage barrier data sets were reviewed and filtered to isolate natural features
that pose a complete barrier to fish passage. The natural fish passage barrier data set was mapped using
GIS and presented to regional co-managers and biologists who confirmed the presence, status, and location
of each feature and provided additional information if available. Features that lacked supporting
information were considered complete barriers to fish passage. The finalized natural fish passage barrier
data set, which included more features than originally modeled, was sent to the NWFSC for inclusion into
an updated intrinsic potential model run.
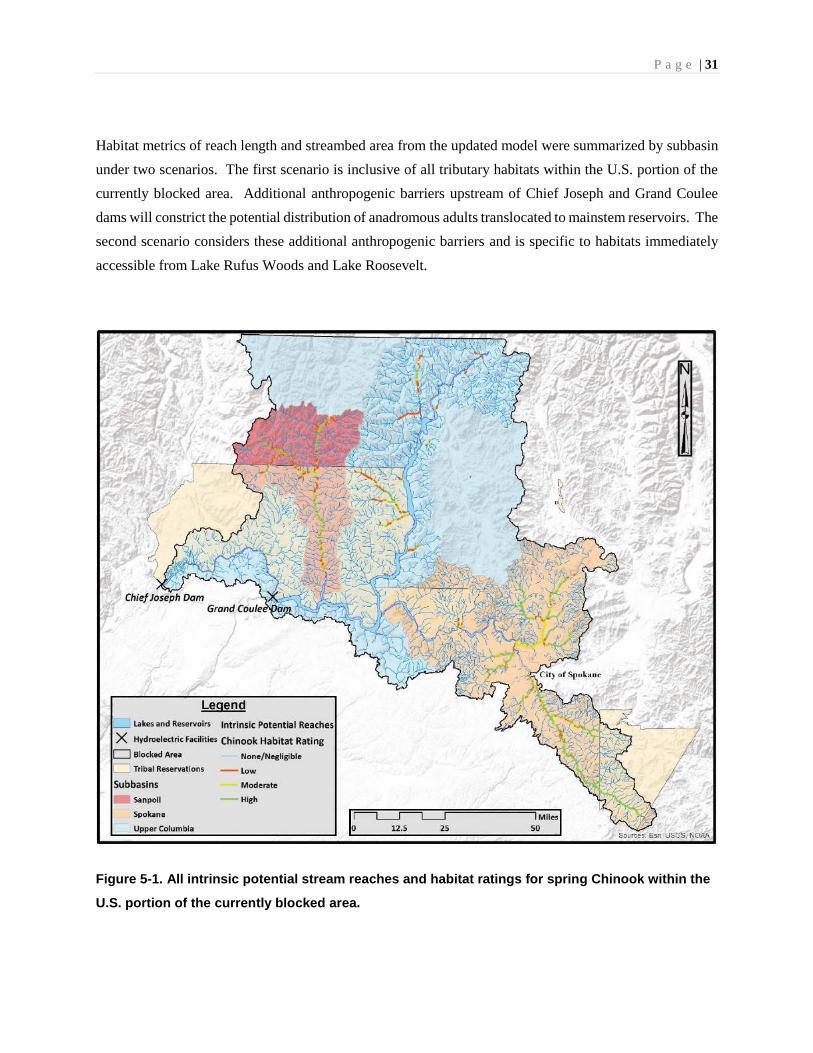
P a g e | 31
Habitat metrics of reach length and streambed area from the updated model were summarized by subbasin
under two scenarios. The first scenario is inclusive of all tributary habitats within the U.S. portion of the
currently blocked area. Additional anthropogenic barriers upstream of Chief Joseph and Grand Coulee
dams will constrict the potential distribution of anadromous adults translocated to mainstem reservoirs. The
second scenario considers these additional anthropogenic barriers and is specific to habitats immediately
accessible from Lake Rufus Woods and Lake Roosevelt.
Figure 5-1. All intrinsic potential stream reaches and habitat ratings for spring Chinook within the
U.S. portion of the currently blocked area.
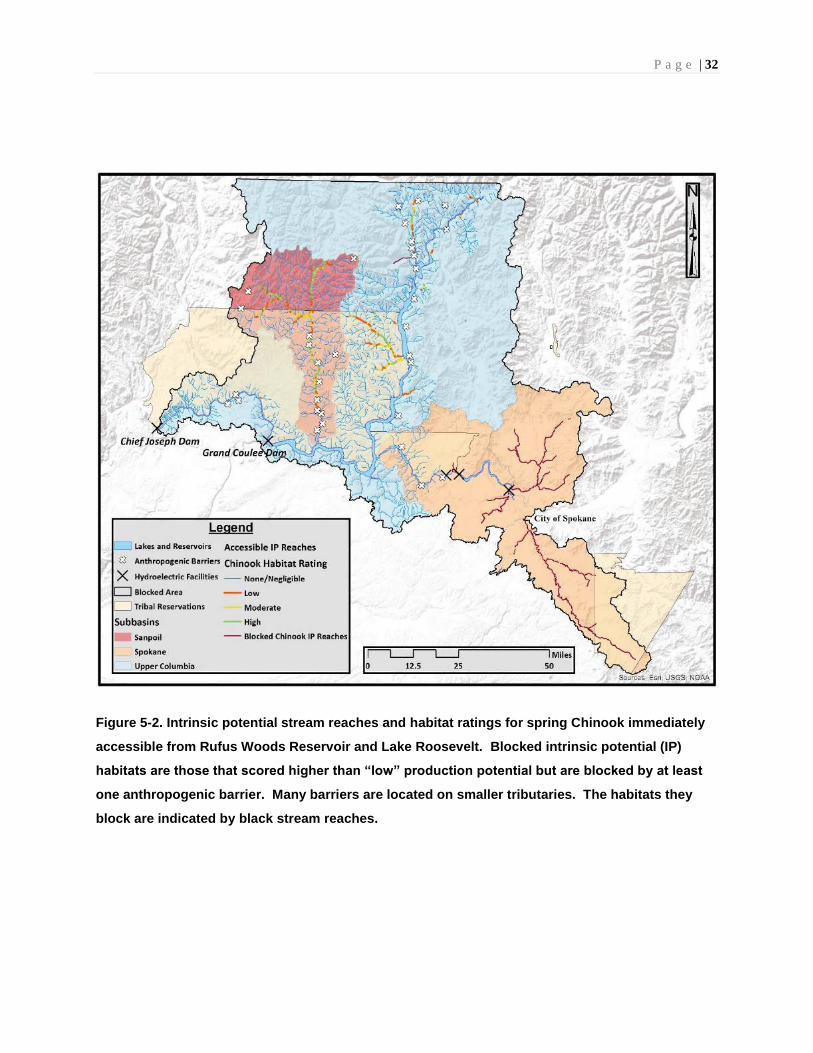
P a g e | 32
Figure 5-2. Intrinsic potential stream reaches and habitat ratings for spring Chinook immediately
accessible from Rufus Woods Reservoir and Lake Roosevelt. Blocked intrinsic potential (IP)
habitats are those that scored higher than “low” production potential but are blocked by at least
one anthropogenic barrier. Many barriers are located on smaller tributaries. The habitats they
block are indicated by black stream reaches.
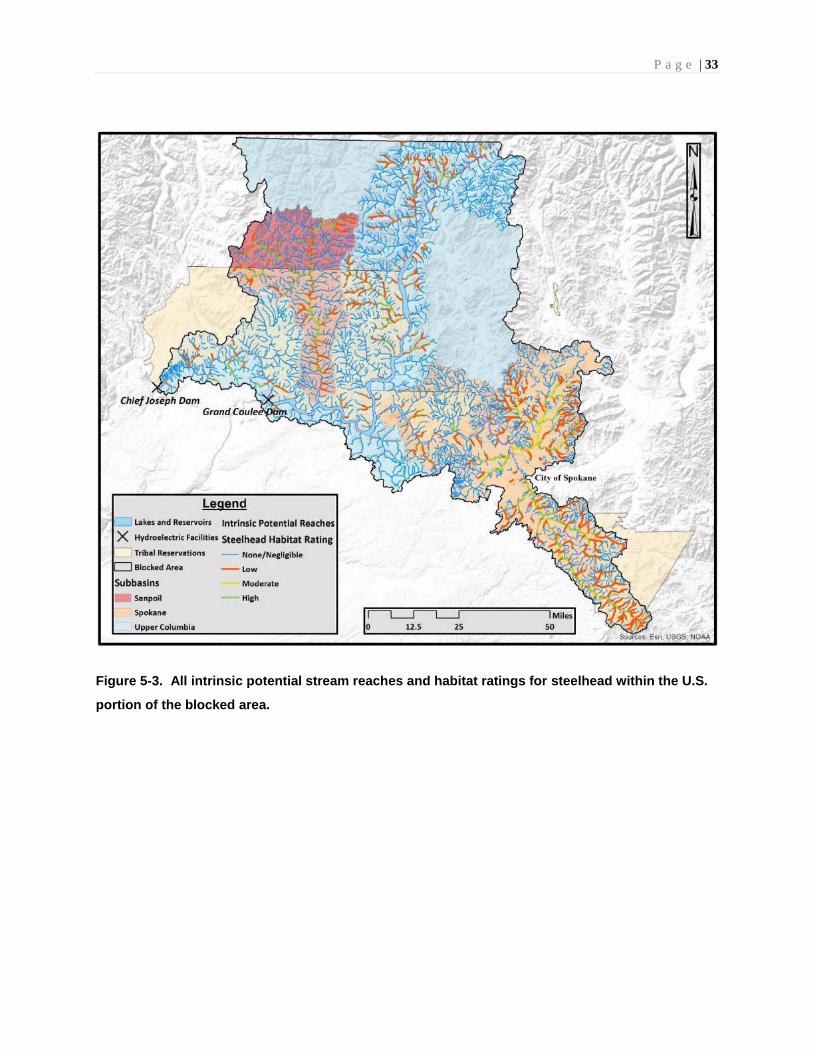
P a g e | 33
Figure 5-3. All intrinsic potential stream reaches and habitat ratings for steelhead within the U.S.
portion of the blocked area.
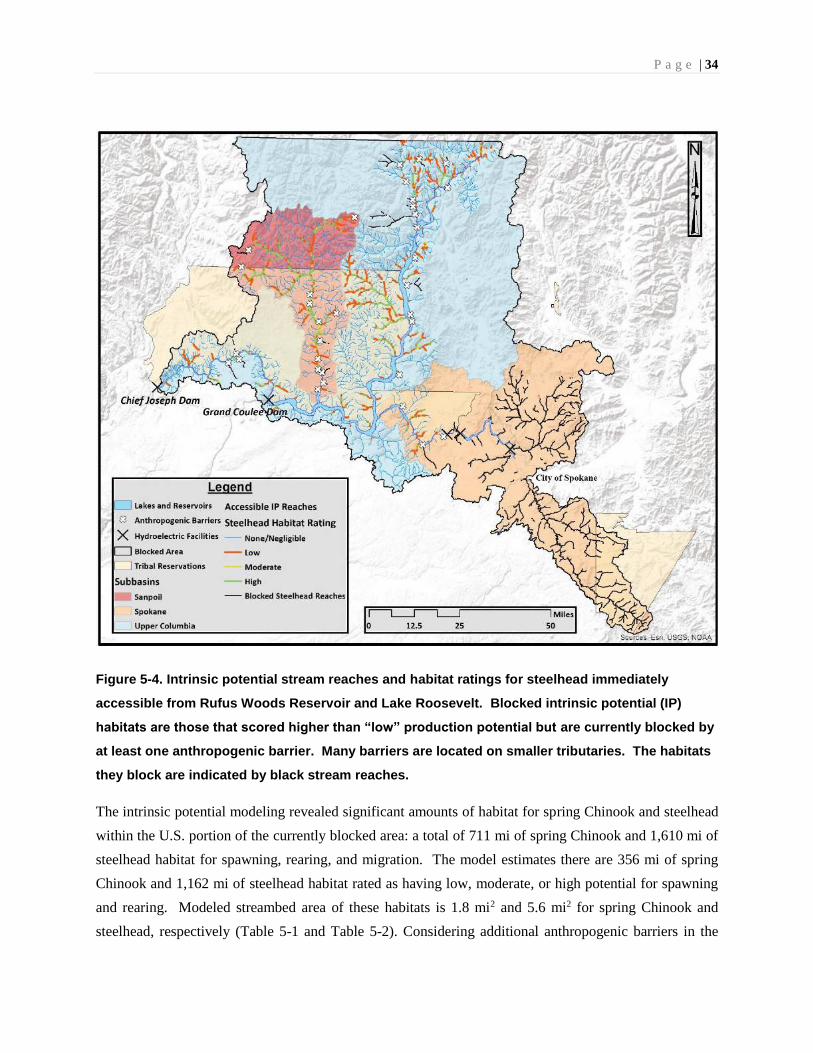
P a g e | 34
Figure 5-4. Intrinsic potential stream reaches and habitat ratings for steelhead immediately
accessible from Rufus Woods Reservoir and Lake Roosevelt. Blocked intrinsic potential (IP)
habitats are those that scored higher than “low” production potential but are currently blocked by
at least one anthropogenic barrier. Many barriers are located on smaller tributaries. The habitats
they block are indicated by black stream reaches.
The intrinsic potential modeling revealed significant amounts of habitat for spring Chinook and steelhead
within the U.S. portion of the currently blocked area: a total of 711 mi of spring Chinook and 1,610 mi of
steelhead habitat for spawning, rearing, and migration. The model estimates there are 356 mi of spring
Chinook and 1,162 mi of steelhead habitat rated as having low, moderate, or high potential for spawning
and rearing. Modeled streambed area of these habitats is 1.8 mi2 and 5.6 mi2 for spring Chinook and
steelhead, respectively (Table 5-1 and Table 5-2). Considering additional anthropogenic barriers in the
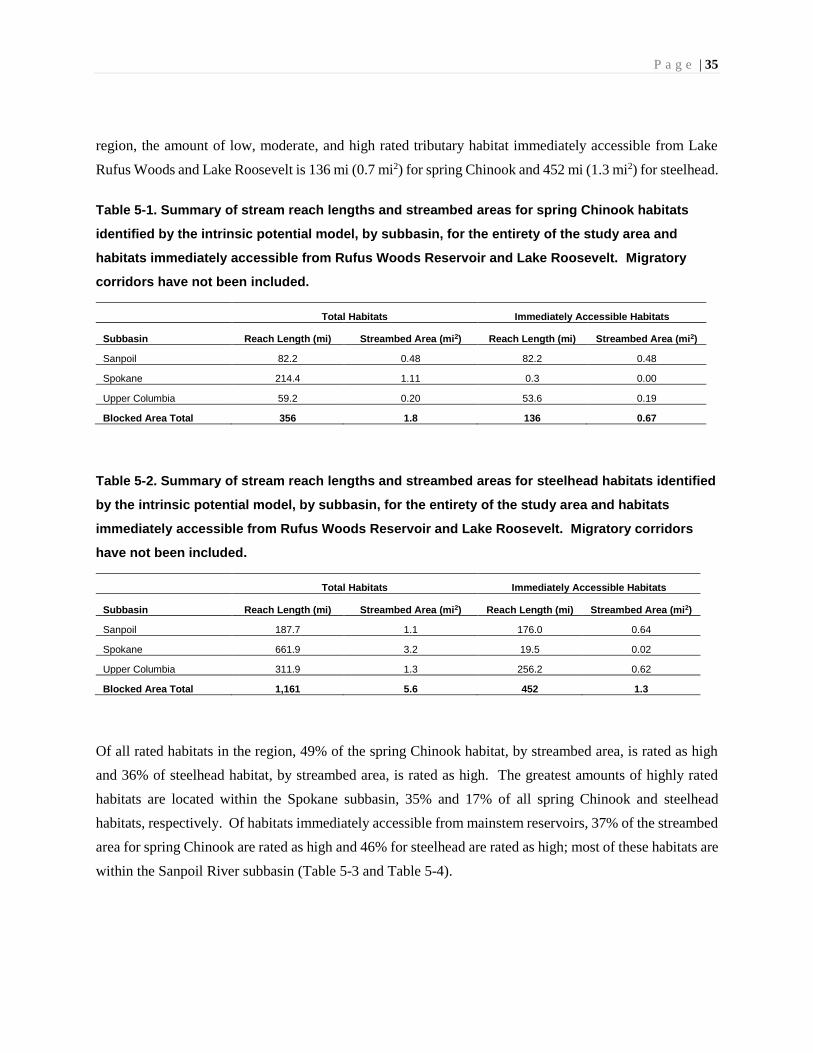
P a g e | 35
region, the amount of low, moderate, and high rated tributary habitat immediately accessible from Lake
Rufus Woods and Lake Roosevelt is 136 mi (0.7 mi2) for spring Chinook and 452 mi (1.3 mi2) for steelhead.
Table 5-1. Summary of stream reach lengths and streambed areas for spring Chinook habitats
identified by the intrinsic potential model, by subbasin, for the entirety of the study area and
habitats immediately accessible from Rufus Woods Reservoir and Lake Roosevelt. Migratory
corridors have not been included.
Total Habitats Immediately Accessible Habitats
Subbasin Reach Length (mi) Streambed Area (mi2) Reach Length (mi) Streambed Area (mi2)
Sanpoil 82.2 0.48 82.2 0.48
Spokane 214.4 1.11 0.3 0.00
Upper Columbia 59.2 0.20 53.6 0.19
Blocked Area Total 356 1.8 136 0.67
Table 5-2. Summary of stream reach lengths and streambed areas for steelhead habitats identified
by the intrinsic potential model, by subbasin, for the entirety of the study area and habitats
immediately accessible from Rufus Woods Reservoir and Lake Roosevelt. Migratory corridors
have not been included.
Total Habitats Immediately Accessible Habitats
Subbasin Reach Length (mi) Streambed Area (mi2) Reach Length (mi) Streambed Area (mi2)
Sanpoil 187.7 1.1 176.0 0.64
Spokane 661.9 3.2 19.5 0.02
Upper Columbia 311.9 1.3 256.2 0.62
Blocked Area Total 1,161 5.6 452 1.3
Of all rated habitats in the region, 49% of the spring Chinook habitat, by streambed area, is rated as high
and 36% of steelhead habitat, by streambed area, is rated as high. The greatest amounts of highly rated
habitats are located within the Spokane subbasin, 35% and 17% of all spring Chinook and steelhead
habitats, respectively. Of habitats immediately accessible from mainstem reservoirs, 37% of the streambed
area for spring Chinook are rated as high and 46% for steelhead are rated as high; most of these habitats are
within the Sanpoil River subbasin (Table 5-3 and Table 5-4).
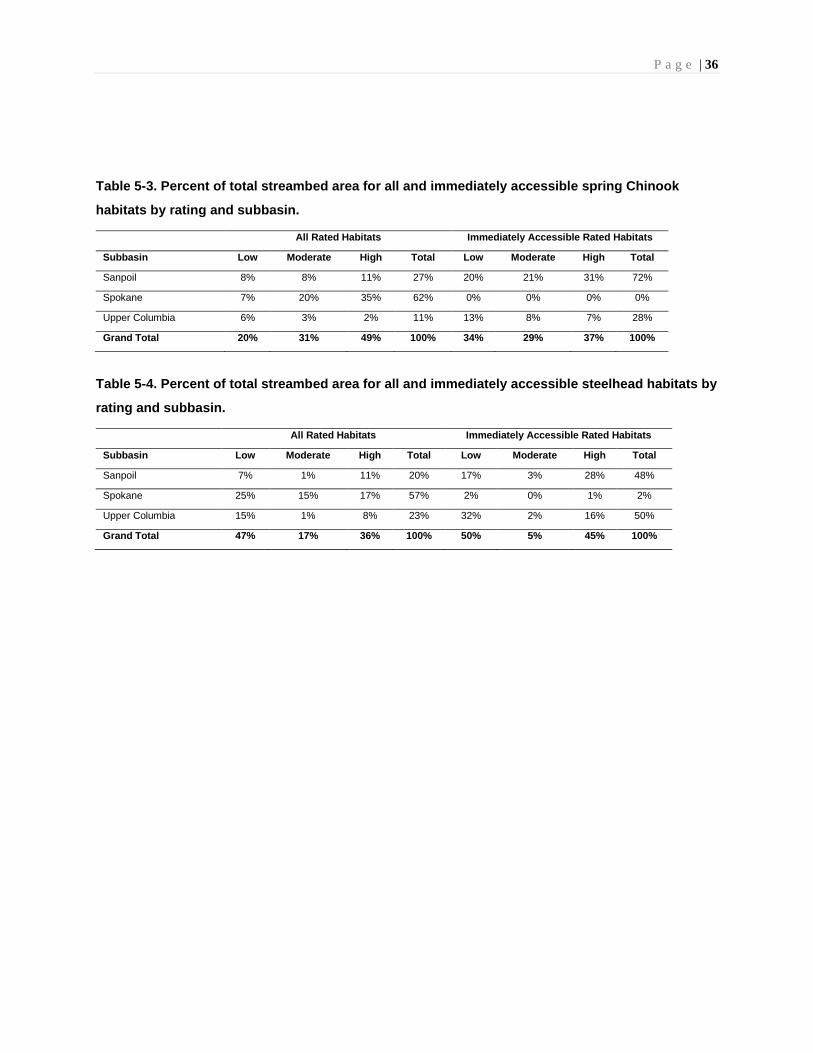
P a g e | 36
Table 5-3. Percent of total streambed area for all and immediately accessible spring Chinook
habitats by rating and subbasin.
All Rated Habitats Immediately Accessible Rated Habitats
Subbasin Low Moderate High Total Low Moderate High Total
Sanpoil 8% 8% 11% 27% 20% 21% 31% 72%
Spokane 7% 20% 35% 62% 0% 0% 0% 0%
Upper Columbia 6% 3% 2% 11% 13% 8% 7% 28%
Grand Total 20% 31% 49% 100% 34% 29% 37% 100%
Table 5-4. Percent of total streambed area for all and immediately accessible steelhead habitats by
rating and subbasin.
All Rated Habitats Immediately Accessible Rated Habitats
Subbasin Low Moderate High Total Low Moderate High Total
Sanpoil 7% 1% 11% 20% 17% 3% 28% 48%
Spokane 25% 15% 17% 57% 2% 0% 1% 2%
Upper Columbia 15% 1% 8% 23% 32% 2% 16% 50%
Grand Total 47% 17% 36% 100% 50% 5% 45% 100%
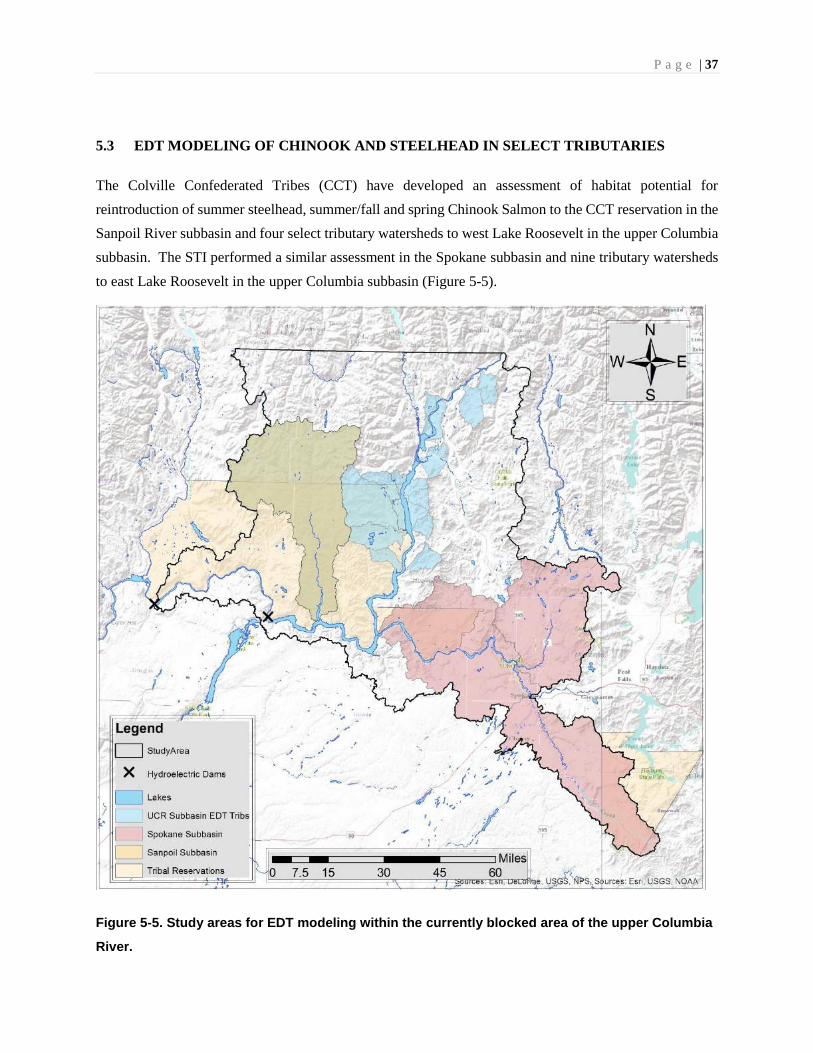
P a g e | 37
5.3 EDT MODELING OF CHINOOK AND STEELHEAD IN SELECT TRIBUTARIES
The Colville Confederated Tribes (CCT) have developed an assessment of habitat potential for
reintroduction of summer steelhead, summer/fall and spring Chinook Salmon to the CCT reservation in the
Sanpoil River subbasin and four select tributary watersheds to west Lake Roosevelt in the upper Columbia
subbasin. The STI performed a similar assessment in the Spokane subbasin and nine tributary watersheds
to east Lake Roosevelt in the upper Columbia subbasin (Figure 5-5).
Figure 5-5. Study areas for EDT modeling within the currently blocked area of the upper Columbia
River.

P a g e | 38
The CCT assessment was conducted using existing Sanpoil and Upper Columbia Ecosystem Diagnosis and
Treatment (EDT) models previously built to support resident fish conservation efforts. Extensive data sets
documenting current habitat conditions in these watersheds were used to populate the model. The
adaptation of these existing EDT models required the development of hypothetical populations of steelhead,
summer/fall Chinook and spring Chinook. ICF, the modeling subcontractor, and the CCT hosted a life
history model workshop with regional fisheries experts to define probable age composition and life stage
timing as well as distribution and behavioral characteristics based on knowledge of remaining extant
populations in the upper Columbia region. The information gained from this workshop was used to
parameterize EDT model populations used in both the CCT and STI initial reintroduction analyses.
ICF relied on the consensus opinion of workshop attendees and National Marine Fisheries Service intrinsic
potential model criteria to define the extent of probable habitat for steelhead, spring and summer/fall
Chinook Salmon in each subbasin.
ICF applied three different sets of assumptions about Grand Coulee Dam and Chief Joseph Dam passage
survival to evaluate reintroduction potential. These scenarios use the following passage survival rates for
juvenile migrants moving downstream and adult migrants moving upstream:
• Biological opinion (BiOp) survival: 95% juvenile downstream, 98% adult upstream survival at
both dams.
• Moderate survival: 90% juvenile downstream, 97% adult upstream survival at both dams.
• Low survival: 85% juvenile downstream, 95% adult upstream survival at both dams.
These passage survival scenarios apply to Grand Coulee Dam and Chief Joseph Dam. The BiOp survival
assumption is consistent with Federal Columbia River Power System (FCRPS) biological opinion survival
standards for other federally-operated dams on the Columbia River mainstem. The moderate and low
survival assumptions are provided to evaluate habitat potential at survival rates below BiOp standards. ICF
calibrated juvenile and adult migrant survival in the remainder of the Columbia River migration corridor
and Pacific Ocean to match recent observations for extant species, emphasizing data collected after 2008
when significant changes in federal hydropower system operations and other system improvements were
implemented to increase juvenile migrant survival.
The STI assessment involved the construction of new EDT models for the Spokane subbasin and tributaries
east of Lake Roosevelt. These models were populated with existing habitat data previously collected by a
multitude of agencies and organizations independent of this investigation. Missing habitat parameters or
P a g e | 39
gaps in spatial coverage were filled using products from 3rd party models, interpretation of aerial imagery,
or interpolation from comparable watersheds. Species and life history information developed through the
CCT workshops were applied to the STI EDT models. The three scenarios of passage survival at GCD and
CJD were run, but for each, passage survival at Spokane River hydroelectric dams was maintained at BiOp
passage survival rates (95% juvenile downstream, 98% adult upstream survival) assuming that, due to the
size and nature of those facilities, BiOp passage rates are achievable. Additional anthropogenic barriers,
such as road crossings, within the study area were assumed to be resolved following future restoration
actions.
A summary of EDT-estimated habitat potential for summer steelhead and spring Chinook in the Sanpoil
River and west Lake Roosevelt tributaries and summer/fall Chinook in the Sanpoil River is presented in
ICF (2017) (Table 5-5 and 5-6). Summaries for the Spokane subbasin and east Lake Roosevelt tributaries
is found in ICF (2018). The take home messages from these documents are as follows:
• There is substantial potential for summer steelhead reintroduction in the total blocked area:
• Blocked area tributaries may support populations of approximately 2,300 adult steelhead under
current habitat conditions and BiOp passage scenarios, assuming that all manmade passage barriers
are resolved (Table 5-5).
• The Spokane and Sanpoil subbasins contain the vast majority of production potential in the region,
although Lake Roosevelt tributaries appear to have enough habitat to support small spawning
aggregates of steelhead.
• Steelhead life stage survival metrics are consistent with observed survival rates in other functional
watersheds in the Columbia basin.
• Egg-to-parr survival2 in the blocked area ranges from 3.4% to 7.9% under current conditions across
2 Egg-to-parr survival in this study means survival from the beginning of incubation through the end of the first
summer of active rearing.
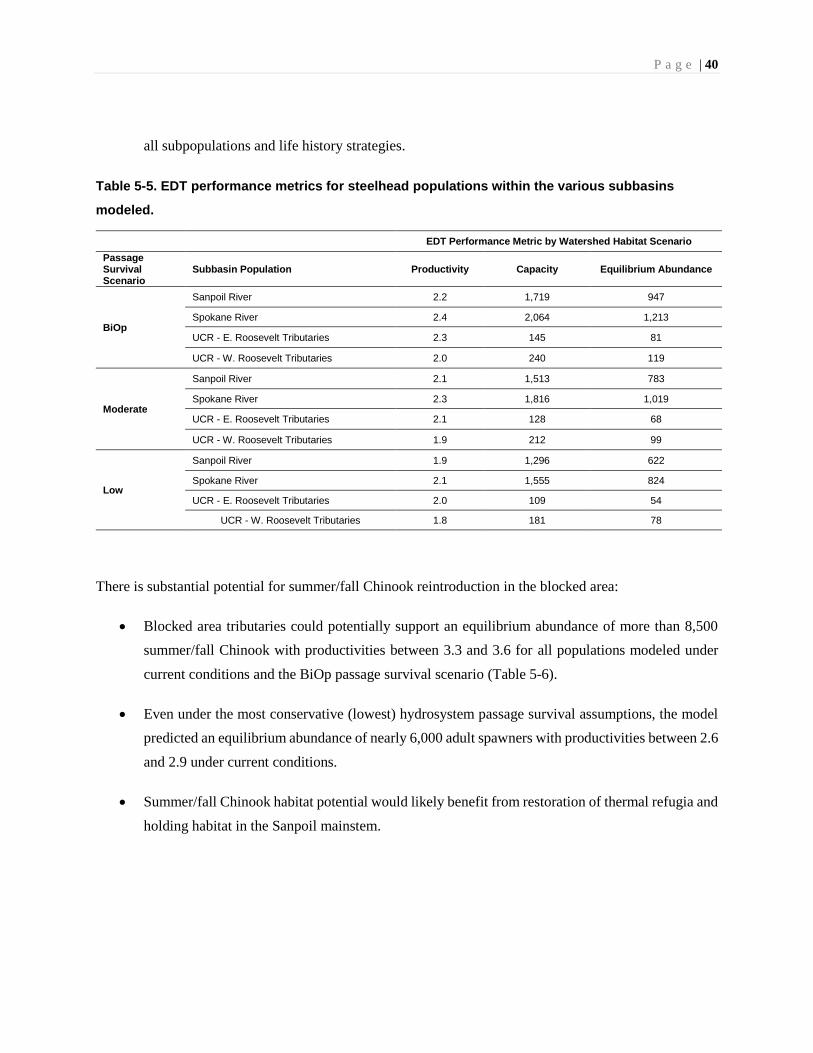
P a g e | 40
all subpopulations and life history strategies.
Table 5-5. EDT performance metrics for steelhead populations within the various subbasins
modeled.
EDT Performance Metric by Watershed Habitat Scenario
Passage Survival Scenario
Subbasin Population Productivity Capacity Equilibrium Abundance
BiOp
Sanpoil River 2.2 1,719 947
Spokane River 2.4 2,064 1,213
UCR - E. Roosevelt Tributaries 2.3 145 81
UCR - W. Roosevelt Tributaries 2.0 240 119
Moderate
Sanpoil River 2.1 1,513 783
Spokane River 2.3 1,816 1,019
UCR - E. Roosevelt Tributaries 2.1 128 68
UCR - W. Roosevelt Tributaries 1.9 212 99
Low
Sanpoil River 1.9 1,296 622
Spokane River 2.1 1,555 824
UCR - E. Roosevelt Tributaries 2.0 109 54
UCR - W. Roosevelt Tributaries 1.8 181 78
There is substantial potential for summer/fall Chinook reintroduction in the blocked area:
• Blocked area tributaries could potentially support an equilibrium abundance of more than 8,500
summer/fall Chinook with productivities between 3.3 and 3.6 for all populations modeled under
current conditions and the BiOp passage survival scenario (Table 5-6).
• Even under the most conservative (lowest) hydrosystem passage survival assumptions, the model
predicted an equilibrium abundance of nearly 6,000 adult spawners with productivities between 2.6
and 2.9 under current conditions.
• Summer/fall Chinook habitat potential would likely benefit from restoration of thermal refugia and
holding habitat in the Sanpoil mainstem.
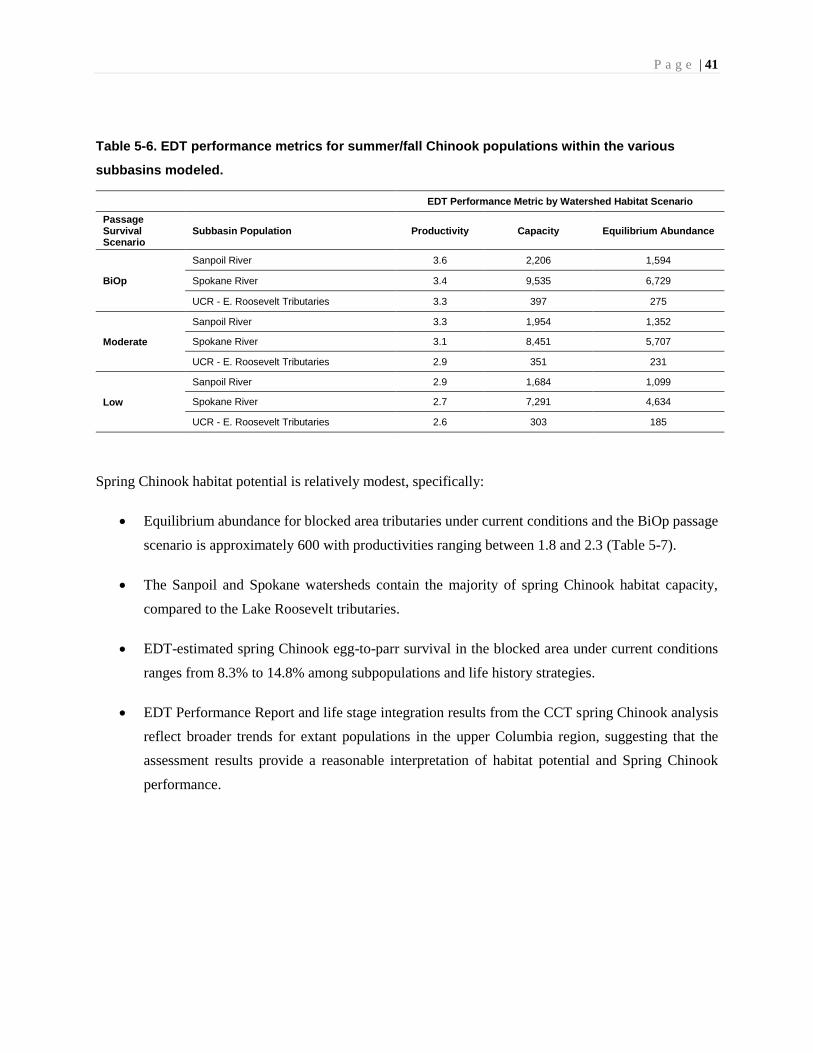
P a g e | 41
Table 5-6. EDT performance metrics for summer/fall Chinook populations within the various
subbasins modeled.
EDT Performance Metric by Watershed Habitat Scenario
Passage Survival Scenario
Subbasin Population Productivity Capacity Equilibrium Abundance
BiOp
Sanpoil River 3.6 2,206 1,594
Spokane River 3.4 9,535 6,729
UCR - E. Roosevelt Tributaries 3.3 397 275
Moderate
Sanpoil River 3.3 1,954 1,352
Spokane River 3.1 8,451 5,707
UCR - E. Roosevelt Tributaries 2.9 351 231
Low
Sanpoil River 2.9 1,684 1,099
Spokane River 2.7 7,291 4,634
UCR - E. Roosevelt Tributaries 2.6 303 185
Spring Chinook habitat potential is relatively modest, specifically:
• Equilibrium abundance for blocked area tributaries under current conditions and the BiOp passage
scenario is approximately 600 with productivities ranging between 1.8 and 2.3 (Table 5-7).
• The Sanpoil and Spokane watersheds contain the majority of spring Chinook habitat capacity,
compared to the Lake Roosevelt tributaries.
• EDT-estimated spring Chinook egg-to-parr survival in the blocked area under current conditions
ranges from 8.3% to 14.8% among subpopulations and life history strategies.
• EDT Performance Report and life stage integration results from the CCT spring Chinook analysis
reflect broader trends for extant populations in the upper Columbia region, suggesting that the
assessment results provide a reasonable interpretation of habitat potential and Spring Chinook
performance.
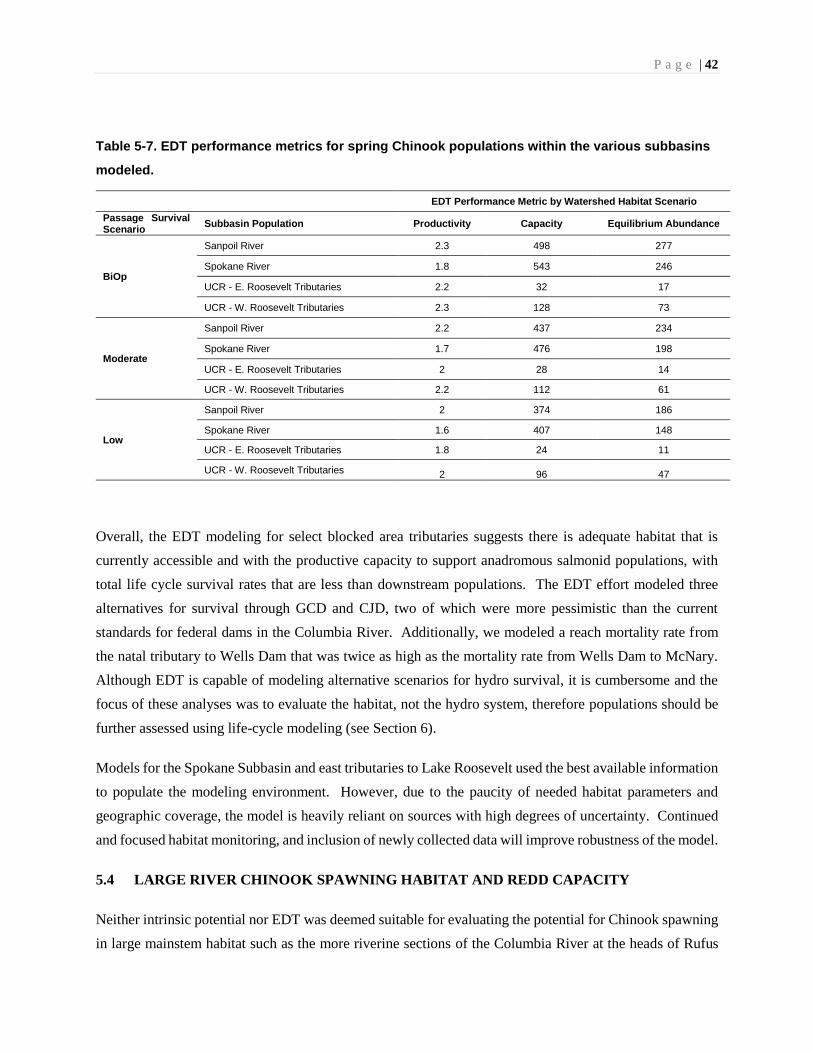
P a g e | 42
Table 5-7. EDT performance metrics for spring Chinook populations within the various subbasins
modeled.
EDT Performance Metric by Watershed Habitat Scenario
Passage Survival Scenario
Subbasin Population Productivity Capacity Equilibrium Abundance
BiOp
Sanpoil River 2.3 498 277
Spokane River 1.8 543 246
UCR - E. Roosevelt Tributaries 2.2 32 17
UCR - W. Roosevelt Tributaries 2.3 128 73
Moderate
Sanpoil River 2.2 437 234
Spokane River 1.7 476 198
UCR - E. Roosevelt Tributaries 2 28 14
UCR - W. Roosevelt Tributaries 2.2 112 61
Low
Sanpoil River 2 374 186
Spokane River 1.6 407 148
UCR - E. Roosevelt Tributaries 1.8 24 11
UCR - W. Roosevelt Tributaries 2 96 47
Overall, the EDT modeling for select blocked area tributaries suggests there is adequate habitat that is
currently accessible and with the productive capacity to support anadromous salmonid populations, with
total life cycle survival rates that are less than downstream populations. The EDT effort modeled three
alternatives for survival through GCD and CJD, two of which were more pessimistic than the current
standards for federal dams in the Columbia River. Additionally, we modeled a reach mortality rate from
the natal tributary to Wells Dam that was twice as high as the mortality rate from Wells Dam to McNary.
Although EDT is capable of modeling alternative scenarios for hydro survival, it is cumbersome and the
focus of these analyses was to evaluate the habitat, not the hydro system, therefore populations should be
further assessed using life-cycle modeling (see Section 6).
Models for the Spokane Subbasin and east tributaries to Lake Roosevelt used the best available information
to populate the modeling environment. However, due to the paucity of needed habitat parameters and
geographic coverage, the model is heavily reliant on sources with high degrees of uncertainty. Continued
and focused habitat monitoring, and inclusion of newly collected data will improve robustness of the model.
5.4 LARGE RIVER CHINOOK SPAWNING HABITAT AND REDD CAPACITY
Neither intrinsic potential nor EDT was deemed suitable for evaluating the potential for Chinook spawning
in large mainstem habitat such as the more riverine sections of the Columbia River at the heads of Rufus
P a g e | 43
Woods Lake and Lake Roosevelt. Instead, the substantial habitat and population analysis methods used in
the Hanford Reach and Snake River were conducted to determine Chinook spawning potential in large river
habitats. Reaches evaluated include a 17-mile portion of Rufus Woods Lake downstream of Grand Coulee
Dam (Hanrahan et al. 2004) and several sections of the Transboundary Reach. The Transboundary Reach
is an approximately 60-mile-long free-flowing section of the Columbia River between Lake Roosevelt and
Hugh L. Keenlyside Dam in British Columbia, Canada. Garavelli and others (in prep) evaluated a 40-mile
section from Kettle Falls to the U.S./Canadian border. The Canadian Columbia River Inter-Tribal Fisheries
Commission contracted a similar analysis in a three-mile segment of the Transboundary Reach in and
around the confluence of the Kootenay and Columbia rivers (Golder 2016 and 2017).
The approaches used for each of these analyses are similar in that they all employed 2-D hydraulic modeling
for depth, velocity, substrate, and channel slope. However, the exact methods for estimating the quantity
and quality of each potential spawning area were slightly different for each area.
Rufus Woods (see Hanrahan et al. 2004 for full details): Two potential spawning areas were identified in
the upper reaches of Lake Rufus Woods by a geomorphic analysis. A binary analysis was applied to each
area that classified each 3m×3m cell within the areas as either “Suitable” or “Not Suitable” based on
published criteria defining suitable fall Chinook spawning habitat (i.e., depth, velocity, substrate, and
channel-bed slope; see Table 1 in Hanrahan et al. 2004). Lastly, of the potential habitat calculated as
“Suitable,” a suitability index analysis was performed to rate the quality of this habitat on a scale from 0
(poor) to 1 (optimum).
Once the locations and areas (m2) of suitable habitats were quantified, redd capacity was calculated using
four different methods that accounted for suitable habitat, the percent of available habitat utilized by
spawners, average redd size and inter-redd spacing.
Transboundary Reach (U.S. habitat; see Garavelli et al. in prep., for full details): Current velocity, depth,
and riverbed slope of the study area were estimated using a spatially explicit grid-based hydrodynamic
model simulating flow and temperature in two dimensions, the Modular Aquatic Simulation System in 2-
dimensions MASS2 (Perkins et al., 2007a; Perkins et al., 2007b). To determine the spawning habitat
availability of Chinook Salmon in the study reach, a logistic regression model was developed using data of
physical habitat attributes and spawning habitat from Geist et al. (2008) in the Hanford Reach of the
Columbia River. Spawning probabilities were calculated for the three exceedance flow levels (10%, 50%,
and 90%) and for three substrate categories in each 3×3m habitat cells from Kettle Falls to the Canadian
border for a total of nine habitat estimates. Four estimates of redd size were used to calculate redd capacity,
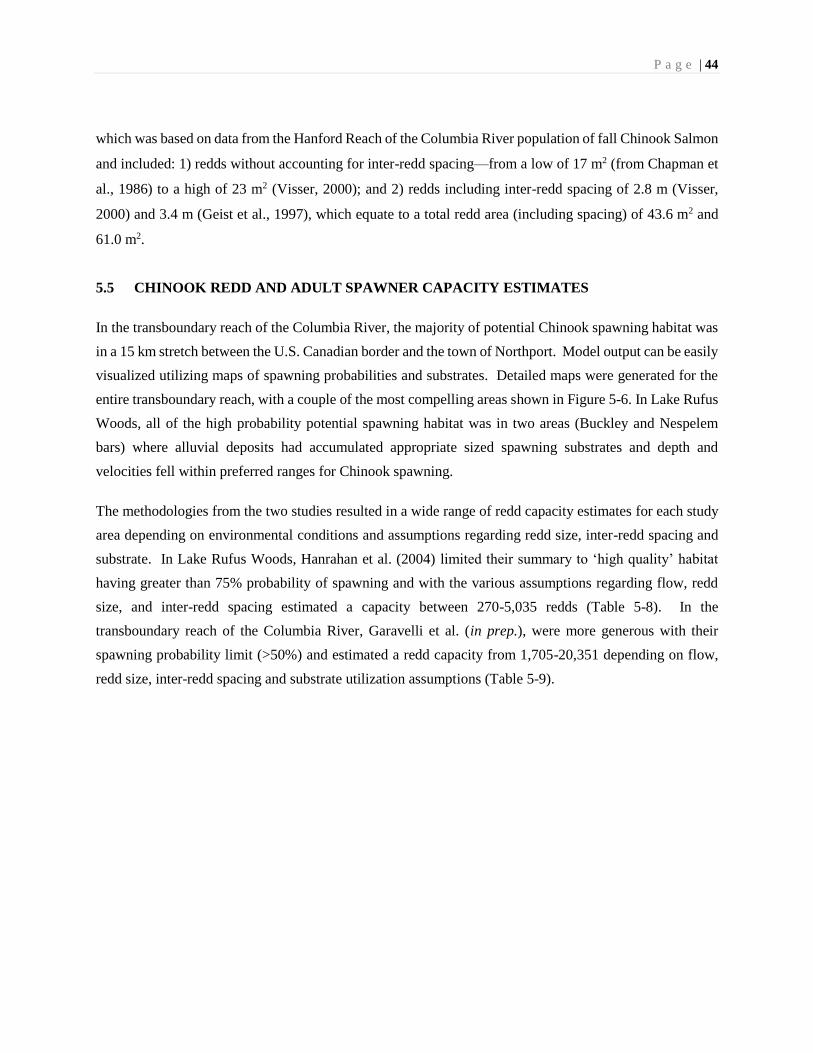
P a g e | 44
which was based on data from the Hanford Reach of the Columbia River population of fall Chinook Salmon
and included: 1) redds without accounting for inter-redd spacing—from a low of 17 m2 (from Chapman et
al., 1986) to a high of 23 m2 (Visser, 2000); and 2) redds including inter-redd spacing of 2.8 m (Visser,
2000) and 3.4 m (Geist et al., 1997), which equate to a total redd area (including spacing) of 43.6 m2 and
61.0 m2.
5.5 CHINOOK REDD AND ADULT SPAWNER CAPACITY ESTIMATES
In the transboundary reach of the Columbia River, the majority of potential Chinook spawning habitat was
in a 15 km stretch between the U.S. Canadian border and the town of Northport. Model output can be easily
visualized utilizing maps of spawning probabilities and substrates. Detailed maps were generated for the
entire transboundary reach, with a couple of the most compelling areas shown in Figure 5-6. In Lake Rufus
Woods, all of the high probability potential spawning habitat was in two areas (Buckley and Nespelem
bars) where alluvial deposits had accumulated appropriate sized spawning substrates and depth and
velocities fell within preferred ranges for Chinook spawning.
The methodologies from the two studies resulted in a wide range of redd capacity estimates for each study
area depending on environmental conditions and assumptions regarding redd size, inter-redd spacing and
substrate. In Lake Rufus Woods, Hanrahan et al. (2004) limited their summary to ‘high quality’ habitat
having greater than 75% probability of spawning and with the various assumptions regarding flow, redd
size, and inter-redd spacing estimated a capacity between 270-5,035 redds (Table 5-8). In the
transboundary reach of the Columbia River, Garavelli et al. (in prep.), were more generous with their
spawning probability limit (>50%) and estimated a redd capacity from 1,705-20,351 depending on flow,
redd size, inter-redd spacing and substrate utilization assumptions (Table 5-9).

P a g e | 45
Figure 5-6. Predicted locations of the Chinook Salmon spawning habitat for the 50% exceedance
flow level and substrate category #3 (pebble, cobble, and boulder). Predicted locations are defined
by their spawning probabilities (upper panels), from 0 (blue) to 1 (red), at the U.S.-Canada
international border (A.; RKM 255–256) and upstream of Northport (B.; RKM 245–246). Substrate
types for the same locations are shown in the lower panels. Inset maps show the locations
(represented by a red square) relative to the study area in the Columbia River (Washington State).
Table 5-8. Lake Rufus Woods redd capacity of highly suitable (composite index 0.76-1.0) potential
Fall Chinook Salmon spawning habitat based on redd sizes and inter-redd spacing. This table was
re-created from Hanrahan et al. 2004.
Redd Capacity at Flow Level (Q)
Redd Size (m2) Q10 Q50 Q90
21 5,035 4,566 1,506
23 4597 4169 1375
Area used (m2) Q10 Q50 Q90
91 1,159 1,051 347
117 902 818 270
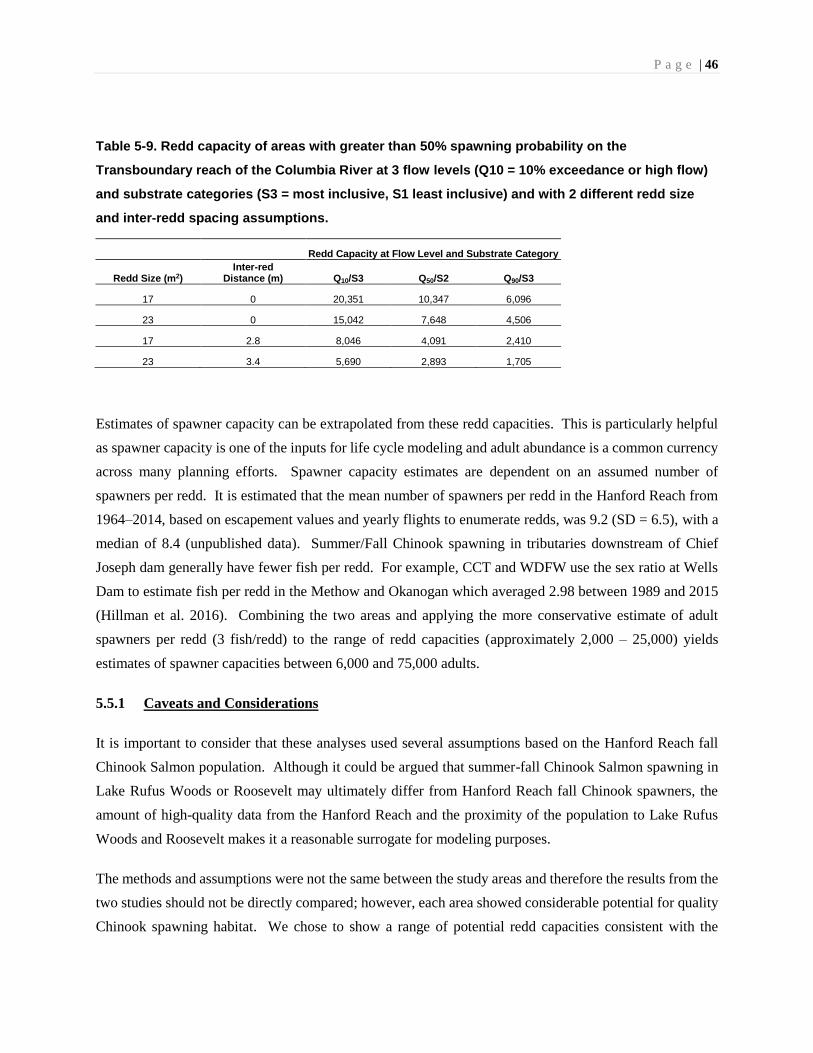
P a g e | 46
Table 5-9. Redd capacity of areas with greater than 50% spawning probability on the
Transboundary reach of the Columbia River at 3 flow levels (Q10 = 10% exceedance or high flow)
and substrate categories (S3 = most inclusive, S1 least inclusive) and with 2 different redd size
and inter-redd spacing assumptions.
Redd Capacity at Flow Level and Substrate Category
Redd Size (m2) Inter-red
Distance (m) Q10/S3 Q50/S2 Q90/S3
17 0 20,351 10,347 6,096
23 0 15,042 7,648 4,506
17 2.8 8,046 4,091 2,410
23 3.4 5,690 2,893 1,705
Estimates of spawner capacity can be extrapolated from these redd capacities. This is particularly helpful
as spawner capacity is one of the inputs for life cycle modeling and adult abundance is a common currency
across many planning efforts. Spawner capacity estimates are dependent on an assumed number of
spawners per redd. It is estimated that the mean number of spawners per redd in the Hanford Reach from
1964–2014, based on escapement values and yearly flights to enumerate redds, was 9.2 (SD = 6.5), with a
median of 8.4 (unpublished data). Summer/Fall Chinook spawning in tributaries downstream of Chief
Joseph dam generally have fewer fish per redd. For example, CCT and WDFW use the sex ratio at Wells
Dam to estimate fish per redd in the Methow and Okanogan which averaged 2.98 between 1989 and 2015
(Hillman et al. 2016). Combining the two areas and applying the more conservative estimate of adult
spawners per redd (3 fish/redd) to the range of redd capacities (approximately 2,000 – 25,000) yields
estimates of spawner capacities between 6,000 and 75,000 adults.
5.5.1 Caveats and Considerations
It is important to consider that these analyses used several assumptions based on the Hanford Reach fall
Chinook Salmon population. Although it could be argued that summer-fall Chinook Salmon spawning in
Lake Rufus Woods or Roosevelt may ultimately differ from Hanford Reach fall Chinook spawners, the
amount of high-quality data from the Hanford Reach and the proximity of the population to Lake Rufus
Woods and Roosevelt makes it a reasonable surrogate for modeling purposes.
The methods and assumptions were not the same between the study areas and therefore the results from the
two studies should not be directly compared; however, each area showed considerable potential for quality
Chinook spawning habitat. We chose to show a range of potential redd capacities consistent with the
P a g e | 47
approach of the study authors because of the difficulty of selecting the ‘best’ value for each model input.
There is considerable uncertainty in selecting the best single estimate of capacity due to unknown direction
and magnitude of the difference between the model prediction and the biological truth (which can only be
evaluated after fish are reintroduced). If, or when, fine-tuning a single estimate for a biological target for
spawning escapement becomes important, we recommend that a technical workgroup take a closer look at
the two studies, add in any pertinent empirical data (from these reaches or surrogates) and develop a
recommendation. For now, the ranges provided by these studies appear to adequately answer the
management question regarding the availability and suitability of habitat in the reaches studied.
5.6 POTENTIAL SOCKEYE SALMON SPAWNER CAPACITY IN THE SANPOIL
SUBBASIN
The techniques used for other tributary habitat assessments are not parameterized to evaluate habitat
suitability with respect to Sockeye Salmon. Existing habitat data for the Sanpoil subbasin enabled the
estimation of potential spawner capacity using two different methods: one based on spawner densities, the
other based on redd sizes. This analysis is specific to the Sanpoil subbasin because adequate habitat data
sets are not available for other tributaries in the region are expected to support Sockeye spawning.
Extensive habitat surveys were conducted by the CCT in the Sanpoil River in 2009 (Wolvert and Nine
2010). One of the objectives for this work was to estimate the quantity of potential spawning habitat for
kokanee, the non-anadromous form of O. nerka. Wolvert and Nine (2010) estimated there is over 340,000
m2 of habitat of glide, pool tailout, and small cobble/gravel riffle in the lower 65 km of Sanpoil River. The
estimates of habitat area (m2) for various habitat types enables potential spawner capacity to be calculated
using two techniques, applying separate assumptions to each: one based on spawner density for a given
area, the other based on redd size and number of spawners per redd.
It was estimated that Sanpoil habitats could support between 238k and 1.7 million kokanee spawners,
depending on the density of spawners. The literature reviewed by Wolvert and Nine (2010) suggested that
kokanee spawner densities could be between 0.7 and 5.0 fish/m2 and that a large proportion of kokanee
redds may be found in glides. A literature review in Hyatt and Rankin (1999) suggested a similar spawning
density for Sockeye in streams of British Columbia, Canada, which was between 1.1 and 4.0 fish per m2.
Similar densities have been observed in the Okanagan River for the Lake Osoyoos population (K. Hyatt,
personal communication). Calculations in Wolvert and Nine (2010) did not make adjustments for portions
of the available habitat that may not be utilized by O. nerka spawners. Although O. nerka spawning may
occur in each of the three habitat unit types, it is unlikely that fish would use 100% of any available habitat
P a g e | 48
type. However, in the absence of empirical data regarding where Sockeye prefer to spawn in the Sanpoil,
we used a matrix approach to evaluate the potential quantity of spawning habitats given different sets of
assumptions regarding the utilization of habitat (25% - 75%) and the density of spawners (Table 5-9). The
mid-range estimate for both spawner density (2.96 fish/m2) and habitat utilization (50%) yielded a capacity
of 373,094 Sockeye Salmon spawners. The capacity ranged from 70,585 to 756,272 depending on the
assumptions regarding fish density and the percent of each habitat type that may be utilized (Table 5-10).
Table 5-10. Matrix of potential Sockeye Salmon abundance given various rates of utilization of
each habitat type in the Sanpoil and three possible densities of spawners. The quantity of habitat
available in the Sanpoil comes from Wolvert and Nine (2010). The range of potential Sockeye
spawner densities comes from Hyatt and Rankin (1999), which were affirmed with more current
information from the Okanogan River (Hyatt, personal communication).
Habitat Unit Habitat unit %
Habitat Utilization Multiplier
Adjusted area (m2)
Abundance if density (fish/m2) =
1.12 2.96 4.0
Pool tailout 1.8%
25% 1,533 1,717 4,538 6,132
50% 3,066 3,434 9,075 12,264
75% 4,599 5,151 13,613 18,396
Small cobble/ gravel riffle
25.7%
25% 21,888 24,514 64,787 87,550
50% 43,775 49,028 129,575 175,101
75% 65,663 73,542 194,362 262,651
Glide 46.5%
25% 39,602 44,354 117,222 158,408
50% 79,204 88,709 234,444 316,817
75% 118,806 133,063 351,666 475,225
Sum of 25% 63,023 70,585 186,547 252,091
Sum of 50% 126,045 141,171 373,094 504,181
Sum of 75% 189,068 211,756 559,641 756,272
The USBR (2007) performed a spawner capacity estimate for the Cle Elum River, a tributary of the Yakima
River in central Washington. Authors estimated number of redds, based on redd size, for a given habitat
area, then applied an assumed number of spawners per redd. Their literature review suggested that the
minimum area required for a Sockeye Salmon redd is 1.75 m2, and that a female territory averages about
3.7 m2 when in competition with other females (Bocking and Gaboury 2003; Burner 1951). With a sex
ratio of 1 male per female and assuming Sockeye would utilize between 25%-75% of potential habitat
available in the Sanpoil, these redd areas result in a spawner abundance potential of 34,066 to 216,078
(Table 5-11).
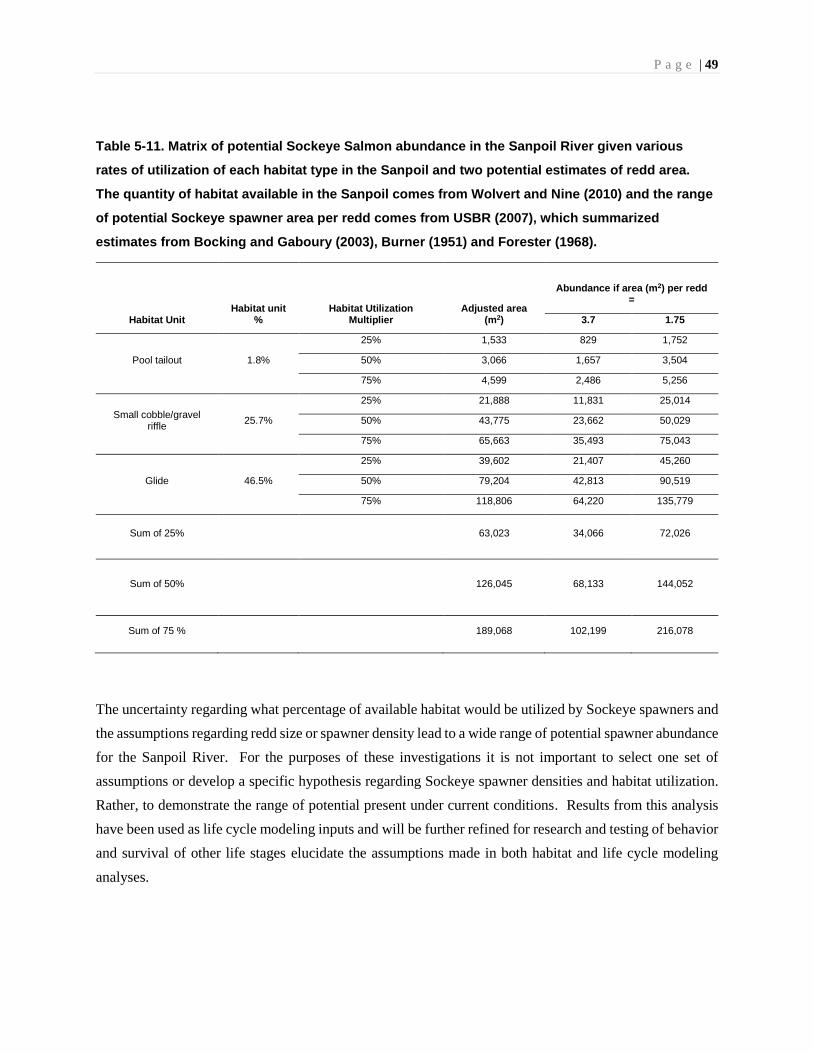
P a g e | 49
Table 5-11. Matrix of potential Sockeye Salmon abundance in the Sanpoil River given various
rates of utilization of each habitat type in the Sanpoil and two potential estimates of redd area.
The quantity of habitat available in the Sanpoil comes from Wolvert and Nine (2010) and the range
of potential Sockeye spawner area per redd comes from USBR (2007), which summarized
estimates from Bocking and Gaboury (2003), Burner (1951) and Forester (1968).
Habitat Unit Habitat unit
% Habitat Utilization
Multiplier Adjusted area
(m2)
Abundance if area (m2) per redd =
3.7 1.75
Pool tailout 1.8%
25% 1,533 829 1,752
50% 3,066 1,657 3,504
75% 4,599 2,486 5,256
Small cobble/gravel riffle
25.7%
25% 21,888 11,831 25,014
50% 43,775 23,662 50,029
75% 65,663 35,493 75,043
Glide 46.5%
25% 39,602 21,407 45,260
50% 79,204 42,813 90,519
75% 118,806 64,220 135,779
Sum of 25% 63,023 34,066 72,026
Sum of 50% 126,045 68,133 144,052
Sum of 75 % 189,068 102,199 216,078
The uncertainty regarding what percentage of available habitat would be utilized by Sockeye spawners and
the assumptions regarding redd size or spawner density lead to a wide range of potential spawner abundance
for the Sanpoil River. For the purposes of these investigations it is not important to select one set of
assumptions or develop a specific hypothesis regarding Sockeye spawner densities and habitat utilization.
Rather, to demonstrate the range of potential present under current conditions. Results from this analysis
have been used as life cycle modeling inputs and will be further refined for research and testing of behavior
and survival of other life stages elucidate the assumptions made in both habitat and life cycle modeling
analyses.
P a g e | 50
5.7 SOCKEYE SALMON REARING CAPACITY OF LAKE ROOSEVELT
An assessment of limnological characteristics in Lake Roosevelt was used to determine potential rearing
capacity for Sockeye Salmon reintroduced to the blocked area of the upper Columbia River. Reservoir
production or capacity has been calculated for anadromous species on a multitude of waterbodies for a
variety of purposes. Limnological-based techniques have been integral components of anadromous
reintroduction feasibility assessments (e.g., Ackerman et al. 2002, Bocking and Gaboury 2003, Gaboury
and Bocking 2004, Bussanich and Bocking 2006, USBR 2007a, USBR 2007b, Sorel 2017).
The STI Lake Roosevelt Fisheries Evaluation Program (LRFEP; BPA Project No. 1994-043-00) has been
collecting limnological data for Lake Roosevelt since 1988. The 152-mile-long reservoir is annually
surveyed across five reaches (Lower, Middle, and Upper mainstem Columbia, Spokane Arm and Sanpoil
Arm) during the productive season (May through October). Based on the types and continuity of data
available for Lake Roosevelt, the Euphotic Volume (EV) model was used to estimate Sockeye Salmon
smolt rearing capacity (Hume et al 1996). This model has been used in other anadromous reintroduction
feasibility evaluations in the Willamette, Yakima, and Fraser River watersheds (Bocking and Gaboury
2003, Gaboury and Bocking 2004, Bussanich and Bocking 2006, BOR 2007a, BOR 2007b, Sorel 2017).
Euphotic volume for Lake Roosevelt was calculated as:
𝐸𝑉 = 𝐸𝑍𝐷𝑡(𝑚) × 𝑆𝐴𝑡 (𝑘𝑚2)
Where: EZD = Euphotic Zone Depth at time t; and SA = Surface Area at time t
Euphotic zone depth is defined as the portion of the water column extending from the surface to the depth
where one percent of ambient light penetrates (Schindler 1971). It approximates depths where nearly all
primary production occurs in typical freshwater systems. Applying these depths to the surface area of the
lake or reservoir approximates the productive volume, in EV units, of waterbody as a whole. Assumptions
on how many smolts an EV unit can support are then used to estimate capacity of the reservoir.
Euphotic zone depths were calculated for May, July, and October for all years from 1997 through 2006.
These months coincide with the early, middle, and late periods within the productive season; they also align
with annual hydro-operations events: flood control maximum drawdown, full pool upon refill, and full pool
following late-season drawdown. Reservoir-wide mean EZD for each month was multiplied by the
corresponding surface area to determine the EV for each month and year. The 10-year mean EV for each
month was then used to determine Sockeye smolt rearing capacity.
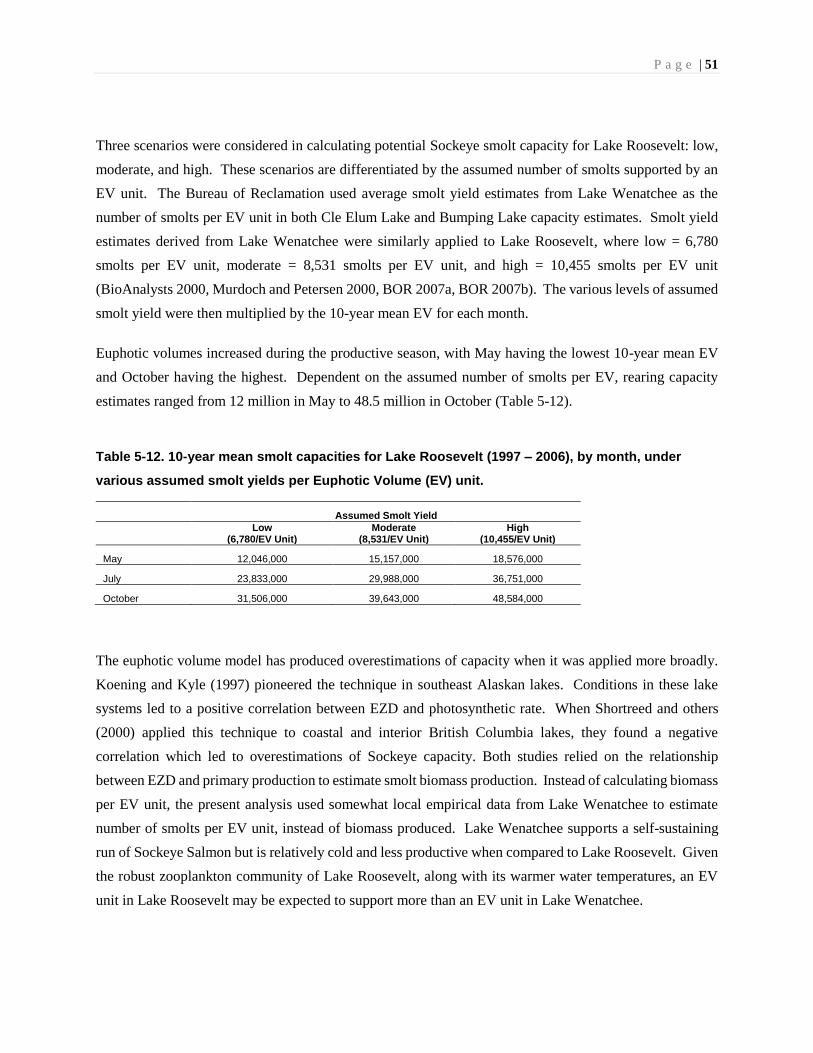
P a g e | 51
Three scenarios were considered in calculating potential Sockeye smolt capacity for Lake Roosevelt: low,
moderate, and high. These scenarios are differentiated by the assumed number of smolts supported by an
EV unit. The Bureau of Reclamation used average smolt yield estimates from Lake Wenatchee as the
number of smolts per EV unit in both Cle Elum Lake and Bumping Lake capacity estimates. Smolt yield
estimates derived from Lake Wenatchee were similarly applied to Lake Roosevelt, where low = 6,780
smolts per EV unit, moderate = 8,531 smolts per EV unit, and high = 10,455 smolts per EV unit
(BioAnalysts 2000, Murdoch and Petersen 2000, BOR 2007a, BOR 2007b). The various levels of assumed
smolt yield were then multiplied by the 10-year mean EV for each month.
Euphotic volumes increased during the productive season, with May having the lowest 10-year mean EV
and October having the highest. Dependent on the assumed number of smolts per EV, rearing capacity
estimates ranged from 12 million in May to 48.5 million in October (Table 5-12).
Table 5-12. 10-year mean smolt capacities for Lake Roosevelt (1997 – 2006), by month, under
various assumed smolt yields per Euphotic Volume (EV) unit.
Assumed Smolt Yield
Low (6,780/EV Unit)
Moderate (8,531/EV Unit)
High (10,455/EV Unit)
May 12,046,000 15,157,000 18,576,000
July 23,833,000 29,988,000 36,751,000
October 31,506,000 39,643,000 48,584,000
The euphotic volume model has produced overestimations of capacity when it was applied more broadly.
Koening and Kyle (1997) pioneered the technique in southeast Alaskan lakes. Conditions in these lake
systems led to a positive correlation between EZD and photosynthetic rate. When Shortreed and others
(2000) applied this technique to coastal and interior British Columbia lakes, they found a negative
correlation which led to overestimations of Sockeye capacity. Both studies relied on the relationship
between EZD and primary production to estimate smolt biomass production. Instead of calculating biomass
per EV unit, the present analysis used somewhat local empirical data from Lake Wenatchee to estimate
number of smolts per EV unit, instead of biomass produced. Lake Wenatchee supports a self-sustaining
run of Sockeye Salmon but is relatively cold and less productive when compared to Lake Roosevelt. Given
the robust zooplankton community of Lake Roosevelt, along with its warmer water temperatures, an EV
unit in Lake Roosevelt may be expected to support more than an EV unit in Lake Wenatchee.

P a g e | 52
Despite limitations of the EV model and unique characteristics of lake and reservoir systems, previous
reintroduction efforts have used EV as fundamental information necessary to evaluate the feasibility of
reintroducing anadromous species to reservoirs. Estimates generated in the present analysis provide
evidence of substantial capacity within Lake Roosevelt to support reintroduced Sockeye.

P a g e | 53
5.8 CLIMATE CHANGE
Climate change is identified as one of the major threats to salmon, steelhead, Pacific Lamprey and other
aquatic resources in the Columbia River basin. Efforts to assess and provide adaptation to future climate
change are a major current focus for tribes and other managers of aquatic resources in the region.
The best available scientific information from updated global circulation models forecast substantial
climate-driven changes to Columbia basin hydrology, as well as increased air and stream temperatures. By
the end of this century summer air temperatures could on average increase by more than 10 degrees
Fahrenheit (Rupp 2017). Increasing summer and winter temperature is expected to change snow-rain
transient areas over most of the U.S. portion of the Columbia River basin to rain dominated systems. This
portion of the basin will experience higher winter and summer stream temperatures and more frequent
droughts that will stress native aquatic biota and result in increased salmon adult and juvenile mortality as
evidenced by loss of thousands of adult Sockeye in 2015 caused by low flows and warm river temperatures
(FPC 2016).
In the Canadian portion of the basin, although there will be a substantial reduction in glacier size, the area
will remain for the most part snow/transition-dominated (Figure 5-7). Therefore, stream temperature and
river flows in this portion of the basin are expected to provide more suitable habitat for salmonids than most
of the subbasins located below Chief Joseph Dam.
The reintroduction of salmon to areas upstream of Chief Joseph Dam and Grand Coulee Dam will allow
fish access to habitat that will be the most resilient to climate change effects expected over the next 80
years. Beginning the reintroduction process now provides enough lead time to conduct needed research,
build and test fish passage facilities and develop donor stocks prior to the onset of substantial climate change
effects on salmon habitat.
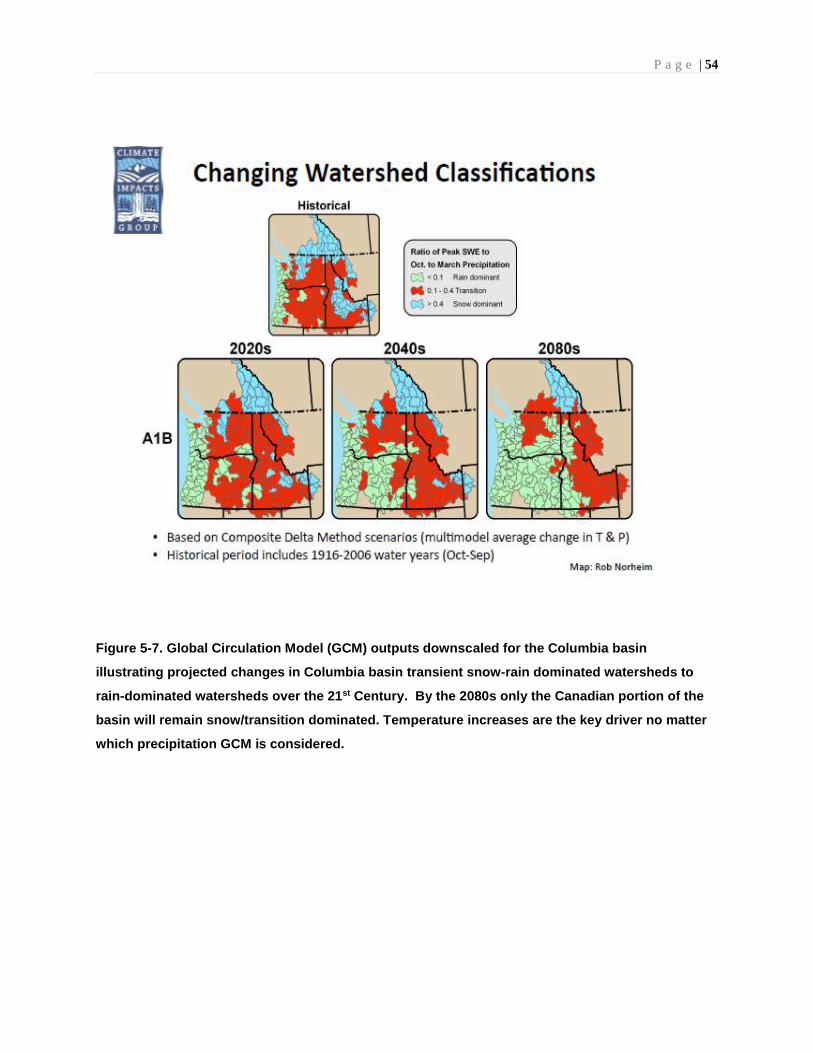
P a g e | 54
Figure 5-7. Global Circulation Model (GCM) outputs downscaled for the Columbia basin
illustrating projected changes in Columbia basin transient snow-rain dominated watersheds to
rain-dominated watersheds over the 21st Century. By the 2080s only the Canadian portion of the
basin will remain snow/transition dominated. Temperature increases are the key driver no matter
which precipitation GCM is considered.
P a g e | 55
5.9 REFERENCES
Ackerman, N. K., Cramer, S. P., and J. R. Carlson. 2002. Estimation of Production Potential for
Anadromous Salmonids above Keechelus Dam in the Yakima Basin. Prepared for Yakima Basin Joint
Board. Yakima, WA.
Baldwin, C., and B. Bellgraph. 2017. Untitled Technical Memorandum. Update to Hanrahan et al. (2004)
Chinook spawning habitat assessment in Rufus Woods Reservoir.
Baldwin, C. 2018. Unpublished Data. Assessment of Sockeye spawning habitat within the Sanpoil
Subbasin.
BioAnalysts, Inc. 2000. Potential Sockeye Smolt Yield from Lake Chelan. Prepared for Public Utility
District No. 1 of Chelan County, Wenatchee, WA.
Bocking, R.C. and M.N. Gaboury. 2003. Feasibility of reintroducing Sockeye and other species of pacific
salmon in the Coquitlam Reservoir BC. Prepared for the BC Hydro Bridge Coastal Fish and Wildlife
Restoration program. BCRP Report 04.Co.03. LGL Limited. 105p.
Bocking, R.C. and Gaboury, M.N., 2004. Feasibility of reintroducing Sockeye and other species of Pacific
salmon in the Alouette Reservoir, BC. Prepared for Alouette River Management River Society
Bureau of Reclamation (BOR). 2007a. Assessment of Sockeye Salmon Production Potential in the Cle
Elum River Basin, Storage Dam Fish Passage Study, Yakima Project, Washington, Technical Series No.
PN-YDFP-008, Bureau of Reclamation, Boise, Idaho, March 2007.
BOR. 2007b. Assessment of Sockeye Salmon Production Potential in the Bumping River Basin, Storage
Dam Fish Passage Study, Yakima Project, Washington, Technical Series No. PN-YDFP-010, Bureau of
Reclamation, Boise, Idaho, March 2007.
Bussanich, R., Bocking, R., Field, K., Nordin, R., Banner-Martin, K., Perga, M. and Mazumder, A., 2006.
Assessment of rearing capacity for consideration of reintroducing Sockeye Salmon to the Coquitlam
reservoir. BCRP Report No. #05.Co.13. July 2006.
Burner, C. 1951. Characteristics of Spawning nests of Columbia River Salmon. U.S. Fish and Wildlife
Service Fishery Bulletin 52(61): 97-110.
Chapman, D.W., 1986. Salmon and steelhead abundance in the Columbia River in the nineteenth
P a g e | 56
century. Transactions of the American Fisheries Society, 115(5), pp.662-670.
Garavelli, Bellgraph, Baldwin, Haque, Howell, McLellan, Perkins (in prep) Estimated Chinook Salmon
spawning habitat in the Columbia River upstream of Grand Coulee Dam (Washington, U.S.). Pacific
Northwest National Laboratory. Richland, Washington.
Geist, D.R., Dauble, D.D., and Visser, R.H. 1997. The development of a spawning habitat model to aid in
recovery plans for Snake River fall Chinook salmon. Fiscal year 1995 and 1996 progress report. Bonneville
Power Administration, Portland, Oreg.
Geist, D.R., C.J. Murray, T.P. Hanrahan, and Y. Xie. 2008. A model of the effects of flow fluctuations on
fall Chinook salmon spawning habitat availability in the Columbia River. North American Journal of
Fisheries Management 28:1911–1927.
Giorgi, C. and A. Kain. 2018. Lake Roosevelt Sockeye Salmon Rearing Capacity. Spokane Tribal
Fisheries, Wellpinit, WA. March 2018.
Giorgi, C. 2018. Identification of Potential Habitats for Blocked Area Reintroduction. Prepared for Bureau
of Reclamation, Agreement No. R16AP00169. June 2018.
Golder Associates. 2016. Chinook Salmon Spawning Habitat Availability in the Lower Columbia River.
Report No. 1538622-001-R-Rev0. Prepared for Canadian Columbia River Inter-Tribal Fisheries
Commission, Cranbrook, BC. April 2016.
Golder Associates. 2017. Chinook Salmon Spawning Habitat Availability in the Lower Columbia River,
Year 2. Report No. 1659612-001-R-Rev0. Prepared for Canadian Columbia River Inter-Tribal Fisheries
Commission, Cranbrook, BC. March 2017
Hanrahan, T. P., Dauble, D. D., and D. R. Geist. 2004. An estimate of chinook salmon (Oncorhynchus
tshawytscha) spawning habitat and redd capacity upstream of a migration barrier in the upper Columbia
River. Canadian Journal of Fisheries and Aquatic Science. 61: 23-33.
Hillman, T., M. Miller, M. Johnson, C. Moran, J. Williams, M. Tonseth, C. Willard, S. Hopkins, B. Ishida,
C. Kamphaus, T. Pearsons, and P. Graf. 2016. Monitoring and evaluation of the Chelan and Grant County
PUDs hatchery programs: 2015 annual report. Report to the HCP and PRCC Hatchery Committees,
Wenatchee and Ephrata, WA.

P a g e | 57
Hyatt, K.D. and D.P. Rankin. 1999. A Habitat Based Evaluation of Okanagan Sockeye Salmon Escapement
Objectives. Department of Fisheries and Oceans, Canada. ISSN 1480-4883. Nanaimo, British Columbia.
K. Hyatt, personal communication
ICF. 2017. Anadromous Reintroduction Potential for the Sanpoil River and Select Upper Columbia
Tributaries on the Colville Reservation using the Ecosystem Diagnosis and Treatment model. September.
ICF 00392.17 Seattle, WA. Prepared for Confederated Tribes of the Colville Reservation, Spokane, WA.
ICF. 2018. Anadromous Reintroduction Potential for the Spokane River and Select Lake Roosevelt
Tributaries Using the Ecosystem Diagnosis and Treatment Model. Final version. April. ICF 00281.17
Seattle, WA. Prepared for Spokane Tribe of Indians, Wellpinit, WA.
ICTRT (Interior Columbia Technical Recovery Team). 2005. Updated population delineation in the interior
Columbia Basin. Memorandum. May 11, 2005.
ICTRT. 2006. Appendix C: Interior Columbia Basin Stream Type Chinook Salmon and Steelhead
Populations: Habitat Intrinsic Potential Analysis, in Viability Criteria for Application to Interior Columbia
Basin Salmonid ESUs. March 16, 2006.
ICTRT. 2007. Role of large extirpated areas in recovery. Memorandum. January 8, 2007. Attachment 1 in
Viability Criteria for Application to Interior Columbia Basin Salmonid ESUs. January 8, 2007.
Murdoch, A. and K. Petersen. 2000. Survival of Sockeye, spring chinook, and summer chinook salmon
released from Rock Island Fish Hatchery complex facilities. Washington Dept. of Fish and Wildlife.
Olympia, WA.
Perkins, W.A., Richmond, M.C. 2007a. “MASS2, Modular Aquatic Simulation System in Two
Dimensions, Theory and Numerical Methods.” PNNL-14820-1. Richland, Washington: Pacific Northwest
National Laboratory.
Perkins, W.A., Richmond, M.C. 2007b. “MASS2, Modular Aquatic Simulation System in Two
Dimensions, User Guide and Reference.” PNNL-14820-2. Richland, Washington 99352: Pacific Northwest
National Laboratory.

P a g e | 58
Rupp, D.E. 2017. Comparison graphs showing precipitation and air temperature increases for the average
of 10 global climate models downscaled for the Pacific Northwest projected for the 2030-2050’s. Presented
by the UW Computational Hydrology Group at the December 8, 2017 RMJOC II Meeting.
Schindler, D.W., Armstrong, F.A.G., Holmgren, S.K. and Brunskill, G.J. 1971. Eutrophication of Lake 227,
Experimental Lakes Area, northwestern Ontario, by addition of phosphate and nitrate. Can. J. Fish. Aquat.
Sci. 28: 1763-1782.
Visser, R. H. 2000. Using remotely sensed imagery and GIS to monitor and research salmon spawning: a
case study of the Hanford Reach fall chinook (Oncorhynchus tshawytscha). Pacific Northwest National
Laboratory, Richland, Wash.
Wolvert and Nine. 2009. Chief Joseph Kokanee Enhancement Project, 2009 Annual Progress Report
(Technical), Mainstem Sanpoil Habitat Surveys. BPA Project Number 9501100. Confederated Tribes of
the Colville Reservation, Nespelem, Washington.
P a g e | 59
6.0 LIFE-CYCLE MODELING
6.1 INTRODUCTION
The UCUT contracted with DJ Warren and Associates to build a reconnaissance-level, life cycle model
(LCM). The LCM is designed to help managers determine whether conservation and harvest goals can be
met for each species in various geographic areas by providing estimates of escapement and harvest, given
best available scientific information and an initial set of assumptions regarding release numbers, survival,
habitat productivity and hatchery releases. For example, the LCM may be used to compare the outcomes
of different management strategies and sets of assumptions (e.g., different numbers of hatchery releases or
different fish passage options). The assumptions and modeling scenarios are not intended as recommended
management targets (e.g., hatchery release numbers), rather, it is a starting point to evaluate potential
outcomes given an initial set of model inputs.
The LCM was developed to help managers answer key management questions such as:
• What role can hatchery releases play in starting and sustaining the reintroduced population?
• What role can translocation of adult salmon play in starting and sustaining the reintroduced
population?
• What might be the adult spawning escapement and harvest benefits from such reintroduction
efforts?
• What are the key assumptions and research needs?
The LCM was built in EXCEL and can be run in real-time in technical and policy settings
(www.UCUT.org) This feature was deemed important as it allows managers the ability to change inputs
and see results immediately thus facilitating discussion and reducing concerns over “selected values.”
P a g e | 60
Specifically, the LCM produces estimates of the following parameters (Table 6-1):
• Spring migrant (fry/subyearling), fall migrant (age-0), yearling migrant (age-1) and Age 2+ migrant
abundance.
• Adult run-size before and after harvest, adults arriving at Chief Joseph dam and escapement to
spawning grounds.
• Numbers of juveniles (natural and hatchery) successfully migrating below Chief Joseph Dam.
• Number of fish harvested in marine and freshwater fisheries, including new fisheries upstream of
Chief Joseph Dam.
• Smolt-to-adult survival rate.
• pHOS, PNI and pNOB.
UCUT hosted an Ad Hoc Modeling Group of U.S. and Canadian biologists to populate the model with
required LCM input data (Table 6-2). The LCM was used to evaluate baseline scenarios, variations of those
baseline scenarios, and perform sensitivity analyses on model input using a Monte Carlo approach. For
each scenario and species, the Group created a Parameter Document Sheet with all model inputs, the source
of those inputs and any relevant notes (www.UCUT.org). These sheets are working documents that will be
updated over time as new information is collected as part of possible future research downstream and
upstream of Chief Joseph Dam.
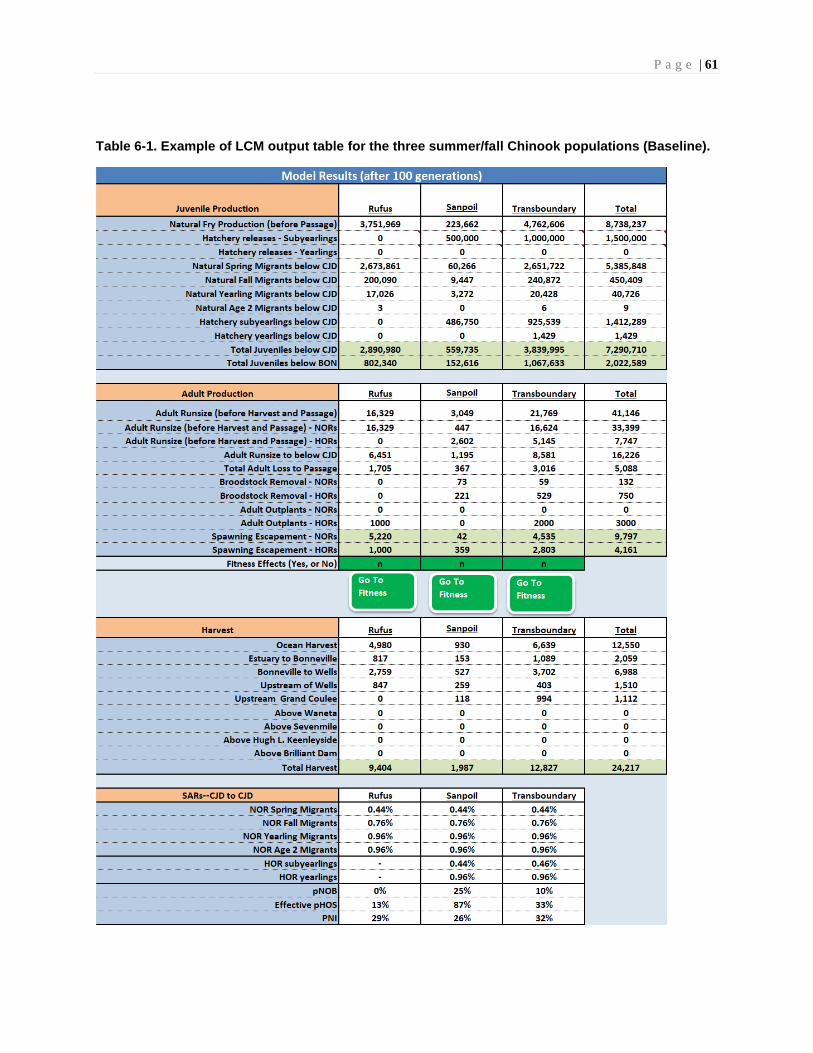
P a g e | 61
Table 6-1. Example of LCM output table for the three summer/fall Chinook populations (Baseline).
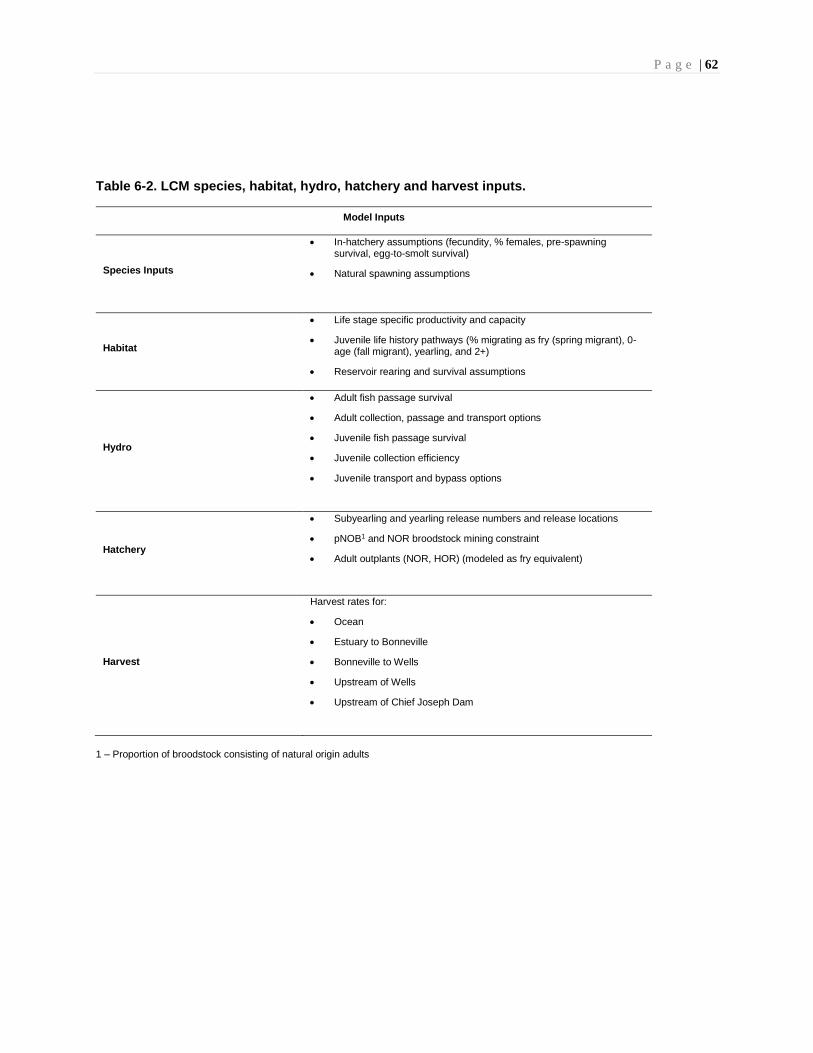
P a g e | 62
Table 6-2. LCM species, habitat, hydro, hatchery and harvest inputs.
Model Inputs
Species Inputs
• In-hatchery assumptions (fecundity, % females, pre-spawning survival, egg-to-smolt survival)
• Natural spawning assumptions
Habitat
• Life stage specific productivity and capacity
• Juvenile life history pathways (% migrating as fry (spring migrant), 0-age (fall migrant), yearling, and 2+)
• Reservoir rearing and survival assumptions
Hydro
• Adult fish passage survival
• Adult collection, passage and transport options
• Juvenile fish passage survival
• Juvenile collection efficiency
• Juvenile transport and bypass options
Hatchery
• Subyearling and yearling release numbers and release locations
• pNOB1 and NOR broodstock mining constraint
• Adult outplants (NOR, HOR) (modeled as fry equivalent)
Harvest
Harvest rates for:
• Ocean
• Estuary to Bonneville
• Bonneville to Wells
• Upstream of Wells
• Upstream of Chief Joseph Dam
1 – Proportion of broodstock consisting of natural origin adults
P a g e | 63
In general, LCM inputs were based on scientific literature on fish populations residing below Chief Joseph
dam, FCRPS juvenile and adult survival and passage studies, results of surface collector research conducted
in the region, and habitat evaluations conducted specifically for this analysis (See Habitat section).
The LCM was used to evaluate fish performance in three geographic areas (referred to as populations) for
summer/fall Chinook and Sockeye. These populations are specific to habitats that are immediately
accessible from Rufus Woods Lake and Lake Roosevelt including habitats in Canada. These Canadian
habitats were included to most accurately reflect the potential of the region barring further intervention once
passage at GCD is facilitated. Although habitat modeling was performed for the Spokane River and its
tributaries, the Spokane Subbasin was not included in the LCM. Multiple hydroelectric projects on the
Spokane River complicate its inclusion into the model as it’s currently configured. Plans to include the
Spokane into the LCM are being developed at present.
The summer/fall Chinook populations modeled are:
1. Rufus Woods Lake – (Chief Joseph Dam to Grand Coulee Dam).
2. Sanpoil River – (Lake Roosevelt, Sanpoil River, Kettle River and other small tributaries).
3. Mainstem Columbia River upstream of Lake Roosevelt to Hugh L. Keenlyside Dam in British
Columbia (i.e., Transboundary Reach).
The Sockeye populations modeled are:
1. Sanpoil River.
2. Christina Lake (in British Columbia, contributing to the Kettle River).
3. Mainstem Columbia River upstream of Lake Roosevelt to Hugh L. Keenlyside Dam in British
Columbia (i.e., Transboundary Reach).
The amount of habitat in each of these areas by species, and how it was derived, is presented in the Habitat
Assessments section of this report.
The LCM was run to evaluate the Baseline scenario and variants of the Baseline for each species (Tables
6-3 to 6-5). The Baseline represents the combination of fish passage facilities, hatchery production and
other reintroduction actions the AD Hoc Modeling Group identified as a starting point to achieve identified
goals given current knowledge. The variants explore how reintroduction outcomes differ with the

P a g e | 64
elimination of some juvenile passage facilities and change in hatchery production or life stage released.
Model run results are described in more detail in working memos provided at (www.UCUT.org) and
summarized below. The variants also provide insights into the possible sequencing of fish passage facilities
and propagation actions to optimize benefits and costs.
Table 6-3. Baseline scenario and variants modeled for summer/fall Chinook reintroduction to Chief
Joseph Dam (Rufus Woods Lake) Only.
Scenario/Variant Description
Chief Joseph Baseline Scenario– FSC and 1,000 HOR Adults
This option assumes adult fish passage at Chief Joseph Dam and a floating surface collector (FSC) to collect and pass juvenile fish from Rufus Woods Lake to tailrace of Chief Joseph Dam. The FSC would be located at the powerhouse and may use exclusion nets linking the FSC to the dam and left bank. The modeled reintroduction program assumes the annual release of 1,000 hatchery-origin summer/fall Chinook adults and no other artificial propagation programs. Ocean and river fisheries would continue as currently managed, with an added salmon fishery in Rufus Woods Lake.
Escaping fish would spawn in identified habitat in the upper reaches of Rufus Woods Lake. Emerging fry would rear in the reservoir with emigrants passing via the FSC or powerhouse/spillway primarily as sub-yearlings in the spring and early summer, and a much lessor number in the fall and as yearlings the following spring.
Chief Joseph Variant #1 – No FSC at Chief Joseph Dam, 1,000 HOR Adults
This option is the same as the Baseline Scenario except there is no FSC facility. Emigrating juvenile fish would pass via the spillway or powerhouse. This variant, when compared to the Baseline, indicates the potential benefit of an FSC facility on anadromous fish runs and harvest. This variant also shows the potential effects of a pilot reintroduction that would be conducted prior to installation of any juvenile fish passage facility.
Chief Joseph Variant #2 – FSC, 1,000 HOR adults and 500,000 Pen-reared juveniles
This option is the same as the Baseline Scenario except that it includes artificial propagation of 500,000 pen-reared summer/fall Chinook juveniles to be released in Rufus Woods Lake.
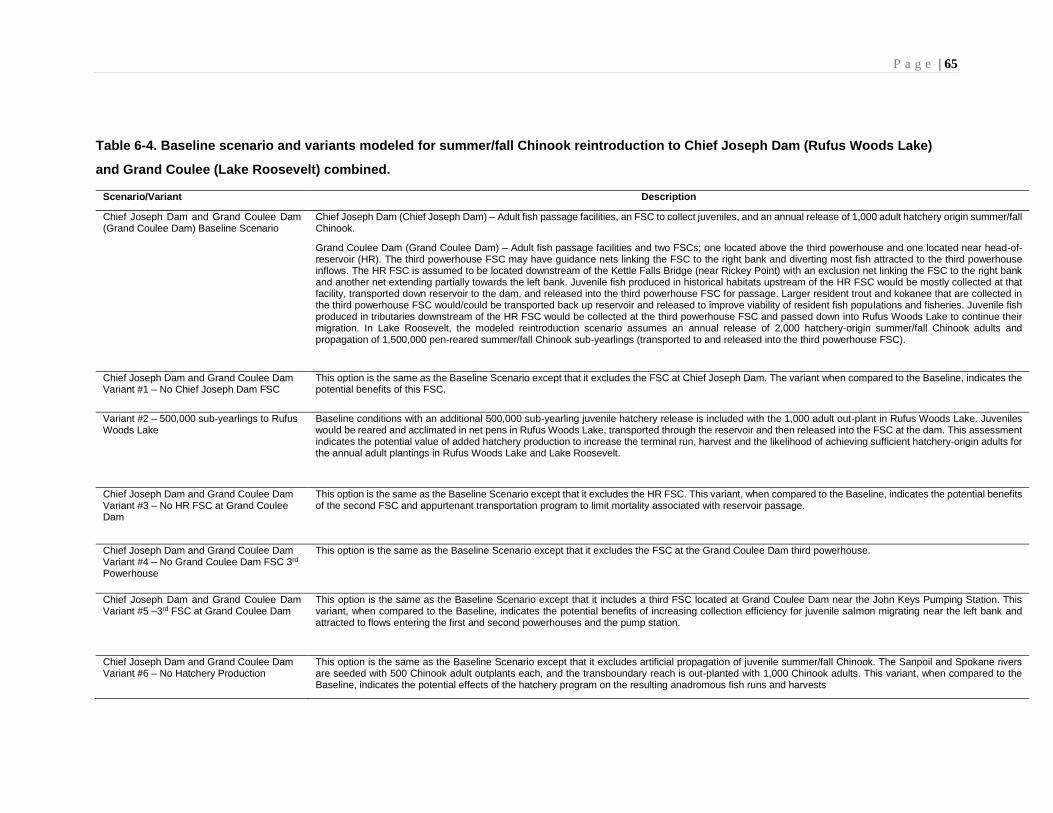
P a g e | 65
Table 6-4. Baseline scenario and variants modeled for summer/fall Chinook reintroduction to Chief Joseph Dam (Rufus Woods Lake)
and Grand Coulee (Lake Roosevelt) combined.
Scenario/Variant Description
Chief Joseph Dam and Grand Coulee Dam (Grand Coulee Dam) Baseline Scenario
Chief Joseph Dam (Chief Joseph Dam) – Adult fish passage facilities, an FSC to collect juveniles, and an annual release of 1,000 adult hatchery origin summer/fall Chinook.
Grand Coulee Dam (Grand Coulee Dam) – Adult fish passage facilities and two FSCs; one located above the third powerhouse and one located near head-of-reservoir (HR). The third powerhouse FSC may have guidance nets linking the FSC to the right bank and diverting most fish attracted to the third powerhouse inflows. The HR FSC is assumed to be located downstream of the Kettle Falls Bridge (near Rickey Point) with an exclusion net linking the FSC to the right bank and another net extending partially towards the left bank. Juvenile fish produced in historical habitats upstream of the HR FSC would be mostly collected at that facility, transported down reservoir to the dam, and released into the third powerhouse FSC for passage. Larger resident trout and kokanee that are collected in the third powerhouse FSC would/could be transported back up reservoir and released to improve viability of resident fish populations and fisheries. Juvenile fish produced in tributaries downstream of the HR FSC would be collected at the third powerhouse FSC and passed down into Rufus Woods Lake to continue their migration. In Lake Roosevelt, the modeled reintroduction scenario assumes an annual release of 2,000 hatchery-origin summer/fall Chinook adults and propagation of 1,500,000 pen-reared summer/fall Chinook sub-yearlings (transported to and released into the third powerhouse FSC).
Chief Joseph Dam and Grand Coulee Dam Variant #1 – No Chief Joseph Dam FSC
This option is the same as the Baseline Scenario except that it excludes the FSC at Chief Joseph Dam. The variant when compared to the Baseline, indicates the potential benefits of this FSC.
Variant #2 – 500,000 sub-yearlings to Rufus Woods Lake
Baseline conditions with an additional 500,000 sub-yearling juvenile hatchery release is included with the 1,000 adult out-plant in Rufus Woods Lake. Juveniles would be reared and acclimated in net pens in Rufus Woods Lake, transported through the reservoir and then released into the FSC at the dam. This assessment indicates the potential value of added hatchery production to increase the terminal run, harvest and the likelihood of achieving sufficient hatchery-origin adults for the annual adult plantings in Rufus Woods Lake and Lake Roosevelt.
Chief Joseph Dam and Grand Coulee Dam Variant #3 – No HR FSC at Grand Coulee Dam
This option is the same as the Baseline Scenario except that it excludes the HR FSC. This variant, when compared to the Baseline, indicates the potential benefits of the second FSC and appurtenant transportation program to limit mortality associated with reservoir passage.
Chief Joseph Dam and Grand Coulee Dam Variant #4 – No Grand Coulee Dam FSC 3rd Powerhouse
This option is the same as the Baseline Scenario except that it excludes the FSC at the Grand Coulee Dam third powerhouse.
Chief Joseph Dam and Grand Coulee Dam Variant #5 –3rd FSC at Grand Coulee Dam
This option is the same as the Baseline Scenario except that it includes a third FSC located at Grand Coulee Dam near the John Keys Pumping Station. This variant, when compared to the Baseline, indicates the potential benefits of increasing collection efficiency for juvenile salmon migrating near the left bank and attracted to flows entering the first and second powerhouses and the pump station.
Chief Joseph Dam and Grand Coulee Dam Variant #6 – No Hatchery Production
This option is the same as the Baseline Scenario except that it excludes artificial propagation of juvenile summer/fall Chinook. The Sanpoil and Spokane rivers are seeded with 500 Chinook adult outplants each, and the transboundary reach is out-planted with 1,000 Chinook adults. This variant, when compared to the Baseline, indicates the potential effects of the hatchery program on the resulting anadromous fish runs and harvests
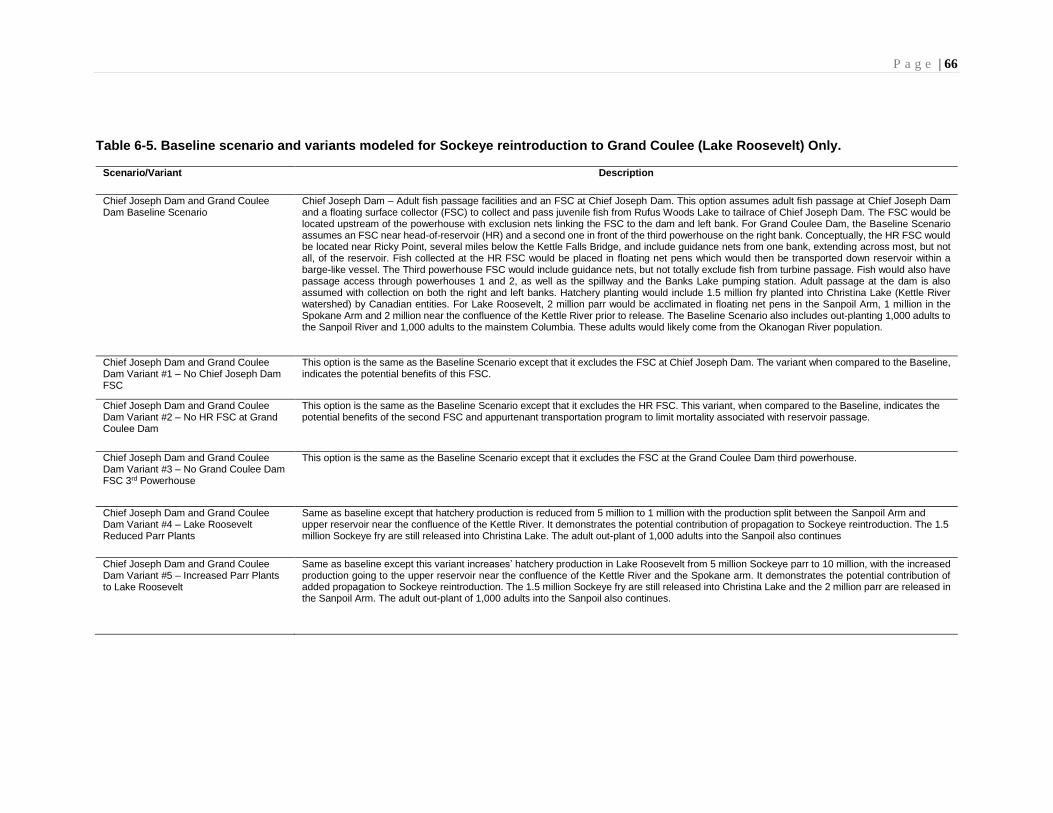
P a g e | 66
Table 6-5. Baseline scenario and variants modeled for Sockeye reintroduction to Grand Coulee (Lake Roosevelt) Only.
Scenario/Variant Description
Chief Joseph Dam and Grand Coulee Dam Baseline Scenario
Chief Joseph Dam – Adult fish passage facilities and an FSC at Chief Joseph Dam. This option assumes adult fish passage at Chief Joseph Dam and a floating surface collector (FSC) to collect and pass juvenile fish from Rufus Woods Lake to tailrace of Chief Joseph Dam. The FSC would be located upstream of the powerhouse with exclusion nets linking the FSC to the dam and left bank. For Grand Coulee Dam, the Baseline Scenario assumes an FSC near head-of-reservoir (HR) and a second one in front of the third powerhouse on the right bank. Conceptually, the HR FSC would be located near Ricky Point, several miles below the Kettle Falls Bridge, and include guidance nets from one bank, extending across most, but not all, of the reservoir. Fish collected at the HR FSC would be placed in floating net pens which would then be transported down reservoir within a barge-like vessel. The Third powerhouse FSC would include guidance nets, but not totally exclude fish from turbine passage. Fish would also have passage access through powerhouses 1 and 2, as well as the spillway and the Banks Lake pumping station. Adult passage at the dam is also assumed with collection on both the right and left banks. Hatchery planting would include 1.5 million fry planted into Christina Lake (Kettle River watershed) by Canadian entities. For Lake Roosevelt, 2 million parr would be acclimated in floating net pens in the Sanpoil Arm, 1 million in the Spokane Arm and 2 million near the confluence of the Kettle River prior to release. The Baseline Scenario also includes out-planting 1,000 adults to the Sanpoil River and 1,000 adults to the mainstem Columbia. These adults would likely come from the Okanogan River population.
Chief Joseph Dam and Grand Coulee Dam Variant #1 – No Chief Joseph Dam FSC
This option is the same as the Baseline Scenario except that it excludes the FSC at Chief Joseph Dam. The variant when compared to the Baseline, indicates the potential benefits of this FSC.
Chief Joseph Dam and Grand Coulee Dam Variant #2 – No HR FSC at Grand Coulee Dam
This option is the same as the Baseline Scenario except that it excludes the HR FSC. This variant, when compared to the Baseline, indicates the potential benefits of the second FSC and appurtenant transportation program to limit mortality associated with reservoir passage.
Chief Joseph Dam and Grand Coulee Dam Variant #3 – No Grand Coulee Dam FSC 3rd Powerhouse
This option is the same as the Baseline Scenario except that it excludes the FSC at the Grand Coulee Dam third powerhouse.
Chief Joseph Dam and Grand Coulee Dam Variant #4 – Lake Roosevelt Reduced Parr Plants
Same as baseline except that hatchery production is reduced from 5 million to 1 million with the production split between the Sanpoil Arm and upper reservoir near the confluence of the Kettle River. It demonstrates the potential contribution of propagation to Sockeye reintroduction. The 1.5 million Sockeye fry are still released into Christina Lake. The adult out-plant of 1,000 adults into the Sanpoil also continues
Chief Joseph Dam and Grand Coulee Dam Variant #5 – Increased Parr Plants to Lake Roosevelt
Same as baseline except this variant increases’ hatchery production in Lake Roosevelt from 5 million Sockeye parr to 10 million, with the increased production going to the upper reservoir near the confluence of the Kettle River and the Spokane arm. It demonstrates the potential contribution of added propagation to Sockeye reintroduction. The 1.5 million Sockeye fry are still released into Christina Lake and the 2 million parr are released in the Sanpoil Arm. The adult out-plant of 1,000 adults into the Sanpoil also continues.
P a g e | 67
6.2 OVERVIEW OF LCM
The LCM follows summer/fall Chinook and Sockeye through all life stages and tracks the number of natural
and hatchery-origin fish that survive from one life stage to the next, accounting for both natural sources of
mortality as well as mortality due to fish passage and harvest.
6.2.1 Natural Production
Survival of natural-origin fish and hatchery fish released into the river depends on:
• Quantity and quality of habitat used by the population.
• Fish passage survival in the Columbia mainstem.
• Estuarine and ocean survival conditions.
• Fitness of the natural population.
• Relative ability of hatchery fish to spawn and their progeny to survive.
The number of juveniles produced by naturally spawning adults is computed using the two parameter,
multi-stage B-H survival function (Beverton and Holt 1957; Mousalli and Hilborn 1986). The survival
function contains life stage-specific parameters for productivity (density-independent survival) and
capacity (maximum number of fish that can survive). Life stages include:
• Spawning.
• Incubation.
• Fry colonization.
• Fry to migration from the spawning reach (spring migrant, fall migrant, yearling migrant, or age 2
migrant).
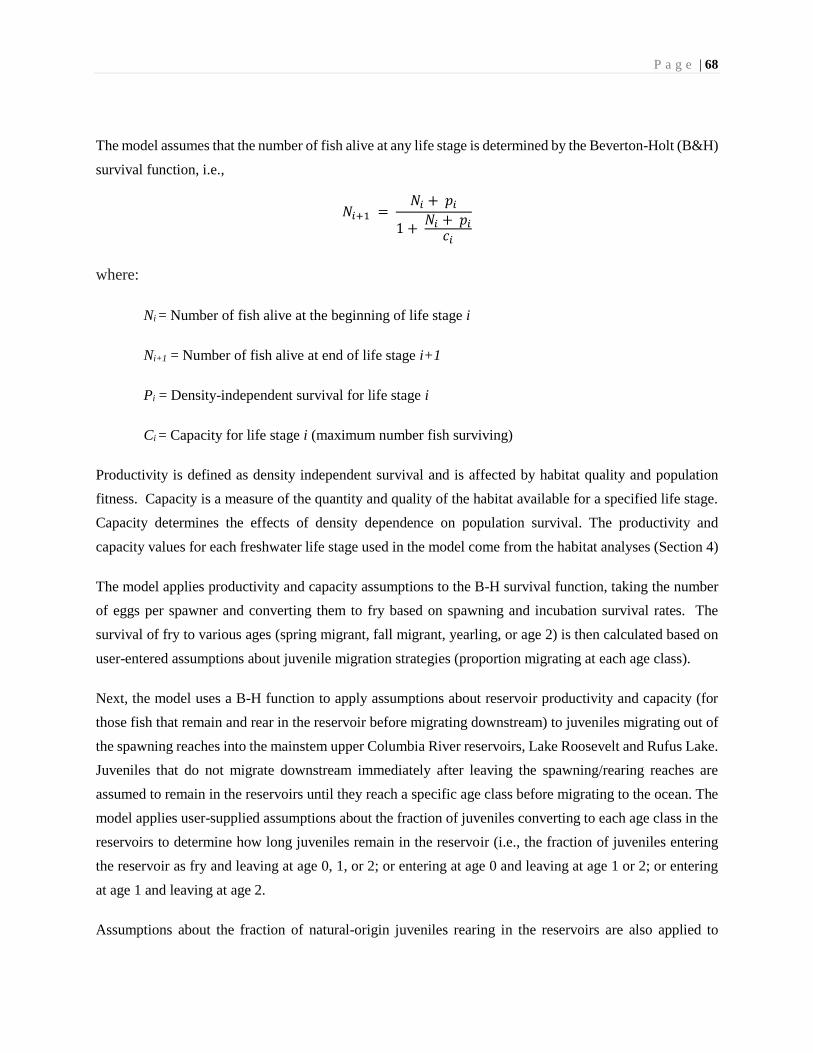
P a g e | 68
The model assumes that the number of fish alive at any life stage is determined by the Beverton-Holt (B&H)
survival function, i.e.,
𝑁𝑖+1 = 𝑁𝑖 + 𝑝𝑖
1 + 𝑁𝑖 + 𝑝𝑖
𝑐𝑖
where:
Ni = Number of fish alive at the beginning of life stage i
Ni+1 = Number of fish alive at end of life stage i+1
Pi = Density-independent survival for life stage i
Ci = Capacity for life stage i (maximum number fish surviving)
Productivity is defined as density independent survival and is affected by habitat quality and population
fitness. Capacity is a measure of the quantity and quality of the habitat available for a specified life stage.
Capacity determines the effects of density dependence on population survival. The productivity and
capacity values for each freshwater life stage used in the model come from the habitat analyses (Section 4)
The model applies productivity and capacity assumptions to the B-H survival function, taking the number
of eggs per spawner and converting them to fry based on spawning and incubation survival rates. The
survival of fry to various ages (spring migrant, fall migrant, yearling, or age 2) is then calculated based on
user-entered assumptions about juvenile migration strategies (proportion migrating at each age class).
Next, the model uses a B-H function to apply assumptions about reservoir productivity and capacity (for
those fish that remain and rear in the reservoir before migrating downstream) to juveniles migrating out of
the spawning reaches into the mainstem upper Columbia River reservoirs, Lake Roosevelt and Rufus Lake.
Juveniles that do not migrate downstream immediately after leaving the spawning/rearing reaches are
assumed to remain in the reservoirs until they reach a specific age class before migrating to the ocean. The
model applies user-supplied assumptions about the fraction of juveniles converting to each age class in the
reservoirs to determine how long juveniles remain in the reservoir (i.e., the fraction of juveniles entering
the reservoir as fry and leaving at age 0, 1, or 2; or entering at age 0 and leaving at age 1 or 2; or entering
at age 1 and leaving at age 2.
Assumptions about the fraction of natural-origin juveniles rearing in the reservoirs are also applied to

P a g e | 69
hatchery juveniles. For example, juveniles released as subyearlings may remain in the reservoir and rear
until age 1 or 2 before migrating downstream.
Finally, the number of hatchery-origin fish spawning naturally are adjusted to account for the relative
reproductive success of hatchery-origin adults as compared with natural-origin adults. The relative
reproductive success of HORs is a correction factor that accounts for the assumed lower reproductive
success of HORs (relative to NORs). It reflects the reduced reproductive success of first-generation
hatchery-origin fish due to behavioral differences between natural and hatchery-origin fish in terms of
spawn timing and/or location.
Reproductive success is measured in terms of the number of returning adults produced per spawner. If the
correction factor is set to 1.0, there is no difference between the number of returning adults produced per
spawning NOR and HOR. If RRS is set to 0.8, HOR spawners produce only 80% as many returning adults
(per spawner) as NORs. The RRS is applied such that the total number of spawners, Ni, is:
𝑁𝑖 = 𝑁𝑖,𝑛𝑎𝑡𝑢𝑟𝑎𝑙 + 𝑁𝑖,ℎ𝑎𝑡𝑐ℎ𝑒𝑟𝑦 × 𝑅𝑅𝑆𝑖,ℎ𝑎𝑡𝑐ℎ𝑒𝑟𝑦
where:
Ni, natural = Number of progeny from natural-origin spawners in life stage i
Ni, hatchery = Number of progeny from hatchery-origin spawners in life stage i
RRSi, hatchery = An estimate of the phenotype impact of hatchery rearing on natural productivity
for life stage i
The version of the LCM used in this analysis does not include adult age. This feature will be added in future
versions of the model as funds allow.
6.2.2 Hatchery Production
The in-hatchery fecundity and survival assumptions are used to calculate the number of broodstock required
to produce the number of hatchery subyearlings and/or yearlings specified by the user. In addition, the
model applies several user-supplied assumptions about the hatchery strategy:
P a g e | 70
• Hatchery smolt release locations.
• Number of adult outplants in each spawning population (NORs and/or HORs transported from
below Chief Joseph Dam and released into each spawning reach).
• pNOB and maximum percentage of NORs removed for broodstock (NOR mining constraint).
Adult outplants are counted as part of the natural spawning population to account for density-dependent
effects on the spawning grounds. If adult outplants are HORs, the RRS factor described above is applied
to HOR outplants when calculating the total number of spawners.
6.2.3 Harvest
Harvest is estimated for four major fisheries (defined by harvest area) as a function of user-supplied harvest
rates and the estimated number of HOR and NOR fish available in each fishery. Mark-selective fisheries
on hatchery fish were analyzed by imposing differential harvest rates on NORs and HORs. The model does
not incorporate age-specific harvest rates; harvest rates represent total harvest over all ages.
The number of fish harvested is calculated sequentially, beginning with the number of fish harvested in
ocean fisheries. The number of fish harvested in the lower Columbia, the upper Columbia, and inside the
subbasins of origin is then calculated sequentially, with each successive harvest removing a fraction of the
fish remaining after previous harvests.
The model uses assumptions about harvest rates for NORs and HORs in the ocean, lower Columbia3, upper
Columbia4, and terminal5 fisheries. These are entered as harvest rates, which are calculated based on the
3 Lower Columbia is defined as the mainstem Columbia River below Bonneville Dam.
4 Upper Columbia is defined as the mainstem Columbia River between Bonneville and McNary Dams.
5 Terminal fisheries are those that occur in the mainstem Columbia upstream of McNary Dam and inside the subbasin
of origin.

P a g e | 71
number of fish entering the geographic area, as opposed to exploitation rates, which are calculated based
on the total run size. The LCM is also able to model harvest using maximum sustainable yield (MSY), a
target NOR adult escapement goal or MSY escapement.
If the Harvest Rate option is selected, the harvest rates entered above will be applied. If the MSY Rate or
MSY Escapement options are selected, the model will calibrate harvest at each location to meet the MSY
goals, respectively. If Escapement Goal is selected, harvest will be calibrated to meet the desired NOR
escapement level. For this analysis a set harvest rate was used for all fisheries.
6.2.4 Fish Passage
The model uses a set of assumptions about juvenile and adult fish passage survival. Juvenile and adult
survival rates in the mainstem Columbia River from Bonneville through Wells Dam are documented in the
FCRPS BiOp (NOAA 2010) and are applied in the model.
Upstream of Chief Joseph and Grand Coulee dams, the model applies the following user-supplied
assumptions about juvenile and adult fish passage:
• Assumptions about juvenile migration survival during migration from the rearing areas to the
collectors upstream of Grand Coulee Dam and Chief Joseph Dam.
• Assumptions about juvenile collection efficiency and transport survival.
• For those fish not captured in the juvenile fish collectors, assumptions about the fraction of
juveniles that 1) migrate directly to the head of the dam, or 2) rear in the reservoir to the age class
specified in the reservoir assumptions (above) before migrating to the head of the dam.
• Assumptions about bypass and spill/turbine survival for fish that migrate to the head of the dam.
• For returning adults, assumptions about adult collection efficiency at Chief Joseph Dam and Grand
Coulee Dam, transport survival, and migration survival through the reservoirs.
All of these collection and survival rates are applied as simple multipliers to the number of individuals
surviving to that life stage.
P a g e | 72
6.2.5 Monte Carlo Sensitivity Analysis
The LCM uses a Monte Carlo approach for conducting sensitivity analyses. This type of analysis is used to
help managers understand the probability of meeting escapement and harvest goals under different
management options and sets of assumptions. For example, the analysis may be used to compare:
• Management options in terms of the number of smolts released, HOR adults outplanted, and
terminal harvest rates.
• Program outcomes based on assumptions about juvenile fish collection efficiency and passage
survival.
• Program outcomes based on assumptions about terminal harvest rates.
The sensitivity analysis is used to compare model outcomes from a set of baseline assumptions to a set of
alternative assumptions (the scenario). The scenario assumptions are associated with a range of values
representing uncertainty around the parameter estimate.
The model uses Monte Carlo simulation to draw values from the specified range for each parameter. Values
are drawn randomly from a triangular distribution, which uses assumptions about the minimum, maximum,
and most likely value (mode) for the parameter. The randomly drawn values are used to recalculate model
outcomes.
The results presented from the sensitivity analysis include the median outcome and the range (minimum
and maximum) of values from all model runs in the Monte Carlo simulation. Results also include a
histogram displaying the scenario results from all model runs for key model outputs (NOS, terminal catch,
pHOS and PNI).
For some analyses, instead of using the Monte Carlo feature modelers simply increased or decreased the
parameter of interest by a set percentage and then reported the median value.
6.3 BASELINE SCENARIOS AND KEY LCM MODELING ASSUMPTIONS
The LCM steps each species through life stages associated with spawning, incubation juvenile rearing and
migration (juvenile and adult) through the FCRPS (including Chief Joseph and Grand Coulee dams), ocean
and fisheries. All assumptions and inputs used in conducting life cycle modeling are documented in
parameter documentation sheets (www.UCUT.org).
P a g e | 73
Three baseline scenarios were run in the LCM. One for summer/fall Chinook in Rufus Woods Lake, where
fish passage is provided at Chief Joseph Dam only. Another for summer/fall Chinook in Rufus Woods
Lake, Lake Roosevelt and the Transboundary Reach, where passage is provided at both Chief Joseph and
Grand Coulee. The last models Sockeye within the Sanpoil (including Lake Roosevelt), the Transboundary
Reach and Christina Lake, where passage is provided at both Chief Joseph and Grand Coulee. Each of
these scenarios has variants, where alternative management actions (e.g., fish passage facilities, juvenile
releases, adult outplants) are considered.
The analysis assumes that hydro operations at Chief Joseph Dam and Grand Coulee do not substantially
change with the implementation of fish passage structures.
The key assumptions regarding Chinook and Sockeye natural production, hydro operations and fish
passage, harvest and hatchery production are presented below.
6.3.1 Natural Production
Key natural production assumptions used in LCM modeling for summer/fall Chinook are provided in Table
6-6 and for Sockeye in Table 6-7.
6.3.2 Hydro Operations and Fish Passage
As migrating fish enter reservoirs or approach dams, they are routed into collection systems, or pass through
spillways and turbines where mortality rate may be quite high. If collected, fish may be transported
downstream or bypassed back to the river to continue their migration. To be successful, juvenile and adult
survival rates to and from the ocean must be sufficiently high to produce spawners. The key hydro
assumptions of the analysis therefore pertain to the effectiveness of fish passage facilities, juvenile survival
rate through spill/turbines and juvenile and adult survival rates through reservoirs associated with Chief
Joseph and Grand Coulee dams (Table 6-8).
6.3.3 Harvest
Harvest rates by area for summer/fall Chinook and Sockeye used in the analysis are presented in Table 6-9
and reflect, at least for areas downstream of Chief Joseph Dam, current harvest rates.
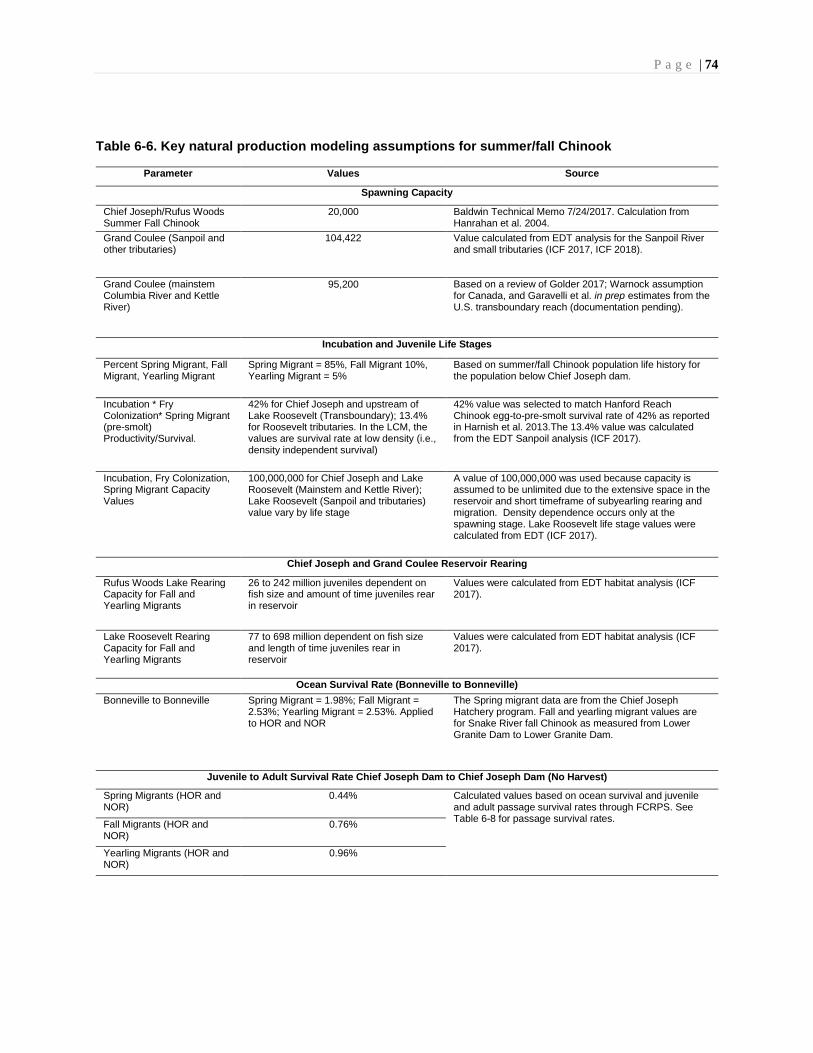
P a g e | 74
Table 6-6. Key natural production modeling assumptions for summer/fall Chinook
Parameter Values Source
Spawning Capacity
Chief Joseph/Rufus Woods Summer Fall Chinook Spawning Capacity
20,000 Baldwin Technical Memo 7/24/2017. Calculation from Hanrahan et al. 2004.
Grand Coulee (Sanpoil and other tributaries)
104,422 Value calculated from EDT analysis for the Sanpoil River and small tributaries (ICF 2017, ICF 2018).
Grand Coulee (mainstem Columbia River and Kettle River)
95,200 Based on a review of Golder 2017; Warnock assumption for Canada, and Garavelli et al. in prep estimates from the U.S. transboundary reach (documentation pending).
Incubation and Juvenile Life Stages
Percent Spring Migrant, Fall Migrant, Yearling Migrant
Spring Migrant = 85%, Fall Migrant 10%, Yearling Migrant = 5%
Based on summer/fall Chinook population life history for the population below Chief Joseph dam.
Incubation * Fry Colonization* Spring Migrant (pre-smolt) Productivity/Survival.
42% for Chief Joseph and upstream of Lake Roosevelt (Transboundary); 13.4% for Roosevelt tributaries. In the LCM, the values are survival rate at low density (i.e., density independent survival)
42% value was selected to match Hanford Reach Chinook egg-to-pre-smolt survival rate of 42% as reported in Harnish et al. 2013.The 13.4% value was calculated from the EDT Sanpoil analysis (ICF 2017).
Incubation, Fry Colonization, Spring Migrant Capacity Values
100,000,000 for Chief Joseph and Lake Roosevelt (Mainstem and Kettle River); Lake Roosevelt (Sanpoil and tributaries) value vary by life stage
A value of 100,000,000 was used because capacity is assumed to be unlimited due to the extensive space in the reservoir and short timeframe of subyearling rearing and migration. Density dependence occurs only at the spawning stage. Lake Roosevelt life stage values were calculated from EDT (ICF 2017).
Chief Joseph and Grand Coulee Reservoir Rearing
Rufus Woods Lake Rearing Capacity for Fall and Yearling Migrants
26 to 242 million juveniles dependent on fish size and amount of time juveniles rear in reservoir
Values were calculated from EDT habitat analysis (ICF 2017).
Lake Roosevelt Rearing Capacity for Fall and Yearling Migrants
77 to 698 million dependent on fish size and length of time juveniles rear in reservoir
Values were calculated from EDT habitat analysis (ICF 2017).
Ocean Survival Rate (Bonneville to Bonneville)
Bonneville to Bonneville Spring Migrant = 1.98%; Fall Migrant = 2.53%; Yearling Migrant = 2.53%. Applied to HOR and NOR
The Spring migrant data are from the Chief Joseph Hatchery program. Fall and yearling migrant values are for Snake River fall Chinook as measured from Lower Granite Dam to Lower Granite Dam.
Juvenile to Adult Survival Rate Chief Joseph Dam to Chief Joseph Dam (No Harvest)
Spring Migrants (HOR and NOR)
0.44% Calculated values based on ocean survival and juvenile and adult passage survival rates through FCRPS. See Table 6-8 for passage survival rates.
Fall Migrants (HOR and NOR)
0.76%
Yearling Migrants (HOR and NOR)
0.96%
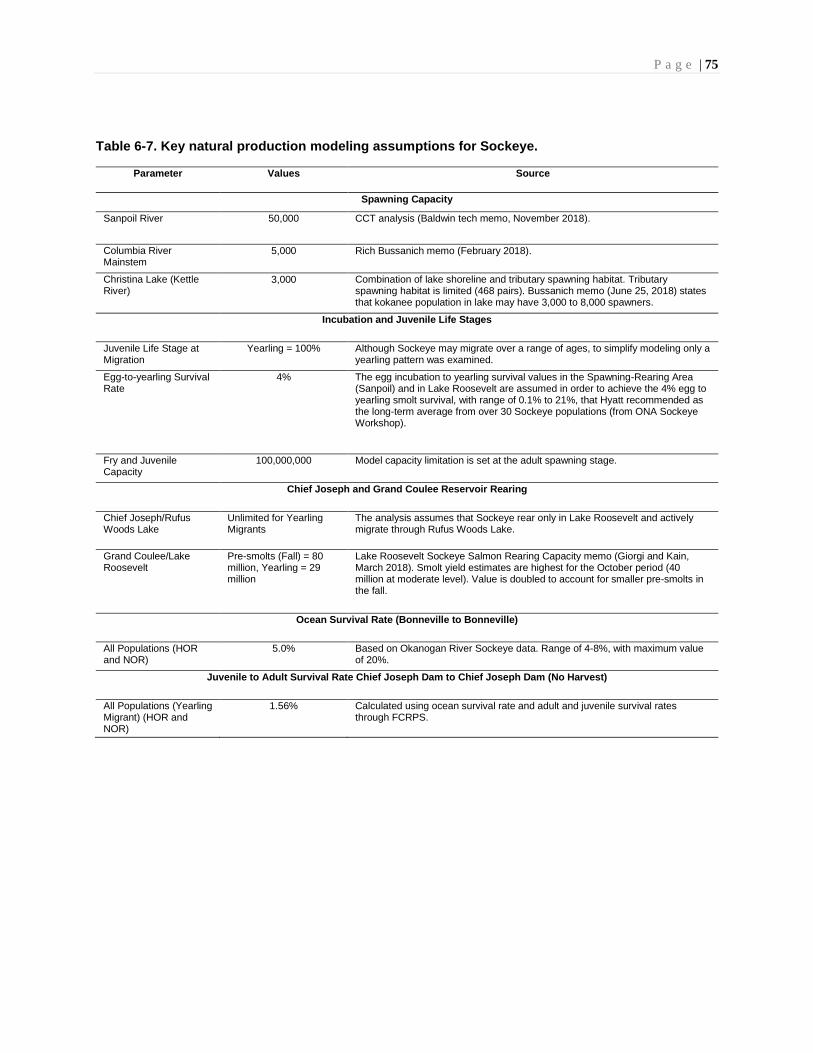
P a g e | 75
Table 6-7. Key natural production modeling assumptions for Sockeye.
Parameter Values Source
Spawning Capacity
Sanpoil River 50,000 CCT analysis (Baldwin tech memo, November 2018).
Columbia River Mainstem
5,000 Rich Bussanich memo (February 2018).
Christina Lake (Kettle River)
3,000 Combination of lake shoreline and tributary spawning habitat. Tributary spawning habitat is limited (468 pairs). Bussanich memo (June 25, 2018) states that kokanee population in lake may have 3,000 to 8,000 spawners.
Incubation and Juvenile Life Stages
Juvenile Life Stage at Migration
Yearling = 100% Although Sockeye may migrate over a range of ages, to simplify modeling only a yearling pattern was examined.
Egg-to-yearling Survival Rate
4% The egg incubation to yearling survival values in the Spawning-Rearing Area (Sanpoil) and in Lake Roosevelt are assumed in order to achieve the 4% egg to yearling smolt survival, with range of 0.1% to 21%, that Hyatt recommended as the long-term average from over 30 Sockeye populations (from ONA Sockeye Workshop).
Fry and Juvenile Capacity
100,000,000 Model capacity limitation is set at the adult spawning stage.
Chief Joseph and Grand Coulee Reservoir Rearing
Chief Joseph/Rufus Woods Lake
Unlimited for Yearling Migrants
The analysis assumes that Sockeye rear only in Lake Roosevelt and actively migrate through Rufus Woods Lake.
Grand Coulee/Lake Roosevelt
Pre-smolts (Fall) = 80 million, Yearling = 29 million
Lake Roosevelt Sockeye Salmon Rearing Capacity memo (Giorgi and Kain, March 2018). Smolt yield estimates are highest for the October period (40 million at moderate level). Value is doubled to account for smaller pre-smolts in the fall.
Ocean Survival Rate (Bonneville to Bonneville)
All Populations (HOR and NOR)
5.0% Based on Okanogan River Sockeye data. Range of 4-8%, with maximum value of 20%.
Juvenile to Adult Survival Rate Chief Joseph Dam to Chief Joseph Dam (No Harvest)
All Populations (Yearling Migrant) (HOR and NOR)
1.56% Calculated using ocean survival rate and adult and juvenile survival rates through FCRPS.
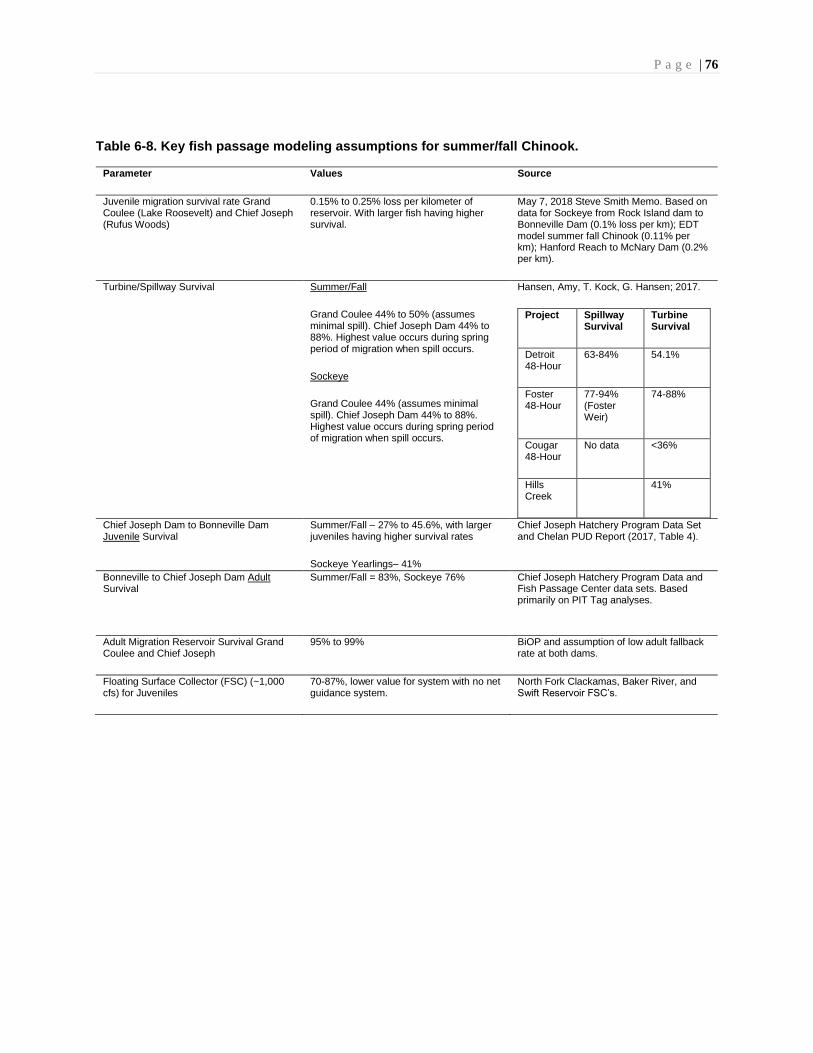
P a g e | 76
Table 6-8. Key fish passage modeling assumptions for summer/fall Chinook.
Parameter Values Source
Juvenile migration survival rate Grand Coulee (Lake Roosevelt) and Chief Joseph (Rufus Woods)
0.15% to 0.25% loss per kilometer of reservoir. With larger fish having higher survival.
May 7, 2018 Steve Smith Memo. Based on data for Sockeye from Rock Island dam to Bonneville Dam (0.1% loss per km); EDT model summer fall Chinook (0.11% per km); Hanford Reach to McNary Dam (0.2% per km).
Turbine/Spillway Survival Summer/Fall
Grand Coulee 44% to 50% (assumes minimal spill). Chief Joseph Dam 44% to 88%. Highest value occurs during spring period of migration when spill occurs.
Sockeye
Grand Coulee 44% (assumes minimal spill). Chief Joseph Dam 44% to 88%. Highest value occurs during spring period of migration when spill occurs.
Hansen, Amy, T. Kock, G. Hansen; 2017.
Project Spillway Survival
Turbine Survival
Detroit 48-Hour
63-84% 54.1%
Foster 48-Hour
77-94% (Foster Weir)
74-88%
Cougar 48-Hour
No data <36%
Hills Creek
41%
Chief Joseph Dam to Bonneville Dam Juvenile Survival
Summer/Fall – 27% to 45.6%, with larger juveniles having higher survival rates
Sockeye Yearlings– 41%
Chief Joseph Hatchery Program Data Set and Chelan PUD Report (2017, Table 4).
Bonneville to Chief Joseph Dam Adult Survival
Summer/Fall = 83%, Sockeye 76% Chief Joseph Hatchery Program Data and Fish Passage Center data sets. Based primarily on PIT Tag analyses.
Adult Migration Reservoir Survival Grand Coulee and Chief Joseph
95% to 99% BiOP and assumption of low adult fallback rate at both dams.
Floating Surface Collector (FSC) (~1,000 cfs) for Juveniles
70-87%, lower value for system with no net guidance system.
North Fork Clackamas, Baker River, and Swift Reservoir FSC’s.
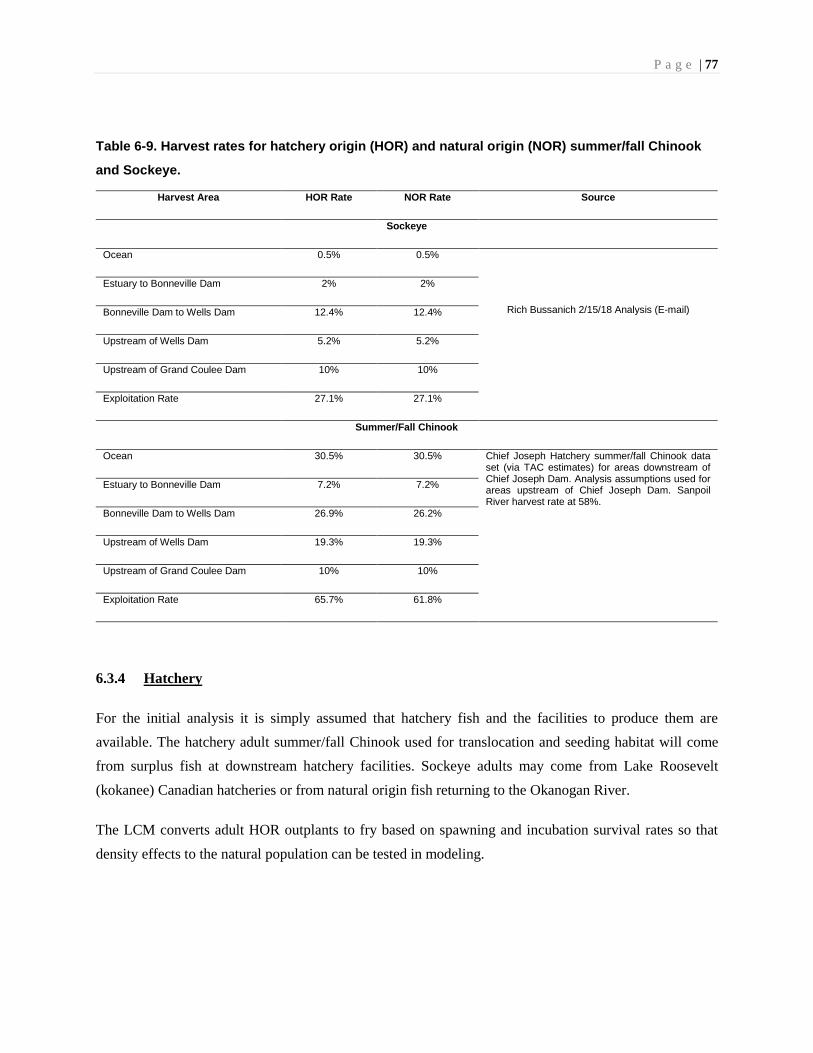
P a g e | 77
Table 6-9. Harvest rates for hatchery origin (HOR) and natural origin (NOR) summer/fall Chinook
and Sockeye.
Harvest Area HOR Rate NOR Rate Source
Sockeye
Ocean 0.5% 0.5%
Rich Bussanich 2/15/18 Analysis (E-mail)
Estuary to Bonneville Dam 2% 2%
Bonneville Dam to Wells Dam 12.4% 12.4%
Upstream of Wells Dam 5.2% 5.2%
Upstream of Grand Coulee Dam 10% 10%
Exploitation Rate 27.1% 27.1%
Summer/Fall Chinook
Ocean 30.5% 30.5% Chief Joseph Hatchery summer/fall Chinook data set (via TAC estimates) for areas downstream of Chief Joseph Dam. Analysis assumptions used for areas upstream of Chief Joseph Dam. Sanpoil River harvest rate at 58%.
Estuary to Bonneville Dam 7.2% 7.2%
Bonneville Dam to Wells Dam 26.9% 26.2%
Upstream of Wells Dam 19.3% 19.3%
Upstream of Grand Coulee Dam 10% 10%
Exploitation Rate 65.7% 61.8%
6.3.4 Hatchery
For the initial analysis it is simply assumed that hatchery fish and the facilities to produce them are
available. The hatchery adult summer/fall Chinook used for translocation and seeding habitat will come
from surplus fish at downstream hatchery facilities. Sockeye adults may come from Lake Roosevelt
(kokanee) Canadian hatcheries or from natural origin fish returning to the Okanogan River.
The LCM converts adult HOR outplants to fry based on spawning and incubation survival rates so that
density effects to the natural population can be tested in modeling.

P a g e | 78
6.4 LCM RESULTS
The modeling exercises provided reconnaissance level information on the potential outcome of providing
fish passage and implementing related reintroduction actions. Modeling results are presented for the
Baseline condition for summer/fall Chinook and Sockeye in Table 6-10. LCM outputs for the variants are
provided for the Chief Joseph and Grand Coulee projects separately for the two species in Tables 6-11 to
6-13. Again, these results are not intended to establish management targets or numerical goals for the
reintroduction. The purpose of the modeling output was to document assumptions, evaluate possibilities
given those assumptions and provide a science-based set of working hypotheses that could be used to guide
critical research needs for future investigations.
6.4.1 Baseline LCM Results for Summer/Fall Chinook and Sockeye
LCM results for Baseline conditions compared to current conditions for extant population of upper
Columbia River summer/fall Chinook and Sockeye are provided in Table 6-10. Current conditions represent
2007-2016 estimated adult returns to the upper Columbia River. Sockeye numbers include fish returning to
the Wenatchee River and Okanogan River.
Baseline model results show that the reintroduction effort may result in a substantial increase in juvenile
and adult production. Total juvenile production, as measured at Bonneville Dam, is 2.0 million and 1.5
million, summer/fall Chinook and Sockeye, respectively. The Bonneville fish numbers are based on the
assumption that 27% of the Summer/fall Chinook and 41% of the Sockeye juveniles survive passage and
migration from Chief Joseph Dam to Bonneville Dam.
Total adult production (pre-harvest) is estimated at 41,000 summer/fall Chinook and 76,000 Sockeye.
The reintroduction effort has the potential to increase the number of summer/fall Chinook harvested in all
fisheries by 24,000 fish and for Sockeye the number is 21,000 fish. These values represent a 37% and 54%
increase in harvest over current for summer/fall Chinook and Sockeye, respectively.
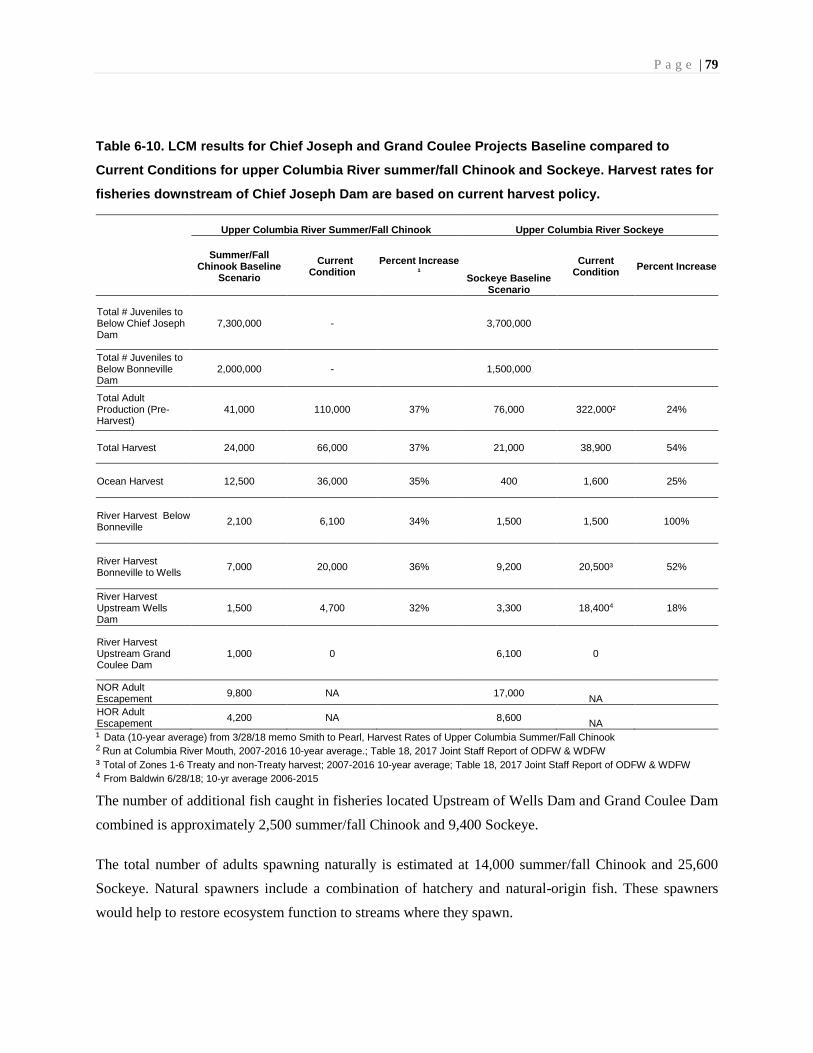
P a g e | 79
Table 6-10. LCM results for Chief Joseph and Grand Coulee Projects Baseline compared to
Current Conditions for upper Columbia River summer/fall Chinook and Sockeye. Harvest rates for
fisheries downstream of Chief Joseph Dam are based on current harvest policy.
Upper Columbia River Summer/Fall Chinook Upper Columbia River Sockeye
Summer/Fall Chinook Baseline
Scenario
Current Condition
Percent Increase ¹
Sockeye Baseline Scenario
Current Condition
Percent Increase
Total # Juveniles to Below Chief Joseph Dam
7,300,000 - 3,700,000
Total # Juveniles to Below Bonneville Dam
2,000,000 - 1,500,000
Total Adult Production (Pre-Harvest)
41,000 110,000 37% 76,000 322,000² 24%
Total Harvest 24,000 66,000 37% 21,000 38,900 54%
Ocean Harvest 12,500 36,000 35% 400 1,600 25%
River Harvest Below Bonneville
2,100 6,100 34% 1,500 1,500 100%
River Harvest Bonneville to Wells
7,000 20,000 36% 9,200 20,500³ 52%
River Harvest Upstream Wells Dam
1,500 4,700 32% 3,300 18,4004 18%
River Harvest Upstream Grand Coulee Dam
1,000 0
6,100 0
NOR Adult Escapement
9,800 NA 17,000 NA
HOR Adult Escapement
4,200 NA 8,600 NA
¹ Data (10-year average) from 3/28/18 memo Smith to Pearl, Harvest Rates of Upper Columbia Summer/Fall Chinook 2 Run at Columbia River Mouth, 2007-2016 10-year average.; Table 18, 2017 Joint Staff Report of ODFW & WDFW ³ Total of Zones 1-6 Treaty and non-Treaty harvest; 2007-2016 10-year average; Table 18, 2017 Joint Staff Report of ODFW & WDFW 4 From Baldwin 6/28/18; 10-yr average 2006-2015
The number of additional fish caught in fisheries located Upstream of Wells Dam and Grand Coulee Dam
combined is approximately 2,500 summer/fall Chinook and 9,400 Sockeye.
The total number of adults spawning naturally is estimated at 14,000 summer/fall Chinook and 25,600
Sockeye. Natural spawners include a combination of hatchery and natural-origin fish. These spawners
would help to restore ecosystem function to streams where they spawn.

P a g e | 80
The LCM generated a Beverton-Holt production function for each of the populations associated with each
geographic area (Table 6-11). Of the three summer/fall Chinook populations, the Sanpoil and Tributaries
has the lowest productivity (1.01). At this low a productivity, natural summer/fall Chinook production from
this area is not sustainable without continued hatchery supplementation6. In contrast, the EDT analysis for
this population estimated the Beverton-Holt productivity parameter at ~3.0 dependent on passage
assumptions (ICF 2017). However, it appears that in the EDT analysis the summer/fall Chinook SAR was
substantially higher than in the LCM. Interestingly, both methods forecast adult production at about 1,400
adults.
For Sockeye, the Christina Lake population had the lowest productivity value. Productivity values for the
other two populations were identical as modeling assumptions were also identical. Capacity was higher for
the Sanpoil population than for the transboundary population. This result occurred because capacity values
for the egg-to-migrant life stages for the Sanpoil were based on EDT results, while for the Transboundary
reach capacity was limited at the spawning stage only.
A key assumption of the Sockeye analysis is that juveniles rearing in Lake Roosevelt produces most of the
Sockeye production from the U.S. portion of the upper Columbia River Basin.
A second key point from the data in Table 6-11 is the modeled harvest rate is substantially higher than the
MSY value for all the populations. Harvest rate therefore has a large effect on natural production potential
for each population.
6 If fish that rear in the reservoir grow larger than stream reared fish – then survival to adult may be higher and increase
the probability of achieving sustainable natural production (See Section 7).
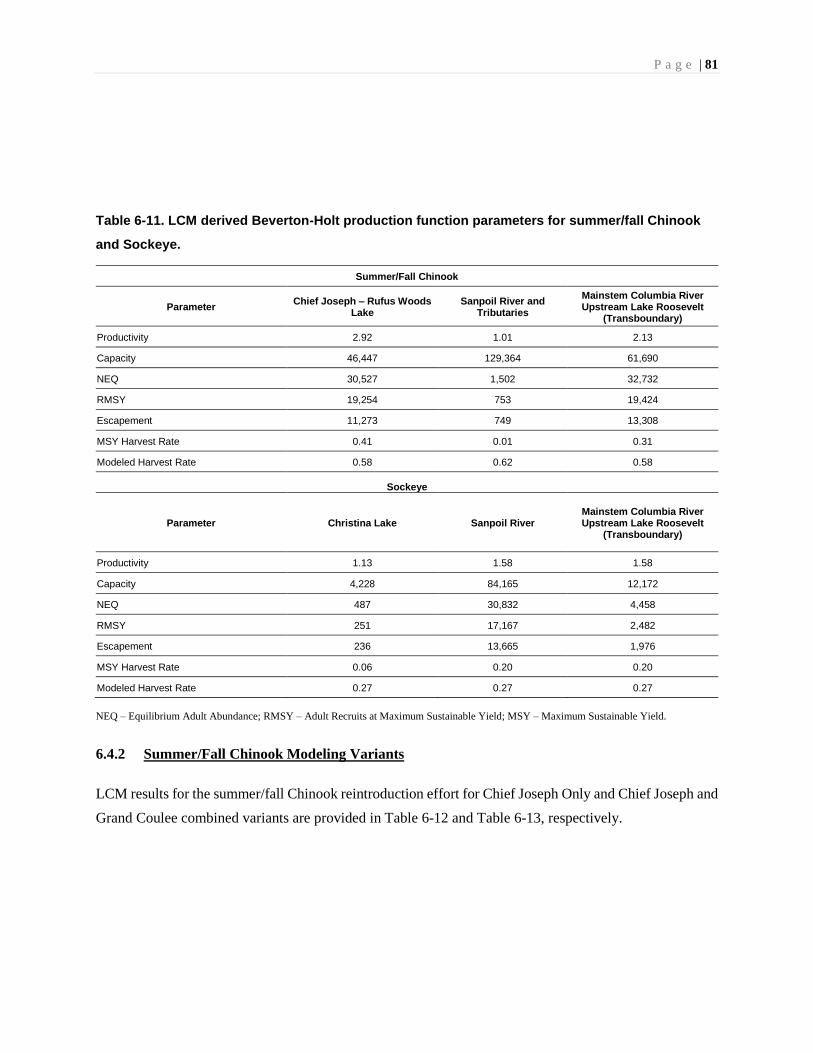
P a g e | 81
Table 6-11. LCM derived Beverton-Holt production function parameters for summer/fall Chinook
and Sockeye.
Summer/Fall Chinook
Parameter Chief Joseph – Rufus Woods
Lake Sanpoil River and
Tributaries
Mainstem Columbia River Upstream Lake Roosevelt
(Transboundary)
Productivity 2.92 1.01 2.13
Capacity 46,447 129,364 61,690
NEQ 30,527 1,502 32,732
RMSY 19,254 753 19,424
Escapement 11,273 749 13,308
MSY Harvest Rate 0.41 0.01 0.31
Modeled Harvest Rate 0.58 0.62 0.58
Sockeye
Parameter Christina Lake Sanpoil River Mainstem Columbia River Upstream Lake Roosevelt
(Transboundary)
Productivity 1.13 1.58 1.58
Capacity 4,228 84,165 12,172
NEQ 487 30,832 4,458
RMSY 251 17,167 2,482
Escapement 236 13,665 1,976
MSY Harvest Rate 0.06 0.20 0.20
Modeled Harvest Rate 0.27 0.27 0.27
NEQ – Equilibrium Adult Abundance; RMSY – Adult Recruits at Maximum Sustainable Yield; MSY – Maximum Sustainable Yield.
6.4.2 Summer/Fall Chinook Modeling Variants
LCM results for the summer/fall Chinook reintroduction effort for Chief Joseph Only and Chief Joseph and
Grand Coulee combined variants are provided in Table 6-12 and Table 6-13, respectively.
P a g e | 82
6.4.2.1 Reintroduction above Chief Joseph Only
LCM results for the Baseline show that providing fish passage at Chief Joseph Dam only, could result in
the production of 16,000 adult summer/fall Chinook (Table 6-12).
The results for Variant #1 provide insights into the value of investing in a state-of-the-art Chief Joseph Dam
juvenile collector and bypass facility and the benefits it could provide to a Chinook reintroduction. When
the FSC at the dam is eliminated, all juvenile fish passing the dam must go through the spillway or turbines.
Without the FSC, total potential juveniles arriving to below Chief Joseph Dam declines from 2.9 million to
520,000. Total potential adult production declines from 16,000 to about 2,900 and spawning escapement to
940 (Table 6-12). The spawning escapement value is less than the 1,000-hatchery fish that were planted;
however, if the adult transplants are surplus fish that would otherwise be removed from the river there is
still a net benefit to overall production.
Variant #2 examines the effect increased hatchery production has on resulting adult production. As was
expected, releasing more hatchery fish produces more returning adults. However, the LCM analysis does
not account for any density dependence that may occur in river reaches downstream of Chief Joseph Dam
as reintroduced fish interact with other salmon populations. If density dependence does occur in these
reaches, expected benefits of increased production may be less.
Adding a component of juvenile Chinook hatchery production into Rufus Woods Lake appears to add
significant benefits (Variant #2). Such a program might be initiated early to increase the supply of returning
adult Chinook for subsequent use as broodstock and adult outplants for reintroductions above Grand Coulee
Dam. Alternatively, reprogramming existing hatchery production from mainstem releases below Chief
Joseph Dam to Rufus Woods Lake could increase overall regional production and harvest benefits by
providing escapement to unused spawning habitat.
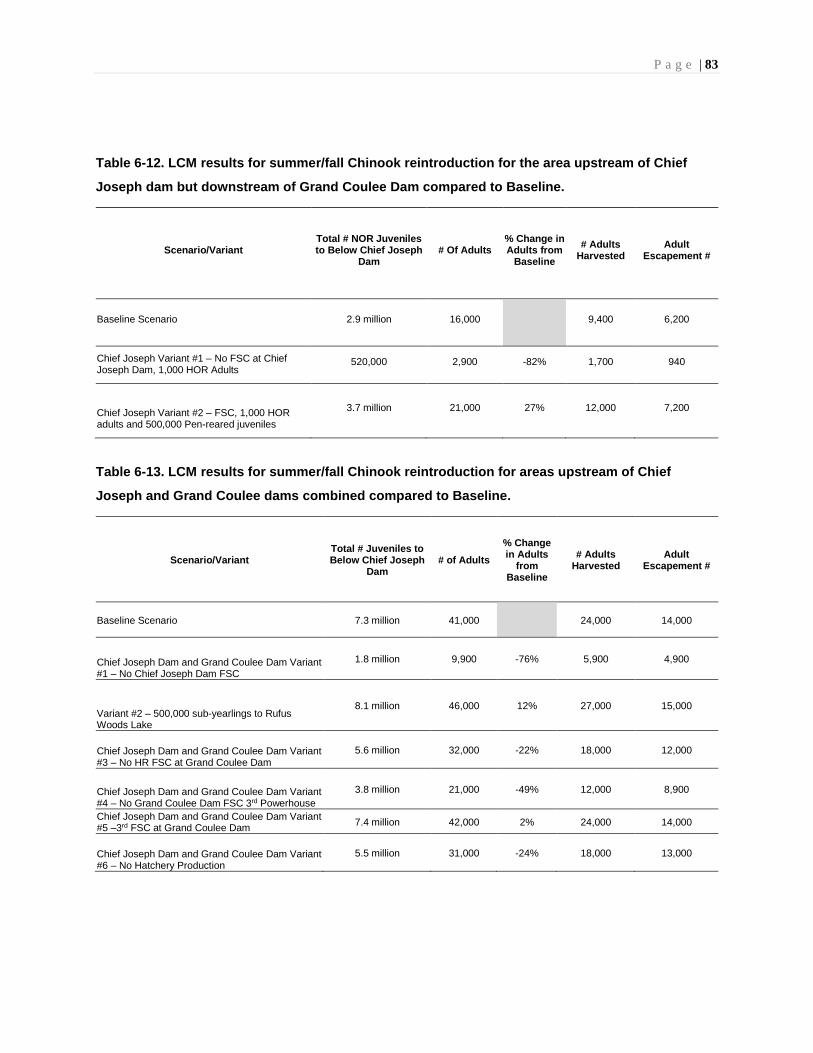
P a g e | 83
Table 6-12. LCM results for summer/fall Chinook reintroduction for the area upstream of Chief
Joseph dam but downstream of Grand Coulee Dam compared to Baseline.
Scenario/Variant Total # NOR Juveniles to Below Chief Joseph
Dam # Of Adults
% Change in Adults from
Baseline
# Adults Harvested
Adult Escapement #
Baseline Scenario 2.9 million 16,000 9,400 6,200
Chief Joseph Variant #1 – No FSC at Chief Joseph Dam, 1,000 HOR Adults
520,000 2,900 -82% 1,700 940
Chief Joseph Variant #2 – FSC, 1,000 HOR adults and 500,000 Pen-reared juveniles
3.7 million 21,000 27% 12,000 7,200
Table 6-13. LCM results for summer/fall Chinook reintroduction for areas upstream of Chief
Joseph and Grand Coulee dams combined compared to Baseline.
Scenario/Variant Total # Juveniles to Below Chief Joseph
Dam # of Adults
% Change in Adults
from Baseline
# Adults Harvested
Adult Escapement #
Baseline Scenario 7.3 million 41,000 24,000 14,000
Chief Joseph Dam and Grand Coulee Dam Variant #1 – No Chief Joseph Dam FSC
1.8 million 9,900 -76% 5,900 4,900
Variant #2 – 500,000 sub-yearlings to Rufus Woods Lake
8.1 million 46,000 12% 27,000 15,000
Chief Joseph Dam and Grand Coulee Dam Variant #3 – No HR FSC at Grand Coulee Dam
5.6 million 32,000 -22% 18,000 12,000
Chief Joseph Dam and Grand Coulee Dam Variant #4 – No Grand Coulee Dam FSC 3rd Powerhouse
3.8 million 21,000 -49% 12,000 8,900
Chief Joseph Dam and Grand Coulee Dam Variant #5 –3rd FSC at Grand Coulee Dam
7.4 million 42,000 2% 24,000 14,000
Chief Joseph Dam and Grand Coulee Dam Variant #6 – No Hatchery Production
5.5 million 31,000 -24% 18,000 13,000
P a g e | 84
6.4.2.2 Reintroduction into Chief Joseph and Grand Coulee
A more comprehensive Chinook reintroduction effort, wherein summer/fall Chinook are stocked above
both Chief Joseph and Grand Coulee dams, provides significantly more potential summer/fall Chinook than
the Chief Joseph Only (Table 6-13). Under the Baseline scenario, total adult summer/fall Chinook
production is estimated at 41,000 adults.
6.4.2.2.1 Variant #1
Without the FSC at Chief Joseph Dam, total potential juveniles arriving to below Chief Joseph Dam
declines from 7.3 million to 1.8 million (Table 6-13). Total potential adult production declines from 41,000
to about 9,900 and added fish harvest declines from 24,000 to 5,900. Potential escapement declines from
about 14,000 to 4,900. In all, Chinook production is reduced by about 76% from the Baseline scenario. A
key assumption in this analysis is that juvenile survival passing through turbines and spill combined ranges
from 40% to 50%.
6.4.2.2.2 Variant #2
In Variant #2, an additional 500,000 sub-yearling juvenile hatchery release is included with the 1,000 adult
out-plant in Rufus Woods Lake. These juveniles would be reared and acclimated in net pens in Rufus
Woods, transported through the reservoir and then released into the FSC at the dam. This assessment
indicates the potential value of added hatchery production to increase the terminal run, harvest and the
likelihood of achieving sufficient hatchery-origin adults for the annual adult plantings in Rufus Woods Lake
and Lake Roosevelt. With the added hatchery production above Chief Joseph Dam, total potential juveniles
arriving to below this dam increases from 7.3 million to 8.1 million (increased hatchery-origin salmon
escapement also leads to increased natural juvenile production in future generations). Total potential adult
production increases from 41,000 to about 46,000 and added fish harvest increases from 24,000 to 27,000
(Table 6-13). Potential escapement increases from about 14,000 to about 15,000. In all, benefits are
increased by about 12%.
6.4.2.2.3 Variant #3
Variant #3 shows the potential benefits of the Lake Roosevelt head-of-reservoir FSC to a comprehensive
Chinook reintroduction at the two U.S. dams. Without a head-of-reservoir FSC, all juveniles produced in
upper Lake Roosevelt and in the Canadian mainstem reach would need to migrate to Grand Coulee Dam
before collection. This would affect production from the mainstem Columbia River, Kettle River and a few
P a g e | 85
small, eastside tributaries.
Eliminating an FSC at the head of Lake Roosevelt reduces total potential juveniles arriving to below Chief
Joseph Dam from 7.3 million to 5.6 million (Table 6-13). Total potential adult production decreases from
41,000 to about 32,000 and added fish harvest decreases from 24,000 to 18,000. Potential escapement
decreases from about 14,000 to about 12,000. In all, benefits are decreased by about 22% from the Baseline
Scenario.
An FSC near the head of Lake Roosevelt appears to offer significant benefits to a Chinook reintroduction.
Potential benefits of this facility would increase substantially with any Canadian reintroduction above its
dams.
6.4.2.2.4 Variant #4
Variant #4 demonstrates the potential value of an FSC located above the Grand Coulee Third Powerhouse
to the viability of Chinook reintroduction. Considering this variant with the no head-of-reservoir FSC
variant (#3), above provides insights on a possible sequence of FSC installation above Grand Coulee Dam.
Without an FSC at Grand Coulee Dam, all juvenile fish arriving at Grand Coulee Dam would emigrate
from Lake Roosevelt via one of the three powerhouses (mostly through the third powerhouse), the Keys
Pump Station to Banks Lake, or occasionally the spillway. In addition to the more obvious increase in
mortality caused by powerhouse passage, there is also likely to be delay in passage which could
subsequently reduce survival at ocean entry (not assessed here).
Under Variant #4, total potential juveniles arriving to below Chief Joseph Dam declines from 7.3 million
to 3.8 million (Table 6-13). Total potential adult production declines from 41,000 to about 21,000 and added
fish harvest declines from 24,000 to 12,000. Potential escapement declines from about 14,000 to about
8,900. In all, Chinook reintroduction benefits are reduced by about 49% from the Baseline Scenario, with
77% of the remaining benefits arising from the Chief Joseph Dam reintroduction.
The Rufus Woods Lake population still has the potential to provide a viable reintroduction as the FSC at
Grand Coulee Dam does not affect this population. But, the Sanpoil and Columbia River mainstem
populations would potentially not be viable. The Sanpoil population only achieves an escapement of 7
adults while the mainstem population produces an escapement of 710 natural-origin salmon from the annual
out-planting of the 2,000 hatchery-origin adults.
P a g e | 86
From this assessment, it appears that an FSC located at Grand Coulee Dam would be an essential element
of a reintroduction strategy above Grand Coulee Dam.
6.4.2.2.5 Variant #5
This variant examines the potential benefits of including a third FSC located near the left bank to capture
fish attracted to the first powerhouse, spillway and John Keys Pump Station. This facility would increase
collection efficiency for those fish arriving at Grand Coulee Dam and offer a second facility to collect and
pass juveniles transported down reservoir from the head-of-reservoir collector and hatchery net pens.
For modeling purposes, this variant is assumed to increase fish collection efficiency at the Grand Coulee
Dam from 75% to 85% for all Chinook populations originating upstream of the dam.
With the added FSC at Grand Coulee Dam, total potential juveniles arriving to below Chief Joseph Dam
increases from 7.3 million to 7.4 million (Table 6-13). Total potential adult production increases to 42,000
and added fish harvest increases to slightly more than 24,000. Potential escapement increases to slightly
more than 14,000. In summary, there is little net benefit (2%) from a third FSC at Grand Coulee Dam. It
would appear that this added FSC might only have meaningful benefit if collection efficiencies at Third
Powerhouse are significantly less than assumed in this assessment. This could occur if juveniles’ approach
to the powerhouse is skewed to the left bank.
6.4.2.2.6 Variant #6
This variant eliminates hatchery production of 1.5 million juvenile summer/fall Chinook. It demonstrates
the potential contribution of this propagation program to reintroduction. To seed the Sanpoil River habitat,
the 500,000 juveniles acclimated at this site are replaced with out-planting of 500 hatchery-origin adults.
With removal of the juvenile hatchery production above Grand Coulee Dam, total potential juveniles
arriving to below Chief Joseph Dam decreases from 7.3 million to 5.5 million (decreased hatchery-origin
salmon escapement also leads to decreased natural production of juveniles in future generations). Total
potential adult production decreases from 41,000 to about 31,000 and added fish harvest decreases from
24,000 to 18,000. Potential adult escapement decreases from about 14,000 to about 13,000. In all, benefits
are decreased by about 24% (Table 6-13).
This variant provides insights on the potential of using only adult outplants to at least initiate a
reintroduction program. This situation could arise if hatchery facilities are not initially available and adult
out-planting results in successful spawning.

P a g e | 87
6.4.3 Sockeye Modeling Variants
Sockeye reintroduction will only occur upstream of Grand Coulee Dam under the assumption that Rufus
Woods Lake does not provide habitat for Sockeye spawning or rearing. The results of LCM Sockeye
modeling for the Variants is provided in Table 6-14. Results for each variant is compared to Baseline
conditions that produced 76,000 total adults.
Table 6-14. LCM results for Sockeye reintroduction upstream of Grand Coulee Dam compared to
Baseline.
Scenario/Variant Total # Juveniles to Below Chief Joseph Dam
# Adults % Change in Adults from
Baseline
# Adults Harvested
Adult Escapement #
Baseline 3.7 million 76,000 21,000 26,000
Chief Joseph Dam and Grand Coulee Dam Variant #1 – No Chief Joseph Dam FSC
1.3 million 26,000 -65% 7,100 4,600
Chief Joseph Dam and Grand Coulee Dam Variant #2 – No HR FSC at Grand Coulee Dam
3.6 million 74,000 -3% 20,000 25,000
Chief Joseph Dam and Grand Coulee Dam Variant #3 – No Grand Coulee Dam FSC 3rd
0.5 million 9,400 -82% 1,500 100
Chief Joseph Dam and Grand Coulee Dam Variant #4 – Lake Roosevelt Reduced Parr Plants
2.2 million 44,000 -42% 12,000 16,000
Chief Joseph Dam and Grand Coulee Dam Variant #5 – Increased Parr Plants to Lake Roosevelt
4.9 million 100,000 33% 27,000 31,000
P a g e | 88
6.4.3.1 Reintroduction above Grand Coulee
Modeling results for each of the five variants examined are provided below.
6.4.3.1.1 Variant #1
In Variant #1, the FSC at Chief Joseph Dam is eliminated requiring all juvenile fish to pass the dam through
the spillway or turbines. Without the FSC at Chief Joseph Dam, total potential juveniles arriving to below
the dam declines from 3.7 million to 1.3 million. Total potential adult production declines from 76,000 to
about 26,000 and added fish harvest declines from 21,000 to 7,100. Potential escapement declines from
about 26,000 to about 4,600. In all, benefits in adult Sockeye Salmon production are reduced by about 65%
from the Baseline Scenario (Table 6-14).
For the Christina Lake population, all adult escapement is required for broodstock and there is no fish
available to seed natural habitat.
From this assessment, it appears that an FSC located above Chief Joseph Dam powerhouse would be an
important element of any Sockeye reintroduction strategy in the upper Columbia Basin that avoids trucking
smolts around dams.
6.4.3.1.2 Variant #2
This variant is assessed to show the potential benefits of the head-of-reservoir FSC to a comprehensive
Sockeye reintroduction at the two U.S. dams. Without a head-of-reservoir FSC, all yearling juveniles
produced in the Kettle River watershed would need to migrate to Grand Coulee Dam before collection. This
would affect production from the Christina Lake population, but not the Sanpoil River and mainstem
Columbia River (the latter are assumed too small and young for collection).
Eliminating an FSC at the head of Lake Roosevelt reduces total potential juveniles arriving to below Chief
Joseph Dam from 3.7 million to 3.6 million. Total potential adult production decreases from 76,000 to about
74,000 and added fish harvest decreases from 21,000 to 20,000. Potential escapement decreases from about
26,000 to about 25,000. In all, benefits decrease by about 3% relative to the Baseline Scenario.

P a g e | 89
Modeling indicates that based on current assumptions, the head-of-reservoir FSC may not add much value
to Sockeye reintroduction above Grand Coulee Dam. This FSC should show more potential value when
later modeling is undertaken on Sockeye reintroductions above Canadian dams in assessing the U.S. Tribes’
and First Nations’ 6-dam, comprehensive reintroduction concept.
6.4.3.1.3 Variant #3
This variant demonstrates the potential value of an FSC located above the Grand Coulee Dam Third
Powerhouse to the viability of Sockeye reintroduction.
Without an FSC at Grand Coulee Dam, all juvenile fish arriving at the project would emigrate from Lake
Roosevelt via one of the three powerhouses (mostly through the third powerhouse), the Keys Pump Station
to Banks Lake, or occasionally the spillway. In addition to the more obvious increase in mortality caused
by powerhouse passage, there is also likely to be delay in passage which could subsequently reduce survival
at ocean entry (not assessed here).
As modeled here, the Grand Coulee Dam FSC would not be available as a passage facility for all juvenile
fish collected at and transported downstream from the head-of-reservoir FSC. In an actual pilot
reintroduction, these transported fish would likely be transferred from the net pens at Grand Coulee Dam
and passed the dam to the tailrace and not be subjected to turbine passage.
Without the FSC at Grand Coulee Dam, total potential juveniles arriving to below Chief Joseph Dam
declines from 3.7 million to 0.5 million. Total potential adult production declines from 76,000 to about
9,400; added fish harvest declines from 21,000 to 1,500. Potential escapement declines from about 26,000
to about 100. In all, Sockeye reintroduction benefits are reduced by about 82% compared to the Baseline
scenario.
Without a Grand Coulee Dam FSC, the Christina Lake reintroduction fails, providing no harvest or
escapement. Additionally, few fish return to spawn in the Sanpoil River and there is no escapement to the
mainstem Columbia River habitat.
6.4.3.1.4 Variant #4
This variant reduces hatchery production in Lake Roosevelt from 5 million Sockeye parr to 1 million, with
production split between the Sanpoil Arm and upper reservoir near the confluence of the Kettle River. It
demonstrates the potential contribution of propagation to Sockeye reintroduction. The 1.5 million Sockeye
fry are still released into Christina Lake. The adult out-plant of 1,000 adults into the Sanpoil also continues.
P a g e | 90
With this reduction of the hatchery production in Lake Roosevelt, total potential juveniles arriving to below
Chief Joseph Dam decreases from 3.7 million to 2.2 million. Total potential adult production decreases
from 76,000 to about 44,000 and added fish harvest decreases from 21,000 to 12,000. Potential escapement
decreases from about 26,000 to about 16,000. In all, benefits are decreased by about 42% relative to the
Baseline Scenario.
With significant reductions in releases of hatchery juveniles in Lake Roosevelt, the reintroduction still
appears viable, but with reduced benefits.
6.4.3.1.5 Variant #5
This variant increases hatchery production in Lake Roosevelt from 5 million Sockeye parr to 10 million,
with the increased production going to the upper reservoir near the confluence of the Kettle River and the
Spokane River arm. It demonstrates the potential contribution of added propagation to Sockeye
reintroduction. The 1.5 million Sockeye fry are still released into Christina Lake and the 2 million parr are
released in the Sanpoil River arm. The adult out-plant of 1,000 adults into the Sanpoil River also continues.
With the increased hatchery production in Lake Roosevelt, total potential juveniles arriving to below Chief
Joseph Dam increases from 3.7 million to 4.9 million. Total potential adult production increases from
76,000 to about 100,000 and added fish harvest increases from 21,000 to 27,000. Potential escapement
increases from about 26,000 to about 31,000. In all, benefits are increased by about 33% compared to the
Baseline Scenario.
It appears the model’s Beverton-Holt productivity function (accounting for density dependence) reduces
survival of the hatchery juveniles rearing in Lake Roosevelt. The increase in hatchery production does not
produce a corresponding increase in juveniles emigrating below Chief Joseph Dam.
6.4.4 Sensitivity Analysis for Summer/Fall Chinook and Sockeye
A sensitivity analysis was conducted to identify the key uncertainties that can be prioritized and addressed
in future research. Data collected from this research can then be used to update model assumptions and
results. The sensitivity analysis was performed by modeling a range of values for each LCM input of
interest.
P a g e | 91
The sensitivity analysis was performed on the following LCM inputs:
• Chief Joseph Dam FSC Fish Collection Efficiency.
• Egg to Pre-migrant Survival (summer/fall Chinook).
• Egg to Yearling Survival (Sockeye).
• Harvest Rates (summer/fall Chinook).
• Mortality Rate on Juveniles Migrating through Reservoirs (summer/fall Chinook).
• Fitness Factor for Hatchery Origin Adults (summer/fall Chinook).
• Improved Juvenile Fish Passage at Mainstem Columbia River Dams downstream of Chief Joseph
Dam (summer/fall Chinook).
• Improved Juvenile Fish Passage at Mainstem Columbia River Dams downstream of Chief Joseph
Dam (Sockeye).
• Smolt-to-adult return rate (SAR).
• Pre-smolt passage at Grand Coulee Dam (Sockeye).
• Juvenile Survival (Sockeye).
The results of the sensitivity analysis are provided on the web at www.UCUT.org. It should be noted that
for some sensitivity analyses modelers simply increased or decreased the parameter by a set percentage
instead of using the Monte Carlo feature which was still being developed and tested.
Key conclusions from this analysis are provided below.
6.4.4.1 Summer/Fall Chinook Sensitivity Analysis Conclusions
Modeling indicates that the success of the reintroduction program, regarding total adult summer/fall
Chinook production, could be significantly affected by the performance of hatchery-origin adults relative
to their natural origin counterparts. If hatchery origin adults have lower relative reproductive success than
modeled in the newly available habitat, resulting adult production may be reduced by over 50%. This
decrease in adult abundance might be mitigated by using, to the extent feasible, natural origin summer/fall
P a g e | 92
adults from below Chief Joseph Dam. However, negative effects to those populations from such an action
would need to be considered.
The fish collection efficiency (FCE) of the FSC at Chief Joseph Dam can be as low as 50% and production
of adult summer/fall Chinook can still be large. Benefits would further increase if juvenile survival through
Chief Joseph Dam turbines and spillways is higher than the 40%-50% assumed. Developing estimates of
juvenile survival through these structures would be a priority of the program. If survival rates exceed 75%,
the FCE of collection systems can be lower than modeled and still achieve goals.
Given the low adult productivity value for Sanpoil summer/fall Chinook (1.01) virtually any decrease in
survival at any life stage or location reduces natural adult production to unsustainable levels. This in turn
means that the expected adult production benefits from operating an integrated hatchery program would
not materialize as natural origin fish would be unavailable for use as broodstock.
Current harvest rates on each of the three summer/fall Chinook populations exceed their MSY value by a
substantial amount. Changing the harvest rate on these populations had small effects on the success of the
reintroduction effort primarily due to continued supplementation with hatchery fish. It should be noted that
the existing Okanogan River population (downstream of Chief Joseph Dam) consistently outperforms EDT
model expectations even given the high harvest rates that population experiences.
Resulting adult production is entirely dependent on the overall survival rate from spawning to return as
adult in future years. Thus, a decrease in survival at one location or life stage, can be mitigated by an
increase at another. Because one objective of the reintroduction effort is to minimize impacts to project
operations at Chief Joseph and Grand Coulee dams, assumptions regarding juvenile survival rates through
reservoirs and dams should be tested early. To illustrate, because of the importance of flood control
operations at Grand Coulee, it is unlikely that reservoir operations can be altered to improve juvenile
migration survival. If survival rates are substantially less than modeled, then the effectiveness of the effort
will be reduced. If on the other hand, survival rates are much higher, the effectiveness and number of
juvenile collection systems required may be reduced.
6.4.4.2 Sockeye Sensitivity Analysis Conclusions
The Sockeye sensitivity analysis showed that even when the FCE of juvenile collection facilities was
reduced by 50% compared to Baseline assumptions, total adult production was greater than 32,000 adults.
However, under a lower FCE no natural origin fish returned to Christina Lake.
P a g e | 93
The Baseline assumes an egg-to-smolt survival rate of 4.3%. When the assumption is reduced to 1%, total
adult production is reduced from 76,000 to 34,000 adult Sockeye. In contrast, if this value is increased to
10% total adult production increases to 149,000. Program success does not appear to be heavily reliant on
the egg-to-smolt survival value so long as it’s greater than ~1%.
One issue with having a larger egg-to-smolt survival rate than anticipated is the impact to adult fish passage
facilities. Facilities and systems must be sized to accommodate expected adult returns. If the number of
adults returning gets too large than options such as trapping and hauling adults around projects may be
impractical. Properly sizing juvenile and adult passage facilities would also account for potential
reintroductions above Canadian dams. This added restoration could contribute substantially to numbers of
emigrating juveniles and returning adults.
In regard to SAR, the analysis showed that as SAR (Bonneville to Bonneville) increased from the assumed
5% to 8%, total adult Sockeye production increased from 76,000 to 182,000. The 8% value is realistic as it
is based on data for the Okanogan River Sockeye population. These results show the importance of not only
looking at average survival conditions but also the range of survival when quantifying program outcomes.
Finally, improving juvenile survival rates as they pass the 9-mainstem dams below Chief Joseph Dam by
10%, results in a 21% increase in adult production. This finding is important for it points out that if survival
targets upstream of Chief Joseph Dam cannot be met, or the cost is prohibitive, then improvement at
downstream dams may help achieve reintroduction goals while at the same time increasing abundance of
downstream salmon populations. Also, survival rates downstream could continue to improve with further
implementation of BiOp actions.

P a g e | 94
6.5 REFERENCES
Baldwin, C. and B. Bellgraph. Memo dated July 24, 2017.
Beverton, R. J. H. and S. J. Holt. 1957. On the Dynamics of Exploited Fish Populations. Chapman & Hall,
London.
Giorgi, C. and A. Kain. 2018. Sockeye Salmon Rearing Capacity of Lake Roosevelt. Spokane Tribal
Fisheries, Wellpinit, WA. March 2018.
Golder Associates. 2017. Chinook Salmon Spawning Habitat Availability in the Lower Columbia River,
Year 2. Report No. 1659612-001-R-Rev0. Prepared for Canadian Columbia River Inter-Tribal Fisheries
Commission, Cranbrook, BC. March 2017.
Hanrahan, T.P., D.D. Dauble, and D.R. Geist. 2004. An estimate of Chinook salmon (Oncorhynchus
tshawytscha) spawning habitat and redd capacity upstream of a migration barrier in the upper Columbia
River. Canadian Journal of Fisheries and Aquatic Sciences 61:23–33.
Hansen, Amy, T. Kock, G. Hansen; 2017. Synthesis of Downstream Fish Passage Information at Projects
Owned by the U.S. Army Corps of Engineers in the Willamette River Basin, Oregon. USGS Open-Field
Report 2017-1101.
Harnish R., R. Sharma, G. McMichael, R. Langshaw and T. Pearsons. 2013. Effect of hydroelectric dam
operations on the freshwater survival of Columbia River fall Chinook salmon. Can. J. Fish. Aquat. Sci. 71:
602-615.
ICF. 2017. Phase 1 Anadromous Reintroduction Potential Analysis – Sanpoil River and Select Upper
Columbia River Tributaries, Final Version. September. Prepared for the Confederated Tribes of the
Colville Reservation, Spokane WA.
Moussalli, E. and R. Hilborn. 1986. Optimal stock size and harvest rate in multistage life history models.
Canadian Journal of Fisheries and Aquatic Science. 43:135-141.
NOAA. 2010. FCRPS Supplemental BiOp.

P a g e | 95
7.0 ADULT AND JUVENILE FISH PASSAGE
7.1 INTRODUCTION
LCM results show that habitat of enough quality and quantity exist upstream of Chief Joseph Dam to
produce large numbers of both summer/fall Chinook and Sockeye Salmon. However, the scale of the adult
production possible depends on the effectiveness of proposed upstream and downstream fish passage
facilities and migration survival through reservoirs.
A properly designed fish passage facility provides fish, safe, timely, and effective passage defined as:
1. Safe – High survival rate through the structure.
2. Timely – Minimum migration delay when approaching, passing through, and exiting the
structure.
3. Effective – High fish collection efficiency (FCE) over the entire fish migration period.
These characteristics are achieved in the fish passage design process where careful thought is given to the
type of facility proposed, its location, size, the species to be passed, and interaction with dam project
operations such as flood control and power peaking.
When restoring fish passage at a series of dams, strategic consideration must be given to the implementation
sequence of juvenile and adult passage facilities. Scheduling the sequence of facility construction and
operation can affect budgetary planning and a cost-effective reintroduction strategy.
In the phased implementation approach outlined in the NPCC Fish and Wildlife Program, interim fish
passage facilities are necessary during Phase 2 investigations to allow evaluation of reintroduction. Should
pilot reintroductions and investigations show efficacy, then long-term, permanent facilities can be pursued
in Phase 3, as needed.
7.2 ADULT PASSAGE FACILITIES
Facilities used to pass adult salmon and other species over dams is well described in the NPCC (2016) Staff
Paper and Linnansaari et al. (2015). Overall, adult passage facilities can be readily designed to achieve the
safe, timely and effective criteria as established by NMFS (2011). A brief summary on possible fish passage
systems that could be used to pass fish at Chief Joseph Dam and Grand Coulee Dam are presented below.
P a g e | 96
For more detailed information on these facilities the reader should review the aforementioned reports.
Additional insight to fish passage facilities specific to Chief Joseph and Grand Coulee dams is expected to
be part of future investigations.
NPCC (2016) describes five options for passing adult anadromous and resident fish over high-head dams:
• Trap and Haul: consists of a collection facility (i.e., a short fish ladder) and trap at the
downstream base of a dam. Trapped fish are then loaded into tanker trucks to be transported to
site(s) upstream of the blockage.
• Fish Ladder: consists of a sloped weir or baffled raceways that create a staircase of pools over or
through which the fish pass to gain the elevation needed to surmount the dam. Ladders include
attraction flows at their downstream entrance, suitable flows through the ladder, and an exit
located so that fish can easily continue their upstream migration and not be entrained back
through or over the dam.
• Fish Elevator and Locks: consist of an attraction flow at the downstream base of the dam leading
to a hopper where fish are trapped and lifted in a water filled vessel or directed into a series of
locks leading to the forebay where fish are released to continue their upstream migration.
• Whooshh Salmon Cannon: an emerging technology that consists of attraction flow leading to a
“false waterfall,” directing fish to volitionally enter a flexible tube. Fish pass up the suspended
tube under negative pressure to an exit in the forebay.
• Natural Channel Fishways: consist of a long artificial channel resembling a natural stream that
attracts fish and allows them to migrate up the channel, around the dam, to exit into the forebay.
• Combination Passage Facilities: one or more of the above options combined to increase passage
effectiveness and or reduce capital and O&M costs.
Any of these systems could be operated to pass adults at the two dams. For large dams such as Grand Coulee
and Chief Joseph, adult collection facilities are likely needed on both banks of the tailrace to improve
collection efficiency and avoid fish migration delay. Delay is particularly important in the upper Columbia
as salmon will have already migrated over 550 miles, passed nine dams, and may be subjected to warming
water temperatures as the season progresses. All these factors reduce the fish’s energy reserves that, upon
arrival to spawning grounds, must be sufficient to complete the spawning process.
P a g e | 97
7.3 JUVENILE PASSAGE FACILITIES
Detailed descriptions of juvenile (i.e., downstream) collection, exclusion and bypass facilities can be found
in NPCC (2016) and U.S. Department of Interior (USDOI; 2006). Information on surface collector
technology that may be the most applicable technology for passage at Grand Coulee and Chief Joseph dams
is presented in the Surface Bypass Program Compendium (ENSR 2007) and the effectiveness of such
systems in Kock et al. (2017 Draft Report). The key information on FSC technology is briefly summarized
below.
7.3.1 The Floating Surface Collector (FSC)
The FSC is a barge-like device that floats on the surface of a reservoir allowing it to operate under a range
of reservoir water elevations. The FSC technology continues to evolve and improve in function and cost as
evidenced from designs installed at Puget Sound Energy’s (PSE) Upper Baker Dam in 2008, PacifiCorp’s
Swift Dam on the Lewis River in 2012, and versions installed at Portland General Electric’s North Fork
Projects located on the Clackamas River in 2015. The Corps of Engineers is currently in the process of
designing FSC’s at Cougar and Detroit dams on the Willamette River.
The FSC uses water pumps, or gravity flow, to create a surface-oriented flow field upstream of the floating
structure that takes advantage of juvenile salmonids tendency to migrate near the surface of reservoirs when
water temperatures are suitable (<16° C). Fish may be guided to the FSC using nets that lead the fish to the
FSC net transition structure (NTS), and entrance where they are collected using a series of dewatering
screens (Figure 7-1). Total flow used for fish attraction is generally around 500 cfs to 1,000 cfs, but larger
surface attraction systems have been built or are being designed (Kock et al. (2017 Draft). FSC’s have been
operated at Projects with reservoir elevations that fluctuate up to 10 meters (32.8 ft.) and are being designed
for larger fluctuations (>100 ft.) at Cougar Dam on the Willamette River.
Currently, the only FSC that is collecting Sockeye is located on the Baker River; although kokanee are
being collected at the Round Butte project in Oregon. The FCE of the upper and lower Baker FSCs has
been greater than 75% for Sockeye entering the forebay of the project (Kock et al. 2017 (Draft)).
Spring Chinook FCE for the River Mill FSC (Clackamas River) was greater than 95% for fish entering the
reservoir. In contrast, spring Chinook FCE at Swift Dam has been less than 25%, although 47% entered the
NTS (PacifiCorp 2018). The FCE Round Butte Surface Collector (non-floating) for spring Chinook has
been estimated at 31.5% (Kock et al. 2017 (Draft)).
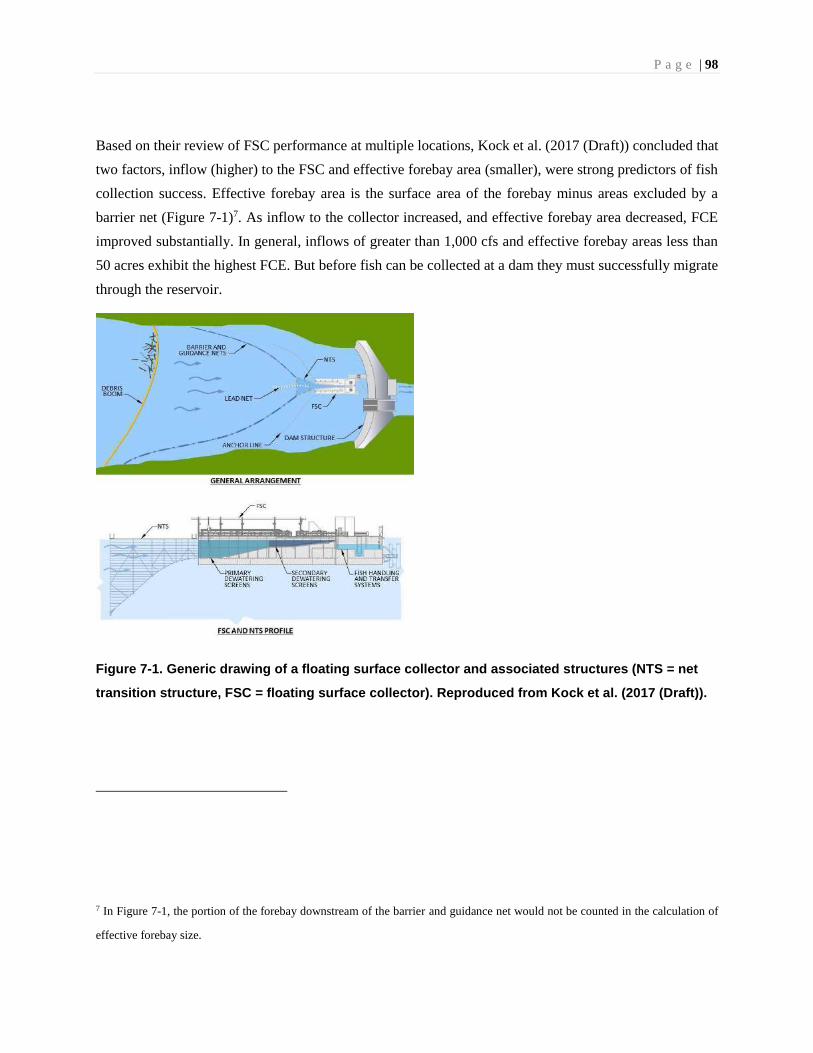
P a g e | 98
Based on their review of FSC performance at multiple locations, Kock et al. (2017 (Draft)) concluded that
two factors, inflow (higher) to the FSC and effective forebay area (smaller), were strong predictors of fish
collection success. Effective forebay area is the surface area of the forebay minus areas excluded by a
barrier net (Figure 7-1)7. As inflow to the collector increased, and effective forebay area decreased, FCE
improved substantially. In general, inflows of greater than 1,000 cfs and effective forebay areas less than
50 acres exhibit the highest FCE. But before fish can be collected at a dam they must successfully migrate
through the reservoir.
Figure 7-1. Generic drawing of a floating surface collector and associated structures (NTS = net
transition structure, FSC = floating surface collector). Reproduced from Kock et al. (2017 (Draft)).
7 In Figure 7-1, the portion of the forebay downstream of the barrier and guidance net would not be counted in the calculation of
effective forebay size.

P a g e | 99
Importantly to reintroduction in the upper Columbia basin, it should be noted that Koch et al. did not
consider flow net through a reservoir towards the dams in their evaluation of factors contributing to fish
passage. While the reservoirs created by Chief Joseph and Grand Coulee dams are very large, they are also
subject to substantially higher flows than other reservoirs that were evaluated. This added flow cue should
be important in the success of reservoir migration towards any FSC at the two dams.
The effects of reservoirs on fish migration survival are discussed next.
7.4 RESERVOIR PASSAGE AND SURVIVAL
The collection of juvenile salmon and steelhead from large reservoirs created by dams is perhaps the
greatest challenge to the successful reintroduction of anadromous fish runs to historical habitats. In
contrast, adult salmonids appear to be very successful in their ability to migrate through reservoirs
associated with dams such as those in the lower mainstem Columbia River.
Large reservoirs can minimize or eliminate the flow cues that salmon rely upon to direct their migration in
a timely manner. For juveniles, this potential lack of downstream water velocity cues will, to varying extents
(depending on species), reduce the attraction of juveniles to collection facilities.
Large reservoirs also provide habitat for other fish species that prey on juvenile salmon as they rear and
migrate through the reservoir to the dam. Predation mortality rates on migrating salmonid juveniles can be
quite large. Rieman et al. (1991) estimated that three predator species consumed 14% of all juvenile
salmon that entered John Day Reservoir. This led to the implementation of successful predator control
programs that reduced predation effects on migrating salmon8. (http://www.pikeminnow.org/wp-
content/uploads/2017/03/2014-Pikeminnow-AR.pdf )
The size and length of reservoirs, as well as how they are operated, may affect juvenile migration success
(i.e., survival and travel time). For mainstem Columbia River Projects, combined dam and reservoir juvenile
8 The Colville Tribes have been removing non-native species from Lake Roosevelt since 2011. To date thousands of
predators of salmon have been removed from the lake (Wolvert et al. 2018)
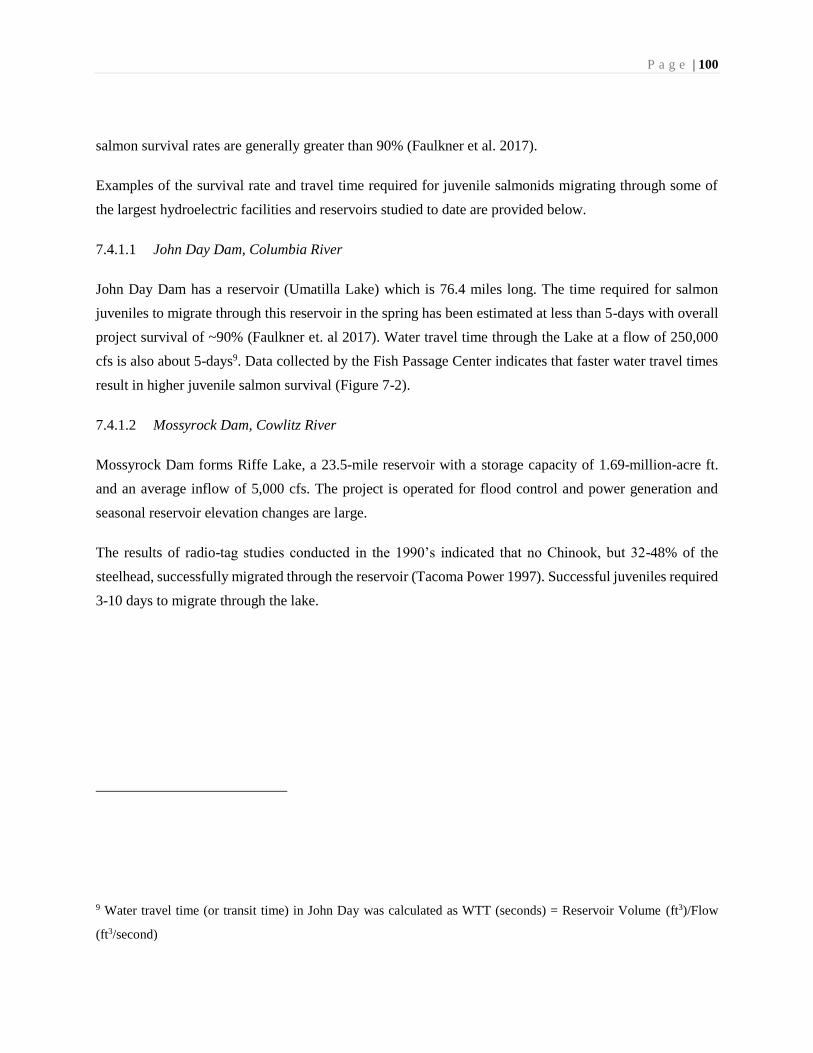
P a g e | 100
salmon survival rates are generally greater than 90% (Faulkner et al. 2017).
Examples of the survival rate and travel time required for juvenile salmonids migrating through some of
the largest hydroelectric facilities and reservoirs studied to date are provided below.
7.4.1.1 John Day Dam, Columbia River
John Day Dam has a reservoir (Umatilla Lake) which is 76.4 miles long. The time required for salmon
juveniles to migrate through this reservoir in the spring has been estimated at less than 5-days with overall
project survival of ~90% (Faulkner et. al 2017). Water travel time through the Lake at a flow of 250,000
cfs is also about 5-days9. Data collected by the Fish Passage Center indicates that faster water travel times
result in higher juvenile salmon survival (Figure 7-2).
7.4.1.2 Mossyrock Dam, Cowlitz River
Mossyrock Dam forms Riffe Lake, a 23.5-mile reservoir with a storage capacity of 1.69-million-acre ft.
and an average inflow of 5,000 cfs. The project is operated for flood control and power generation and
seasonal reservoir elevation changes are large.
The results of radio-tag studies conducted in the 1990’s indicated that no Chinook, but 32-48% of the
steelhead, successfully migrated through the reservoir (Tacoma Power 1997). Successful juveniles required
3-10 days to migrate through the lake.
9 Water travel time (or transit time) in John Day was calculated as WTT (seconds) = Reservoir Volume (ft3)/Flow
(ft3/second)
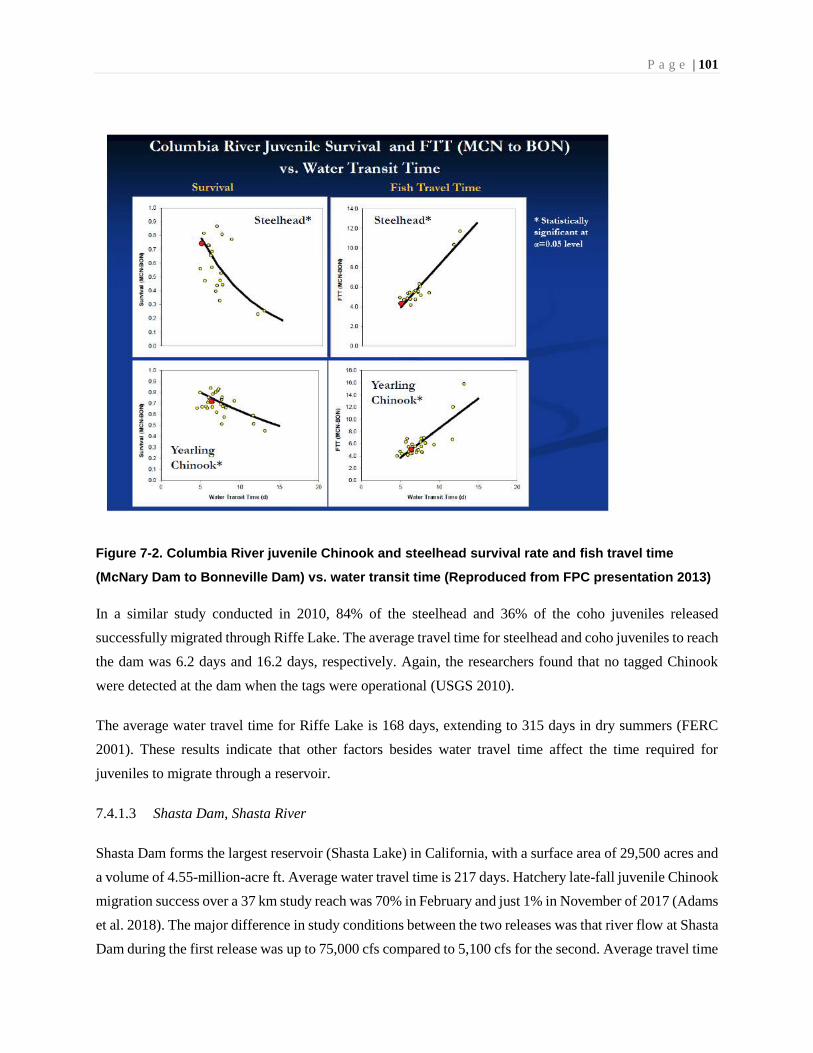
P a g e | 101
Figure 7-2. Columbia River juvenile Chinook and steelhead survival rate and fish travel time
(McNary Dam to Bonneville Dam) vs. water transit time (Reproduced from FPC presentation 2013)
In a similar study conducted in 2010, 84% of the steelhead and 36% of the coho juveniles released
successfully migrated through Riffe Lake. The average travel time for steelhead and coho juveniles to reach
the dam was 6.2 days and 16.2 days, respectively. Again, the researchers found that no tagged Chinook
were detected at the dam when the tags were operational (USGS 2010).
The average water travel time for Riffe Lake is 168 days, extending to 315 days in dry summers (FERC
2001). These results indicate that other factors besides water travel time affect the time required for
juveniles to migrate through a reservoir.
7.4.1.3 Shasta Dam, Shasta River
Shasta Dam forms the largest reservoir (Shasta Lake) in California, with a surface area of 29,500 acres and
a volume of 4.55-million-acre ft. Average water travel time is 217 days. Hatchery late-fall juvenile Chinook
migration success over a 37 km study reach was 70% in February and just 1% in November of 2017 (Adams
et al. 2018). The major difference in study conditions between the two releases was that river flow at Shasta
Dam during the first release was up to 75,000 cfs compared to 5,100 cfs for the second. Average travel time
P a g e | 102
from fish release to detection at Shasta River Dam forebay was about 50 days for each release. Therefore,
river flow did not appear to have a large effect on juvenile travel time, at least for successful migrants within
the life span of the acoustic tag.
7.4.1.4 Juvenile Reservoir Rearing
One potential benefit of a large reservoir is that it can supply expansive, almost unlimited, juvenile salmonid
rearing habitat beyond that of tributary streams and rivers that may significantly enhance the survival of
salmon fry and parr (especially for Sockeye). For Chinook, Giorgi and Malone (2013) summarized this
species survival and behavior in reservoirs and lakes from studies conducted primarily in the Willamette
River basin (many at high head dams). They found that Chinook fry to migrant survival for reservoirs and
lakes ranged from 10% to 30%. Recently, Kock et al. (2018) conducted a Chinook fry survival study at
Lookout Point Reservoir (Willamette River, Oregon) and estimated hatchery origin fry-to-juvenile survival
for the period April to October at 18.8%. These values are similar to those measured on the Skagit River,
where Chinook egg-to-migrant survival rates were estimated at 4.5% to 21.5%, depending on river flow
(Zimmerman et al. 2015). Thus, the juvenile Chinook survival rate in the reservoir is expected to be similar
or higher than those observed in the riverine environment. Because of the size of a reservoir, rearing
capacity is expected to be substantially larger on a per mile basis for reservoir habitat compared to riverine
habitat.
Reservoirs can also provide thermal conditions and food supplies that produce larger emigrating Chinook
smolts that may survive to adulthood at rates higher than those reared in colder, native streams (Monzyk et
al. 2015).
In the life cycle modeling analysis, it is assumed that reservoirs associated with Chief Joseph Dam and
Grand Coulee Dam can provide extensive juvenile rearing habitat for both Sockeye and Chinook (Section
6).

P a g e | 103
7.5 CHIEF JOSEPH PROJECT CONDITIONS AND IMPLICATIONS FOR FISH PASSAGE
7.5.1 Project Conditions
Chief Joseph Dam is a 236 ft. high run-of-river10 project located at river mile (RM) 545 on the Columbia
River. The dam forms the ~50-mile Rufus Woods Lake (Figure 7-3). The storage capacity of Rufus Woods
Lake is 590,000 acre-ft., with a mean water travel time of approximately 3-days (USACE 2005) (Figure 7-
4). Chief Joseph Dam has 19-spillbays and 27 Francis turbines. The turbine openings are approximately
75-80 ft. below the surface of the lake.
Figure 7-3. Chief Joseph Dam (Google Maps)
10 Run-of-river meaning that it has little capacity to store water.
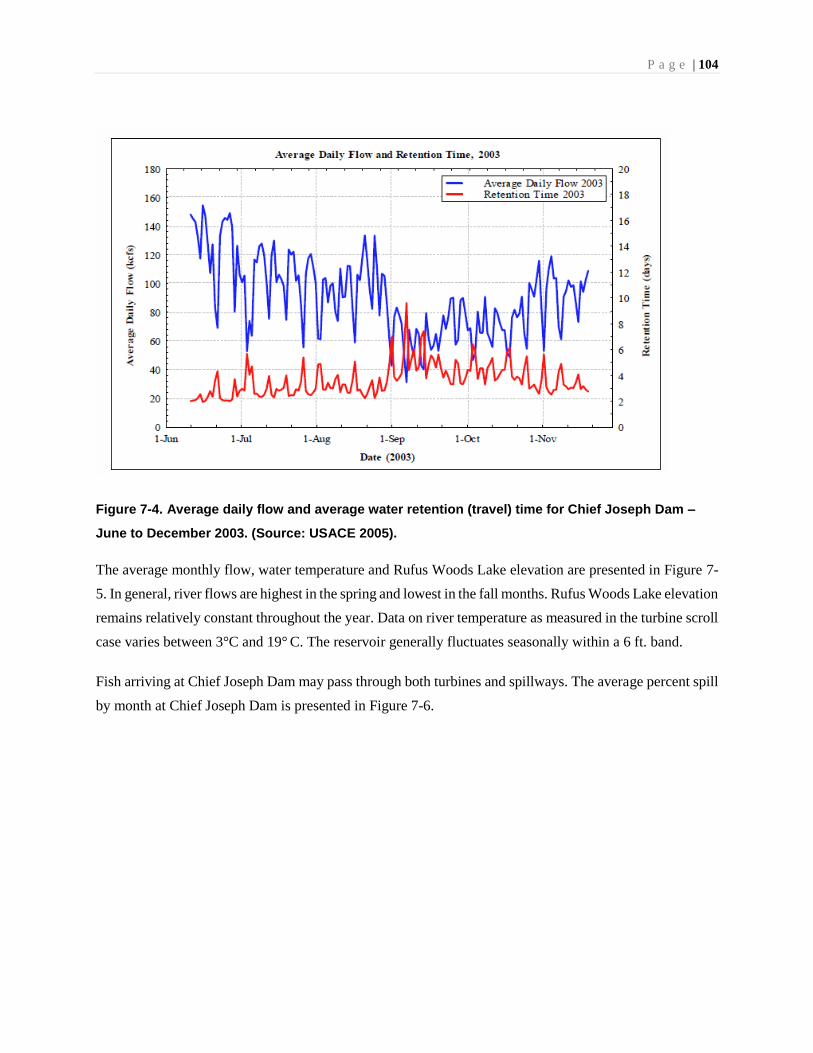
P a g e | 104
Figure 7-4. Average daily flow and average water retention (travel) time for Chief Joseph Dam –
June to December 2003. (Source: USACE 2005).
The average monthly flow, water temperature and Rufus Woods Lake elevation are presented in Figure 7-
5. In general, river flows are highest in the spring and lowest in the fall months. Rufus Woods Lake elevation
remains relatively constant throughout the year. Data on river temperature as measured in the turbine scroll
case varies between 3°C and 19° C. The reservoir generally fluctuates seasonally within a 6 ft. band.
Fish arriving at Chief Joseph Dam may pass through both turbines and spillways. The average percent spill
by month at Chief Joseph Dam is presented in Figure 7-6.
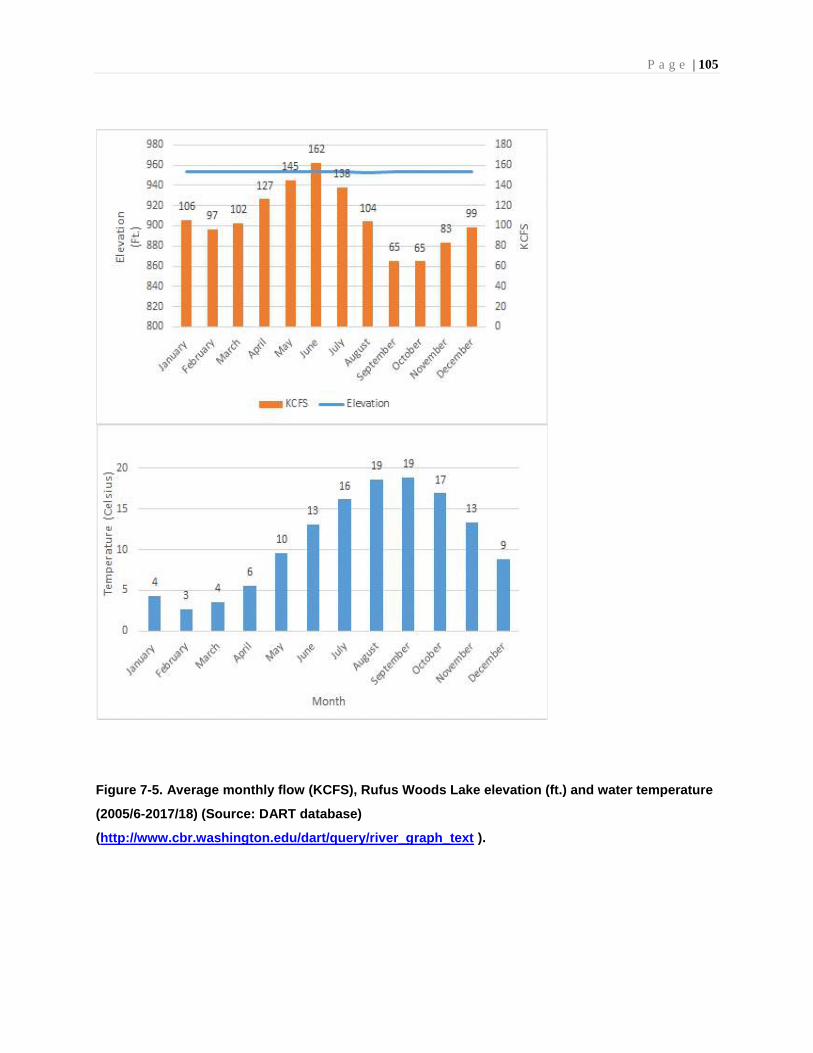
P a g e | 105
Figure 7-5. Average monthly flow (KCFS), Rufus Woods Lake elevation (ft.) and water temperature
(2005/6-2017/18) (Source: DART database)
(http://www.cbr.washington.edu/dart/query/river_graph_text ).

P a g e | 106
Figure 7-6. Average percent of total river flow spilled by month for Chief Joseph Dam (2008-2017)
(Source Dart Database) (http://www.cbr.washington.edu/dart/query/river_graph_text ).
7.5.2 Implications for Fish Passage
For juvenile fish there has been concern that migration survival rate through the 50-mile-long Rufus Woods
Lake may be quite low. However, the data presented in Figure 7-5 show that water temperatures for spring
migrating fish are, on average, ≤ 16°C through July. This temperature falls within the EPA recommended
16°C value11 for juvenile rearing and migration life stages (EPA 2003). Thus, temperature conditions should
be suitable for summer/fall Chinook and Sockeye juveniles migrating through the lake for most of the spring
and early summer juvenile migration period.
Water retention time of Rufus Woods Lake on average is ~3-days (Figure 7-4). Retention is the amount of
time required for a particle of water entering the lake to pass through the lake and the term is used
interchangeably with water travel time. If fish migrate at the same rate as a particle of water, then they
should be able to migrate through the lake in a similar amount of time. Although river flow is higher at
John Day Dam, juveniles are still able to migrate through the 76.4-mile Lake Umatilla in ~5-days (Faulkner
et al. 2017) when water retention time is approximately 5-days. These data indicate reservoir conditions of
Rufus Woods Lake are like those of Lake Umatilla and that juvenile travel time through the Rufus Woods
11 Measured as the 7 Day Average of the Daily Maximum (DADM).
0% 1%
7%
13%
18%20%
12%
1% 0% 0% 0%0%
5%
10%
15%
20%
25%
% S
pill
P a g e | 107
may also be similar.
Spill operations at Chief Joseph Dam occur primarily in the spring, the same time frame when juvenile fish
are migrating. If it is assumed that the percentage of juveniles using spillways for passage is equal to the
percent of total project discharge passing via the spillway, then from 1% to 20% of the juveniles may pass
via the spillway from March to July. Juvenile survival rate for the Chief Joseph Dam spillway is unknown.
Adult summer/fall Chinook are expected to arrive at Chief Joseph Dam from late June to early-November;
Sockeye from mid-June to early-September. Water temperatures on average during this period will still
likely be below the 20°C DADM EPA recommended value (EPA 2003) (Figure 7-5). Nearly every year a
portion of the Okanogan River summer/fall Chinook and Sockeye adults must hold near the confluence of
the Columbia and Okanogan Rivers about 18 km downstream of Chief Joseph Dam until Okanogan River
temperatures drop in the early fall. These fish experience warmer water (~24°C) from the Okanogan as
well as the cooler water (~19°C) of the Columbia River for up to several weeks before finishing their
migration. Despite this challenging thermal block in the adult migration, the Okanogan River has the most
robust populations of Sockeye and summer/fall Chinook in the Columbia River basin. However, there will
be years (such as 2015) when the Columbia River heats up earlier and/or exceeds 20°C for an extended
period and fish losses will be higher. Although 2015 was devastating to adult migration survival of
Sockeye, summer/fall Chinook did very well with the highest estimated spawner abundance in recent times
(Pearl et al. 2017).
7.5.3 Initial Juvenile Passage Facility Concept at Chief Joseph Dam
The following options are initial concepts that will need to be further developed and evaluated with and by
the dam owners and operators (Army Corp of Engineers, Bonneville Power Administration). We present
some options herein as part of this report to provide readers with some options that might be applicable and
to help guide likely studies that will need to be implemented early in the next steps. The studies will provide
important data for selecting preferred alternatives for further scoping, engineering, and development of
interim passage facilities, if appropriate
An initial juvenile passage concept for Chief Joseph Dam is the placement of an FSC at the downstream
end of the powerhouse (Figure 7-7). At this location the shape of the forebay and powerhouse are expected
to naturally guide fish to the FSC. Guide nets could be used to move fish closer to the bank across from the
powerhouse (bottom of Figure 7-7) or trashracks with narrower spacing (and possibly angled) used to direct
fish down the face of the powerhouse similar to the configuration at River Mill Dam. FCE of the River
Mill FSC for Chinook is greater than 95% (Kock et al. 2017 (Draft)). However, additional studies will
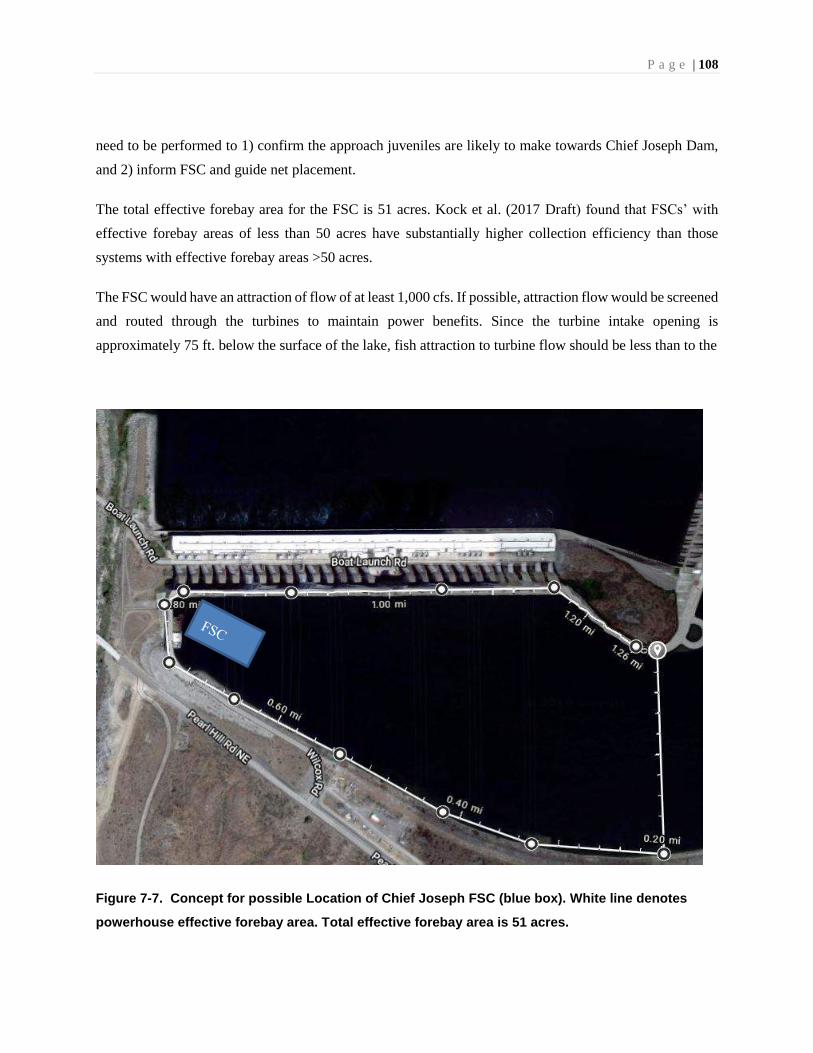
P a g e | 108
need to be performed to 1) confirm the approach juveniles are likely to make towards Chief Joseph Dam,
and 2) inform FSC and guide net placement.
The total effective forebay area for the FSC is 51 acres. Kock et al. (2017 Draft) found that FSCs’ with
effective forebay areas of less than 50 acres have substantially higher collection efficiency than those
systems with effective forebay areas >50 acres.
The FSC would have an attraction of flow of at least 1,000 cfs. If possible, attraction flow would be screened
and routed through the turbines to maintain power benefits. Since the turbine intake opening is
approximately 75 ft. below the surface of the lake, fish attraction to turbine flow should be less than to the
Figure 7-7. Concept for possible Location of Chief Joseph FSC (blue box). White line denotes
powerhouse effective forebay area. Total effective forebay area is 51 acres.

P a g e | 109
FSC as juvenile salmon generally migrate near the surface at water temperatures of 16°C or less (occurs
through July at Chief Joseph). A second spot for consideration for an FSC location is near the upstream end
of the forebay area. For this site to be effective, nets would likely have to be used guide fish to the FSC and
prevent fish from passing under or around the FSC. Guide nets would need to withstand river flows of over
150 kcfs which is an order of magnitude greater flow than required by netting systems at existing FSCs12.
Because Rufus Woods Lake elevation generally varies less than 5 ft., a second concept that may work in
place of the FSC would be a Rocky Reach Dam style corner collector. Chelan County PUD, using this type
of collector with an attraction flow of 6,000 cfs, combined with spill, has achieved project survival rates
>93% for Sockeye and Chinook. The effective forebay size where the collector is located is 12 acres (Figure
7-8). (http://www.chelanpud.org/docs/default-source/default-document-library/er_project_updates.pdf ).
Other juvenile fish passage system concepts that may be implemented at Chief Joseph Dam can be found
in a report written in 2000 (Battelle Northwest 2000). The report looks at a range of concepts and provides
cost data as well. The study concluded that a feasibility study should be undertaken to address fish behavior
and reservoir hydraulics, and that a successful system is likely to combine several options.
12 A detailed description of a head of reservoir FSC with guide nets concept was developed for Lookout Point Dam,
Willamette. See Section 5 of the following report for more info (USACE 2011)
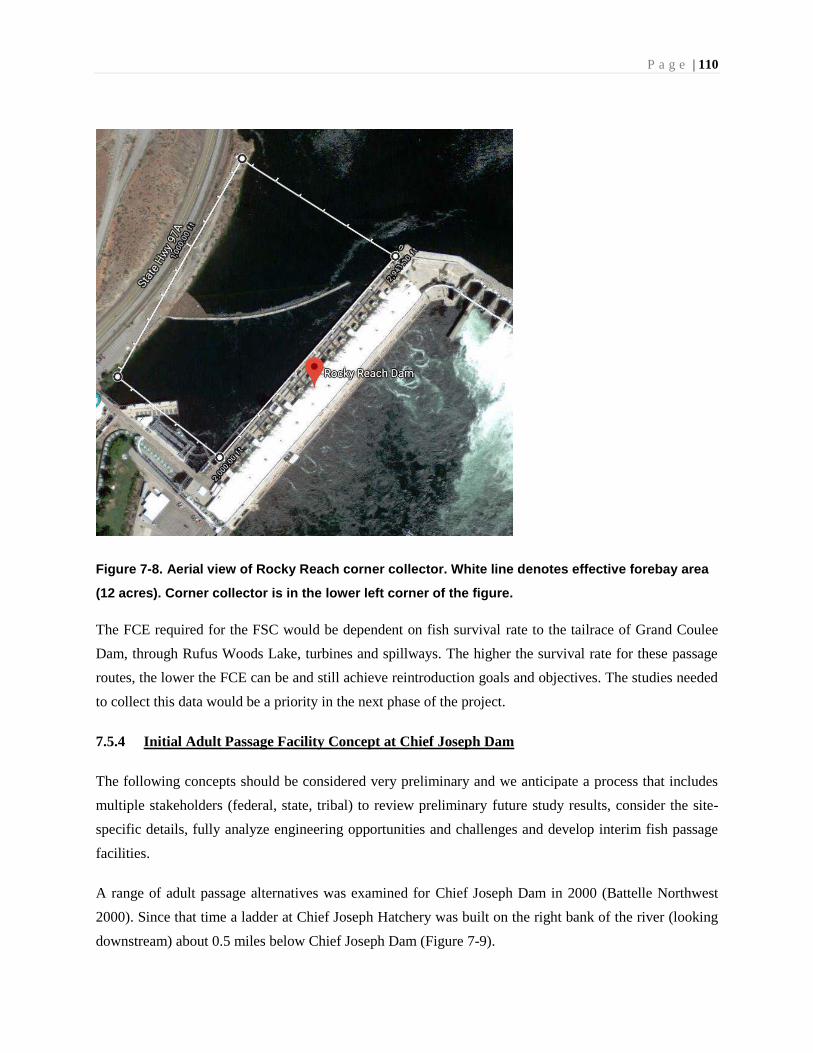
P a g e | 110
Figure 7-8. Aerial view of Rocky Reach corner collector. White line denotes effective forebay area
(12 acres). Corner collector is in the lower left corner of the figure.
The FCE required for the FSC would be dependent on fish survival rate to the tailrace of Grand Coulee
Dam, through Rufus Woods Lake, turbines and spillways. The higher the survival rate for these passage
routes, the lower the FCE can be and still achieve reintroduction goals and objectives. The studies needed
to collect this data would be a priority in the next phase of the project.
7.5.4 Initial Adult Passage Facility Concept at Chief Joseph Dam
The following concepts should be considered very preliminary and we anticipate a process that includes
multiple stakeholders (federal, state, tribal) to review preliminary future study results, consider the site-
specific details, fully analyze engineering opportunities and challenges and develop interim fish passage
facilities.
A range of adult passage alternatives was examined for Chief Joseph Dam in 2000 (Battelle Northwest
2000). Since that time a ladder at Chief Joseph Hatchery was built on the right bank of the river (looking
downstream) about 0.5 miles below Chief Joseph Dam (Figure 7-9).
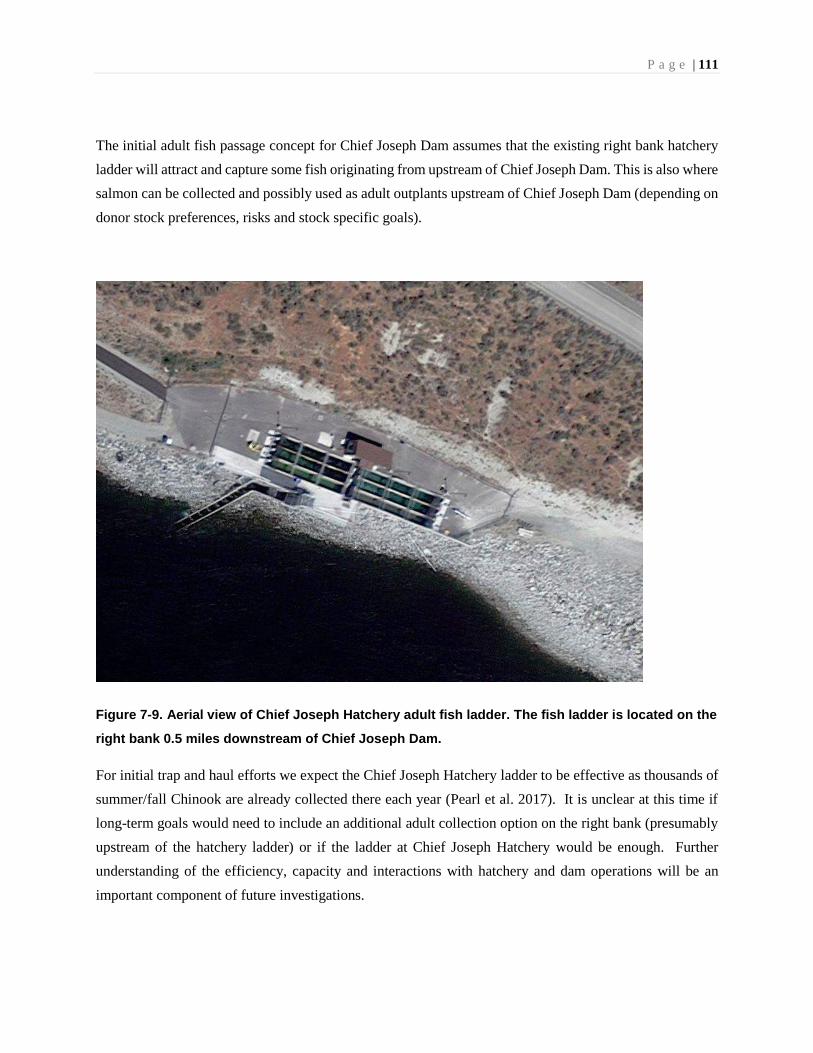
P a g e | 111
The initial adult fish passage concept for Chief Joseph Dam assumes that the existing right bank hatchery
ladder will attract and capture some fish originating from upstream of Chief Joseph Dam. This is also where
salmon can be collected and possibly used as adult outplants upstream of Chief Joseph Dam (depending on
donor stock preferences, risks and stock specific goals).
Figure 7-9. Aerial view of Chief Joseph Hatchery adult fish ladder. The fish ladder is located on the
right bank 0.5 miles downstream of Chief Joseph Dam.
For initial trap and haul efforts we expect the Chief Joseph Hatchery ladder to be effective as thousands of
summer/fall Chinook are already collected there each year (Pearl et al. 2017). It is unclear at this time if
long-term goals would need to include an additional adult collection option on the right bank (presumably
upstream of the hatchery ladder) or if the ladder at Chief Joseph Hatchery would be enough. Further
understanding of the efficiency, capacity and interactions with hatchery and dam operations will be an
important component of future investigations.
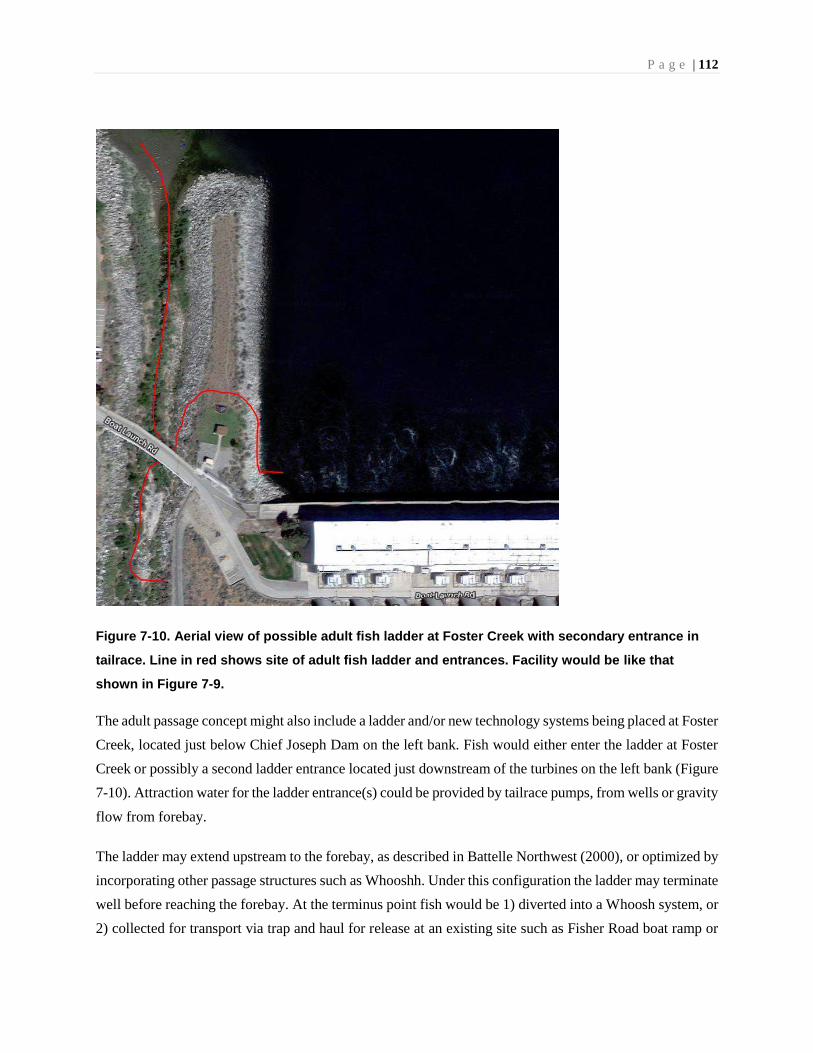
P a g e | 112
Figure 7-10. Aerial view of possible adult fish ladder at Foster Creek with secondary entrance in
tailrace. Line in red shows site of adult fish ladder and entrances. Facility would be like that
shown in Figure 7-9.
The adult passage concept might also include a ladder and/or new technology systems being placed at Foster
Creek, located just below Chief Joseph Dam on the left bank. Fish would either enter the ladder at Foster
Creek or possibly a second ladder entrance located just downstream of the turbines on the left bank (Figure
7-10). Attraction water for the ladder entrance(s) could be provided by tailrace pumps, from wells or gravity
flow from forebay.
The ladder may extend upstream to the forebay, as described in Battelle Northwest (2000), or optimized by
incorporating other passage structures such as Whooshh. Under this configuration the ladder may terminate
well before reaching the forebay. At the terminus point fish would be 1) diverted into a Whoosh system, or
2) collected for transport via trap and haul for release at an existing site such as Fisher Road boat ramp or
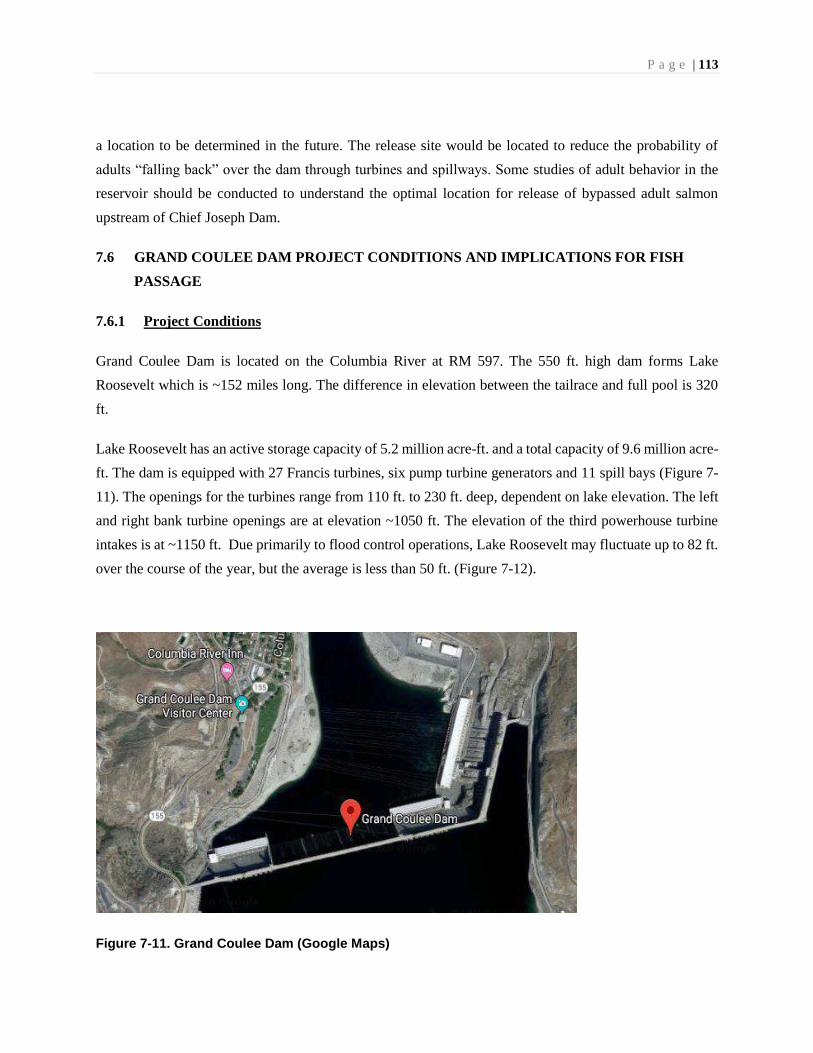
P a g e | 113
a location to be determined in the future. The release site would be located to reduce the probability of
adults “falling back” over the dam through turbines and spillways. Some studies of adult behavior in the
reservoir should be conducted to understand the optimal location for release of bypassed adult salmon
upstream of Chief Joseph Dam.
7.6 GRAND COULEE DAM PROJECT CONDITIONS AND IMPLICATIONS FOR FISH
PASSAGE
7.6.1 Project Conditions
Grand Coulee Dam is located on the Columbia River at RM 597. The 550 ft. high dam forms Lake
Roosevelt which is ~152 miles long. The difference in elevation between the tailrace and full pool is 320
ft.
Lake Roosevelt has an active storage capacity of 5.2 million acre-ft. and a total capacity of 9.6 million acre-
ft. The dam is equipped with 27 Francis turbines, six pump turbine generators and 11 spill bays (Figure 7-
11). The openings for the turbines range from 110 ft. to 230 ft. deep, dependent on lake elevation. The left
and right bank turbine openings are at elevation ~1050 ft. The elevation of the third powerhouse turbine
intakes is at ~1150 ft. Due primarily to flood control operations, Lake Roosevelt may fluctuate up to 82 ft.
over the course of the year, but the average is less than 50 ft. (Figure 7-12).
Figure 7-11. Grand Coulee Dam (Google Maps)

P a g e | 114
Water temperature and river flow at Grand Coulee Dam are like Chief Joseph Dam. The major difference
in operations between the two projects is Lake Roosevelt elevations vary on average about 50 ft annually.
(Figure 7-12). In high flow years the elevation of the lake may fluctuate even more. Lake Roosevelt is
drawn down from February to May in order to meet flood control obligations. Refill begins in May with
the lake reaching full pool (elevation ~1,290 feet) by July.
The percent spill by month for Grand Coulee is presented in Figure 7-13. Percent spill at Grand Coulee
Dam ranges from 1% to 8% from April through July.
Figure 7-12. Average monthly flow (KCFS), Lake Roosevelt elevation (ft.) and water temperature
(0C) (2007-2016).
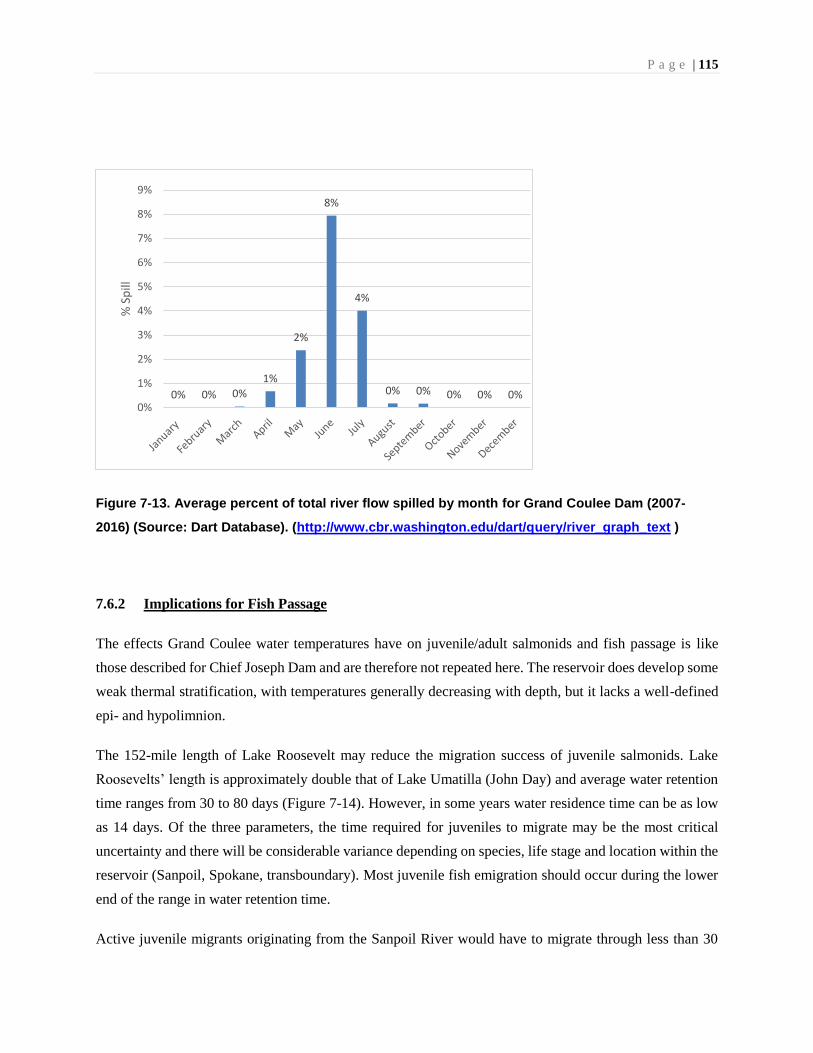
P a g e | 115
Figure 7-13. Average percent of total river flow spilled by month for Grand Coulee Dam (2007-
2016) (Source: Dart Database). (http://www.cbr.washington.edu/dart/query/river_graph_text )
7.6.2 Implications for Fish Passage
The effects Grand Coulee water temperatures have on juvenile/adult salmonids and fish passage is like
those described for Chief Joseph Dam and are therefore not repeated here. The reservoir does develop some
weak thermal stratification, with temperatures generally decreasing with depth, but it lacks a well-defined
epi- and hypolimnion.
The 152-mile length of Lake Roosevelt may reduce the migration success of juvenile salmonids. Lake
Roosevelts’ length is approximately double that of Lake Umatilla (John Day) and average water retention
time ranges from 30 to 80 days (Figure 7-14). However, in some years water residence time can be as low
as 14 days. Of the three parameters, the time required for juveniles to migrate may be the most critical
uncertainty and there will be considerable variance depending on species, life stage and location within the
reservoir (Sanpoil, Spokane, transboundary). Most juvenile fish emigration should occur during the lower
end of the range in water retention time.
Active juvenile migrants originating from the Sanpoil River would have to migrate through less than 30
0% 0% 0%
1%
2%
8%
4%
0% 0% 0% 0% 0%0%
1%
2%
3%
4%
5%
6%
7%
8%
9%
% S
pill
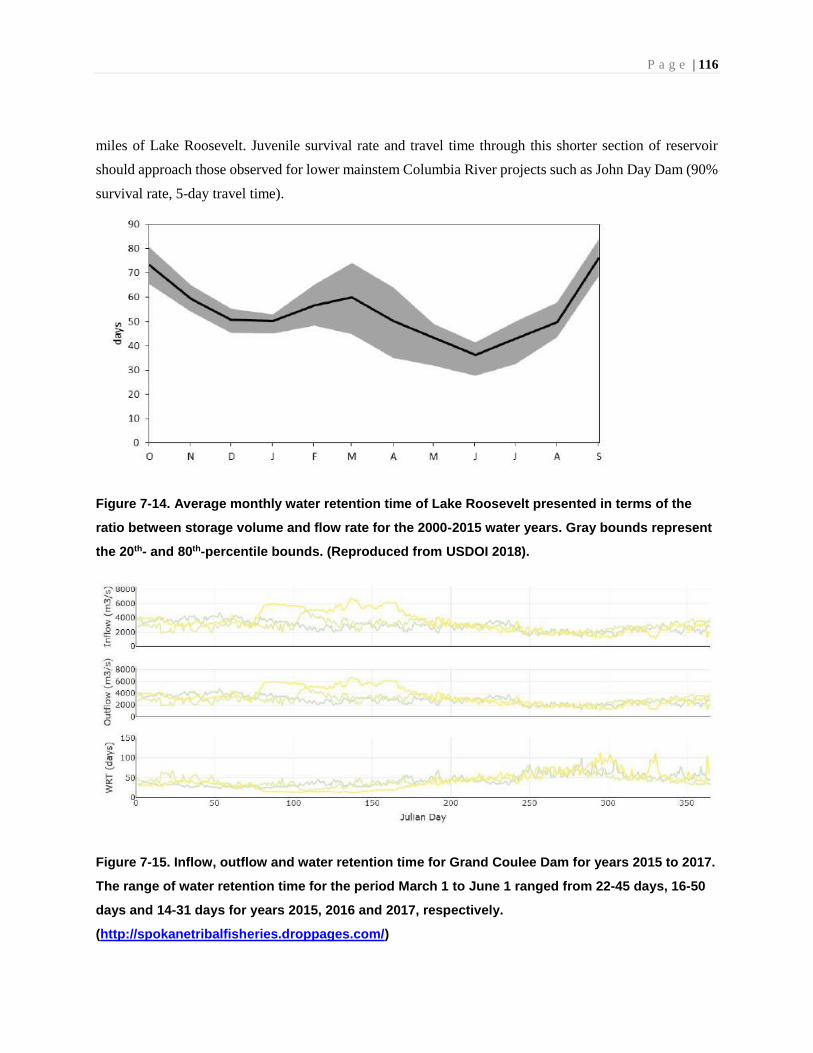
P a g e | 116
miles of Lake Roosevelt. Juvenile survival rate and travel time through this shorter section of reservoir
should approach those observed for lower mainstem Columbia River projects such as John Day Dam (90%
survival rate, 5-day travel time).
Figure 7-14. Average monthly water retention time of Lake Roosevelt presented in terms of the
ratio between storage volume and flow rate for the 2000-2015 water years. Gray bounds represent
the 20th- and 80th-percentile bounds. (Reproduced from USDOI 2018).
Figure 7-15. Inflow, outflow and water retention time for Grand Coulee Dam for years 2015 to 2017.
The range of water retention time for the period March 1 to June 1 ranged from 22-45 days, 16-50
days and 14-31 days for years 2015, 2016 and 2017, respectively.
(http://spokanetribalfisheries.droppages.com/)
P a g e | 117
A key point here is that the majority of Sanpoil River Sockeye are expected to migrate into Lake Roosevelt
as fry and rear for one year before migrating to the dam. As they rear, they will distribute themselves in a
currently unknown distribution in Lake Roosevelt. Thus, the distance these juveniles would have to migrate
to reach the dam will likely vary, with some having to migrate a few miles and others 10’s of miles. Since
this distribution is not known, migration mortality these fish experienced was captured in modeling
assumptions for the rearing life stage.
The rearing conditions Sanpoil River Sockeye experience could have a major effect on outcomes as LCM
results forecast that 86% of the Sockeye NOR and HOR production modeled is associated with this
population.
The 50 ft. Lake Roosevelt surface elevation change may pose design problems for both juvenile and adult
passage facilities. Juvenile facilities will have to effectively function over this range of elevation because
the flood control drawdown and refill occurs concurrently with juvenile outmigration. For returning adults,
considerably less flexibility may be needed depending on which species are included and if objectives can
be met with less than 100% temporal coverage during high water years. The largest change in lake
elevations occurs during the spring from March to June (Figure 7-12). This period will coincide with the
expected migration window for spring migrating juveniles. This decrease in lake elevation, and increase in
river flow, results in the lowest water retention time for the lake (Figure 7-14 and 7-15). Fish migrating in
mid-May to July 1 will encounter a reservoir that is filling and exhibiting longer retention time.
The percent of total project discharge passing via the spillway is less than about 8%. If percent flow equals
percent fish using that route, then less than 8% of the juveniles migrating from April to May will pass via
the spillway. Juvenile survival rate for the Grand Coulee spillway is unknown.
Because the project does spill in the spring, there could be an opportunity to route this flow through a
secondary juvenile collector located at or near the spillway without decreasing power generation.
7.6.3 Initial Juvenile Passage Facility Concept at Grand Coulee Dam
As was the case for Chief Joseph Dam, the following options are initial concepts that will need to be further
developed and evaluated with and by the dam owners and operators (USBR, Bonneville Power
Administration) during future studies.

P a g e | 118
The initial concept modeled assumes the use of two FSCs to collect juvenile migrants upstream of Grand
Coulee Dam. The first would be located at the Third Powerhouse and the second at the head of reservoir
(i.e., in Lake Roosevelt, perhaps 100 miles upstream).
The Third Powerhouse FSC could be located at the downstream terminus of the powerhouse (Figure 7-
16)13. This location in the forebay is like that of the Rocky Reach Corner Collector. The effective forebay
area associated with the FSC is approximately 11 acres; therefore, FCE should be high based on results
from other FSCs with similar effective forebay area in the region (Kock et al. 2017 (draft)). For example,
River Mill and North Fork Dam (Clackamas River) have an effective forebay area ranging from 7-17 acres
and FCE is generally greater than 95% for Chinook, Coho and steelhead. Having a turbine entrance depth
of 100 ft. below the FSC should reduce turbine flow competition with the FSC flow which may further
enhance FCE.
Johnson et al. (2005) reported that flow entering the forebay moved parallel to the Third Powerhouse,
toward where the FSC could be located. Water velocities varied with flow through the powerhouse and
were relatively high (up to 0.8 m/s). Hydroacoustic surveys conducted at the same time indicated that fish
were located toward the back (downstream) end of the forebay (see FSC location in Figure 7-16). The
authors noted that this was a favorite area for anglers to fish.
Hydroacoustic based estimates of resident fish entrainment conducted at Grand Coulee Dam in the 1990’s
estimated that 85% of all fish entrainment over a three-year period occurred at the Third Powerhouse
(Figure 7-17) (LeCaire 2000), providing additional support for placing an FSC at this location.
13 The FSC could also be located at the entrance to the powerhouse if it was possible to use a guidance structure such
as partial netting to prevent fish from entering the forebay. The results of fish behavior studies at the project would be
used to select a preferred location.
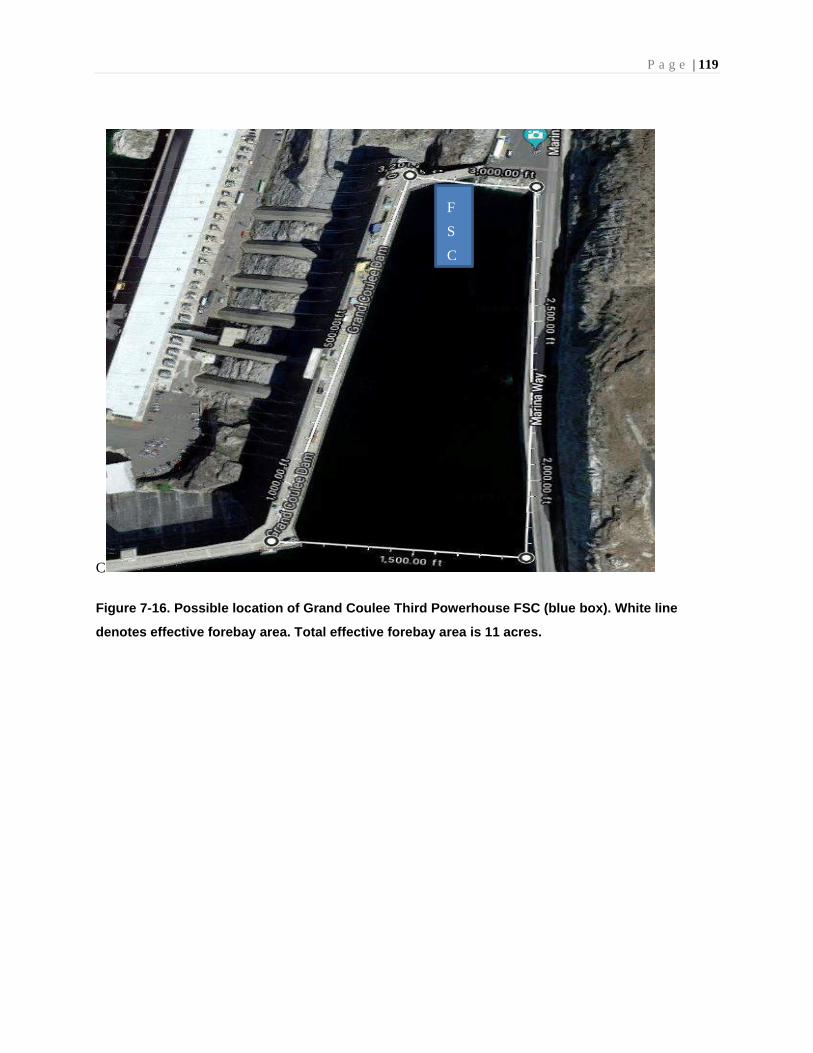
P a g e | 119
C
Figure 7-16. Possible location of Grand Coulee Third Powerhouse FSC (blue box). White line
denotes effective forebay area. Total effective forebay area is 11 acres.
F
S
C
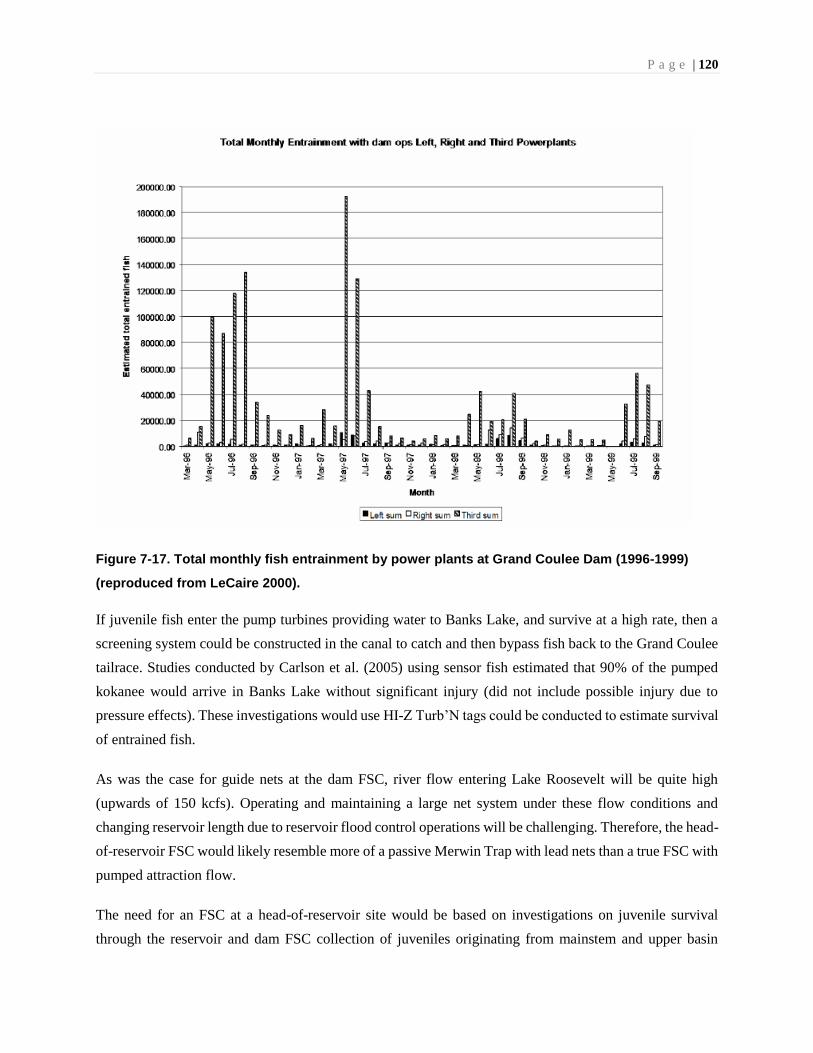
P a g e | 120
Figure 7-17. Total monthly fish entrainment by power plants at Grand Coulee Dam (1996-1999)
(reproduced from LeCaire 2000).
If juvenile fish enter the pump turbines providing water to Banks Lake, and survive at a high rate, then a
screening system could be constructed in the canal to catch and then bypass fish back to the Grand Coulee
tailrace. Studies conducted by Carlson et al. (2005) using sensor fish estimated that 90% of the pumped
kokanee would arrive in Banks Lake without significant injury (did not include possible injury due to
pressure effects). These investigations would use HI-Z Turb’N tags could be conducted to estimate survival
of entrained fish.
As was the case for guide nets at the dam FSC, river flow entering Lake Roosevelt will be quite high
(upwards of 150 kcfs). Operating and maintaining a large net system under these flow conditions and
changing reservoir length due to reservoir flood control operations will be challenging. Therefore, the head-
of-reservoir FSC would likely resemble more of a passive Merwin Trap with lead nets than a true FSC with
pumped attraction flow.
The need for an FSC at a head-of-reservoir site would be based on investigations on juvenile survival
through the reservoir and dam FSC collection of juveniles originating from mainstem and upper basin

P a g e | 121
spawning habitats. Fish collected and retained at an FSC could be transferred to floating net pens or barges
and transported down reservoir for release into the FSC at the Third Powerhouse to avoid reservoir related
mortality. This approach (barging) was used at Mossyrock Dam on the Cowlitz River in the late 1960’s
(WDF 1970). The Corps of Engineers is exploring using a vessel to transfer fish from the proposed Cougar
Dam FSC to a release point in the tailrace.
At Grand Coulee and Chief Joseph dams, FSCs could also be used to collect and relocate resident fish
species (i.e., trout and kokanee) back into the reservoir to prevent their entrainment through the turbines
and loss to the local fisheries. These larger, resident fish could be screened, automatically sorted, and
diverted to floating net pens or barges for later transport and release up reservoir. At Grand Coulee Dam
alone, this could save 100’s of thousands of fish annually that are currently lost to the reservoir fisheries.
FSCs might also be useful in managing non-indigenous, predatory game fish (i.e., Walleye, bass and
Northern Pike).
7.6.4 Initial Adult Passage Facility Concept at Grand Coulee Dam
The following concepts should be considered very preliminary and we anticipate a process that includes
multiple stakeholders (federal, state, tribal) to review preliminary study results, consider the site-specific
details, fully analyze engineering opportunities and challenges and develop interim fish passage facilities.
Interim, steep pass fish collectors (or other structures yet to be determined) could be installed on each river
bank downstream of Grand Coulee Dam and operated with pumped tailrace flows (Figure 7-18). Pumping
would be needed during the adult passage season for summer/fall Chinook and Sockeye Salmon. Pumped
water would include that necessary for operation of the ladders and a greater quantity for attraction flows.
Each interim steep pass adult collection structure could terminate at a landing below the dam where fish
could enter a Whooshh system and be lifted to the forebay and released (www.Whooshh.com). If such a
system was not practical, then fish could be loaded into trucks and transported upstream of the dam. The
release point would be chosen to prevent adult fish from passing back downstream (fallback) through spill
bays and turbines.
Interim facilities need to be enough to allow assessment of the viability of a salmon reintroduction. Passage
performance improvement to desired, longer-term standards could be deferred to a decision on any
permanent facilities. By that time, there should be enough local and regional information on the efficacy of
the Whooshh system, compared to trap-and-haul or traditional concrete ladders. Or perhaps other adult fish
passage technologies will be developed as testing is underway.
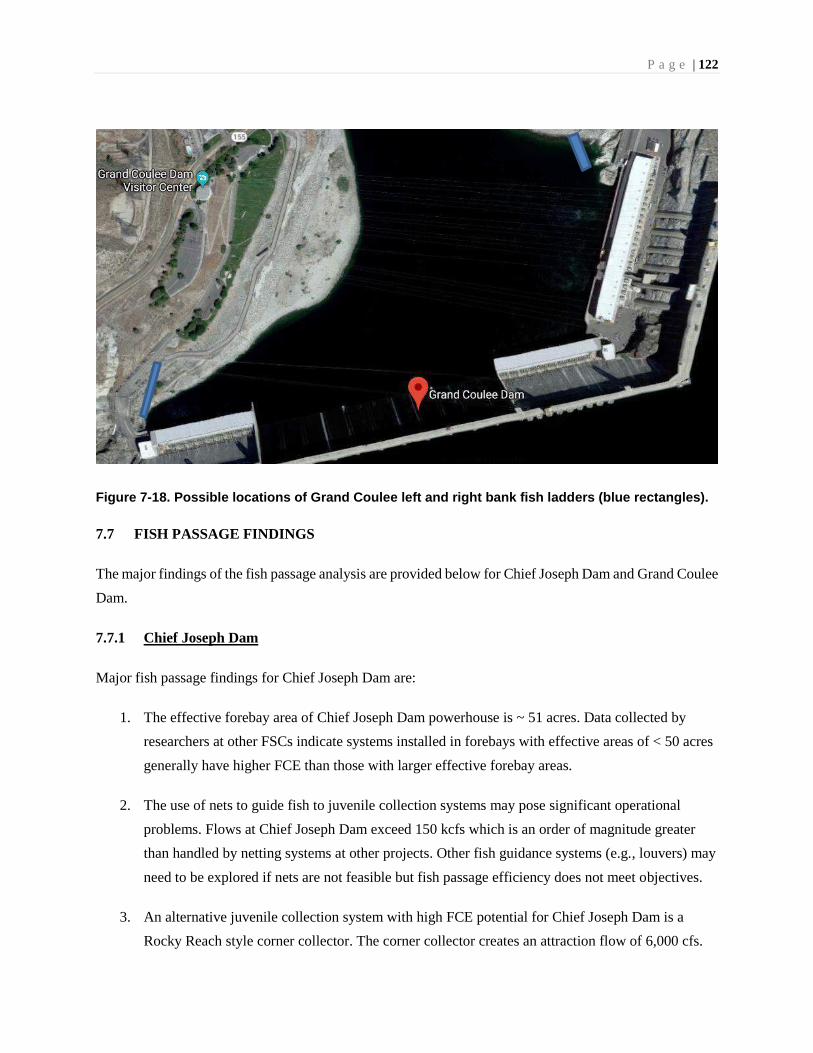
P a g e | 122
Figure 7-18. Possible locations of Grand Coulee left and right bank fish ladders (blue rectangles).
7.7 FISH PASSAGE FINDINGS
The major findings of the fish passage analysis are provided below for Chief Joseph Dam and Grand Coulee
Dam.
7.7.1 Chief Joseph Dam
Major fish passage findings for Chief Joseph Dam are:
1. The effective forebay area of Chief Joseph Dam powerhouse is ~ 51 acres. Data collected by
researchers at other FSCs indicate systems installed in forebays with effective areas of < 50 acres
generally have higher FCE than those with larger effective forebay areas.
2. The use of nets to guide fish to juvenile collection systems may pose significant operational
problems. Flows at Chief Joseph Dam exceed 150 kcfs which is an order of magnitude greater
than handled by netting systems at other projects. Other fish guidance systems (e.g., louvers) may
need to be explored if nets are not feasible but fish passage efficiency does not meet objectives.
3. An alternative juvenile collection system with high FCE potential for Chief Joseph Dam is a
Rocky Reach style corner collector. The corner collector creates an attraction flow of 6,000 cfs.

P a g e | 123
The Chelan County PUD has been able to achieve total project survival rates for Chinook and
Sockeye of greater than 93% using this system combined with spill.
4. Water retention time in Rufus Woods Lake is estimated at less than 5-days, which is similar to
John Day Dam (Lake Umatilla). Juvenile travel time and survival rate at this project are 5-days
and ~90%, respectively. The 90% value includes both dam and reservoir (i.e., lake) survival.
5. Water temperature conditions in Rufus Woods Lake are good for juvenile migration and rearing
through at least July. As summer progresses lake temperatures increase, but average monthly
temperature is less than approximately 200 C. Modeling results assume that 85% of the
summer/fall Chinook leave as spring migrants so summer water temperatures will not be an issue
for this life history type.
6. Spill operations at Chief Joseph Dam occur primarily in the same period as juvenile fish are
migrating in the spring. If it is assumed that the percentage of juveniles using spillways for
passage is equal to the percent of total project discharge passing via the spillway, then from 1% to
20% of the juveniles may pass via the spillway from March to July. Juvenile survival rate for the
spillway, as well as turbines, is unknown.
7. Adult summer/fall Chinook are expected to arrive at Chief Joseph Dam from late June to early
November; Sockeye from mid-June to early September. Water temperatures on average during
this period will still likely be below or near the 200C DADM EPA recommended value. In recent
years, Okanogan River summer/fall Chinook and Sockeye adults have done very well despite
having to pre-spawn hold in the Columbia River due to a thermal barrier at the mouth of the
Okanogan River.
8. There is an existing fish ladder downstream of Chief Joseph Dam at the Chief Joseph Hatchery.
This ladder may be used to collect migrating adults and pass them upstream. The collection
efficiency of this ladder for fish not originating from the hatchery is unknown, however,
thousands of summer/fall Chinook are collected there each year and many of them are not from
that hatchery.
9. A second ladder could be readily constructed at Foster Creek on the left bank below Chief Joseph
Dam. Additional ladder entrances could be in the tailrace of the powerhouse. A Whooshh system
could provide the means to pass fish from a partial ladder to a release point in the forebay.
P a g e | 124
It appears that the environmental, operational and structural conditions at Chief Joseph Dam show good
potential to produce a system that provides safe, timely and effective fish passage for summer/fall Chinook
and Sockeye Salmon
7.7.2 Grand Coulee Dam
Major fish passage findings for Grand Coulee Dam are:
1. The effective forebay area of Grand Coulee Dam Third Powerhouse is ~ 11 acres, therefore FCE
should be high based on results from other FSCs in the region. For example, River Mill and North
Fork Dam (Clackamas River) have effective forebay area ranging from 7-17 acres and FCE is
generally greater than 95% for Chinook, Coho and steelhead.
2. Hydroacoustic studies conducted at Grand Coulee in the 1990’s indicated that 85% of fish
entrained at the project was via the Third Powerhouse, providing evidence that an FSC located at
this location may exhibit high FCE.
3. While an FSC located at the Third Powerhouse may be effective (high FCE), there are two other
powerhouses that may attract and pass fish when operating. The proportion of the fish passing
each of the three powerhouses may or may not be related to total flow through each and it’s not
known if a single collector would be enough to achieve goals. Fish behavior studies would need
to be undertaken to document how summer/fall Chinook and Sockeye approach and pass the dam
to determine if additional juvenile collection or guidance systems are needed.
4. Based on sensor fish data, fish survival through pump/generators diverting water to Banks Lake
may survive at a high rate (90%). Siting a juvenile collection system in the canal may be an
option if fish entrainment rate is high.
5. The average 50 ft. seasonal Lake Roosevelt surface elevation change must be considered,
particularly for juvenile passage facilities. It is possible that adult collection and bypass facilities
could function over a much narrower range of elevation changes that occur from late June to early
November, particularly for summer/fall Chinook and Sockeye.
6. The largest change in lake elevations occurs during the spring from March to June. This period
will coincide with the expected migration window for spring migrating juveniles. The decrease in
lake elevation, and increase in river flow, results in the lowest water retention time for the lake
(Figure 7-14 and 7-15). Thus, project operations are compatible with fish migration needs
P a g e | 125
through mid-May.
7. The use of nets to guide fish to juvenile collection systems has the potential to increase FCE but may
pose operational problems. Flows at Grand Coulee Dam exceed 150 kcfs which is an order of
magnitude greater than handled by netting systems at other projects.
8. The need for an FSC at a head-of-reservoir site would be based on investigations on survival and dam
FSC collection of juveniles originating from mainstem and upper basin spawning habitats and
migrating through the long reservoir. Also, other complimentary reintroduction efforts in Canada
could influence the need for such an FSC.
9. The 20- to 80 percentile bounds for water retention time in the 152-mile Lake Roosevelt ranges
between 30-80 days. In high flow years water retention time may be as low as two weeks. If water
retention time predicts the amount of time juveniles require to migrate through the lake, then the
achievement of timely passage and survival may be difficult to achieve for actively migrating smolts.
Predation rate on migrating juveniles is unknown due to uncertainties in species and life stage specific
abundance and their potential overlap in time and space. If survival and behavior do not meet
objectives, then specific studies to understand the roles and interactions of water retention time and
predation should be considered along with the siting of a head of reservoir FSC.
10. Actively migrating fish from the Sanpoil River would only have to migrate through 30 miles of Lake
Roosevelt to reach the dam. Of high importance is the quality of the juvenile Sockeye rearing habitat
provided by the lake, as the Sanpoil River population is expected to produce 86% of the total Sockeye
production for the area modeled.
11. The ability of juvenile summer/fall Chinook and Sockeye to migrate through Lake Roosevelt at a high
survival rate is not as critical as it seems for achievement of goals, at least for the U.S. populations
modeled. Both summer/fall Chinook and Sockeye are expected to spawn in riverine habitat and
resulting fry rear in Lake Roosevelt. As they rear, they will distribute themselves in a currently
unknown distribution in Lake Roosevelt. Thus, the distance these juveniles would have to migrate to
reach the dam will likely vary, with some having to migrate a few miles and others 10’s of miles
12. Water temperature conditions in Lake Roosevelt are good for juvenile migration and rearing through
at least July. As summer progresses, lake temperatures increase, but average monthly temperature is
less than approximately 20°C and fish are expected to be able to find thermal refugia at depth
(Sockeye) or in tributaries and reservoirs (Chinook).
P a g e | 126
13. Spill operations at Grand Coulee occur primarily in the same period as juvenile fish are migrating in
the spring. If it is assumed that the percentage of juveniles using spillways for passage is equal to the
percent of total project discharge passing via the spillway, then less than 8% of the juveniles may pass
via the spillway from April to July. Juvenile survival rate for the spillway, as well as turbines, is
unknown.
14. Because the project spills during the spring, this flow could be routed into a juvenile collector system
without impacting power operations.
15. Adult summer/fall Chinook are expected to arrive at Grand Coulee Dam from late June to early
November; Sockeye from mid-June to mid-September. Water temperatures on average during this
period will still likely be below or near the 20°C DADM EPA recommended value. In recent years,
Okanogan River summer/fall Chinook and Sockeye adults have done very well despite having to pre-
spawn hold in the Columbia River due to a thermal barrier at the mouth of the Okanogan River.
16. Project structures and operations appear to be conducive for building a juvenile collection system
with potential high FCE at the Grand Coulee Dam Third Powerhouse. The effective forebay area at
the Third Powerhouse is only 11 acres. Data collected at other FSC locations show that FCE can be
greater than 95% when effective forebay size ranges from about 7-50 acres (Kock et al. 2017 (Draft)).
Additionally, fish entrainment studies conducted at the dam indicated that 85% of the fish
entrainment occurred at the Third Powerhouse.
17. It appears feasible to build interim adult passage facilities in the tailrace of Grand Coulee Dam. The
facilities may consist of a short steep pass ladder that terminates 50 ft. or above the tailrace water
level into a holding facility. Here fish could be lifted over the dam using a Whooshh system or
transported and released upstream. Ladder and attraction flow could be provided by pumps located in
the tailrace.
18. It appears that fish facilities and reintroduction could be successfully attained with minimal or no
impacts to current project purposes and benefits.
In conclusion, environmental, operational and structural conditions at Grand Coulee Dam show good
potential to produce a fish passage system that provides safe, timely and effective fish passage for
summer/fall Chinook and Sockeye Salmon.
P a g e | 127
7.8 REFERENCES
Adams N., T. Liedtke, J. Plumb, L. Weiland, A. Hansen and S. Evans. Emigration and Transportation Stress
of Juvenile Chinook Salmon Relative to their Reintroduction Upriver of Shasta Dam, California, 2017-
2018.
Battelle Northwest. 2000. Chief Joseph Dam: Preliminary Investigations of Fish Passage Alternatives.
Carlson, T., J. Duncan, and R. Johnson. 2005. Characterization of Pump Flow at the Grand Coulee Dam
Pumping Station for Fish Passage, 2004.
ENSR 2011. Surface Bypass Program Comprehensive Review Report. Prepared for the U.S. Army Corps
of Engineers. Portland District.
Faulkner J., D. Widener. S. Smith, T. Marsh and R. Zabel. 2017. Survival Estimates for the Passage of
Spring-Migrating Juvenile Salmonids through Snake and Columbia River Dams and Reservoirs, 2016.
Federal Energy Regulatory Commission (FERC). 2001. Draft EIS: Cowlitz River Hydroelectric Project
(No. 2016-044), WA.
Giorgi A. and K. Malone. 2013. Reservoir Rearing and Migration Issues Willamette Basin Projects:
Chinook. Final Memo: September 2013.
Johnson R., C. McKinstry, C. Cook, D. Tano, D. Faber, S. Francis, S. Simmons, C. Simmons, R. Brown,
S. Thorsten, R. LeCaire. 2005. Strobe light deterrent efficiency test and fish behavior determination at
Grand Coulee Dam and Third Power Plant Forebay. Battelle Northwest National Library.
Kock T., N. Verretto, N. Ackerman, R. Perry. M. Garello, J. Beaman, and S. Fielding. 2017. Performance
of surface collection for downstream passage of juvenile Pacific salmonids (Oncorhynchus spp.) at high
head dams.
Kock. T., R. Perry, G. Hansen, P. Haner. A. Pope, J. Plumb, K. Cogliati and A. Hansen. 2018. Evaluation
of Chinook Salmon Fry Survival in Lookout Point Reservoir, Oregon, 2017.
LeCaire R. 2000. Chief Joseph: Kokanee Enhancement Project. Draft Final Annual Report and Final Report
on Fish Entrainment. Prepared by Colville Tribes of the Colville Indian Reservation. BPA Project No.
9501100.
P a g e | 128
Linnansaari. T., B. Wallace, R. Curry and G. Yamazaki. 2015. Fish Passage in Large Rivers: A Literature
Review. Mactaquac Aquatic Ecosystem Study. Report Series 2015-2016
Monzyk. F., R. Emig, J. Romer, T. Friesen. 2015. Life-History Characteristics of Juvenile Spring Chinook
Salmon Rearing in Willamette Valley Reservoirs. USACE: Portland District.
PacifiCorp. 2018. Lewis River Fish Passage Program 2017 Annual Report (Final).
National Marine Fisheries Service (NMFS). 2011. Anadromous Salmonid Passage Facility Design.
Northwest Power and Conservation Council (NPCC). 2016. Staff Paper: Review of Fish Passage
Technologies at High Head Dams.
Rieman. B., R. Beamesderfer, S. Vigg and T. Poe. 1991. Estimated Loss of Juvenile Salmonids to Predation
by Northern Squawfish, Walleyes and Smallmouth Bass in John Day Reservoir, Columbia River.
https://www.tandfonline.com/doi/abs/10.1577/1548-
8659(1991)120%3C0448%3AELOJST%3E2.3.CO%3B2
Tacoma Power. 1997. Progress Report: 1997 Juvenile Salmonid Radio-Tagging Study Conducted at the
Cowlitz Hydroelectric Project.
U.S. Army Corps of Engineers (USACE). 2005. Water Temperature Studies at Chief Joseph Dam,
Washington 2003: Data Review and Synthesis. Seattle District.
U.S. Corps of Engineers (USACE). 2011. Alternatives Report: Lookout Point Dam, Middle Fork
Willamette River, Oregon. Lookout Point Head of Reservoir Collection alternatives Study. Prepared by
CH2MHILL, AECOM and BioAnalysts.
United States Department of Interior (DOI). 2006. Water Resources Technical Publication: Fish Protection
at Water Diversions. A Guide for Planning and Designing Fish Exclusion Facilities. DOI, Bureau of
Reclamation, Denver Colorado.
United States Department of Interior (DOI). 2018. Thermal Regime of the Columbia River at Lake
Roosevelt. DOI, Bureau of Reclamation, Pacific Northwest Regional Office, Boise, Idaho.
United States Environmental Protection Agency (EPA). 2003. EPA Region 10 Guidance for Northwest
State and Tribal Temperature Water Quality Standards.

P a g e | 129
United States Geological Survey (USGS). 2010. Juvenile salmonid collection efforts in the Upper Cowlitz
River Basin: 2009 evaluations, final report series no. 2010-01.
Washington Department of Fisheries. 1970. Cowlitz River Salmon Hatchery and Reservoir Production
Program: Annual Report 1967 and 1968.
Wolvert S. and H. McLellan. 2018. Chief Joseph Kokanee Enhancement Project. Confederated Tribes of
the Colville Indian Reservation. BPA Project #1995-011-00.
Zimmerman M., C. Kinsel, E. Beamer, E. Connor, D. Pflug. 2015. Abundance, Survival and Life History
Strategies of Juvenile Chinook salmon in the Skagit River, Washington. Transactions of the American
Fisheries Society. April 28, 2015.
P a g e | 130
8.0 FUTURE FIELD STUDIES AND RECOMMENDATIONS
As stated at the beginning of this report, its purpose is to determine if the reintroduction of salmon to the
United States portion of the upper Columbia River upstream of Chief Joseph Dam is likely to achieve
identified goals given current hydrologic operations, riverine and reservoir habitat condition, donor stock
availability, reintroduction risk to native species and effectiveness of state-of-the-art juvenile and adult
passage technology. A positive determination will lead to field studies will be implemented to address key
assumptions, and interim passage facilities operated and tested to begin the reintroduction effort.
The analyses provided in this report show that a positive determination is warranted and therefore additional
field studies could commence to address key assumptions and develop, and test needed interim facilities.
An initial set of possible activities and interim facilities are described in this section for both Chief Joseph
Dam and Grand Coulee Dam. We expect this section to evolve with further science and policy review
during the finalization of this report and throughout future study development.
It should be noted that detailed study methods would be developed once the decision is made to proceed
and resources are provided to carry out the work.
8.1 CHIEF JOSEPH ACTIVITIES
Future activities will be focused on testing the key assumptions for the Baseline condition for summer/fall
Chinook described below. The interim facilities needed to conduct the studies and begin the reintroduction
effort are also discussed.
8.1.1 Testing Key Assumptions
LCM results showed that the Chief Joseph Dam only Baseline scenario produced approximately 16,000
summer/fall Chinook adults, of which 9,400 were harvested and 6,200 returned to spawn. Whether or not
this adult production is realized depends on the accuracy of the assumptions that went into modeling. The
key assumptions used in modeling form the working hypothesis that captures our understanding of how the
system is supposed to work to achieve identified goals. Studies will be focused on testing those assumptions
and their associated metrics that, 1) affect management decisions, 2) are uncertain and 3) are feasible to
observe and estimate in a reasonable period.
P a g e | 131
The key assumptions to be tested are:
1. Fallback rate, spawning and reproductive success of hatchery origin summer/fall Chinook.
The key assumption here is that the adult pre-spawn salmon will stay in the reservoir, find the
available habitat, and that the habitat produces similar egg to spring migrant survival rates as the
Hanford Reach (0.42) and adult pre-spawn survival is at least 72%.
2. Juvenile Chinook survival rate through Rufus Woods Lake, Chief Joseph turbines and
spillways. Survival rates are expected to be high (>90%) for the lake and approximately 50% for
turbines and spillways. The higher the survival rate for these areas the lower the FCE of the
proposed FSC can be and still achieve program goals.
3. Juvenile survival rate from Chief Joseph Dam to Bonneville Dam. The assumption is that
juvenile survival rates are like those observed for Okanogan River summer/fall Chinook (27%).
4. Adult survival rate from Bonneville Dam to Chief Joseph Dam/Wells Dam. The assumption
is that adult survival rates are similar to those observed for Okanogan River summer/fall Chinook
(83%).
5. Adult collection efficiency of Chief Joseph hatchery ladder. The hatchery ladder currently
provides a location where returning adults can be collected and passed upstream14. If the
collection efficiency of this facility is high (95%) then an additional adult collection facility
below Chief Joseph Dam may not be needed.
6. Adult behavior Chief Joseph tailrace. How fish approach and congregate in the tailrace will be
used to inform possible sites for the placement of a fish ladder and associated entrances.
The methods used to conduct the studies (Table 8-1) will also provide needed information on juvenile fish
behavior as they approach and pass Chief Joseph Dam under both spill and no spill conditions. This data
will be used to help site the proposed FSC at the dam and infer how effective such a system might be given
14 Wells Dam may provide an additional site to capture returning adults if they were PIT Tagged as juveniles.
P a g e | 132
passage results at the more surface-oriented spillways.
8.1.2 Interim Fish Facilities
The interim facilities required are those needed to conduct the studies and begin the reintroduction program.
For Chief Joseph Dam these include:
• Hatchery for incubation and early rearing of summer/fall Chinook juveniles.
• Net pens.
• Prototype juvenile collection system at powerhouse.
• Adult collection/transport system at Chief Joseph tailrace.
As called for in the Baseline scenario, 1,000 hatchery origin adults would be released upstream of Chief
Joseph Dam as soon as feasible. These adults and their offspring are not only needed for testing key
assumptions but also to begin the reintroduction program. LCM results for variant #1 showed that even
with existing assumptions regarding juvenile survival rate through turbines and spill bays, an adult release
of 1,000 fish produces 2,900 total adults in the next generation.
Depending on study protocols, a small Merwin style juvenile collection system (or other type trap) may be
needed in the forebay. This system would be used to collect fish to determine juvenile migration timing,
size, and for additional tagging or detection if needed.
Engineering work would start on the design of possible fish ladder and juvenile collection systems for Chief
Joseph Dam as well. Final design and construction would not begin until biological testing was complete.
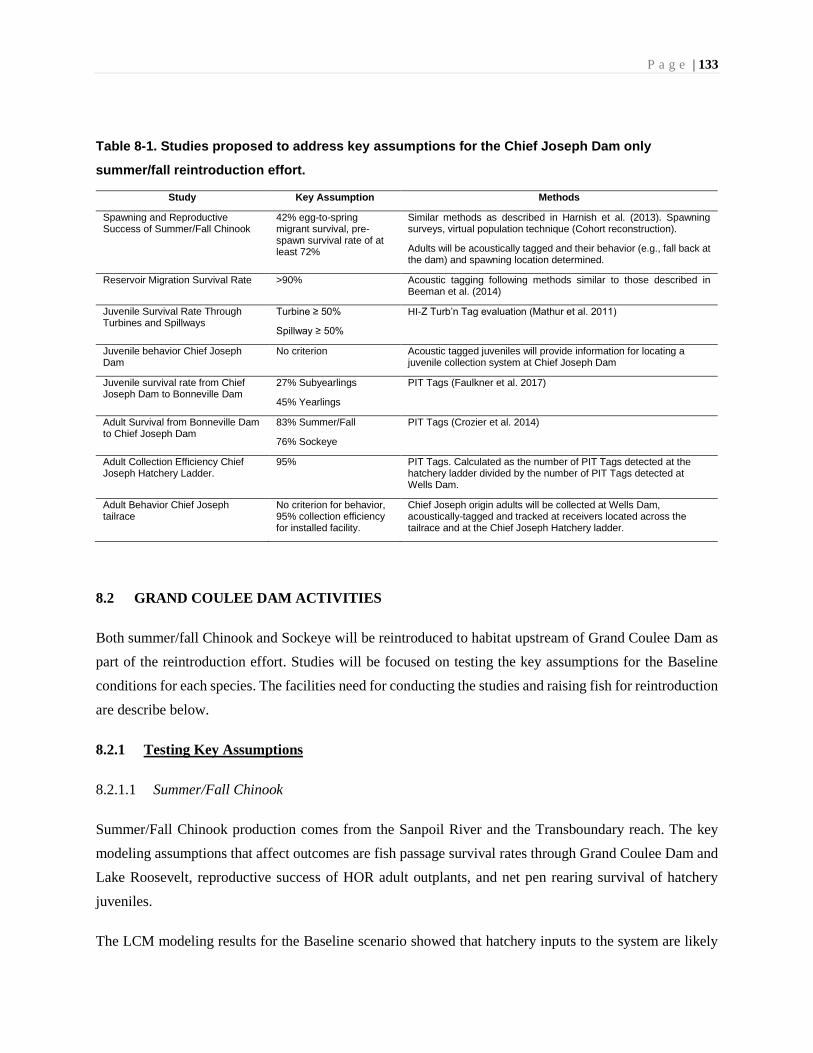
P a g e | 133
Table 8-1. Studies proposed to address key assumptions for the Chief Joseph Dam only
summer/fall reintroduction effort.
Study Key Assumption Methods
Spawning and Reproductive Success of Summer/Fall Chinook
42% egg-to-spring migrant survival, pre-spawn survival rate of at least 72%
Similar methods as described in Harnish et al. (2013). Spawning surveys, virtual population technique (Cohort reconstruction).
Adults will be acoustically tagged and their behavior (e.g., fall back at the dam) and spawning location determined.
Reservoir Migration Survival Rate >90% Acoustic tagging following methods similar to those described in Beeman et al. (2014)
Juvenile Survival Rate Through Turbines and Spillways
Turbine ≥ 50%
Spillway ≥ 50%
HI-Z Turb’n Tag evaluation (Mathur et al. 2011)
Juvenile behavior Chief Joseph Dam
No criterion Acoustic tagged juveniles will provide information for locating a juvenile collection system at Chief Joseph Dam
Juvenile survival rate from Chief Joseph Dam to Bonneville Dam
27% Subyearlings
45% Yearlings
PIT Tags (Faulkner et al. 2017)
Adult Survival from Bonneville Dam to Chief Joseph Dam
83% Summer/Fall
76% Sockeye
PIT Tags (Crozier et al. 2014)
Adult Collection Efficiency Chief Joseph Hatchery Ladder.
95% PIT Tags. Calculated as the number of PIT Tags detected at the hatchery ladder divided by the number of PIT Tags detected at Wells Dam.
Adult Behavior Chief Joseph tailrace
No criterion for behavior, 95% collection efficiency for installed facility.
Chief Joseph origin adults will be collected at Wells Dam, acoustically-tagged and tracked at receivers located across the tailrace and at the Chief Joseph Hatchery ladder.
8.2 GRAND COULEE DAM ACTIVITIES
Both summer/fall Chinook and Sockeye will be reintroduced to habitat upstream of Grand Coulee Dam as
part of the reintroduction effort. Studies will be focused on testing the key assumptions for the Baseline
conditions for each species. The facilities need for conducting the studies and raising fish for reintroduction
are describe below.
8.2.1 Testing Key Assumptions
8.2.1.1 Summer/Fall Chinook
Summer/Fall Chinook production comes from the Sanpoil River and the Transboundary reach. The key
modeling assumptions that affect outcomes are fish passage survival rates through Grand Coulee Dam and
Lake Roosevelt, reproductive success of HOR adult outplants, and net pen rearing survival of hatchery
juveniles.
The LCM modeling results for the Baseline scenario showed that hatchery inputs to the system are likely
P a g e | 134
needed over the long term to maintain adult production. This result occurs because expected harvest rate
(0.58-0.62) is much larger than the MSY harvest rate for the two natural populations (0.01 and 0.31) given
modeling estimates of adult productivity (Table 8-2). Modeling indicates for expected harvest rates, the
hatchery component will still produce sufficient adult returns to meet broodstock needs to continue the
stocking program and achieve harvest goals.
The Baseline scenario also uses net pens to rear summer/fall Chinook juveniles. The net pens provide a
means to acclimate and imprint fish to identified areas. The use of net pens allows the rearing of large
numbers of hatchery juveniles without the construction of major hatchery facilities. Survival rate for these
pen reared fish is expected to be > 90%.
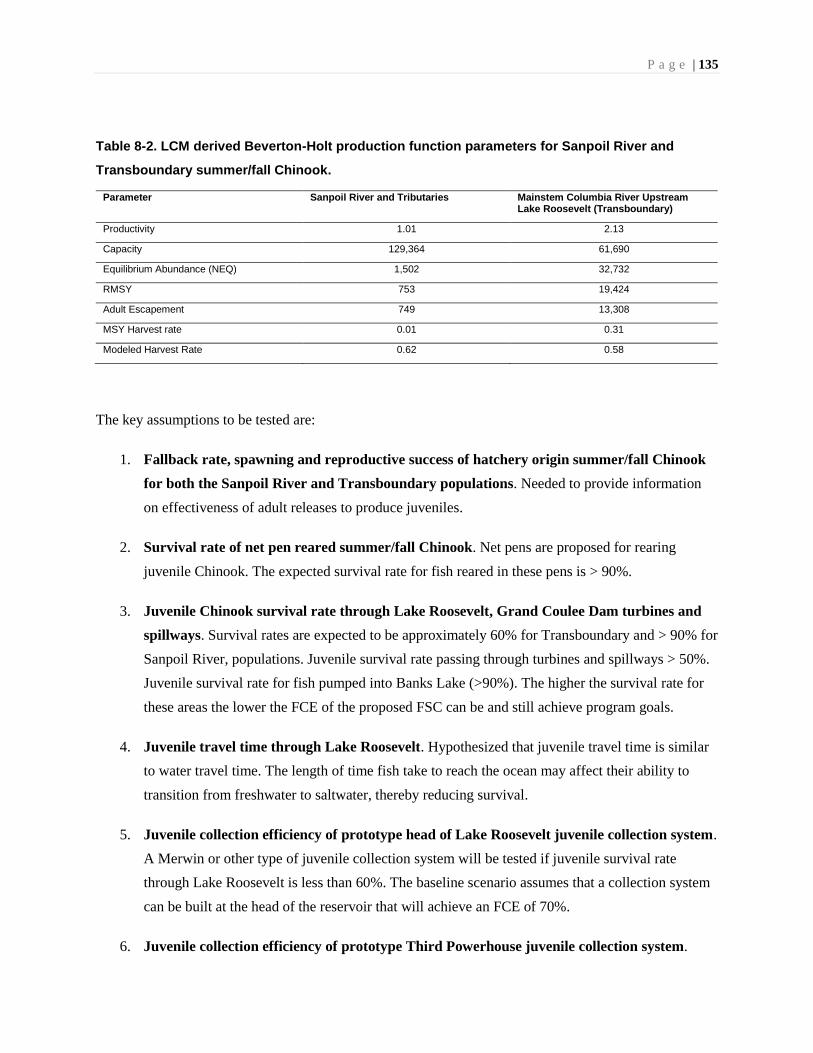
P a g e | 135
Table 8-2. LCM derived Beverton-Holt production function parameters for Sanpoil River and
Transboundary summer/fall Chinook.
Parameter Sanpoil River and Tributaries Mainstem Columbia River Upstream Lake Roosevelt (Transboundary)
Productivity 1.01 2.13
Capacity 129,364 61,690
Equilibrium Abundance (NEQ) 1,502 32,732
RMSY 753 19,424
Adult Escapement 749 13,308
MSY Harvest rate 0.01 0.31
Modeled Harvest Rate 0.62 0.58
The key assumptions to be tested are:
1. Fallback rate, spawning and reproductive success of hatchery origin summer/fall Chinook
for both the Sanpoil River and Transboundary populations. Needed to provide information
on effectiveness of adult releases to produce juveniles.
2. Survival rate of net pen reared summer/fall Chinook. Net pens are proposed for rearing
juvenile Chinook. The expected survival rate for fish reared in these pens is > 90%.
3. Juvenile Chinook survival rate through Lake Roosevelt, Grand Coulee Dam turbines and
spillways. Survival rates are expected to be approximately 60% for Transboundary and > 90% for
Sanpoil River, populations. Juvenile survival rate passing through turbines and spillways > 50%.
Juvenile survival rate for fish pumped into Banks Lake (>90%). The higher the survival rate for
these areas the lower the FCE of the proposed FSC can be and still achieve program goals.
4. Juvenile travel time through Lake Roosevelt. Hypothesized that juvenile travel time is similar
to water travel time. The length of time fish take to reach the ocean may affect their ability to
transition from freshwater to saltwater, thereby reducing survival.
5. Juvenile collection efficiency of prototype head of Lake Roosevelt juvenile collection system.
A Merwin or other type of juvenile collection system will be tested if juvenile survival rate
through Lake Roosevelt is less than 60%. The baseline scenario assumes that a collection system
can be built at the head of the reservoir that will achieve an FCE of 70%.
6. Juvenile collection efficiency of prototype Third Powerhouse juvenile collection system.
P a g e | 136
Because of the likely costs of an FSC, a prototype system (e.g., Merwin Trap) would be tested to
determine likely success of a full system. The system selected for testing would be dependent on
the ability to operate guide nets and costs of a prototype compared to a full system.
7. Juvenile behavior at Grand Coulee Dam. No criterion. Acoustic tags used to determine fish
behavior at dam. This data used to locate FSC at Grand Coulee Dam
8. Juvenile survival rate from Chief Joseph Dam to Bonneville Dam. The assumption is that
juvenile survival rates are similar to those observed for Okanogan River summer/fall Chinook
(27%).
9. Adult survival rate from Bonneville Dam to Chief Joseph Dam. Similar to Okanogan River
summer/fall Chinook (83%)
10. Adult survival rate Chief Joseph Dam and Grand Coulee Dam. Model assumption of 94%
and 90% survival rate for Chief Joseph and Grand Coulee dams, respectively.
11. Adult behavior Grand Coulee Dam tailrace and Lake Roosevelt. How fish approach and
congregate in the tailrace will be used to inform possible sites for the placement of a fish
collection/bypass facility and associated entrances. Fish behavior in the reservoir will inform
release locations for hatchery and naturally produced fish.
P a g e | 137
The methods used to conduct the studies (Table 8-3) will also provide needed information on juvenile
fish behavior as they approach and pass Grand Coulee Dam under both spill and no spill conditions.
This data will be used to help site the proposed FSC at the dam and infer how effective such a system
might be given passage results at the more surface-oriented spillways. Estimates of the percentage of
migrants entrained into the Banks Lake canal and their survival rate will also be developed to determine
if a collection system can be in the canal.
For Chief Joseph Dam, a cohort reconstruction method was chosen as a likely candidate approach for
determining spawning success and resultant production of juveniles and adults. This approach could
be used because survival through Chief Joseph Dam is expected to be high enough to produce returning
adults even without juvenile collection facilities. This is not expected to be the case for Grand Coulee.
For Grand Coulee, the spawning success and resultant juvenile production in the riverine environment
would use a combination of spawner surveys and trapping of juvenile fish. This method would provide
an estimate for the number of fish entering Lake Roosevelt but not for survival once they entered the
lake.
To estimate juvenile survival in Lake Roosevelt a study such as that described by Kock et al. (2018)
may be undertaken. The authors used a staggered-release recovery model and a parentage-based tagging
(PBT) N-mixture model to determine reservoir survival probability of juvenile spring Chinook fry at
Lookout Point Dam (Willamette River). However, Lookout Point Reservoir is only 10 miles long. It
may be infeasible to conduct such as a study in the 152-mile Lake Roosevelt.
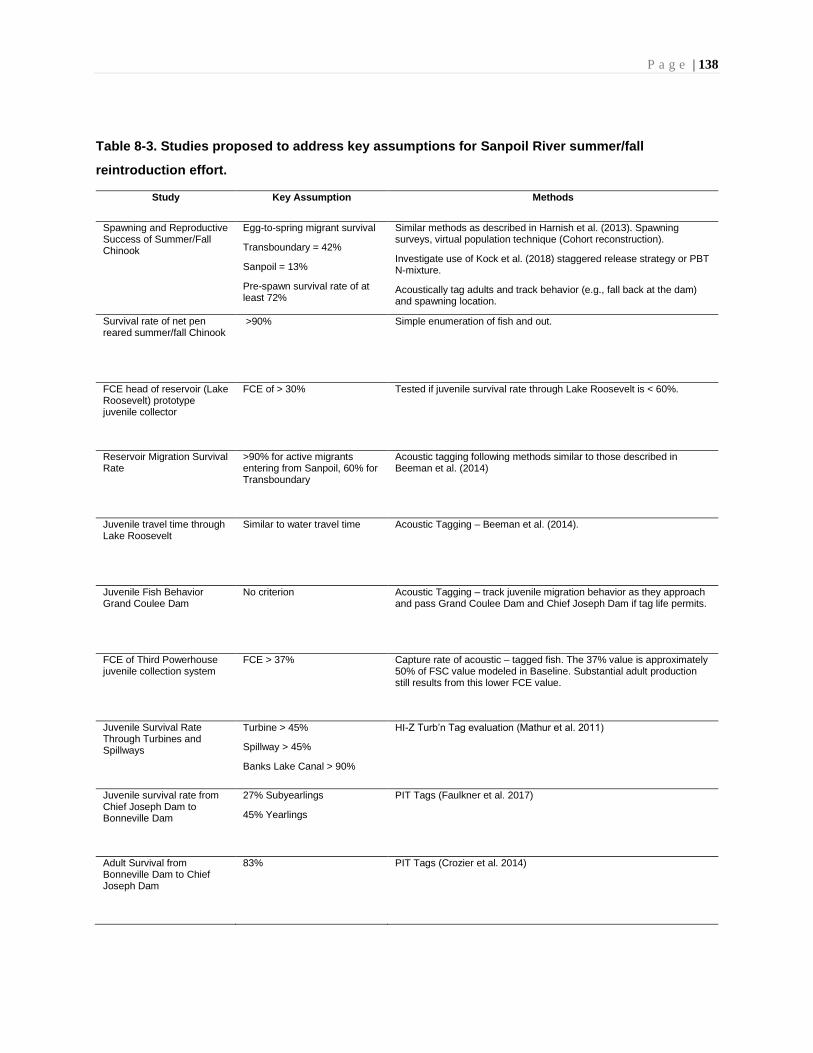
P a g e | 138
Table 8-3. Studies proposed to address key assumptions for Sanpoil River summer/fall
reintroduction effort.
Study Key Assumption Methods
Spawning and Reproductive Success of Summer/Fall Chinook
Egg-to-spring migrant survival
Transboundary = 42%
Sanpoil = 13%
Pre-spawn survival rate of at least 72%
Similar methods as described in Harnish et al. (2013). Spawning surveys, virtual population technique (Cohort reconstruction).
Investigate use of Kock et al. (2018) staggered release strategy or PBT N-mixture.
Acoustically tag adults and track behavior (e.g., fall back at the dam) and spawning location.
Survival rate of net pen reared summer/fall Chinook
>90% Simple enumeration of fish and out.
FCE head of reservoir (Lake Roosevelt) prototype juvenile collector
FCE of > 30% Tested if juvenile survival rate through Lake Roosevelt is < 60%.
Reservoir Migration Survival Rate
>90% for active migrants entering from Sanpoil, 60% for Transboundary
Acoustic tagging following methods similar to those described in Beeman et al. (2014)
Juvenile travel time through Lake Roosevelt
Similar to water travel time Acoustic Tagging – Beeman et al. (2014).
Juvenile Fish Behavior Grand Coulee Dam
No criterion Acoustic Tagging – track juvenile migration behavior as they approach and pass Grand Coulee Dam and Chief Joseph Dam if tag life permits.
FCE of Third Powerhouse juvenile collection system
FCE > 37% Capture rate of acoustic – tagged fish. The 37% value is approximately 50% of FSC value modeled in Baseline. Substantial adult production still results from this lower FCE value.
Juvenile Survival Rate Through Turbines and Spillways
Turbine > 45%
Spillway > 45%
Banks Lake Canal > 90%
HI-Z Turb’n Tag evaluation (Mathur et al. 2011)
Juvenile survival rate from Chief Joseph Dam to Bonneville Dam
27% Subyearlings
45% Yearlings
PIT Tags (Faulkner et al. 2017)
Adult Survival from Bonneville Dam to Chief Joseph Dam
83%
PIT Tags (Crozier et al. 2014)

P a g e | 139
Adult Survival Chief Joseph Dam and Grand Coulee Dam
Chief Joseph = 94%
Grand Coulee = 90%
PIT Tags (Crozier et al. 2014). The criteria are based on combined dam and reservoir survival.
Adult Behavior Grand Coulee Tailrace
No Criterion for behavior, 95% collection efficiency for installed facility.
Grand Coulee/Chief Joseph origin PIT Tagged adults will be collected at Wells Dam, acoustically-tagged, transported and released upstream of Chief Joseph Dam and tracked at receivers located across the tailrace.
P a g e | 140
8.2.1.2 Sockeye
Sockeye production will originate from the Sanpoil, Christina Lake (Kettle River) and the Transboundary
reach, with the most production originating from the Sanpoil River (Table 8-4). For the Sanpoil River and
Transboundary reach, it’s assumed that fish spawn in the river environment and resulting fry migrate into
Lake Roosevelt to rear for one year before migrating to the dam. In contrast, Christina Lake fry rear in the
lake and then migrate to Lake Roosevelt as 1+ juveniles. Because of the difference in life history
assumptions for the populations, the key assumptions also differ to some degree.
For Christina Lake, 1+ juvenile migration success to Grand Coulee is important, while for the other two
populations it is rearing survival in Lake Roosevelt. How important 1+ juvenile migration survival rate
through the reservoir is dependent on whether the fish that do not arrive at the dam are actual mortalities or
are alive and may possibly migrate as 2+ fish.
Regarding fish passage assumptions, the results of the LCM sensitivity analysis showed that adult Sockeye
returns to Grand Coulee dam were still substantial (average of 32,000) even when FCE was reduced from
the baseline assumption of ~75% to 37%. This result occurs because of the assumed fry/parr to yearling
survival rate to below Chief Joseph Dam of 25% for the 5 million hatchery fish released to Lake Roosevelt15.
This results in approximately 1.3 million HOR Sockeye juveniles surviving to the tailrace of Chief Joseph
Dam. For Christina Lake Sockeye, a lower FCE at the dams has little effect on production, as its assumed
that 70% of the 1+ juvenile migrants arriving at Lake Roosevelt are caught at the head of reservoir juvenile
collector.
Net pens will be used to rear hatchery Sockeye in Lake Roosevelt. Fish reared in these net pens are expected
to have a survival rate of > 90% prior to their release.
15 Modeling assumed an egg to yearling migrant survival rate of 41%. The value was based on results from the Skaha
hatchery where 25-60% of the fry released survived to the yearling stage (Bussanich 6/15 memo on Skaha Lake
program.
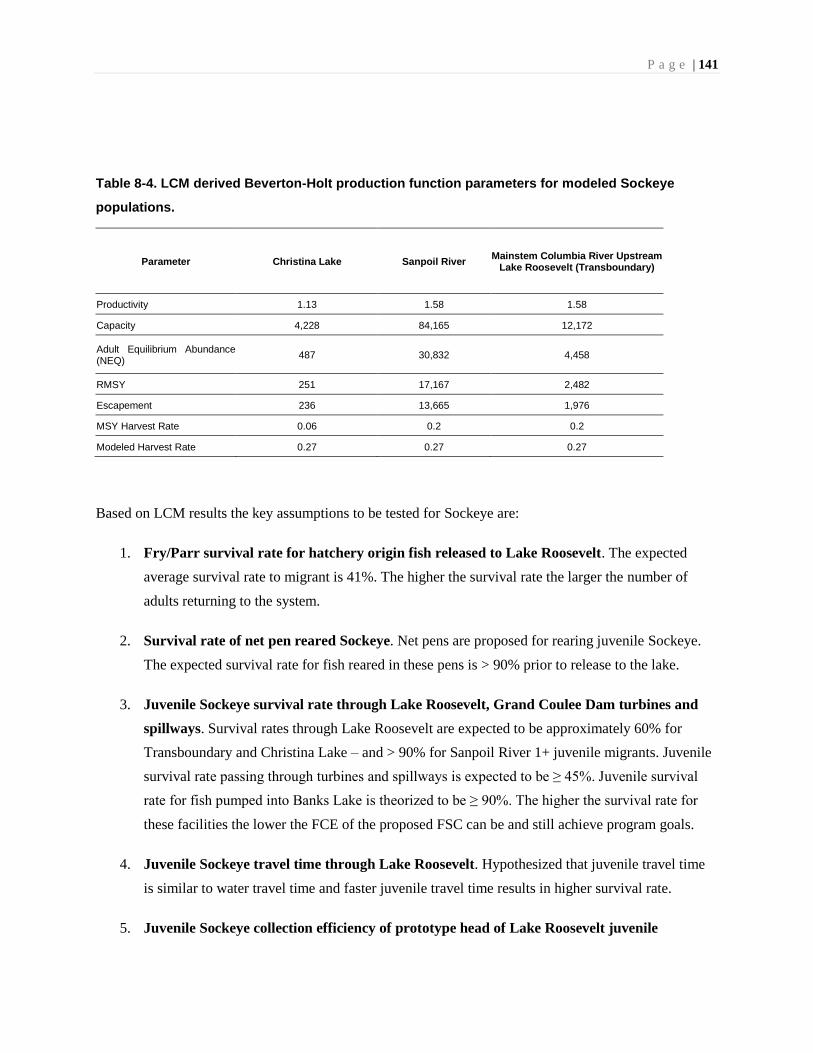
P a g e | 141
Table 8-4. LCM derived Beverton-Holt production function parameters for modeled Sockeye
populations.
Parameter Christina Lake Sanpoil River Mainstem Columbia River Upstream
Lake Roosevelt (Transboundary)
Productivity 1.13 1.58 1.58
Capacity 4,228 84,165 12,172
Adult Equilibrium Abundance (NEQ)
487 30,832 4,458
RMSY 251 17,167 2,482
Escapement 236 13,665 1,976
MSY Harvest Rate 0.06 0.2 0.2
Modeled Harvest Rate 0.27 0.27 0.27
Based on LCM results the key assumptions to be tested for Sockeye are:
1. Fry/Parr survival rate for hatchery origin fish released to Lake Roosevelt. The expected
average survival rate to migrant is 41%. The higher the survival rate the larger the number of
adults returning to the system.
2. Survival rate of net pen reared Sockeye. Net pens are proposed for rearing juvenile Sockeye.
The expected survival rate for fish reared in these pens is > 90% prior to release to the lake.
3. Juvenile Sockeye survival rate through Lake Roosevelt, Grand Coulee Dam turbines and
spillways. Survival rates through Lake Roosevelt are expected to be approximately 60% for
Transboundary and Christina Lake – and > 90% for Sanpoil River 1+ juvenile migrants. Juvenile
survival rate passing through turbines and spillways is expected to be ≥ 45%. Juvenile survival
rate for fish pumped into Banks Lake is theorized to be ≥ 90%. The higher the survival rate for
these facilities the lower the FCE of the proposed FSC can be and still achieve program goals.
4. Juvenile Sockeye travel time through Lake Roosevelt. Hypothesized that juvenile travel time
is similar to water travel time and faster juvenile travel time results in higher survival rate.
5. Juvenile Sockeye collection efficiency of prototype head of Lake Roosevelt juvenile

P a g e | 142
collection system. A Merwin or other type of juvenile collection system will be tested if juvenile
survival rate through Lake Roosevelt is less than 60%. The baseline scenario assumes that a
collection system can be built at the head of the reservoir that will achieve an FCE of 70%.
6. Juvenile collection efficiency of prototype Third Powerhouse juvenile collection system.
Because of the likely costs of an FSC, a prototype system (e.g., Merwin Trap) would be tested to
determine likely success of a full system. The system selected for testing would be dependent on
the ability to operate guide nets and costs of a prototype compared to a full system. FCE target of
37% (approximately 50% of modeled values).
7. Juvenile behavior at Grand Coulee Dam. Not criterion. Data from acoustic tagged fish used to
locate FSC at Grand Coulee.
8. Juvenile survival rate from Grand Coulee Dam to Chief Joseph Dam. Survival rate of 92%
for migrants.
9. Juvenile survival rate from Chief Joseph Dam to Bonneville Dam. The assumption is that
juvenile survival rates are like those observed for lower river yearling Sockeye (41%).
10. Adult survival rate from Bonneville Dam to Chief Joseph Dam. Similar to Okanogan River
Sockeye (76%)
11. Adult survival rate Chief Joseph Dam and Grand Coulee Dam. Model assumption of 93%
and 89% survival rate for Chief Joseph and Grand Coulee dams, respectively.
12. Adult behavior Grand Coulee Dam tailrace. How fish approach and congregate in the tailrace
will be used to inform possible sites for the placement of a fish ladder and associated entrances.
13. Adult spawning success of out-planted Sockeye hatchery and natural origin adults. A major
assumption is that hatchery- and natural origin fish out-planted as adults will spawn successfully
(85% pre-spawn survival rate).
P a g e | 143
8.2.2 Interim Fish Facilities
The interim facilities needed to conduct studies and begin the reintroduction program above Grand Coulee
Dam include:
• Hatchery for incubation and early rearing of Sockeye and summer/fall Chinook juveniles.
• Net pens.
• Prototype juvenile collection system at Third Powerhouse.
• Merwin style juvenile collection system at head of reservoir (Lake Roosevelt).
• Adult collection/transport system in Grand Coulee tailrace.
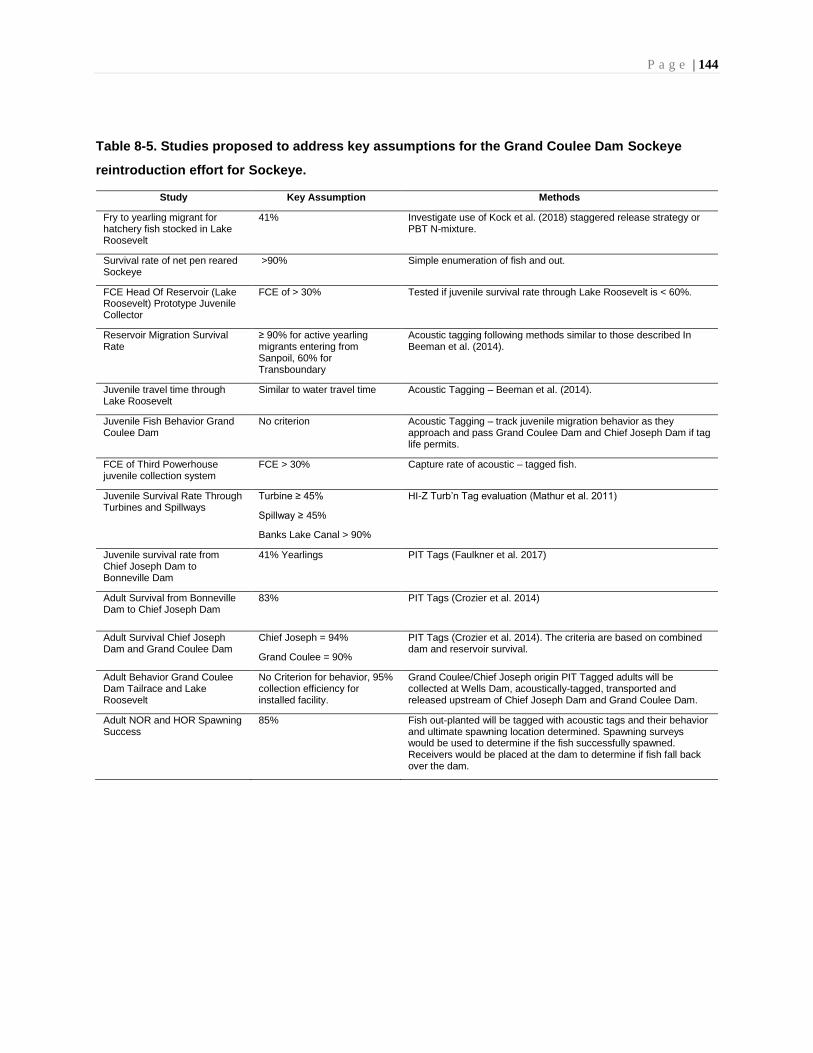
P a g e | 144
Table 8-5. Studies proposed to address key assumptions for the Grand Coulee Dam Sockeye
reintroduction effort for Sockeye.
Study Key Assumption Methods
Fry to yearling migrant for hatchery fish stocked in Lake Roosevelt
41% Investigate use of Kock et al. (2018) staggered release strategy or PBT N-mixture.
Survival rate of net pen reared Sockeye
>90% Simple enumeration of fish and out.
FCE Head Of Reservoir (Lake Roosevelt) Prototype Juvenile Collector
FCE of > 30% Tested if juvenile survival rate through Lake Roosevelt is < 60%.
Reservoir Migration Survival Rate
≥ 90% for active yearling migrants entering from Sanpoil, 60% for Transboundary
Acoustic tagging following methods similar to those described In Beeman et al. (2014).
Juvenile travel time through Lake Roosevelt
Similar to water travel time Acoustic Tagging – Beeman et al. (2014).
Juvenile Fish Behavior Grand Coulee Dam
No criterion Acoustic Tagging – track juvenile migration behavior as they approach and pass Grand Coulee Dam and Chief Joseph Dam if tag life permits.
FCE of Third Powerhouse juvenile collection system
FCE > 30% Capture rate of acoustic – tagged fish.
Juvenile Survival Rate Through Turbines and Spillways
Turbine ≥ 45%
Spillway ≥ 45%
Banks Lake Canal > 90%
HI-Z Turb’n Tag evaluation (Mathur et al. 2011)
Juvenile survival rate from Chief Joseph Dam to Bonneville Dam
41% Yearlings PIT Tags (Faulkner et al. 2017)
Adult Survival from Bonneville Dam to Chief Joseph Dam
83%
PIT Tags (Crozier et al. 2014)
Adult Survival Chief Joseph Dam and Grand Coulee Dam
Chief Joseph = 94%
Grand Coulee = 90%
PIT Tags (Crozier et al. 2014). The criteria are based on combined dam and reservoir survival.
Adult Behavior Grand Coulee Dam Tailrace and Lake Roosevelt
No Criterion for behavior, 95% collection efficiency for installed facility.
Grand Coulee/Chief Joseph origin PIT Tagged adults will be collected at Wells Dam, acoustically-tagged, transported and released upstream of Chief Joseph Dam and Grand Coulee Dam.
Adult NOR and HOR Spawning Success
85% Fish out-planted will be tagged with acoustic tags and their behavior and ultimate spawning location determined. Spawning surveys would be used to determine if the fish successfully spawned. Receivers would be placed at the dam to determine if fish fall back over the dam.
P a g e | 145
8.3 REFERENCES
Beeman J., H. Hansel, A. Hansen, S. Evans, P. Haner, T. Halton, E. Kofoot, J. Sprando and D. Smith. 2014.
Behavior and Dam Passage of Juvenile Chinook Salmon at Cougar Reservoir and Dam, Oregon, March
2012-February 2013. USGS Open File Report 2014-1177.
Crozier G., B. Burke, B. Sandford, G. Axel and B. Sanderson. 2014. Passage and Survival of Adult Snake
River Sockeye Salmon within and Upstream from the Federal Columbia River Power System. National
Marine Fisheries Service, Fisheries Fish Ecology Division, Northwest Fisheries Science Center.
Faulkner J., D. Widener. S. Smith, T. Marsh and R. Zabel. 2017. Survival Estimates for the Passage of
Spring-Migrating Juvenile Salmonids through Snake and Columbia River Dams and Reservoirs, 2016.
Fish Passage Center (FPC). 2013. River Flows, Fish Migration and Survival.
Harnish R., R. Sharma, G. McMichael, R. Langshaw and T. Pearsons. 2013. Effect of hydroelectric dam
operations on the freshwater survival of Columbia River fall Chinook salmon. Can. J. Fish. Aquat. Sci. 71:
602-615.
Mathur D., P. Heisey, E. Euston and J. Skalski. 2011. Turbine passage survival estimation for Chinook
salmon smolts (Oncorhynchus tshawytscha) at a large dam on the Columbia River. Canadian Journal of
Fisheries and Aquatic Sciences 53(3):542-549 · April 2011
Pearl A., M. Laramie, C. Baldwin, J. Rohrback and P. Phillips. 2015. The Chief Joseph Hatchery Program
2015 Annual Report.
U.S. Columbia Basin Tribes and Canadian First Nations, 2015, Fish passage and reintroduction into the
U.S. and Canadian Upper Columbia Basin: Joint paper of the U.S. Columbia Basin Tribes and Canadian
First Nations, accessed, February 25, 2017, at https://ucut.org/wp-
content/uploads/2016/09/Fish_Passage_and_Reintroduction_into_the_US_And_Canadian_Upper_Colum
bia_River4-1.pdf
U.S. Corps of Engineers (USACE). 2011. Alternatives Report: Lookout Point Dam, Middle Fork
Willamette River, Oregon. Lookout Point Head of Reservoir Collection alternatives Study. Prepared by
CH2MHILL, AECOM and BioAnalysts.