fisheries centre - sea around us€¦ · fisheries centre. the university of ... [email protected]...
TRANSCRIPT

Fisheries Centre
The University of British Columbia
Working Paper Series
Working Paper #2015 - 55
Trinidad and Tobago: Reconstructed fisheries catches, 1950-2010
Elizabeth Mohammed and Alasdair Lindop
Year: 2015
Email: [email protected]
This working paper is made available by the Fisheries Centre, University of British Columbia, Vancouver, BC, V6T 1Z4, Canada.

1
TRINIDAD AND TOBAGO: RECONSTRUCTED FISHERIES CATCHES, 1950-2010
Elizabeth Mohammeda and Alasdair Lindopb
a Research and Resource Assessment, Caribbean Regional Fisheries Mechanism Secretariat, Eastern Caribbean Office, St Vincent and the Grenadines.
b Sea Around Us, Fisheries Centre, University of British Columbia, 2202 Main Mall, Vancouver, BC, V6T 1Z4, Canada.
[email protected]; [email protected]
Abstract
Trinidad and Tobago is a Caribbean island nation, located at the southern end of the eastern Caribbean island chain
and near the coast of Venezuela. Fisheries are largely dominated by an artisanal fleet, although significant trawling
for shrimp also occurs, which began in the mid-1950s. Industrial fleets were further developed towards the end of
the 1980s with the introduction of ice boats. This report builds upon a previous study that reconstructed fish catches
in the country from 1908-2001, and here we update the time period to 1950-2010. The total reconstructed catch for
Trinidad and Tobago fisheries from 1950-2010 was 2.6 times the data reported to the FAO for the time period.
Artisanal fisheries were the most significant sector, making up 38% of the catch, with the subsistence sector
contributing 26% and industrial landings 8%. Recreational fisheries contributed 4% and discards (industrial) from
shrimp trawlers made up 24% of the total removals. Scombrids dominated the overall catch, making up over a
quarter of total removals. Large fluctuations in the time series reflect variations in the intensity of shrimp trawling
and demonstrate large quantities of associated by-catch. Further study is necessary to increase understanding of the
by-catch of other fleets, as well as reduce assumptions made in the update to the previous study.
Introduction
Study Area
Trinidad and Tobago is located at the southern end of the eastern Caribbean island chain (Figure 1), Trinidad rests
on the continental shelf off Northeast South America, some 8 miles east of Venezuela while Tobago is situated
further offshore and surrounded by deeper, oceanic waters. The islands lie downstream of the outflow of 17 South
American rivers, including the Amazon and Orinoco, and at the confluence of major ocean currents such as the
North Equatorial Current (Fabres 1983). This location has influenced species diversity and marine habitat types
which range from limited coral reefs, to open ocean and muddy substrate and brackish water. Trinidad’s position on
the continental shelf offers access to shrimp and groundfish resources which are lacking in Tobago.

2
Figure 1: Exclusive Economic Zone (EEZ) and shelf area (to 200 m depth) of Trinidad and Tobago.
Fishery development in Trinidad
Pre-1950s
There is little documentation on fisheries in Trinidad and Tobago prior to the 1940s. In fact, fisheries attracted little
attention following the establishment of the Department of Agriculture in 1908, within which fisheries
administration was imbedded (Anon. 1929). According to an account of fisheries on the north-western coast of
Trinidad, sport fishing seemed more popular than commercial fishing at the time (Vincent 1910). Commercial
fishing was mainly of a subsistence nature. One central market existed in Port of Spain. Despite the high retail price
of fish, the fishers were disadvantaged by the low prices they received from the ‘middle-men’, which may have
acted as a disincentive to fisheries development. Despite the apparent abundant resources around Trinidad (Vincent
1910), development of the fishing industry was further hindered by lack of capital and inappropriate technology. As
a result, Trinidad was dependent on imported processed fish, mainly from Canada and Venezuela (Vincent 1910).

3
By the early 1940s imports had increased to £650,000 GBP. Compared to other colonies in the British West Indies,
Trinidad and Tobago suffered the most severe decline in availability of fresh fish at the onset of the Second World
War (Brown 1942) due to gear shortage, transportation problems and lack of infrastructure. Moreover, the situation
was exacerbated by the transfer of labour from the fishing industry to the more lucrative military bases in Trinidad
and the exclusion and closure of fishing areas in military training areas. The control of local fish prices also acted as
a disincentive to development (Brown 1942).
A development program was implemented after WWII to increase food security. Fleet mechanization was promoted
through introduction of outboard engines (Anon. 1948). Larger boats were constructed, and more fuel-efficient
inboard engines introduced (Anon. 1947). Fishing trials were conducted with a variety of gear types, e.g., trammel
and shark nets, otter trawl, bottom-longline (palangue), multiple troll lines, longlines, purse seines, and drift- and
gillnets (Stockdale 1945; Anon. 1947, 1948). The otter trawl was later officially adopted in 1953 (Kuruvilla et al.
2000). Existing fishing gears were considered antiquated (Hunt 1949) and a subsidization program was implemented
to promote the adoption of more efficient gear (Anon. 1947). The supply of gear was improved and efforts focused
on increasing the industry’s awareness of related regulations and promotion of co-operative organizations (Anon.
1948). The development program also included trials in fish processing and experimentation with extraction of shark
liver oil (Anon. 1946), as well as introduction of nets for the capture of turtles (Anon. 1947). Fish depots were
established at Toco, Matelot, Grande Rivière, Sans Souci and Cumana, and ice storage promoted through market
guarantee. Despite these developments, however, the fishing industry was still largely of a subsistence nature by the
late 1940s. Already then, however, there were reports of environmental concerns associated with the high level of
discards from the beach seine fishery targeting shrimp, and pollution from the petrochemical and agricultural
industries in the Gulf of Paria. The shrimp fishery, particularly off Cedros, had expanded considerably following
WWII due to relocation of fishers displaced from the northwestern peninsular to facilitate construction of a military
base.
1950 - 1980
During the 1950s, development efforts initiated earlier continued. Subsidization of the industry increased with the
introduction of a fuel tax rebate system in 1956 facilitated under the Fishing Industry Assistance Regulations of
1952, and a loan scheme in 1957 to promote the entry of more boats in the fishery (Anon. 1958). Improved
infrastructure at the Port of Spain fish market and fishing facilities at Carenage, Toco and Blanchisseuse occurred
throughout 1956. The use of small outboard motors with lower operation costs was promoted (Anon. 1958). A 1957
survey identified the lack of adequate harbor facilities as a major constraint (Anon. 1958). The adoption of arrow-
head fish-pots (early 1950s) and trawl nets (1954) were the major gear introductions in the 1950s, and an 18 m
motor launch acted as a mother-ship for five artisanal trawlers operating in the Gulf of Paria (Anon. 1958).

4
Due to the development of the fishery off the south coast, increased catches of fish were realized. This accounted for
about 28 percent of total landings by the 1960s (Kenny and Lagois 1961; Vidaeus 1970). The fleet still consisted
mainly of artisanal pirogues, most of which were mechanized as a result of duty free engine imports. A single, large
sized trawler commenced operations in the Gulf of Paria, but contributions to overall landings were negligible. At
this time, severe marketing problems also acted as a disincentive to development, causing some fishers to limit their
catches. Most boats operating off the south-western peninsula switched from targeting fish to shrimp, as they began
to exploit the waters in the channel between Trinidad and Venezuela (Vidaeus 1970). The establishment of a shrimp
processing plant at Cedros promoted development of the shrimp fishery. This plant provided a guaranteed shrimp
market and boat servicing facilities. Shrimp, being a high priced commodity, also made the switch in target species
more profitable. A locally owned company, International Fisheries Ltd, provided landing and processing facilities
for some 60 international trawlers, mainly of American origin, which fished along the continental shelf off the
north-east coast of South America, as well as three locally owned large trawlers which caught shrimp off the
Guianas. Following a temporary termination of the loan scheme for artisanal boats in 1966, the development of the
fleet of large trawlers (over 21 m) was promoted through a similar incentive. By 1972, however, the loan scheme for
artisanal boats, and, to a lesser extent, boats targeting the deep-sea fishery, was re-instituted (see Mohammed and
Chan A Shing 2003).
Between 1966 and 1972, fuel rebate subsidies amounted to over USD 570,000 (see Mohammed and Chan A Shing
2003). Correspondingly, the exemption of purchase tax on boats and engines over the same period was greater than
USD 1.3 million . By the beginning of the 1970s, fish landings had increased to a level which facilitated, for the first
time, the export of more than 455 t of fish to Canada, England and other countries. Local investment in the industry
was high, with only 20 percent of total investment contributed by government. Fishers received higher prices for
their fish, and efforts focused on development of the inshore fishery. Imports were however, still substantial. For
example, approximately GBP 80,000 were spent on imported salted and smoked fish in 1980. During the 1970s,
there was considerable fisheries infrastructural development on both islands (see Mohammed and Chan A Shing
2003).
1980s - 2000
Trinidad and Tobago faced new challenges in the 1980s, with the pending restrictions on fishing areas for the
offshore fleets and added responsibilities for conservation, assessment and management of its marine resources
under the United Nations Convention on the Law of the Sea. Following the loss of access of the local fleet of large
trawlers (10) to traditional fishing grounds due to declarations of EEZs, access was negotiated for waters of French
Guyana, through an arrangement with the European Community. Boats were, however, limited to the capture of 76 t
within a 600 day period (see Mohammed and Chan A Shing 2003).

5
Fishery development in Tobago
Pre-1950s
Very little is documented on the fishing industry in Tobago prior to the 1950s. The main gear utilized during the
1940s were the beach seine for targeting pelagic species off the north-west coast, and the bank line for targeting
deep water snappers off the west and south-east coasts (Brown 1942; King-Webster 1957). Turtles were also
captured for meat (green turtle: Chelonia mydas) and shell export (hawksbill: Eretmochelys imbricata).
1950 - 1980
As in Trinidad, new gear was introduced in Tobago during the 1950s. These included gillnets for catching flyingfish
in the local ‘drifting’ fishery, and ‘tight lining’ (fishing at night with lights) for the capture of large pelagics (Caesar
1988). Fishpots were introduced earlier, but the bamboo used for construction was replaced by chicken wire (Caesar
1988). Foreign fleets from Grenada and St. Vincent and the Grenadines also operated from the capital city,
Scarborough, during the 1950s and 1960s (Caesar 1988).
During the 1970s the Tobago Fisheries Division, after a period of experimentation, introduced fish aggregating
devices to the drifting fishery. These increased catches considerably, and were rapidly adopted by the fleet. They
continue to be used in the drifting fishery. The Tobago Fisheries Division embarked on an awareness campaign in
1973 to increase the local demand for flyingfish by introducing the processing methodology to the public (Caesar
1988). The fiber-glass pirogue, introduced in 1977, eventually replaced the wooden boats because of the lower
maintenance costs. Following the establishment of the National Fisheries Company Ltd. (NFC) in Trinidad, a
Collector Boat System was implemented towards the end of the 1970s. Industrial boats from the NFC were stationed
off south west Tobago and purchased flyingfish and associated species directly from the fishing boats at sea. This
system was successful in increasing catches during 1979 to 1981 (Caesar 1988). During the late 1970s two other fish
processing plants, Pisces Limited and Roy Jacob’s Enterprises, were set up in Tobago.
1980 to 2001
In the 1980s, through a project funded by the United Nations, demersal longlines were introduced for the capture of
sharks and other demersal fish. The existing local longline fishery benefited from the associated change in
technology (Caesar 1988). Other fish processing plants, Tobago Sea Products, Yeates processing and Stewart’s
processing plants, were established in the 1980s. Two other fish processing plants, Terry Swan Ltd and Fresh Fish
of Tobago, were established in the 1990s. Towards the end of the 1980s, ice-boats were introduced to the flyingfish
fishery. The fleet of ice-boats increased to 10 boats by 2001, and Trinidad and Tobago became a member of the
Western Central Atlantic Fisheries Commission Ad-Hoc working group on flyingfish. Trinidad and Tobago was also
a participant in a regional project aimed at assessment and management related research on the flyingfish fishery in
the eastern Caribbean (Oxenford et al. 1993). The project resulted in an improved data collection system for the
fishery in Tobago.
6
Fisheries statistical data collection
Trinidad
Prior to 1941 almost the entire fish supply to Port of Spain was from the north western peninsula. The focus of
fisheries statistical data collection programs reflects the Government’s main objectives at the time. Accounts of
fisheries landing statistics prior to the 1940s were limited to reports of individual stakeholders (Vincent 1910).
Subsequent to this, Colonial Fisheries Advisors (Stockdale 1945; Luke 1957) reported on development and welfare
in the region. Formal collection of fisheries statistics commenced in 1945 (Anon. 1946), some ten years before the
establishment of the Fisheries Department (Fiedler et al. 1957). At this time fishing was mainly a subsistence
activity, with data collection aimed at assessing self-sufficiency in food production and fish import requirements of
what was then a British colony. Documentation of fish landings and distribution from the major wholesale fish
market was introduced in 1954 (Kenny 1955) as the first step in development of an island-wide statistical data
collection system. The quantities, species of fish landed and landing site, as well as fish prices, were recorded
(Kenny and Lagois 1961). By 1958, fisheries statistics were collected at 16 of the 53 landing sites and major
markets (Anon. 1958). Additional details pertaining to the fishing trip were also recorded (Anon. 1958). This
system, established in the 1950s and modified in the early 1960s, remained unchanged until the early 1990s.
In the early 1990s, analytical procedures of the existing system were refined under an FAO/UNDP Project entitled
‘Establishment of Data Collection Systems and Assessment of Marine Fisheries Resources’ (McClure 1991). The
program focused on species of major importance nationally and regionally. A standardized procedure for estimation
of total landings was conceptualized and improved by the zonation of landing sites, based on similarities in fishery
types and fishing practices. In the mid-1990s, under the CARICOM Fisheries Resource Assessment and
Management Program (CFRAMP), an enhanced supervisory mechanism for field data collectors contributed to
improved precision in reporting. To date, the statistical data collection system targets the artisanal fishery operating
in areas within 15 miles from shore. Recent improvements have focused on refinement of estimates of shrimp
landings by the trawl fleets.
Tobago
No accounts of the collection of fisheries statistics is documented prior to the early 1960s. The Tobago Fishing Co-
operative Society, established at Charlotteville in 1959 (Kishore 1990), kept records of the quantities and species of
fish purchased from fishers in the area. Since market availability and competitive pricing affected the selection of
species and associated quantities sold to the co-operative, these records reflect, at best, underestimates of the actual
quantities caught or landed, and provide an inaccurate estimation of the actual species composition in the catch.
During the 1960s, statistics were recorded daily at four beaches (Vidaeus 1970) located at Plymouth, Castara,
Speyside and Man-of-War Bay. This included information on trip duration, fishing methods or gear used, and
landings and prices by major species groups for individual boats. The total number of boats fishing each day was

7
also recorded. To promote fisheries development, and in particular the flyingfish component, the Government
instituted a Collector Boat System (see above) between 1979 and 1982 (Fabres 1986). Since this provided a
guaranteed market for the respective species, recorded transactions detailing the quantities by species purchased are
thought a reliable representation of actual catches between 1979 and 1982. By the early 1980s, data were collected
at five landing sites (Jordan 1986). However, there were some ten additional landing sites (Jordan 1986) at which
landings were not recorded, and no attempts were made to estimate total overall landings from recorded data.
Under the Eastern Caribbean Flyingfish Project, a data collection system targeting the flyingfish and associated
pelagic fishery was implemented at Buccoo Point, Pigeon Point and Mt. Irvine. Thereafter, and until the
implementation of the CARICOM Fisheries Resource Assessment and Management Program (CFRAMP) in 1995,
data collection focused on this fishery. In 1993, the system was expanded to include two additional landing sites, but
reverted to the original three sites by the following year (Mohammed 1998). Under CFRAMP, the data collection
system was expanded to include large pelagic and reef species caught by trolling, fishpots and handlines (Alexander
1998). Due to staff shortages, random stratified data collection was implemented. This resulted in four and eight
days of data at each landing site per month. Data on the quantities and associated species of fish sold at the
Scarborough fish market were recorded. Additionally, some data exists on fish purchases by the major processing
plants. However, the completeness or accuracy of the information cannot be verified at this time.
Fisheries management and policy
The Fisheries Act of 1916 is the legislative basis for management. The authority of the Act extended three miles
from the coast, and responsibility was held by the Governor in Council. A 1966 amendment, following Trinidad and
Tobago’s independence from Britain, included the management of turtles and corals, and conferred authority to the
Minister in charge. A further amendment in 1975 specified new offences, increased penalties and extended
jurisdiction of the act to 12 miles from the coast. Jurisdiction was later extended to 200 nautical miles from the
archipelagic baselines under the 1986 Archipelagic and Exclusive Economic Zone Act. This act also sought to
regulate foreign fishing through specifications of an ‘allowable catch’, and introduction of a licensing system for
associated boats. From a conservation perspective, the Marine Areas Preservation and Enhancement Act of 1970 is
also relevant. However, its implementation has so far been limited to the reef areas off Tobago. Management of
local fisheries is directed mainly at trawl and gillnet fisheries, through regulations under the 1916 Act and the
Conservation of Marine Turtle Regulations of 1994 to reduce the by-catch species in fishing gear. To date, the
exploitation of fisheries has followed an open access policy. A review of the existing marine fisheries policy in 1994
sought to update fisheries laws and legislation in keeping with international measures to assess, manage and
conserve fisheries resources. The transition from open access to limited entry was proposed through a licensing
system. As well, there was the proposed move away from subsidization of the industry as well as the integration of

8
fisheries management into the broader context of coastal zone management. However, associated legislation was
never drafted. In 2006, the Fisheries Division sought to review the marine fisheries policy and legislation for
Trinidad and Tobago to consider national, regional and international commitments to management, conservation,
trade and health and safety standards. However, while a draft fisheries management bill was produced in 2011, the
Fisheries Act of 1916 still seems to be in force.
Objective
This report is an attempt to reconstruct the catches of Trinidad and Tobago for the time period 1950-2010, and
account for catch that may be missing from the reported data. The study includes reconstructions of unreported
catch, such as recreational, subsistence and the associated by-catch and discards of industrial fisheries, and is
compared to the reported data for the time series. The report presented here is an update and extension of a previous
study that assembled a time series of catch and effort data for Trinidad and Tobago from 1908 to 2001 to enable
assessment of the ecosystem impacts of fishing (Mohammed and Chan A Shing 2003). The update covers the time
period 1950-2010 and provides a sector analysis as well as compares the reconstructed catches with the data
officially reported by the FAO. Small updates were made to the Mohammed and Chan A Shing (2003) data to
comply with Sea Around Us database format and definitions.
METHODS
Catches
Differences in the major species harvested, the development and implementation of statistical data collection
programs and the availability of time series data between Trinidad and Tobago, required that the reconstruction of
catch and effort statistics be conducted separately for both islands. The complexity of the fisheries (multi-species
and multi-gear) contributed to aggregation of species in reported landings. Also, the tendency to report fish species
by local names created uncertainties in species identification over the time period covered. Often only the most
important commercial species were identified to the species level. Ramjohn (1999) was consulted for identification
of species reported by local names. However, to address the problem over the entire time series of reconstructed
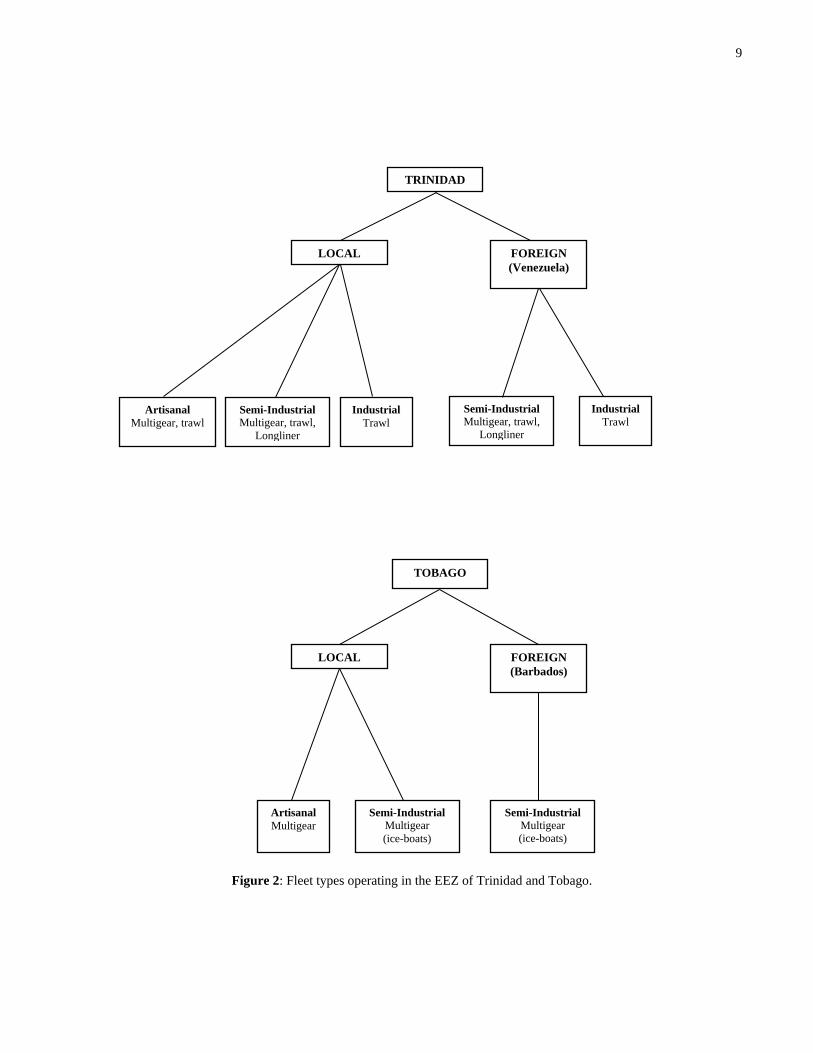
data, it was necessary to group reconstructed data at the family level. Due to the variety of fleets with different
fishing operations (Figure 2) and differences in associated data collection programs, the reconstruction was
conducted separately for the respective fleets: artisanal multigear, artisanal trawl, semi-industrial multigear, semi-
industrial trawl, semi-industrial iceboat, semi-industrial longline and industrial trawl. Reconstructed catches were
disaggregated into inshore and offshore components based on the distribution of fish families present in the catch.
Offshore catches comprised the families Alopiidae, Carcharhinidae, Coryphaenidae, Delphinidae, Istiophoridae,
Lamnidae, Phococoenidae, Scombridae, Sphyraenidae and Xiphiidae while all other families were categorized as
inshore.
9
Figure 2: Fleet types operating in the EEZ of Trinidad and Tobago.
TRINIDAD
LOCAL FOREIGN (Venezuela)
Artisanal Multigear, trawl
Semi-Industrial Multigear, trawl,
Longliner
Semi-Industrial Multigear, trawl,
Longliner
Industrial Trawl
Industrial Trawl
LOCAL FOREIGN (Barbados)
Artisanal Multigear
Semi-Industrial Multigear (ice-boats)
Semi-Industrial Multigear (ice-boats)
TOBAGO
10
Trinidad Artisanal multi-gear fleet
Anchor points: total catches
1945: An estimate of 2,800 t total catch was quoted in a report on the fishing industry submitted as Council Paper
No. 34 of 1945, M.P. 15139.
1954: Overall throughput of fish at the Port of Spain wholesale fish market from the beginning of July 1954 to the
end of June 1955 was available in Kenny (1955). Throughput for July to December 1954 was estimated by
subtraction of throughput for January to June 1955 available in Kenny and Lagois (1961). Assuming that the
average annual percentage contribution of July to December throughput to total annual throughput between 1955
and 1959 (Kenny and Lagois 1961) was the same for 1954, total throughput at the Port of Spain market for 1954
was estimated. Assuming that the average annual ratio of landings to throughput between 1955 and 1959 (0.33) at
the Port of Spain market (Kenny 1960) was the same for 1954, an estimate of total landings at the market was
derived. This figure was adjusted further to represent total landings for the entire island based on the percentage
contribution of landings at Port of Spain to overall total island landings from data in Kenny and Lagois (1961).
1955 – 1959: Data on the monthly quantities of fish handled and landings at the Port of Spain Fish Market were
available from 1955 to 1959 in Kenny (1960). Kenny and Lagois (1961) also provided details on the quantities of
fish landed by eight major gear types (Italian seine, beach seine, filette, trolling, banking, fishpots, demersal longline
or palangue and trawl) at eleven major fishing centres (Cedros, San Fernando, Port of Spain, Icacos, Mayaro,
Orange Valley, Carenage, Maracas, Toco, Las Cuevas and Matelot) in 1960. Landings at Port of Spain represented
only 17 percent of total landings from the eleven centres. Assuming that this percentage was the same each year
between 1955 and 1959, landings at Port of Spain (Kenny 1960) were adjusted accordingly to arrive at
corresponding estimates of total annual landings for the island.
1963, 1975, 1995-2001: Total landings were estimated using data in the Trinidad Fisheries Department’s statistical
database. The data comprise the quantity of individual fish species landed by gear type for each fishing trip
conducted by the respective boats at selected sites. Estimates of total landings for sampled sites were derived by
application of a raising factor which accounted for non-sampled days. Overall total landings for the island were
estimated using the methodology after McClure (1991), based on a zoning system which groups landing sites
according to similarities in fleet activity. The methodology uses information on fleet distribution and target species
by gear, derived from periodic boat censuses to estimate landings at sites not incorporated in the data collection
system. Similar average monthly catch rates for non-recorded boats as those estimated for recorded boats utilizing
similar gear types within the respective zone was assumed.
11
Species Composition
1954: The species composition of the throughput of fish at the Port of Spain market from July 1954 to June 1955
was available in Kenny (1955). Data were disaggregated by species and family groups: carite (Scomberomorus
brasiliensis), kingfish (Scomberomorus cavalla), herring (Clupeidae), cavalli (Caranx crysos), red fish (Lutjanidae),
shark (Carcharhinidae), salmon (Sciaenidae), paoua (Chaetodipterus faber), shrimps (Penaeidae), and one aggregate
“miscellaneous” fish category. It was assumed that the species composition over the two months was reflective of
the entire year’s catch. This composition was carried back to 1950.
1957: The species composition of fish handled at the Port of Spain and San Fernando fish markets in 1957 are
available from the Trinidad Fisheries Department (Anon. 1958). Data were disaggregated by ten taxa groups: carite
and kingfish, herring, cavalli, red fish, shark, salmon, paoua, moonshine (Selene vomer), shrimps and an aggregate
“miscellaneous” fish category. The average species composition at both markets was used to disaggregate the
estimate of total catch into its respective species components.
1963, 1975, 1995-2001: The estimated total catch of the artisanal fleet was disaggregated into the respective species
components based on the species composition of landings from recorded boats using similar gear within the
respective statistical zone.
First interpolation: total catches
1950-1953, 1960-1962, 1964-1974, 1976-1994: Total catches were estimated by interpolation of estimates derived
for the anchor points.
Second interpolations: species composition
1950-1953, 1956-1960, 1964-1974, 1976-1994: Composition was derived by interpolation of the species
contributions for the preceding and following year of each period. Individual species catches were taken as the
product of species composition and total catch.
Small trawlers
The otter trawl was introduced in 1953. Over the period examined, small trawlers operated both in the Gulf of Paria,
off Trinidad’s west coast, as well as the south coast and in the waters off the northeast coast of Venezuela. Trawlers
target shrimp, but the by-catch is comprised mainly of groundfish species. The traditional fishery in Venezuelan
waters, conducted mainly by boats from the south-western peninsula of Trinidad, was legitimized in 1972, and a
formal agreement between Trinidad and Tobago and Venezuela signed in 1977 (Kuruvilla et al. 2000). Initially, 60
boats were allowed to fish in Venezuelan waters, but by 1990 the number had increased to 70. A reciprocal
arrangement allowed Venezuelan boats to fish off the north and east coasts of Trinidad. A new agreement, based on

12
co-operation in exploitation and management of the area south of Trinidad, was negotiated in 1997. This agreement
excluded fishing by trawlers from Trinidad in the area of Venezuela’s waters, allowed under the previous
agreement.
Anchor points: total catches
Data collection for the associated trawl fleet is incorporated under the national data collection system for the
‘artisanal multi-gear fleet’. Only the shrimp (target species, all catches landed) and landed component of the by-
catch are recorded. The proportion of the by-catch that is landed depends on whether or not the species is marketable
(certain species and larger sizes are preferred). The by-catch (landed and discarded combined) associated with
shrimp catches in the EEZ of Trinidad and Tobago is estimated separately.
1954, 1955-1959, 1963, 1975, 1995 – 2001: Total shrimp catches were estimated in a similar manner as for the
artisanal multi-gear fleet (1995 to 2001), but limited to those sites from which trawlers are known to operate. Since
1992 data for this fleet were recorded by fishing area, allowing a separation of catches taken in the waters of
Trinidad and Tobago from those taken in the waters of Venezuela.
It is, however, likely that fishing in Venezuela’s waters began since 1968, when the estimated catches of shrimp
increased from a fourteen year average of 159 t to 653 t. Wood (1977) noted that in 1968 about 80 percent of the
shrimp trawl fleet had moved to south Trinidad, affording easier access to the waters of Venezuela. Hence, the
annual shrimp catch from 1968 to 1991 was adjusted to represent only those catches taken in the waters of Trinidad
and Tobago. In 1992 only one percent of the total shrimp catch was taken in the waters of Trinidad and Tobago. It
was assumed that the entire catch (100 percent) of shrimp in 1967 was taken in the waters of Trinidad and Tobago
and the corresponding percentage of total shrimp catch from 1968 to 1991 was estimated by interpolation between
the 1967 and 1992 estimates. Shrimp catches taken in the waters of Trinidad and Tobago from 1968 to 1991 were
estimated as the product of total shrimp catch and the percentage attributed to the waters of Trinidad and Tobago.
Semi-industrial multi-gear fleet
This fleet entered the fishery in 1986. It is comprised of boats targeting pelagic resources using pelagic handlines as
well as boats targeting demersal resources using handlines and fishpots. There is no data collection system for this
fleet, which appears to have diverted to other forms of fishing (semi-industrial trawling and longlining) after 2000.
Anchor points: total catches
1986 – 2000: The product of annual number of active boats, average number of trips per boat and average hold
capacity (1.5 t) was used as an estimate of annual total catch. The number of active boats and average number of
trips per year were obtained from interviews with boat owners and key informants.

13
Species composition
The proportion of total catch attributed to each gear type was assumed the same as for the artisanal boats using
similar gear (fishpots, banklines and pelagic lines) and fishing in the same areas (east coast of Trinidad) as the multi-
gear fleet. The total catch from each gear was disaggregated into the respective species components based on the
corresponding species composition of catches from artisanal boats.
Semi-industrial trawlers
This fleet was gradually introduced in the early 1980s, and is here treated as ‘industrial’. The boats land at one of the
major landing sites (Orange Valley) and therefore catch and effort data are incorporated in the national data
collection system which also targets the multi-gear artisanal fleet. Data on the shrimp and landed component of the
by-catch, comprising mainly juvenile fish, are available from 1987. The discarded component of the by-catch is not
recorded, and, therefore is estimated separately.
Anchor points: total catches
1987 – 1991: Shrimp catches were available from Maharaj (1993).
1992 – 2001: Estimated shrimp catches for 1992 to 2001 were available from L. Ferreira and S. Soomai (pers.
comm.).
Semi-industrial longliners
This fleet was introduced in the 1980s and a data collection programme was implemented from 2001. This gear type
is treated as ‘industrial’.
Anchor point: total catches
1988 – 1991: Estimates of landings from 1987 to 1992 were taken from Chan A Shing (1993). The information is
based on data obtained from the state-owned National Fisheries Company (NFC), a major transshipment port set up
in 1972, and currently operating under Taiwanese management. Both local and foreign boats land at this port. Data
provided in this report pertain to locally flagged boats which operated within the Exclusive Economic Zone of
Trinidad and Tobago and on the high seas. Data were adjusted for the respective species, based on conversion
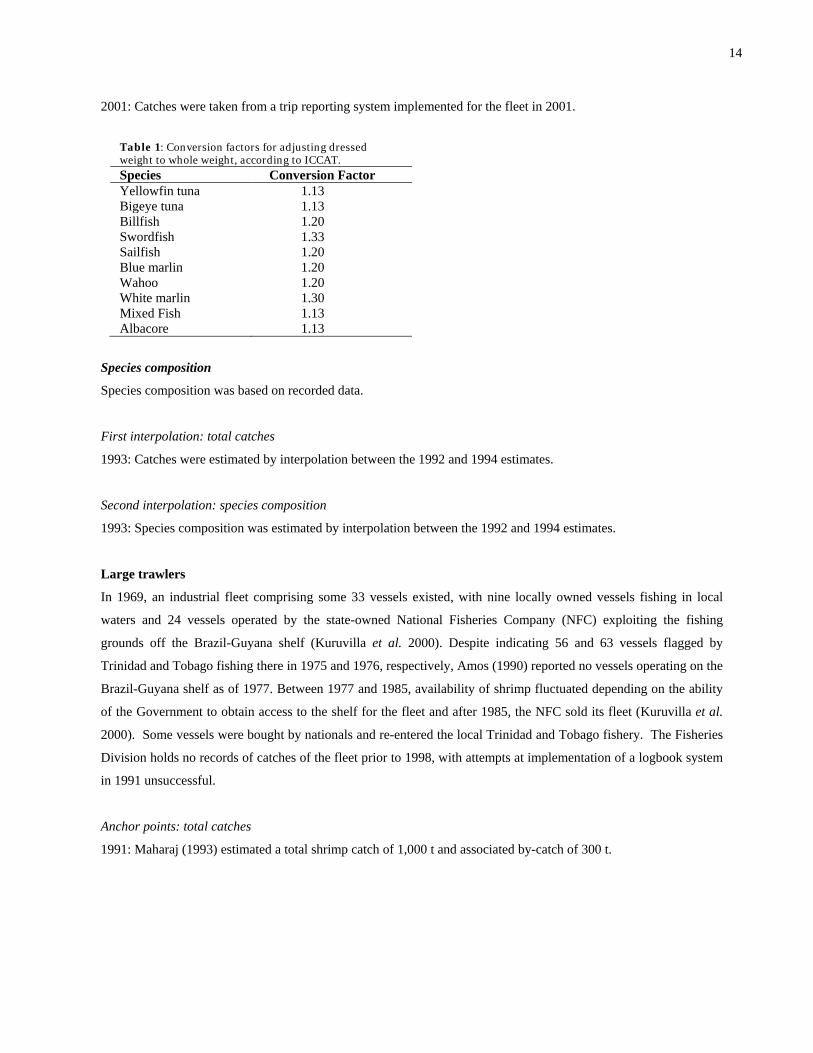
factors from the International Commission for the Conservation of Atlantic Tunas (ICCAT) listed in Table 1 (Kebe
2001). Catches pertain to locally owned and locally flagged, as well as locally owned and foreign flagged boats.
1993 – 2000: Estimated landings for 1993 to 2000 were taken from Trinidad and Tobago data submissions to
ICCAT following adjustment from processed to round weight (Kebe 2001) according to the conversion factors in
Table 1. Catches pertain to locally owned and locally flagged, as well as locally owned and foreign flagged boats.
14
2001: Catches were taken from a trip reporting system implemented for the fleet in 2001.
Table 1: Conversion factors for adjusting dressed weight to whole weight, according to ICCAT. Species Conversion Factor Yellowfin tuna 1.13 Bigeye tuna 1.13 Billfish 1.20 Swordfish 1.33 Sailfish 1.20 Blue marlin 1.20 Wahoo 1.20 White marlin 1.30 Mixed Fish 1.13 Albacore 1.13
Species composition
Species composition was based on recorded data.
First interpolation: total catches
1993: Catches were estimated by interpolation between the 1992 and 1994 estimates.
Second interpolation: species composition
1993: Species composition was estimated by interpolation between the 1992 and 1994 estimates.
Large trawlers
In 1969, an industrial fleet comprising some 33 vessels existed, with nine locally owned vessels fishing in local
waters and 24 vessels operated by the state-owned National Fisheries Company (NFC) exploiting the fishing
grounds off the Brazil-Guyana shelf (Kuruvilla et al. 2000). Despite indicating 56 and 63 vessels flagged by
Trinidad and Tobago fishing there in 1975 and 1976, respectively, Amos (1990) reported no vessels operating on the
Brazil-Guyana shelf as of 1977. Between 1977 and 1985, availability of shrimp fluctuated depending on the ability
of the Government to obtain access to the shelf for the fleet and after 1985, the NFC sold its fleet (Kuruvilla et al.
2000). Some vessels were bought by nationals and re-entered the local Trinidad and Tobago fishery. The Fisheries
Division holds no records of catches of the fleet prior to 1998, with attempts at implementation of a logbook system
in 1991 unsuccessful.
Anchor points: total catches
1991: Maharaj (1993) estimated a total shrimp catch of 1,000 t and associated by-catch of 300 t.

15
1999 – 2001: Data on shrimp and the landed component of the by-catch have been collected since 1999 under a
similar arrangement as for the semi-industrial trawl fleet. Estimation of total landings is based on the procedure
outlined for the artisanal multi-gear fleet (1995 to 2001). Catches between 1991 and 1999 were estimated by
interpolation between the respective estimates. Although the shrimp to by-catch ratio is comparably less than those
for the artisanal and semi-industrial fleets, there is nevertheless some discarding which is not accounted for in the
data collected.
First interpolation: Total catches
1969 – 1990: Shrimp catches were estimated as the product of annual shrimp catch per boat and the number of boats
operating in the waters of Trinidad and Tobago (Trinidad area). Nine boats operated in the Trinidad area in 1969
(Kuruvilla et al. 2000) and it was assumed that the number of boats remained unchanged until 1987 when access to
waters off the Brazil/Guyana shelf was terminated. Some of the associated boats redirected their effort to the waters
of Trinidad and Tobago (Kuruvilla et al. 2000). The numbers of industrial trawlers operating in the waters of
Trinidad and Tobago were 25 and 21 in 1987 and 1995 respectively, and the annual number of such boats operating
between 1987 and 1995 was estimated by interpolation. The 1991 annual catch rate was assumed over the 1969 to
1990 period.
1992-1998: Shrimp catches were derived by interpolation between the 1991 and 1999 estimates.
Tobago
Artisanal multi-gear fleet
Anchor points: total catches
1957: King-Webster (1957) and King-Webster and Rajkumar (1958) provided estimates of catch rates for boats
utilizing specific gear (banklines, troll lines, beach seine, fish-pots). Estimates of the number of boats involved in
the respective fisheries each month were taken from Figure V (5) of King-Webster and Rajkumar (1958) for boats
involved in banking and trolling. Estimates of the lower and upper limits of catch per man-day over an entire year
were provided for the relevant gear types along with the number of men per boat. Boats utilizing banklines carried
between four and five fishers per trip while those utilizing troll lines and fishpots carried three fishermen per trip.
The number of fishing days was assumed.
Banking from bumboats: King-Webster (1957) indicated a catch rate of between 5 and 11 kg per man/day. Since the
peak season occurs in September and October it was assumed that the higher limit was applicable during this time
and the lower limit at other times of the year. Five men were, on average, employed per boat. Using the estimated
16
number of boats fishing each month from Figure 5 of the main reference an estimate of the associated number of
men was derived. Since most boats were un-mechanized it was assumed that fishing occurred only 5 days per month
from November to January, due to rough seas at that time of year. It was assumed that fishing occurred 20 days per
month during the peak season (September to October) and 15 days per month during the remaining months. The
product of number of men and catch per man/day was taken as an estimate of catches from banking. Catches were
disaggregated according to the species components based on the number of boats mentioning a species, e.g., 112 of
the 174 boats surveyed indicated that redfish (Lutjanidae) was the only fish taken, while 5 indicated both redfish and
grouper (Serranidae) and one indicated redfish and blackfish (unidentified). Blackfish was considered insignificant.
The proportion of redfish was estimated as (112 + (5/2))/118 = 0.97 and the remaining 0.03 was assumed to be
grouper.
Banking from sloops: There was one local sloop and up to 13 sloops from the Windward Islands operating off
Tobago. The main season based on an interview of one boat was July to December for redfish, and from November
to March for grouper. The crew of the local boats comprised up to 6 men and the same was assumed for the foreign
boats. Between 136 and 182 kg of fish was landed daily. The higher catch limit was assumed for peak season
months and the lower limit for other months. It was assumed that except for the months of November to January,
fishing occurred on average 20 days per month during the peak season for both species and 10 days per month
otherwise. From November to January, fishing was assumed to occur 15 days per month, because of rough weather.
The fleet however is mechanized. The total catch each month was estimated as the product of daily catch by the
number of fishing days. The species composition of estimated total catch was derived based on the peak season for
the respective species. It was assumed that all catch from July to October were of snapper only, catches from
November and December were divided equally between redfish and grouper, catches from January to March were
assumed to be solely grouper and catches from April to June were assigned equally to both species groups. The
catch per boat and species composition of the foreign fleet was assumed the same as the local sloop.
Trolling for kingfish (Scomberomorus cavalla or Acanthocybium solandri): This fishery had an average of three
men per boat. The daily catch rate per boat for kingfish was 535 kg, and the daily catch rate per man/day was 7.73
kg. The number of boats operating each month was taken from Figure 5 of the main reference. The species was
captured year round but catches peaked from March to August. The 7.73 kg per man/day was assumed over these
months and an estimate of 3 kg per man-day assumed for the remaining months. Further, other species are also
captured on these trips (mainly dolphinfish, barracuda). It was assumed that fishing occurred 5 days per month from
November to January and 20 days per month from February to October. Fishing trips conducted between August
and October targeted only dolphinfish and barracuda. Since all species may be captured on the same fishing trip, the
total number of fishing days each month was divided equally among the species caught to represent the effort
directed at each species.
17
Trolling for dolphinfish (Coryphaena hippurus): The average catch per man day was 10 kg. The peak fishing season
was from February to April although dolphinfish could be captured from August to October. It was assumed that 10
kg per man/day applied to the peak season and 5 kg per man/day for the other months. Effort (number of fishing
days) was divided equally among the main species captured to derive effort directed at each species. Total catch was
estimated as for kingfish.
Trolling for barracuda (Sphyraenidae): The average catch per man per day was 2.72 kg. Using the same number of
fishing days and the number of boats from Figure 5 of the main reference, along with the stated catch rate for peak
months (February to April), and half this estimate for the remaining months, an estimate of total catch was derived.
Trolling for other species such as black jack (Caranx lugubris), shark (Carcharhinidae), cavalli (Caranx hippos),
bonito (Sarda sarda), grouper, carite (Scomberomorus maculatus) and ocean gar (Istiophorus albicans): Estimates
of catch were based on the number of boats mentioning the species in the associated catch. Of the 161 boats
surveyed 81 percent mentioned the first (main) three species listed and the remaining 19 percent the other species
combined. Assuming that the catch of the main three species represented 81 percent of the total catch of this fishery
the catches of all other species combined was estimated at 21 t. The estimated catch was disaggregated into the
respective species components based on the proportion of boats mentioning the species in the associated catch.
Seining: Several species were caught in the seine fishery. These species include jacks (Carangidae, mainly Selar
crumenophthalmus), bonito, carite, kingfish, anchovy (Engraulidae) and robin (Decapterus spp.). Regarding jacks,
the average catch per day of 23 boats was 48 baskets, while two boats reported an average of 400 baskets per day;
two other boats reported 50 baskets per day and an average of 10 baskets per day were estimated for 19 boats. Each
basket weighed 9 to 12 kg. Half the higher catch rate was assumed from March to May, the peak months for jacks.
The catch rate of 50 baskets per day per boat was assumed for the months immediately preceding and following the
peak period. A catch rate of 48 baskets per boat per day was assumed for all remaining months except November to
January when the lowest catch rate was assumed, due to rough weather conditions. An average of 20 fishing days
per month was assumed from March to October (peak season for most important species) and 10 days per month in
the remaining months. The number of fishing days was adjusted to reflect effort directed to the individual species
based on the species composition. The species composition was based on the number of boats mentioning the
species in the associated catch: 53 percent jacks, 19 percent bonito, 12 percent cavalli (Caranx hippos), 9 percent
carite, 2 percent kingfish, 2 percent anchovy and 2 percent robin. Regarding bonitos, the reported catch rate of 89 kg
per boat per day was assumed for September to December (peak season for the species), the lower catch rate of 67
kg per boat per day was assumed for January, while the estimate of 45 kg per boat per day was applied to February
and the lowest catch rate of 27 kg per boat per day in the remaining months. The number of fishing days was
adjusted as for jacks. The higher catch rate for cavalli (89 kg per boat per day) was assumed for September to
December peak months and the lower catch rate (45 kg per boat per day) for remaining months. The number of
fishing days was estimated as for jacks.
18
Fishpots: This method is of minor importance. From the survey of four of the 9 boats operating, two indicated year
round fishing, one fishing from April to November and the other fishing from August to December. Based on the
proportion of sampled boats operating each month the total number of boats operating each month was estimated.
The catch rate ranged between 9 and 45.45 kg per boat. The higher limit was assumed representative of catches from
September to October (peak season) and the lower limit representative of catches from January to August. It was
assumed that fishing occurred 10 days per month from November to April and 20 days each month for the
remaining months. Total monthly catch was estimated as the product of number of boats operating, mean catch per
boat per day and number of fishing days. Catch comprised small redfish and other rock fish. It was assumed that
redfish and other rock fish (unidentified) contributed equal portions to overall catch.
Spear fishing: Five boats were involved in this fishery which targets groupers, snappers and barracuda. Expected
catch rate ranged between 12.5 and 27.27 kg per boat per day (average 19.89 kg). It was assumed that fishing
occurred 10 days per month from November to April and 20 days each month for the remaining months. Estimated
total catch each month was the product of number of boats, average daily catch rate and number of fishing days. It
was assumed that the three species mentioned accounted for equal proportions of the overall annual catch.
Fillet net: Only one boat utilized this method. Since this gear has traditionally targeted only flyingfish in Tobago it
was assumed that the species comprised the entire catch. Flyingfish are seasonal occurring on the fishing ground
from November to June. King-Webster and Rajkumar (1958), however, indicated that the gear was used year round
and targeted several species. It was assumed that fishing occurred 5 days per month from November to January and
20 days per month during the remaining months of the season. The average catch rate was 134 kg/day, assumed to
apply during the peak season from February to July. A catch rate of half this estimate was applied to the remaining
months.
Switchering: This method essentially uses poles or handlines and lights to attract fish to a stationery boat at night.
Kingfish is the main species caught. It was assumed that boats were un-mechanized and fished 90 days per year, 15
in each month from February to July. The catch rate of 67 kg per boat per day was assumed throughout the period.
1962 – 1968 and 1972 - 1976: Total recorded landings between 1962 and 1968 for landing sites at Plymouth,
Castara, Speyside and Man-O-War Bay (Charlotteville) were available from Vidaeus (1970). Ramsaroop (1978)
also provided recorded landings data at the same landing sites for 1972 and 1973, with additional data for 1974 to
1976 for the landing site at Milford. Total recorded landings for 1962 to 1973 were available from Horsford (1975).
Except for 1965, data for 1962 to 1968 corresponded with figures in Vidaeus (1970). Since Vidaeus (1970) provided
details by landing site that could be used for estimation of total landings, data from this source was used for 1965.
Total landing was estimated as the product of the average landing per boat per year at recorded sites and the total
number of boats at all sites. Kenny (1960) provided estimates of the number of boats at Plymouth, Charlotteville,

19
Castara, Parlatuvier, Speyside, Bloody Bay and all other beaches combined in 1959 and Potts et al. (1988) provided
estimates of the number of boats at some 27 landing sites around the island, including those examined by Kenny
(1960). The annual number of boats at the respective landing sites between 1959 and 1988 was estimated by
interpolation between the two data sources. The 1974 to 1976 data for the Milford site from Ramsaroop (1978) were
not utilized in estimating average landing per boat per year because an estimate of the corresponding number of
boats at this site could not be derived from existing data sources.
1988 – 1997: Detailed records of landings and fishing effort are available for the drifting fishery which targets
flyingfish and associated large pelagics, and is the major fishery of Tobago. The fishery uses mainly gillnets, but
troll lines and bank lines are also used to a lesser extent. Pandohee (1993) estimated total catches from the 1987/88
to 1991/92 fishing seasons at the three major beaches: Buccoo Point, Pigeon Point and Mt Irvine. The methodology
involved application of raising factors to account for unrecorded fishing days at recorded landing sites, and boats at
minor and unrecorded landing sites, as described for the artisanal multigear fleet in Trinidad between 1995 and
2001. Estimates of total catches were available for 10 beaches (five recorded and five unrecorded sites) for the
1992/93 fishing season and the 1993/94 fishing season in Pandohee (1994) and Mohammed (1996) respectively.
Mohammed (1998) provided estimates of total catch at the Buccoo Point and Pigeon Point landing sites for the
fishing seasons from 1994/95 to 1996/97. Traditionally, statistics for this fishery are presented for a fishing season
which runs from November to June or July. Data were adjusted accordingly to represent catches for the calendar
year. Estimates for the three most recent years were available for two landing sites only (Buccoo and Pigeon Point).
These data were adjusted to account for catches at the other eight landing sites, assuming that the average ratio of
the respective species catches at Buccoo Point and Pigeon Point (first site) and overall total species catch at the 10
sites in 1993 and 1994 was the same for 1995 to 1997.
1983, 1996 and 1998 - Troll, fishpot, bank line and beach seine fisheries: The various fisheries utilizing troll lines,
fish pots, bank lines and beach seines have historically not been the focus of data collection, although catches of
associated gear (troll and bank lines) used in the drifting fishery are recorded. Recorded landings from the four gears
are available for 1983, 1996 and 1998. Point estimates of total catches for the respective fisheries were taken as the
product of the average landing per boat trip, the annual number of trips and the number of boats specifying the
respective gear as the main gear. The average number of fishing days per year over all fleets utilizing a particular
gear type, from the effort reconstruction for Tobago, was used as representative of the average number of trips per
year, assuming that only one trip is made per day and that the number of trips per year remains unchanged.
The average landing per boat trip for boats utilizing the respective gears was taken from the recorded data. Because
of annual differences in the landing sites recorded in the data collection programme it was assumed that the landing
per boat trip at recorded sites for the respective year were the same for similar gear utilized at other (unrecorded)
sites. Data on landings from fish pots were available for Castara, Milford and Pigeon Point in 1983; for Buccoo
20
Point and Pigeon Point in 1996; and for Buccoo, Pigeon Point, Plymouth and Studley Park in 1998. Data on
landings from troll lines were available for Castara, Milford and Pigeon Point in 1983; for Buccoo Point and Mt
Irvine in 1996; and for Buccoo Point, Courland Bay, Pigeon Point, Plymouth and Roxborough in 1998. Data on
landings from beach seines were available for 1983 only, covering the landing site at Castara, while data on landings
from bank lines were available for the same year for landing sites at Castara and Milford.
The landing per trip from fish pots and troll lines respectively was estimated for 1983, 1996 and 1998. Data for
missing years were estimated by interpolation. The estimated landing per trip from bank lines and beach seines in
1983 was assumed the same from 1983 to 1998. The number of boats utilizing the respective gears was extracted
from records of a national boat census conducted in 1991. Potts et al. (1988) provided information on the number of
boats by landing site in 1988 and these boats were assigned to gear types based on the same relative proportions as
the 1991 boat census. The number of boats using the respective gears between 1983 and 1988 were derived by
interpolation of estimates in Kenny (1960) and Potts et al. (1988). The annual number of boats using the respective
gears between 1992 and 1998 was assumed the same as for 1991.
Species composition
1957: Catches were estimated separately for each of the major fish species. The composition of minor species in the
catch was based on information from the boats surveyed (King-Webster 1957; King-Webster and Rajkumar 1958).
1972 – 1973: The species composition was assumed the same as for records of fish caught at Man-O-War Bay from
Ramsaroop (1978). Species were disaggregated into five categories: carite, kingfish, cavalli, redfish and shark, as
well as one aggregate category called "miscellaneous fish".
1974 – 1976: The species composition was assumed the same as for records of fish caught at Charlotteville from
Ramsaroop (1978). Species were disaggregated into the five categories above and eleven additional categories:
salmon (Elagatis bipinnulata), bonito, jacks, grouper, dolphinfish, barracuda, sailfish (Istiophorus albicans), grunt
(Pomadasyidae), albacore tuna (Thunnus alalunga), amberjacks (Seriola spp.) and black jacks.
1988 – 1997 - Flyingfish and associated large pelagic fishery: The species composition was taken directly from
recorded landings.
1983, 1996 and 1998 - Troll, fishpot, bank line and beach seine fisheries: The species composition was taken
directly from recorded landings.
First interpolation: catches (artisanal)
1958 – 1961: Total landings for 1957 to 1961 were estimated by interpolation between the 1957 and 1962 estimates.

21
1969 – 1971: Total landings for 1969 to 1971 was estimated by interpolation between the estimates derived for 1967
and 1972. Estimates were compared to recorded data from Horsford (1975) for the corresponding years. The
expectation that estimates exceed recorded data was satisfied.
1983 – 1987 - Troll, fishpot, bank line and beach seine fisheries: Annual landings were estimated as described for
the anchor points. The annual number of boats was estimated by interpolation between data for 1959 (Kenny 1960)
and 1988 (Potts et al. 1988).
1989 – 1990 - Troll, fishpot, bank line and beach seine fisheries: Annual catches were estimated as described for the
anchor points. The annual number of boats was estimated by interpolation between data for 1988 and 1991.
1992 – 1998 - Troll, fishpot, bank line and beach seine fisheries: Annual catches were estimated as described for the
anchor points. The annual number of boats was assumed the same as in 1991.
1999 – 2001: Catch data were not available for these years. As a result catches for the respective fisheries were
assumed the same each year as those for 1998.
Second interpolation: species composition
The species composition of landings from the artisanal fleet from 1984 to 1995 was estimated by interpolation
between the estimates derived for 1983 and 1996, and the species composition for 1997 estimated by interpolation
between the estimates derived for 1996 and 1998.
Semi-industrial iceboats in the Tobago fishery
Data for this fleet were incorporated in statistics for the artisanal multi-gear fleet, specifically targeting flyingfish
and associated large pelagics in the drifting fishery.
Adjustments to flyingfish commercial data and estimation of quantity of flyingfish utilized as bait in the
Tobago fishery
Flyingfish is one of the most important species in the Tobago pelagic fisheries. However, based on availability of
raw data, there were years when the species was not adequately captured in the commercial data recorded. As a
result, catches for 1974 to 1984 were taken from Fabres (1986), but the estimate for 1976 was estimated by
interpolation between the 1975 and 1977 catches since the data collector was not recording adequately that year.
Starting in 1995, estimates of the quantity of flyingfish utilized as bait were recorded. Based on the relative
proportions of flyingfish bait to catches of large pelagic species, estimates of the quantity of flyingfish utilized as
bait from 1988 to 1997 were derived.

22
Estimation of by-catch in the Trinidad shrimp-trawl fishery
All trawl fleets (artisanal, semi-industrial and industrial) operate in the Gulf of Paria off Trinidad’s west coast. The
industrial fleet also operates off Trinidad’s northwest coast and off the south coast in the Columbus Channel.
Trawlers also fish in the waters of northwest Venezuela. Annual by-catch for the respective fleets of the trawl
fishery was estimated based on the ratio of by-catch to shrimp. For the smaller vessels (Types I and II), Maharaj
(1993) estimated a ratio of by-catch to shrimp of 14.7:1 for 1987, and Kuruvilla et al. (2000) estimated a ratio of
12.2:1 for 1999. For the mid-sized trawlers (Type III trawlers), Amos (1990) estimated a 1990 by-catch to shrimp
ratio of 12.1:1 for the entire Gulf area, while Kuruvilla et al. (2000) estimated a ratio of 9.1:1 for 1999. The annual
by-catch to shrimp ratio for smaller trawlers (1988 to 1998) and for mid-sized trawlers (1991 to 1998) was estimated
by interpolation between available estimates from the above sources. A by-catch to shrimp ratio of 0.3:1 was
estimated for the large trawlers (Type IV trawlers) using data in Maharaj (1993). However, Kuruvilla et al. (2000),
using logbook data from November 1991 to April 1992, estimated a by-catch to shrimp ratio of 0.6:1 for the same
fleet. The mid-point of these two ratios, i.e., a by-catch to shrimp ratio of 0.45:1, was used in the analysis. This
estimate was assumed the same throughout the period of operation of this fleet (1969 to the present). Estimates of
total by-catch were derived as the product of the by-catch to shrimp ratio and the associated total catch of shrimp for
the respective fleets.
Maharaj (1993) and S. Soomai (unpublished data) provided details on the weight of by-catch by species for the
artisanal fleet from which the corresponding species composition was derived for 1987 and 1999, respectively.
Similarly, the species composition of by-catch in the semi-industrial fleet was derived using information from Amos
(1990) and Soomai (unpublished data) for 1990 and 1999, respectively. The complete species composition of by-
catch of the trawl fisheries was estimated by interpolation between available estimates for these sources. The annual
species composition of catches from the artisanal fleet between 1987 and 1999 was estimated by interpolation
between estimates from Maharaj (1993) and Soomai (unpublished data), the annual species composition of catches
from 1973 to 1987 was assumed constant and equal to the 1987 estimates and the annual species composition from
2000 to 2001 was assumed constant and equal to the 1999 estimates. The annual species composition of catches
from the semi-industrial fleet in 1987 (when the fleet commenced operations) and 1988 was assumed constant and
equal to the 1989 estimate and similarly the annual species composition for 2000 and 2001 was assumed constant
and equal to the 1999 estimate. There is currently no information on the species composition of by-catch from the
industrial fleet. As a result the estimated by-catch was assigned to the category “unidentified fish and invertebrates”.
Estimation of catches from fishing tournaments
Data from fishing tournaments were available from the Trinidad and Tobago Game Fishing Association as well as
the Fisheries Division’s data collection program for sport fishing tournaments. The data covered landed catches of
target species, and by-catch species to a lesser extent, from 1991 to 2001 for the following tournaments conducted in
Trinidad over the period: Citibank Kingfish Tournament, the Royal Bank Wahoo Tournament, the Scotia Bank
23
Funfish Tournament, the Teacher’s Scotch Whiskey Kingfish Tournament and the Winfield Aloeng Tournament.
Data were available from 1981 to 2001 for the Caribbean International Game Fishing Tournament conducted
annually in Tobago.
Foreign fishing in Trinidad and Tobago EEZ
Foreign fleets: Venezuelan trawlers and semi-industrial multi-gear boats
Trawlers
Landed catch and by-catch: Annual total shrimp catch (target species) of the Venezuelan fleet operating in the
Atlantic Zone of Venezuela (includes waters both within and outside the EEZ of Trinidad and Tobago) was
available for 1973 to 1994 (Marcano et al. 1997) and annual total fish catch (landed by-catch) of the same fleet
operating in the same area was available for 1987 to 1996 (Marcano et al. 1999). Fish catch estimates in Marcano et
al. (1999) did not include the dog trout (Macrodon ancylodon), however, catches of this species were available from
Marcano et al. (1997) for 1987 to 1994. Estimates of the annual fish catch in the Atlantic Zone of Venezuela
between 1973 and 1986 were calculated as the product of the ratio of fish to shrimp in the catch and the overall
shrimp catch for the respective year. The ratio of fish to shrimp in the annual catches between 1973 and 1986 was
assumed the same as the ratio in the 1987 catch. The ratio of fish to shrimp in 1995 was estimated by interpolation
between the 1994 and 1996 ratios.
The total catches of shrimp and fish in the Atlantic Zone of Venezuela (CVEN) between 1973 and 1996 were
adjusted to account for catches taken only within the EEZ of Trinidad and Tobago. This was done using spatially
disaggregated annual catch data for fish and shrimp reported for the entire Atlantic Zone of Venezuela, including the
east and north coasts of Trinidad, from 1989 to 1991 (Marcano et al. 1995) and 1995 to 1996 (Marcano et al. 1997).
The catch data were disaggregated into shrimp and fish for spatial grids of 30 miles square. The grids within the
EEZ of Trinidad and Tobago were numbered: 10623; 10613; 10604; 10603; 10694; 10612; 10611; 10602; 10601;
10592; 9614; 9613; 9603 and 9594. The combined catch of shrimp in these grids was taken as the catch within the
EEZ of Trinidad and Tobago from 1989 to 1991 and from 1995 to 1996. Using the annual combined shrimp catch
for these cells (CTT) and the corresponding total shrimp catch for the Atlantic Zone of Venezuela (CVEN) the ratio
of CTT to CVEN was computed for 1989 to 1991 and 1995 to 1996. These ratios were used to estimate the catches
taken within the EEZ of Trinidad and Tobago from the estimates of total catches in the CVEN estimated for the
same years above. The 1989 ratio was applied to total catch in the Atlantic Zone of Venezuela between 1973 and
1988. The ratio for 1992 to 1994 was estimated by interpolation between the 1991 and 1995 estimates. The same
procedure was followed to estimate the annual fish catches within the EEZ of Trinidad and Tobago.

24
The annual species composition of fish catches in the Atlantic Zone of Venezuela was available for 1987 to 1996
from Marcano et al. (1999). The authors reported catches by nine species categories: croaker (Micropogonias
furnieri); curvina (Cynoscion spp.); king weakfish (Macrodon ancylodon); lane snapper (Lutjanus synagris);
catfishes nei (Bagre bagre, Arias spp.); Atlantic moonfish (Selene setapinnis); Atlantic cutlassfish (Trichiuridae);
sharks, rays, skates, etc., (Elasmobranchii); and marine fish nei. The same species composition was assumed for fish
catches within the EEZ of Trinidad and Tobago. The 1987 species composition was assumed for the years 1973 to
1986.
Discarded by-catch: Spatially disaggregated data (30 mile square grids as described above) on the non-commercial
shrimp accompanying fauna (NCSAF) or non-commercial by-catch (NCBC) were available for 1991 and 1992
(Marcano et al. 1995). According to Marcano et al. (1995) the NCSAF was comprised of 96 percent fish, 3 percent
crustaceans and 1 percent molluscs and other invertebrates. Assuming the same annual ratio of landed fish by-catch
and discarded fish by-catch for 1973 to 1990 as that estimated for 1991, estimates of discards of fish by-catch were
derived for all years with missing data. The discarded by-catch of other invertebrates (4 percent) was calculated
using the estimates of discarded fish by-catch which accounted for 96 percent of overall discards (invertebrate
discard = discard of fish by-catch/96 * 4).
Semi-industrial multi-gear Venezuelan boats utilizing live bait fishing, surface and demersal longlines, hook and line and demersal handlines
fish off the north and east coasts of Trinidad (Mendoza and Lárez 1996). Those utilizing pelagic gear target carite
(Scomberomorus brasiliensis), dolphinfish (Coryphaena hippurus) and billfish (Istiophoridae), while those utilizing
demersal gear target snappers (Rhomboplites aurorubens, Lutjanus purpureus) and groupers (Epinephelus
flavolimbatus). On average about 90 fishing trips are conducted each month. Data for this fleet operating in the
waters of Trinidad and Tobago were obtained from the Sea Around Us of the Fisheries Centre, University of British
Columbia.
UPDATE Calculating totals
2001-2010:
For the update, total catches were extrapolated forward to 2010. This was achieved by first calculating the ratio of
overall reconstructed catches to the FAO total for each year and taking an average of 1997-2001. The average ratio
was carried forward and applied to the FAO total for each year, 2002-2010, to estimate an overall catch for Trinidad
and Tobago for each year. This estimate was split by the average percentage contribution of Trinidad and Tobago
separately to the total reconstructed catch for 1997-2001, giving an estimated catch total for each island in 2002-
2010.
25
Marine Mammals and Turtles
Earlier work by Mohammed and Chan A Shing (2003) contained catches of marine mammals and turtles. However,
the Sea Around Us does not include these, thus marine mammal and turtle catches were excluded from the database
and final reconstruction totals.
Sector breakdowns
Sector disaggregation for Trinidad’s industrial, semi-industrial and artisanal fleets, including landed by-catch and
discards of the shrimp industry, and tournament recreational fishing, as well as for the artisanal fleet for Tobago,
were provided by Mohammed and Chan A Shing (2003) for the period 1950-2001. To estimate the catch in each
sector for 2002-2010, the average contribution of each to the total catch in 1997-2001 was applied to the estimated
total for each year.
Industrial and artisanal catches
For the purposes of this update, all catches from the semi-industrial fleet were considered to be industrial.
Additionally, although part of the shrimp catches were described as coming from what in Trinidad and Tobago is
called an ‘artisanal trawl’ fleet, the Sea Around Us considers all towed gear to be industrial (Martín 2012) and
therefore ‘artisanal’ shrimp catches and associated by-catch and discards were re-categorized as industrial.
Species breakdown, 2002-2010
A taxonomic breakdown was estimated by first calculating the average contribution of each species to total catch for
each sector in the years 1997 – 2001. This average was then applied to the estimated catch for the industrial and
artisanal sectors each year 2002-2010.
Discards
Shrimp trawl fisheries are known to have high discard rates (Alverson et al. 1994) and therefore a discard rate was
calculated for the shrimp by-catch. Lopez (1999) reported that 90% of shrimp by-catch is discarded in Trinidad and
Tobago; therefore, we applied this rate to the previously calculated by-catch, to split by-catch into a landed
component and a discarded component.
Subsistence
The reconstruction may already address part of the subsistence contribution for the islands, in terms of parts of
reported catch that was landed through reporting stations but taken home, but it is likely that fishing purely for
subsistence bypassed the reporting process. Using case studies from Martinique, Dominica, Guadeloupe, Montserrat
and St Kitts and Nevis (Frotté et al. 2009a, 2009b; Ramdeen et al. 2012; Ramdeen et al. 2014a; Ramdeen et al.
2014c), an approximate average per capita subsistence rate of 0.013 t∙person-1∙year-1 in 1950 and 0.006 t∙person-
1∙year-1 in 2010 was calculated and an interpolation applied for the intervening years. We conservatively applied

26
50% of this to the population of Trinidad and Tobago for the 1950-2010 time period to estimate a subsistence catch.
This is a highly simplified approach and it is likely that subsistence catches are underestimated.
Taxonomic breakdown
A taxonomic disaggregation was achieved by assuming that the subsistence catch composition was proportionally
similar to the artisanal catch. The contribution of each species to the artisanal catch in each island was applied to the
estimated totals for Trinidad and Tobago.
Recreational
Domestic
Taxonomic breakdown
Mike and Cowx (1996) reported on the domestic recreational fishery in Trinidad and Tobago and estimated that in
1992, 1,000 t of fish were caught in the north-west Trinidad domestic recreational fishery. This figure was used as
an anchor point and it was assumed that 1,000 t·year-1 remained the catch until the end of the time period; it was also
assumed that 100 t was caught by recreational fishers in 1950. Catch totals were interpolated between 1950 and
1992 to estimate landings for the intervening years. Mike and Cowx (1996) also reported that many of the fish
caught were sold and estimated the proportion sold in each taxa. We used this as a proxy for the catch composition
and the percentages were normalised to give a species breakdown sector, which was applied to the estimated total
for each year. Again, this is considered to be a conservative estimation for the total fish caught recreationally in the
islands.
Tourist
Recreational participation in Antigua and Barbuda was found to be 0.23% of the total population (Cisneros-
Montemayor 2010) and the same rate was assumed to be true of tourists in Trinidad and Tobago. Tourist arrivals
data were only available from 1995,1 so estimated tourist numbers for 1950-1994 were calculated by interpolating
from 260,000 tourists in 1995 to an assumed 0 tourists in 1945. Recreational participation was than calculated by
applying the 0.23% participation rate to the tourist numbers. Ramdeen et al. (2014b) estimated a consumption rate
of 0.001 t·tourist-1·year-1 for the British Virgin Islands, which we assumed to be the same for Trinidad and Tobago
and applied it to the estimated participation total for each year 1950-2010 to obtain a recreational catch for both
islands combined.
Taxonomic breakdown
The catch composition for the tourist recreational fishery was calculated using the same methods as for the domestic
recreational fishery
Tournament recreational fishing taxonomic breakdown
The average species contribution for the years 1997-2001 was applied to the estimated 2002-2010 totals for the
tournament fishing calculated above.
1 http://data.worldbank.org/indicator/ST.INT.ARVL

27
Foreign fishing
Trawlers: Venezuelan vessels are understood to have continued targeting shrimp in a common fishing zone that
included part of the Trinidad and Tobago EEZ until 2009, when trawling in Venezuela was banned by Presidential
decree (J. Mendoza, pers. comm). However, no new information on the catch and by-catch quantities was available.
Therefore the total catches were extended from 1996-2009, using the average catch of 1995-1996 and the relative
contribution of each species.
Semi-industrial multi-gear: This fishery has continued into the 21st century, although the port sampling which
informed the data in the original reconstruction ceased in the early 2000s (J. Mendoza, pers. comm). Therefore,
catches were assumed to have remained relatively constant and were extended from 2001-2010 using the average
total catch and relative average annual contribution of each species 1996-2000.
RESULTS
Fisheries catches
Total reconstructed catches by Trinidad and Tobago between 1950 and 2010 were 2.6 times larger than those
reported to the FAO over the same period. The catches were dominated by the artisanal sector, which made up
37.7% of the overall catch, followed by the landings of the subsistence and industrial sectors, with 26.5% and 7.9%,
respectively. The recreational sector contributed 4% of the total catch. Discards from the shrimp fishery (industrial)
made up 24.2% of total catches. Catches within Trinidad and Tobago’s EEZ by the Trinidad and Tobago fleet were
92.5% of the total reconstructed catch.
Overall catches increased gradually from 9,000 t in 1950 to 13,600 t in 1967, before the catch rose sharply the next
year and peaked at 24,300 t fish caught in 1969. A steady decline to the late 1980s followed, with the catch dropping
almost to previous levels, with 16,600 t caught in 1986. Another spike occurred in 1987, with the catch leaping to
29,400 t and returning to 24,100 t by 1988. This was followed by a fluctuating gradual decline, eventually
stabilizing in the late 2000s with an average 19,600 t∙year-1 caught between 2006 and 2010 (Figure 2a).
Tunas, mackerels and bonitos (Scombridae) were the most prevalent taxa in the overall catch, with 25.4% of the
catch. Swimming crabs (Portunidae) and marine fishes not identified were also important, with 7.8% and 7.4%,
respectively, followed by snappers (Lutjanidae, 7.2%) and drums and croakers (Sciaenidae, 7.1%) (Figure 2b).
Industrial sector
The industrial sector contributed 32.1% of the overall catch, although 75.5% of those removals were discards, and
had a similar trend to the overall catch. In the early 1960s, there was a significant crash, with the catch falling from
2,700 t in 1962, to 265 t in 1963, followed by immediate recovery to 2,800 t in 1964. Thereafter, the catch continued
to follow the same trend as the overall catch, peaking in the late 1960s, followed by a steady decline and another
dramatic spike in the late 1980s. Catches stabilized in the late 2000s, averaging 5,800 t∙year-1.

28
The main catch was swimming crabs, as by-catch of the shrimp industry, with 24.4% of the catch. Penaeid shrimp
followed with 12.1%. Drums and croakers (7.6%) and herrings and shads (Clupeidae, 7.6%) were also important
components of the by-catch.
Artisanal sector
The artisanal sector was the main component of the overall reconstructed catch, contributing 37.7%. Catches in the
sector followed a very steady and gradual increase across the time period, rising from 4,400 t in 1950 to a peak of
12,100 in 2002. Catches decreased through the early part of the 2000s, stabilizing at an average 8,800 t∙year-1 over
the last five years of the decade.
Tunas, mackerels and bonitos (37.3%) made up over a third of the catch, more than three times as much as the next
most important taxa, snappers (11%). Jacks and pompanos (Carangidae 7.5%) and drums and croakers (7.2%) were
the next most significant taxa in the catch.
Subsistence
The subsistence sector exhibited a gradual rise from 4,200 in 1950 to 5,100 t in 1961 and thereafter produced
relatively stable catches, averaging 5,200 t∙year-1, until 1990. Catches then declined steadily to 3,900 t in 2010.
Tunas, mackerels and bonitos (40%) were the most dominant taxa, followed by snappers (7.7%), jacks and
pompanos (7.7%) and clupeoids (7.5%).
Recreational
Catches in the recreational sector increased steadily from 100 t in 1950 to a peak of 1,000 t in 1992 and plateaued
thereafter.
Trinidad
In Trinidad alone, artisanal landings were again most important, contributing 37%. Subsistence fisheries made up
28.6%, with recreational fisheries making up 4.5%. Industrial landings were 7.1% of the total, with discards
contributing 22.7%.
Catches followed a similar trend to the overall reconstruction. Beginning at 7,200 t in 1950, catches increased over
the time period with peaks of 23,600 t in 1969 and 26,700 t in 1987, stabilizing at an average of 13,600 t∙year-1 for
2006-2010 (Figure 3a).
As in the overall reconstruction, tunas and mackerels (Scombridae, 29.1%), swimming crabs (Portunidae, 7.9%),
drums and croakers (Sciaenidae, 7.8%) and herrings and shads (Clupeidae, 7.4%) were the most important taxa
(Figure 3b).

29
Tobago
Artisanal fisheries in Tobago made up 71.7% of catches, with subsistence contributing 28.2%. Recreational fisheries
made up less than 0.1%. Catches on the island initially decreased, dropping from 1,800 t in 1950 to 900 t in 1966.
Catches then recovered, steadily increasing with peaks of 3,300 t in the mid-1990s and the early 2000s, before
declining again to 2,500 t in 2010 (Figure 4a).
Compared to the overall catch breakdown, the taxonomic composition was quite different in Tobago. Snappers
(Lutjanidae, 37.4%) were by far the most dominant taxa, followed by flying fish (Exocoetidae, 15.4%). Tuna,
mackerels and bonitos (13.5%), jacks (Carangidae, 8.8%), and sea basses and groupers (Serranidae, 7.2%) were also
important (Figure 4b).
Outside the EEZ
Trinidad and Tobago also fished outside of their own waters with 7.4% of their catches coming from Venezuelan
waters and less than 1% from Guyana. Catches in Guyana averaged just over 80 t·year-1 from 1969 to 1976. Catches
in Venezuelan waters initially were relatively stable, averaging 310 t·year-1 from 1970 to 1986. Catches then
increased to 1,100 t in 1987 before spiking to 5,700 t in 1992. Catches then declined and fluctuated until the late
2000s when catches leveled out at 3,500 t·year-1.
Foreign Fishing
It was estimated that the catch by the Venezuelan fleet in Trinidad and Tobago’s EEZ (which was part of the
common zone) averaged 18,000 t·year-1 from 1973-1977 before declining sharply to an average of 11,400 t·year-
1 from 1978-1983. Catches hit a low of 5,000 t in 1986 and then rose to a peak of 24,600 t in 1990. Catches then
declined again to 3,700 t in 1995 and remained at that level up until 2009, at which point trawling was banned in
Venezuela. Note that these catches by Venezuelan vessels are not included in any of the above results. Our main
results were focused on catches by Trinidad and Tobago.
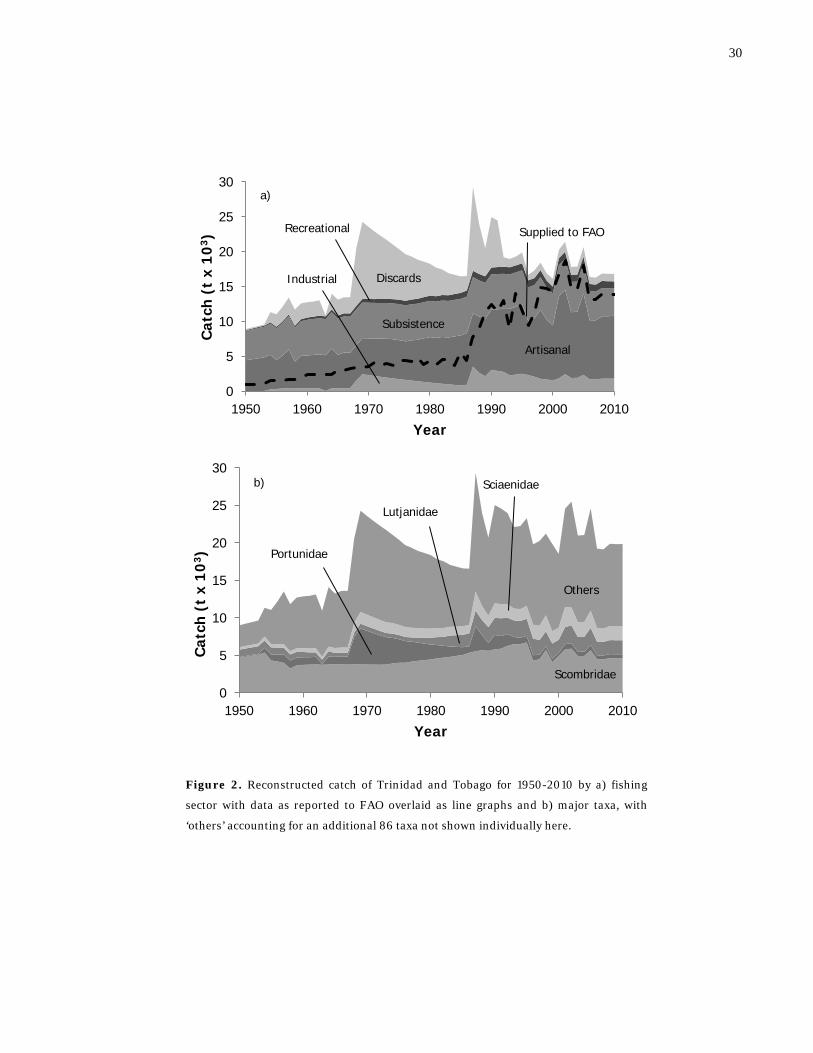
30
Figure 2. Reconstructed catch of Trinidad and Tobago for 1950-2010 by a) fishing
sector with data as reported to FAO overlaid as line graphs and b) major taxa, with
‘others’ accounting for an additional 86 taxa not shown individually here.
0
5
10
15
20
25
30
1950 1960 1970 1980 1990 2000 2010
Cat
ch (
t x
103 )
Year
Industrial Discards
Subsistence
Recreational
Artisanal
Supplied to FAO
a)
0
5
10
15
20
25
30
1950 1960 1970 1980 1990 2000 2010
Cat
ch (
t x
103 )
Year
Sciaenidae
Lutjanidae
Portunidae
Scombridae
Others
b)

31
Figure 3. Reconstructed catches in Trinidad by a) sector and b) taxonomic
breakdown. ‘Others’ includes 82 additional taxa.
0
5
10
15
20
25
30
1950 1960 1970 1980 1990 2000 2010
Cat
ch (
t x
103 )
Year
Discards
Subsistence
Recreational
Artisanal
Industrial
a)
0
5
10
15
20
25
30
1950 1960 1970 1980 1990 2000 2010
Cat
ch (
t x
103 )
Year
Others
Clupeidae
Sciaenidae
Portunidae
Scombridae
b)

32
Figure 4. Reconstructed catches in Tobago, 1950-2010, a) by sector. Note that the
recreational sector is too small to visualize; and b) by major taxonomic category.
‘Others’ accounts for 17 additional taxa.
0
500
1000
1500
2000
2500
3000
3500
1950 1960 1970 1980 1990 2000 2010
Cat
ch (
t)
Year
Subsistence
Artisanal
a)
0
500
1000
1500
2000
2500
3000
3500
1950 1960 1970 1980 1990 2000 2010
Cat
ch (
t)
Year
Lutjanidae
Others
Serranidae
Carangidae
Scombiridae Exocoetidae
b)

33
DISCUSSION
Catches
Overall, catches by Trinidad and Tobago increased by 2.2 times between 1950 and 2010. In Trinidad waters, the
increase over the time period was a factor of 1.9, and in Tobago 1.4. The overall combined reconstructed total for
catches by both islands was 2.6 times the data officially reported to the FAO for the same time period. It is
interesting to note that data submitted to the FAO comprised mainly landings of the artisanal multi-gear fleet as well
as the artisanal, semi-industrial and industrial trawl fleets of Trinidad, i.e., landings from the semi-industrial multi-
gear and longline fleets, as well as by-catch of the trawl fleets in Trinidad, are not included. Landings from all fleets
in Tobago are also not included in data submitted to the FAO. Reconstructed data show a decline in catches from the
late 1980s while reported data showed a decline from the mid-1990s.
The general trend in reconstructed catches differs from reported data mainly because of the high by-catch of the
trawl fleet, responsible for the 1969 and 1987 peaks. In 1969 many industrial trawlers which were denied access to
waters off the Guianas began fishing in the waters of Trinidad and Tobago, in addition to the artisanal fleet which
existed since 1954. The 1987 spike coincides with the time when the NFC sold their fleet that was fishing on the
Brazil/Guyana shelf and some vessels were bought by local operators fishing in Trinidad and Tobago waters.
Nevertheless, further investigation is necessary to determine the validity of the data for these years. Although the
artisanal trawl fleet began operations in the 1950s, this fleet is known for fishing in Venezuela’s waters. Hence the
percentage of total catch taken in Trinidad and Tobago’s waters needs to be verified by further study. As well, the
ratio of shrimp to by-catch, estimated by Maharaj (1989) for the late 1980s, was assumed constant since the
inception of the trawl fleet. The same assumption was made for the species composition of the by-catch.
A greater level of species disaggregation was achieved with reconstructed catches compared to reported catches.
While reported catches were confined to between 10 and 25 species or species groups per year, reconstructed
catches for Trinidad increased from 10 species or species groups per year in the early 1950s to 53 by 1954 and to 75
by the 1990s. Inadequate data collection however, impacted on the number of species groups in reconstructed data
for Tobago as these varied between five and twenty per year from 1950 and 2001. As well, the percentage of total
catch in the aggregate category remained lower in reconstructed data for Trinidad compared to the associated
reported data. Overall reconstructed data were a better representation of overall catches and species composition of
the catch than reported data.
The procedure for adjusting recorded to estimated total catches by fleet, gear and species is continuously being
refined in Trinidad. Recent refinements preclude overestimation of catches by trawl fleets and fleets which capture
blue marlin and sailfish off Trinidad’s north coast (L. Ferreira, Fisheries Officer, pers. comm.). Such refinements are
due to improvements in the data collection system as well as consideration of species distributions in assessing the
likelihood of specific fleets targeting certain species, accounting for months with missing data at the respective sites
and inclusion of the landed component of groundfish by-catch of the industrial trawl fleet. Unfortunately, this results
34
in some inconsistency in interpretation of current, compared to historic data, since the refinements are applied to the
data from 1995 only.
As a single group, Scombrids dominated Trinidad catches, while Lutjanids dominated Tobago catches over the
entire period examined. However, a large portion of Trinidad catches are attributed to the by-catch of trawl fleets
(artisanal and semi-industrial), which comprises about sixty-two species groups of which only nine are major
contributors to overall by-catch: Portunidae, Trichiuridae, Triglidae, Engraulidae, Clupeidae, Carangidae,
Lutjanidae, Sciaenidae and Gerreidae. The species composition of the by-catch of industrial trawlers is not known
and had to be estimated based on the semi-industrial trawlers, therefore is one of the limitations of this study.
Tobago catches were dominated by Lutjanids, Exocoetids, Scombrids, Carangids and Serranids. However, there was
very poor data collection coverage over the time period examined. As well, there exists no system in Tobago for
estimation of total landings, nor total catches from recorded data, except for the drifting fishery which was the main
focus of data collection between 1988 and 1997. Large pelagic species such as dolphinfish (Coryphaena hippurus),
wahoo (Acanthocybium solandri), king mackerel (Scomberomorus cavalla), yellowfin tuna (Thunnus albacares),
blackfin tuna (Thunnus atlanticus), skipjack tuna (Katsuwonus pelamis), Atlantic bonito (Sarda sarda) among
others are caught at various locations around Tobago but Charlotteville and the southwestern areas are major landing
points. These species however, do not feature significantly in reconstructed catches. Thomas et al. (2000) provided
estimates of catches of dolphinfish, wahoo and king mackerel between 1988 and 1999 however, the source of the
information and method of derivation of the estimates were not indicated. Further, the estimates were less than those
estimated in this study for the respective species and years.
There is some uncertainty regarding interpretation of historic catch data. Amos (1990) provided estimates of shrimp
landings in Trinidad and Tobago from 1962 to 1989. In the absence of a system for estimating total catches from
recorded data at the time, it was assumed that the statistics represent recorded data, and therefore are likely an
under-estimate of total catches. Prior to 1978, boats from Trinidad caught shrimp in the waters off the Guyana-
Brazil shelf, under a bilateral agreement between Trinidad/Tobago and Brazil (Weidner and Hall 1993; Mohammed
and Chan A Shing 2003). As well, boats from Trinidad also fished off Suriname, Guyana and French Guiana (Jones
and Dragovich 1973; Weidner and Hall 1993; Mohammed and Chan A Shing 2003). There is a possibility that
statistics on shrimp catches between 1962 and 1978 may include catches taken from waters in the Guyana-Brazil
Shelf. However, this is highly unlikely as such catches were landed in Port of Spain for direct processing and an
associated data collection system had not been implemented for such activity.
Alverson et al. (1994) ranked the artisanal shrimp fishery of Trinidad among one of the highest in the world based
on the quantities of by-catch and associated discards. The annual average estimated by-catch of the trawl fleets in
the reconstruction between 1954 and 2001 was just over 5,000 t∙year-1. However, in the late 60s/early 70s period, as
well as the late 1980s, the annual total was more than double that. Kuruvilla et al. (2000) estimated annual discards
of 8,800 t of by-catch, twice the overall estimated by-catch in 1999 reconstructed data. The difference between the
two estimates is likely due to consideration of the entire catch of the artisanal trawl fleet by Kuruvilla et al. (2000) ,
while reconstructed data considered only the portion of overall catches (five percent in 1999) taken in local waters.
35
Several assumptions were taken with respect to the point estimates of by-catch to shrimp ratio, as well as the species
composition of the by-catch for the artisanal and semi-industrial fleets.
The reconstruction did not attempt to represent discarded by-catch of other fleets or gear, although gear such as
beach seines also produce discards. Further study is required to incorporate discards of fishing other than shrimp
trawls.
Foreign fishing in the waters of Trinidad and Tobago has been and still is a common occurrence. In fact, as early as
the 1920s boats from Venezuela, Grenada and St Vincent were documented as “making good hauls” in the waters
off Tobago (Guppy 1922). During the period investigated in this study however, only fleets from Venezuela were
considered in detail. Preliminary estimates of catches by the Venezuelan fleet, comprising trawlers and semi-
industrial multi-gear boats, appear to surpass those taken by local fleets in the EEZ of Trinidad and Tobago. This is
mainly due to the estimated large quantities of trawl by-catch, however, estimates of the catch totals were not made
in this study. Nevertheless, the illegal fishing of Venezuela fleets in the waters of Trinidad and Tobago has been a
long standing problem due to the limited monitoring, surveillance and enforcements capabilities of Trinidad and
Tobago and the general failure on the part of both governments to fully activate the protocol on fisheries research
for collaboration in management of shared stocks under the fishing agreement between the two countries (Kuruvilla
and Chan A Shing 2002).
Mendoza and Lárez (1996) examined catches of the artisanal medium range fishery (termed semi-industrial multi-
gear fleet of Venezuela in this study, though still categorized as artisanal catch) off northeastern Venezuela, through
a series of interviews and landing controls. Results of the study indicated considerable declines in catch per unit
effort of three important species between 1981 and 1992: catch of the red snapper (Lutjanus purpureus) per handline
per fishing day declined by 40 percent off Trinidad’s east coast and similar statistics for the yellowedge grouper
(Epinephelus flavolimbatus) and vermillion snapper (Rhomboplites aurorubens) declined by more than 50 percent
off Trinidad’s north coast. Confirmation of illegal fishing activity of Venezuelan boats was obtained from a reliable
but confidential source as a regional meeting in 2000. During the period 1997 to 1999, thirty-six Venezuelan boats
fished between 120 and 160 miles off the east coast of Trinidad. They targeted the red snapper (Lutjanus purpureus)
using handlines and landed the catch at night in Port of Spain for subsequent export. The operation was coordinated
by a national of Martinique and there are no records of the catch. In 2000, there were also 120 Venezuelan boats
fishing within the 200 nm zone, using live bait fishing to catch carite (Scomberomorus brasiliensis) and surface
longlines and hook and line to catch dolphin fish (Coryphaena hippurus) and billfishes (Istiophoridae). An unknown
number of Venezuelan boats targeting billfishes also operate off Trinidad’s north coast. Besides Venezuelan vessels,
fleets from Barbados and occasionally Guyana are also involved in illegal fishing in Trinidad and Tobago waters
(Kuruvilla 2004).
Reported coverage of the recreational fishery is limited to fishing tournaments between 1981 and 2001 in Tobago
and 1991 to 2001 in Trinidad. The reconstruction includes estimations on domestic recreational catches based on

36
Mike and Cowx (1996), as well as tourist recreational fishing in both Trinidad and Tobago. However, these are
based on somewhat crude assumptions and it is likely that as a result, the reconstructed data under-represent the
actual catches of the associated fleet. There is currently no data collection system for the recreational fleet.
The field identification of landed species uses either local names or the FAO common names. This leads to
discrepancies in the assignment of scientific names, particularly for the artisanal fleet. This situation is also
complicated by the variation in local names given to the same species at different landing sites. Some local names
correspond to FAO common names, but refer scientifically to different species. A more accurate representation of
the breakdown of catches is therefore provided by family groups in this study.
An in depth study on removals from foreign fishing is necessary. Results suggested that catches by fleets from
Venezuela in Trinidad and Tobago waters are substantial, perhaps even greater than the local fleet. However, the
data on these removals are not made available, except at the FAO/WECAFC Stock Assessment and Management
Workshops on Shrimp and Groundfish Resources of the Brazil-Guianas Shelf (SGW). These Workshops examine
catches from trawlers only but there are other fleets from Venezuela which operate in the waters of Trinidad and
Tobago. An account of illegal fishing by Venezuelan boats in the waters of Trinidad and Tobago was made public at
the 4th FAO/WECAFC SGW from a reliable source. From the end of 1997 to 1999 thirty-six boats from Venezuela,
each less than 14 m, fished between 220 and 300 km off the east coast of Trinidad using handlines to catch red
snappers (Lutjanus purpureus). The catch was landed at night, in Port of Spain, Trinidad and shipped out of the
country by a national of Martinique. Neither Trinidad nor Venezuela has records of the associated catches. In 2000,
there were also 120 boats from Venezuela, each less than 14 m, fishing with a-la-vive lines (pelagic lines using live
bait), surface longlines or hook and line between 220 and 300 km off the east coast of Trinidad and as far east as 58
degrees longitude. These boats targeted the Serra Spanish Mackerel (Scomberomorus brasiliensis), dolphinfish
(Coryphaena hippurus) and billfish (Istiophoridae). Fishers from Puerto Santo on Margarita Island also fish off
Trinidad’s north coast for marlin (most likely the Atlantic Blue Marlin, Makaira nigricans) as they move between
Venezuela and Tobago. There are still numerous accounts of illegal fishing by boats from Venezuela in the waters
of Trinidad and Tobago. Illegal fishing by boats from Barbados, in waters off Tobago is also an issue. Yet, the
monitoring, surveillance and enforcement capability of Trinidad and Tobago is limited despite the formation of an
associated Unit within the Fisheries Department in 2006.
There is need to improve the data collection system in Tobago and to introduce a methodology for estimation of
total landings and possibly catches from recorded data. It is difficult therefore to interpret the existing recorded data
(both quantity and species composition) as the coverage of the eight landing sites recorded is very limited (data are
collected at most eight days per month). As well, there is need to conduct a boat census to be used as a basis for
modifying recorded data to estimate total landings for landing sites which are not recorded.
37
Bait fisheries which target mainly small pelagic species (Vincent 1910; Mohammed 2006) for use in live-bait
fishing, longlines and fishpots are not well documented. These operations occur offshore and catches are sometimes
kept alive in netted enclosures for sale to various boats. This activity is not currently incorporated into the data
collection programme. Foreign catch data are also not readily available, whether under an access agreement or
illegal. Illegal, unreported and unregulated catches were also not considered in this analysis. These limitations direct
future efforts for improvement of the fisheries catch statistics in Trinidad and Tobago. ACKNOWLEDGEMENTS
This is a contribution from the Sea Around Us, a collaboration between the University of British Columbia and The
Pew Charitable Trusts. We would like the thank Jeremy Mendoza for providing information on Venezuelan fishing
activity in Trinidad and Tobago’s EEZ. We also thank Christine Chan A Shing for considerable assistance sourcing
catch data and the Paul G. Allen Family Foundation for supporting the Sea Around Us.

38
REFERENCES Alexander C (1998) Landing sites, gear types, fishing areas, species landed and vessels recorded by the data
collection system under the CFRAMP Large Pelagic and Reef Fish Resource Assessment Sub-project implemented in Tobago. Fisheries and Marine Affairs Section, Division of Agriculture, Forestry and Marine Affairs, Scarborough. 9 p.
Alverson DL, Freeberg MH, Murawski SA and Pope JG (1994) A global assessment of fisheries by-catch and discards. FAO Fisheries Technical Paper 339, FAO, Rome. 233 p.
Amos M (1990) A study of type III shrimp trawling in the Gulf of Paria. Advanced Diploma in Resource Management and Environmental Studies thesis, University of the West Indies, Cave Hill (Barbados), UWI/CERMES/9004PR. 56 p.
Anon. (1929) Administration report of the Director of Agriculture for the year 1928. Government Printing Office, Port of Spain (Trinidad). 2 p.
Anon. (1946) Administration report of the Director of Agriculture for the year 1946. Government Printing Office, Port of Spain (Trinidad). 11 p.
Anon. (1947) Report on fisheries of Trinidad and Tobago: Potentialities and development. Fisheries Division, Port of Spain (Trinidad). 6 p.
Anon. (1948) Administration report of the Director of Agriculture for the year 1947. Port of Spain (Trinidad). 10 p. Anon. (1958) A reconnaissance agriculture and fisheries survey of the eastern countries of Trinidad and East
Victoria. Bulletin No. 38, Development and Welfare in the West Indies. 32 p. Brown HH (1942) The sea fisheries of Trinidad and Tobago. Bulletin 2, Development and Welfare. 45 p. Caesar ED (1988) A brief history of fisheries development in Tobago. In Consultation on the fisheries industry in
Tobago, October 15, 1988, Scarborough. 5 p. Chan A Shing C (1993) The industrial longline fishery in Trinidad: A description and recommendations for
improving data collection. Ministry of Agriculture, Land and Marine Resources, Port of Spain (Trinidad). 33 p.
Cisneros-Montemayor A (2010) The economic benefits of ecosystem-based marine recreation: implications for management and policy. MSc thesis, University of British Columbia, Vancouver. 105 p.
Fabres B (1983) Fisheries and related oceanography of northeastern South America. Ministry of Food Production, Marine Exploitation, Forestry, and the Environment, Port of Spain (Trinidad). 27 p.
Fabres B (1986) The flying fish fishery of Trinidad and Tobago. In Mahon R, Oxenford H and Hunte W (eds.), Development strategies for flying fish fisheries of the eastern Caribbean: Proceedings of an IDRC-Sponsered Workshop at the University of the West Indies. 7-10 p.
Fiedler RH, Lobell MJ and Lucas CR (1957) The fisheries and fishery resources of the Caribbean area. Fishery Leaflet 259, United States Department of the Interior, Bureau of Commercial Fisheries. 211 p.
Frotté L, Harper S, Veitch L, Booth S and Zeller D (2009a) Reconstruction of marine fisheries catches for Guadeloupe from 1950-2007. pp. 13-20 In Zeller D and Harper S (eds.), Fisheries catch reconstructions: Islands, part I. Fisheries Centre Research Report 17 (5). University of British Columbia, Vancouver.
Frotté L, Harper S, Veitch L, Booth S and Zeller D (2009b) Reconstruction of marine fisheries catches for Martinique, 1950-2007. pp. 21-26 In Zeller D and Harper S (eds.), Fisheries catch reconstructions: Islands, part I. Fisheries catch reconstructions: Islands, part I 17 (5). University of British Columbia, Vancouver.
Guppy PL (1922) A Naturalist in Trinidad and Tobago. The West India Committee Circular 626: 443-445; 467-468; 492.
Horsford S (1975) The effectiveness of fiscal incentives in the fishing industry of Tobago. Caribbean Studies thesis, The University of the West Indies, Trinidad. 45 p.
Hunt REB (1949) Survey of Trinidad fisheries. Fisheries Division, Port of Spain (Trinidad). 2 p. Jones AC and Dragovich A (1973) Investigations and management of the Guianas Shrimp Fishery under the US-
Brazil Agreement. Proceedings of the Gulf and Caribbean Fisheries Institute 25: 26-33. Jordan CM (1986) Development of the artisanal fisheries in Tobago. In Report of conference on agriculture in
Tobago, Tobago. 5 p. Kebe P (2001) Report of the visit to Trinidad and Tobago: Summary. 16-25 April, 2001. ICCAT Report. COM-
SCRS/01/07, 16-25 p. Kenny JS (1955) Statistics of the Port of Spain wholesale fish market. Journal of the Agricultural Society (June
Issue): 3-8. Kenny JS (1960) Some notes on the standardisation of fishery statistics with an outline of the system used in
Trinidad and Tobago. Fisheries Division, Trinidad. 26 p. Kenny JS and Lagois DE (1961) Availability of fish in Trinidad Waters in 1960. Bulletin No 3, West Indies
Fisheries. 14 p. King-Webster WA (1957) Report on fisheries in Tobago. Fisheries Division, Trinidad. 24 p.

39
King-Webster WA and Rajkumar HO (1958) A preliminary survey of the fisheries of the island of Tobago. Caribbean Commission Central Secretariat. 19 p.
Kishore R (1990) Review of the fishing industry of Charlotteville, Tobago. UWI Biospectrum 2, University of the West Indies. 45-49 p.
Kuruvilla S (2004) Review of studies on the marine fisheries of Trinidad and Tobago and status of the fisheries resources: Phase 1 – An assessment of the fish stock and review of past studies for the domestic fishing industry. Fish and Fish Processing Industry Team of the Standing Committee on Business development (SCBD) of the Government of Trinidad and Tobago. 77 p.
Kuruvilla S and Chan A Shing C (2002) Globalisation, international trade and marine fisheries: Case study of the trawl fishery in Trinidad and Tobago. Fisheries Division, Ministry of Agriculture, Land and Marine Resources, Port of Spain, (Trinidad and Tobago). 27 p.
Kuruvilla S, Ferreira L and Soomai S (2000) The trawl fishery of Trinidad and Tobago. Fisheries Information Series No. 9: 18.
Lopez J (1999) Bycatch utilization in the Americas. In Clucas I and Teutscher F (eds.), Report and Proceedings of FAO/DFID Expert Consultation on Bycatch Utilization in Tropical Fisheries. Beijing, September 1998, Beijing, China. 53-84 p.
Luke SS (1957) Development and Welfare in the West Indies 1957. Advocate C. Ltd. Printery, Bridgetown (Barbados).
Maharaj V (1989) The by-catch in the artisanal shrimp trawl fishery, Gulf of Paria, Trinidad. MSc thesis, The University of Rhode Island, Kingston, (USA). 168 p.
Maharaj V (1993) The By-Catch in the artisanal shrimp trawl fishery, Gulf of Paria, Trinidad. MSc thesis, University of Rhode Island, Rhode Island (USA). 168 p.
Marcano L, Alió J and Altuve DE (1997) National Report on the Shrimp and Groundfish Fisheries of Venezuela. pp. 96-110 In Western Central Atlantic Fishery Commission: National report and selected papers presented at the fourth meeting of the WECAFC Ad Hoc Shrimp and Groundfish Working Group of the Guianas-Brazil Continental Shelf and CFRAMP Shrimp and Groundfish Subproject Specification Workshop. Port of Spain, Trinidad and Tobago. 8-12 January, 1996. FAO Fisheries Report No. 544, Supplement. FAO, Rome.
Marcano L, Alió J and Altuve DE (1999) National Report of Venezuela: Venezuelan Shrimp Fisheries in the Atlantic Margin of Guiana. pp. 85-98 In Western Central Atlantic Fishery Commission: National reports presented and stock assessment reports prepared at the CFRAMP/FAO/DANIDA Stock Assessment Workshop on the Shrimp and Groundfish Fisheries on the Guiana-Brazil Shelf. Port of Spain, Trinidad and Tobago. 7-18 April, 1997. FAO Fisheries Report No. 600. FAO, Rome.
Marcano L, Alió J, Altuve DE and Celaya J (1995) National Report of Venezuela: Venezuelan Shrimp Fisheries in the Atlantic Margin of Guyana. pp. 1-29 In Western Central Atlantic Fishery Commission: National reports and selected papers presented at the Third Workshop on the Biological and Economic Modelling of the Shrimp Resources of the Guyana-Brazil Shelf. Parmaribo, Suriname. 22-25 June, 1992. FAO Fisheries Report No. 526. Supplement. FAO, Rome.
Martín JI (2012) The small-scale coastal fleet in the reform of the common fisheries policy. European Parliament, Brussels, (Belgium). 38 p.
McClure D (1991) Mission report of the project "Establishment of Data Collection Systems and Assessment of Fisheries Resources". (FAO/UNDPLTRI/91/001): 12.
Mendoza JJ and Lárez A (1996) Abundance and distribution of snappers and groupers targeted by the artisanal medium range fishery off northeastern Venezuela (1981 to 1992). pp. 266-276 In Arreguín-Sánchez F, Munro JL, Balgos MC and Pauly D (eds.), Biology, fisheries and culture of tropical groupers and snappers. ICLARM Conference Proceedings 48.
Mike A and Cowx IG (1996) A preliminary appraisal of the contribution of recreational fishing to the fisheries sector in north-west Trinidad. Fisheries Management and Ecology 3: 219-228.
Mohammed E (1996) 1993 - 1994: Reports on the drifting fishery of Tobago. Fisheries Division, Ministry of Agriculture, Land and Marine Resources. 105 p.
Mohammed E (1998) 1994/95 - 1996/97: Reports on the drifting fishery of Tobago (Buccoo and Pigeon Point landing sites). Fisheries Division, Ministry of Agriculture, Land and Marine Resources. 224 p.
Mohammed E (2006) The coastal pelagic fishery in Trinidad and Tobago. Ministry of Agriculture, Land and Marine Resources, Port of Spain, (Trinidad and Tobago). 4 p.
Mohammed E and Chan A Shing C (2003) Trinidad and Tobago: Preliminary reconstructions of fisheries catches and fishing effort, 1908 - 2002. pp. 117-132 In Zeller D, Booth S, Mohammed E and Pauly D (eds.), From Mexico to Brazil: Central Atlantic fisheries catch trends and ecosystem models. Fisheries Centre Research Reports 11 (6). University of British Columbia, Vancouver (Canada).
Oxenford HA, Mahon R and Hunte W (1993) The Eastern Caribbean Flyingfish Project. OECS Fishery Report No. 9. 117 p.

40
Pandohee E (1993) 1987/88 - 1991/92 fishing seasons: Reports on the drifting fishery of Tobago. Fisheries Division, Ministry of Agriculture, Land and Marine Resources. 185 p.
Pandohee E (1994) 1992 - 1993: Reports on the drifting fishery of Tobago. Fisheries Division, Ministry of Agriculture, Land and Marine Resources. 109 p.
Potts A, Gooriesingh K, Mahon R and Rosenberg AA (1988) A fishery data collection system for Tobago. pp. 164-172 In Mahon R and Rosenberg AA (eds.), Fishery data collection systems for eastern Caribbean islands. OECS Fishery Report No. 2.
Ramdeen R, Harper S and Zeller D (2014a) Reconstruction of total marine fisheries catches for Dominica (1950-2010). pp. 33-42 In Zylich K, Zeller D, Ang M and Pauly D (eds.), Fisheries catch reconstructions: Islands, part IV. Fisheries Centre Research Reports 22 (2). University of British Columbia, Vancouver.
Ramdeen R, Harper S, Zylich K and Zeller D (2014b) Reconstruction of total marine fisheries catches for the British Virgin Islands (1950-2010). pp. 9-16 In Zylich K, Zeller D, Ang M and Pauly D (eds.), Fisheries catch reconstructions: Islands, part IV. Fisheries Centre Research Report 22 (2). University of British Columbia, Vancouver.
Ramdeen R, Ponteen A, Harper S and Zeller D (2012) Reconstruction of total marine fisheries catches for Montserrat (1950-2010). pp. 69-76 In Harper S, Zylich K, Boonzaier L, Le Manach F, Pauly D and Zeller D (eds.), Fisheries catch reconstructions: Islands, part III. Fisheries Centre Research Reports 20 (5). University of British Columbia, Vancouver.
Ramdeen R, Zylich K and Zeller D (2014c) Reconstruction of total marine fisheries catches for St. Kitts and Nevis (1950-2010). pp. 129-136 In Zylich K, Zeller D, Ang M and Pauly D (eds.), Fisheries catch reconstructions: Islands, part IV. Fisheries Centre Research Report 22 (2). University of British Columbia, Vancouver.
Ramjohn D (1999) Checklist of coastal and marine fishes of Trinidad and Tobago. Fisheries Information Series No. 8: 151.
Ramsaroop D (1978) Aspects of the fisheries and ecology of Man-o-War Bay, Tobago. The Institute of Marine Affairs, Tobago. 23 p.
Stockdale F (1945) Development and welfare in the West Indies 1943 - 1944. Colonial No. 189, His Majesty's Stationary Office, London (UK). 35-41 p.
Thomas AD, Potts AC, Nichols E and Mukhida F (2000) National report of Trinidad and Tobago – Pelagic and Reef Fisheries. CFRAMP Pelagic Fisheries Assessment Workshop, Caribee Hotel, Barbados, 5 – 7 June, 2000, Department of Marine Resources and Fisheries, Division of Agriculture, Land and Marketing, Tobago, (Trinidad and Tobago). 19 p.
Vidaeus L (1970) An inventory of the Trinidad and Tobago fishing industry. UNDP/FAO Caribbean Fishery Development Project. 75 p.
Vincent H (1910) The sea fish of Trinidad. Press of J.J. Little and Ives Co, New York. 97 p. Weidner DM and Hall DL (1993) Trinidad and Tobago. pp. 155-164 In World fishing fleets: An analysis of distant-
water fleet operations - past - present - future. Volume IV, Latin America4. National Marine Fisheries Service, National Oceanic and Atmospheric Administration, Silver Spring MD, (USA).
Wood HE (1977) Two case histories of successful fisheries development in Trinidad and Tobago. In Higman JB, Williams F and Roedel PM (eds.), Conference on the development of small-scale fisheries in the Caribbean region, November 16-17, 1977, Cartagena, (Colombia). 153-160 p.
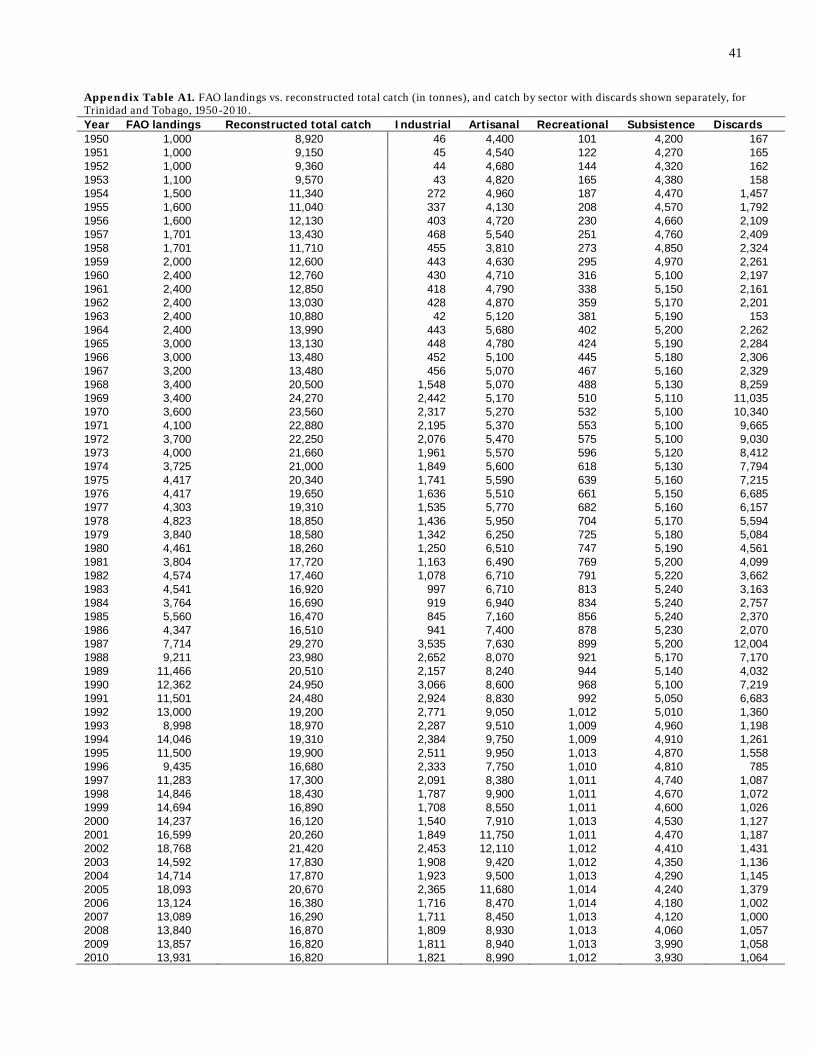
41
Appendix Table A1. FAO landings vs. reconstructed total catch (in tonnes), and catch by sector with discards shown separately, for Trinidad and Tobago, 1950-2010. Year FAO landings Reconstructed total catch Industrial Artisanal Recreational Subsistence Discards 1950 1,000 8,920 46 4,400 101 4,200 167 1951 1,000 9,150 45 4,540 122 4,270 165 1952 1,000 9,360 44 4,680 144 4,320 162 1953 1,100 9,570 43 4,820 165 4,380 158 1954 1,500 11,340 272 4,960 187 4,470 1,457 1955 1,600 11,040 337 4,130 208 4,570 1,792 1956 1,600 12,130 403 4,720 230 4,660 2,109 1957 1,701 13,430 468 5,540 251 4,760 2,409 1958 1,701 11,710 455 3,810 273 4,850 2,324 1959 2,000 12,600 443 4,630 295 4,970 2,261 1960 2,400 12,760 430 4,710 316 5,100 2,197 1961 2,400 12,850 418 4,790 338 5,150 2,161 1962 2,400 13,030 428 4,870 359 5,170 2,201 1963 2,400 10,880 42 5,120 381 5,190 153 1964 2,400 13,990 443 5,680 402 5,200 2,262 1965 3,000 13,130 448 4,780 424 5,190 2,284 1966 3,000 13,480 452 5,100 445 5,180 2,306 1967 3,200 13,480 456 5,070 467 5,160 2,329 1968 3,400 20,500 1,548 5,070 488 5,130 8,259 1969 3,400 24,270 2,442 5,170 510 5,110 11,035 1970 3,600 23,560 2,317 5,270 532 5,100 10,340 1971 4,100 22,880 2,195 5,370 553 5,100 9,665 1972 3,700 22,250 2,076 5,470 575 5,100 9,030 1973 4,000 21,660 1,961 5,570 596 5,120 8,412 1974 3,725 21,000 1,849 5,600 618 5,130 7,794 1975 4,417 20,340 1,741 5,590 639 5,160 7,215 1976 4,417 19,650 1,636 5,510 661 5,150 6,685 1977 4,303 19,310 1,535 5,770 682 5,160 6,157 1978 4,823 18,850 1,436 5,950 704 5,170 5,594 1979 3,840 18,580 1,342 6,250 725 5,180 5,084 1980 4,461 18,260 1,250 6,510 747 5,190 4,561 1981 3,804 17,720 1,163 6,490 769 5,200 4,099 1982 4,574 17,460 1,078 6,710 791 5,220 3,662 1983 4,541 16,920 997 6,710 813 5,240 3,163 1984 3,764 16,690 919 6,940 834 5,240 2,757 1985 5,560 16,470 845 7,160 856 5,240 2,370 1986 4,347 16,510 941 7,400 878 5,230 2,070 1987 7,714 29,270 3,535 7,630 899 5,200 12,004 1988 9,211 23,980 2,652 8,070 921 5,170 7,170 1989 11,466 20,510 2,157 8,240 944 5,140 4,032 1990 12,362 24,950 3,066 8,600 968 5,100 7,219 1991 11,501 24,480 2,924 8,830 992 5,050 6,683 1992 13,000 19,200 2,771 9,050 1,012 5,010 1,360 1993 8,998 18,970 2,287 9,510 1,009 4,960 1,198 1994 14,046 19,310 2,384 9,750 1,009 4,910 1,261 1995 11,500 19,900 2,511 9,950 1,013 4,870 1,558 1996 9,435 16,680 2,333 7,750 1,010 4,810 785 1997 11,283 17,300 2,091 8,380 1,011 4,740 1,087 1998 14,846 18,430 1,787 9,900 1,011 4,670 1,072 1999 14,694 16,890 1,708 8,550 1,011 4,600 1,026 2000 14,237 16,120 1,540 7,910 1,013 4,530 1,127 2001 16,599 20,260 1,849 11,750 1,011 4,470 1,187 2002 18,768 21,420 2,453 12,110 1,012 4,410 1,431 2003 14,592 17,830 1,908 9,420 1,012 4,350 1,136 2004 14,714 17,870 1,923 9,500 1,013 4,290 1,145 2005 18,093 20,670 2,365 11,680 1,014 4,240 1,379 2006 13,124 16,380 1,716 8,470 1,014 4,180 1,002 2007 13,089 16,290 1,711 8,450 1,013 4,120 1,000 2008 13,840 16,870 1,809 8,930 1,013 4,060 1,057 2009 13,857 16,820 1,811 8,940 1,013 3,990 1,058 2010 13,931 16,820 1,821 8,990 1,012 3,930 1,064
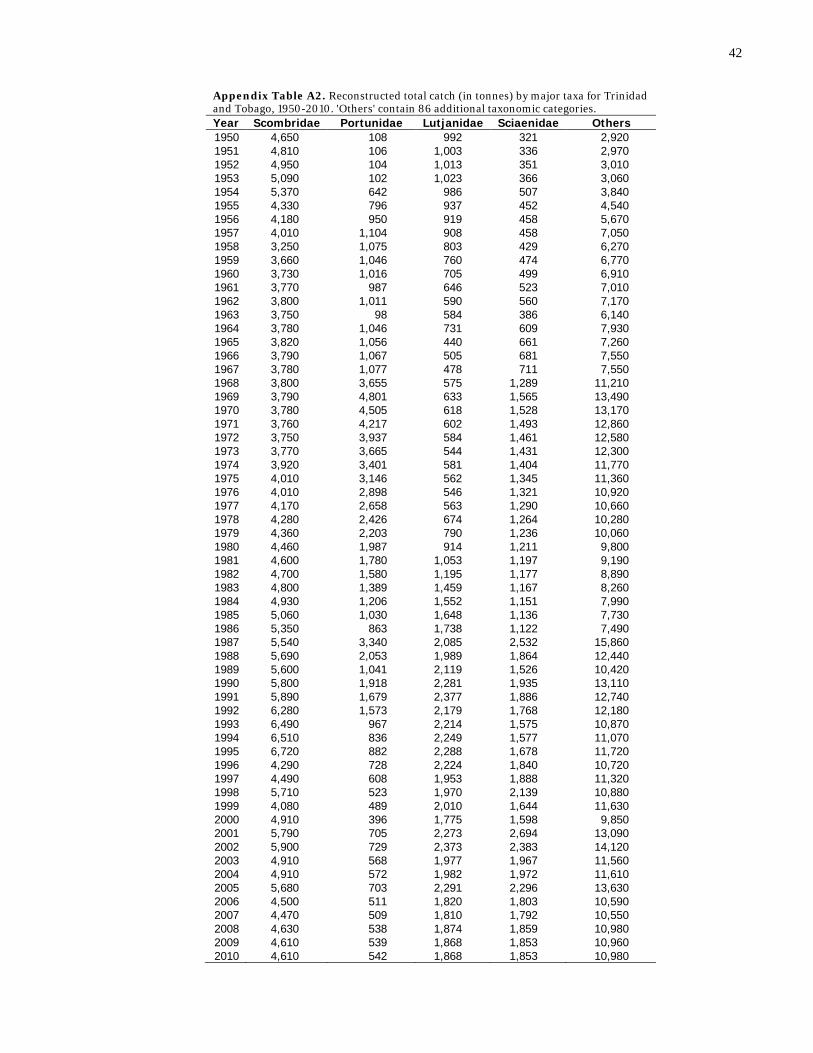
42
Appendix Table A2. Reconstructed total catch (in tonnes) by major taxa for Trinidad and Tobago, 1950-2010. 'Others' contain 86 additional taxonomic categories. Year Scombridae Portunidae Lutjanidae Sciaenidae Others 1950 4,650 108 992 321 2,920 1951 4,810 106 1,003 336 2,970 1952 4,950 104 1,013 351 3,010 1953 5,090 102 1,023 366 3,060 1954 5,370 642 986 507 3,840 1955 4,330 796 937 452 4,540 1956 4,180 950 919 458 5,670 1957 4,010 1,104 908 458 7,050 1958 3,250 1,075 803 429 6,270 1959 3,660 1,046 760 474 6,770 1960 3,730 1,016 705 499 6,910 1961 3,770 987 646 523 7,010 1962 3,800 1,011 590 560 7,170 1963 3,750 98 584 386 6,140 1964 3,780 1,046 731 609 7,930 1965 3,820 1,056 440 661 7,260 1966 3,790 1,067 505 681 7,550 1967 3,780 1,077 478 711 7,550 1968 3,800 3,655 575 1,289 11,210 1969 3,790 4,801 633 1,565 13,490 1970 3,780 4,505 618 1,528 13,170 1971 3,760 4,217 602 1,493 12,860 1972 3,750 3,937 584 1,461 12,580 1973 3,770 3,665 544 1,431 12,300 1974 3,920 3,401 581 1,404 11,770 1975 4,010 3,146 562 1,345 11,360 1976 4,010 2,898 546 1,321 10,920 1977 4,170 2,658 563 1,290 10,660 1978 4,280 2,426 674 1,264 10,280 1979 4,360 2,203 790 1,236 10,060 1980 4,460 1,987 914 1,211 9,800 1981 4,600 1,780 1,053 1,197 9,190 1982 4,700 1,580 1,195 1,177 8,890 1983 4,800 1,389 1,459 1,167 8,260 1984 4,930 1,206 1,552 1,151 7,990 1985 5,060 1,030 1,648 1,136 7,730 1986 5,350 863 1,738 1,122 7,490 1987 5,540 3,340 2,085 2,532 15,860 1988 5,690 2,053 1,989 1,864 12,440 1989 5,600 1,041 2,119 1,526 10,420 1990 5,800 1,918 2,281 1,935 13,110 1991 5,890 1,679 2,377 1,886 12,740 1992 6,280 1,573 2,179 1,768 12,180 1993 6,490 967 2,214 1,575 10,870 1994 6,510 836 2,249 1,577 11,070 1995 6,720 882 2,288 1,678 11,720 1996 4,290 728 2,224 1,840 10,720 1997 4,490 608 1,953 1,888 11,320 1998 5,710 523 1,970 2,139 10,880 1999 4,080 489 2,010 1,644 11,630 2000 4,910 396 1,775 1,598 9,850 2001 5,790 705 2,273 2,694 13,090 2002 5,900 729 2,373 2,383 14,120 2003 4,910 568 1,977 1,967 11,560 2004 4,910 572 1,982 1,972 11,610 2005 5,680 703 2,291 2,296 13,630 2006 4,500 511 1,820 1,803 10,590 2007 4,470 509 1,810 1,792 10,550 2008 4,630 538 1,874 1,859 10,980 2009 4,610 539 1,868 1,853 10,960 2010 4,610 542 1,868 1,853 10,980