fisheries sensitivity maps in british waters - cefas · fishery sensitivity maps in british waters...
TRANSCRIPT


Fishery Sensitivity Maps in British Waters - Introduction
This booklet has been produced by the Fisheries Agencies with support from the United KingdomOffshore Operator’s Association (UKOOA), the Scottish Fishermen’s Federation (SFF) and theNational Federation of Fishermen’s Organisations (NFFO). It has two primary purposes. Firstly,it seeks to provide information to enable all interested parties better to understand the potentialfor interaction between the fishing and offshore oil and gas industries. Secondly, it seeks toencourage meaningful dialogue in order that competing concerns can be addressed and, whereverpossible, dealt with as early as possible in the planning process. It will also aid the newlyintroduced environmental impact assessment process, and will inform seismic, exploration, fielddevelopment and decommissioning activities and the preparation of oil spill response strategies.
The fisheries agencies collect information about the marine environment and the living resourcesit supports in order to advise on regulation and conservation policy. The staff involved in workconnected with the fishing and offshore oil and gas industries are located at centres in Scotlandand England. The Aberdeen Marine Laboratory, formerly part of the Scottish Office Agriculture,Environment and Fisheries Department (SOAEFD) is now a division of Fisheries ResearchServices (FRS), an Executive Agency of The Scottish Office. The Lowestoft and Burnham-on-Crouch Laboratories are now part of the Centre for Environment, Fisheries and AquacultureScience (CEFAS), an Executive Agency of the Ministry of Agriculture Fisheries and Food(MAFF).
The enclosed maps have been compiled from data collected and collated by FRS and CEFAS.This work forms part of comprehensive study programmes financed, respectively, by The ScottishOffice and by MAFF. The data are mapped as reported and describe the sensitivities of the maincommercial species. The booklet contains maps under five headings;
Individual species spawning areas Individual species nursery areasMonthly seismic restriction areasFishing effort mapsRelative value maps The species spawning and nursery area maps are constantly revised in the light of the latestinformation. For some species we have decided not to produce maps. For example, theinformation on monkfish life history is not yet very comprehensive and other species, such asbrown crab, are very locally distributed and exploited. The fishing activity maps are based on theaveraged data for the years 1991-1996. The relative value maps describe 1996 values.
Some readers may have local knowledge of species spawning activity, that might improvesubsequent editions. This information can be passed on to either R Johnstone of FRS, or Dr S IRogers of CEFAS, at the addresses indicated below. Requests for further information may besimilarly forwarded.
In order to identify sensitivities by quadrant, the map of oil and gas activity on page 1 should bephotocopied on to a transparent sheet. It can then be overlaid on the individual maps. Becausecommercial landings data are collected on a coarser scale than applies to oil and gas licenceblocks (see later), the maps are only indicative of potential sensitivities. They should not be readtoo literally and an overly detailed interpretation is not advised.

ii
The following additional sources of information may also be of interest.
UKDMAP. Project Manager, Proudman Oceanographic Laboratory, Bidston Observatory,Birkenhead, Merseyside, L43 7RA.
Knijn, R. J., Boon, T. W., Heessen, H. J. L. & Hislop, J. R. G. 1993 Atlas of North Sea fishes.ICES Cooperative Research Report 194, 268 pp.
Lee, A. J. & Ramster, J. W. 1981 Atlas of the seas around the British Isles. Lowestoft:Ministry of Agriculture, Fisheries and Food, Directorate of Fisheries Research.
The North Sea and Atlantic Marine Oil and Gas Activity and Concession Map. OilfieldPublications Ltd, Po Box 11, Ledbury, Herts, HR8 1BN.
The Energy Report, Published annually with the permission of the Department of Trade andIndustry on behalf of the Controller of Her Majesty’s Stationery Office, PO Box 276, LondonSW8 5DT.
Jennings, S, Alsvag, J., Cotter, A.J., Ehrich, S., Greenstreet, S. P. R., Jarre-Teichmann, A.,Mergardt, N., Rijnsdorp, A. D. And Smedstad, O. (1998). International fishing effort in theNorth Sea: an analysis of temporal and spatial trends. Fisheries Research, in press
For citation purposes this booklet can be referenced as:
Coull, K.A., Johnstone, R., and S.I. Rogers. 1998. Fisheries Sensitivity Maps in British Waters.Published and distributed by UKOOA Ltd.
Further copies are obtainable, free of charge, from the addresses below, or from UKOOA, 9Albyn Terrace, Aberdeen.
The electronic version of this document was created by DC Moore of the EnvironmentalProtection Section of the FRS Marine Laboratory. Please E-mail any comments or suggestionsto [email protected]
FRS CEFASMarine Laboratory Fisheries LaboratoryTorry Pakefield RoadVictoria Road LowestoftAberdeen AB11 8DB Suffolk NR33 0HT

Introduction
Map of UK Offshore Oil and Gas Licensing Areas 1
Individual species spawning maps 2
Mackerel 3Herring 4Cod 5Haddock 6Whiting 7Saithe 8Plaice 9Lemon Sole 10Sole 11Norway Pout 12Blue Whiting 13Sandeels 14Sprat 15Nephrops 16
Table of Spawning Periods for Main Commercial Species 17 Individual species nursery area maps 18
Mackerel 19Herring 20Cod 21Haddock 22Whiting 23Saithe 24Plaice 25Lemon Sole 26Sole 27Norway Pout 28Blue Whiting 29Sandeels 30Sprat 31Nephrops 32
Seismic Sensitivity Periods by Month 33
January 34February 35March 36April 37May 38June 39July 40

August 41September 42October 43November 44December 45
Fishing Effort Maps 46
Demersal Effort 47Pelagic Effort 48Nephrops / Shrimp Effort 49Static Gears 50Beam Trawlers 51All countries, North Sea beam trawl effort 52
Relative Values Maps 53
Demersal Species 54Pelagic Species 55Nephrops and Shrimp 56Shellfish excluding Nephrops / Shrimp 57Overall relative values 58
14 13 12 11 10 9 8 7 6 5 4 3 2 1 0 1 2 3 4 5 6 7 8
49N
50N
51N
52N
53N
54N
55N
56N
57N
58N
59N
60N
61N
62N
D5 D6 D7 D8 D9 E0 E1 E2 E3 E4 E5 E6 E7 E8 E9 F0 F1 F2 F3 F4 F5 F6 F7 F8
53
1
52
51
50
49
48
47
46
45
44
43
42
41
40
39
38
37
36
35
34
33
32
31
30
29
28
27
26
Oil and Gas Activity UK Quadrant / Blocks
217 218 219
213 214 208 209 210 211
204 205 206 207 001 002 003
202 203 005 006 007 008 009166165164163162161160159158
148 149 150 151 152 153 154 155 156 201 011 012 013 014 015 016
022021020019018017 023
025 026 027 028 029 030 031
038037036035034 039
041 042 043 044040
047 048 049 050
052 053 054
056 057
138 139 140 141 142 143 144
128 129 130 131 132 133 134 135
125 126
111 112 113
108 109 110
106 107
102 103 104 105
092091 093 094 095 096 097 098 099 100 058
083082 084 085 086 087 088 089
072 073 074 075
2
Individual species spawning maps.
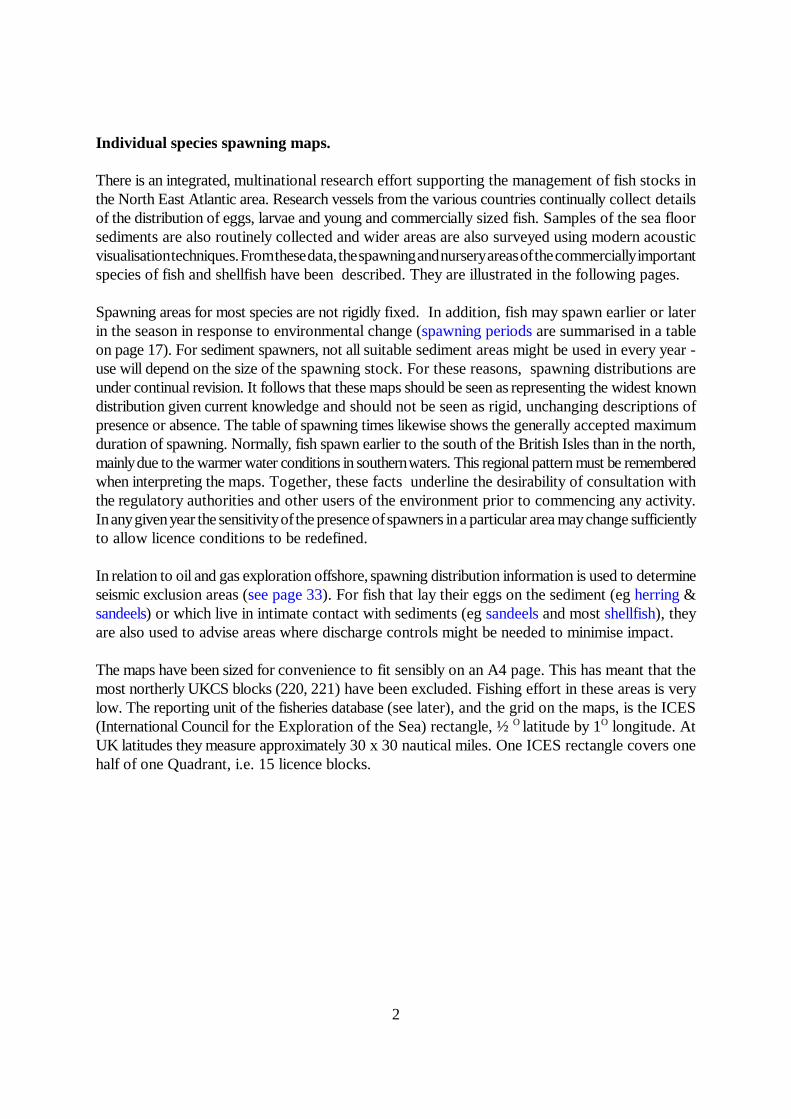
There is an integrated, multinational research effort supporting the management of fish stocks inthe North East Atlantic area. Research vessels from the various countries continually collect detailsof the distribution of eggs, larvae and young and commercially sized fish. Samples of the sea floorsediments are also routinely collected and wider areas are also surveyed using modern acousticvisualisation techniques. From these data, the spawning and nursery areas of the commercially importantspecies of fish and shellfish have been described. They are illustrated in the following pages.
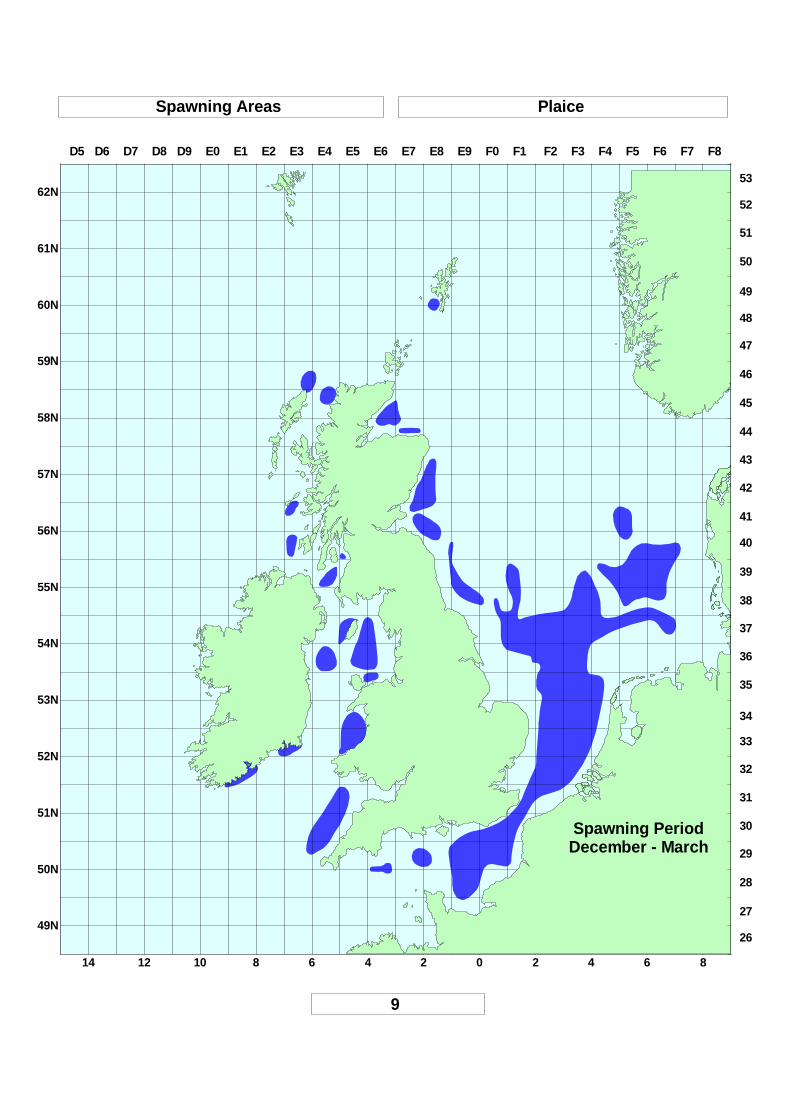
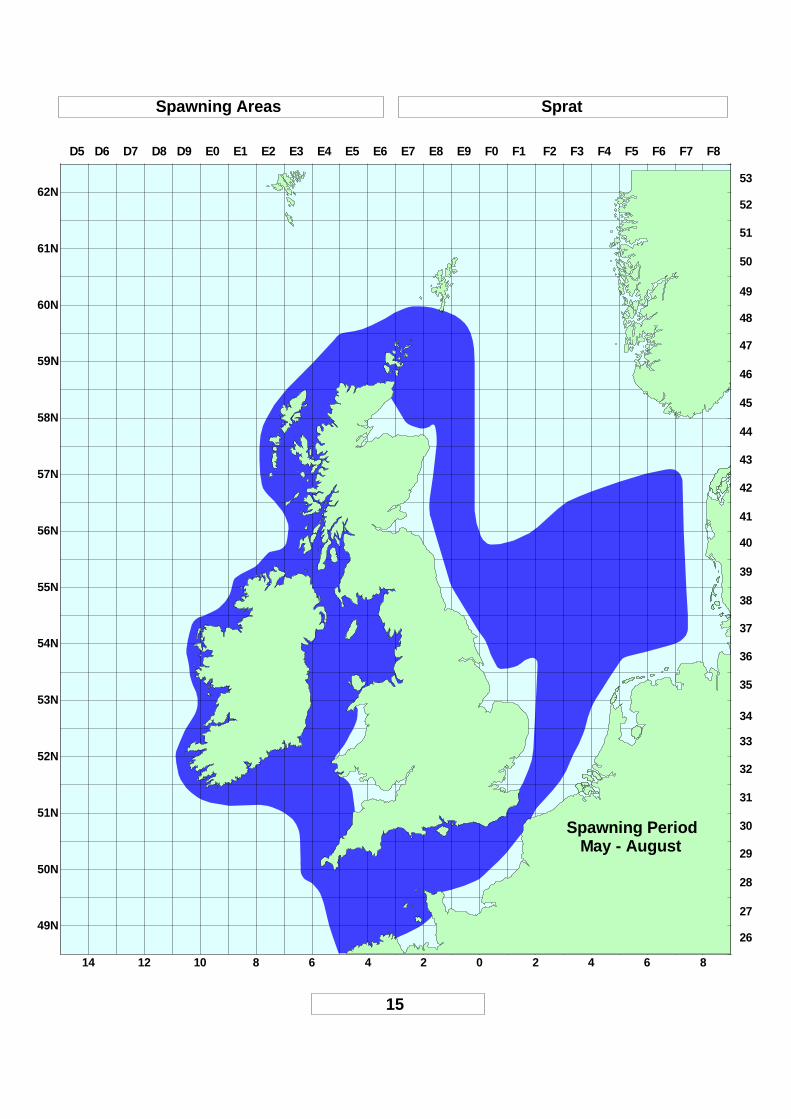
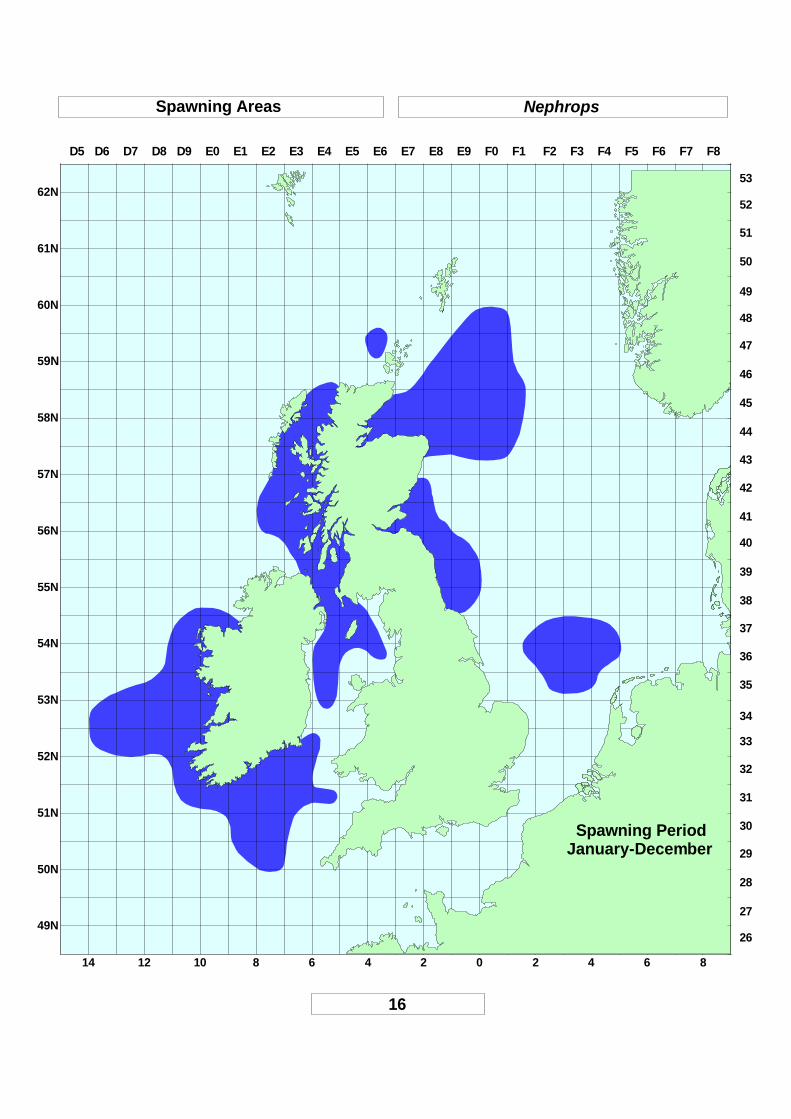
Spawning areas for most species are not rigidly fixed. In addition, fish may spawn earlier or laterin the season in response to environmental change (spawning periods are summarised in a tableon page 17). For sediment spawners, not all suitable sediment areas might be used in every year -use will depend on the size of the spawning stock. For these reasons, spawning distributions areunder continual revision. It follows that these maps should be seen as representing the widest knowndistribution given current knowledge and should not be seen as rigid, unchanging descriptions ofpresence or absence. The table of spawning times likewise shows the generally accepted maximumduration of spawning. Normally, fish spawn earlier to the south of the British Isles than in the north,mainly due to the warmer water conditions in southern waters. This regional pattern must be rememberedwhen interpreting the maps. Together, these facts underline the desirability of consultation withthe regulatory authorities and other users of the environment prior to commencing any activity.In any given year the sensitivity of the presence of spawners in a particular area may change sufficientlyto allow licence conditions to be redefined.
In relation to oil and gas exploration offshore, spawning distribution information is used to determineseismic exclusion areas (see page 33). For fish that lay their eggs on the sediment (eg herring &sandeels) or which live in intimate contact with sediments (eg sandeels and most shellfish), theyare also used to advise areas where discharge controls might be needed to minimise impact.
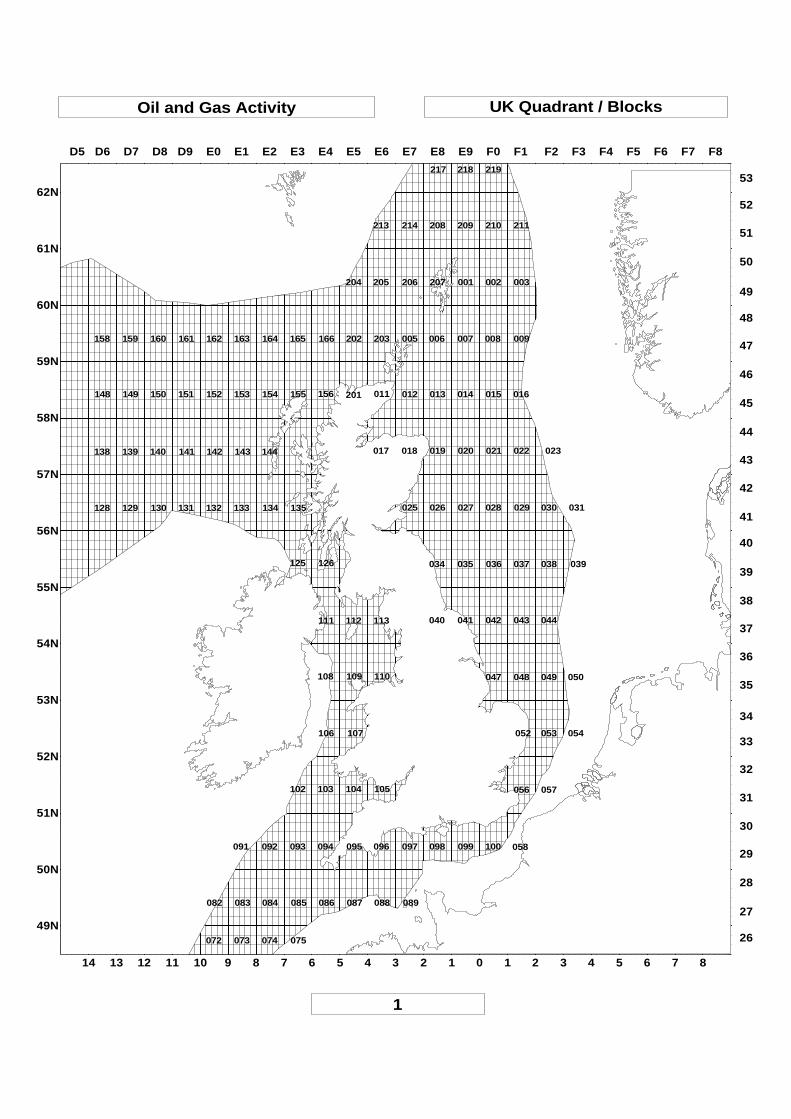
The maps have been sized for convenience to fit sensibly on an A4 page. This has meant that themost northerly UKCS blocks (220, 221) have been excluded. Fishing effort in these areas is verylow. The reporting unit of the fisheries database (see later), and the grid on the maps, is the ICES(International Council for the Exploration of the Sea) rectangle, ½ latitude by 1 longitude. AtO O
UK latitudes they measure approximately 30 x 30 nautical miles. One ICES rectangle covers onehalf of one Quadrant, i.e. 15 licence blocks.

49N
50N
51N
52N
53N
54N
55N
56N
57N
58N
59N
60N
61N
62N
14 12 10 8 6 4 2 0 2 4 6 8
D5 D6 D7 D8 D9 E0 E1 E2 E3 E4 E5 E6 E7 E8 E9 F0 F1 F2 F3 F4 F5 F6 F7 F8
53
3
52
51
50
49
48
47
46
45
44
43
42
41
40
39
38
37
36
35
34
33
32
31
30
29
28
27
26
Spawning Areas Mackerel
Spawning Period March-July (West)May-August (N.Sea)
Higher egg concentrations
14 12 10 8 6 4 2 0 2 4 6 8
49N
50N
51N
52N
53N
54N
55N
56N
57N
58N
59N
60N
61N
62N
D5 D6 D7 D8 D9 E0 E1 E2 E3 E4 E5 E6 E7 E8 E9 F0 F1 F2 F3 F4 F5 F6 F7 F8
53
4
52
51
50
49
48
47
46
45
44
43
42
41
40
39
38
37
36
35
34
33
32
31
30
29
28
27
26
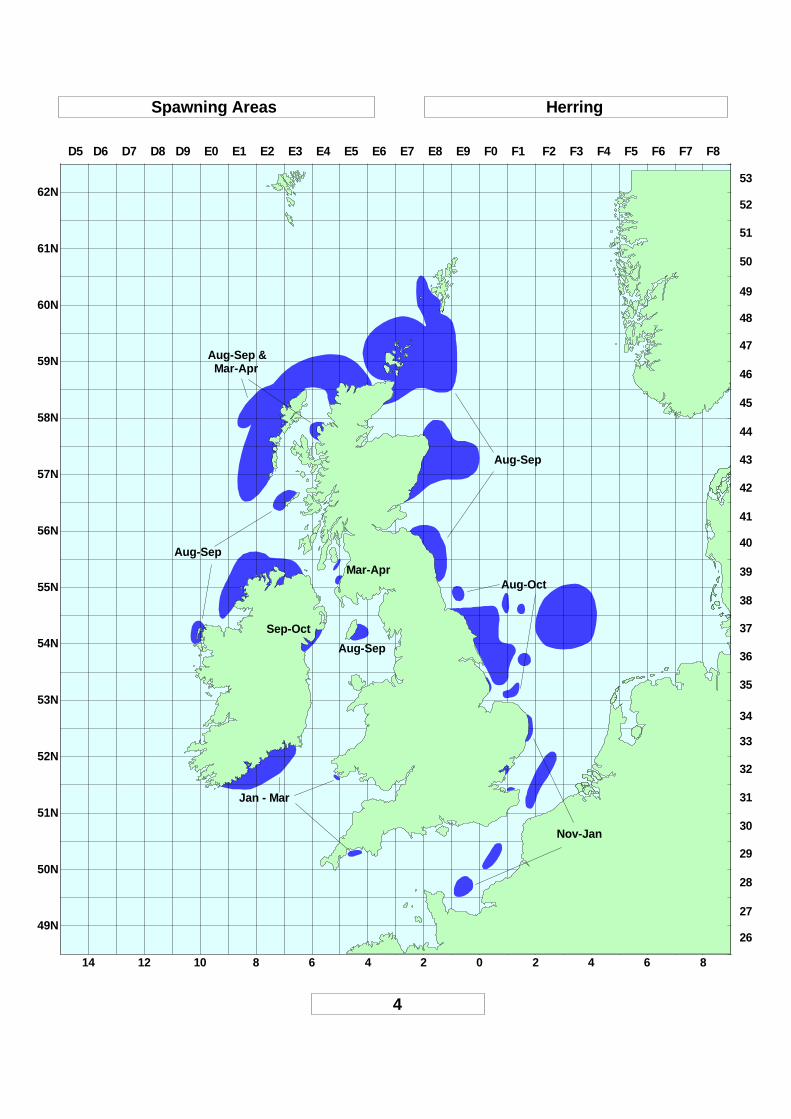
Spawning Areas Herring
Aug-Sep
Aug-Oct
Aug-Sep & Mar-Apr
Aug-Sep
Sep-Oct
Jan - Mar
Aug-Sep
Nov-Jan
Mar-Apr
14 12 10 8 6 4 2 0 2 4 6 8
49N
50N
51N
52N
53N
54N
55N
56N
57N
58N
59N
60N
61N
62N
D5 D6 D7 D8 D9 E0 E1 E2 E3 E4 E5 E6 E7 E8 E9 F0 F1 F2 F3 F4 F5 F6 F7 F8
53
5
52
51
50
49
48
47
46
45
44
43
42
41
40
39
38
37
36
35
34
33
32
31
30
29
28
27
26
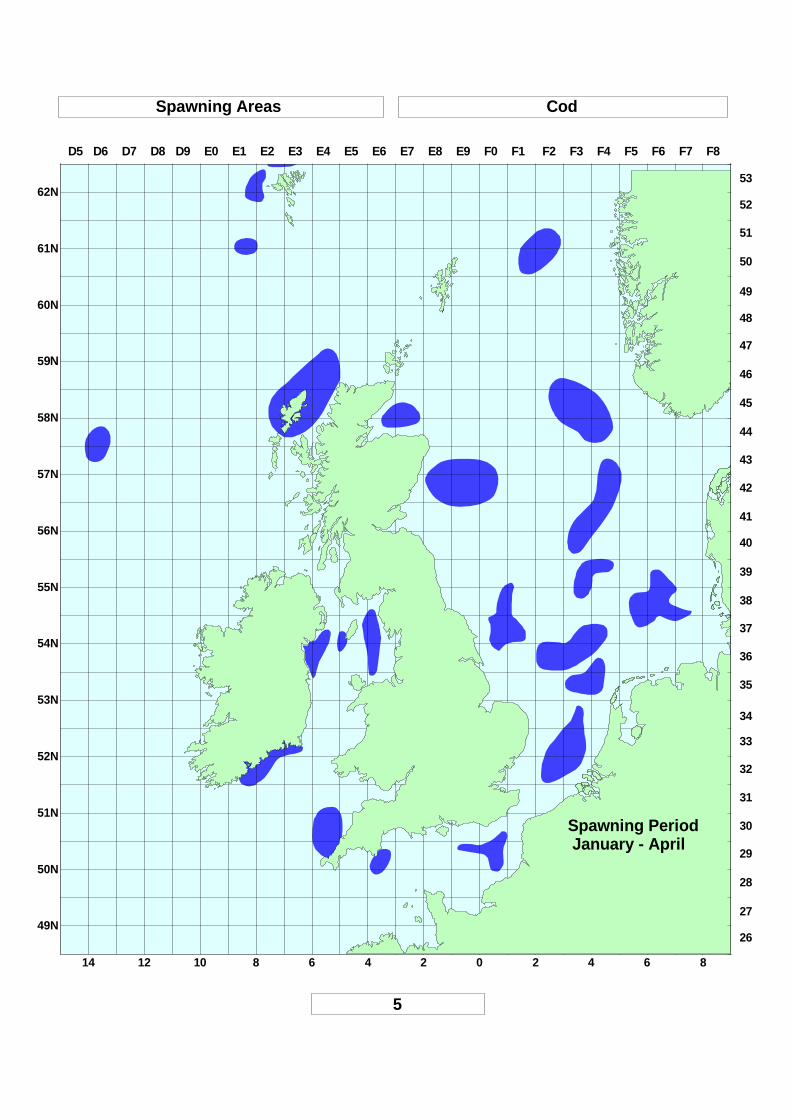
Spawning Areas Cod
Spawning Period January - April

14 12 10 8 6 4 2 0 2 4 6 8
49N
50N
51N
52N
53N
54N
55N
56N
57N
58N
59N
60N
61N
62N
D5 D6 D7 D8 D9 E0 E1 E2 E3 E4 E5 E6 E7 E8 E9 F0 F1 F2 F3 F4 F5 F6 F7 F8
53
6
52
51
50
49
48
47
46
45
44
43
42
41
40
39
38
37
36
35
34
33
32
31
30
29
28
27
26
Spawning Areas Haddock
Spawning Period February - May

14 12 10 8 6 4 2 0 2 4 6 8
49N
50N
51N
52N
53N
54N
55N
56N
57N
58N
59N
60N
61N
62N
D5 D6 D7 D8 D9 E0 E1 E2 E3 E4 E5 E6 E7 E8 E9 F0 F1 F2 F3 F4 F5 F6 F7 F8
53
7
52
51
50
49
48
47
46
45
44
43
42
41
40
39
38
37
36
35
34
33
32
31
30
29
28
27
26
Spawning Areas Whiting
Spawning Period February - June

14 12 10 8 6 4 2 0 2 4 6 8
49N
50N
51N
52N
53N
54N
55N
56N
57N
58N
59N
60N
61N
62N
D5 D6 D7 D8 D9 E0 E1 E2 E3 E4 E5 E6 E7 E8 E9 F0 F1 F2 F3 F4 F5 F6 F7 F8
53
8
52
51
50
49
48
47
46
45
44
43
42
41
40
39
38
37
36
35
34
33
32
31
30
29
28
27
26
Spawning Areas Saithe
Spawning Period January - April
14 12 10 8 6 4 2 0 2 4 6 8
49N
50N
51N
52N
53N
54N
55N
56N
57N
58N
59N
60N
61N
62N
D5 D6 D7 D8 D9 E0 E1 E2 E3 E4 E5 E6 E7 E8 E9 F0 F1 F2 F3 F4 F5 F6 F7 F8
53
9
52
51
50
49
48
47
46
45
44
43
42
41
40
39
38
37
36
35
34
33
32
31
30
29
28
27
26
Spawning Areas Plaice
Spawning PeriodDecember - March

14 12 10 8 6 4 2 0 2 4 6 8
49N
50N
51N
52N
53N
54N
55N
56N
57N
58N
59N
60N
61N
62N
D5 D6 D7 D8 D9 E0 E1 E2 E3 E4 E5 E6 E7 E8 E9 F0 F1 F2 F3 F4 F5 F6 F7 F8
53
10
52
51
50
49
48
47
46
45
44
43
42
41
40
39
38
37
36
35
34
33
32
31
30
29
28
27
26
Spawning Areas Lemon sole
Spawning Period April - September

14 12 10 8 6 4 2 0 2 4 6 8
49N
50N
51N
52N
53N
54N
55N
56N
57N
58N
59N
60N
61N
62N
D5 D6 D7 D8 D9 E0 E1 E2 E3 E4 E5 E6 E7 E8 E9 F0 F1 F2 F3 F4 F5 F6 F7 F8
53
11
52
51
50
49
48
47
46
45
44
43
42
41
40
39
38
37
36
35
34
33
32
31
30
29
28
27
26
Spawning Areas Sole (Solea solea)
Spawning Period March - May

14 12 10 8 6 4 2 0 2 4 6 8
49N
50N
51N
52N
53N
54N
55N
56N
57N
58N
59N
60N
61N
62N
D5 D6 D7 D8 D9 E0 E1 E2 E3 E4 E5 E6 E7 E8 E9 F0 F1 F2 F3 F4 F5 F6 F7 F8
53
12
52
51
50
49
48
47
46
45
44
43
42
41
40
39
38
37
36
35
34
33
32
31
30
29
28
27
26
Spawning Areas Norway pout
Spawning PeriodJanuary_April (Shelf) March-May (Deep)
Higher concentrations

14 12 10 8 6 4 2 0 2 4 6 8
49N
50N
51N
52N
53N
54N
55N
56N
57N
58N
59N
60N
61N
62N
D5 D6 D7 D8 D9 E0 E1 E2 E3 E4 E5 E6 E7 E8 E9 F0 F1 F2 F3 F4 F5 F6 F7 F8
53
13
52
51
50
49
48
47
46
45
44
43
42
41
40
39
38
37
36
35
34
33
32
31
30
29
28
27
26
Spawning Areas Blue whiting
Spawning Period April - June
Higher concentrations

14 12 10 8 6 4 2 0 2 4 6 8
49N
50N
51N
52N
53N
54N
55N
56N
57N
58N
59N
60N
61N
62N
D5 D6 D7 D8 D9 E0 E1 E2 E3 E4 E5 E6 E7 E8 E9 F0 F1 F2 F3 F4 F5 F6 F7 F8
53
14
52
51
50
49
48
47
46
45
44
43
42
41
40
39
38
37
36
35
34
33
32
31
30
29
28
27
26
Spawning Areas Sandeels ( A. marinus )
Spawning PeriodNovember-February
14 12 10 8 6 4 2 0 2 4 6 8
49N
50N
51N
52N
53N
54N
55N
56N
57N
58N
59N
60N
61N
62N
D5 D6 D7 D8 D9 E0 E1 E2 E3 E4 E5 E6 E7 E8 E9 F0 F1 F2 F3 F4 F5 F6 F7 F8
53
15
52
51
50
49
48
47
46
45
44
43
42
41
40
39
38
37
36
35
34
33
32
31
30
29
28
27
26
Spawning Areas Sprat
Spawning Period May - August
14 12 10 8 6 4 2 0 2 4 6 8
49N
50N
51N
52N
53N
54N
55N
56N
57N
58N
59N
60N
61N
62N
D5 D6 D7 D8 D9 E0 E1 E2 E3 E4 E5 E6 E7 E8 E9 F0 F1 F2 F3 F4 F5 F6 F7 F8
53
16
52
51
50
49
48
47
46
45
44
43
42
41
40
39
38
37
36
35
34
33
32
31
30
29
28
27
26
Spawning Areas Nephrops
Spawning PeriodJanuary-December

Spawning Periods For Main Commercial Species
Species Jan Feb Mar Apr May Jun Jul Aug Sep Oct Nov Dec
Cod * *
Haddock * * *
Whiting
Saithe * *
Plaice * *
Norway pout (shelf) * *
Norway pout (deep)
Blue whiting * *
Sprat * *
Lemon sole
Sole *
Mackerel (N Sea) * * *
Mackerel (Western) * *
Herring
(Buchan/Shetland)
( Banks/Dogger )
(SE England)
(SW Ireland)
( NW Scotland)
( Clyde )
( Mourne )
( NW Ireland/ )
Sandeel
Nephrops * * *
Spawning Period
Peak Spawning *
17
18
Individual species nursery maps.
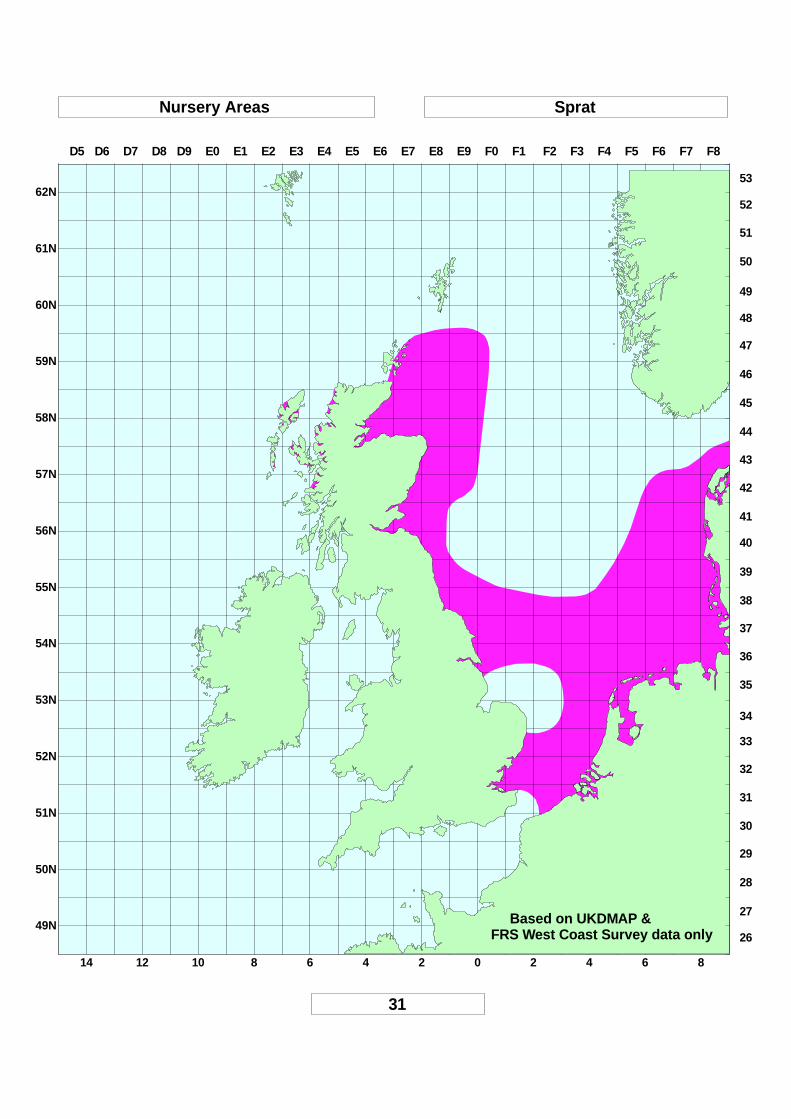
Fish hatch quickly from their eggs and many species remain in the water column as larvae, consumingmicroscopic organisms and gradually developing the body shape and behaviour patterns of adults.At this stage of the life cycle, many species occupy discrete areas, either in the water column oron the seabed, where opportunities for feeding, and for protection from predators are greatest.These are nursery areas. For example, juvenile flatfish will tend to converge on shallow coastalwaters and feed on the abundant worms and crustaceans in these productive areas. Other fish,such as juvenile cod, can occupy coastal reef environments as well as deeper offshore regions.Juvenile fish can often be found in nursery areas together with slightly older individuals, and occasionallyadults, and the prevailing water temperature and availability of food can also alter the position ofthese nursery grounds from year to year. As a result of these factors it is difficult precisely to definethe limits of nurseries.
The following charts are intended as an indication of the likely positions of juvenile concentrationsaround the UK coast, rather than a definitive description of the limits of all nursery grounds.

14 12 10 8 6 4 2 0 2 4 6 8
49N
50N
51N
52N
53N
54N
55N
56N
57N
58N
59N
60N
61N
62N
D5 D6 D7 D8 D9 E0 E1 E2 E3 E4 E5 E6 E7 E8 E9 F0 F1 F2 F3 F4 F5 F6 F7 F8
53
19
52
51
50
49
48
47
46
45
44
43
42
41
40
39
38
37
36
35
34
33
32
31
30
29
28
27
26
Nursery Areas Mackerel

14 12 10 8 6 4 2 0 2 4 6 8
49N
50N
51N
52N
53N
54N
55N
56N
57N
58N
59N
60N
61N
62N
D5 D6 D7 D8 D9 E0 E1 E2 E3 E4 E5 E6 E7 E8 E9 F0 F1 F2 F3 F4 F5 F6 F7 F8
53
20
52
51
50
49
48
47
46
45
44
43
42
41
40
39
38
37
36
35
34
33
32
31
30
29
28
27
26
Nursery Areas Herring

14 12 10 8 6 4 2 0 2 4 6 8
49N
50N
51N
52N
53N
54N
55N
56N
57N
58N
59N
60N
61N
62N
D5 D6 D7 D8 D9 E0 E1 E2 E3 E4 E5 E6 E7 E8 E9 F0 F1 F2 F3 F4 F5 F6 F7 F8
53
21
52
51
50
49
48
47
46
45
44
43
42
41
40
39
38
37
36
35
34
33
32
31
30
29
28
27
26
Nursery Areas Cod

14 12 10 8 6 4 2 0 2 4 6 8
49N
50N
51N
52N
53N
54N
55N
56N
57N
58N
59N
60N
61N
62N
D5 D6 D7 D8 D9 E0 E1 E2 E3 E4 E5 E6 E7 E8 E9 F0 F1 F2 F3 F4 F5 F6 F7 F8
53
22
52
51
50
49
48
47
46
45
44
43
42
41
40
39
38
37
36
35
34
33
32
31
30
29
28
27
26
Nursery Areas Haddock

14 12 10 8 6 4 2 0 2 4 6 8
49N
50N
51N
52N
53N
54N
55N
56N
57N
58N
59N
60N
61N
62N
D5 D6 D7 D8 D9 E0 E1 E2 E3 E4 E5 E6 E7 E8 E9 F0 F1 F2 F3 F4 F5 F6 F7 F8
53
23
52
51
50
49
48
47
46
45
44
43
42
41
40
39
38
37
36
35
34
33
32
31
30
29
28
27
26
Nursery Areas Whiting

14 12 10 8 6 4 2 0 2 4 6 8
49N
50N
51N
52N
53N
54N
55N
56N
57N
58N
59N
60N
61N
62N
D5 D6 D7 D8 D9 E0 E1 E2 E3 E4 E5 E6 E7 E8 E9 F0 F1 F2 F3 F4 F5 F6 F7 F8
53
24
52
51
50
49
48
47
46
45
44
43
42
41
40
39
38
37
36
35
34
33
32
31
30
29
28
27
26
Nursery Areas Saithe

14 12 10 8 6 4 2 0 2 4 6 8
49N
50N
51N
52N
53N
54N
55N
56N
57N
58N
59N
60N
61N
62N
D5 D6 D7 D8 D9 E0 E1 E2 E3 E4 E5 E6 E7 E8 E9 F0 F1 F2 F3 F4 F5 F6 F7 F8
53
25
52
51
50
49
48
47
46
45
44
43
42
41
40
39
38
37
36
35
34
33
32
31
30
29
28
27
26
Nursery Areas Plaice

14 12 10 8 6 4 2 0 2 4 6 8
49N
50N
51N
52N
53N
54N
55N
56N
57N
58N
59N
60N
61N
62N
D5 D6 D7 D8 D9 E0 E1 E2 E3 E4 E5 E6 E7 E8 E9 F0 F1 F2 F3 F4 F5 F6 F7 F8
53
26
52
51
50
49
48
47
46
45
44
43
42
41
40
39
38
37
36
35
34
33
32
31
30
29
28
27
26
Nursery Areas Lemon sole

14 12 10 8 6 4 2 0 2 4 6 8
49N
50N
51N
52N
53N
54N
55N
56N
57N
58N
59N
60N
61N
62N
D5 D6 D7 D8 D9 E0 E1 E2 E3 E4 E5 E6 E7 E8 E9 F0 F1 F2 F3 F4 F5 F6 F7 F8
53
27
52
51
50
49
48
47
46
45
44
43
42
41
40
39
38
37
36
35
34
33
32
31
30
29
28
27
26
Nursery Areas Sole ( Solea solea )

14 12 10 8 6 4 2 0 2 4 6 8
49N
50N
51N
52N
53N
54N
55N
56N
57N
58N
59N
60N
61N
62N
D5 D6 D7 D8 D9 E0 E1 E2 E3 E4 E5 E6 E7 E8 E9 F0 F1 F2 F3 F4 F5 F6 F7 F8
53
28
52
51
50
49
48
47
46
45
44
43
42
41
40
39
38
37
36
35
34
33
32
31
30
29
28
27
26
Nursery Areas Norway pout

14 12 10 8 6 4 2 0 2 4 6 8
49N
50N
51N
52N
53N
54N
55N
56N
57N
58N
59N
60N
61N
62N
D5 D6 D7 D8 D9 E0 E1 E2 E3 E4 E5 E6 E7 E8 E9 F0 F1 F2 F3 F4 F5 F6 F7 F8
53
29
52
51
50
49
48
47
46
45
44
43
42
41
40
39
38
37
36
35
34
33
32
31
30
29
28
27
26
Nursery Areas Blue whiting

14 12 10 8 6 4 2 0 2 4 6 8
49N
50N
51N
52N
53N
54N
55N
56N
57N
58N
59N
60N
61N
62N
D5 D6 D7 D8 D9 E0 E1 E2 E3 E4 E5 E6 E7 E8 E9 F0 F1 F2 F3 F4 F5 F6 F7 F8
53
30
52
51
50
49
48
47
46
45
44
43
42
41
40
39
38
37
36
35
34
33
32
31
30
29
28
27
26
Nursery Areas Sandeel ( A. marinus )
14 12 10 8 6 4 2 0 2 4 6 8
49N
50N
51N
52N
53N
54N
55N
56N
57N
58N
59N
60N
61N
62N
D5 D6 D7 D8 D9 E0 E1 E2 E3 E4 E5 E6 E7 E8 E9 F0 F1 F2 F3 F4 F5 F6 F7 F8
53
31
52
51
50
49
48
47
46
45
44
43
42
41
40
39
38
37
36
35
34
33
32
31
30
29
28
27
26
Nursery Areas Sprat
Based on UKDMAP & FRS West Coast Survey data only

14 12 10 8 6 4 2 0 2 4 6 8
49N
50N
51N
52N
53N
54N
55N
56N
57N
58N
59N
60N
61N
62N
D5 D6 D7 D8 D9 E0 E1 E2 E3 E4 E5 E6 E7 E8 E9 F0 F1 F2 F3 F4 F5 F6 F7 F8
53
32
52
51
50
49
48
47
46
45
44
43
42
41
40
39
38
37
36
35
34
33
32
31
30
29
28
27
26
Nursery Areas Nephrops

33
Seismic sensitivity periods.
In the sea, fish hear sounds from ships and towed gears long before they see them but tend onlyto avoid them at close range. In seismic surveys, exceptionally loud and repeated ‘bangs’ are addedto the towing ship's sounds and even at several hundred metres range will create an uncomfortablesound stimulus. In some circumstances seismic surveys have been observed to cause fish to moveaway from and avoid the survey area. There are two concerns of seismic surveys from a fisheriesstandpoint.
Firstly, marine fish tend to migrate to particular areas to spawn and these chosen areas may haveattributes that contribute to successful spawning. It is therefore considered reasonable to avoidseismic survey disturbance in identified spawning areas at times when it is known that spawningregularly takes place.
Secondly, seismic cables, sometimes comprising many synchronised air guns, are towed just belowthe sea surface. This is the zone where the eggs and larval stages of many fish species drift whilethey hatch and grow. Cables are towed at speeds of ca 3 metres per second (6 knots) and gunsare fired frequently (10-20 seconds). The smaller larval fish and eggs, unlike adult stages, are unableto move aside from the track of the ship and at each explosion of the guns, those within 2 metresor so of each gun, will be unavoidably damaged. Studies show that at this range the very intensepressure impulse released by the air gun can cause internal rupture of tissues leading to bleedingand death. Each detonation of the multiple gun arrays may therefore kill a fresh sample of eggsand larvae and the accumulated effect where these are more densely concentrated in a breedingarea may have stock consequences.
All fish will hear and may choose to avoid seismic sound. Most fish are additionally sensitive becausethey contain an internal air bladder, the swim bladder, which aids their buoyancy. Mackerel, flatfish,rays and sharks do not contain air bladders and are not thought to be as sensitive as other fishes.Shellfish also do not contain air bladders and commonly live on or in the sea bed. For the mostpart therefore, they too are not thought to be adversely affected by seismic surveys.
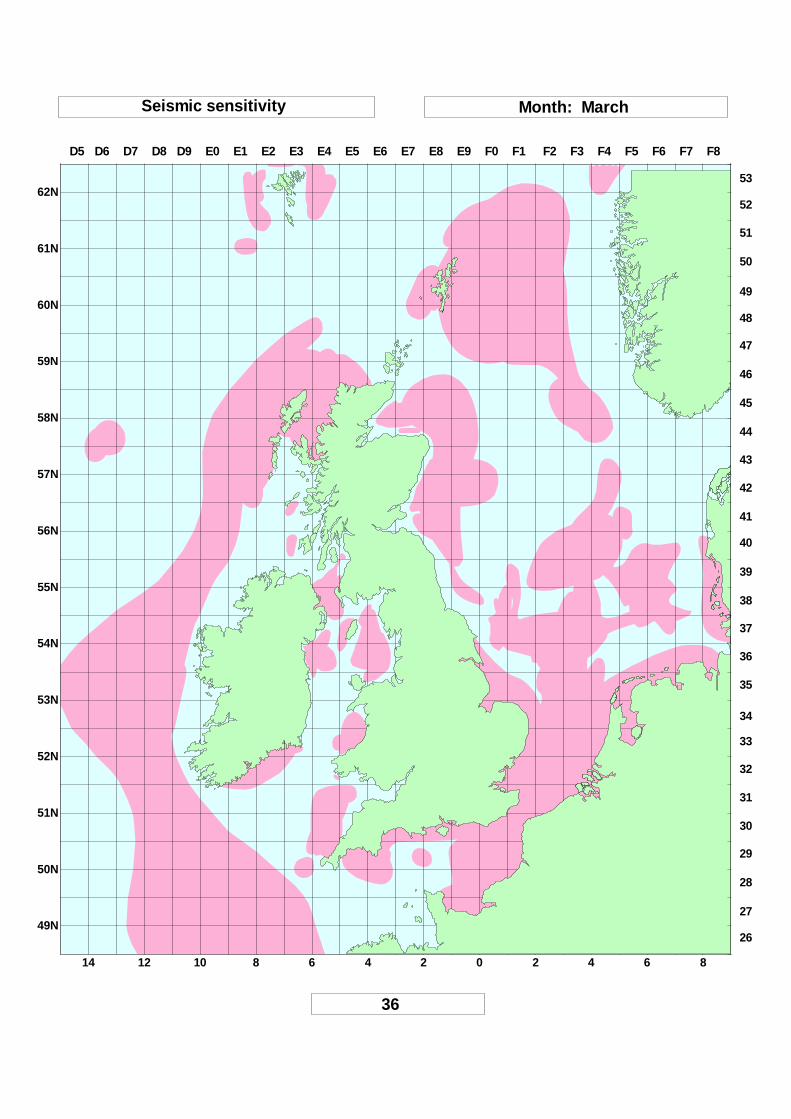
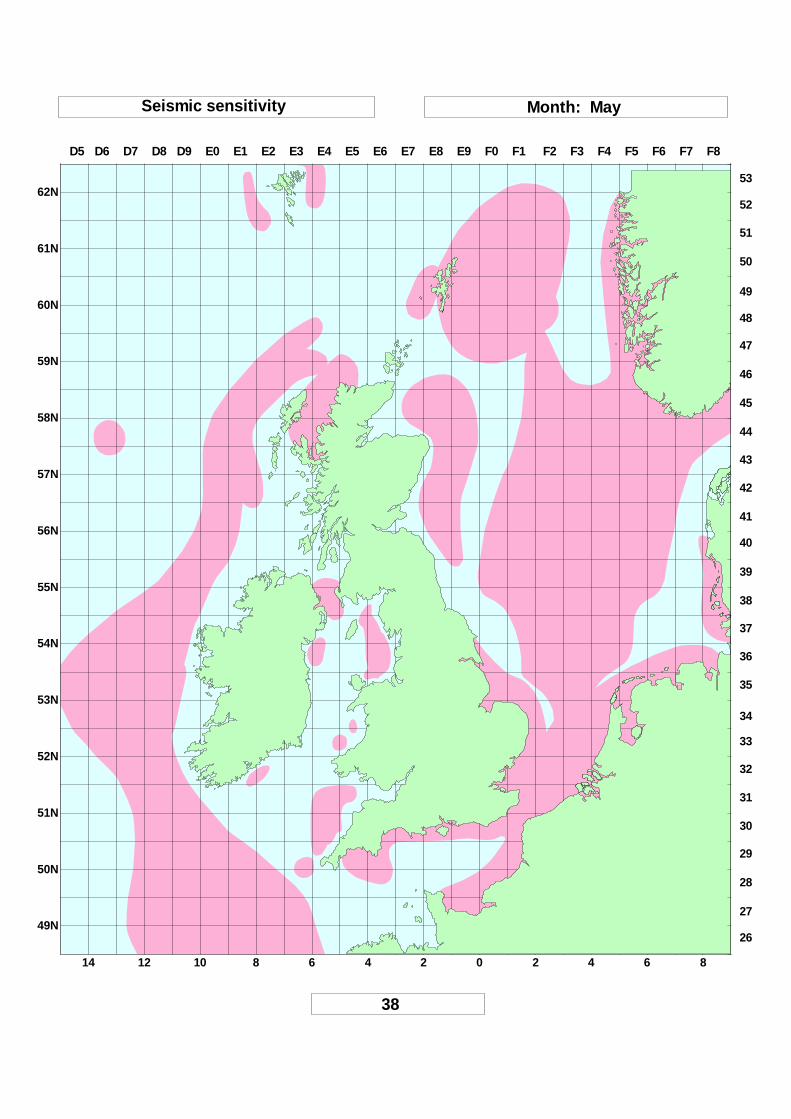
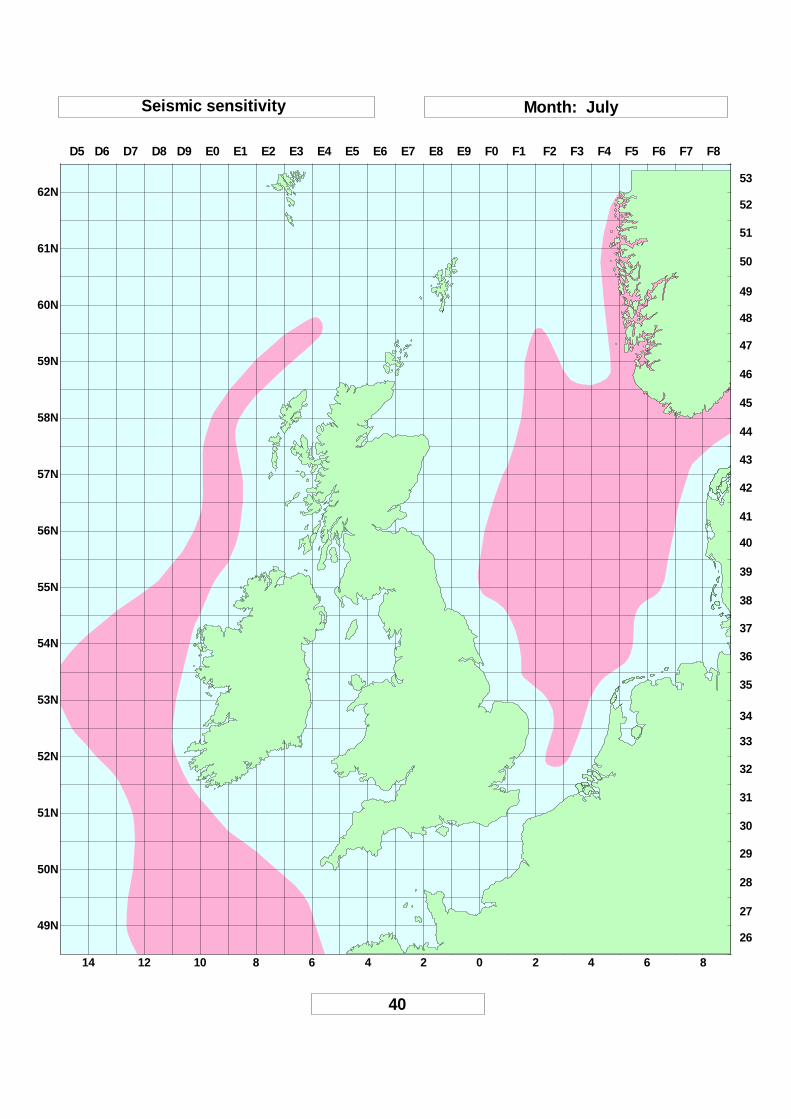
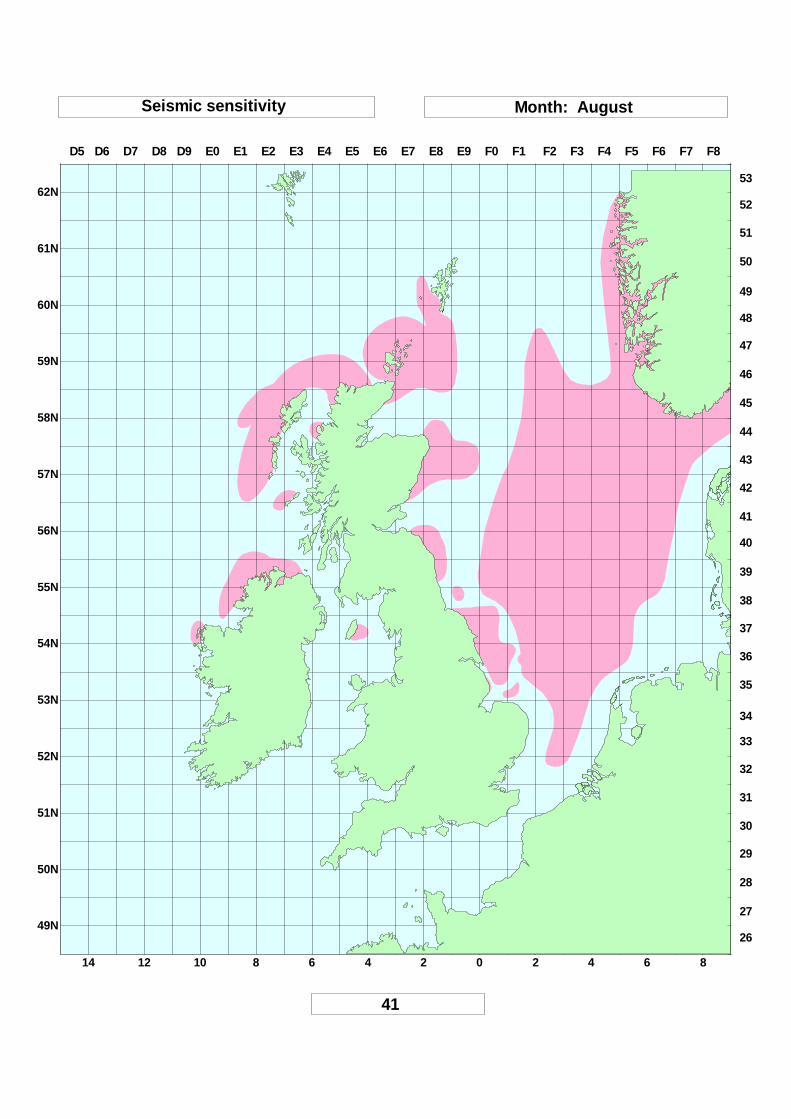
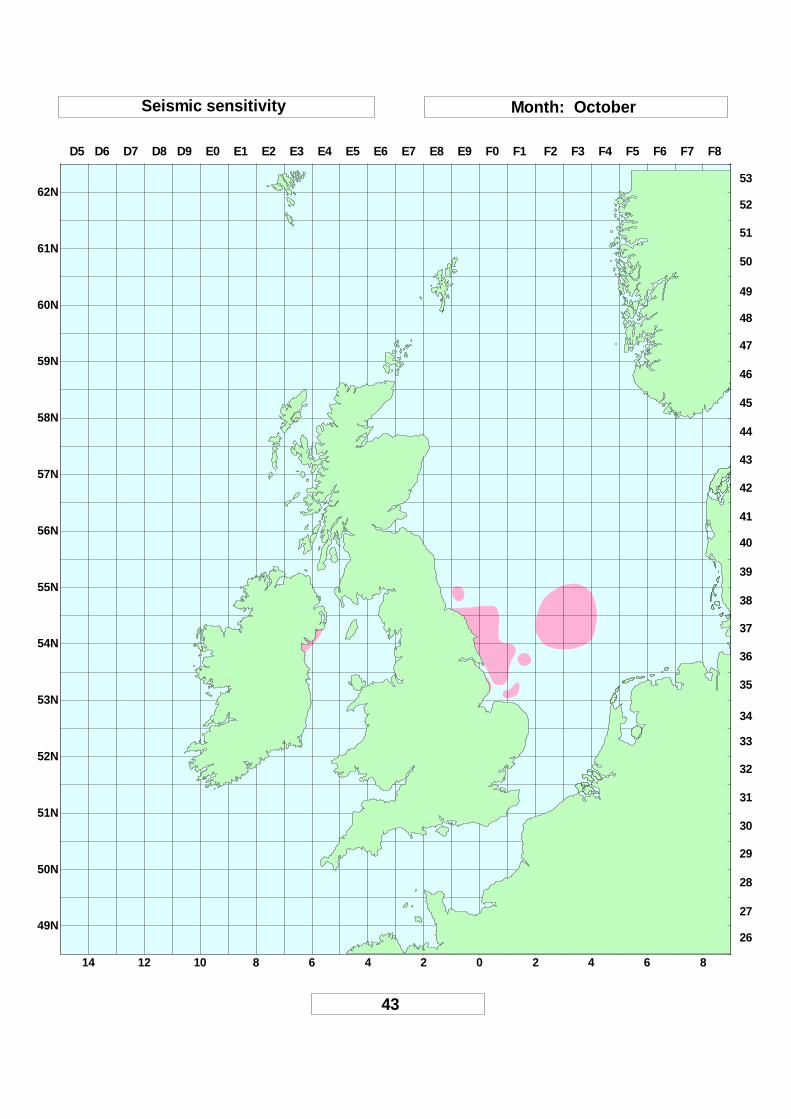
As a precautionary measure, regulators set exclusion windows to minimise seismic disturbanceto individual species at or around the peak times and locations of spawning activity. A knowledgeof sensitive spawning periods by block and by month will enable operators to plan their activitiesmore efficiently. The accompanying monthly maps have been derived by simple area addition fromthe individual species maps shown earlier. There is less concern for species with very wide spawningdistributions (eg pout, blue whiting, sprat and lemon sole) and they are not included in the restrictionmaps. Where exclusion windows cause exceptional operational difficulty there may be room forfine tuning and operators in this position should talk to the regulator or to fisheries advisors.
Many fishermen have traditional fishing grounds and local fishermen should always be consultedabout seismic survey activity in order to explore possible operational and commercial sensitivities.The possibility of interaction with static gears is likely to be most important (see effort map onpage 50). In addition, prior and timely consultation will allow commercial concerns related to thescaring away of nomadic and migratory fish to be properly discussed.

14 12 10 8 6 4 2 0 2 4 6 8
49N
50N
51N
52N
53N
54N
55N
56N
57N
58N
59N
60N
61N
62N
D5 D6 D7 D8 D9 E0 E1 E2 E3 E4 E5 E6 E7 E8 E9 F0 F1 F2 F3 F4 F5 F6 F7 F8
53
34
52
51
50
49
48
47
46
45
44
43
42
41
40
39
38
37
36
35
34
33
32
31
30
29
28
27
26
Seismic sensitivity Month: January

14 12 10 8 6 4 2 0 2 4 6 8
49N
50N
51N
52N
53N
54N
55N
56N
57N
58N
59N
60N
61N
62N
D5 D6 D7 D8 D9 E0 E1 E2 E3 E4 E5 E6 E7 E8 E9 F0 F1 F2 F3 F4 F5 F6 F7 F8
53
35
52
51
50
49
48
47
46
45
44
43
42
41
40
39
38
37
36
35
34
33
32
31
30
29
28
27
26
Seismic sensitivity Month: February
14 12 10 8 6 4 2 0 2 4 6 8
49N
50N
51N
52N
53N
54N
55N
56N
57N
58N
59N
60N
61N
62N
D5 D6 D7 D8 D9 E0 E1 E2 E3 E4 E5 E6 E7 E8 E9 F0 F1 F2 F3 F4 F5 F6 F7 F8
53
36
52
51
50
49
48
47
46
45
44
43
42
41
40
39
38
37
36
35
34
33
32
31
30
29
28
27
26
Seismic sensitivity Month: March

14 12 10 8 6 4 2 0 2 4 6 8
49N
50N
51N
52N
53N
54N
55N
56N
57N
58N
59N
60N
61N
62N
D5 D6 D7 D8 D9 E0 E1 E2 E3 E4 E5 E6 E7 E8 E9 F0 F1 F2 F3 F4 F5 F6 F7 F8
53
37
52
51
50
49
48
47
46
45
44
43
42
41
40
39
38
37
36
35
34
33
32
31
30
29
28
27
26
Seismic sensitivity Month: April
14 12 10 8 6 4 2 0 2 4 6 8
49N
50N
51N
52N
53N
54N
55N
56N
57N
58N
59N
60N
61N
62N
D5 D6 D7 D8 D9 E0 E1 E2 E3 E4 E5 E6 E7 E8 E9 F0 F1 F2 F3 F4 F5 F6 F7 F8
53
38
52
51
50
49
48
47
46
45
44
43
42
41
40
39
38
37
36
35
34
33
32
31
30
29
28
27
26
Seismic sensitivity Month: May

14 12 10 8 6 4 2 0 2 4 6 8
49N
50N
51N
52N
53N
54N
55N
56N
57N
58N
59N
60N
61N
62N
D5 D6 D7 D8 D9 E0 E1 E2 E3 E4 E5 E6 E7 E8 E9 F0 F1 F2 F3 F4 F5 F6 F7 F8
53
39
52
51
50
49
48
47
46
45
44
43
42
41
40
39
38
37
36
35
34
33
32
31
30
29
28
27
26
Seismic sensitivity Month: June
14 12 10 8 6 4 2 0 2 4 6 8
49N
50N
51N
52N
53N
54N
55N
56N
57N
58N
59N
60N
61N
62N
D5 D6 D7 D8 D9 E0 E1 E2 E3 E4 E5 E6 E7 E8 E9 F0 F1 F2 F3 F4 F5 F6 F7 F8
53
40
52
51
50
49
48
47
46
45
44
43
42
41
40
39
38
37
36
35
34
33
32
31
30
29
28
27
26
Seismic sensitivity Month: July
14 12 10 8 6 4 2 0 2 4 6 8
49N
50N
51N
52N
53N
54N
55N
56N
57N
58N
59N
60N
61N
62N
D5 D6 D7 D8 D9 E0 E1 E2 E3 E4 E5 E6 E7 E8 E9 F0 F1 F2 F3 F4 F5 F6 F7 F8
53
41
52
51
50
49
48
47
46
45
44
43
42
41
40
39
38
37
36
35
34
33
32
31
30
29
28
27
26
Seismic sensitivity Month: August

14 12 10 8 6 4 2 0 2 4 6 8
49N
50N
51N
52N
53N
54N
55N
56N
57N
58N
59N
60N
61N
62N
D5 D6 D7 D8 D9 E0 E1 E2 E3 E4 E5 E6 E7 E8 E9 F0 F1 F2 F3 F4 F5 F6 F7 F8
53
42
52
51
50
49
48
47
46
45
44
43
42
41
40
39
38
37
36
35
34
33
32
31
30
29
28
27
26
Seismic sensitivity Month: September
14 12 10 8 6 4 2 0 2 4 6 8
49N
50N
51N
52N
53N
54N
55N
56N
57N
58N
59N
60N
61N
62N
D5 D6 D7 D8 D9 E0 E1 E2 E3 E4 E5 E6 E7 E8 E9 F0 F1 F2 F3 F4 F5 F6 F7 F8
53
43
52
51
50
49
48
47
46
45
44
43
42
41
40
39
38
37
36
35
34
33
32
31
30
29
28
27
26
Seismic sensitivity Month: October

14 12 10 8 6 4 2 0 2 4 6 8
49N
50N
51N
52N
53N
54N
55N
56N
57N
58N
59N
60N
61N
62N
D5 D6 D7 D8 D9 E0 E1 E2 E3 E4 E5 E6 E7 E8 E9 F0 F1 F2 F3 F4 F5 F6 F7 F8
53
44
52
51
50
49
48
47
46
45
44
43
42
41
40
39
38
37
36
35
34
33
32
31
30
29
28
27
26
Seismic sensitivity Month: November

14 12 10 8 6 4 2 0 2 4 6 8
49N
50N
51N
52N
53N
54N
55N
56N
57N
58N
59N
60N
61N
62N
D5 D6 D7 D8 D9 E0 E1 E2 E3 E4 E5 E6 E7 E8 E9 F0 F1 F2 F3 F4 F5 F6 F7 F8
53
45
52
51
50
49
48
47
46
45
44
43
42
41
40
39
38
37
36
35
34
33
32
31
30
29
28
27
26
Seismic sensitivity Month: December

46
Effort Maps
UK fishermen are obliged when they land their catches to market to report the quantities of specieslanded, where they were caught, and what method (which gear / duration of fishing ) they usedto capture them. Data are linked to the first sales value of the catch by Fisheries Officers in eachport throughout the UK and are then passed to the Fisheries Agencies and entered into a database.
For the purposes of this booklet effort is considered to be time spent fishing, i.e. what is sometimesdefined as nominal fishing effort. Clearly the efficiency (catch per unit of effort) of boats of differentsizes varies considerably and this must be borne in mind when viewing the maps. Small boats, i.e.those < 10 m length which commonly operate close to shore, do not need to report their returns.The effort and overall sensitivity in these areas is thus considerably under represented by the presentmaps.
The reporting unit of the fisheries database is the ICES (International Council for the Explorationof the Sea) rectangle and covers 15 licence blocks. It is therefore quite coarse. In the North Seawhere most rectangles are actively exploited most of the time, this coarseness matters little in mappingterms. In the maps, the effort in most rectangles is assumed to have been centrally located. Oneway of plotting the effort would have been to colour individual squares differently according totheir effort value. But this would have resulted in areas with hard edges and clearly effort changesgradually between areas. Instead, contoured maps are presented, and a smoothing function hasbeen used to decide, in comparison with adjacent scores, where the boundary line should be drawn.Although this is more realistic it has the consequence in some areas of reducing the area assignedto the highest effort. This illustrates that these maps, like the others in this series, are merely indicativeof the real situation - discussion with local groups will be necessary to tease out detailed concerns.In some areas, e.g. west of Shetland where individual ICES rectangles have both very deep andmuch shallower water, allocation of the effort to the centre of the square would be inappropriate.In these squares the effort has been more accurately located, in most cases to the shallower waterarea. This allows the deep water effort, which is currently low, to be delineated by block from theshallow water effort. The deep water effort, however, is increasing rapidly as fishermen use biggerboats pulling heavier gears to exploit non-quota, deeper water species. Operators will wish to planaccordingly.
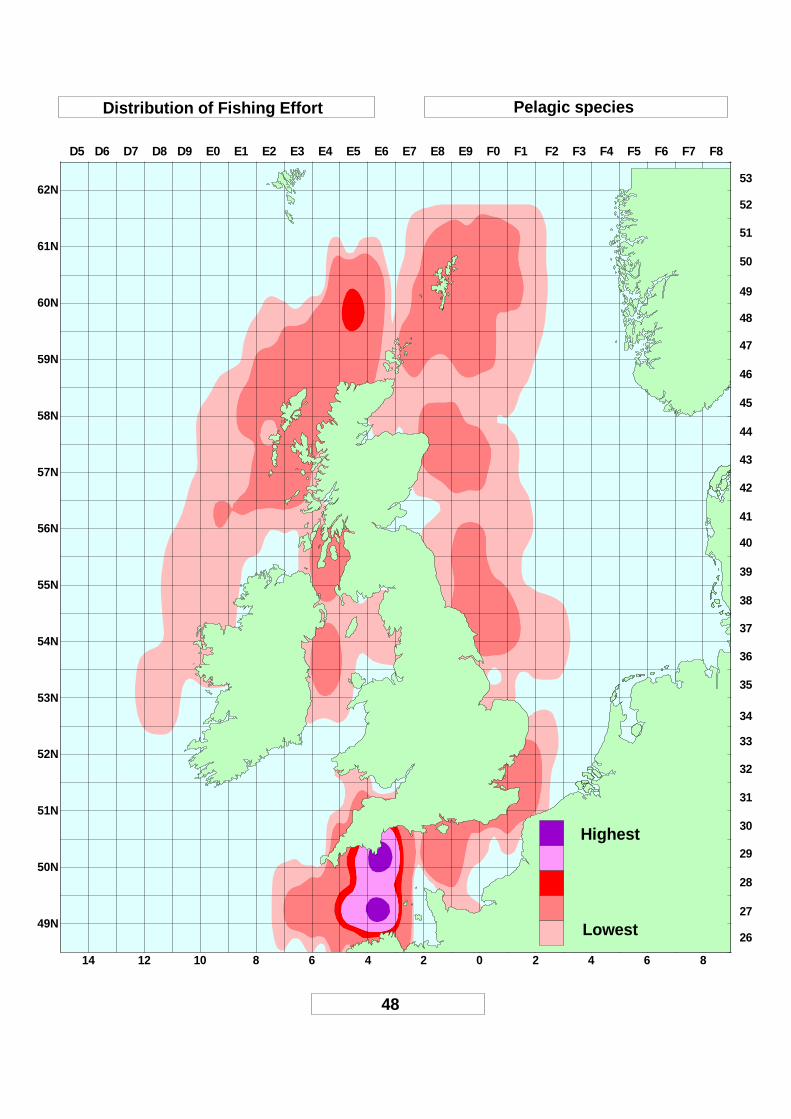
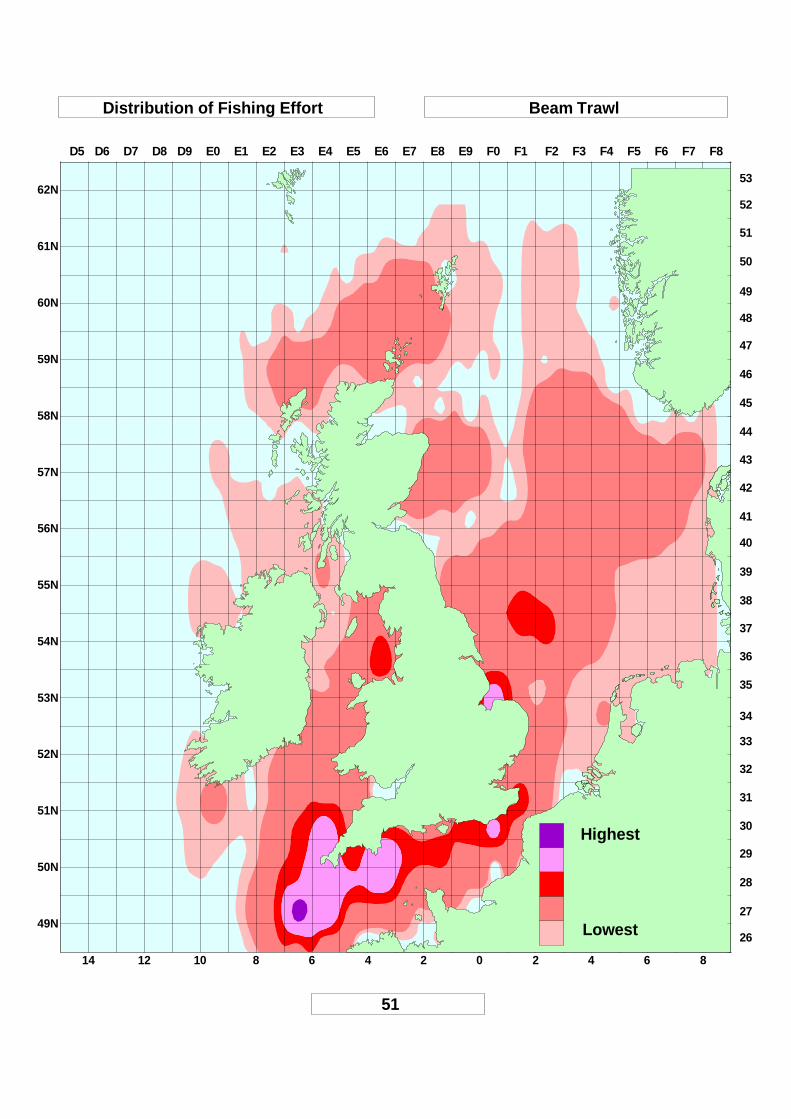
In the maps, UK effort is divided arbitrarily into five categories from the highest to the lowest.It is recognised that this makes little scientific sense since the distribution of effort is actually acontinuum between those squares which contain little effort and those which are actively exploited.However, since the primary purpose of the maps is to inform and flag up relative sensitivities inorder to encourage dialogue and resolution of potential interaction this is not thought to be an importantcriticism. Five maps, for demersal (excluding beam trawls), pelagic, Nephrops and shrimp, beamtrawlers and static gears are presented. The value of each category is not consistent between thegears, i.e. high demersal effort does not necessarily correspond with high pelagic effort.
The potential for interaction during seismic exploration, field developments, production anddecommissioning, is obvious and a knowledge of fishing effort by area will help operators in theirplanning processes. Some gears carry more potential threat to oilfield equipment than others. Beamtrawls carry the most threat and an extra map of beam trawl effort by all countries by area is provided(it comes from Jennings et al, 1998, for reference see page ii).

14 12 10 8 6 4 2 0 2 4 6 8
49N
50N
51N
52N
53N
54N
55N
56N
57N
58N
59N
60N
61N
62N
D5 D6 D7 D8 D9 E0 E1 E2 E3 E4 E5 E6 E7 E8 E9 F0 F1 F2 F3 F4 F5 F6 F7 F8
53
47
52
51
50
49
48
47
46
45
44
43
42
41
40
39
38
37
36
35
34
33
32
31
30
29
28
27
26
Distribution of Fishing Effort Demersal species
Highest
Lowest
14 12 10 8 6 4 2 0 2 4 6 8
49N
50N
51N
52N
53N
54N
55N
56N
57N
58N
59N
60N
61N
62N
D5 D6 D7 D8 D9 E0 E1 E2 E3 E4 E5 E6 E7 E8 E9 F0 F1 F2 F3 F4 F5 F6 F7 F8
53
48
52
51
50
49
48
47
46
45
44
43
42
41
40
39
38
37
36
35
34
33
32
31
30
29
28
27
26
Distribution of Fishing Effort Pelagic species
Highest
Lowest

14 12 10 8 6 4 2 0 2 4 6 8
49N
50N
51N
52N
53N
54N
55N
56N
57N
58N
59N
60N
61N
62N
D5 D6 D7 D8 D9 E0 E1 E2 E3 E4 E5 E6 E7 E8 E9 F0 F1 F2 F3 F4 F5 F6 F7 F8
53
49
52
51
50
49
48
47
46
45
44
43
42
41
40
39
38
37
36
35
34
33
32
31
30
29
28
27
26
Distribution of Fishing Effort Nephrops
Highest
Lowest
/ Shrimp Trawlers

14 12 10 8 6 4 2 0 2 4 6 8
49N
50N
51N
52N
53N
54N
55N
56N
57N
58N
59N
60N
61N
62N
D5 D6 D7 D8 D9 E0 E1 E2 E3 E4 E5 E6 E7 E8 E9 F0 F1 F2 F3 F4 F5 F6 F7 F8
53
50
52
51
50
49
48
47
46
45
44
43
42
41
40
39
38
37
36
35
34
33
32
31
30
29
28
27
26
Distribution of Fishing Effort Static Gears
Highest
Lowest
14 12 10 8 6 4 2 0 2 4 6 8
49N
50N
51N
52N
53N
54N
55N
56N
57N
58N
59N
60N
61N
62N
D5 D6 D7 D8 D9 E0 E1 E2 E3 E4 E5 E6 E7 E8 E9 F0 F1 F2 F3 F4 F5 F6 F7 F8
53
51
52
51
50
49
48
47
46
45
44
43
42
41
40
39
38
37
36
35
34
33
32
31
30
29
28
27
26
Distribution of Fishing Effort Beam Trawl
Highest
Lowest

14 12 10 8 6 4 2 0 2 4 6 8
49N
50N
51N
52N
53N
54N
55N
56N
57N
58N
59N
60N
61N
62N
D5 D6 D7 D8 D9 E0 E1 E2 E3 E4 E5 E6 E7 E8 E9 F0 F1 F2 F3 F4 F5 F6 F7 F8
53
52
52
51
50
49
48
47
46
45
44
43
42
41
40
39
38
37
36
35
34
33
32
31
30
29
28
27
26
Distribution of International Fishing Effort N. Sea Beam Trawl (1995 )
Highest
Lowest
53
Relative Value Maps
It is not possible to describe all sensitivities by a common metric. Overall value of the differentspecies by area (financial yield per ICES square) is an indication of the differential worth of areasand is merely another way of expressing sensitivity. Damaging events eg an oil spill, in an area ofhigher fisheries value would be of more concern than a similar spill in less productive waters, notonly in strictly financial terms to fishermen but also perhaps to fish eating mammals and piscivorousbirds via the food chain.
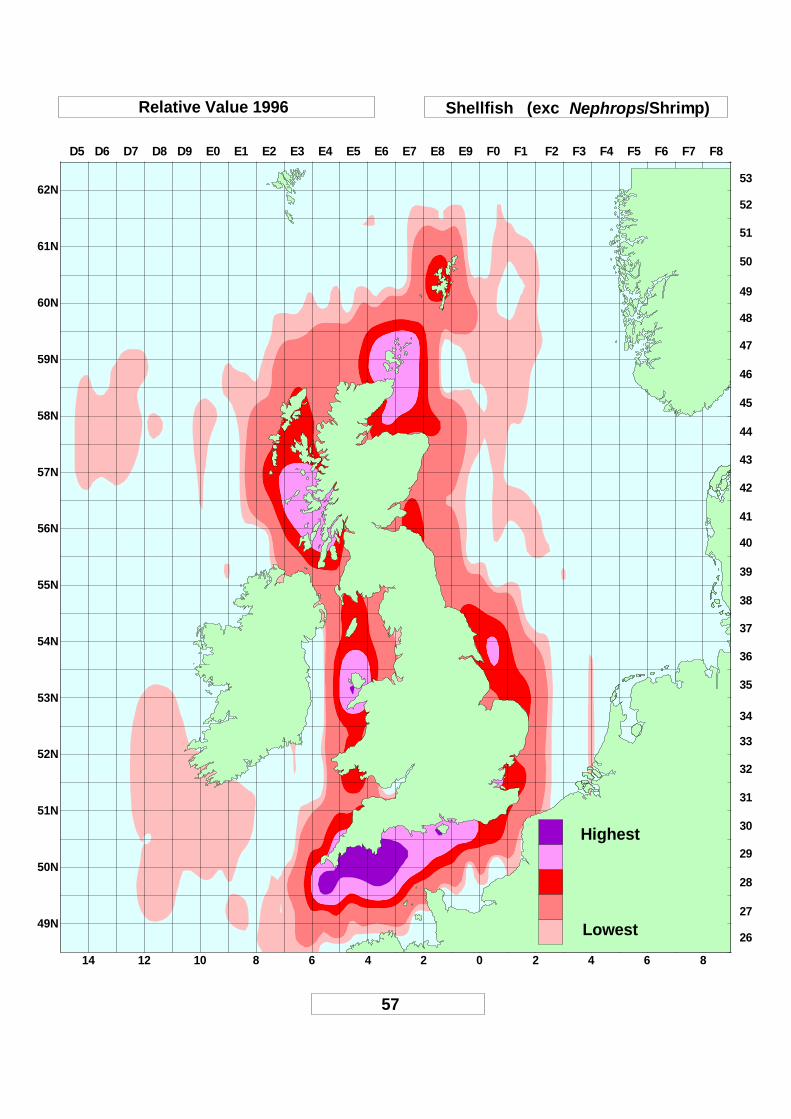
The following maps show annual value by area. The first three maps show the value of the demersal,pelagic, and the principal shellfish, namely Nephrops and shrimp. The fourth map shows the valuesof other shellfish (scallops, crabs and lobsters) and its more coastal distribution reflects the factthat static gears are often used to collect these resources. These data, like those for effort describedin the previous section, are allocated to a rectangle, but have been smoothed to show a continuouschange between rectangles. Clearly they should be used only as an indication of the likely sensitivityof an area. Values are arranged in arbitrary categories, from the highest to the lowest and, as withthe effort maps, the actual values are different for the different resources.
A final map which sums the values of all resources by area is also included. It is an indication ofoverall economic productivity of the different marine areas around the UK.

14 12 10 8 6 4 2 0 2 4 6 8
49N
50N
51N
52N
53N
54N
55N
56N
57N
58N
59N
60N
61N
62N
D5 D6 D7 D8 D9 E0 E1 E2 E3 E4 E5 E6 E7 E8 E9 F0 F1 F2 F3 F4 F5 F6 F7 F8
53
54
52
51
50
49
48
47
46
45
44
43
42
41
40
39
38
37
36
35
34
33
32
31
30
29
28
27
26
Relative Value 1996 Demersal species
Highest
Lowest

14 12 10 8 6 4 2 0 2 4 6 8
49N
50N
51N
52N
53N
54N
55N
56N
57N
58N
59N
60N
61N
62N
D5 D6 D7 D8 D9 E0 E1 E2 E3 E4 E5 E6 E7 E8 E9 F0 F1 F2 F3 F4 F5 F6 F7 F8
53
55
52
51
50
49
48
47
46
45
44
43
42
41
40
39
38
37
36
35
34
33
32
31
30
29
28
27
26
Relative Value 1996 Pelagic species
Highest
Lowest

14 12 10 8 6 4 2 0 2 4 6 8
49N
50N
51N
52N
53N
54N
55N
56N
57N
58N
59N
60N
61N
62N
D5 D6 D7 D8 D9 E0 E1 E2 E3 E4 E5 E6 E7 E8 E9 F0 F1 F2 F3 F4 F5 F6 F7 F8
53
56
52
51
50
49
48
47
46
45
44
43
42
41
40
39
38
37
36
35
34
33
32
31
30
29
28
27
26
Relative Value 1996 Nephrops
Highest
Lowest
& Shrimps
14 12 10 8 6 4 2 0 2 4 6 8
49N
50N
51N
52N
53N
54N
55N
56N
57N
58N
59N
60N
61N
62N
D5 D6 D7 D8 D9 E0 E1 E2 E3 E4 E5 E6 E7 E8 E9 F0 F1 F2 F3 F4 F5 F6 F7 F8
53
57
52
51
50
49
48
47
46
45
44
43
42
41
40
39
38
37
36
35
34
33
32
31
30
29
28
27
26
Relative Value 1996 Shellfish (exc /Shrimp)
Highest
Lowest
Nephrops

14 12 10 8 6 4 2 0 2 4 6 8
49N
50N
51N
52N
53N
54N
55N
56N
57N
58N
59N
60N
61N
62N
D5 D6 D7 D8 D9 E0 E1 E2 E3 E4 E5 E6 E7 E8 E9 F0 F1 F2 F3 F4 F5 F6 F7 F8
53
58
52
51
50
49
48
47
46
45
44
43
42
41
40
39
38
37
36
35
34
33
32
31
30
29
28
27
26
Relative Value 1996 Total All Species
Highest
Lowest