fishery view improvement of time series line chart visualization of fishery data cpsc 533c final...
Post on 21-Dec-2015
216 views
TRANSCRIPT

Fishery ViewImprovement of Time Series Line Chart Visualization of
Fishery Data
CPSC 533CFinal Presentation
Ying Zhang & Lan Wu
December 19th 2005

Background:
• Ecopath: Line chart system developed by UBC Fishery Department
No fish is an island

Motivation:
• Too many time series gathered• Curves overlapping and information
overload
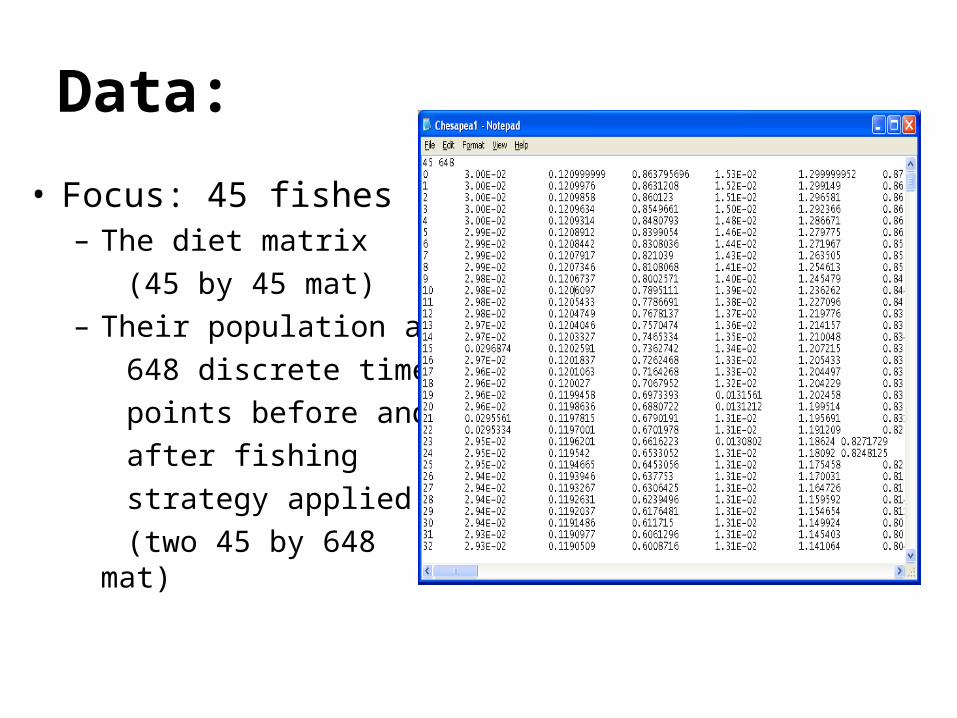
Data:
• Focus: 45 fishes– The diet matrix (45 by 45 mat)– Their population at 648 discrete time points before and after fishing strategy applied (two 45 by 648 mat)
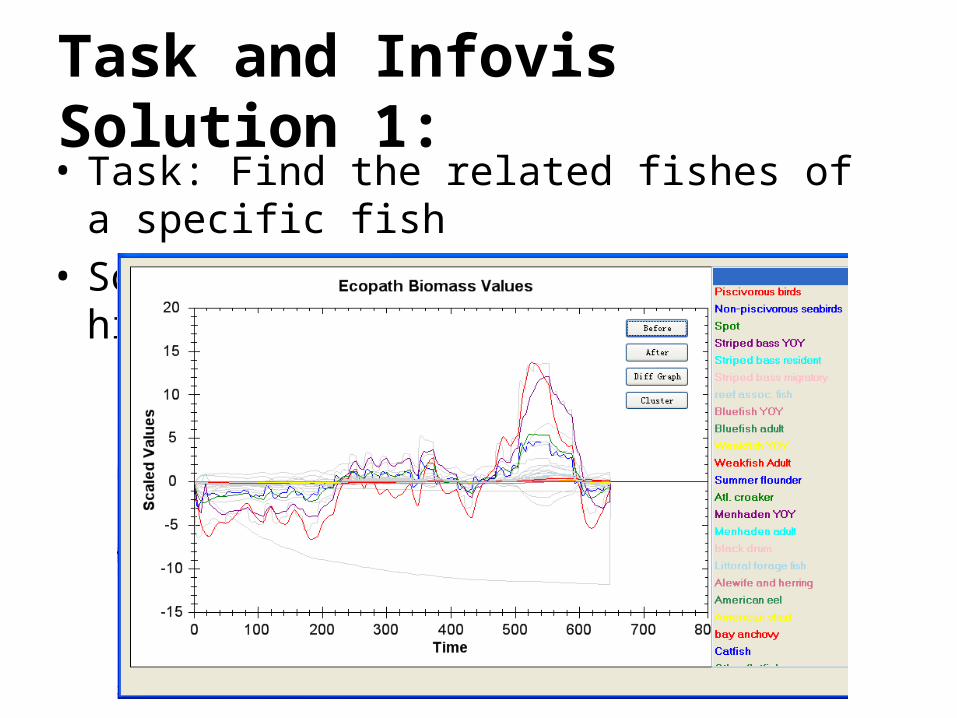
Task and Infovis Solution 1:• Task: Find the related fishes of a specific fish
• Solution: Brushing and highlighting

Task and Infovis Solution 2:• Task: Evaluate the effect of human’s fishing
• Solution: Difference graph

Task and Infovis Solution 3:• Task: Find the patterns fish populations match
• Solution: Clustering

High Level Implementation:
• Programming Platform: Visual Studio.Net
• Graphics Package: Zedgraph
• Clustering Algorithm– Distance Measure:
(Root Mean Square)
2 /rms i iD Y X M

Demo coming~
Unfinished/Future Work:
• Repeated Colors
• Overlapping reduced but still not eliminated
• Code Optimization
• More user interaction

Lessons learned:
• Understanding users’ preferences
• Developing based on an existing framework or using a visualization package

Thank you !
?