fitt research european global markets research oil …p) 106/05/2009 fundamental, industry,...
TRANSCRIPT

Europe United Kingdom Oil & Gas
7 December 2009
European Oil Services
Chasing the pendulum
Christyan Malek Research Analyst (+44) 20 754-58249 [email protected]
Lucas Herrmann, ACA Research Analyst (+44) 20 754-73636 [email protected]
Jonathan Copus Research Analyst (+44) 20 754-51202 [email protected]
Deutsche Bank AG/London
All prices are those current at the end of the previous trading session unless otherwise indicated. Prices are sourced from local exchanges via Reuters, Bloomberg and other vendors. Data is sourced from Deutsche Bank and subject companies. Deutsche Bank does and seeks to do business with companies covered in its research reports. Thus, investors should be aware that the firm may have a conflict of interest that could affect the objectivity of this report. Investors should consider this report as only a single factor in making their investment decision. Independent, third-party research (IR) on certain companies covered by DBSI's research is available to customers of DBSI in the United States at no cost. Customers can access IR at http://gm.db.com/IndependentResearch or by calling 1-877-208-6300. DISCLOSURES AND ANALYST CERTIFICATIONS ARE LOCATED IN APPENDIX 1. MICA(P) 106/05/2009
FITT Research
Fundamental, Industry, Thematic, Thought Leading DB's Company Research’s Research Committee has deemed this work F.I.T.T for investors seeking differentiated ideas. Here our European team undertakes a '360' analysis on the global oil services industry that leverages unique data sourced from Wood Mackenzie and DB's expansive contract database to reveal the winners and losers of oil service themes & names across 2010-11.
Fundamental: ‘capex pendulum’ should swing back in favour of some but not all
Industry: topline momentum is key driver of company earnings mid-term
Thematic: a unique analysis of appraisal drilling and license terms
Thought leading: deepwater drilling most attractive; E&C winners & losers
Playing the trends: Amec, SPMI & SDRL - top picks offer impressive growth
Co
mp
any
Glo
bal
Mar
kets
Res
earc
h

Europe United Kingdom Oil & Gas
7 December 2009
European Oil Services Chasing the pendulum
Christyan Malek Research Analyst (+44) 20 754-58249 [email protected]
Lucas Herrmann, ACA Research Analyst (+44) 20 754-73636 [email protected]
Jonathan Copus Research Analyst (+44) 20 754-51202 [email protected]
Fundamental, Industry, Thematic, Thought Leading DB's Company Research’s Research Committee has deemed this work F.I.T.T for investors seeking differentiated ideas. Here our European team undertakes a '360' analysis on the global oil services industry that leverages unique data sourced from Wood Mackenzie and DB's expansive contract database to reveal the winners and losers of oil service themes & names across 2010-11.
Deutsche Bank AG/London
All prices are those current at the end of the previous trading session unless otherwise indicated. Prices are sourced from local exchanges via Reuters, Bloomberg and other vendors. Data is sourced from Deutsche Bank and subject companies. Deutsche Bank does and seeks to do business with companies covered in its research reports. Thus, investors should be aware that the firm may have a conflict of interest that could affect the objectivity of this report. Investors should consider this report as only a single factor in making their investment decision. Independent, third-party research (IR) on certain companies covered by DBSI's research is available to customers of DBSI in the United States at no cost. Customers can access IR at http://gm.db.com/IndependentResearch or by calling 1-877-208-6300. DISCLOSURES AND ANALYST CERTIFICATIONS ARE LOCATED IN APPENDIX 1. MICA(P) 106/05/2009
FITT Research
Top picks AMEC Plc (AMEC.L),GBP810.00 BuySaipem (SPMI.MI),EUR22.19 BuySeadrill Limited (SDRL.OL),NOK142.10 Buy
Key changes Ratings/ PT changes From ToAcergy PT NOK 50 NOK 85Aker Solutions PT NOK 40 NOK 60AMEC PT GBp 850 GBp 950Lamprell PT GBp 185 GBp 210Petrofac PT GBp 680 GBp 970Saipem PT E 23 E 27Seadrill PT NOK 120 NOK 190Seadrill rating Hold BuySubsea 7 PT NOK 50 NOK 80Technip PT E 42 E 53Tecnicas Reunidas E 41 E 44Wood Group PT GBp 190 GBp 210Wood Group rating Hold Sell
Deepwater appraisal and successful exploration wells drilled globally
1.0
2.0
3.0
4.0
5.0
6.0
7.0
8.0
App
rais
al/ s
ucce
ssfu
l exp
lora
tion
0
20
40
60
80
100
120
1995
1996
1997
1998
1999
2000
2001
2002
2003
2004
2005
2006
2007
2008
Wel
ls d
rille
dAppraisal/ successful exploration ratio (RHS) Successful exploration Appraisal
Source: Wood Mackenzie, Deutsche Bank
Deepwater rig rate outlook (>2000m)
0200400600800
100012001400160018002000
2000
2001
2002
2003
2004
2005
2006
2007
2008
2009
E
2010
E
2011
E
WM
dril
ling
days
0
100
200
300
400
500
600
700
Day
rate
('00
0$k/
d)
Drilling days Day rate
Source: Wood Mackenzie, Deutsche Bank
Current expectations for E&C revenue and margin 2009-11E
-40%-35%-30%-25%-20%-15%-10%-5%0%5%10%15%20%25%30%
-350 -300 -250 -200 -150 -100 -50 -
Absolute margin downside 2009-11E(bps)
Ave
rage
cap
ex g
row
th 2
009-
11E
LNG
Deepwater subsea
Refining & Petrochem.
Deepwater Facilities
Frontier Developments
Onshore Upstream
Oil Sands
GTL
Regas Middle East
Shallow water (capex)
Negative margin outlook vs. 2008 study
Decrease in capex momentum vs. 2008 study
Shallow water (opex)
Source: Wood Mackenzie, Deutsche Bank
Fundamental: ‘capex pendulum’ should swing back in favour of some but not all Our annual review of global capex conducted in partnership with Wood Mackenzie (WM) forecasts a moderate decline, in aggregate, across 2009-11 (-3%). The long run oil price implicit in WM’s bottom up analysis is $70/bbl. We kick the foundations to reveal green shoots in both exploration and engineering/construction (E&C) segments. While not immune to heightened macro risks near term their secular characteristics should help drive out-performance for those companies with appropriate exposure.
Industry: topline momentum is key driver of company earnings mid-term We place each company’s industry and regional ‘blueprint’ against our updated outlook. Together with our unique framework that differentiates companies on a number of metrics we forecast, on average, topline growth for the group (9%, 2009-12E) against a relatively cautious view on margin (c. 75bps EBITDA reduction). Our 2009-12E earnings outlook for the sector is 8%.
Thematic: a unique analysis of appraisal drilling and license terms Our proprietary analysis, done in conjunction with WM, reveals a material increase in deepwater licenses awarded relative to last year’s study. Between 2010 and 2014 70% of the world’s deepwater exploration licenses (exc. GoM) are due to expire with a sharp rise expected to occur in 2012. We argue that this should drive an impressive increase in absolute levels of exploration activity. Going forward this would also imply a higher intensity of appraisal drilling (for every successful deepwater exploration well we show that four appraisal wells have been drilled, on average, across this decade with some regions posting double digit figures). Together this forms the basis to our structural view that demand for deepwater rigs (particularly in the ultra-deep) will accelerate across the near to medium term.
Thought leading: deepwater drilling most attractive; E&C winners & losers Based on our analysis of deepwater rig supply/demand we believe that day rates here should reach $600k/day by 2011 (currently c. $500k/day). Across the E&C complex we carve out our most & least favored themes/regions and show how our appraisal drilling outlook has positive implications for contractors’ backlog.
Playing the trends: Amec, SPMI & SDRL - top picks offer impressive growth Amec, Saipem & Seadrill (upgraded to Buy) each possess excellent diversification and exposure to our highest conviction themes and regions. In contrast, WG (downgraded to Sell) appears at the weaker end of the industry spectrum given its relatively poor positioning & business model. We have raised our target sector multiple, which in part drives our PT revisions (pg. 54). Key downside risks include oil prices sinking below $70/bbl for a sustained period and poor execution.

7 December 2009 Oil & Gas European Oil Services
Page 2 Deutsche Bank AG/London
Table of Contents
Executive summary...................................................................................... 3
Exploration and appraisal drilling trends .................................................. 7
Exploration industry dynamics and relative profitability....................... 20
Global engineering and construction outlook......................................... 28
Kicking the foundations reveals some green shoots.............................. 31
E&C industry dynamics and relative profitability ................................... 39
Implications for companies’ earnings outlook 2010 and beyond.......... 45
Sector valuation and company winners and losers................................ 52
Top picks and key recommendation changes ......................................... 55
Appendix A: Valuation matrices ............................................................... 57
Appendix B: Exploration, appraisal and development capex split........ 61
Deepwater drilling activity vs. oil price ................................................... 62
Appendix C: Snapshot of each company’s financing ............................. 63
Appendix D: Shallow water drilling duration.......................................... 66
Appendix E: Regional spread of contracted newbuild rigs.................... 67
Appendix F: NOC/IOC/Independents investment in drilling ................. 68
Appendix G: Calculations behind backlog cover analysis...................... 70
Appendix H: Regional split of shallow water capex ............................... 72
Appendix I: Detailed overview of companies’ fleet ................................ 73
Appendix J: ‘Backlog longevity’ calculation explained .......................... 78
Appendix K: Asset utilisations .................................................................. 80
Appendix L: Gearing analysis.................................................................... 89
Appendix M: Contract strategy analysis.................................................. 90
Appendix N: NOC/IOC exposure .............................................................. 92
Appendix O: Licenses awarded by depth (onshore and offshore) ........ 93
Appendix P: Wind power capacity ........................................................... 94
Appendix Q: Strategic analysis of the E&C themes................................ 96
Appendix R: Porter’s 5 forces on key service segments ........................ 98
Appendix S: The CAPEX/OPEX ‘life cycle’ explained ........................... 104
Appendix T: Global oil service spectrum explained ............................. 107
Appendix U: Glossary of terms and simplifications ............................. 110

7 December 2009 Oil & Gas European Oil Services
Deutsche Bank AG/London Page 3
Executive summary Global outlook
Our annual study of global capex conducted in partnership with Wood Mackenzie sees a moderate decline, in aggregate, across 2009-11 (-3% compounded from 2008 levels). Exploration, appraisal and development activity (wellhead operations, drilling and seismic) represents c. 40% of global capex in 2009E with the balance comprising engineering and construction (E&C) spend. In this note we kick the foundations to reveal green shoots in both of these segments which while not immune to heightened macro risks near term, possess secular characteristics that should drive impressive growth in 2010-11 for those companies with appropriate exposure.
Figure 1: Global exploration* and E&C capex outlook
-
100,000
200,000
300,000
400,000
500,000
600,000
700,000
1999 2000 2001 2002 2003 2004 2005 2006 2007 2008 2009E 2010E 2011E
Cap
ex ($
bn)
Exploration, appraisal and development capex E&C capex
Source: Deutsche Bank, Wood Mackenzie; *Appendix B shows exploration, appraisal and development capex split by seismic, wellhead operations and drilling; we estimate that IOC/NOC leasing of drilling rigs (onshore, shallow water and deepwater) represents c.12% of global capex
E&C outlook Cost deflation across the supply chain and delays in Final Investment Decisions (FIDs) has driven a c. 10% drop vs. last year’s outlook (2008-10E). Despite this relatively muted backdrop we reveal a number of ‘sweet spots’ that include deepwater offshore construction (SURF and FPSO/facilities), LNG and OPEX spend (shallow/mid waters). By region, Middle East (Saudi, Kuwait and UAE), SE Asia (Australia and India), Africa (Ghana, Egypt, Angola and Nigeria) and Brazil should emerge as primary drivers of capex. We believe the majority of FIDs here should begin to materialise across H2 2010 and continue through 2011.
Performing strategic analysis of the subsets within this segment drives our absolute and relative outlook of profitability across the E&C complex. The themes we believe will provide out-performance (in terms of capex and margin) across the near to medium term are frontier developments, Middle East, LNG (and associated infrastructure) and ‘high-value’ (defined as highly technical) engineering and project management. Shallow water/conventional OPEX and deepwater facilities/FPSOs/subsea both share impressive capex outlooks but against the potential of excessive margin decline near term this leaves us with a broadly neutral view. Themes we expect will under-perform are shallow water/conventional CAPEX, oil sands and refining and petrochemicals.
The long run oil price
implicit in our bottom up
Wood Mack forecast is
$70/bbl. This is below DB’s
commodities team estimate
of $80/bbl long run
Our analysis shows that
NOCs will become a key
constituent of oil services’
backlog longer term making
them potentially a ‘price
setter’ in the context of a
global capex recovery (NOCs
are expected to represent
40% of global capex and
20% of all contracts signed
across the OFS sector by
2011)

7 December 2009 Oil & Gas European Oil Services
Page 4 Deutsche Bank AG/London
Key risk to our forecast is if FIDs are delayed beyond 2010. Whilst this would place downside pressure on our 2011 estimates we believe the impact should be limited based on our view that IOCs looking to adhere to mid to longer term targets of production would have to invest across 2011/2012. Critical to their reserve replacement will be the need to offset production decline on maturing fields with incrementally new barrels. Having delayed FIDs across 2009-10, we believe IOCs would be under renewed pressure to sustain production at their current levels provided was profitable.
Exploration outlook Demand: rising in deepwater. Proprietary analysis done in conjunction with Wood Mackenzie reveals a threefold increase in the number of deepwater appraisal wells drilled across this decade. We believe this trend is structural based on or analysis that shows a steady rise (since 1995) in: i) deep and ultra-deep appraisal activity (South America and South East Asia appear to be emerging as primary drivers) as IOCs and NOCs place greater focus on developing deepwater acreage. Discoveries in frontier regions across 1996-2000 created a backlog of wells requiring appraisal and triggered a material uplift in appraisal activity relative to exploration. ii) The proportion of wells drilled by independents and NOCs (that arguably possess a different set of criteria to IOCs). iii) The time taken to appraise deepwater wells (in part linked to their increasing depths and complexity).
We have also tracked all exploration licenses awarded since 2000 with a focus on when they are due to expire. We note a material increase in deepwater licenses awarded relative to last year’s study and reveal that between 2010 and 2014 70% of the world’s deepwater exploration licenses (exc. GoM) are due to expire with a sharp rise expected to occur in 2012. We argue that this should drive an impressive increase in absolute levels of exploration activity. Going forward this would also imply a higher intensity of appraisal drilling (for every successful deepwater exploration well we show that four appraisal wells have been drilled, on average, across this decade with some regions posting double digit figures). Together this forms the basis to our structural view that demand for deepwater rigs (particularly in the ultra-deep >2000m) will accelerate across the near to medium term. Our analysis also reveals a robust outlook for shallow water exploration and appraisal drilling based on a material increase in licenses awarded across 2008/09. Onshore activity continues to appear lacklustre. The implications of the above are renewed investment in refurbishment and upgrading of deepwater rig fleet.
Overall, whilst there is downside risk to drill given a potentially worsening macro environment (particularly in the event that license expiries are extended), we believe that near to medium-term exploration and appraisal drilling programs, particularly those in South America, West Africa and South East Asia should be least impacted. This is based, in part, on: i) IOC’s longer-term production targets that are weighted heavily to these regions leaving them with relatively less flexibility to relinquish their license and ii) our analysis in this note that presents a structural case for appraisal drilling that should be sustained at current levels.
Rig supply: tight for the best of them. Our analysis shows that deepwater global rig liquidity (defined as % rigs that are currently un-contracted) has increased from 26% (2008-12E) to 40% (2009-12E) and from 70% to 90% in the shallow water segment (current newbuild schedules suggests a 19% increase in global rig capacity vs. current levels). We believe the ultra deepwater market will demonstrate the best performance as supply/demand fundamentals are expected to tighten again beyond 2010. Having fallen from a record level of $700k/day in 2008 and stabilised around $500k/day, we expect rig rates to rise from 2010 (we forecast $600k/day by 2011) as license expiries loom and exploration/appraisal drilling accelerates. With this in mind, we believe incremental demand for best in class assets (younger, latest generation of rigs) will re-shape the deepwater market as new rig owners gradually displace market share traditionally held by more mature drillers (predominantly US based). We expect downward pressure on rig day rates operating in depths lower than 2000m given the greater availability of (older generation) mid-water fleet partly offset by a robust demand outlook. Shallower water day rates should continue to fall but stabilise
The upward structural shift
in the number of deepwater
wells appraised coupled
with a general rise in
complexity in and around
the wellhead suggests that
appraisal activity will be
sustained at current levels
Overall, whilst there is
downside risk to drill given
a potentially worsening
macro environment
(particularly in the event
that license expiries are
extended), we believe that
near to medium-term
exploration and appraisal
drilling programs,
particularly those in South
America, West Africa and
South East Asia should be
least impacted
Incremental demand for
best in class assets
(younger, latest generation
of rigs) will re-shape the
deepwater market as new
rig owners gradually
displace market share
traditionally held by more
mature drillers
(predominantly US based)

7 December 2009 Oil & Gas European Oil Services
Deutsche Bank AG/London Page 5
towards structurally higher levels than mid-cycle. Elsewhere in the exploration complex, rig construction services emerge as an attractive niche particularly in the Middle East.
Key 2010 trends for the companies We leverage our exhaustive database of contracts to show that since 2004, 70% of all contracts awarded across the E&C sector have comprised of sprint to market projects (STM characterised as brownfield developments that may be monetised relatively quickly and at a lower marginal cost of production than a greenfield project/FID). Whilst STMs are not immune to the volatility in commodity prices, we show that awards of this nature have been instrumental in sustaining the group’s revenue cover for 2009 around historic levels. We argue that the upward shift in shallow and deepwater appraisal drilling highlighted above should spur a proportionate increase in spend directed towards related FEED work and sprint to market projects. As a result we expect 2010 revenue cover for oil service companies exposed to this type of investment (asset light and asset intensive companies alike) to remain robust despite the risk of further potential delays in FIDs across 2010.
Given company management’s general lack of guidance regarding the level of pricing that has been achieved on more recently signed contracts and the apparent lag on company profitability (our analysis reveals it can be anything up to three years) we believe this places downside risk on our renewed margin forecasts for the E&C group (which, on aggregate, assumes some contraction across 2009-11). Variations to this trend will clearly depend on each company’s ability to differentiate both within the respective industry and through the operational efficiencies, strategy and business model underpinning it.
Key recommendations for 2010
We place each company’s industry and regional ‘blueprint’ against our global exploration and E&C projections outlined above. Together with our unique framework that differentiates companies on a number of metrics we model the company’s earnings outlook to 2012 (forecast horizon has been extended from 2011). We forecast, on average, topline growth for the group (9%, 2009-12E) against a more cautious view on margin (c. 75bps EBITDA reduction). Our 2009-12E earnings outlook for the sector is 8%. Our top picks are:
Seadrill: upgraded to Buy, PT NOK 190 (previously 120). Sector leading exposure to deep and ultra-deepwater drilling fuels impressive earning growth (21% 2009-12E CAGR). We argue for an absolute and relative re-rating against the European and US oil services. This should be driven, in part, by its imminent listing in the US (Q1’10) which should help improve investors’ perception of its superior asset quality and deepwater exposure (relative to its most comparable US peers).
Amec: Buy, PT raised to 950p (previously 850p). The company’s unique business model and impressive diversification beyond oil and gas (underpinned by its ‘high-value’ engineering and project management) should drive superior earnings visibility relative to its E&C peers (13% 2009-12 CAGR vs. sector average of 8%).
Saipem: Buy, PT raised to E27 (previously E23). High relative and absolute exposure to several of our preferred themes (including deepwater drilling) drives leading backlog cover and earnings growth across the E&C sector (10% 2009-12 CAGR).
In a scenario where the oil price could sit significantly below $70/bbl for a sustained period of time, we believe the earnings of E&C companies will be negatively impacted beyond 2011 as oil company capex gets pulled back. The reason why our earnings outlook should remain unchanged before then is that existing company backlog provides sufficient revenue cover and that the margins associated with the majority of these projects would have already been contracted (subject to execution performance, of course). Even so, share price sentiment will
We expect 2010 revenue
cover for oil service
companies exposed to
shallow and deepwater of
investment (asset light and
asset intensive companies
alike) to remain robust
despite the risk of further
potential delays in FIDs
across 2010
We believe Saipem, Amec
and Seadrill are optimally
placed across the oil
services chain and
demonstrate superior
earnings growth. In contrast,
Wood Group (downgraded
to Sell) appears at the other
end of the industry
spectrum given its relatively
weak positioning and
business model

7 December 2009 Oil & Gas European Oil Services
Page 6 Deutsche Bank AG/London
be negative (in anticipation of a slowdown in earnings momentum beyond 2010 not to mention the sector’s strong correlation with oil price). Against this backdrop we believe Saipem and Amec would outperform on a relative basis (vs. their E&C peers); Wood Group and Aker Solutions should underperform (we have downgraded Wood Group to a Sell from Hold). On an absolute basis we prefer Seadrill from our entire coverage universe.
Valuation –sector target multiple moved from 2010 to 2011; we continue to argue for a discount against historical multiples
Our 2011E EV/DACF for the sector is currently 7.0x (market cap-weighted) which represents c. 33% discount to the sector’s historical average (2000-08) of 10.5x. Given the decline in both exploration and E&C capex we expect over the near to medium term against what appears to be a slowing in earnings momentum, we believe that our target sector multiple (2011) should trade at a discount to historical multiples.
At the industry level, based on our analysis above we believe the risk (primarily execution and margin compression)/reward (primarily revenue) trade off has shifted more into ‘equilibrium’. However, in light of the lack of visibility surrounding FIDs nearer term linked to the risk of renewed deterioration at the macro level, on balance we argue that our sector target multiple should trade at a 20% discount to the historical average (vs. -50% previously). Improved cashflow visibility to the end of the decade (fuelled by robust sector backlog) coupled with a general improvement in execution and risk sharing between the contractor/client justifies why we believe this sector should not trade at a deeper discount to historical multiples.
Our implied PTs are supported by our DCF valuation in which we assume peak company earnings in 2012 with subsequent linear fade to our mid-cycle scenario in 2015. We have lowered our company WACCs to reflect the reduced market risk premium as well as the relatively lower cost of debt vs. last year’s study. We detail changes in company WACC in Appendix A. This in part drives our price target changes on our universe of stocks (summarised on page 54). We assume a long-term growth rate of 3% which is the average mid-cycle rate since 1990 for the Euro oil services.
Risks
Oil price: whilst impossible to quantify, Wood Mackenzie estimates that 2010/11 E&C capex would be c. 20% lower if oil prices sink to $40/bbl. Russia, North America, Europe and Canada in particular could see an even more exaggerated decline. The Middle East will be the least impacted but nonetheless we would expect to see a slow down. Companies most at risk in this context are Acergy, Susbea 7, Wood Group and Aker Solutions (regional and thematic exposures detailed on pages 46 and 47). In contrast, we believe this downside risk for companies exposed to deepwater drilling will be mitigated by the structural need for operators to drill (near and medium-term) and their longer contract lives that should drive earnings growth well into the next decade.
Backlog cancellation (e.g. due to lack of client/contractor funding): Our discussions with Wood Mackenzie and Pegasus Global (leading risk consultants) suggest there is very little probability contracted projects will be cancelled given the healthy state of IOC and NOC balance sheets. In the unlikely event that they do, contractors have the right to file for liquidated damages and take control of all cash pre-payments. Equally we show that the refinancing risk on debt maturities of the companies we cover is low (detailed in Appendix C) and as a result we do not expect them to have cashflow issues in executing their contracts.
Execution: Poor execution is another key industry risk. We believe the potential impact this risk can have on company earnings remains impossible to quantify ahead of any material announcement.
On balance, we argue that
our sector target multiple
should trade at a 20%
discount (vs. -50%
previously) to the historical
average
Key risks are oil price,
backlog cancellation and
execution
7 December 2009 Oil & Gas European Oil Services
Deutsche Bank AG/London Page 7
Exploration and appraisal drilling trends Proprietary analysis done in conjunction with Wood Mackenzie reveals a threefold increase in the number of deepwater appraisal wells drilled across this decade. We believe this trend is structural based on our analysis that shows a steady rise (since 1995) in: i) deep and ultra-deep appraisal activity (South America and South East Asia appear to be emerging as primary drivers) as IOCs and NOCs place greater focus on developing deepwater acreage. Discoveries in frontier regions across 1996-2000 created a backlog of wells requiring appraisal and triggered a material uplift in appraisal activity relative to exploration. ii) The proportion of wells drilled by independents and NOCs (that arguably possess a different set of criteria to IOCs). iii) The time taken to appraise deepwater wells (in part linked to their increasing depths and complexity).
We have also tracked all exploration licenses awarded since 2000 with a focus on when they are due to expire. We note a material increase in deepwater licenses awarded relative to last year’s study and reveal that between 2010 and 2014 70% of the world’s deepwater exploration licenses (exc. GoM) are due to expire with a sharp rise expected to occur in 2012. We argue that this should drive an impressive increase in absolute levels of exploration activity. Going forward this would also imply a higher intensity of appraisal drilling (for every successful deepwater exploration well we show that four appraisal wells have been drilled, on average, across this decade with some regions posting double digit figures). Together this forms the basis to our structural view that demand for deepwater rigs (particularly in the ultra-deep >c. 2000m) will accelerate across the near to medium term. Our analysis also reveals a robust outlook for shallow water exploration and appraisal drilling based on a material increase in licenses awarded across 2008/09. Onshore activity continues to appear lacklustre.
Finally, in this section we argue that the implications of the above are renewed investment in refurbishment and upgrading of deepwater rig fleet (and to a lesser degree shallow and onshore assets).
Appraisal activity represents a discrete yet material driver of drilling demand
In our last FITT report titled ‘Reality Check’ (Oct 2008) we focused on the impact exploration drilling would have on the overall supply/demand outlook for rigs with a particularly emphasis on the deep and ultra-deepwater. We leveraged Wood Mackenzie’s global database of signature bonuses, licenses awarded and drilling days (measured as the time between spudding and completion of the well and a useful indicator of demand to drill) to analyse the outlook for drilling by different depths and respective rig types. We also looked at these licenses with a focus on their expiry profiles. Whilst we revisit these trends and their implications later on in this section our focus to start with is the outlook for shallow water and deepwater (defined as >400m) appraisal drilling and the incremental impact this could have on demand for rig capacity and ultimately day rates.
Simply put, appraisal drilling occurs when the operator has had enough success on an exploration well to want to drill it further. Ultimately it will determine the operator’s decision on whether to develop the well and proceed with an FID (first oil).
Our focus to start with is the
outlook for shallow water
and deepwater (defined as
>400m) appraisal drilling

7 December 2009 Oil & Gas European Oil Services
Page 8 Deutsche Bank AG/London
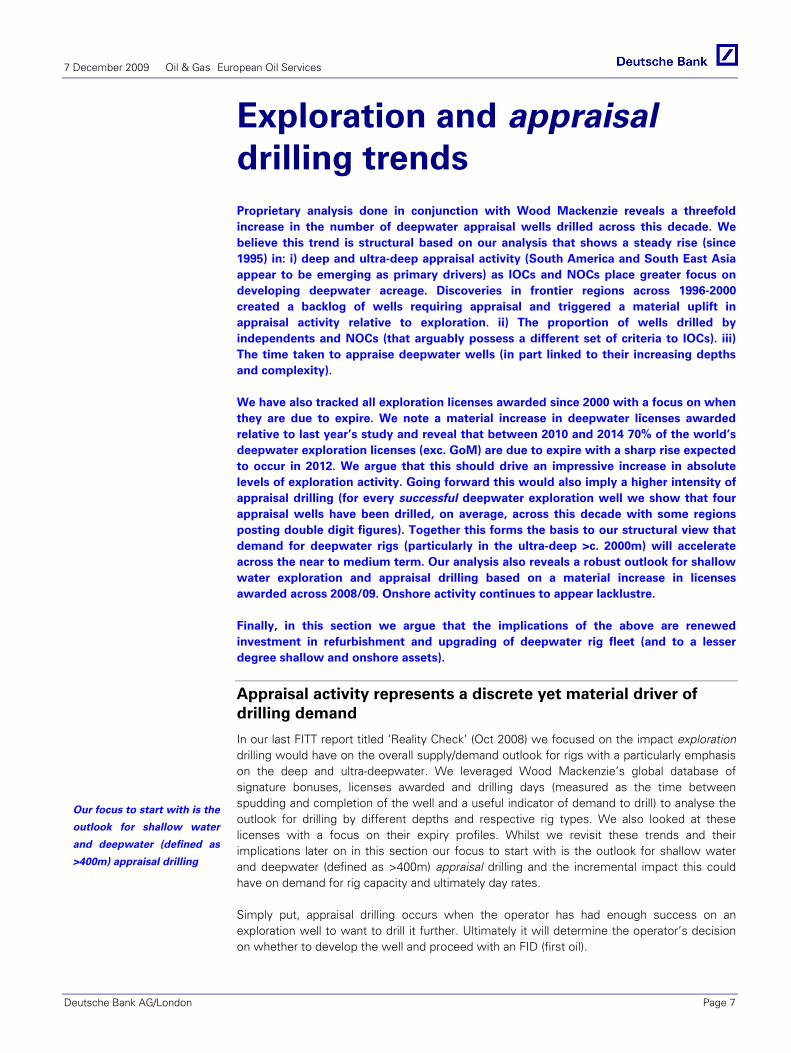
For every deepwater exploration well, an average four appraisal wells are drilled Figure 2 below shows the number of deepwater appraisal wells vs. successful exploration wells drilled over time. The correlation between the two should not be surprising and we observe the relatively high proportion of appraisal wells drilled subsequent to oil and/or gas being found.
Figure 2: Deepwater appraisal and successful exploration wells drilled globally
0
20
40
60
80
100
120
1995
1996
1997
1998
1999
2000
2001
2002
2003
2004
2005
2006
2007
2008
1.0
2.0
3.0
4.0
5.0
6.0
7.0
8.0
Wel
ls d
rille
d
App
rais
al/ s
ucce
ssfu
l exp
lora
tion
Appraisal/ successful exploration ratio (RHS) Successful exploration Appraisal
Source: Wood Mackenzie, Deutsche Bank
Figure 3 shows the relative number of appraisal wells vs. successful exploration wells drilled by region.
Figure 3: Ratio of deepwater appraisal wells drilled vs. successful exploration wells by
region
0
5
10
15
20
25
1996 1997 1998 1999 2000 2001 2002 2003 2004 2005 2006 2007 2008
Appr
aisa
l/ su
cces
sful
exp
lora
tion
ratio
Africa N America S America South East Asia Australia Average
Source: Wood Mackenzie, Deutsche Bank
We make the following observations from the above:
A structural increase in appraisal activity in relative and absolute terms driven by a greater focus on deepwater acreage by IOCs and NOCs. Discoveries in frontier regions
Our analysis reveals a
relatively high proportion of
appraisal wells drilled
subsequent to oil and/or gas
being found

7 December 2009 Oil & Gas European Oil Services
Deutsche Bank AG/London Page 9
across 1996-2000 created a backlog of wells requiring appraisal and helps explain the divergence between appraisal and exploration drilling during the same period.
The global historic average is around 4 appraisal wells drilled per successful exploration well.
South America and North America (primarily Gulf of Mexico) have both experienced relatively higher appraisal activity vs. other parts of the world. Large discoveries across this decade would have driven the spikes in appraisal drilling relative to exploration.
Secular increase in appraisal drilling should place upside pressure on global demand for deepwater rigs Factors that will influence the degree of appraisal drilling going forward include:
The operator’s desire to establish the well’s commerciality particularly on acreage that is technical challenging (e.g. very deep, remote and/or harsh weather conditions),
An operator’s ambition to achieve first oil as quickly as possible in order to lower the payback period of investment (particularly when the development cycle is difficult to shorten and where there is greater ability to do so during the exploration and appraisal phase),
The well’s proximity to a nearby well(s) that would make it immediately commercial if tied back to existing subsea infrastructure and platform (s),
The fiscal terms set about by the host government which could allow within a certain time frame the participants to be reimbursed on some of the costs incurred during appraisal (vs. exploration which is more often than not fully expensed across the company’s P&L).
No doubt commodity prices will drive operators’ appetite to explore and appraise more wells and a weaker macro environment could see a slowdown in activity. However, we believe the upward trend evidenced above in the number of deepwater wells appraised should stabilise at current levels on an absolute and relative basis. This is supported by our analysis below which shows:
A structural shift in appraisal activity towards deeper waters (figure 4). We also depict this by region (figure 5) and show that South America and South East Asia have emerged as swing players since the start of this decade
Figure 4: Appraisal drilling has gravitated towards mid
and ultra-deep water…
Figure 5: …South America and South East Asia have
emerged as swing players across this decade
-
1,000
2,000
3,000
4,000
5,000
6,000
1996
1997
1998
1999
2000
2001
2002
2003
2004
2005
2006
2007
2008
Dri
lling
day
s
400-799 800-1199 1200-1599 1600-1999 2000-2399 2400-2799 2800-3199
0
1000
2000
3000
4000
5000
6000
1996
1997
1998
1999
2000
2001
2002
2003
2004
2005
2006
2007
2008
Dril
ling
days
N America S America Africa E Hemisphere Europe Middle East
Source: Wood Mackenzie, Deutsche Bank; drilling days is defined as the time drilled between spudding & completion of well. Source: Wood Mackenzie, Deutsche Bank; drilling days is defined as the time drilled between spudding &
completion of well.
A higher exploration success rate over time argues for more appraisal work per unit well explored (figure 6 shows the global success rate rising from an average of 15% on average across the first half of the decade to 25% since 2005),
We believe the structural shift
evidenced above in the
number of deepwater wells
appraised will be sustained at
current levels

7 December 2009 Oil & Gas European Oil Services
Page 10 Deutsche Bank AG/London
An increase in the proportion of wells drilled by independents and NOCs since the mid-90’s (figure 7). NOCs’ appetite to explore and appraise will be based on their own (strategic) ambitions for future production. Independents’ incentive to appraise will be linked to their respective drilling schedules (shareholders’ primary focus will be on the company’s exploration and appraisal success).
Figure 6: Exploration success rate (based on commercial
and technical success) has generally improved over
time…
Figure 7: …with a greater proportion of wells drilled by
independents and NOCs
5%
7%
9%
11%
13%
15%
17%
19%
21%
23%
25%
27%
29%
31%
1995
1996
1997
1998
1999
2000
2001
2002
2003
2004
2005
2006
2007
2008
Expl
orat
ion
succ
ess r
ate
0
50
100
150
200
250
300
350
1995 1996 1997 1998 1999 2000 2001 2002 2003 2004 2005 2006 2007 2008
Tota
l wel
ls d
rille
d (e
xplo
ratio
n an
d ap
prai
sal)
20%
25%
30%
35%
40%
45%
50%
55%
60%
% In
depe
nden
ts &
NO
Cs
Independent E&P IOC NOC % Independents & NOCs (RHS)
Source: Wood Mackenzie, Deutsche Bank Source: Wood Mackenzie, Deutsche Bank
A gradual increase in the time spent (on aggregate) to drill an appraisal well (figure 8) arguably linked to a general rise in complexity in and around the wellhead,
Figure 8: Average drilling time per well has increased substantially across the decade
30
35
40
45
50
55
60
65
70
75
0%
10%
20%
30%
40%
50%
60%
70%
80%
90%
100%
2000 2001 2002 2003 2004 2005 2006 2007 2008A
vera
ge d
rillin
g da
ys p
er w
ell
Prop
ortio
n of
wel
ls d
rille
d ac
ross
wat
er d
epth
s
2800-3199 2400-2799 2000-2399 1600-1999 1200-1599
800-1199 400-799 Exploration (RHS) Appraisal (RHS) Source: Wood Mackenzie, Deutsche Bank
A counter-argument to our thesis above is that the cumulative experience built by the operator in drilling over the respective acreage could drive higher well flow rates and over time result in fewer wells drilled and within a shorter time frame. We have seen anecdotal evidence of this already in some basins such as Santos, Brazil where IOCs have expressed interest in reducing drilling times going forward. Whilst this dynamic places downside risk on the long run global demand to appraise, for now it appears to be limited to a few regions around the world and specific to only a handful of IOCs.
Shallow water and onshore appraisal drilling at parity with exploration Figures 9 and 10 below highlights the volatility in drilling activity for onshore and offshore appraisal drilling with the recent rise fuelled by the increase in commodity prices (we would expect the reverse to occur across 2009 given the sharp drop). Whilst this cyclicality is not surprising, we observe that in contrast to deepwater, the level of appraisal drilling relative to
7 December 2009 Oil & Gas European Oil Services
Deutsche Bank AG/London Page 11
exploration has rarely moved beyond parity. Appendix D shows the aggregate time spent to drill an exploration/ appraisal well.
Figure 9: Shallow water appraisal and successful
exploration wells drilled globally
Figure 10: Onshore appraisal and successful exploration
wells drilled globally
0.4
1.4
2.4
3.4
4.4
5.4
6.4
7.4
8.4
0
100
200
300
400
500
600
700
800
1996 1997 1998 1999 2000 2001 2002 2003 2004 2005 2006 2007 2008
App
rais
al/ s
ucce
ssfu
l exp
lora
tion
Wel
ls d
rille
d
Successful exploration Appraisal Appraisal/ successful exploration ratio (RHS)
0.6
0.7
0.8
0.9
1.0
1.1
1.2
1.3
1.4
1.5
1.6
150
200
250
300
350
400
1996 1997 1998 1999 2000 2001 2002 2003 2004 2005 2006 2007 2008
App
rais
al/ s
ucce
ssfu
l exp
lora
tion
Wel
ls d
rille
d
Successful exploration Appraisal Appraisal/ successful exploration ratio (RHS)
Source: Wood Mackenzie, Deutsche Bank Source: Wood Mackenzie, Deutsche Bank
Deepwater license expiries should fuel structural demand to explore (and in turn appraise) across 2010-14
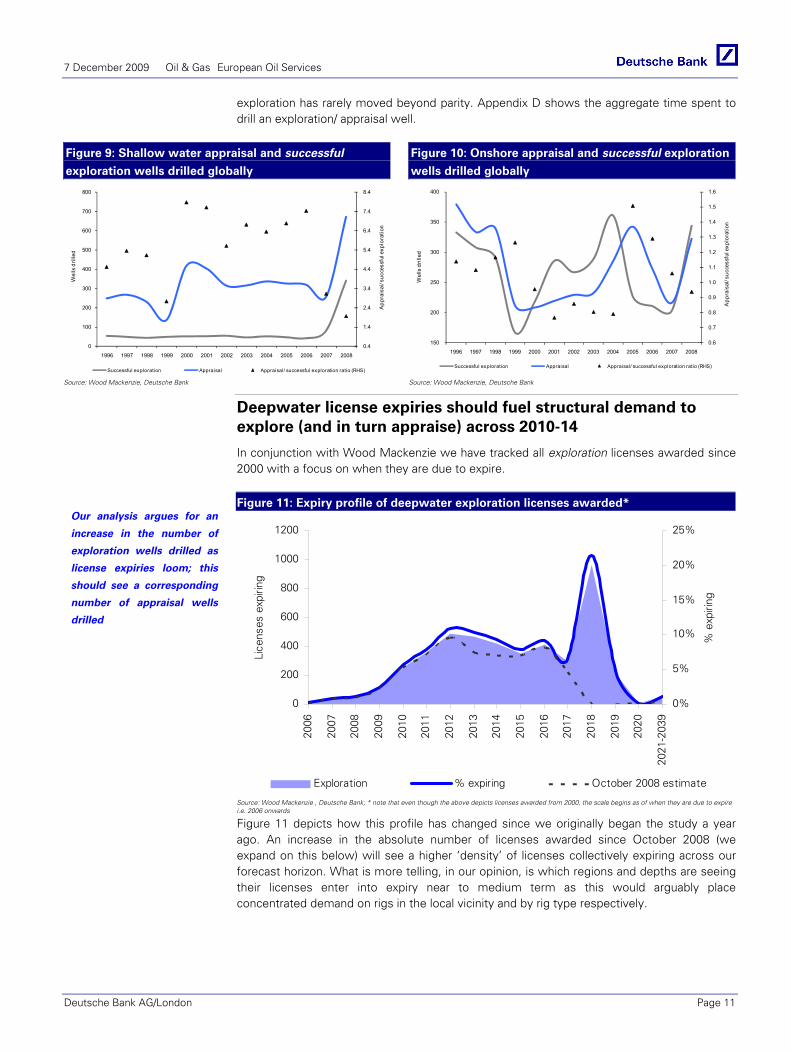
In conjunction with Wood Mackenzie we have tracked all exploration licenses awarded since 2000 with a focus on when they are due to expire.
Figure 11: Expiry profile of deepwater exploration licenses awarded*
0
200
400
600
800
1000
1200
2006
2007
2008
2009
2010
2011
2012
2013
2014
2015
2016
2017
2018
2019
2020
2021
-203
9
Lice
nses
exp
iring
0%
5%
10%
15%
20%
25%
% e
xpiri
ng
Exploration % expiring October 2008 estimate
Source: Wood Mackenzie , Deutsche Bank; * note that even though the above depicts licenses awarded from 2000, the scale begins as of when they are due to expire i.e. 2006 onwards
Figure 11 depicts how this profile has changed since we originally began the study a year ago. An increase in the absolute number of licenses awarded since October 2008 (we expand on this below) will see a higher ‘density’ of licenses collectively expiring across our forecast horizon. What is more telling, in our opinion, is which regions and depths are seeing their licenses enter into expiry near to medium term as this would arguably place concentrated demand on rigs in the local vicinity and by rig type respectively.
Our analysis argues for an
increase in the number of
exploration wells drilled as
license expiries loom; this
should see a corresponding
number of appraisal wells
drilled

7 December 2009 Oil & Gas European Oil Services
Page 12 Deutsche Bank AG/London
Figure 12: Given that the majority of the world’s
deepwater rigs* operate outside of GoM…
Figure 13: …we take a closer look at the expiry profile of
deepwater exploration licenses awarded exc. GoM
46%
23%
17%
6%4% 4%
S America GOM E Hemisphere Africa Russia Europe
0
20
40
60
80
100
120
2006
2007
2008
2009
2010
2011
2012
2013
2014
2015
2016
2017
2018
2020
2021
-203
9
Lice
nses
exp
iring
0%2%4%6%8%
10%12%14%16%18%
% e
xpiri
ng
Exploration % October 2008 estimate
Source: Deutsche Bank, ODS Petrodata; * refers to contracted newbuild deepwater rigs (represents c.17% of all rigs (existing + new) Source: Deutsche Bank, Wood Mackenzie
Between 2010 and 2014, 70% of the world’s deepwater exploration licenses (excluding GoM) are due to expire with an acute rise expected to occur in 2012. We believe the absolute increase in licenses expiring (particularly in 2014) relative to last year’s outlook places additional strain on the world’s deepwater rigs given excess capacity has remained broadly unchanged across the same period.
Figure 14: Breakdown of deepwater exploration licenses expiring by depth excluding
GoM*
0
20
40
60
80
100
120
2006
2007
2008
2009
2010
2011
2012
2013
2014
2015
2016
2017
2018
2020
2021
- 20
39
Lice
nses
exp
iring
400-799 (Peak 2014) 800-1199 (Peak 2009 & 2014) 1200-1599 (Peak 2009 & 2012)
1600-1999 (Peak 2010, 2012 & 2014) 2000-2399 (Peak 2012) 2400-2799 (Peak 2013)
>2800 (Peak 2009, 2012 & 2015)
Source: Deutsche Bank, Wood Mackenzie, *Given the scale of GoM licenses awards (on average 400/year vs. 40/year elsewhere in the world) and the fact that two thirds of them are below 1500m, we have excluded this region from the chart in order to show clearly the trends occurring in ultra-deep i.e. >c. 2000m
Figure 14 shows that the majority of licenses across all depth intervals are due for expiry over the next five years. The sharp rise in ultra-deepwater (i.e. >c. 2000m) license relinquishments should place additional strain on the demand for these types of rigs (fifth/sixth generation) of which there are far fewer of to relative to shallow and mid-water rigs. We expand on the supply/demand implications of this analysis on day rates in the next section (‘exploration dynamics’).
The sharp rise in ultra-
deepwater (i.e. >c. 2000m)
license expiries should place
additional strain on the demand
for these types of rigs (5th/6th
generation) of which there are
far fewer of to the end of the
decade relative to shallow and
mid-water rigs

7 December 2009 Oil & Gas European Oil Services
Deutsche Bank AG/London Page 13
Figure 15: Breakdown of deepwater exploration licenses expiring by region
0
10
20
30
40
50
60
70
80
90
100
2006 2007 2008 2009 2010 2011 2012 2013 2014 2015 2016 2017 2018 2019 2020 2021-2039
Lice
nses
exp
iring
-200
0
200
400
600
800
1000
1200
Europe (Peak 2009 & 2014) South East Asia (Peak 2012 & 2015)Africa (Peak 2009 & 2013) S America (Peak 2010 & 2012)N America (Peak 2013 & 2017) GOM (Peak 2018) (RHS)
Source: Deutsche Bank , Wood Mackenzie
We draw the following observations from the above:
South America licenses should relinquish between 2010 and 2013. This should see a hike in exploration and subsequent appraisal drilling activity that implies greater demand for rigs near term. Note that the increase in exploration activity triggered by the Tupi find in 2007 de-stabilised the global market for rigs as existing ones gravitated towards South America and un-contracted global rig capacity reduced (mainly driven by new orders placed by Petrobras). Our analysis of all recently built rigs operating globally shows that 27% have been contracted to work in the region over the next five years (detailed in Appendix E).
The majority of the licenses awards in Africa across this decade will expire between 2010 and 2015 which should see operators continue to bid on un-contracted rigs to ensure that their drilling commitments are fulfilled. We note a large number of new licenses that have been awarded over the last 12 months and that broadly 20% of the existing base has been renegotiated (drilling programs extended). Together this has pushed out Africa’s expiry profile towards the middle of next decade (vs. last year’s outlook which showed the majority of licenses in this region expiring by 2012).
Europe (largely represented by the North Sea and Norwegian shelf) should witness a renewed surge in drilling mid to longer term as expiries continue into the next decade (vs. last year’s outlook that showed the majority of licenses relinquishing by 2010)
We show the Gulf of Mexico separately given its much larger scale of licenses awarded vs. the rest of the world (albeit that each license is far smaller in block size). We note that the pressure to drill in this region is less given the first ‘peak’ in expiry does not occur until broadly 2012/13. In addition, oil companies have arguably more flexibility in being able to extend drilling programs here relative to other parts of the world.
Brazil and South East Asia
will emerge as swing
players in the global
demand for deepwater rigs
Europe, Africa and GoM
have all experienced a
material increase in licenses
awarded over the last 12
months. Extensions to
drilling programs have been
most prominent in these
regions. Together this sees
renewed expiries across the
mid term and more regular
peaks

7 December 2009 Oil & Gas European Oil Services
Page 14 Deutsche Bank AG/London
Following a hike in 2009, shallow water and onshore license relinquishments appear to be reducing mid term and with it the pressure to drill ahead of expiry
Figure 16: Expiry profile of shallow water and onshore
licenses awarded from 2000
Figure 17: Breakdown of shallow water and onshore
exploration licenses expiring by region
0
500
1000
1500
2000
2500
3000
2002
2005
2007
2009
2011
2013
2015
2017
2019
2021
-204
0
Cou
nt o
f lic
ense
s ex
pirin
g
0%
5%
10%
15%
20%
25%
% e
xpiri
ng
Exploration % expiring
0
200
400
600
800
1000
1200
2002
2005
2007
2009
2011
2013
2015
2017
2019
2021
-204
0
Lice
nses
exp
iring
0
500
1000
1500
2000
2500
3000
N A
mer
ica
licen
ses
expi
ring
GOM (Peak 2009 & 2013) E Hemisphere (Peak 2008, 2012 & 2015)S America (Peak 2009, 2012 & 2014) Africa (Peak 2010 & 2012)Europe (Peak 2012) Middle East (Peak 2009 & 2011)Russia (Peak 2008, 2011 & 2033) N America (Peak 2022) (RHS)
Source: Deutsche Bank, Wood Mackenzie Source: Deutsche Bank, Wood Mackenzie
Shallow water licenses appear to be generally less periodic in their expiry and having collectively reached a peak this year, the pressure to drill into the end of the decade is reducing. Looking at the regional splits, GoM not surprisingly represents one of the largest constituents of shallow water drilling and is to a large degree driving the downtick in license relinquishments to the end of the decade.
To what extent will volatile macro conditions impact drilling programs being adhered to and the appetite to drill?
What is implicit in the above is that every operator be it oil company or independent will have no choice but to drill in order to fulfil their commitments to the host government. High commodity prices will no doubt influence their appetite to explore and appraise more actively. However, even if oil prices were to fall significantly below current levels the access to reserves (particularly those that offer high net margin barrels) should remain a priority over its near-term commerciality and development. The risk to this assumption is that if credit availability and macro conditions were to worsen, governments themselves (committed to social programs and other fiscal pressures) could in turn pull funding and therefore become more accommodating to drilling programs. This would see license expiries extended easing the pressure for oil companies to explore and appraise.
This decision process would typically be initiated by the host government or National Oil Company. International oil companies that have left their licenses early or exited countries pre-maturely have in the past found it extremely difficult to return. Note it is not uncommon to see them negotiate with their partners including the host government on the grounds that the block acreage yielded very little in the way of discoveries and should not continue to be drilled upon. This is clearly a sensitive discussion but nonetheless one that again removes some of the pressure to remain overly committed to drilling schedules and in particular those that have not been successful.
Overall, whilst there is downside pressure to drill given some uncertainty on the macro environment (particularly in the event that license expiries are extended), we believe that near to medium-term exploration and appraisal drilling programs particularly those in South America, West Africa and South East Asia should be least impacted. This is based on:
1) Wood Mackenzie’s view that these host governments in particular have greater strategic ambition to increase their country’s oil and gas production,
2) IOC’s longer-term production targets are weighted heavily to these regions leaving them with relatively less flexibility to relinquish their licenses,
…the risk to this assumption
is that if macro conditions
deteriorate, then we could
see a reduced willingness
from governments to
explore easing the pressure
on IOCs/NOCs and
independents to drill
Overall, whilst there is
downside pressure to drill
given some uncertainty on
the macro environment
(particularly in the event
that license expiries are
extended), we believe that
near to medium-term
drilling programs
particularly those in South
America, West Africa and
South East Asia should be
least impacted

7 December 2009 Oil & Gas European Oil Services
Deutsche Bank AG/London Page 15
3) Our analysis above that presents a structural case for appraisal drilling that should be sustained at current levels on an absolute basis.
Drilling demand outlook
In this section we model the various datasets provided by Wood Mackenzie’s global exploration database (licenses acreage, signature bonuses, drilling days) to derive an outlook of demand to drill split offshore vs. onshore and also across various depth intervals. The appetite to drill is not homogeneous across the spectrum of depths or indeed onshore and offshore. We combine this analysis with the conclusions derived from our earlier observations on license expiries and outlook for appraisal activity to renew our forecasts for rig day rates offering an alternative to the methodologies adopted by ODS Petrodata and consultancies alike. Figure 18 below shows the increase in deepwater signatures bonuses since the start of the decade. The uplift in shallow water signature bonuses in 2008 is primarily driven by Brazil (Campos and Santos basins) and the US (Alaska Chukchi Sea basin and GoM).
Figure 18: Signature bonuses accelerated across 2006-2008 with an increasing
emphasis on deepwater
-
2,000
4,000
6,000
8,000
10,000
12,000
14,000
2000 2001 2002 2003 2004 2005 2006 2007 2008
Sig
natu
re b
onus
($m
n)
Onshore Offshore <400m Deepwater >400m
Source: Deutsche Bank, Wood Mackenzie

7 December 2009 Oil & Gas European Oil Services
Page 16 Deutsche Bank AG/London
Figure 19: Shift in licensees awarded (see Appendix O for detailed trends on licenses
awarded) has historically been followed with a similar (directional) change in drilling
days (exploration and appraisal)
0
20,000
40,000
60,000
80,000
100,000
120,000
140,000
160,000
180,000
200,000
2000
2001
2002
2003
2004
2005
2006
2007
2008
2009
E
2010
E
2011
E
drill
ing
days
0
500,000
1,000,000
1,500,000
2,000,000
2,500,000
3,000,000
3,500,000
licen
ses
(acr
eage
in k
m2)
Onshore Shallow water (0-400m)Deepwater (>400m) licenses awarded (RHS)
Source: Deutsche Bank , Wood Mackenzie; * drilling days is defined as the time drilled between spudding & completion of well.
Shallow water drilling outlook shows mixed signals
Figure 20: Drilling activity in depths 0-199m* Figure 21: Drilling activity in depths 200-399m*
9,000
29,000
49,000
69,000
89,000
109,000
129,000
2000
2001
2002
2003
2004
2005
2006
2007
2008
2009
E
2010
E
2011
E
drilli
ng d
ays
0
50,000
100,000
150,000
200,000
250,000
300,000
licen
ses
(acr
eage
in k
m2)
drilling days licenses awarded
Increase in licenses aw arded expected to fuel drilling activity
0
1,000
2,000
3,000
4,000
5,000
6,000
7,000
2000
2001
2002
2003
2004
2005
2006
2007
2008
2009
E
2010
E
2011
E
days
010,00020,00030,00040,00050,00060,00070,00080,00090,000
licen
ses
(acr
eage
in k
m2)
drilling days licenses awarded
Whilst outlook appears lacklustre, activity is expected be driven from a higher base
Source: Wood Mackenzie and Deutsche Bank estimates; *2009 license acreage has yet to be fully updated by WM
Source: Wood Mackenzie and Deutsche Bank estimates; *2009 license acreage has yet to be fully updated by WM
Mid deepwater outlook robust, ultra-deepwater continues to accelerate
Figure 22: Drilling activity in depths 800-1199m* Figure 23: Drilling activity >2000m*
0
5000
10000
15000
20000
25000
30000
35000
40000
0
1000
2000
3000
4000
5000
6000
7000
8000
2000
2001
2002
2003
2004
2005
2006
2007
2008
2009
E
2010
E
2011
E
Lice
nses
(acr
eage
in k
m2)
days
dril l ing days licenses awarded
Ramp up in licenses awarded across 2007-08 should see an equivalent increase in drilling act ivity across 2010/11 vs. previous years; key regional drivers are South East Asia and Brazil
-
50,000
100,000
150,000
200,000
250,000
300,000
350,000
400,000
-
200
400
600
800
1,000
1,200
1,400
1,600
1,800
2,000
2000
2001
2002
2003
2004
2005
2006
2007
2008
2009
E
2010
E
2011
E
Lice
nses
(acr
eage
in k
m2)
Day
s
Drilling days Licenses awarded
Ultra-deepwater ilicens awards has been a key driver in this unpredented hike across 2006-09. This should see an equivalent increase in drilling activity well into the next decade
Source: Deutsche Bank & Wood Mackenzie; *2009 license acreage has yet to be fully updated by WM Source Deutsche Bank & Wood Mackenzie; *2009 license acreage has yet to be fully updated by WM

7 December 2009 Oil & Gas European Oil Services
Deutsche Bank AG/London Page 17
Figure 24: Deepwater drilling activity will continue to intensify in depths >2000m
0
5000
10000
15000
20000
25000
30000
2000 2001 2002 2003 2004 2005 2006 2007 2008 2009E 2010E 2011E
Dee
pwat
er d
rillin
g da
ys
> 2400 2000-2399 1600-1999 1200-1599 800-1199 400-799
Structural shift towards ultra deep water depths in absolute and relative terms
Source: Wood Mackenzie; Deutsche Bank
Onshore drilling outlook appears lacklustre with some support from Middle East and South East Asia
Figure 25: Onshore activity
-
500,000
1,000,000
1,500,000
2,000,000
2,500,000
0
5,000
10,000
15,000
20,000
25,000
30,000
35,000
2000
2001
2002
2003
2004
2005
2006
2007
2008
2009
E
2010
E
2011
E
licen
ses
(acg
reag
e in
km
2)
days
drilling days licenses awarded
Source: Wood Mackenzie; Deutsche Bank
Positive implications for rig construction services
Our outlook of rig construction spend (newbuild, upgrade and refurbishment) is based on what has already been flagged by the contractors (drillers and E&C companies) and the degree of additional investment that could materialise. Despite the number of deepwater floater new builds coming on-stream, the relative lack of liquidity here (only c. 40% are accessible vs. 90% for jack-ups) against accelerated drilling activity particularly in the ultra-deepwater suggests that the demand for newbuilds will continue albeit at a reduced pace and scale vs. 2006-08.
This is in contrast to the jack-up rig market (offshore and onshore) that appears readily accessible and in turn should see a more severe decline in newbuild investment vs. 2006-08. Notable exceptions here that place upside pressure particularly on the rate of incremental jack-up rig spend include:
The demand for premium jack-up rigs capable of working in harsh environments as the global incremental supply of oil continues to be sourced from more technically challenging prospects (e.g. in the FSU).
Our outlook for drilling
demand points to a material
rise in ultra-deepwater
drilling. By 2011 we expect
this end of the depth
spectrum to represent 20%
of deepwater drilling days
(vs. 14% 2007)

7 December 2009 Oil & Gas European Oil Services
Page 18 Deutsche Bank AG/London
National oil company investment in rig newbuilds. Figures 26 and 27 show actual capex committed to new builds between 2009 and 2012 sourced by region and origin of the operator; i.e., NOC vs. IOC.
Figure 26: Rig new build spend (2009-12E) by region Figure 27: Rig new build spend (2009-12E) by NOC/IOC
Total 2009-12E capex = $67.5 bn
Asia 19%
Norw ay 23%
South America 19%
Africa1%
US27%
Europe10%
Middle East1%
Total 2009-12E capex = $67.5 bn
IOC (i.e private or publicly listed
drillers)40%
NOC60%
Source: Deutsche Bank, ODS Petrodata Source: Deutsche Bank, ODS Petrodata
On comparing the above to the split of new build spend that occurred between 2003 and 2006, we note that there has been a gradual shift from the traditional investors of rig new builds, such as the US and Europe towards South America, Middle East and Asia. This move has been underpinned by greater participation of NOCs in rig construction and in turn refurbishment/upgrades. Confirming this is our analysis done in conjunction with Wood Mackenzie which shows direct investment by the NOCs in drilling since 1995 (Appendix F).
Robust drilling outlook will continue to support rig upgrade and refurbishment investment particularly for those operating in deepwater This sub sector of rig construction services focuses on extending the life of a rig whether it be through maintenance and/or or extra kitting of equipment to improve its technical capabilities. Volatile commodity prices and general lack of macro visibility has put many refurbishment and upgrade programs on hold, as operators prefer to ‘cold or warm’ stack rigs than upgrade existing fleet. This has been most pertinent within the shallow water drilling segment; deepwater refurbishment has been relatively less impacted. Going forward, we believe that as macro conditions stabilise, we should see renewed interest in rig construction services. Forward demand will be directly correlated to:
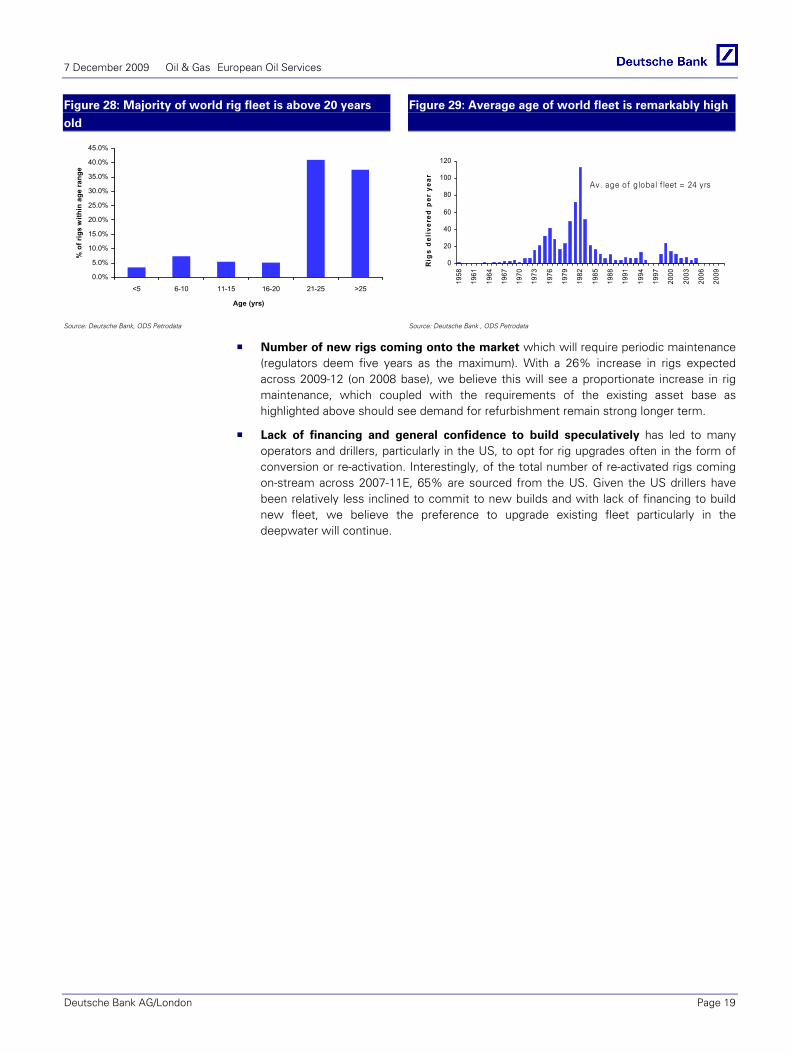
Rig attrition. Figures 28 and 29 show that 38% of global rig capacity is above 25-years-old (typical rig run life is 30 years) suggesting that over the next 10 years, these rigs will require some degree of maintenance. This could vary from refurbishment e.g. replacement of corroded parts (basically returning the rig to its original efficiency and capability thus extending its life) through to enhancement of the rig in order to extract more value from it. It is worth noting that we expect a more pro-active maintenance approach in contrast to earlier parts of the cycle where underinvestment i.e., the bare minimum was accepted (drillers, keen to exploit the strong commodity environment, kept maintenance time as low as possible).
7 December 2009 Oil & Gas European Oil Services
Deutsche Bank AG/London Page 19
Figure 28: Majority of world rig fleet is above 20 years
old
Figure 29: Average age of world fleet is remarkably high
0.0%
5.0%
10.0%
15.0%
20.0%
25.0%
30.0%
35.0%
40.0%
45.0%
<5 6-10 11-15 16-20 21-25 >25
Age (yrs)
% o
f rig
s w
ithin
age
ran
ge
0
20
40
60
80
100
120
1958
1961
1964
1967
1970
1973
1976
1979
1982
1985
1988
1991
1994
1997
2000
2003
2006
2009
Rig
s d
eliv
ered
per
yea
r
Av. age of global fleet = 24 yrs
Source: Deutsche Bank, ODS Petrodata
Source: Deutsche Bank , ODS Petrodata
Number of new rigs coming onto the market which will require periodic maintenance (regulators deem five years as the maximum). With a 26% increase in rigs expected across 2009-12 (on 2008 base), we believe this will see a proportionate increase in rig maintenance, which coupled with the requirements of the existing asset base as highlighted above should see demand for refurbishment remain strong longer term.
Lack of financing and general confidence to build speculatively has led to many operators and drillers, particularly in the US, to opt for rig upgrades often in the form of conversion or re-activation. Interestingly, of the total number of re-activated rigs coming on-stream across 2007-11E, 65% are sourced from the US. Given the US drillers have been relatively less inclined to commit to new builds and with lack of financing to build new fleet, we believe the preference to upgrade existing fleet particularly in the deepwater will continue.

7 December 2009 Oil & Gas European Oil Services
Page 20 Deutsche Bank AG/London
Exploration industry dynamics and relative profitability Our analysis shows that deepwater global rig liquidity has increased from 26% (2008-12E) to 40% (2009-12E) and from 70% to 90% in the shallow water segment (current newbuild schedules suggests a 19% increase in global rig capacity vs. current levels). In this section we marry the demand implications of our exploration and appraisal drilling outlook against what appears to be a well supplied market to determine how day rates will evolve by rig class across the near to medium term.
We believe the ultra deepwater market will demonstrate the best performance as supply/demand fundamentals are expected to tighten again beyond 2010. Having fallen from a record level of $700k/day in 2008 and stabilised around $500k/day, we expect rig rates to rise from 2010 (we forecast $600k/day by 2011) as license expiries loom and exploration/appraisal drilling accelerates. With this in mind, we believe incremental demand for best in class assets (younger, latest generation of rigs) will re-shape the deepwater market as new rig owners gradually displace market share traditionally held by more mature drillers (predominantly US based). We expect downward pressure on rig day rates operating in depths lower than 2000m given the greater availability of (older generation) mid-water fleet partly offset by a robust demand outlook. Shallower water day rates should continue to fall but stabilise towards structurally higher levels than mid-cycle. Elsewhere in the exploration complex, rig construction services emerge as an attractive niche particularly in the Middle East.
Drilling services: global rig rate outlook
Analysis and prediction of rig rates will be based on a number of continually changing variables that affect the operators and drillers’ perception of how the market will move. Structural factors that influence spot (or leading edge) and long-term (or contracted) rig rates include:
Outlook of exploration and appraisal drilling demand
Rate of rig replacement defined as the degree with which incremental rig capacity (confirmed new builds and upgrades) will be offset by ageing fleet due to be taken off-stream
Liquidity of the rig market - operators’ willingness to sign up rigs at a premium or discount to the current leading edge is, in part, based on the accessibility of incremental supply, i.e. the proportion of rigs that are not yet locked up into long-term contracts.
We base our short- to medium-term rig rate forecasts on our understanding of the above supply/demand dynamics. Macro and geopolitical factors influencing rig rates include:
Oil and gas prices (higher prices will drive appetite to drill and monetise reserves quickly)
The condition of the global economy and level of GDP growth anticipated worldwide and at the regional level
We believe our near- to mid-term day rate outlook remains intact at sub $70/bbl oil on a sustained basis and against deteriorating macro conditions. This is given the bottom up nature of our demand forecast (linked to the structural dynamics detailed in the last section).
Our day rate model is
demand driven and
dependent on our outlook
for exploration and appraisal
activity; analysing the
degree of supply coming on-
stream and more
importantly operator’s
ability to access spare
capacity, provides a more
complete picture with which
to forecast future day rates

7 December 2009 Oil & Gas European Oil Services
Deutsche Bank AG/London Page 21
DB day rate model
First we analyse supply.... Whilst we have not quantified the impact of supply on day rates we address below,
albeit qualitatively, the extent to which capacity creep could effect our forecast, if at all. Figures 30-33 show the timing, complexity and degree of incremental rig capacity (already commissioned) expected to come on-stream in the medium term. It is worth noting that rigs capable of drilling in deep and ultra deep waters are also operable in mid and shallower waters. Therefore during periods of low utilisation, owners of fifth/sixth generation rigs (semi-submersibles or drillships) may choose to charter them out in reduced depths.
Figure 30: Latest ODS figures suggest a 19% increase in
global capacity by 2012 vs. 2009
Figure 31: Drillships; 73% increase in supply expected
(depths greater than 7500ft)
0
10
20
30
40
50
60
70
2009 2010 2011 2012
Num
ber o
f rig
s
Drillship Jackup Semisubmersible Tenders
155 rigs are currently planned tocome on-stream across 09-12E
0
5
10
15
20
25
30
35
0-2999 3000-4999 5000-7499 7500-9999 >=10000
depth (ft)
Num
ber o
f rig
s
2009 2010 2011 2012
35 Drillships are planned to come onstream across 09-12E
Source: Deutsche Bank and ODS Petrodata Source: Deutsche Bank and ODS Petrodata
Figure 32: Semi-submersibles; 20% increase in supply
expected (bulk occurring at depths >7500ft)
Figure 33: Jackups; 13% increase in supply expected
(bulk occurring at depths b/w 300-400ft)
0
5
10
15
20
25
30
0-2999 3000-4999 5000-7499 7500-9999 >=10000
depth (ft)
Num
ber o
f rig
s
2009 2010 2011 2012
45 Semisubmersible rigs are planned to come onstream across 09-12E
0
10
20
30
40
50
60
0-199 200-300 300-400 >=400
Num
ber o
f rig
s
2009 2010 2011 2012
69 Jackups rigs are planned to come on stream across 09-12E
Source: Deutsche Bank and ODS Petrodata Source: Deutsche Bank and ODS Petrodata
Whilst the rig market appears well supplied into the end of the decade, we highlight below counter dynamics that should remove some of the downside risk on rig utilisations.
Rig attrition. Of the expected 19% increase in global capacity, ODS Petrodata estimates that up to a third of that could potentially be ‘soaked up’ in replacing older rigs forced off stream over the next 5-10 years.
Lack of financing and general confidence to build speculatively. Lack of credit availability and the general reluctance to build new rigs has completely removed speculative capacity this year. Whilst we believe deepwater rigs will continue to be built it will be at depressed pace and scale relative to 2006-09.

7 December 2009 Oil & Gas European Oil Services
Page 22 Deutsche Bank AG/London
Rig liquidity. Figures 34 and 35 show the proportion of new builds that have yet to be contracted.
Figure 34: Jackup new build spare capacity 2009-12E
Figure 35: Semi-submersible and drillship new build
spare capacity 2009-12E contracted Jackups
10%
Number of uncontracted
Jackups90%
Uncontracted semis and drillships,
40%
Contracted semis and drillships,
60%
Source: Deutsche Bank ,ODS Petrodata Source: Deutsche Bank, ODS Petrodata
Despite the number of deepwater floater new builds coming on-stream, the relative lack of liquidity here (c. 40% are accessible) suggests that the market will continue to remain tight in the medium term all else being equal. Conversely, the jack-up rig market (offshore and onshore) appears readily accessible. As the new builds come on stream, we believe this will inevitably place downward pressure on utilisation, assuming that jack-up demand does not vary significantly from current levels.
With regards to the existing rigs already under contract (that could threaten to increase spare capacity dramatically) analysis of the world’s contracted deepwater rigs (detailed further in the next section) shows that the average term length on rigs signed across 2007/08 (>90% of the world’s rigs were re-negotiated during this period) is four years (jackups between 0.5-2 years). Our point here is that spare capacity of existing rigs, at least those drilling in deepwater will not free up before 2011/2012. We believe this should be more than offset by a significant expected up-tick in drilling demand across the same period keeping supply/demand fundamentals robust into the first half of the next decade.
With the above in mind, we have utilised the Wood Mackenzie outlook on drilling activity and license expiries to forecast rig rates at various depth intervals in both shallow and deepwater. Note that our forecasts have been made on a yearly basis. So, for example, a driller currently looking to re-negotiate a contract due to expire during 2010 would, for the purpose of our rig model, lock into the rate we estimate in 2010 (at the relevant depth) for the renewed length of the contract term.
As Figures 36-40 show, excess offshore rig capacity (that drove utilisation <80%) between 2003 and 2005 appears to have pressured day rates across all depths despite intermittent increases in drilling activity during broadly the same time frame. We expect downward pressure on rig day rates operating in depths lower than 2000m given the greater availability of (older generation) mid-water fleet. In our opinion, the ultra deepwater market (depths >2000m) will demonstrate the best performance as supply/demand fundamentals are expected to tighten again beyond 2010. Shallower water day rates should continue to fall but stabilise towards structurally higher levels than mid-cycle.
The ultra deepwater market
(depths > 6500ft) will
demonstrate the best
performance going forward
as supply/demand
fundamentals tighten
further.

7 December 2009 Oil & Gas European Oil Services
Deutsche Bank AG/London Page 23
Figure 36: Ultra-deepwater rig rate outlook >2000m/6500ft
0
100
200
300
400
500
600
700
0200400600800
100012001400160018002000
2000
2001
2002
2003
2004
2005
2006
2007
2008
2009
E
2010
E
2011
E
Day
rate
('00
0$k/
d)
WM
dri
lling
day
s
Drilling days Day rate
Having fallen from a record level of $700k/day in 2008 and stabilised around $500k/day, we expect rig rates to rise from 2010 as licenses expirie loom (expected to peak in 2012), exploration drilling accelerates and appraisal activity intensifies.
Amidst potentially lower rig liquidity, the increase in new ultra deepwater rigs (capable of drilling >6500ft) are not likely to be sufficient to quench the ramp up in drilling activity expected at these depths.
Source: Deutsche Bank and Wood Mackenzie estimates
Figure 37: Rig rate outlook b/w between 400m to
914m/1300-3000ft
Figure 38: Mid deepwater rig rate outlook b/w 800m to
1200m/2600-3900ft
0
50
100
150
200
250
300
350
1500
2000
2500
3000
3500
4000
2000
2001
2002
2003
2004
2005
2006
2007
2008
2009
E
2010
E
2011
E
Day
rate
('00
0$k/
d)
WM
dri
lling
day
s
Drilling days Day rate
0
50
100
150
200
250
300
350
400
450
0
1000
2000
3000
4000
5000
6000
7000
8000
2000
2001
2002
2003
2004
2005
2006
2007
2008
2009
E
2010
E
2011
E
Day
rate
('00
0$k/
d)
WM
dri
lling
day
s
Drilling days Day rate
Increase in drilling activity should help support demand for rigs operating at the lower end of the deepwater spectrum.
However, older generation of rigs coming off contract coupled with new capacity coming on-stream should offset this incremental demand to drill and we expect day rates to remain under pressure.
Source: Deutsche Bank and Wood Mackenzie estimates
Robust drilling outlook should help support current day rates despite ramp up of new ultra deepwater rigs that may initially be utilised across the mid-water depths.
Incremental supply of older generation rigs (that operate mainly across this depth interval) will have negative implications on the supply/demand balance within mid-water and we expect day rates to fall albeit moderately.
Source: Deutsche Bank and Wood Mackenzie estimates

7 December 2009 Oil & Gas European Oil Services
Page 24 Deutsche Bank AG/London
Figure 39: Shallow water rig rate outlook b/w 0m to
199m/656ft
Figure 40: Shallow water rig rate outlook b/w 200m to
399m/656-1300ft
0.0
20.040.060.0
80.0100.0
120.0140.0
160.0
9,000
29,000
49,000
69,000
89,000
109,000
129,000
149,000
2000
2001
2002
2003
2004
2005
2006
2007
2008
2009
E
2010
E
2011
E
Day
rate
('00
0$k/
d)
WM
dril
ling
days
dr i l l ing days day rate
0.0
50.0
100.0
150.0
200.0
250.0
0
1,000
2,000
3,000
4,000
5,000
6,000
7,000
2000
2001
2002
2003
2004
2005
2006
2007
2008
2009
E
2010
E
2011
E
Day
rate
('00
0$k/
d)
WM
dril
ling
days
dr i l l i ng days day rate
The uptick in drilling activity beyond 2010 should be offset by a readily accessible jack-up market. This should see day rates fall (albeit to a level structurally higher than across the first part of the decade)
Source: Deutsche Bank and Wood Mackenzie estimates
Strong drilling outlook should help maintain current jack-up rates against a backdrop of capacity creep and high rig liquidity.
Source: Deutsche Bank and Wood Mackenzie estimates
Ultra-deepwater day rates will stay ‘stronger for longer’ as contract term lengths increase
We have updated our extensive contract analysis of all deepwater rigs signed under long-term fixtures since 2004 in order to track the term length of contracts over time.
Figure 41: Term length of semi-submersible and drillship contracts since 2004
0%10%20%30%40%50%60%70%80%90%
100%
2004 2005 2006 2007 2008
Up to 2 years 2-4 years 4+ years
Source: Deutsche Bank, Rigzone, ODS Petrodata
Figure 41 shows term lengths on the rise as clients prefer to lock into longer fixtures on fixed day rates (as opposed to accessing the spot market on shorter term leases typically <1 year). This should come as no surprise given the lack of rig liquidity in the deepwater market across 2007/08 which coupled with accelerated global drilling activity (not to mention stricter drilling schedule requirements by host governments) has forced IOCs and independents to sign up rigs well ahead of their release (or delivery if they are newbuild) and for longer periods of time. In parallel we have seen several NOCs (e.g. Petrobras) do the same as they take strategic decisions to invest over 5-10 year periods that justify locking into contracts on rigs

7 December 2009 Oil & Gas European Oil Services
Deutsche Bank AG/London Page 25
for 5+ years. The impact this dynamic has on our company model is that it gives us greater visibility beyond our earnings horizon (2012).
Rig construction services: capacity appears over-supplied, Middle East less so
We have analysed current and future capacity across the Middle East, Asia and Australia – basically the Eastern Hemisphere. With currently 66 yards in the region operating, three of which are undergoing brownfield expansion and four more being built, we believe that the risk of oversupply is real (notwithstanding yards being built in China that are not public knowledge). However, against our demand outlook and various counter-dynamics discussed below (based on our analysis of capacity by region and industry), the risk of margins deteriorating significantly in the medium term appears low in our opinion.
In Figure 42 we show the current regional yard capacity for construction. Oil and gas activities include newbuild and refurbishment of semi-submersible rigs, jack-up rigs, drillships, tension leg platforms, FPSO, FPO, heavy lift carriers, pipelay vessels, crude oil tankers, container vessels, gas carriers (LNG,LPG) etc. Non-oil and gas activities comprise yards that do ship (civil and naval) building, repair and conversion, service crafts, cargo ships, yachts, work boats, etc.
Figure 42: Regional construction capacity – Total of 70 yards (including greenfield)
China 21 (Yantai, COSCO, CSSC, Keppel)
Singapore 13 (Keppel. Sembcorp, Clough)
UAE 11 (Lamprell, MIS, Dubai Dry Docks, Keppel,
Mcdermott, QGM,CCC)
Indonesia 5 (Sembcorp, Mcdermott, Labroy Marine, Clough)
Korea 3 (Hyundai, Daewoo, Samsung)
Philippines 3 (Keppel)
Japan 3 (Kawasaki, Mitsui)
Azerbaijan 2 (Keppel, Mcdermott)
Thailand 2 (Lamprell, Clough)
Saudi Arabia 2 (Sembcorp, MIS) Qatar 1 (Keppel)
Kazakhstan 1 (Keppel) Kuwait 1 (MIS)
India 1 (Sembcorp) Australia 1 (Mermaid Marine)
Yards - Oil and gas sector
Greenfield expansions
Yards - non Oil and gas sector
Greenfield expansions
China 21 (Yantai, COSCO, CSSC, Keppel)
Singapore 13 (Keppel. Sembcorp, Clough)
UAE 11 (Lamprell, MIS, Dubai Dry Docks, Keppel,
Mcdermott, QGM,CCC)
Indonesia 5 (Sembcorp, Mcdermott, Labroy Marine, Clough)
Korea 3 (Hyundai, Daewoo, Samsung)
Philippines 3 (Keppel)
Japan 3 (Kawasaki, Mitsui)
Azerbaijan 2 (Keppel, Mcdermott)
Thailand 2 (Lamprell, Clough)
Saudi Arabia 2 (Sembcorp, MIS) Qatar 1 (Keppel)
Kazakhstan 1 (Keppel) Kuwait 1 (MIS)
India 1 (Sembcorp) Australia 1 (Mermaid Marine)
Yards - Oil and gas sector
Greenfield expansions
Yards - non Oil and gas sector
Greenfield expansions
Source: Deutsche Bank, Company data
Whilst the risk of over supply in the region poses a continuing threat to the industry’s mid- to longer-term pricing power (the fear being that the structure of the rig construction industry will weaken as more capacity comes online), we include below some of the counter-dynamics that should offset the downside risk on the company’s margins across the mid term:
Our discussions with
industry suggest that China
offers the lowest pricing on
rig construction services,
followed by Korea then UAE
and Singapore

7 December 2009 Oil & Gas European Oil Services
Page 26 Deutsche Bank AG/London
The type of construction activity on offer from these yards does not coincide completely with that of rig related construction. Figure 43 shows the proportion of yards that provide oil and gas related construction. Investor perception of construction capacity in these regions suggests that there is plenty of it; the reality is that it is being used for a variety of products of which non oil and gas represents approximately one-third. Of the oil and gas portion, the economies of scale on the yards offering newbuild services makes it relatively difficult to switch to the (smaller sized) refurbishment projects alone. Figure 44 shows the proportion of oil and gas based capacity that caters for refurbishment. The relative lack of pure refurbishment capacity suggests this sub-sector will continue to be robust and perhaps even more so in the Middle East (only 16% of rig construction capacity is refurbishment based) across the mid term. The downside risk to our outlook is that as incremental demand for newbuilds slows this could force contractors to change their product offering and result in a significant up-tick in refurbishment capacity.
Figure 43: Split of capacity by oil and gas related
construction and others
Figure 44: Split of capacity by refurbishment and
newbuild services
Number of yards: 70
30%
70%
Non oil and gas Oil and gas
Number of yards: 49
47%
16%
37%
New build Refurbishment New build + Refurbishment
Source: Deutsche Bank, Company data Source: Deutsche Bank, Company data
Companies operating specifically in the Middle East sit within three critical barriers to entry:
New entrants in the region and more specifically UAE which represents the bulk of construction activity in the region will likely lack the long standing relationships that existing contractors have established with the local government not to mention client base, critical prerequisites in being able to open up shop and succeed.
It makes no sense for drillers and oil companies operating here to upgrade or refurbish their rigs anywhere else; transport costs and likely risk of delay and inferior quality far outweighs the potential benefit of cheaper options in e.g. China.
Lack of natural harbours across the Middle East, particularly within the most construction-heavy country, UAE. Indeed, the government recently voiced their inability to expand industrial activity further across their coastline.
Greenfield expansions in the region as shown in Figure 45 suggest that the industry has certainly reacted to the demand surge witnessed in rig construction but perhaps not as aggressive as one would have expected (only two ‘oil and gas’ based yards are under construction against a current 47 in operation). Equally we show that the profile of this incremental capacity is changing. Figure 46 shows total capex committed by all the companies listed above (Figure 42) since 2004 and a gradual re-weighting towards non-oil and gas based activities.
… and even more so in the
Middle East
The relative lack of pure
refurbishment capacity
suggests this sub-sector will
remain robust…
The profile of incremental
capacity is shifting towards
non-oil and gas based
activities

7 December 2009 Oil & Gas European Oil Services
Deutsche Bank AG/London Page 27
Figure 45: Greenfield extensions* (oil and gas related) Figure 46: Investment in yard capacity
2,400 mQuay side
8,000 mQuay side
42 hectaresLand area
-
1,000
2,000
3,000
4,000
5,000
6,000
7,000
8,000
9,000
Qua
y si
de (m
)
0
5
10
15
20
25
30
35
40
45
Land
are
a (h
ecta
res)
Changxing (China) Keppel, Nakilat JV (Qatar)
53%50%
56%58%
50%53%
-
1,000
2,000
3,000
4,000
5,000
6,000
7,000
2004 2005 2006 2007 2008 2009E
Cap
ex ($
mn)
Oil and gas Non - Oil and gas % of Oil and gas
Source: Deutsche Bank, Company data* all of which will be completed by 2015; note that of the four greenfield yards under construction two are non oil and gas related
Source: Deutsche Bank , Company data;
Finally, despite what appears above to be a large number of yards in China (and potentially more that have not been disclosed), the oil and gas industry is split in its view of the quality of product that is on offer there. With drillers having to pay hefty fines on rig delays not to mention a forfeit of day rate, the appetite to change their traditional supplier of choice to new players particularly within Asia is unsurprisingly low. We would caution however that as the product quality of these yards improve (industry consultants Pegasus Global suggest this could be the case within five years), we expect market share to be re-distributed and pricing power to be under renewed pressure particularly on newbuild work given the relatively higher available capacity.

7 December 2009 Oil & Gas European Oil Services
Page 28 Deutsche Bank AG/London
Global engineering and construction outlook Our annual review of global E&C capex sees a moderate decline, in aggregate, across 2009-11. Not surprisingly, cost deflation across the supply chain and delays in FIDs has driven a c. 10% drop vs. last year’s outlook (2008-10E). In this section we outline the results of our bottom up analysis by theme and list the key bottlenecks surrounding FIDs which if they were to fully materialise could result in FIDs being delayed beyond 2010. Whilst this would place downside pressure on our 2011 estimates we believe the impact should be limited based on our view that IOCs looking to adhere to mid to longer term targets of production growth would have to invest across 2011/2012. Critical to their reserve replacement will be the need to offset production decline on maturing fields with incrementally new barrels. Having delayed FIDs across 2009-10, we believe IOCs would be under renewed pressure to sustain production at their current levels provided was profitable.
Global capex outlook
Figure 47: Global capex split 2010E
Exploratory, appraisal and development
spend*39%
Engineering and construction spend
61%
Source: Deutsche Bank and Wood Mackenzie;* excludes rig construction service capex
In partnership with Wood Mackenzie we have conducted our yearly review of global E&C spend that draws from the consultancy’s vast database of individual field models. We have incorporated all upstream/downstream projects likely to be sanctioned across 2010/11 based on our partner’s assessment of potential commercialisation of the world’s current 2P reserve base. These capex forecasts are sense-checked with what is implicit within our own global supply models (IOC and NOC production outlooks) and should not vary significantly in an oil price world of $70/bbl+ (Wood Mackenzie long-term assumption) given the bottom-up nature of our analysis.
Our capex forecasts should not vary significantly in an oil price world of $70/bbl + (Wood Mackenzie long-term assumption) given the bottom-up nature of our analysis

7 December 2009 Oil & Gas European Oil Services
Deutsche Bank AG/London Page 29
Figure 48: Global E&C outlook (NOC + IOC) by theme (av. yearly growth rates 2009-11E
shown alongside)
0
100
200
300
400
500
2006 2007 2008 2009E 2010E 2011E
Glo
bal E
&C
cap
ex (U
S $
bn)
….
9%
10%
11%
12%
13%
14%
15%
Dee
pwat
er w
eigh
ting
Deepw ater subsea 19%
Deepw ater facilities & FPSOs 6%
Onshore upstream -4%
GTL and Regas -3 %Oilsands -12%
Refining & petrochemicals 5 %
Deepw ater contribution to global spend
LNG plant 4%
Shallow w ater -9%
Source: Company data, Deutsche Bank & Wood Mackenzie estimates.
This year’s review incorporates improved Wood Mackenzie coverage of Middle East, Russia, Canada and South East Asia (including China and Australia - IOC and NOC spend) not to mention further development of our LNG and downstream products. All these factors have helped improve the granularity and accuracy of our capex forecasts. The variance vs. last year’s capex (2009-10E) is, on average -9%. One-third of this drop is due to expanded WM coverage with the balance attributed to:-
Projects being pushed back particularly FIDs that were due for sanctioning in 2009 delayed until 2010 and some indefinitely. This effect was most acute in North America (Permian Basin, Rockies and Gulf Coast fell 41%, 40% and 31% respectively vs. 2008), Brazil and West Africa. The drop off was less pronounced in other regions as a result of i) binding commitments to long lead items and long term contractual obligations particularly in the deepwater market and ii) sanctioning of sprint to market projects (expanded on in the next section),
Greater than expected cost deflation particularly with respect to steel and basic materials; note that prices of more specialised equipment and exotic materials have held up better.
Figure 49: Absolute spend across the global energy complex and expected year-on-year growth rates Year/year growth rates
$mn 2007 2008 2009E 2010E 2011E 2008/07 2009E/08 2010E/09E 2011E/10E Av. 2009E-11E
Deepwater Sub-sea 9,251 8,147 8,759 9,340 13,219 -12% 8% 7% 42% 19%
Deepwater Facilities & FPSOs 27,221 32,347 32,523 32,800 38,219 19% 1% 1% 17% 6%
Shallow water upstream (surface facilities & infrastructure)
83,555 92,641 78,070 75,891 69,253 11% -16% -3% -9% -9%
Onshore upstream (facilities & infrastructure)
167,925 194,678 174,335 175,641 173,480 16% -10% 1% -1% -4%
Gas to liquids (GTL) 2,300 5,150 5,000 3,468 2,131 124% -3% -31% -39% -24%
LNG plant 13,006 12,562 10,972 7,328 11,494 -3% -13% -33% 57% 4%
Re-gasification terminals 5,397 6,580 6,980 6,926 5,304 22% 6% -1% -23% -6%
Oil Sands 15,762 20,535 9,993 9,957 11,572 30% -51% 0% 16% -12%
Refining & Petrochemicals 19,735 27,417 44,902 35,898 26,064 39% 64% -20% -27% 5%
Other* 10,161 10,337 10,602 9,867 9,691 2% 3% -7% -2% -2%
Total E&C capex 354,314 410,395 382,137 367,115 360,428 16% -7% -4% -2% -4%
Total E&C capex 2008 346,789 394,758 408,028 416,663 na 14% 3% 2% na 6%**
Variance 2% 4% -6% -12% na Source: Company data, Deutsche Bank & Wood Mackenzie estimates; *other includes operations and maintenance capex as well as spend that cannot be categorised by one specific theme; **2008-10E

7 December 2009 Oil & Gas European Oil Services
Page 30 Deutsche Bank AG/London
Risks to our forecasts
Our forecasts detailed in figure 49 incorporate NOC capex and shows a moderate decline, on aggregate, in global spend to 2011. However, as mentioned above this assumes that company budgets in regards to FID and general ‘sprint to market’ spend go ahead. General risks to this assumption that we identify as key bottlenecks particularly surrounding FIDs include:
Management boards of Oil Cos deliberating the long run demand for the commodity and whether they should continue to commit to production targets that may appear aggressive relative to worst case scenarios of GDP growth (that assume prolonged recession) – volatility in commodity prices does not help visibility either,
Perception by Oil Cos that costs across the supply chain have further to fall,
Regulatory uncertainties particularly pertaining to environmental restraints and carbon. The latter is now being seen as a potentially material part of costing projects across all parts of the oil chain and the uncertainty relates not only to timing of any legislation from the US but also trying to gauge what cost might be involved,
Disagreement between IOCs and NOCS that are operating as part of a consortium and unable to decide collectively on whether to go ahead with the project development,
The potential shift in appetite by NOCs and IOCs in sanctioning ‘speed to market’ projects to ‘marathon market’ projects that see Oil Cos prolong investment decisions with the view to embark on projects offering sustainable LT returns (we expand on this dynamic in the next section) and
Social pressure on governments to invest in infrastructure and other services has left them with less capital relative to the last few years to funnel into new oil and gas projects. No doubt, the volatile oil and gas price does not make an easy case for NOCs to sanction FIDs.

7 December 2009 Oil & Gas European Oil Services
Deutsche Bank AG/London Page 31
Kicking the foundations reveals some green shoots Despite Wood Mackenzie’s relatively muted outlook for global E&C capex we reveal sweet spots across the oil services chain which while not immune to the risks outlined in the previous section should post impressive growth in 2010-11E assuming a long run oil price assumption of $70/bbl. By theme, these include deepwater offshore construction (SURF and FPSO/facilities), LNG, OPEX spend (shallow/mid waters). By region, Middle East (Saudi, Kuwait and UAE), SE Asia (Australia and India), Africa (Ghana, Egypt, Angola and Nigeria) and Brazil should emerge as primary drivers of capex. We believe the majority of FIDs here should begin to materialise across H2 2010 and continue through 2011. Our analysis also shows that pure NOC investment (NOCs working alone or with each other) will emerge as a key constituent of oil services’ backlog longer term making them potentially a ‘price setter’ in the context of a global capex recovery (NOCs are expected to represent 40% of global capex and 20% of all contracts signed across the OFS sector by 2011).
We leverage our exhaustive database of contracts to show that since 2004, 70% of all contracts awarded across the E&C sector have comprised of sprint to market projects (STM characterised as brownfield developments that may be monetised relatively quickly and at a lower marginal cost of production than a greenfield project/FID). Whilst STMs are not immune to the volatility in commodity prices, our analysis reveals that awards of this nature have been instrumental in sustaining the group’s revenue cover for 2009 around historic levels.
We argue that the upward trend in shallow and deepwater appraisal drilling highlighted in the previous section should spur a proportionate increase in spend directed towards related FEED work and sprint to market projects. As a result we expect 2010 revenue cover for oil service companies exposed to this type of investment (asset light and asset intensive companies alike) to remain robust despite the risk of further potential delays in FIDs across 2010.
‘Sprint to market’ investment will play a pivotal role in oil services’ backlog replenishment
A sprint to market project (STM) can take the form of: tie-ins (e.g. of a satellite well to an existing platform), general infrastructure, efficiency improvements and the next phase of a brownfield development that is already in production. These type of projects are generally shorter in term length (typically <12 months) given the nature of the work involved vs. an FID (on average 12-36 months) which is typically representative of a greenfield investment. FEED (front end engineering design) and detailed engineering is highly specialised and will be involved in conceptual and detailed engineering of various phases of the development (detailed definition given in Appendix S).
Upside risks to our forecasts are linked to faster than expected investment in Shell and BG’s floating LNG projects (FLNG), Iraq, GoM and the Caspian (collectively linked to the outcome of 2010 capital budgets decided upon by IOCs across Q4’09/Q1/’10).
Our analysis reveals that since 2004, 70% of all contracts awarded across the E&C sector have been sprint to market projects

7 December 2009 Oil & Gas European Oil Services
Page 32 Deutsche Bank AG/London
Figure 50: FID, Sprint to market and FEED contracts
awarded* to E&C companies (across our coverage
universe)
Figure 51: Split of offshore contracts* by FID, Sprint to
market and FEED for asset intensive companies under
our coverage
60%
62%
64%
66%
68%
70%
72%
74%
76%
78%
0
50
100
150
200
250
2004 2005 2006 2007 2008 2009
% S
prin
t to
mar
ket
Coun
t of c
ontr
acts
aw
arde
d
FEED/ EPCm FID
Sprint to market % Sprint to market (RHS)
60%
65%
70%
75%
80%
85%
0
10
20
30
40
50
60
70
80
90
100
2004 2005 2006 2007 2008 2009
% S
prin
t to
mar
ket
Coun
t of c
ontr
acts
aw
arde
d
FEED/ EPCm FID Sprint to market % Sprint to market
Source: Deutsche Bank, Company data; *We analyse the relative split by number of contracts vs. unit value given the latter is often not disclosed by the company Source: Deutsche Bank, Company data; *We analyse the relative split by number of contracts vs. unit value
given the latter is often not disclosed by the company
We leverage our exhaustive database of contracts to analyse, on aggregate, the proportion of projects represented by our classifications above (shown in figures 50 and 51) and deduce the following:
IOC/NOCs have been actively involved in STM projects during the last few years of high oil and gas prices incentivised by their relatively low marginal cost of production and speed with which first oil and/or gas may be monetised,
FIDs have played a key role in the growth of oil service company backlog particularly within the onshore segment; note an FID will generally possess a greater unit contract value than a STM and the above analysis does not capture this,
The reduction in aggregate number of contracts awarded across the sector will be driven by falling commodity prices and in addition (industry sources such as Pegasus Global would suggest) by IOC/NOCs consideration of marathon projects that offer longer term sustainable IRRs in place of STM. Indeed, the current delays in sanctioning FIDs are linked to this shift in investment criteria and some of the reasons outlined in the previous section,
Whilst this dynamic would have contributed to the relative decline across 2008/09 in STM, we note that awards of this nature have nevertheless continued despite deteriorating macro conditions and represent 65% of all contracts awarded this year. Figures 52 and 53 below show that this has been instrumental in sustaining the group’s revenue cover for 2009 and 2010 (calculations shown in Appendix G).
Figure 52: Evolution of 2009E revenue cover – the
group’s visibility for this year has improved significantly
Figure 53: 2010 revenue cover has in part been driven by
continued investment in sprint to market projects
55%60%65%70%75%80%85%90%95%
100%
Q3' 08 Q4' 08 Q1' 09 Q2' 09 Q3' 09
Cur
rent
yea
r rev
enue
cov
er (Y
)
Acergy SaipemSubsea 7 TechnipHistorical group average (04-07)
25%
35%
45%
55%
65%
75%
85%
Q3' 08 Q4' 08 Q1' 09 Q2' 09 Q3' 09
Forw
ard
year
reve
nue
cove
r (Y
+1)
Acergy SaipemSubsea 7 TechnipHistorical group average (05-07)
Source: Deutsche Bank, Company data Source: Deutsche Bank, Company data
STM awards been instrumental in sustaining the group’s revenue cover for 2009 and 2010

7 December 2009 Oil & Gas European Oil Services
Deutsche Bank AG/London Page 33
Whilst the future level of margin realisation on all contracts awarded this year has yet to materialise (we expand on this in the next section) the point to make is that as a result of continued appetite by IOC/NOCs to invest in FEED and sprint to market projects, the services have performed better than expected in being able to keep their resources utilised during a period of limited FIDs and heightened volatility in commodity prices.
The question is whether this dynamic will continue in the context of potentially weaker commodity prices and a renewed deterioration of the macro environment across the next 6 months. Figures 54 and 55 below show shallow and deepwater appraisal drilling activity and subsequent investment in shallow and deepwater subsea respectively. Typically we would expect a 1-2 year lag (although in some cases this can be several years if governments delay sanctioning) between appraisal drilling activity (with respect to those wells spudded successfully) and the start of a brownfield development life cycle.
Figure 54: Deepwater appraisal drilling should help fuel
2010/11 investment in related FEED work and sprint to
market projects across the E&C complex
Figure 55: Shallow water appraisal drilling should help
support 2010/11 investment in related FEED work and
sprint to market projects across the E&C complex
0
5,000
10,000
15,000
20,000
25,000
30,000
3,700
5,700
7,700
9,700
11,700
13,700
15,700
17,700
19,700
2005 2006 2007 2008 2009E 2010E 2011E
Cape
x ($
mn)
Dril
ling
days
Appraisal dril l ing days Subsea capex (RHS) FPSO capex (RHS)
-
2,000
4,000
6,000
8,000
10,000
12,000
14,000
3,700
13,700
23,700
33,700
43,700
53,700
63,700
73,700
83,700
93,700
103,700
2005 2006 2007 2008 2009E 2010E 2011E
Cape
x ($
mn)
Dril
ling
days
Apprailsal dri l ling days Subsea capex (RHS) FPSO capex (RHS)
Source: Deutsche Bank & Wood Mackenzie estimates. Source: Deutsche Bank & Wood Mackenzie estimates.
It is our belief that the upward shift in shallow water and deepwater appraisal drilling highlighted in the previous section will spur a proportionate increase in spend directed towards related FEED work and sprint to market projects (in particular deepwater subsea and facilities/FPSOs). As a result we expect 2010 revenue cover for oil service companies exposed to this type of investment (asset light and asset intensive companies alike) to remain robust despite further potential delays in FIDs across 2010.
Offshore E&C complex: SURF, FPSO, platform facilities and seabed surface investment set for recovery
We ‘slice’ our outlook for offshore E&C capex a number of ways in order to reveal the relative levels of investment across the global offshore complex. We focus on:
Shallow water (often termed conventional) vs. deepwater investment,
Deepwater by industry segment e.g. SURF, general infrastructure, facilities, FPSO, seabed related services,
Regional trends e.g. Brazil, Nigeria, Ghana, Angola, Egypt and GoM.
We expect 2010 revenue
cover for the oil service
group to be in line with
historic levels despite
uncertainty around the
timing of FIDs…
…however, this does not say
much for future levels of
topline growth and
evolution of margins across
the group

7 December 2009 Oil & Gas European Oil Services
Page 34 Deutsche Bank AG/London
Figure 56: Shallow water (conventional) vs. deepwater
global outlook
Figure 57: Global deepwater capex outlook split by
theme
0
20
40
60
80
100
120
140
2006 2007 2008 2009E 2010E 2011E
Glo
bal E
&C o
ffsho
re c
apex
(US
$ bn
)
Shallow w ater Deepaw ater
0
10
20
30
40
50
60
2006 2007 2008 2009 2010 2011
Cap
ex (U
S $
bn)
Fixed Platform FPSO Floater Subsea
Source: Deutsche Bank & Wood Mackenzie estimates. Source: Deutsche Bank & Wood Mackenzie estimates.
Figure 56 shows a material decline this year in shallow water capex particularly linked to a slow down in conventional activity in the North Sea, Gulf of Mexico and West Africa (Appendix H shows shallow water capex split by region). This will likely be attributed to the weaker commodity environment given the maturity of these types of fields that require relatively higher commodity prices to justify investment (particularly in regions with higher unit costs of production). Across 2010/11, we expect a moderate decline in shallow water capex which given the low barriers to entry and greater competition (particularly from Asian contractors) should see lower margins (we expand on this in the next section) realised for the oil service companies operating here.
Our 2010 forecast for deepwater capex is broadly flat vs. 2009 (shown above in figure 56) and is set to accelerate to a level in 2011 that is c. 40% higher than 2007/08 (peak year of deepwater investment). Deepwater SURF and FPSO investment appears to drive the bulk of this increase and assumes that FIDs are sanctioned from H2 2010 onwards. Figure 58 shows our deepwater capex outlook represented by region and the key countries in our analysis that appear to demonstrate capex growth.
Figure 58: Global deepwater capex outlook by region – Brazil, GoM and West Africa
appear to be the sweet spots
0
10
20
30
40
50
60
2005 2006 2007 2008 2009 2010
Dee
pwat
er c
apex
(US
D b
n)
West Africa(Angola,Ghana,Nigeria)
Gulf of Mexico Brazil SE Asia(Australia,India,Malaysia)
Europe(UK,Norway)
ROW(Egypt,Azerbaijan,Israel)
Source: Deutsche Bank & Wood Mackenzie estimates
Deepwater SURF and FPSO
investment is expected to
drive our positive outlook
for the subsea segment and
assumes that FIDs are
sanctioned from H2 2010
onwards

7 December 2009 Oil & Gas European Oil Services
Deutsche Bank AG/London Page 35
Middle East investment should continue to remain buoyant
Figure 59: ME outlook– faster than expected pace of
investment in Iraq would place upside pressure to our
forecast
Figure 60: Middle East outlook by theme
-
10
20
30
40
50
60
2006 2007 2008 2009 2010 2011
Cap
ex (U
SD
bn)
Qatar UAE Oman YemenSyria Iran Iraq IsraelSaudi Arabia Bahrain Kuwait
-
10
20
30
40
50
60
2006 2007 2008 2009 2010 2011
Cap
ex ($
bn)
Fixed Platform SubseaOnshore GTLLNG plant Refining and Petrochemicals
Source: Deutsche Bank & Wood Mackenzie estimates. Source: Deutsche Bank & Wood Mackenzie estimates.
Our recent field trip to the Middle East underpins Wood Mackenzie’s expectation for a structurally high level of investment from 2008 onwards. With the exception of Qatar (decline driven by LNG and Pearl GTL capex tailing off towards 2011), figure 59 shows the increasing levels of capex expected particularly in Saudi Arabia and UAE over the next two years namely in upstream oil and gas (primarily offshore) and to a lesser extent refining and general energy infrastructure. We should also start to see renewed capex in Iraq (Rumaila and Zubair oil fields) albeit that the timing of FID remains uncertain.
LNG investment poised for growth, prospects for floating LNG places upside pressure to our estimates
Figure 61: LNG capex outlook- Australia’s Gorgon at the front of the queue
-
2
4
6
8
10
12
14
2006 2007 2008 2009 2010 2011
Cap
ex (U
SD
bn)
Angola Australia Indonesia Nigeria Norway Peru Qatar Yemen
Source: Deutsche Bank & Wood Mackenzie estimates.
FID approval of Gorgon LNG earlier this year should fuel impressive capex growth in Australia across 2010-12. Elsewhere it appears FIDs are generally being pushed out beyond 2011 (with the exception of Indonesia PNG which WM expects to go ahead over the next 12 months). With regards to FLNG, we expect Shell to begin material investment in its first phase next

7 December 2009 Oil & Gas European Oil Services
Page 36 Deutsche Bank AG/London
year and whilst WM have yet to capture the related capex in their LNG model, we believe this places upside pressure to our forecast.
European outlook lacklustre; sprint to market and OPEX spend in UK and Norway robust
Figure 62: Norway, FSU and Russia capex outlook
-
10
20
30
40
50
60
70
80
2006 2007 2008 2009 2010 2011
Cap
ex (U
SD
bn)
Norway Russia Azerbaijan Georgia Kazakhstan Kyrgyzstan Turkmenistan Uzbekistan Ukraine
Source: Deutsche Bank & Wood Mackenzie estimates.
Europe (along with US depicted below) has witnessed some of the sharpest declines in capex across 2009/08. However, despite the high costs and technical challenges, major projects in Norway and FSU continue to attract relatively high levels of industry interest. Previous years' capex budgets set by IOCs in UK and Norway (which shows only moderate declines vs. 2009) confirm the continued attraction of their fiscal terms. Whilst timing of FIDs in all these regions appears uncertain, we expect continued investment in sprint to market projects and OPEX projects. With regards the latter, the long term nature of an operating and maintenance contract makes it a defensive theme despite the volatility in commodity prices.
Global outlook sees Brazil, Ghana and Angola as clear outperformers; upside risk to our estimates linked to Gulf of Mexico and the Caspian
WM expect Ghana (Jubilee), Angola (Blocks 17 and 31) and Brazil (Tupi) to undertake FIDs by H2 2010 at the latest. Accelerated investment in the Gulf of Mexico and the Caspian will predominantly be a function of the 2010 capital budgets decided upon by IOCs across Q4 this year. Note that whilst Canada oil sands is expected to continue to decline across our forecast horizon, the Kearl project should see the next phase of its expansion underpinned by Exxon’s ambitious $7.5bn plan over the next 4 years.
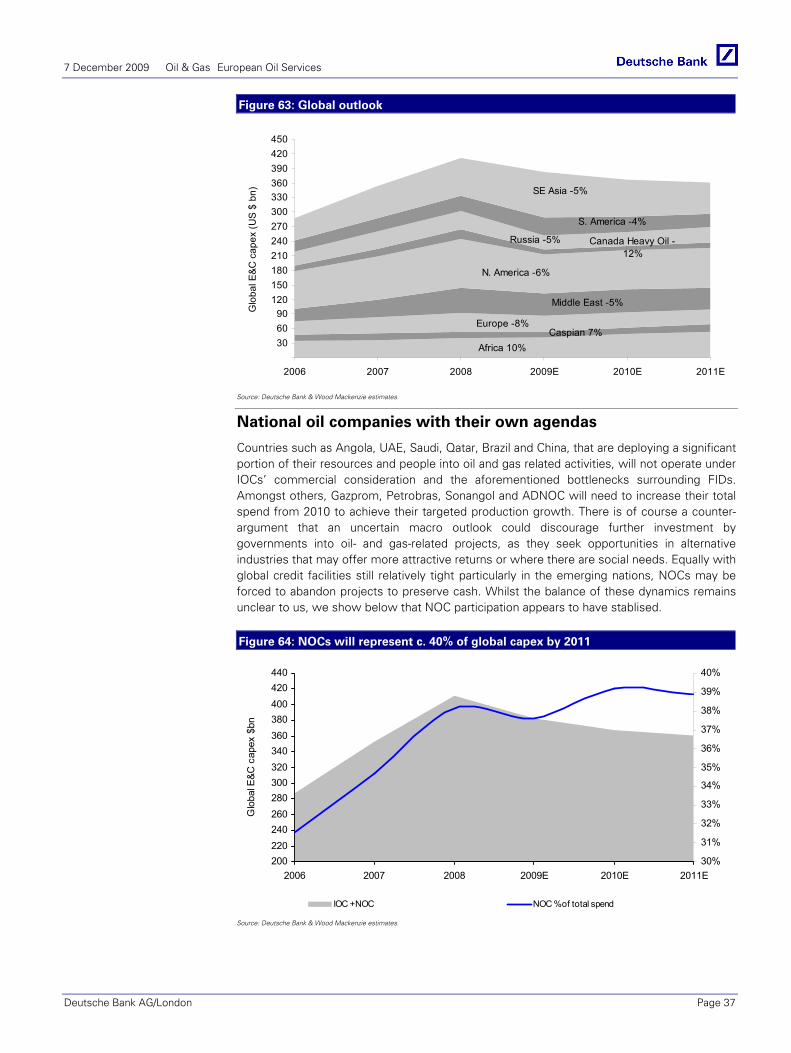
7 December 2009 Oil & Gas European Oil Services
Deutsche Bank AG/London Page 37
Figure 63: Global outlook
Africa 10%Caspian 7%
Europe -8%
Middle East -5%
N. America -6%
Canada Heavy Oil -12%
Russia -5%
S. America -4%
SE Asia -5%
306090
120150180210240270300330360390420450
2006 2007 2008 2009E 2010E 2011E
Glo
bal E
&C c
apex
(US
$ bn
)...
Source: Deutsche Bank & Wood Mackenzie estimates.
National oil companies with their own agendas
Countries such as Angola, UAE, Saudi, Qatar, Brazil and China, that are deploying a significant portion of their resources and people into oil and gas related activities, will not operate under IOCs’ commercial consideration and the aforementioned bottlenecks surrounding FIDs. Amongst others, Gazprom, Petrobras, Sonangol and ADNOC will need to increase their total spend from 2010 to achieve their targeted production growth. There is of course a counter-argument that an uncertain macro outlook could discourage further investment by governments into oil- and gas-related projects, as they seek opportunities in alternative industries that may offer more attractive returns or where there are social needs. Equally with global credit facilities still relatively tight particularly in the emerging nations, NOCs may be forced to abandon projects to preserve cash. Whilst the balance of these dynamics remains unclear to us, we show below that NOC participation appears to have stablised.
Figure 64: NOCs will represent c. 40% of global capex by 2011
200220240260280300320340360380400420440
2006 2007 2008 2009E 2010E 2011E
Glo
bal E
&C c
apex
$bn
30%
31%
32%
33%
34%
35%
36%
37%
38%
39%
40%
IOC + NOC NOC % of total spend
Source: Deutsche Bank & Wood Mackenzie estimates.

7 December 2009 Oil & Gas European Oil Services
Page 38 Deutsche Bank AG/London
Analysis of contracts awarded by NOCs (either alone or in collaboration with each other) in figure 65 confirms the above trend. ONGC, SINOPEC, CNOOC and Petrobras are some of the NOCs that we believe will emerge as key players in the longer term demand for oil services. Whilst IOCs may prolong investment decisions for reasons already outlined above, we argue that the structural increase of NOC investment could set a floor to prices that IOCs will have no choice but to accept.
Figure 65: Pure NOC investment (NOCs working alone or with each other) will emerge
as a key constituent of oil services’ backlog longer term making them potentially a
‘price setter’ in the context of a global capex recovery
5%
10%
15%
20%
25%
30%
0
50
100
150
200
250
2004 2005 2006 2007 2008 2009
% N
OC
Coun
t of c
ontr
acts
aw
arde
d
NOC IOC Mixed consortium % NOC (RHS)
Source: Deutsche Bank
Whilst IOCs may prolong
investment decisions for
reasons outlined above, we
argue that the structural
increase of NOC investment
could set a floor to prices
that IOCs will have no
choice but to accept.

7 December 2009 Oil & Gas European Oil Services
Deutsche Bank AG/London Page 39
E&C industry dynamics and relative profitability We combine our projections in the last section with strategic analysis of the segment to derive our absolute and relative outlook of profitability across the E&C complex. The themes we believe will provide out-performance (in terms of capex and margin) across the near to medium term are frontier developments, Middle East, LNG (and associated infrastructure) and engineering and project management. Shallow water/conventional OPEX and deepwater facilities/FPSOs/subsea both share impressive capex outlooks but against the potential of excessive margin decline near term this leaves us with a broadly neutral view. Themes we expect will under-perform are shallow water/conventional CAPEX, oil sands and refining and petrochemicals.
Given company management’s general lack of guidance regarding the level of pricing that has been achieved on more recently signed contracts and the apparent lag on company profitability (we show it can be anything up to three years) we believe this places downside risk on our renewed margin forecasts (which, on aggregate, assumes some contraction across 2009-12). Variations to this trend will clearly depend on each company’s ability to differentiate both within the respective industry and through the operational efficiencies, strategy and business model underpinning it. We expand on this in the next section.
The ‘invisible’ time lag places downside risk on 2010 margins
Forecasting the rate of margin expansion/contraction for each company and its respective sub-segments is difficult given the European E&C contractors will generally recognise profits across the life of the project with little or no disclosure regarding the pace and level of margin and contingency released. Figure 66 below shows that the bulk of the profits booked on a contract will typically occur during the latter half of a project.
Figure 66: Typical profit recognition on a capex project linked to the pace of physical
completion of the development (terms explained in Appendix S)
0.0
0.1
0.2
0.3
0.4
0.5
0.6
0 1 2 3 4 5 6 7 8 9 10 11 12 13 14 15 16 17 18 19 20 21 22 23 24 25 26 27 28 29 30 31 32
Month
Tota
l inst
alle
d co
st (T
IC) r
e-ba
sed
Front end engineering Project management contract (PMC) Detailed engineering
Procurement (m) Construction (m) Installation (m)
5%7%
20%
24%
31%
14%
Absolute percentage contribution from each phase
Source: Deutsche Bank; m = management;
With the exception of the
Middle East, other regions
highlighted in our previous
section are more difficult to
apply strategic analyses on
given each will comprise an
array of different industries
and services

7 December 2009 Oil & Gas European Oil Services
Page 40 Deutsche Bank AG/London
We leverage our database of contracts to show in figure 67 how the average contract life across the E&C group has changed over time. We exclude the drilling segment given that day rates signed on vessels will generally not vary and possess different terms and conditions.
Figure 67: Average contract term length since 2004 for the group appears to be rising
3.1
2.9
2.8
2.9
2.7
2.9
2.5
2.6
2.7
2.8
2.9
3.0
3.1
3.2
2004 2005 2006 2007 2008 2009YTD
Ave
rage
con
trac
t du
ratio
n
Source: Deutsche Bank, Company data; Note: *The above analysis is based on contracts disclosed by companies in their press releases 2004-09 YTD and weighted by value. In the cases of Amec and Wood Group contract count has been used in place of monetary weighting given values are not reported for all contracts
Figures 67 and 68 suggest that the current earnings lag for the sector could be anything up to three years from the point of contract award. Note that the nature of the contract be it lump sum or cost plus and also the industry and type of service offered (e.g. opex vs. capex) will determine the full extent of this dynamic by company. Nevertheless the result is that despite the sharp fall in commodity prices across 2008/09, margins, on aggregate for the sector continued to remain steady throughout Q4’08-Q2’09.
Figure 68: Given the profit lag linked to longer term contracts, the sharp fall in
commodity prices across 2008/09 should see a delayed reaction to bottom lines
across the E&C players on aggregate
-40%
-20%
0%
20%
40%
60%
80%
2004
2005
2006
2007
2008
2009
Q1
2009
Q2
2009
Q3
2009
Q4E
2010
E
2011
E
y/y
chan
ge
35
45
55
65
75
85
95
105
Oil p
rice
($)
Offshore construction avg. EBIT margin change (LHS) Onshore construction avg. EBIT margin change (LHS)Avg. Brent oil price (RHS)
Source: Deutsche Bank, Company data

7 December 2009 Oil & Gas European Oil Services
Deutsche Bank AG/London Page 41
Given it is unclear what level of pricing has been achieved on more recently signed contracts and this apparent lag on company profitability we believe this places downside risk on our estimates (which already assume some degree of margin contraction). Exceptions to this trend will clearly depend on each company’s ability to differentiate both within the respective industry and through the operational efficiencies, strategy and business model underpinning it. We expand on this in the next section.
Profitability outlook for the E&C sector: mixed performance
As with previous years we form a strategic analysis of the industry segments (margin derivation detailed in Appendices Q and R) and combine this with our Wood Mackenzie forecast for capex to derive our absolute and relative outlook of profitability by theme. The relative levels of margin contraction are intuitively based on the structural differences of each industry e.g. level of complexity, barriers to entry, number of players and also the quality and degree of asset intensity it carries. We show this below in figure 69
Figure 69: Current expectations for revenue and margin 2009-11E
-40%
-35%
-30%
-25%
-20%
-15%
-10%
-5%
0%
5%
10%
15%
20%
25%
30%
-350 -300 -250 -200 -150 -100 -50 -
Absolute margin dow nside 2009-11E(bps)
Aver
age
cape
x gr
owth
200
9-11
E
LNG
Deepw ater subsea
Refining & Petrochemicals
Deepw ater Facilities
Frontier Developments
Onshore UpstreamOil Sands
GTL
Regas
Middle EastShallow w ater (capex)
Negative margin outlook vs. 2008 study
Decrease in capex momentum vs. 2008 study
Shallow w ater (opex)
Source: Company data, Deutsche Bank & Wood Mackenzie estimates
With the above in mind, we highlight below which themes should outperform/underperform across the oil services chain across 2010/11:-
Shallow water/conventional CAPEX (underperform): margin compression based on the structural weakness of this theme coupled with a marked slowdown in capex (despite continued activity in sprint to market projects).
Oil sands (underperform): poor capex outlook together with significantly lower margins based on weak/supply demand fundamentals in Canada (comprises the bulk of oil sands activity).
Shallow water/conventional OPEX (in-line): positive outlook in spend offset by structural weakness of industry not helped by various contract clauses that gives the client an option to change the fee structure and/or contractor itself (new entrants have accelerated over the last 12 months).
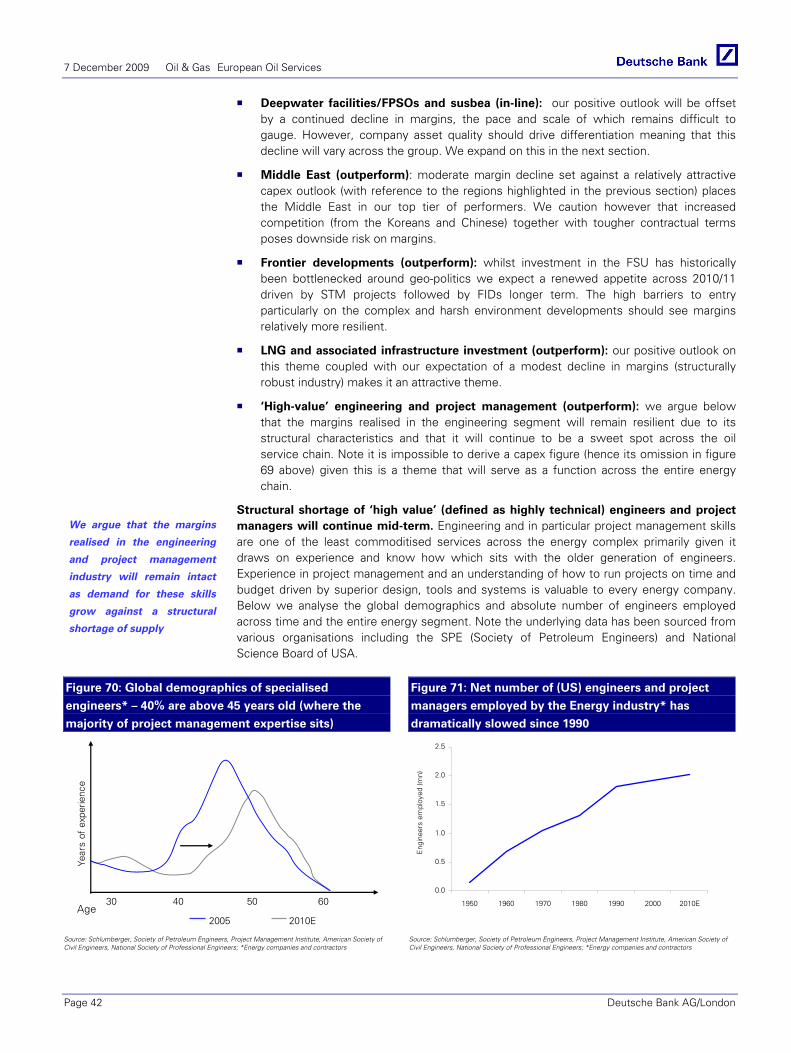
7 December 2009 Oil & Gas European Oil Services
Page 42 Deutsche Bank AG/London
Deepwater facilities/FPSOs and susbea (in-line): our positive outlook will be offset by a continued decline in margins, the pace and scale of which remains difficult to gauge. However, company asset quality should drive differentiation meaning that this decline will vary across the group. We expand on this in the next section.
Middle East (outperform): moderate margin decline set against a relatively attractive capex outlook (with reference to the regions highlighted in the previous section) places the Middle East in our top tier of performers. We caution however that increased competition (from the Koreans and Chinese) together with tougher contractual terms poses downside risk on margins.
Frontier developments (outperform): whilst investment in the FSU has historically been bottlenecked around geo-politics we expect a renewed appetite across 2010/11 driven by STM projects followed by FIDs longer term. The high barriers to entry particularly on the complex and harsh environment developments should see margins relatively more resilient.
LNG and associated infrastructure investment (outperform): our positive outlook on this theme coupled with our expectation of a modest decline in margins (structurally robust industry) makes it an attractive theme.
‘High-value’ engineering and project management (outperform): we argue below that the margins realised in the engineering segment will remain resilient due to its structural characteristics and that it will continue to be a sweet spot across the oil service chain. Note it is impossible to derive a capex figure (hence its omission in figure 69 above) given this is a theme that will serve as a function across the entire energy chain.
Structural shortage of ‘high value’ (defined as highly technical) engineers and project managers will continue mid-term. Engineering and in particular project management skills are one of the least commoditised services across the energy complex primarily given it draws on experience and know how which sits with the older generation of engineers. Experience in project management and an understanding of how to run projects on time and budget driven by superior design, tools and systems is valuable to every energy company. Below we analyse the global demographics and absolute number of engineers employed across time and the entire energy segment. Note the underlying data has been sourced from various organisations including the SPE (Society of Petroleum Engineers) and National Science Board of USA.
Figure 70: Global demographics of specialised
engineers* – 40% are above 45 years old (where the
majority of project management expertise sits)
Figure 71: Net number of (US) engineers and project
managers employed by the Energy industry* has
dramatically slowed since 1990
30 40 50 60
Year
s of
exp
erie
nce
2005 2010EAge
0.0
0.5
1.0
1.5
2.0
2.5
1950 1960 1970 1980 1990 2000 2010E
Eng
inee
rs e
mpl
oyed
(mn)
Source: Schlumberger, Society of Petroleum Engineers, Project Management Institute, American Society of Civil Engineers, National Society of Professional Engineers; *Energy companies and contractors Source: Schlumberger, Society of Petroleum Engineers, Project Management Institute, American Society of
Civil Engineers, National Society of Professional Engineers; *Energy companies and contractors
We argue that the margins
realised in the engineering
and project management
industry will remain intact
as demand for these skills
grow against a structural
shortage of supply

7 December 2009 Oil & Gas European Oil Services
Deutsche Bank AG/London Page 43
Figure 70 above shows the demographic profile of engineers globally and the deteriorating level of more experienced project management (classified broadly as above 40 years old) over time. This has not surprisingly been driven by the lacklustre growth in recruitment since broadly the mid 1990s (illustrated in Figure 71). Contractors have traditionally treated engineering as a ‘loss leader’ (arguably to a lesser degree in the more complex and technically challenging areas of energy) in that it is a means to get the larger EPIC contract where procurement, construction and installation are the most profitable segments. This, in part, explains why over the years the market for engineering and project management services became tighter – as engineering skill and training gravitated towards the more commercial and specialised parts of the oil life cycle.
Demand for specialised engineering and project management services expected to grow. Below we list some of the dynamics we believe will underpin the demand for this theme
Against a backdrop of lower and more volatile commodity prices, IOCs in particular will be under pressure from their shareholders to execute their current projects successfully not least to ensure they meet IRR targets.
IOC projects are getting more complex (as highlighted in the last section, access to reserves are predominantly situated in the deepwater as well non-conventional basins) – this is driving the need for more technical based engineering and project management excellence.
In the context of FID delays, IOCs will continue to invest in optimising the engineering design ahead the ultimate award (on complex projects particularly this has led to an overall decline in the estimated cost e.g. Gorgon)
Given the slowdown in FIDs and the potential impact this will have on reserve replacement mid-longer term, IOC and NOCs have placed greater emphasis on increasing productivity of their existing oil and gas portfolios.
Energy companies generally prefer to tender the FEED contract separately from the rest of the project phases to ensure that the contractor is offering an objective solution not linked to an internal product that could potentially be used in latter parts of the development.
Having shed the bulk of their engineering resource across the last two decades, Energy companies are arguably left with no choice but to rely heavily on service companies to achieve the above.
The structural nature of this theme is also linked to the fact that it is not asset intensive and less commoditised. We believe energy companies, whilst expecting contractors’ mark up on their engineers to come down will not be as aggressive as perhaps elsewhere in the oil service chain. This will particularly hold for those contractors that can differentiate in the quality and experience of their engineers and project managers given they are less transactional and have more a value/relationship based service offering. This is in contrast to, for example, procurement, installation and construction, which is asset intensive, more transactional/commoditised and where short-term supply/demand dynamics and levels of contingencies would have made margins far more cyclical across the last few years. This is shown below in Figure 72, which depicts the range of engineering margins vs. other parts of the oil service chain.
We argue that Energy
companies will be least
reluctant to cut corners
across the engineering
design phases of a project
development given
a) They will prefer to partner
with engineering excellence
(history has shown that poor
design and project
management will lead to
spiralling costs further on
and ultimately delays in
production) and
b) It represents a small
portion of the total project
cost as shown in figure 66
above.

7 December 2009 Oil & Gas European Oil Services
Page 44 Deutsche Bank AG/London
Figure 72: Engineering margin is less cyclical than more commoditised parts of the oil
service chain such as installation and construction*
0.0%
2.0%
4.0%
6.0%
8.0%
10.0%
12.0%
14.0%
16.0%
18.0%
20.0%
2005 2006 2007 2008 2009E 2010E 2011E 2012E0.0%
2.0%
4.0%
6.0%
8.0%
10.0%
12.0%
14.0%
16.0%
18.0%
20.0%
Margin range of sector* Engineering margin **
Source: Deutsche Bank; Company data, *excludes drillers; ** Average of Amec’s and Wood Group’s margin

7 December 2009 Oil & Gas European Oil Services
Deutsche Bank AG/London Page 45
Implications for companies’ earnings outlook 2010 and beyond In this section, we place each company’s industry and regional ‘blueprint’ against our global exploration and E&C projections outlined above. Together with our unique framework that differentiates companies on a number of metrics we model the company’s earnings outlook to 2012 (forecast horizon has been extended from 2011).
On aggregate, we forecast topline growth for the group (9% compounded 2009-12E) against a more cautious outlook on margin (c. 75bps reduction in EBITDA margin). Net, our 2009-12 average earnings outlook for the sector is 8%. We believe Saipem, Amec and Seadrill are optimally placed across the oil services chain and demonstrate superior earnings growth. Those appearing at the weaker end of the industry spectrum based on their relatively poor positioning and business model include Wood Group, Aker Solutions and Subsea 7.
i. Company positioning across the exploration and E&C service spectrum
In Figure 73 this is demonstrated, albeit somewhat superficially by showing the companies’ topline ‘blueprint’ across the energy services chain. Our estimate of each company’s absolute exposure is given as a percentage of 2010E group revenue and is based on conversations with management, application of our contract database and the use of divisional splits where given. Note the industry ranking shown along the right of Figure 73 is based on our assessment of capex and margin in the previous sections and these dynamics are considered together. Regional ranking is based on our assessment of capex alone given it is more difficult to apply strategic analysis (each region will comprise a different array of industries and services). Other assumptions are listed below.

7 Decem
ber 2009 O
il & G
as European O
il Services
Page 46
Deutsche B
ank AG
/London
Figure 73: Company positioning by theme (X=under-performer, XX=neutral, XXX=out-performer)
AcergyAker
SolutionsAmec Lamprell Petrofac Saipem Seadrill Subsea 7 Technip Tecnicas Wood Group
Estimated segment capex 2010E ($ bn)
DB outlook 2010-12E
Onshore drilling 6% X
Shallow water drilling 1% 31%X
Deepwater drilling XX
Ultra deepwater drillingXXX
Surface servicing 7% 8% 41 X
Surface equipment 20% 29 X
Subsurface servicing 7% 4% 27 X
Subsurface equipment and products 6% 68 X
Newbuiilds 22% 3 X
Upgrades 60% 2 XXX
Others 6% 4 XX
Onshore/offshore operations and maintenance (OPEX)
10% 5% 16% 26% 5% 5% 12% 10
XX
Deepwater SURF 65% 23% 20% 67% 35% 10% 9XX
Deepwater Facilities 10% 4% 12% 4% 8% 7% 33XX
Shallow water SURF/facilities 25% 10% 4% 4% 28% 7% 5% 76 X
Frontier Developments 5% 4% 10% 12% 15XXX
LNG 5% 14% 20% 5% 7 XXX
Re-gas terminals 5% 7 X
Refining & petrochemicals 5% 10% 15% 70% 8% 36 X
Onshore facilities & infastructure 5% 4% 64% 17% 10% 20% 16% 161 X
Gas to liquids 3 X
Heavy Oil sands: extraction 12% 5% X
Heavy Oil sands: refining 5% X
Power 17% 19% XX
Process and others 12% 40% X
Total (100%) (100%) (100%) (100%) (100%) (100%) (100%) (100%) (100%) (100%) (100%) $ 616 bn
Group revenues 2010E ($bn) 2.2 9.8 4.8 0.4 4.2 15.7 3.8 2.2 8.7 4.8 4.6
"High - value" engineering and project management (darkest shade = pure play)
XXX
Engineering & Construction services
Exploration: Energy construction services
Non oil and gas
Exploration and appraisal: drilling services
55%
76
7%
10
Exploration: associated well head services
Source: Deutsche Bank, Company data

Deutsche B
ank AG
/London P
age 47
7 Decem
ber 2009 O
il & G
as European O
il Services
Figure 74: Company positioning by region (X=under-performer, XX=neutral, XXX=out-performer)
Acergy Aker Solutions Amec Lamprell Petrofac Saipem Seadrill Subsea 7 TechnipTecnicas Reunidas
Wood GroupEstimated E&C
capex 2010E ($bn)DB outlook 2010-
12E
Africa 37% 2% 1% 26% 51% na 29% 19% 6% 2% 49.6 XXX
Middle East 4% 2% 9% 28% 15% na 42% 33% 3% 48.0 XXX
Russia/FSU/Caspian 23% 1% 3% 10% 7% na 2% 10% 1% 41.3 XX
Europe 33% 40% 34% 10% 24% 12% na 29% 10% 37% 29% 30.8 XX
North America 5% 5% 45% 73% na 7% 7% 38% 79.5 X
South America 18% 5% 12% na 28% 7% 3% 12% 31.1 XXX
SE Asia 7% 21% 5% 5% 12% 3% na 7% 8% 11% 10% 76.9 XXX
Canada (Heavy Oil) 12% na 5% 5% 10.0 X
(Total) (100%) (100%) (100%) (100%) (100%) (100%) na (100%) (100%) (100%) (100%) ($367bn)
Group revenues 2010E ($bn)
2.2 9.8 4.8 0.4 4.2 15.7 3.8 2.2 8.7 4.8 4.6
Source: Deutsche Bank, Company data
Assumptions behind figure 73 – Company positioning by theme:
Amec: Earth & Environmental and Process divisions have been included under ‘Non oil and gas’ segment.
Petrofac: Energy Developments division has been excluded.
For the drilling segment, % detailed reflects average of 2009-12 revenue share (so as to capture backend loaded newbuild program).
Wood Group: GTS division has been included under Power.
‘Exploration: associated wellhead services’ capex encompasses exploratory, appraisal and development activities.
Global 2010 capex forecast of $616bn excludes seismic capex of $15bn.
Assumptions behind figure 74 – Company positioning by region:
Petrofac: Energy Developments division has been included.
Seadrill: rigs are deployed all over the world and are not allocated to a specific region.

7 December 2009 Oil & Gas European Oil Services
Page 48 Deutsche Bank AG/London
ii. Review of our ‘fitness’ league table for the Euro OFS
Figure 75 below is an update of our framework initiated in January 2009 which leverages our exhaustive contract and asset database to access the Euro Oil Services. We have added two more company metrics:-
Execution capability: whilst this is a subjective assessment of each company’s ability to deliver, we base it on managements’ track record of performance (including anecdotal evidence of project failure if and when they were not listed on the stock market).
Asset quality/differentiation: we differentiate asset intensive companies by their relative and absolute exposure to superior types of vessels. For the offshore drillers this will be represented by ultra-deepwater drilling capability and the latest generation of rigs that are also younger (in contrast to shallower water, older assets). For offshore E&C companies this will be in the form of a ‘multi-purpose’ ship that possesses all or some of the following characteristics: heavy lift capacity, rigid and flexible pipe-laying, wide range of pipe diameter that can be installed, accommodation units, local content and yard space (in order to accommodate the asset) and pipe-laying depth potential (e.g. ultra-deep). In Appendix I we detail each company’s fleet with a focus on these capabilities that together on single vessel should yield a superior return given its high barriers to entry (multi-purpose assets are expensive to build and highly complex). Finally, we differentiate asset light companies by the degree of specialised engineering and project management resource and/or fabrication complexity.
Figure 75: Revised ‘fitness’ league table for the Euro oil services 2010 outlook (X= low; XXX = high)
Backlog longevity*
Asset/ resource utilisation risk**
Diversified ***
Balance sheet strength****
Contract strategy*****
NOC exposure ******
Execution capability
Asset quality/ differentiation
*******
Overall 'fitness' level
Saipem XX XXX XXX XXX XXX XXX XXX XXX 23
Amec XXX XXX XXX XXX XX X XXX XXX 21
Seadrill XXX XXX XX X XXX XXX XXX XXX 21
Technip XX XXX XX XXX XXX XX XX XXX 20
Tecnicas Reunidas XX XXX X XXX XXX XXX XXX X 19
Petrofac XX XXX XX XX XXX XX XXX X 18
Lamprell X XX XX XXX XXX XX XXX X 17
Acergy XX XX X XX XXX XX XX XX 16
Wood Group XX XX XX X X XX XXX XX 15
Aker Solutions XX XX XX X X X XX XXX 14
Subsea 7 XX XX X X XX XX XX XX 14 Source: Deutsche Bank; * Average of 2008/09. Refer to Appendix J for details, **X contribution to overall fitness is inverted. Refer to Appendix K for detailed analysis; ***Refer to figures 73 and 74 for details, **** Refer to Appendix L for gearing analysis, *****Average of 2008/09. Refer to Appendix M for detailed analysis of contract schedules of companies; ******Average of 2008/09. Refer to Appendix N for details; ******* Refer to Appendix I for detailed analysis of companies’ offshore fleet .
We combine the above metrics and place an equal weighting to each to arrive at an overall measure of ‘fitness’ for the company. Each of these assessments should not be viewed stand alone but collectively will form a basis of differentiation. Note the logic behind their choice is expanded on in our note titled ‘Clean Slate’ published Jan’09.
Our renewed earnings outlook: 8% growth (2009-12E) for the group
Whilst the outcome of analyses i) and ii) is not necessarily easy to quantify they serve as a critical tool in terms of:
Understanding the drivers behind our company earnings forecasts and current revisions,

7 December 2009 Oil & Gas European Oil Services
Deutsche Bank AG/London Page 49
Capturing some of the downside risks associated with the current macro and credit environment (and more specifically its impact on the rate of topline and margin change) and in turn,
Justifying the valuation discount/premium each company should trade on relative to our sector benchmark. We expand on this further in the next section (company overview and key recommendations).
We detail the implications of our industry and company analyses in figures 76 and 77 below which shows a summary of our earnings adjustments and outlook. Note we have extended our forecast horizon to 2012.

7 Decem
ber 2009 O
il & G
as European O
il Services
Page 50
Deutsche B
ank AG
/London
Figure 76: Summary of earnings adjustments and outlook summary
Net income change (%)
2009E 2010E 2011E 2009E 2010E 2011E Avg. 2009-11E
Acergy 3.9% 0.0% 0.9% 111 127 54 -7.6% 5.5% 12.8% -351
Robust backlog cover (62%) for 2010 driven by STMs (86% of 2009 contracts won) sees limited downside risk on 2010 consensus. DB positive outlook on deepwater SURF should drive impressive revenue recovery 2011/12. Upside risk linked to FIDs accelerating early 2010 (vs. DB expectations of H2).
Lag effect of lower priced STM contracts signed on assets that are structurally weaker (mid-tier) should see acute margin compression near to medium term. Expect margins to stabilise from a lower base. Reasons why they should remain relatively depressed (even if FIDs occur faster than expected) are due to i) increasing supply of mid-tier assets (ship conversions emerging from Asia and Europe) coming online across 2011/12 ii) lower contingencies in contracts than previous years (in part due to IOC/NOCs reluctance to revert to peak-cycle terms and conditions) iii) lower priced STM contracts still being executed upon across 2010-11 (average contract life: 2.7 yrs).
Aker Solutions
0.0% 0.7% -5.1% 0 25 -7 -0.8% -4.2% 1.4% -87
DB positive outlook on E&PM, frontier developments and deepwater subsea should drive robust backlog cover (in 2009: 73%/23% STM and FEED respectively). Lacklustre group outlook linked to relatively low market share across the oil services chain (exception being subsea, products and technologies), slow down in manufacturing products and technologies and process segments.
Relatively high exposure to engineering and project management coupled with high asset quality (manufacturing of subsea and installation vessels) should see margins stay relatively resilient helped also by implementation of impressive operational efficiencies.
AMEC 0.0% 0.0% 0.0% 0 0 0 0.0% 12.9% 8.5% 35
Diversification beyond oil and gas and expansion into new markets as well as increasing market share are all positive drivers of topline. High absolute exposure to engineering and project management.
Engineering and project management exposure coupled with positive impact of operational efficiencies and KPIs in contracts should help grow margins.
Lamprell 6.4% -1.1% 12.1% -8 50 50 6.7% 10.3% 11.6% -42
Increase in revenue forecast linked to expectation of new contract signatures particularly in Middle East newbuild and general energy infastructure (windfarms - see Appendix P which gives an industry outlook on regional capacity expectations) - driven by DB positive outlook on energy construction services.
Margin contraction linked to weak supply/demand fundamentals (Asia yards under-cutting price). However, high barriers to entry in Middle East and strong relationships with clients should see margins stabilise from a lower base.
Petrofac -0.4% -11.5% -0.2% -155 -151 -369 -5.7% 15.0% 15.0% 79
Robust backlog cover driven by FIDs awards this year that should see limited risk on 2010 consensus. DB positive outlook on Middle East should drive impressive revenue growth.
Margins expected to stay relatively resilient. However, risk of poor execution on lump sum contracts and potential of more aggressive pricing from Asian contractors in the region places downward pressure on long term margins.
Saipem 0.0% -0.5% 4.9% 0 -25 -70 -0.8% 9.8% 5.8% 137
Diversification across drilling and E&C drives sector leading backlog cover for 2010. Top three market share in several DB preferred segments and regions (50% of 2009 contract wins are FIDs and we believe this relative mix will be maintained) should drive impressive revenue growth.
Offshore construction margins will remain resilient given relatively high asset quality and differentiation. Uplift in 2012 based on new assets coming online that should generate higher returns given their complexity and multipurpose capability (yields better economies of scale to client). Onshore construction margins will be robust given high exposure to engineering and project management. Offshore drilling margins should increase as higher DBe day rates are crystallised on Saipem rigs coming off contract.
Outlook summary (based on conclusions from figures 73-75) 2009E-12E growth/(decline) outlook
Revenue growth/ decline
(CAGR 09E-12E)
EBITDA margin movement
(09E-12E) (bps)Basis to revenue outlook Basis to margin outlook
EBITDA margin change (bps)
Revenue change (%)
Changes to forecasts
Net income growth/ decline(CAGR
09E-12E)
Source: Deutsche Bank

Deutsche B
ank AG
/London P
age 51
7 Decem
ber 2009 O
il & G
as European O
il Services
Figure 77: Summary of earnings adjustments and outlook summary continued…..
Net income change (%)
2009E 2010E 2011E 2009E 2010E 2011E Avg. 2009-11E
Seadrill 0.0% -0.1% 0.0% 0 -3 1 -1.2% 20.9% 14.4% -33
Sector leading backlog cover linked to long term drilling contracts. Postive DB outlook on deepwater should see utilisations remain robust longer term.
High absolute exposure to deepwater should support margins longer term underpinned by our positive outlook on day rates in this segment.
Subsea 7 5.7% 0.7% 0.0% 115 54 69 6.6% 0.8% 8.1% -376
Robust backlog cover (57%) for 2010 driven by STMs (91% of 2009 contracts won) sees limited downside risk on 2010 consensus. DB positive outlook on deepwater SURF should drive impressive revenue recovery 2011/12. Upside risk linked to FIDs accelerating early 2010 (vs. DB expectations of H2).
Lag effect of lower priced STM contracts signed on assets that are structurally weaker (mid-tier) should see acute margin compression near to medium term. Expect margins to stabilise from a lower base. Reasons why they should remain relatively depressed (even if FIDs occur faster than expected) are due to i) increasing supply of mid-tier assets (ship conversions emerging from Asia and Europe) coming online across 2011/12 ii) lower contingencies in contracts than previous years (in part due to IOC/NOCs reluctance to revert to peak-cycle terms and conditions) iii) lower priced STM contracts still being executed upon across 2010-11 (average contract life: 3.3 yrs).
Technip 0.5% 8.9% 5.0% 52 -77 8 4.2% -0.1% 4.2% -136
Diversification across E&C drives robust backlog cover (67%). Top three market share in several DB preferred segments should drive impressive revenue growth (of 2009 contracts: 52% STMs, 10% FIDs, 38% FEEDs - we believe this relative mix will be maintained)
Combination of mid and high tier assets means that there will be some lag effect of lower priced STM contracts on assets that should yield lower margins in subsea. High level of complexity (through superior technologies and engineering) should see robust margins in onshore and offshore segments. Overall, we expect margins to stabilise from a (moderately) lower base.
Tecnicas Reunidas
0.0% 0.0% 0.0% 0 0 0 0.0% 12.7% 11.7% 0
Robust backlog cover driven by FIDs awards this year that should see limited risk on 2010 consensus. DB positive outlook on Middle East should drive impressive revenue growth
Margins expected to stay relatively resilient. However, risk of poor execution on lump sum contracts and potential of more aggressive pricing from Asian contractors in the region places downward pressure on long term margins.
Wood Group -7.0% -13.7% -12.5% -14 -100 -96 -25.7% 1.2% 2.1% -62
Well support segment geared to US rig count; we assume more exxagerated decline in 2009 and slow recovery in 2010/11. GTS business weaker than expected due to slow down in orders linked to macro environment - outlook remains lacklustre. High absolute exposure to engineering and project management should help drive recovery in 2011/12. Near term however, we expect this division to underperform peers.
Lower mark up on engineering and project management against a higher fixed cost base (initiatives around operational efficiencies remain limited) drives margin contraction 2009-11 and relative underperformance vs. comparable peers (whom are forecasted to grow margins near to medium term). We expect margins to stabilise in GTS and Well Support divisions albeit from a lower base. With regards to the latter, reovery tied to pace of pick up in US rig count - we expect moderate EBIT growth 2009-12.
Group average
0.8% -1.5% 0.5% 9.1 - 9.0 - 32.6 -2.2% 7.7% 8.7% -76
Outlook summary (based on conclusions from figures 73-75) 2009E-12E growth/(decline) outlook
Revenue growth/ decline
(CAGR 09E-12E)
EBITDA margin movement
(09E-12E) (bps)Basis to revenue outlook Basis to margin outlook
EBITDA margin change (bps)
Revenue change (%)
Changes to forecasts
Net income growth/ decline(CAGR
09E-12E)
Source: Deutsche Bank

7 December 2009 Oil & Gas European Oil Services
Page 52 Deutsche Bank AG/London
Sector valuation and company winners and losers
Valuation –sector target multiple moved from 2010 to 2011; we continue to argue for a discount against historical multiples
Our 2011E EV/DACF for the sector is currently 7.0 (market cap-weighted) which represents c. 33% discount to the sector’s historical average (2000-08) of 10.5x. Given the decline in both exploration and E&C capex we expect over the near to medium term against what appears to be a slowing in earnings momentum (see figure 78 below), we believe that our target sector multiple (2011) should trade at a discount to historical multiples.
Figure 78: The sector remains in growth territory despite earnings momentum slowing
59%
47%
27%
8% 5%8%
0%
10%
20%
30%
40%
50%
60%
70%
2004-07 2005-08 2006-09 2007-10 2008-11 2009-12
EPS
CAG
R %
Source: Deutsche Bank Estimates
At the industry level, based on our analysis above we believe the risk (primarily execution and margin compression)/reward (primarily revenue) trade off has shifted more into ‘equilibrium’. However, in light of the lack of visibility surrounding FIDs nearer term linked to the risk of renewed deterioration at the macro level, on balance we argue that our sector target multiple should trade at a 20% discount to the historical average (vs. -50% previously). Improved cashflow visibility to the end of the decade (fuelled by robust sector backlog) coupled with a general improvement in execution and risk sharing between the contractor/client justifies why we believe this sector should not trade at a deeper discount to historical multiples.
On balance we argue that
our sector target multiple
should trade at a 20%
discount (vs. -50%
previously) to the historical
average

7 December 2009 Oil & Gas European Oil Services
Deutsche Bank AG/London Page 53
Figure 79: Sector EV/DACF*
Figure 80: Company 2011E EV/DACF (sector target:
8.4x)*
0.0
2.0
4.0
6.0
8.0
10.0
12.0
14.0
2008 2009E 2010E 2011E 2012E
EV/D
ACF
European historical average (2000-08)
4
5
6
7
8
9
10
11
Acer
gy
Aker
Solu
tions
AMEC
Lam
prel
l
Petro
fac
Saip
em
Sead
rill
Subs
ea 7
Tech
nip
Tecn
icas
Reu
nida
s
Woo
d G
roup
2011
EV/
DAC
F
Target sector multiple (2011x)
Source: Deutsche Bank and company data Source: Deutsche Bank and company data
Our implied price targets are supported by our DCF valuation in which we assume ‘peak’ company earnings in 2012 with subsequent linear fade to our mid-cycle scenario in 2015. We have lowered our company discount rates to reflect the reduced market risk premium as well as the relatively lower cost of debt vs. last year’s study. We detail changes in company WACC in Appendix A. This in part drives our price target changes on our universe of stocks (summarised overleaf). We assume a long-term growth rate of 3% which is the average mid-cycle rate since 1990 for the oil services.
*Comparing these companies on any one valuation metric will never yield a perfect result given their differing asset bases/capital structures/regional tax exposures (in turn related to where along the service chain they operate). We consider EV/DACF to be the ‘lesser of the evils’ given the broadly similar capital intensities and gearing levels across the majority of the companies we follow. Exceptions here would be, for example, Saipem, Wood Group, Aker Solutions, Seadrill and Subsea 7’s current net debt position (vs. remainder of the sector, which is net cash), Amec and Petrofac’s asset-light business relative to peers.
Company-specific overview: winners need to have it all
In picking our highest conviction stocks, we look for the following investment credentials:
High relative and absolute exposure to our preferred themes and regions,
Ranked towards the top end of our ‘fitness’ league table,
Impressive earnings potential,
Compelling valuation – we would also argue for a premium relative to the sector if the above all co-exist (equally the reverse if they do not).
Note our valuation of the
European oil services uses a
combination of earnings and
cash flow techniques, aided
by DCF valuation as an
important sanity check

7 December 2009 Oil & Gas European Oil Services
Page 54 Deutsche Bank AG/London
Figure 81: Company specific overview and price target derivation
Company (local fx)
EPS CAGR
(09-12E)*
Current 2011E
EV/DACF
Target +/- to sector
(8.4x)
Target 2011E
EV/DACF
Implied PT
(local) DCF
DB rec.
Comment Old PTNew PT**
Acergy (NOK)
6%
(10%)
7.0
-10%
7.5 93 78 Hold
+ Strong balance sheet, exposure to deepwater SURF, robust backlog cover for 2010.
- Lack of diversification leaves it more vulnerable to delay on FIDs.
Net: argue for 10% discount to sector target (previously -30%).
50 85
Aker Solutions (NOK)
-4%
(7%)
8.2 -10% 7.5 66 50 Hold
+ Asset quality/ differentiation, robust backlog cover for 2010.
- High relative exposure to regions with greater elasticity to oil price; weak track record in execution; poor EPS outlook
Net: argue for 10% discount to sector target (previously -40%).
40 60
AMEC (£)
13%
(12%)
7.2 20% 10.0 1021 897 Buy
+ Impressive EPS growth; well diversified; high backlog longevity; balance sheet strength; low asset/resource utilisation risk; high asset differentiation; exposure to engineering and project management. - Low NOC exposure; overweight cost plus contract strategy, exposure to oil sands (underperforming theme).
Net: argue for 20% premium to sector target (previously 40%).
850950
***
Lamprell (£)
10%
(NA)
6.8 10% 9.2 241 172 Buy
+ Relatively high EPS growth; exposure to preferred theme rig construction services; high Middle East exposure; low asset/resource utilisation risk; balance sheet strength.
- Lack of diversification; low backlog longevity; low NOC exposure; over-concentration on few large contracts leaves company at greater risk than peers to potential client defaults and late payments.
Net: argue for 10% premium to sector target (previously inline).
185 210
Petrofac (£)
15%
(14%)
6.4 0% 8.4 1213 814 Hold
+ Impressive EPS growth, high exposure to Middle East & NOCs; absolute value underpinned by energy developments division; low asset/resource utilisation risk.
- Energy developments sensitive to oil price risk; lack of diversification leaves it more vulnerable to delay on FIDs; low asset differentiation.
Net: argue for in line to sector target (previously -10%).
680970
****
Saipem (E) 10%
(0%) 8.1 20% 10.0 29 33 Buy
+ Impressive EPS growth, strong diversification; exposure to several of our preferred themes and regions, asset differentiation, sector leading backlog cover for 2010.
- Risk of delay of new rigs coming online.
Net: argue for 20% premium to sector target (previously 60%).
2327
*****
Seadrill (NOK)
21%
(10%)
5.6 10% 9.2 253 168 Buy
+ Leading exposure to preferred theme ultra-deepwater drilling; valuation compelling and underpinned by robust backlog; sector leading EPS growth, high NOC exposure and backlog longevity. - Risk of delay of new rigs, balance sheet strength lowest in peer group; no room for error leaves it over-exposed to credit risk. Net: argue for 10% premium to sector target (previously inline)
120190
******
Subsea 7 (NOK)
1%
(2%)
9.4 -10% 7.5 78 80 Hold
+ Exposure to deepwater SURF, robust backlog cover for 2010
- Lack of diversification leaves it more vulnerable to delay on FIDs, weak balance sheet, lacklustre EPS outlook
Net: argue for 10% discount to sector target (previously -30%)
50 80
Technip (E)
0%
(-6%)
5.5 0% 8.4 63 43 Hold
+ Strong balance sheet strength; exposure to several preferred themes, high technological differentiation; robust backlog cover for 2010
- Lacklustre EPS outlook
Net: argue for inline to sector target (no change)
42 53
Tecnicas Reunidas
(E)
13%
(7%)
4.6 0% 8.4 43 45 Buy
+ High exposure to Middle East and premium position in refining/petrochemicals
- Lack of diversification leaves it more vulnerable to delays on FIDs in the core segment
Net: argue for in line sector target (previously 50% discount)
41 44
Wood Group (£)
1%
(11%)
10.1 -10% 7.5 218 197 Sell
+ Exposure to engineering and project management, relatively well diversified
- Lacklustre EPS outlook; weak balance sheet; M&A potential appears unlikely in our view
Net: argue for 10% discount to sector target (no change)
190 210
Average 8% 7.0
Source: Deutsche Bank and company data; * Bloomberg consensus EPS CAGR (2009-12E) in brackets below; **taken as avg. of price target implied by relative valuation target multiple and fair value; *** includes SOTP GBp932;
**** includes SOTP GBp885; ***** includes SOTP E20, ****** includes our alternative DCF (leading edge dayrates) of NOK156 and implied PT of NOK194 (at 10% premium to 2010E US drillers’ P/E)

7 December 2009 Oil & Gas European Oil Services
Deutsche Bank AG/London Page 55
Top picks and key recommendation changes Saipem, combination of relative valuation, DCF and SOTP drives PT re-rating (from E23 to E27)
We argue that Saipem should trade at a 20% premium to our 2011 EV/DACF target sector multiple (8.4x) based on:
A unique strategy and business model that should defend Saipem’s market leading share across the engineering and construction (E&C) industry. Based on this, we believe the company is better placed to win (and successfully execute) contracts, particularly those linked to NOCs that are currently actively tendering (Brazil, Middle East), and IOCs that have sanctioned go ahead on FIDs (in particular the Gorgon project in Australia).
Saipem’s sector leading backlog underpins an impressive growth outlook in the near to medium. Analysis of backlog cover at the industry and company level sees Saipem at a comfortable premium relative to its peers and at record levels vs. history (77% of 2010 consensus revenue is already covered by current backlog vs. 2005-7 group historical average of c. 60%),
Solid ‘backlog longevity’ (longer contract life implies topline visibility) that stands out against most comparable peer Technip - a direct function of Saipem’s unique exposure to (longer term) drilling contracts,
Analysis of Saipem’s asset utilisations (leveraging our expansive database of contracts) implies a robust outlook for vessel activity which given their superior differentiation should support our forecasts for margins both in the drilling and offshore construction segments,
Sector leading execution capabilities: despite a change in the company’s risk profile (we have considered four types of execution risk) linked to an impressive expansion of its industry product offering, the company has consistently delivered; analysis of Saipem’s contract strategy and discipline in bidding supports why we believe it will continue to do so and finally
An asset development program that should yield impressive cashflow generation from next year and fuel group EBITDA growth 2010-12; this should bring the company’s gearing comfortably back towards mid-cycle levels (c. 35% debt/equity). Investing across all parts of the oil services chain should underpin the company’s ability to grow market share particularly in regions that are relatively fertile.
Amec, PT 950p (previously 850p), diversified (oil and gas/power and process), sector leading cash yield and robust execution
We argue that Amec should trade at a 20% premium to our 2011 EV/DACF target sector multiple (8.4x) based on:
The company’s unique business model is that we believe drives superior earnings visibility. The key components that differentiate include: 1) an operational excellence programme that keeps Amec ‘lean’ and improves efficiencies, 2) optimal balance of capex and opex based activities, 3) ‘cost plus’ contract strategy that significantly reduces the relative risk profile of its earnings and offers margin enhancement through key
7 December 2009 Oil & Gas European Oil Services
Page 56 Deutsche Bank AG/London
performance indicators, 4) sector leading backlog longevity, and 5) balance sheet strength.
Amec’s diversification across the oil service chain both by region and by industry that ensures effective penetration of its engineering and project management resources. Taken together with the above this drives leading oil and gas margins (on aggregate) vs. the peer group. We also expect it to continue to outperform across 2009-12 (35bps vs. our sector average outlook of -75bps).
Top quartile EPS growth of 13% CAGR 2009-12 (peer group average 8%); critical to this is the contribution of power and process and environmental divisions that are both exposed to industries driven by factors that extend beyond macro dynamics and commodity prices making them arguably contra-cyclical.
The company’s ‘frontlog’ strategy that should yield increased market share as well as entry into new markets mid to longer term. This places upside pressure on its top line (as the company grows market share from a low base) and gives it greater scale.
Seadrill, PT NOK 190 (previously 120), sector leading ultra-deepwater exposure, superior earnings visibility
We value Seadrill using a combination of relative and absolute valuation techniques given the various scenarios of day rates that we have analysed as well as differing sector benchmarks with which to compare it to (US and European sector multiples). Our base-case DCF of NOK 168 is modelled around our forecasts for day rates. Alternative scenarios assume a) five-year payback and b) leading edge day rates. Seadrill currently trades at a discount (P/E 2010: 7.8x) to the average 2010E P/E multiple for the US drillers (9.8x). We believe it should trade at 10% premium, both to our target sector 2011E EV/DACF multiple and to the US drillers (previously inline) based on:
Seadrill’s high relative and absolute exposure to deepwater drilling. Management’s choice to maintain a degree of rig liquidity in their portfolio, evident in that 2 of its new deepwater units remain un-contracted (vs. global average of 40%) leaves them with sufficient exposure to further capture leading edge day rates.
$11bn backlog that fuels sector leading earnings growth (21% 2009-12E CAGR vs. sector average of 8%): Seadrill possesses excellent visibility in earnings beyond 2012 given a portion of their contracts have terms that run at up to six years. This together with additional upside to earnings related to higher day rates being signed should overshadow the risk surrounding delays in rig new-build delivery. In any case even if every rig were delayed by a quarter, we calculate it would have an immaterial impact on mid-term earnings growth.
The company’s US listing in Q1’10 that should help improve investors’ perception of the company’s superior asset quality and deepwater exposure vis-à-vis its US peers. We believe that incremental demand for best in class assets (younger, latest generation of rigs) will re-shape the deepwater market and we expect new rig owners such as Seadrill to gradually displace market share traditionally held by more mature drillers (predominantly US based).
A healthier balance sheet supported by the company’s recent convertible bond (which was over-subscribed) and bridging load facilities. However, given Seadrill’s high gearing, we cannot ignore the risk that if anything goes wrong (be it new rigs being delayed, existing rigs underperforming or issues with their own financial instruments), the company remains at risk financially.
A key differentiator of Amec
vs. its peers is the
transferability of its
engineering and project
management both within
natural resources and across
its other divisions…
…this ensures effective
penetration of its resource
Number two market share
globally in ultra-deepwater
drilling, our preferred theme
across the exploration
industry…
…however given Seadrill’s
high gearing, we cannot
ignore the risk that if
anything goes wrong (be it
new rigs being delayed,
existing rigs
underperforming or issues
with their own financial
instruments), the company
is most at risk financially

7 December 2009 Oil & Gas European Oil Services
Deutsche Bank AG/London Page 57
Appendix A: Valuation matrices
Figure 82: European oil services valuation table * Listed Share Target (Expensive) Market cap Market cap E.V.
04/12/2009 01:40 RIC Currency price Rec share price /Cheap % (local bn) ($bn) ($bn) (local bn) / Equity (%) / D+E (%)Acergy ACY.OL NOK 87 Hold 85 -3% 16.1 2.9 2.3 -3.1 NA NAAker Solutions AKSO.OL NOK 73 Hold 60 -18% 19.7 3.5 3.9 2.1 NA NAAMEC AMEC.L £ 825 Buy 950 15% 2.8 4.6 3.0 -0.9 NA NALamprell LAM.L £ 189 Buy 210 11% 0.4 0.6 0.5 -0.1 NA NAPetrofac PFC.L £ 987 Hold 970 -2% 3.4 5.6 4.4 -0.7 NA NASaipem SPMI.MI € 22 Buy 27 23% 9.7 14.6 19.2 3.0 81% 45%Seadrill SDRL.OL NOK 138 Buy 190 38% 54.9 9.8 15.3 30.9 90% 47%Subsea 7 SUB.OL NOK 96 Hold 80 -17% 15.8 2.8 3.1 1.4 23% 18%Technip TECF.PA € 47 Hold 53 12% 5.1 7.7 5.0 -1.8 NA NA
Tecnicas Reunidas TRE.MC € 36 Buy 44 21% 2.0 3.1 1.7 -0.9 NA NAWood Group WG.L £ 308 Sell 210 -32% 1.63 2.7 3.08 0.22 25% 20%
Weighted average/total 13% 57.8
European multiples only Free cash yield (x) ROE* (%)RIC 2008 2009E 2010E 2011E 2012E 2008 2009E 2010E 2011E 2012E 2008 2009E 2010E 2011E 2012E
Acergy ACY.OL 13.7 3.7 8.6 7.0 5.0 1.3% 13.2% 7.8% 9.5% 11.8% 36.6% 20.1% 10.4% 14.1% 16.7%Aker Solutions AKSO.OL 6.3 4.4 7.5 8.2 7.4 -16.8% 8.1% 2.6% 2.3% 2.4% 19.8% 21.2% 15.8% 13.0% 13.6%AMEC AMEC.L 14.6 7.4 7.9 7.2 6.3 3.3% 4.9% 6.3% 6.9% 7.5% 15.4% 14.3% 15.8% 15.7% 15.5%Lamprell LAM.L 11.9 4.6 9.1 6.8 5.3 -2.7% 10.4% 6.1% 7.9% 9.5% 50.4% 21.8% 17.1% 19.2% 20.4%Petrofac PFC.L 7.5 7.7 7.7 6.4 5.4 5.0% 6.4% 11.1% 12.6% 13.1% 50.8% 48.8% 48.0% 38.9% 32.4%Saipem SPMI.MI 11.1 8.3 9.6 8.1 7.0 -1.3% -6.2% 1.9% 9.2% 10.6% 27.4% 23.4% 18.3% 19.9% 20.6%Seadrill SDRL.OL 46.2 7.7 8.1 5.6 4.1 -31.0% -7.7% 7.5% 19.0% 22.9% 12.4% 30.2% 24.9% 22.1% 18.3%Subsea 7 SUB.OL 0.8 0.5 11.1 9.4 7.0 -4.4% 6.1% 3.4% 6.6% 8.6% 32.2% 29.5% 15.2% 16.2% 17.4%Technip TECF.PA 4.7 3.5 6.8 5.5 4.5 0.9% 6.4% 6.3% 7.1% 8.4% 19.3% 16.0% 10.6% 11.9% 13.4%Tecnicas Reunidas TRE.MC 9.8 6.2 6.1 4.6 3.7 11.3% 11.6% 12.8% 13.1% 12.0% 61.7% 60.7% 51.5% 44.6% 38.4%Wood Group WG.L 8.8 7.1 9.7 10.1 9.9 1.9% -0.5% -1.4% -2.0% -2.9% 23.9% 15.5% 11.4% 11.5% 11.2%
Weighted average 15.3 6.4 8.4 7.0 5.8 -5% 1% 6% 10% 11% 31.8% 27.4% 21.7% 20.6% 19.8%
Euro/US comparitive EV/EBITDA (x) PCF ratio (x) PEGRIC 2008 2009E 2010E 2011E 2012E 2008 2009E 2010E 2011E 2012E 2008 2009E 2010E 2011E 2012E 2010
Europe Acergy ACY.OL 12.6 9.5 27.7 18.7 13.9 5.8 3.2 6.7 5.2 3.7 10.5 4.2 9.1 8.2 6.8 0.6Aker Solutions AKSO.OL 17.7 7.1 11.7 13.0 11.4 8.8 3.8 5.9 6.5 5.8 -31.5 4.6 8.6 9.9 8.6 -1.2AMEC AMEC.L 16.4 15.2 15.3 14.0 13.0 6.7 5.5 6.0 5.2 4.5 -253.1 14.2 14.6 13.4 12.4 1.7Lamprell LAM.L 14.5 7.9 13.8 11.0 9.2 12.6 4.6 8.9 6.7 5.2 73.9 7.2 12.9 10.1 8.3 0.5Petrofac PFC.L 13.0 11.7 12.7 11.9 11.3 6.9 6.6 6.2 5.1 4.4 6.8 7.9 8.4 7.8 7.5 1.8Saipem SPMI.MI 14.7 10.7 15.2 12.3 10.4 8.7 6.7 7.9 6.6 5.6 6.5 6.1 7.6 6.6 6.1 0.6Seadrill SDRL.OL 22.8 5.7 7.8 6.1 5.5 17.0 7.0 7.0 4.9 3.5 27.5 3.8 5.8 4.7 4.3 0.3Subsea 7 SUB.OL 12.2 6.8 18.0 14.5 11.3 6.6 4.1 8.7 7.2 5.3 6.3 4.5 11.5 10.2 8.1 0.7Technip TECF.PA 10.8 9.4 17.5 14.9 12.4 3.8 2.6 5.2 4.2 3.5 10.6 5.5 8.9 7.7 6.8 1.0Tecnicas Reunidas TRE.MC 16.1 10.8 10.9 9.6 8.9 10.8 6.0 5.9 4.5 3.6 8.5 7.8 7.2 7.0 7.6 0.8Wood Group WG.L 14.1 11.5 16.8 14.9 13.7 7.5 5.9 8.4 8.1 7.8 14.8 17.3 24.0 28.2 36.7 1.3
Euro services average 15.5 9.7 14.4 12.1 10.5 9.0 5.6 6.9 5.6 4.7 -10.8 6.8 9.2 8.6 8.3 0.7European integrated average 8.0 13.8 11.8 NA NA NA NA NA NA NA NA NA NA NA NABroader European market 14.1 15.4 12.9 14.8 12.7 7.3 8.2 7.0 7.4 6.7 8.8 9.7 7.7 7.3 7.0US Large Cap Diversified Average 12.1 22.8 20.6 NA NA 7.7 11.2 10.3 NA NA 8.7 12.3 11.5 NA NAUS Mid/Small Cap Service & Equipment Suppliers 11.1 24.7 26.4 NA NA 6.5 9.4 9.2 NA NA 8.0 11.9 11.6 NA NAUS Equipment Contractors/Drillers average 7.2 8.7 9.8 NA NA 5.2 6.2 6.3 NA NA 6.0 6.9 6.7 NA NAGlobal services average 10.3 18.2 17.5 NA NA 6.7 9.3 8.8 NA NA 7.7 10.4 9.9 NA NA
P/E ratio (x)
EV/DACF (x)
Net debt (2010)
Source: Deutsche Bank, Company data, * closing share prices as at Thursday, December 3rd 2009.

7 December 2009 Oil & Gas European Oil Services
Page 58 Deutsche Bank AG/London
Figure 83: European oil services financial matrix * Reporting Share Net income (reporting currency m) Growth EPS (local currency) CAGR
RIC Currency price 2008 2009E 2010E 2011E 2012E (09-10) 2008 2009E 2010E 2011E 2012E (09-12)Acergy ACY.OL $ 87 277 175 103 153 206 -41% 7.6 5.9 3.2 4.7 6.3 1.9%Aker Solutions AKSO.OL NOK 73 1,540 1,966 1,682 1,512 1,728 -14% 5.7 7.3 6.2 5.6 6.4 -4.2%AMEC AMEC.L £ 825 145 147 180 196 212 22% 43.4 44.1 53.7 58.7 63.4 12.9%Lamprell LAM.L $ 189 94 51 45 57 68 -11% 25.2 16.2 13.7 17.2 20.6 8.3%Petrofac PFC.L $ 987p 265 324 438 469 492 35% 41.7 60.6 77.4 83.0 87.1 12.9%Saipem SPMI.MI € 22 693 705 638 789 933 -9% 1.6 1.6 1.4 1.8 2.1 9.8%Seadrill SDRL.OL $ 138 393 1,012 1,258 1,614 1,786 24% 5.3 15.8 17.7 22.8 25.2 16.7%Subsea 7 SUB.OL $ 96 243 242 156 194 248 -36% 8.2 9.2 5.3 6.6 8.5 -2.7%Technip TECF.PA € 47 448 410 290 342 409 -29% 4.2 3.8 2.7 3.2 3.8 -0.1%
Tecnicas Reunidas TRE.MC € 36 137 160 187 212 229 17% 2.45 2.86 3.35 3.80 4.10 12.7%Wood Group WG.L $ 308 252 190 161 182 197 -15% 26.0 23.3 18.3 20.7 22.5 -1.2%
Average -5% 6%Reporting Share Revenues (reported currency m) CAGR EBITDA Margin (%) Increase (bp)
RIC Currency price 2008 2009E 2010E 2011E 2012E (09-12) 2008 2009E 2010E 2011E 2012E (09-12)Acergy ACY.OL $ 87 2522 2103 2207 2639 3022 13% 22.7% 19.7% 15.5% 15.0% 16.1% -351Aker Solutions AKSO.OL NOK 73 58252 56425 54347 54038 58816 1% 5.8% 7.3% 6.8% 6.3% 6.5% -87AMEC AMEC.L £ 825 2606 2605 2880 3105 3324 8% 9.3% 9.8% 10.6% 10.6% 10.5% 67Lamprell LAM.L $ 189 741 456 421 531 634 12% 13.5% 13.4% 13.0% 13.0% 13.0% -43Petrofac PFC.L $ 987p 3330 3538 4619 5009 5386 15% 12.6% 13.3% 15.5% 15.3% 14.1% 79Saipem SPMI.MI € 22 10094 10244 10422 11173 12130 6% 14.2% 15.3% 15.4% 16.5% 16.7% 137Seadrill SDRL.OL $ 138 2106 3188 3805 4495 4774 14% 44.1% 57.2% 57.1% 57.5% 56.9% -33Subsea 7 SUB.OL $ 96 2373 2405 2243 2536 3039 8% 21.9% 20.0% 15.7% 15.8% 16.2% -376Technip TECF.PA € 47 7481 6434 5764 6999 7281 4% 11.3% 13.1% 11.0% 10.6% 11.7% -136Tecnicas Reunidas TRE.MC € 36 2487 2747 3179 3571 3824 12% 6.0% 6.0% 6.0% 6.0% 6.0% 0Wood Group WG.L $ 308 5243 4787 4633 4909 5097 2% 9.8% 8.9% 7.9% 8.0% 8.3% -62
Average 9% 18.0% 20.6% 20.1% 20.4% 20.4% -20Local Share Cash flow per share (local) CAGR Debt adjusted cash flow per share (local) CAGR
RIC Currency price 2008 2009E 2010E 2011E 2012E (09-12) 2008 2009E 2010E 2011E 2012E (09-12)Acergy ACY.OL NOK 87 9.0 13.5 9.6 10.6 12.8 -2% 6.6 12.2 8.2 9.1 11.0 -3.3%Aker Solutions AKSO.OL NOK 73 3.2- 11.2 8.4 7.4 8.5 NA 17.6 13.5 10.9 9.9 11.2 -6%AMEC AMEC.L £ 825 2.8- 47.3 56.5 61.6 66.4 NA 33.3 57.8 65.6 70.3 74.7 9%Lamprell LAM.L £ 189 4.9 17.6 14.6 18.8 22.7 9% 28.7 19.3 16.2 20.5 24.5 8%Petrofac PFC.L £ 987p 79.1p 90.p 117.9p 126.6p 131.5p 13% 60.7p 76.p 102.p 108.p 109.6p 13%Saipem SPMI.MI € 22 3.5 2.8 2.9 3.3 3.6 9% 2.5 2.9 3.0 3.4 3.7 9%Seadrill SDRL.OL NOK 138 4.4 24.0 23.9 29.4 32.1 10% 4.6 26.0 26.6 31.5 33.2 9%Subsea 7 SUB.OL NOK 96 15.9 13.7 8.3 9.4 11.9 -5% 13.4 15.2 9.4 10.5 12.9 -5%Technip TECF.PA € 47 4.3 6.5 5.3 6.1 7.0 2% 6.5 5.9 4.5 5.3 6.1 1%Tecnicas Reunidas TRE.MC € 36 4.7 4.0 5.1 5.2 4.8 7% 2.9 2.9 3.3 3.7 na naWood Group WG.L £ 308 24.8p 15.5p 12.8p 10.9p 8.4p -18% 44.7p 43.2p 36.2p 35.7p 37.7p -4%
Average 5% 5%Local Share Dividend per share (local) CAGR Yield (%)
RIC Currency price 2008 2009E 2010E 2011E 2012E (09-12) 2008 2009E 2010E 2011E 2012EAcergy ACY.OL NOK 87 1.2 1.3 0.7 1.0 1.4 2% 1.4% 2.2% 0.8% 1.2% 1.6%Aker Solutions AKSO.OL NOK 73 1.6 2.9 2.5 2.2 2.6 -4% 1.6% 5.7% 3.4% 3.1% 3.5%AMEC AMEC.L £ 825 0.2 0.2 0.2 0.2 0.2 13% 2.2% 2.3% 2.3% 2.5% 2.7%Lamprell LAM.L £ 189 0.1 0.0 0.1 0.1 0.1 33% 0.0% 0.0% 2.9% 3.6% 4.4%Petrofac PFC.L £ 987p 13.7p 21.2p 27.1p 29.0p 30.5p 13% 2.5% 3.0% 2.7% 2.9% 3.1%Saipem SPMI.MI € 22 0.6 0.5 0.5 0.6 0.7 10% 2.4% 3.1% 2.2% 2.7% 3.2%Seadrill SDRL.OL NOK 138 8.69 3.12 11.23 11.23 11.23 NA 7.2% 3.4% 8.1% 8.1% 8.1%Subsea 7 SUB.OL NOK 96 - - - - - NA 0.0% 0.0% 0.0% 0.0% 0.0%Technip TECF.PA € 47 1.2 2.1 1.5 1.7 2.1 0% 2.6% 5.7% 3.1% 3.6% 4.3%Tecnicas Reunidas TRE.MC € 36 1.2 1.4 1.7 - - NA 3.1% 4.6% 4.6% 0.0% 0.0%Wood Group WG.L £ 308 4.9p 4.7p 3.7p 4.1p 4.5p -1% 1.3% 1.7% 1.2% 1.3% 1.5%
Weighted average 3.0% 3.4% 3.4% 3.4% 3.7%Local Share Free cash flow (mn) - local CAGR ROACE (clean before goodwill %)
RIC Currency price 2008 2009E 2010E 2011E 2012E (09-12) 2008 2009E 2010E 2011E 2012EAcergy ACY.OL NOK 87 244 1,373 1,256 1,531 1,892 11% 43% 30% 21% 36% 63%Aker Solutions AKSO.OL NOK 73 (4,600) 1,126 520 451 464 NA 20% 20% 16% 13% 14%AMEC AMEC.L £ 825 77 110 175 191 206 23% 63% 57% 66% 73% 80%Lamprell LAM.L £ 189 (19) 26 23 30 36 11% 144% 38% 32% 39% 44%Petrofac PFC.L £ 987p 92 154 372 424 440 42% na na na na naSaipem SPMI.MI € 22 (135) (468) 181 891 1,031 NA 17% 14% 11% 13% 15%Seadrill SDRL.OL NOK 138 (15,494) (2,773) 4,097 10,448 12,577 NA 6% 10% 12% 14% 16%Subsea 7 SUB.OL NOK 96 (732) 628 533 1,034 1,362 NA 25% 20% 13% 16% 20%Technip TECF.PA € 47 43 246 321 361 425 20% 64% 47% 31% 37% 45%Tecnicas Reunidas TRE.MC € 36 250 200 260 266 244 7% na na na na naWood Group WG.L £ 308 37 (7) (22) (33) (48) NA 20% 14% 10% 10% 9%
Weighted Average 26% 21% 18% 21% 25%Local Share Backlog ($ bn) CAGR Dividend payout (%)
RIC Currency price 2008 2009E 2010E 2011E 2012E (09-12) 2008 2009E 2010E 2011E 2012E
Acergy ACY.OL NOK 87 2.5 2.7 2.7 3.3 4.0 14% 16% 22% 22% 22% 22%
Aker Solutions AKSO.OL NOK 73 10.4 6.9 9.3 - - NA 28% 40% 40% 40% 40%
AMEC AMEC.L £ 825 NA NA NA NA NA NA 35% 35% 35% 35% 35%
Lamprell LAM.L £ 189 0.6 0.9 1.4 2.0 2.6 41% 20% 22% 40% 40% 40%Petrofac PFC.L £ 987p 4.0 9.9 12.2 13.4 14.5 13% 33% 35% 35% 35% 35%Saipem SPMI.MI € 22 28.1 NA NA NA NA NA 35% 33% 33% 33% 33%Seadrill SDRL.OL NOK 138 10,900.0 NA NA NA NA NA 165% 20% 63% 49% 45%Subsea 7 SUB.OL NOK 96 3.3 3.2 3.5 4.2 5.3 19% 0% 0% 0% 0% 0%Technip TECF.PA € 47 10.9 9.6 13.6 15.0 18.4 24% 28% 54% 54% 54% 54%Tecnicas Reunidas TRE.MC € 36 NA NA NA NA NA NA 50% 50% 50% 0% 0%Wood Group WG.L £ 308 NA NA NA NA NA NA 19% 20% 20% 20% 20%
Source: Deutsche Bank, Company data, , * closing share prices as at Thursday, December 3rd 2009.
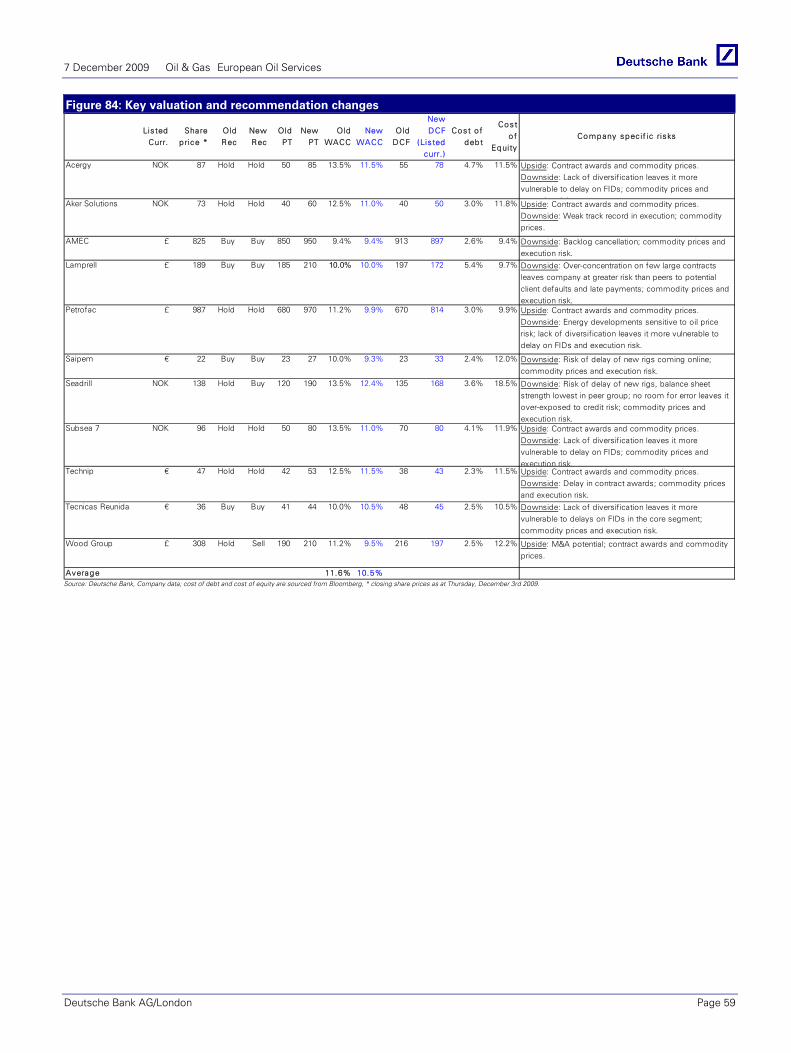
7 December 2009 Oil & Gas European Oil Services
Deutsche Bank AG/London Page 59
Figure 84: Key valuation and recommendation changes
Listed Curr.
Share price *
Old Rec
New Rec
Old PT
New PT
Old WACC
New WACC
Old DCF
New DCF
(Lis ted curr. )
Cost of debt
Cost o f
EquityCompany specif ic risks
Acergy NOK 87 Hold Hold 50 85 13.5% 11.5% 55 78 4.7% 11.5%
Aker Solutions NOK 73 Hold Hold 40 60 12.5% 11.0% 40 50 3.0% 11.8%
AMEC £ 825 Buy Buy 850 950 9.4% 9.4% 913 897 2.6% 9.4%
Lamprell £ 189 Buy Buy 185 210 10.0% 10.0% 197 172 5.4% 9.7%
Petrofac £ 987 Hold Hold 680 970 11.2% 9.9% 670 814 3.0% 9.9%
Saipem € 22 Buy Buy 23 27 10.0% 9.3% 23 33 2.4% 12.0%
Seadrill NOK 138 Hold Buy 120 190 13.5% 12.4% 135 168 3.6% 18.5%
Subsea 7 NOK 96 Hold Hold 50 80 13.5% 11.0% 70 80 4.1% 11.9%
Technip € 47 Hold Hold 42 53 12.5% 11.5% 38 43 2.3% 11.5%
Tecnicas Reunidas € 36 Buy Buy 41 44 10.0% 10.5% 48 45 2.5% 10.5%
Wood Group £ 308 Hold Sell 190 210 11.2% 9.5% 216 197 2.5% 12.2%
Average 11.6% 10.5%
Upside: M&A potential; contract awards and commodity prices.
Upside: Contract awards and commodity prices. Downside: Energy developments sensitive to oil price risk; lack of diversification leaves it more vulnerable to delay on FIDs and execution risk.
Downside: Risk of delay of new rigs coming online; commodity prices and execution risk.
Downside: Risk of delay of new rigs, balance sheet strength lowest in peer group; no room for error leaves it over-exposed to credit risk; commodity prices and execution risk.Upside: Contract awards and commodity prices. Downside: Lack of diversification leaves it more vulnerable to delay on FIDs; commodity prices and execution risk.
Upside: Contract awards and commodity prices. Downside: Lack of diversification leaves it more vulnerable to delay on FIDs; commodity prices and
ti i kUpside: Contract awards and commodity prices. Downside: Weak track record in execution; commodity prices.
Downside: Backlog cancellation; commodity prices and execution risk.
Downside: Over-concentration on few large contracts leaves company at greater risk than peers to potential client defaults and late payments; commodity prices and execution risk.
Upside: Contract awards and commodity prices. Downside: Delay in contract awards; commodity prices and execution risk.
Downside: Lack of diversification leaves it more vulnerable to delays on FIDs in the core segment; commodity prices and execution risk.
Source: Deutsche Bank, Company data; cost of debt and cost of equity are sourced from Bloomberg, * closing share prices as at Thursday, December 3rd 2009.

7 December 2009 Oil & Gas European Oil Services
Page 60 Deutsche Bank AG/London
Figure 85: DBe vs Bloomberg consensus
Net Income Curr (mn) 2009E 2010E 2011E 2012ECAGR
(09E-12E)2009E 2010E 2011E 2012E
CAGR(09E-12E)
2009E 2010E 2011E 2012EAverage
(09E-12E)Acergy $ 175 103 153 206 6% 164 147 183 219 10% 6% -30% -16% -6% -11%Aker Solutions NOK 1966 1682 1512 1728 -4% 2132 1720 1930 2580 7% -8% -2% -22% -33% -16%AMEC £ 147 180 196 212 13% 159 172 184 226 12% -7% 4% 7% -6% -1%Lamprell $ 51 45 57 68 10% 49 69 69 NA NA 4% -34% -18% NA -16%Petrofac $ 324 438 469 492 15% 326 448 485 477 14% -1% -2% -3% 3% -1%Saipem € 705 638 789 933 10% 701 633 671 697 0% 1% 1% 18% 34% 13%Seadrill $ 1012 1258 1614 1786 21% 1059 1135 1325 1392 10% -4% 11% 22% 28% 14%Subsea 7 $ 242 156 194 248 1% 208 166 204 220 2% 16% -6% -5% 13% 4%Technip € 410 290 342 409 0% 409 287 322 334 -6% 0% 1% 6% 22% 8%Tecnicas Reunidas € 160 187 212 229 13% 150 148 175 184 7% 6% 26% 22% 25% 20%Wood Group $ 190 161 182 197 1% 217 196 233 296 11% -12% -18% -22% -33% -21%Average 8% 7% -1%
Revenue Curr (mn) 2009E 2010E 2011E 2012ECAGR
(09E-12E)2009E 2010E 2011E 2012E
CAGR(09E-12E)
2009E 2010E 2011E 2012EAverage
(09E-12E)Acergy $ 2103 2207 2639 3022 13% 2145 2251 2441 2816 9% -2% -2% 8% 7% 3%Aker Solutions NOK 56425 54347 54038 58816 1% 55615 47762 49400 52645 -2% 1% 14% 9% 12% 9%AMEC £ 2605 2880 3105 3324 8% 2775 2851 2990 3549 9% -6% 1% 4% -6% -2%Lamprell $ 456 421 531 634 12% 502 470 519 NA NA -9% -10% 2% NA -6%Petrofac $ 3538 4619 5009 5386 15% 3634 4404 4757 4958 11% -3% 5% 5% 9% 4%Saipem € 10244 10422 11173 12130 6% 10183 9539 10047 9742 -1% 1% 9% 11% 25% 11%Seadrill $ 3188 3805 4495 4774 14% 3246 3863 4312 4553 12% -2% -1% 4% 5% 1%Subsea 7 $ 2405 2243 2536 3039 8% 2313 2171 2430 2596 4% 4% 3% 4% 17% 7%Technip € 6434 5764 6999 7281 4% 6448 5646 6027 6316 -1% 0% 2% 16% 15% 8%Tecnicas Reunidas € 2747 3179 3571 3824 12% 2669 2617 2892 3045 4% 3% 21% 23% 26% 18%Wood Group $ 4787 4633 4909 5097 2% 4872 4783 5049 5903 7% -2% -3% -3% -14% -5%Average 9% 5% 5%
EBITDA margin 2009E 2010E 2011E 2012ECAGR
(09E-12E)2009E 2010E 2011E 2012E
CAGR(09E-12E)
2009E 2010E 2011E 2012EAverage
(09E-12E)Acergy 19.7% 15.5% 15.0% 16.1% -6% 16.6% 15.5% 16.5% 15.7% -2% 18% 0% -9% 3% 3%Aker Solutions 7.3% 6.8% 6.3% 6.5% -4% 7.6% 7.4% 7.7% 8.6% 4% -4% -8% -19% -25% -14%AMEC 9.8% 10.6% 10.6% 10.5% 2% 8.3% 8.5% 9.2% 8.5% 1% 18% 24% 14% 24% 20%Lamprell 13.4% 13.0% 13.0% 13.0% -1% 12.4% 15.3% 15.5% NA NA 8% -15% -16% NA -8%Petrofac 13.3% 15.5% 15.3% 14.1% 2% 14.1% 18.1% 17.4% 14.8% 1% -6% -14% -12% -5% -9%Saipem 15.3% 15.4% 16.5% 16.7% 3% 15.3% 16.5% 16.2% 17.2% 4% 0% -7% 1% -3% -2%Seadrill 57.2% 57.1% 57.5% 56.9% 0% 52.6% 52.4% 53.2% 50.3% -1% 9% 9% 8% 13% 10%Subsea 7 20.0% 15.7% 15.8% 16.2% -7% 18.6% 17.4% 17.6% 19.4% 1% 8% -10% -10% -16% -7%Technip 13.1% 11.0% 10.6% 11.7% -4% 12.7% 11.2% 11.6% 11.7% -3% 3% -1% -9% 0% -2%Tecnicas Reunidas 6.0% 6.0% 6.0% 6.0% 0% 6.0% 6.0% 6.0% 6.1% 1% 0% 1% 1% -2% 0%Wood Group 8.9% 7.9% 8.0% 8.3% -2% 9.1% 8.6% 9.0% 9.0% 0% -3% -8% -10% -9% -8%Average -2% 1% -2%
% difference (DBe vs. consensus)Bloomberg ConsensusDB Estimates
Source: Deutsche Bank, Bloomberg

7 December 2009 Oil & Gas European Oil Services
Deutsche Bank AG/London Page 61
Appendix B: Exploration, appraisal and development capex split
Figure 86: Exploration, appraisal and development outlook broken down by industry
0
50,000
100,000
150,000
200,000
250,000
300,000
1999 2000 2001 2002 2003 2004 2005 2006 2007 2008 2009E 2010E 2011E
$mn
Surface servicing Surface equipmentSubsurface servicing Subsurface equipment & productsDrilling r igs Seismic
Source: Deutsche Bank, Wood Mackenzie, Spears and associates, company data
Please see Appendix T for a description of the above categories.

7 December 2009 Oil & Gas European Oil Services
Page 62 Deutsche Bank AG/London
Deepwater drilling activity vs. oil price
Figure 87: Deepwater appraisal and successful exploration wells drilled globally vs. oil price
1
21
41
61
81
101
121
Appr
aisa
l/ su
cces
sful
exp
lora
tion
0
20
40
60
80
100
120
1995
1996
1997
1998
1999
2000
2001
2002
2003
2004
2005
2006
2007
2008
Wel
ls d
rille
d
Oil price (WTI) Successful exploration Appraisal
Source: Deutsche Bank, Wood Mackenzie

7 December 2009 Oil & Gas European Oil Services
Deutsche Bank AG/London Page 63
Appendix C: Snapshot of each company’s financing We have analysed the debt position, spread of maturity and interest rates to assess the refinancing risks for companies under our coverage. The underlying refinancing risk potential for companies is measured by taking a look at the timing of debt maturity (bond loans, bank loans, convertible bonds etc) along with the company’s current cash position, access to un-drawn credit facilities and their expected free cash flow generation. Data has been sourced from 2008 annual reports (the exception being Seadrill where an update on its debt repayment schedule is available in quarterly results).
Figure 88: Acergy Figure 89: Aker Solutions
-
100
200
300
400
500
600
700
Cas
h
ST
debt
LT d
ebt
2009
2010
2011
2012
2013
Year of maturity of debt
US
D m
n
LT debt maturity Free cash flow
-1,0002,0003,0004,0005,0006,0007,0008,0009,000
Cas
h
LT d
ebt
* 2009
2010
2011
2012
2013
2014
Year of maturity of LT debt
NO
K m
n
LT debt maturity Free cash flow
- Convertible note maturing in 2013. - Strong cash position and free cash potential should
cater for future re-financing requirements. .Source: Company data, Deutsche Bank
- Robust cash position and free cash flow should cater for LT debt maturities.
- Un-drawn revolving credit facility of Euro 750mn expiring in Oct 2012, with option of 2x1 year extension.
Source: Company data, Deutsche Bank; * includes the NOK2.1bn bond issued in 2009.
Figure 90: Amec Figure 91: Lamprell
0
100
200
300
400
500
600
700
Cas
h
Deb
t
2009
2010
2011
2012
GB
P m
n
Free cash flow
Nil
Nil-
30
60
90
120
150
180
Cas
h
Deb
t
2009
2010
2011
2012
Eur
o m
n
Free cash flow
- Strong net cash position supported by positive free cash flows.
Source: Company data, Deutsche Bank
- No debt.
Source: Company data, Deutsche Bank

7 December 2009 Oil & Gas European Oil Services
Page 64 Deutsche Bank AG/London
Figure 92: Petrofac Figure 93: Saipem
-
150
300
450
600
750
Cas
h
ST
debt
LT d
ebt
1 yr
1-2
yrs
2-3
yrs
3-4
yrs
4-5
yrs
> 5
yea
rs
Year of maturity of total debt
US
D m
n
Debt maturity Free cash flow
(700)
-
700
1,400
2,100
2,800
Cas
h
ST
debt
LT d
ebt
2009
2010
2011
2012
2013
Aft
er
Year of maturity of LT debt
Eur
o m
n
LT debt maturity Free cash flow
- Petrofac has a strong net cash position. - Strong free cash flows should cater for future
refinancing requirements.
Source: Company data, Deutsche Bank;
- 78% of loan is provided for by Eni, which has a 43% stake in Saipem. Eni provides strong financial backing for Saipem and thus the refinancing risk is low.
- Following the aggressive capex spend in 2009-11E, the free cash flows from 2010E should cover the long term debt maturities.
- Unused lines of credit available to the extent of $926mn.
Source: Company data, Deutsche Bank
Figure 94: Seadrill Figure 95: Subsea7
(1,000)
-1,000
2,000
3,0004,000
5,000
6,0007,000
8,000
Cas
h
ST
debt
LT d
ebt
2009
2010
2011
2012
2013
and
afte
r
Year of maturity of debt
US
D m
n
Debt maturity Free cash flow
-
100
200
300
400
500
Cas
h
ST
debt
LT d
ebt
2009
2010
2011
2012
2017
Year of maturity of total debt
US
D m
n
Debt maturity Free cash flow
- Has the highest debt exposure relative to peers.
- Strong free cash flows after 2010E provides sufficient cover to meet long term debt maturities.
Source: Company data, Deutsche Bank
- Two convertible bond loans maturing in 2011 and 2017.
- Free cash flows should cater for future re-financing requirements.
Source: Company data, Deutsche Bank
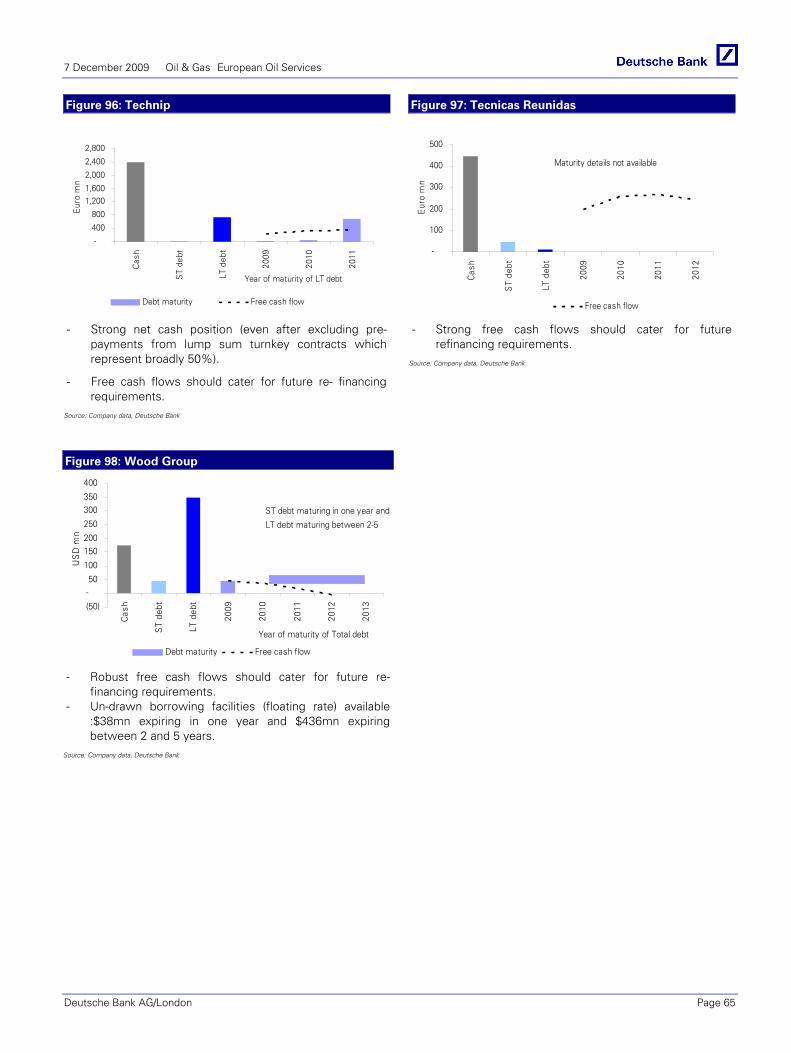
7 December 2009 Oil & Gas European Oil Services
Deutsche Bank AG/London Page 65
Figure 96: Technip Figure 97: Tecnicas Reunidas
-
400
800
1,2001,600
2,000
2,400
2,800
Cas
h
ST
debt
LT d
ebt
2009
2010
2011
Year of maturity of LT debt
Eur
o m
n
Debt maturity Free cash flow
-
100
200
300
400
500
Cas
h
ST
debt
LT d
ebt
2009
2010
2011
2012
Eur
o m
n
Free cash flow
Maturity details not available
- Strong net cash position (even after excluding pre-payments from lump sum turnkey contracts which represent broadly 50%).
- Free cash flows should cater for future re- financing requirements.
Source: Company data, Deutsche Bank
- Strong free cash flows should cater for future refinancing requirements.
Source: Company data, Deutsche Bank
Figure 98: Wood Group
(50)
-50
100
150200
250
300350
400
Cas
h
ST
debt
LT d
ebt
2009
2010
2011
2012
2013
Year of maturity of Total debt
US
D m
n
Debt maturity Free cash flow
ST debt maturing in one year and
LT debt maturing between 2-5
- Robust free cash flows should cater for future re-financing requirements.
- Un-drawn borrowing facilities (floating rate) available :$38mn expiring in one year and $436mn expiring between 2 and 5 years.
Source: Company data, Deutsche Bank

7 December 2009 Oil & Gas European Oil Services
Page 66 Deutsche Bank AG/London
Appendix D: Shallow water drilling duration
Figure 99: Shallow water average drilling duration
0%
20%
40%
60%
80%
100%
2000 2001 2002 2003 2004 2005 2006 2007 2008
Pro
porti
on o
f wel
ls d
rille
d ac
ross
wat
er d
epth
s
20
30
40
50
60
70
80
Ave
rage
dril
ling
days
per
wel
l
0-99 100-199 200-299 300-399 Exploration (RHS) Appraisal (RHS)
Source: Deutsche Bank, Wood Mackenzie

7 December 2009 Oil & Gas European Oil Services
Deutsche Bank AG/London Page 67
Appendix E: Regional spread of contracted newbuild rigs Figure 100: Contracts signed for semi-submersible rigs and drillships coming online
2009-12
39%
14%
10%
4% 3% 3%
27%
Uncontracted S America GOM E Hemisphere Europe Africa Russia
Source: ODS Petrodata, Deutsche Bank
Figure 101: Contracts signed for Jackup rigs coming online 2009-12
4%3% 3%1%
89%
Uncontracted E Hemisphere S America Middle East Europe
Source: ODS Petrodata, Deutsche Bank

7 December 2009 Oil & Gas European Oil Services
Page 68 Deutsche Bank AG/London
Appendix F: NOC/IOC/Independents investment in drilling Figure 102: Snapshot of investment in drilling by operators since 1995
0
200
400
600
800
1000
1200
1400
1600
N America Africa S America South East Asia Europe
Wel
ls d
rille
d
Independent E&P IOC NOC
Source: Deutsche Bank, Wood Mackenzie
Figure 103: Investment in drilling, by operator in
N America
Figure 104: Investment in drilling, by operator in Africa
0
20
40
60
80
100
120
140
160
180
1995
1996
1997
1998
1999
2000
2001
2002
2003
2004
2005
2006
2007
2008
Wel
ls d
rille
d
Independent E&P IOC NOC
0
10
20
30
40
50
60
70
1995
1996
1997
1998
1999
2000
2001
2002
2003
2004
2005
2006
2007
2008
Wel
ls d
rille
d
Independent E&P IOC NOC
Source: Deutsche Bank, Wood Mackenzie Source: Deutsche Bank, Wood Mackenzie

7 December 2009 Oil & Gas European Oil Services
Deutsche Bank AG/London Page 69
Figure 105: Investment in drilling, by operator in
S America
Figure 106: Investment in drilling, by operator in South
East Asia
0
10
20
30
40
50
60
70
80
1995
1996
1997
1998
1999
2000
2001
2002
2003
2004
2005
2006
2007
2008
Wel
ls d
rille
d
Independent E&P IOC NOC
0
5
10
15
20
25
30
35
40
45
1995
1996
1997
1998
1999
2000
2001
2002
2003
2004
2005
2006
2007
2008
Wel
ls d
rille
d
Independent E&P IOC NOC
Source: Deutsche Bank, Wood Mackenzie Source: Deutsche Bank, Wood Mackenzie
Figure 107: Investment in drilling, by operator in Europe
0
2
4
6
8
10
12
14
16
1995
1996
1997
1998
1999
2000
2001
2002
2003
2004
2005
2006
2007
2008
Wel
ls d
rille
d
Independent E&P IOC
Source: Deutsche Bank, Wood Mackenzie

7 Decem
ber 2009 O
il & G
as European O
il Services
Page 70
Deutsche B
ank AG
/London
Appendix G: Calculations behind backlog cover analysis Figure 108: Detailed working of backlog cover for forward year
Future year (FY) for which revenue cover is calculatedBacklog as at end of quarter Q3 2006 Q4 2006 Q1 2007 Q2 2007 Q3 2007 Q4 2007 Q1 2008 Q2 2008 Q3 2008 Q4 2008 Q1 2009 Q2 2009 Q3 2009
Acergy Backlog 2,618 2,587 2,557 3,031 2,745 3,175 3,972 3,649 3,281 2,511 2,432 2,415 2,628 (USD mn) Backlog expected to be booked as revenue in FY * 27% 21% 32% 42% 16% 21% 28% 36% 33% 30% 33% 44% 53%
Implied revenue 707 543 818 1,273 439 667 1,112 1,314 1,083 753 803 1,063 1,393
Revenue of FY 2,522 2,522 2,522 2,522 2,145 2,145 2,145 2,145 2,655 2,242 2,097 2,076 2,251
Backlog cover of FY revenue (X) 28% 22% 32% 50% 20% 31% 52% 61% 41% 34% 38% 51% 62%% of FY revenue dependant on incremental contracts (1-X) 72% 78% 68% 50% 80% 69% 48% 39% 59% 66% 62% 49% 38%
Saipem Backlog 12,804 13,090 13,268 13,348 13,343 15,390 15,409 16,191 19,041 19,105 19,045 19,015 18,354 (EUR mn) Backlog expected to be booked as revenue in FY * 19% 23% 26% 30% 40%
Implied revenue 3,600 4,394 5,000 5,705 7,300
Revenue of FY 10,094 10,094 10,094 10,094 9,828 9,828 9,828 9,828 10,961 9,539 9,816 9,566 9,539
Backlog cover of FY revenue (X) 33% 46% 51% 60% 77%% of FY revenue dependant on incremental contracts (1-X) 67% 54% 49% 40% 23%
Subsea 7 Backlog 3,500 3,748 3,809 3,938 4,200 4,200 3,911 3,745 4,100 3,300 2,907 2,864 2,976 (USD mn) Backlog expected to be booked as revenue in FY * 22% 20% 28% 30% 21% 24% 27% 32% 22% 24% 25% 33% 41%
Implied revenue 760 765 1,062 1,189 895 1,017 1,073 1,197 884 794 732 954 1,232
Revenue of FY 2,373 2,373 2,373 2,373 2,243 2,243 2,243 2,243 2,511 2,171 2,036 2,003 2,171
Backlog cover of FY revenue (X) 32% 32% 45% 50% 40% 45% 48% 53% 35% 37% 36% 48% 57%% of FY revenue dependant on incremental contracts (1-X) 68% 68% 55% 50% 60% 55% 52% 47% 65% 63% 64% 52% 43%
Technip Backlog 10,852 10,273 9,879 9,670 9,411 9,390 8,625 8,053 7,717 7,208 6,928 6,066 7,541 (EUR mn) Backlog expected to be booked as revenue in FY * 33% 33% 39% 46% 21% 25% 31% 42% 28% 23% 31% 42% 50%
Implied revenue 3,616 3,402 3,855 4,432 2,009 2,321 2,649 3,342 2,140 1,685 2,153 2,573 3,785
Revenue of FY 7,481 7,481 7,481 7,481 6,417 6,417 6,417 6,417 6,210 5,646 5,573 5,785 5,646
Backlog cover of FY revenue (X) 48% 45% 52% 59% 31% 36% 41% 52% 34% 30% 39% 44% 67%% of FY revenue dependant on incremental contracts (1-X) 52% 55% 48% 41% 69% 64% 59% 48% 66% 70% 61% 56% 33%
2010E2008 2009E
Source: Deutsche Bank, company data, * As per company guidance
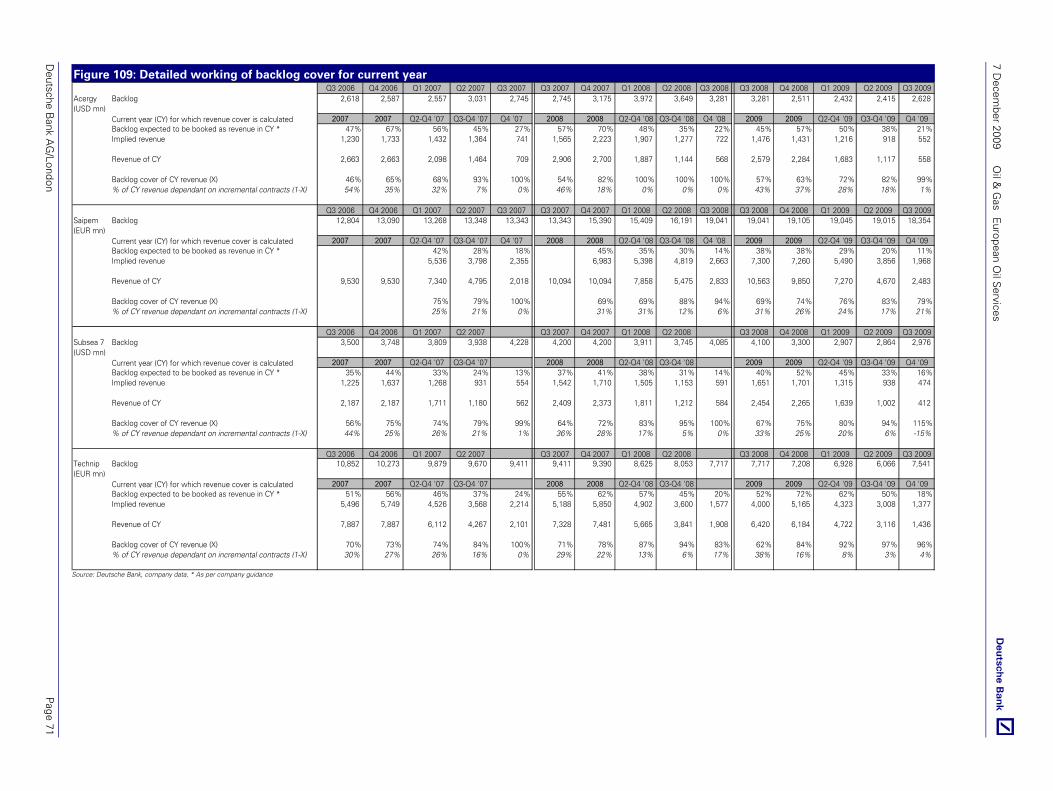
Deutsche B
ank AG
/London P
age 71
7 Decem
ber 2009 O
il & G
as European O
il Services
Figure 109: Detailed working of backlog cover for current year Q3 2006 Q4 2006 Q1 2007 Q2 2007 Q3 2007 Q3 2007 Q4 2007 Q1 2008 Q2 2008 Q3 2008 Q3 2008 Q4 2008 Q1 2009 Q2 2009 Q3 2009
Acergy Backlog 2,618 2,587 2,557 3,031 2,745 2,745 3,175 3,972 3,649 3,281 3,281 2,511 2,432 2,415 2,628 (USD mn)
Current year (CY) for which revenue cover is calculated 2007 2007 Q2-Q4 '07 Q3-Q4 '07 Q4 '07 2008 2008 Q2-Q4 '08 Q3-Q4 '08 Q4 '08 2009 2009 Q2-Q4 '09 Q3-Q4 '09 Q4 '09Backlog expected to be booked as revenue in CY * 47% 67% 56% 45% 27% 57% 70% 48% 35% 22% 45% 57% 50% 38% 21%Implied revenue 1,230 1,733 1,432 1,364 741 1,565 2,223 1,907 1,277 722 1,476 1,431 1,216 918 552
Revenue of CY 2,663 2,663 2,098 1,464 709 2,906 2,700 1,887 1,144 568 2,579 2,284 1,683 1,117 558
Backlog cover of CY revenue (X) 46% 65% 68% 93% 100% 54% 82% 100% 100% 100% 57% 63% 72% 82% 99%% of CY revenue dependant on incremental contracts (1-X) 54% 35% 32% 7% 0% 46% 18% 0% 0% 0% 43% 37% 28% 18% 1%
Q3 2006 Q4 2006 Q1 2007 Q2 2007 Q3 2007 Q3 2007 Q4 2007 Q1 2008 Q2 2008 Q3 2008 Q3 2008 Q4 2008 Q1 2009 Q2 2009 Q3 2009Saipem Backlog 12,804 13,090 13,268 13,348 13,343 13,343 15,390 15,409 16,191 19,041 19,041 19,105 19,045 19,015 18,354 (EUR mn)
Current year (CY) for which revenue cover is calculated 2007 2007 Q2-Q4 '07 Q3-Q4 '07 Q4 '07 2008 2008 Q2-Q4 '08 Q3-Q4 '08 Q4 '08 2009 2009 Q2-Q4 '09 Q3-Q4 '09 Q4 '09Backlog expected to be booked as revenue in CY * 42% 28% 18% 45% 35% 30% 14% 38% 38% 29% 20% 11%Implied revenue 5,536 3,798 2,355 6,983 5,398 4,819 2,663 7,300 7,260 5,490 3,856 1,968
Revenue of CY 9,530 9,530 7,340 4,795 2,018 10,094 10,094 7,858 5,475 2,833 10,563 9,850 7,270 4,670 2,483
Backlog cover of CY revenue (X) 75% 79% 100% 69% 69% 88% 94% 69% 74% 76% 83% 79%% of CY revenue dependant on incremental contracts (1-X) 25% 21% 0% 31% 31% 12% 6% 31% 26% 24% 17% 21%
Q3 2006 Q4 2006 Q1 2007 Q2 2007 Q3 2007 Q4 2007 Q1 2008 Q2 2008 Q3 2008 Q4 2008 Q1 2009 Q2 2009 Q3 2009Subsea 7 Backlog 3,500 3,748 3,809 3,938 4,228 4,200 4,200 3,911 3,745 4,085 4,100 3,300 2,907 2,864 2,976 (USD mn)
Current year (CY) for which revenue cover is calculated 2007 2007 Q2-Q4 '07 Q3-Q4 '07 2008 2008 Q2-Q4 '08 Q3-Q4 '08 2009 2009 Q2-Q4 '09 Q3-Q4 '09 Q4 '09Backlog expected to be booked as revenue in CY * 35% 44% 33% 24% 13% 37% 41% 38% 31% 14% 40% 52% 45% 33% 16%Implied revenue 1,225 1,637 1,268 931 554 1,542 1,710 1,505 1,153 591 1,651 1,701 1,315 938 474
Revenue of CY 2,187 2,187 1,711 1,180 562 2,409 2,373 1,811 1,212 584 2,454 2,265 1,639 1,002 412
Backlog cover of CY revenue (X) 56% 75% 74% 79% 99% 64% 72% 83% 95% 100% 67% 75% 80% 94% 115%% of CY revenue dependant on incremental contracts (1-X) 44% 25% 26% 21% 1% 36% 28% 17% 5% 0% 33% 25% 20% 6% -15%
Q3 2006 Q4 2006 Q1 2007 Q2 2007 Q3 2007 Q4 2007 Q1 2008 Q2 2008 Q3 2008 Q4 2008 Q1 2009 Q2 2009 Q3 2009Technip Backlog 10,852 10,273 9,879 9,670 9,411 9,411 9,390 8,625 8,053 7,717 7,717 7,208 6,928 6,066 7,541 (EUR mn)
Current year (CY) for which revenue cover is calculated 2007 2007 Q2-Q4 '07 Q3-Q4 '07 2008 2008 Q2-Q4 '08 Q3-Q4 '08 2009 2009 Q2-Q4 '09 Q3-Q4 '09 Q4 '09Backlog expected to be booked as revenue in CY * 51% 56% 46% 37% 24% 55% 62% 57% 45% 20% 52% 72% 62% 50% 18%Implied revenue 5,496 5,749 4,526 3,568 2,214 5,188 5,850 4,902 3,600 1,577 4,000 5,165 4,323 3,008 1,377
Revenue of CY 7,887 7,887 6,112 4,267 2,101 7,328 7,481 5,665 3,841 1,908 6,420 6,184 4,722 3,116 1,436
Backlog cover of CY revenue (X) 70% 73% 74% 84% 100% 71% 78% 87% 94% 83% 62% 84% 92% 97% 96%% of CY revenue dependant on incremental contracts (1-X) 30% 27% 26% 16% 0% 29% 22% 13% 6% 17% 38% 16% 8% 3% 4%
Source: Deutsche Bank, company data, * As per company guidance

7 December 2009 Oil & Gas European Oil Services
Page 72 Deutsche Bank AG/London
Appendix H: Regional split of shallow water capex
Figure 110: Regional split of shallow water capex 2006-11E
-
20,000
40,000
60,000
80,000
100,000
120,000
2006 2007 2008 2009E 2010E 2011E
Cap
ex ($
mn)
Africa Europe Middle East Russia SE Asia Caspian S. America N. America
Source: Deutsche Bank, Wood Mackenzie

7 December 2009 Oil & Gas European Oil Services
Deutsche Bank AG/London Page 73
Appendix I: Detailed overview of companies’ fleet
Figure 111: Summary of offshore asset profiles of companies; newbuild vessels coming online from 2010 shown in
brackets Category Acergy Saipem Subsea 7 Technip SeadrillCons. & pipelay ship 6 1(+1) 4 (+1) 2Construction ship 4 7 2 6Pipelay ship 2 3 (+1) 3 (+2) 2 (+2)Semisubmersible rig 5 (+2) 8 (+2)Drillship 1 (+1) 3 (+1)Jack up rig 6 9 (+3)Tender rig 14 (+3)Pipelay barge 2 8Cargo barge 7Diving support vessel (+1) 1 (+1) 6 7Inspection maintenance repair (IMR) vessel 3 3Remotely operated vehicle (ROV) support vessel 1 4
Source: Deutsche Bank, Company data
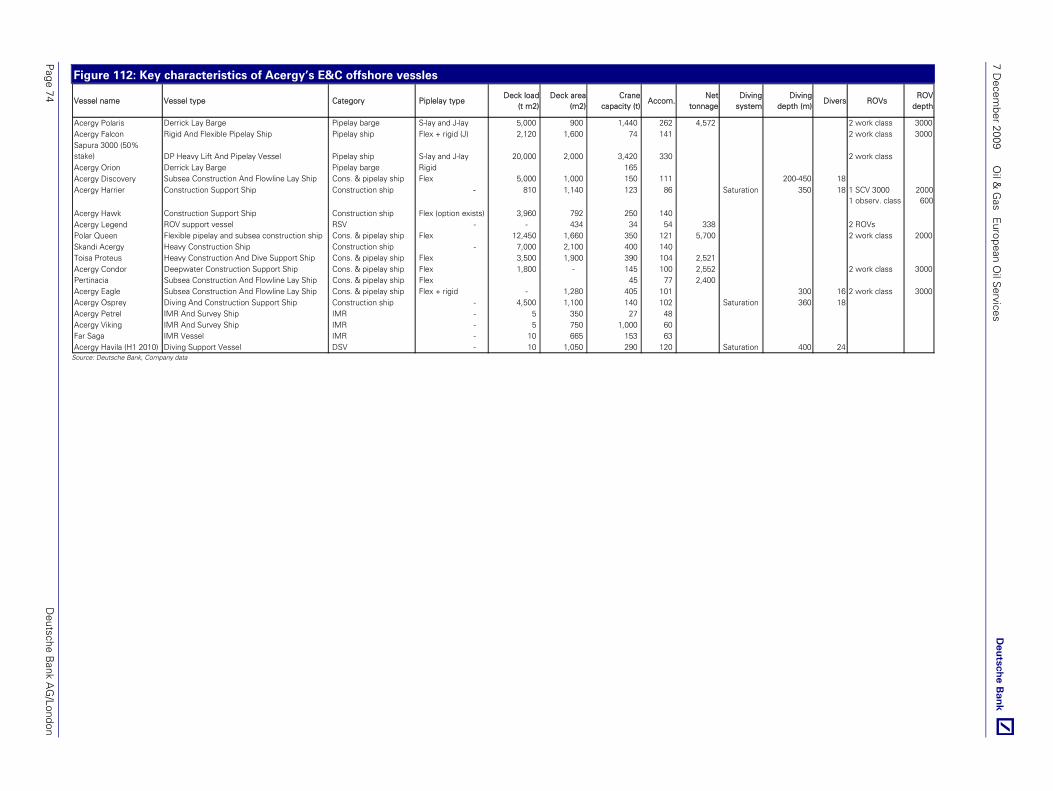
7 Decem
ber 2009 O
il & G
as European O
il Services
Page 74
Deutsche B
ank AG
/London
Figure 112: Key characteristics of Acergy’s E&C offshore vessles
Vessel name Vessel type Category Piplelay type Deck load
(t m2) Deck area
(m2) Crane
capacity (t) Accom.
Net tonnage
Diving system
Diving depth (m)
Divers ROVs ROV
depth
Acergy Polaris Derrick Lay Barge Pipelay barge S-lay and J-lay 5,000 900 1,440 262 4,572 2 work class 3000Acergy Falcon Rigid And Flexible Pipelay Ship Pipelay ship Flex + rigid (J) 2,120 1,600 74 141 2 work class 3000Sapura 3000 (50% stake) DP Heavy Lift And Pipelay Vessel Pipelay ship S-lay and J-lay 20,000 2,000 3,420 330 2 work classAcergy Orion Derrick Lay Barge Pipelay barge Rigid 165 Acergy Discovery Subsea Construction And Flowline Lay Ship Cons. & pipelay ship Flex 5,000 1,000 150 111 200-450 18Acergy Harrier Construction Support Ship Construction ship - 810 1,140 123 86 Saturation 350 18 1 SCV 3000
1 observ. class2000600
Acergy Hawk Construction Support Ship Construction ship Flex (option exists) 3,960 792 250 140 Acergy Legend ROV support vessel RSV - - 434 34 54 338 2 ROVsPolar Queen Flexible pipelay and subsea construction ship Cons. & pipelay ship Flex 12,450 1,660 350 121 5,700 2 work class 2000Skandi Acergy Heavy Construction Ship Construction ship - 7,000 2,100 400 140 Toisa Proteus Heavy Construction And Dive Support Ship Cons. & pipelay ship Flex 3,500 1,900 390 104 2,521 Acergy Condor Deepwater Construction Support Ship Cons. & pipelay ship Flex 1,800 - 145 100 2,552 2 work class 3000Pertinacia Subsea Construction And Flowline Lay Ship Cons. & pipelay ship Flex 45 77 2,400 Acergy Eagle Subsea Construction And Flowline Lay Ship Cons. & pipelay ship Flex + rigid - 1,280 405 101 300 16 2 work class 3000Acergy Osprey Diving And Construction Support Ship Construction ship - 4,500 1,100 140 102 Saturation 360 18Acergy Petrel IMR And Survey Ship IMR - 5 350 27 48 Acergy Viking IMR And Survey Ship IMR - 5 750 1,000 60 Far Saga IMR Vessel IMR - 10 665 153 63 Acergy Havila (H1 2010) Diving Support Vessel DSV - 10 1,050 290 120 Saturation 400 24
Source: Deutsche Bank, Company data

Deutsche B
ank AG
/London P
age 75
7 Decem
ber 2009 O
il & G
as European O
il Services
Figure 113: Key characteristics of Saipem’s E&C offshore vessles (excludes drilling*)
Vessel name Vessel type Category Piplelay type Deck load
(t m2) Deck area
(m2) Crane
capacity (t) Accom.
Saipem 3000 Self propelled DP crane vessel Construction ship 54,000 3,000 2,191 195 Saipem FDS Multi-purpose monohull DP crane and pipelay (J-lay) vessel Cons. & pipelay ship J-Lay 4,000 660 235 Castoro Sei Semisubmersible pipelay vessel Pipelay ship Rigid 3,600 1,525 120 330 Castoro II Derrick/lay barge Pipelay barge 1,178 248 Castoro Otto Self propelled derrick/lay ship Pipelay ship 6,699 2,291 339 Saipem 7000 Semisubmersible crane and pipelaying (J-lay) DP vessel Pipelay ship J-Lay 15,000 9,000 17,500 725 S 355 Derrick/lay barge Pipelay barge 3,200 1,300 590 206 Crawler Derrick/lay barge Pipelay barge 600 230 Normand Cutter Installation and Construction Construction ship 1,600 300 114 DP Reel Installation and Construction Construction ship 700 50 50 Hos Innovator Installation and Construction Construction ship 3,760 752 36 Harvey Discovery Installation and Construction Construction ship 4,050 900 46 OC 280 Installation and Construction Construction ship 3,715 743 66 S 44 Launching/cargo barge Cargo barge 8,500 S 600 Launching/cargo barge Cargo bargeCastoro XI Heavy duty cargo barge Cargo barge 5,200 S45 Launching/cargo barge Cargo barge 6,500 Castoro 9 Launching/cargo barge Cargo bargeS42 Launching/cargo barge Cargo barge 3,450 SB 103 Cargo barge Cargo bargeSemac 1 Semisubmersible pipelay barge Pipelay barge 5,000 518 362 Castoro 10 Trench/pipelay barge Pipelay barge 3,600 1,000 188 168 SB 230 Work/pipelaying/accommodation barge Pipelay barge 86 120 Castoro 12 Shallow water pipelay barge, Caspian Sea service Pipelay barge 55 150 Ersai 1 Construction/ lifting vessel Construction ship 2,100 Saipem TRB Trench/pipelay barge Pipelay barge 67 45 TRB Tender 4 post trenching/backfilling crafts IMR 4 Bar Protector DP dive support vessel DSV 800 100 109 Grampian Surveyor Survey and IRM IMR 600 100 Far Sovereign Multi-functional anchor handling tug and service vessel IMR 2,200 100 70 Castoro One (Q3 2011) Pipe lay vessel Pipelay shipSaipem FDS2 (Q2 2011) Field development vessel Cons. & pipelay shipNew DSV (Q3 2011) DSV DSV
Source: Deutsche Bank, Company data; * Saipem additionally has 6 Jackup rigs, 5 semi-submersible rigs (+2 newbuild rigs) and 1 drillship (+1 newbuild)

7 Decem
ber 2009 O
il & G
as European O
il Services
Page 76
Deutsche B
ank AG
/London
Figure 114: Key characteristics of Subsea 7’s E&C offshore vessles
Vessel name Vessel type Category Piplelay type Deck load
(t m2) Deck area
(m2) Crane
capacity (t) Accom.
Net tonnage
Diving system
Diving depth (m)
Divers ROVs ROV
depth
Amazonia ROV support vessel RSV 1,000 610 50 58 Kommandor 3000 Pipelay Pipelay ship Flex 1,000 750 260 73 2,319 2 work classLochnagar Pipelay Pipelay ship Flex 326 73 1,923 2 work class 2000Normand Seven Pipelay Pipelay ship Flex 20,000 2,000 280 100 2 work class 3000Seven Oceans Pipelay Pipelay ship Rigid + Flex 6,500 650 402 120 5,460 2 work class 3000Seven Seas Pipelay and construction vessel Cons. & pipelay ship Flex (J-lay) 17,500 1,750 472 120 5,475 2 work class 3000Seven Sisters Construction vessel Construction ship - 1,150 150 100 1,450 Skandi Navica Pipelay Pipelay ship Rigid + Flex 3,000 480 66 73 1,859 Skandi Neptune Pipelay and construction vessel Cons. & pipelay ship Vertical + Flex 9,400 1,180 150 106 2,383 2 work class 3000Skandi Seven Construction vessel Construction ship NA 13,000 1,300 256 120 Subsea Viking Pipelay and construction vessel Cons. & pipelay ship Flex 5,750 1,150 100 70 2,220 2 work class
1 observ. class3000
Toisa Perseus Pipelay and construction vessel Cons. & pipelay ship Vertical 7,900 1,580 180 106 2,085 2 work classRockwater 1 Dive support vessel DSV NA 2,750 550 120 94 Saturation 300 15Rockwater 2 Dive support vessel DSV NA 5,750 1,150 307 106 1,797 Saturation 300 16Seven Atlantic Dive support vessel DSV NA 12,000 1,200 145 150 Saturation 350 24 2 ROVs 3000Seven Pelican Dive support vessel DSV NA 6,830 800 65 105 Saturation 370 18 1 Observ. classSeven Spray Air diving support vessel DSV - 11 - 50 2
Toisa Polaris Dive support vessel DSV NA 4,350 870 150 103 2,471 Saturation 231 181 Observ. Class1 work class
Kommandor Subsea ROV support vessel RSV NA 1,600 320 5 44 Seisranger ROV support vessel RSV NA 2,600 520 50 69 Normand Subsea 7 (Q4 2ROV support vessel RSV NA 7,050 705 140 90 Seven Pacific (Q4 2010) Construction Support Ship Cons. & pipelay ship Vertical 17,000 1,700 310 100 2 work class 3,000
Source: Deutsche Bank, Company data
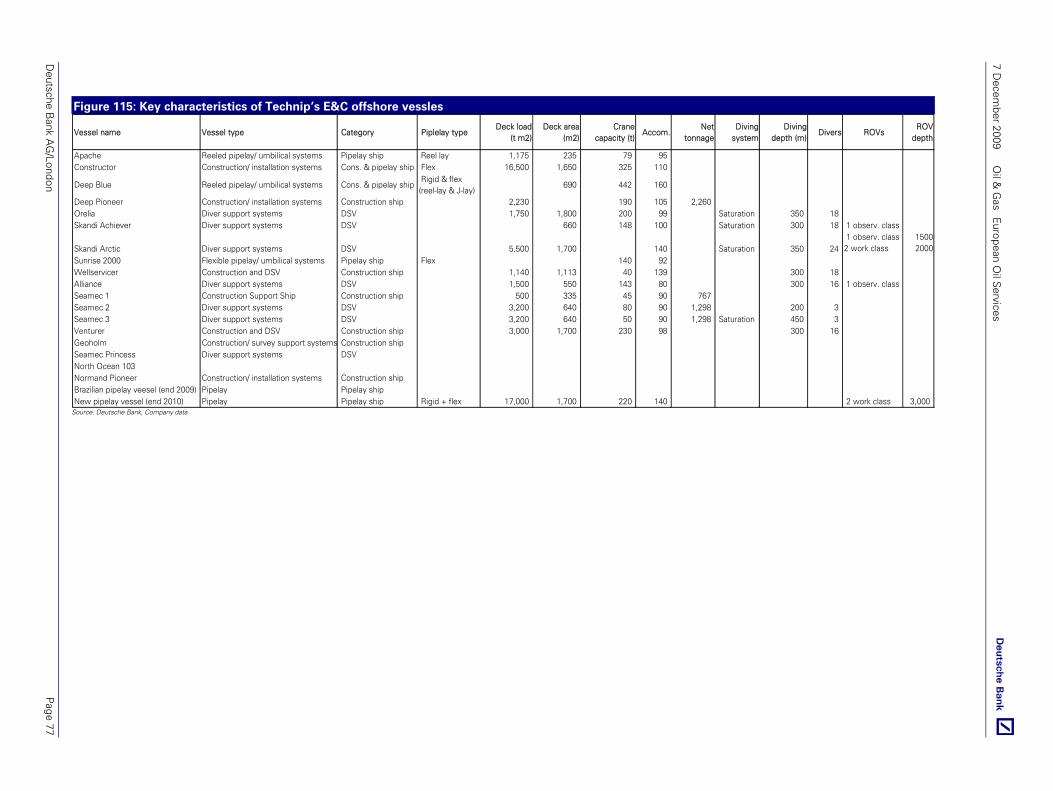
Deutsche B
ank AG
/London P
age 77
7 Decem
ber 2009 O
il & G
as European O
il Services
Figure 115: Key characteristics of Technip’s E&C offshore vessles
Vessel name Vessel type Category Piplelay type Deck load
(t m2) Deck area
(m2) Crane
capacity (t) Accom.
Net tonnage
Diving system
Diving depth (m)
Divers ROVs ROV
depth
Apache Reeled pipelay/ umbilical systems Pipelay ship Reel lay 1,175 235 79 95 Constructor Construction/ installation systems Cons. & pipelay ship Flex 16,500 1,650 325 110
Deep Blue Reeled pipelay/ umbilical systems Cons. & pipelay ship Rigid & flex (reel-lay & J-lay)
690 442 160
Deep Pioneer Construction/ installation systems Construction ship 2,230 190 105 2,260 Orelia Diver support systems DSV 1,750 1,800 200 99 Saturation 350 18 Skandi Achiever Diver support systems DSV 660 148 100 Saturation 300 18 1 observ. class
Skandi Arctic Diver support systems DSV 5,500 1,700 140 Saturation 350 24 1 observ. class2 work class
15002000
Sunrise 2000 Flexible pipelay/ umbilical systems Pipelay ship Flex 140 92 Wellservicer Construction and DSV Construction ship 1,140 1,113 40 139 300 18 Alliance Diver support systems DSV 1,500 550 143 80 300 16 1 observ. classSeamec 1 Construction Support Ship Construction ship 500 335 45 90 767 Seamec 2 Diver support systems DSV 3,200 640 80 90 1,298 200 3 Seamec 3 Diver support systems DSV 3,200 640 50 90 1,298 Saturation 450 3 Venturer Construction and DSV Construction ship 3,000 1,700 230 98 300 16 Geoholm Construction/ survey support systems Construction shipSeamec Princess Diver support systems DSVNorth Ocean 103Normand Pioneer Construction/ installation systems Construction shipBrazilian pipelay veesel (end 2009) Pipelay Pipelay shipNew pipelay vessel (end 2010) Pipelay Pipelay ship Rigid + flex 17,000 1,700 220 140 2 work class 3,000
Source: Deutsche Bank, Company data

7 December 2009 Oil & Gas European Oil Services
Page 78 Deutsche Bank AG/London
Appendix J: ‘Backlog longevity’ calculation explained We have built upon our extensive database of contract awards to compute the average duration of contracts for each company across different segments since 2006. Companies do not report all contract awards due to issues with client confidentiality and so the scope of this analysis is limited to the extent of contract awards reported by companies in their press releases.
Our assumptions include:
�Contracts have been divided broadly into three segments – Engineering & Construction (E&C), Power (P) & Drilling (D). E&C and P contracts are further categorised based on the type of spend it is from the client’s perspective; i.e., whether it is capital expenditure (C) (typically engineering, construction and/or installation related) or operating expenditure (O) (typically maintenance related).
�Contract duration has been weighted by its relative value. In the case of Amec and Wood Group however, where contract values were not available consistently, our weighting was done on the basis of their respective contract counts in each segment.
�Where the term length was not available, we have taken the yearly average for that particular sub segment. If the average for the year was not available, that of the previous year was taken.
Figure 116: Average contract duration - 2008 Figure 117: Average contract duration - 2009
4.4
3.9
2.9
3.4
2.82.7 2.6 2.4
2.0 1.9
4.9
1.5
2.3
3.0
3.8
4.5
5.3
Sea
drill
AM
EC
*
Sub
sea
7
Sai
pem
Tecn
icas
Woo
d G
roup
*
Ace
rgy
Pet
rofa
c
Ake
r S
olut
ions
Lam
prel
l
Tech
nip
Ave
rage
con
trac
t du
ratio
n
0%
20%
40%
60%
80%
100%
Seg
men
t sp
lit b
y va
lue*
E&C (capex) E&C (opex) Power Drilling Company average
1.0
2.72.72.82.93.03.03.2
4.0
3.6
0.51.01.52.02.53.03.54.04.5
Ace
rgy
Tecn
icas
Pet
rofa
c
Woo
d G
roup
*
Sai
pem
Ake
r S
olut
ions
Tech
nip
Sub
sea
7
AM
EC
*
Lam
prel
l
Ave
rage
con
trac
t du
ratio
n
0%
20%
40%
60%
80%
100%
Seg
men
t sp
lit b
y va
lue
*
E&C (capex) E&C (opex) Power Drilling Company average
Source: Deutsche Bank, Company data
* In the case of Amec and Woodgroup, since contract values are not available we have used contract count

Deutsche B
ank AG
/London P
age 79
7 Decem
ber 2009 O
il & G
as European O
il Services
Figure 118: Average contract age calculation
WeightAverage age
(yrs)Weight
Average age (yrs)
WeightAverage age
(yrs)Weight
Average age (yrs)
WeightAverage age
(yrs)Weight
Average age (yrs)
Segment C/O * Segment C/O C/O Segment Segment C/O C/O Segment Segment C/O C/O Segment Segment C/O C/O Segment Segment C/O C/O Segment Segment C/O C/O Segment2009 C 100% 4.0 93% 3.0 80% 3.0 100% 1.0 97% 3.2 100% 2.8
O NA NA 7% 2.4 20% 3.0 NA NA 3% 4.9 NA NAC NA NA NA 0.0 100% 2.0 2.0 100% 2.2 NA NA NA 0.0 NA NA NA 0.0 NA NA NA 0.0O NA NA NA NA NA NA NA NA NA NA NA NA NA NA NA
D - NA NA NA 0.0 NA NA NA 0.0 NA NA NA 0.0 NA NA NA 0.0 NA NA NA 0.0 19% 100% 3.8 3.8
4.0 2.9 2.7 1.0 3.2 3.02008 C 100% 2.7 74% 2.4 75% 4.1 100% 2.0 90% 2.4 98% 3.5
O NA NA 26% 2.5 25% 4.0 NA NA 10% 3.6 2% 5.0C NA NA NA 0.0 NA NA NA 0.0 78% 3.3 NA NA NA 0.0 NA NA NA 0.0 NA NA NA 0.0O NA NA NA NA NA NA 22% 10.0 NA NA NA NA NA NA NA NA NA
D - NA NA NA 0.0 NA NA NA 0.0 NA NA NA 0.0 NA NA NA 0.0 NA NA NA 0.0 17% 100% 2.8 2.8
2.7 2.4 4.4 2.0 2.6 3.42007 C 86% 1.1 94% 2.3 65% 2.0 100% 1.7 95% 2.3 100% 2.5
O 14% 3.9 6% 3.0 35% 4.2 NA NA 5% 1.1 NA NAC NA NA NA 0.0 100% 1.8 1.8 78% 1.9 NA NA NA 0.0 NA NA NA 0.0 NA NA NA 0.0O NA NA NA NA NA 22% 3.5 NA NA NA NA NA NA NA NA NA
D - NA NA NA 0.0 NA NA NA 0.0 NA NA NA 0.0 NA NA NA 0.0 NA NA NA 0.0 22% 100% 4.1 4.1
1.5 2.3 2.6 1.7 2.3 2.82006 C 100% 1.9 92% 2.3 71% 7.2 95% 0.6 98% 2.5 92% 2.6
O NA NA 8% 3.0 29% 3.3 5% 0.1 2% 1.0 8% 6.0C NA NA NA 0.0 100% 2.0 2.0 100% 2.0 NA NA NA 0.0 NA NA NA 0.0 NA NA NA 0.0O NA NA NA NA NA NA NA NA NA NA NA NA NA NA NA NA
D - NA NA NA 0.0 NA NA NA 0.0 NA NA NA 0.0 NA NA NA 0.0 NA NA NA 0.0 28% 100% 4.6 4.6
1.9 2.3 5.6 0.6 2.5 3.4
92%
13%
2.3
6.1
2.0
2.3
35%
88%2.3
Company avg.
E&C 100%
1.5
1.9
2.7 2.4 4.1
2.5
3.6
2.5
2.9
2.6 83%
72%
2.3
2.8
100%
78%
Acergy Aker Amec Lamprell Petrofac Saipem
E&C
E&C
100%
100% 99%
100%
65% 2.8
100%
100%
100%
100%
2.0
1.7
0.6
100%
E&C 100% 4.0 98% 3.0 100%
57%
43%
3.056%
44%
4.8
100% 3.2 81%
2.2
1.0
2%
8%
1%
PP
PP
PP
PP
Company avg.
Company avg.
Company avg.
Source: Deutsche Bank, Company data, * C/O refers to Capex/ Opex
Figure 119: Average contract age calculation continued…
WeightAverage age
(yrs)Weight
Average age (yrs)
WeightAverage age
(yrs)Weight
Average age (yrs)
WeightAverage age
(yrs)Segment C/O * Segment C/O C/O Segment Segment C/O C/O Segment Segment C/O C/O Segment Segment C/O C/O Segment Segment C/O C/O Segment
2009 C NA NA 86% 2.3 100% 2.8 100% 3.6 82% 3.5O NA NA 14% 5.7 NA NA NA NA 18% 2.3C NA NA NA 0.0 0% NA NA 0.0 NA NA NA 0.0 NA NA NA 0.0 44% 0.3O 0% NA NA NA NA NA NA NA NA 56% 4.4
D - 100% 100% 0.2 0.2 0% NA NA 0.0 NA NA NA 0.0 NA NA NA 0.0 0% NA NA 0.0
0.2 2.7 2.8 3.6 3.02008 C NA NA 67% 1.6 100% 1.9 100% 2.9 82% 2.4
O NA NA 33% 8.5 NA NA NA NA 18% 4.3C NA NA NA 0.0 0% NA NA 0.0 NA NA NA 0.0 NA NA NA 0.0 70% 1.6O 0% NA NA NA NA NA NA NA NA 30% 6.5
D - 100% 100% 4.9 4.9 0% NA NA 0.0 NA NA NA 0.0 NA NA NA 0.0 0% NA NA 0.0
4.9 3.9 1.9 2.9 2.82007 C NA NA 95% 2.9 100% 2.1 100% 3.5 69% 1.7
O NA NA 5% 3.3 NA NA NA NA 31% 2.8C NA NA NA 0.0 0% NA NA 0.0 NA NA NA 0.0 NA NA NA 0.0 42% 0.8O 0% NA NA NA NA NA NA NA NA 58% 9.1
D - 100% 100% 3.5 3.5 0% NA NA 0.0 NA NA NA 0.0 NA NA NA 0.0 0% NA NA 0.0
3.5 3.0 2.1 3.5 3.82006 C NA NA 100% 4.1 100% 2.0 100% 2.9 72% 2.2
O NA NA 0% NA NA NA NA NA 28% 3.2C NA NA NA 0.0 0% NA NA 0.0 NA NA NA 0.0 NA NA NA 0.0 33% 0.8O 0% NA NA NA NA NA NA NA NA 67% 6.0
D - 100% 100% 3.2 3.2 0% NA NA 0.0 NA NA NA 0.0 NA NA NA 0.0 0% NA NA 0.0
3.2 4.1 2.0 2.9 2.8
31%
5.7
4.319%
48%
Company avg.
E&C
100%NA 0.0
3.5
2.9
2.7
2.0
2.5
69%
52%
81%
2.9
3.1
100%
100%NA
NA 0.0
3.0
4.1 100%
100%NA
100%
1.9
2.1
2.0
3.9 100%
100%
100%
0.0 100%
Subsea 7 TechnipSeadrill Tecnicas Woodgroup
E&C
E&C
E&C 0.0 100% 2.82.7 100% 3.6 65% 3.3
35% 2.6PP
PP
PP
PP
Company avg.
Company avg.
Company avg.
Source: Deutsche Bank, Company data, * C/O refers to Capex/ Opex

7 December 2009 Oil & Gas European Oil Services
Page 80 Deutsche Bank AG/London
Appendix K: Asset utilisations In analysing the degree of asset utilisation covered by existing contracts, we attempted to ‘map’ contracts to specific assets and in turn estimate the ‘un-contracted’ capacity for 2009-12E. The key constraint was the limited data available on contracts reported. We have analysed contracts awarded across 2006-09 YTD.
Our assumptions include:
Vessels have been divided into three broad categories: Construction & Pipelay, Drilling and FPSO. We have classified vessels outside these categories into ‘others’.
Based on the contract award date and duration, we have apportioned utilisation % by years for each asset. Where the details of term length were not available, we have used the average term length for the year of the respective company.
We have assumed 100% utilisation where a vessel is working on multiple contracts during a year as we have not been able to apportion utilisation specifically across the contracts. Where the asset is being fully engaged we have highlighted this in grey.
For simplicity we have used 100% to indicate continual operation. In reality however vessels typically work for a maximum of 90-95% a year due to yard stay/ repairs.
Figure 120: Average utilisations of vessels (related to
subsea contracts disclosed*) and depreciation/EBITDA
Figure 121: % of contracts disclosed* that have no
vessel accounted for (but by their definition will be
using one)
40%
45%
50%
55%
60%
65%
70%
75%
80%
Subsea 7 Acergy Technip Seadrill Saipem
Ave
rage
util
isat
ion
09-1
2
0%
5%
10%
15%
20%
25%
30%
35%
40%
Avg
. Dep
reci
atio
n/ E
BIT
DA
09-
12
Average utilisation 09-12 (LHS) Avg. 2009-12 Depreciation/EBITDA
0%
10%
20%
30%
40%
50%
60%
70%
80%
90%
100%
Subsea 7 Acergy Technip Seadrill Saipem
% o
f co
ntra
cts
repo
rted
0%
10%
20%
30%
40%
50%
60%
70%
80%
90%
100%
% o
f co
ntra
cts
that
hav
e no
ves
sels
acco
unte
d fo
r% of contracts reported % of contracts disclosed that have no vessels accounted for
Source: Deutsche Bank, Company data; *note we have analysed all contracts that have been disclosed; generally speaking this does not represent all of the contracts won - this is shown on the figure121 alongside
Source: Deutsche Bank, Company data; *note we have analysed all contracts that have been disclosed; generally speaking this does not represent all of the contracts won - this is shown on LHS y-axis

Deutsche B
ank AG
/London P
age 81
7 Decem
ber 2009 O
il & G
as European O
il Services
Figure 122: Acergy asset utilisation Vessle type Contract award Date Client Name Region Term Estimated
term (yrs)2008 2009 2010 2011 2012
Acergy Polaris Rigid pipelay 29-Nov-07 ExxonMobil Angola Starting in 4Q 08 2.7 2-Jan-08 Total Angola 2.7
15-Dec-08 Angola LNG Ltd. Angola Engineering will start immediately and Offshore installation will start in Q4'09
2.7
22-Sep-09 Total E&P Angola and BP Angola
Angola Engineering will start immediately and Offshore installation will start in Q2'10
4.0
100% 100% 100% 100% 100%Acergy Falcon Rigid pipelay 13-Feb-08 EnCana Canada NA 2.7 100% 100% 70% 0% 0%Sapura 3000 (50% stake) Rigid pipelay 16-Jul-07 Murphy Sabah Oil Co Malaysia NA 1.1 50%
17-Mar-09 Sabah Shell Petroleum Company Limited (SSPC)
Malaysia Engineering will commence with immediate effect, with offshore installation scheduled to commence in 2010.
4.0
2-Oct-09 Apache Energy Limited Australia Engg. and project preparations starts immediately, Offshore installation scheduled to commence in late 2010
4.0
50% 0% 100% 100% 100%Acergy Orion Rigid pipelay 29-May-09 MOBIL Producing Nigeria
Unlimited (MPN)Nigeria NA 4.0 50% 100% 100% 100%
Acergy Discovery Subsea construction 13-Feb-08 EnCana Canada NA 2.7 85% 100% 85% 0% 0%Acergy Harrier Subsea construction 30-Oct-07 Petrobras Brazil 3 years + 3 years optional 100% 100% 75% 0% 0%Acergy Hawk Subsea construction 15-Dec-08 Angola LNG Ltd. Angola Engineering will start immediately
and Offshore installation will start in Q4'09
2.7 25%
22-Sep-09 Total E&P Angola and BP Angola
Angola Engineering will start immediately and Offshore installation will start in Q2'10
4.0
25% 100% 100% 100%Acergy Legend Subsea construction 15-Dec-08 Angola LNG Ltd. Angola Engineering will start immediately
and Offshore installation will start in Q4'09
2.7 25%
22-Sep-09 Total E&P Angola and BP Angola
Angola Engineering will start immediately and Offshore installation will start in Q2'10
4.0
25% 100% 100% 100%Polar Queen (chartered) Subsea construction 29-Nov-07 ExxonMobil Angola Starting in 4Q 08 1.1
2-Jan-08 Total Angola NA 2.7 14-Jul-09 Petrobras Brazil 4 years (Option for 4 years)
commencing early 2010100% 100%
100% 100% 100% 100% 100%Skandi Acergy Subsea construction 28-Aug-08 BP Norge SA (on behalf of Skarv
Licensees)Norwegian Sea Installation will commence in H2 2010 2.7 50% 100% 100%
Toisa Proteus (chartered) Subsea construction 3-Jul-07 Apache Energy Australia NA 1.1 13-Feb-08 Woodside Australia NA 2.7 1-Jul-09 BHP Billiton Australia Commencing in the second half of
2009. 4.0 100% 100%
100% 100% 100% 100% 100%Acergy Condor Flexible pipelay Pertinacia Flexible pipelay Acergy Eagle Subsea construction Acergy Osprey Subsea construction SHL S5000 (through JV, 1H 2010)
Subsea construction
Acergy Havila (1H 2010) Subsea construction OthersAcergy Petrel Survey/ IMR ships 30-Jan-07 Statoil Norway 5 years 0% 0% 0% 0% 0%Acergy Viking Survey/ IMR ships 30-Jan-07 Statoil Norway 5 years 100% 100% 100% 100% 75%Far Saga Survey/ IMR shipsNormand Mermaid Survey/ IMR shipsPolar Bjorn Survey/ IMR ships
Source: Deutsche Bank, Company data

7 Decem
ber 2009 O
il & G
as European O
il Services
Page 82
Deutsche B
ank AG
/London
Figure 123: Saipem asset utilisation Contract award
Date Client Name Region TermEstimated term (yrs) 2008 2009 2010 2011 2012
Semac pipelayer Construction Vessel 28-Oct-08 PDVSA Gas S.A. Venezuela End of 2009 17% 100% 0% 0% 0%Saipem 3000 Self propelled DP crane vessel 5-Oct-05 Total Angola 3Q 2006
5-May-05 Total Nigeria 20082-Dec-05 Esso Exploration Angola NA14-Jun-06 Eni Congo Summer 200728-Dec-06 CNR International Gabon Q2 200928-Dec-06 Cabinda Gulf Oil Company Angola Q2-Q4 20084-Apr-07 Cabinda Gulf Oil Company Angola Q2 2008
28-Mar-08 Elf Petroleum Nigeria Limited (Total) Nigeria 201128-May-08 Total Angola Second Half of 200928-Jul-09 Esso Exploration Angola 201114-Oct-09 SNEPCo Nigeria NA 3
100% 100% 100% 100% 100%Saipem FDS (earlier Saibos Multi-purpose monohull dynamically 7-May-03 Esso Exploration Angola Angola Q3 2005FDS) positioned crane and pipelay (J-lay) 5-Oct-05 Total Angola 3Q 2006
vessel 5-May-05 Total Nigeria 20082-Dec-05 Esso Exploration Angola NA4-Aug-06 Burullus Gas Company Egypt End 200728-Mar-08 Elf Petroleum Nigeria Limited (Total) Nigeria 201128-May-08 Burullus Gas Company Egypt Second Half of 200928-Jul-09 Esso Exploration Angola 201114-Oct-09 SNEPCo Nigeria NA 3
100% 100% 100% 100% 100%Castoro Sei Semisubmersible pipelay vessel 24-Aug-04 BBL Company UK 3Q 2006
8-Mar-05 Talisman Energy UK 3Q 200614-Jun-06 Total UK Q4 200714-Jun-06 Maersk Oil OG Gas UK Q4 200716-Feb-07 MEDGAZ Algeria/ Spain 2008 100%19-Sep-07 ENAGAS Spain 1 year 100%
100% 100% 0% 0% 0%Castoro 6 Pipelaying Vessel 28-Nov-03 BP UK 2Q 2005
22-Dec-03 EnCana UK UK Summer/ 3Q 200630-Mar-04 Dolphin Energy Limited Qatar 1H 2006
Castoro 7 28-Jul-09 Eni Italy 25% 0% 0% 0%Castoro II Derrick/lay barge 19-Sep-07 Saudi Aramco Saudi Arabia 7 years 100% 100% 100% 100% 100%Castoro Otto Self propelled derrick/lay ship 16-Jul-03 Elf Petroleum Nigeria Limited (Total) Nigeria Q4 2005
16-Jul-03 Nigerian National Petroleum Corporation/Mobil Nigeria Q2 20052-Dec-05 Thai Oil Thailand Summer 20074-Apr-07 Eni Australia Q3 2008 75%
13-May-09 Premier Oil Natuna Sea B.V. Indonesia Completion by Q4 2011 50% 100% 100%75% 50% 100% 100% 0%
Source: Deutsche Bank, Company data

Deutsche B
ank AG
/London P
age 83
7 Decem
ber 2009 O
il & G
as European O
il Services
Figure 124: Saipem asset utilization continued… Contract award
Date Client Name Region TermEstimated term (yrs) 2008 2009 2010 2011 2012
Saipem 7000 Semisubmersible crane and 28-Nov-03 ExxonMobil Canada N America Summer 2006pipelaying (J-lay) DP vessel 22-Dec-03 EnCana UK UK Summer/ 3Q 2006
3-Jun-04 Norsk Hydro Norway Summer 200627-Oct-04 Aker Kvaerner Offshore Partners (AKOP) Norway 20082-Dec-05 Pemex Exploracion y Produccion Mexico 2H 20064-Aug-06 Companhia Mexilhao do Brasil Brazil H1 200916-Feb-07 MEDGAZ Algeria/ Spain 20084-Apr-07 BP Norway 2008-2010 100%
100% 100% 100% 0% 0%S 355 Derrick/lay barge 14-Jun-06 Devon Energy N America NA
4-Apr-07 Cabinda Gulf Oil Company Angola Q2 2008 50%50% 0% 0% 0% 0%
Crawler Derrick/lay barge 4-Apr-07 BG Tunisia Q2 2008 50%9-Jul-07 Petrobel Egypt H2 2007
50% 0% 0% 0% 0%Castoro One (Under Constr.) Pipe lay vesselSaipem FDS2 (Under Constr.) Field development vesselNew DSV (Under Constr.) DSVNormand Cutter Installation and ConstructionDP Reel Installation and ConstructionHos Innovator Installation and ConstructionHarvey Discovery Installation and ConstructionOC 280 Installation and ConstructionFPSO Firenze FPSOFPSO Mystras FPSOFPSO Cidade de Vitória FPSOFPSO Gimboa FPSO
Others
S 44 Launching/cargo bargeS 600 Launching/cargo bargeCastoro XI Heavy duty cargo bargeS45 Launching/cargo bargeCastoro 9 Launching/cargo bargeS42 Launching/cargo bargeSB 103 Cargo bargeSemac 1 Semisubmersible pipelay barge
Castoro 10 Trench/pipelay barge
Castoro 8 Trench/pipelay barge
SB 230 Work/pipelaying/accommodation barge
Castoro 12 Shallow water pipelay barge, Caspian Sea service
Ersai 1 Ersai Caspian Contractor LlcSaipem TRB Trench/pipelay bargeTRB Tender 4 post trenching/backfilling
craftsPiper Lay BargeBar Protector DP dive support vesselGrampian Surveyor Survey and IRMFar Sovereign Multi-functional anchor
handling tug and service vessel
0%0% 0%
14-Jun-06
0% 0%
Kencana HLTrans Thai-Malaysia (TTM)Petroleum Authority of Thailand (PTT)Taiwanese National Oil Company
2007
Source: Deutsche Bank, Company data

7 Decem
ber 2009 O
il & G
as European O
il Services
Page 84
Deutsche B
ank AG
/London
Figure 125: Saipem asset utilization … drilling Contract award
Date Client Name Region TermEstimated term (yrs) 2008 2009 2010 2011 2012
Jack upPerro Negro 2 96% 45% 90% 90% 90%Perro Negro 3 60% 90% 90% 90% 90%Perro Negro 4 21-Feb-03 Petrobel Africa End 2004
19-Jan-05 Petrobel Africa 2 years100% 90% 90% 90% 90%
Perro Negro 5 94% 90% 90% 90% 90%Perro Negro 6 (Under 90% 90% 90% 90%Perro Negro 7 100% 90% 90% 90% 90%SemisubScarabeo 3 100% 69% 90% 90% 90%Scarabeo 4 100% 40% 90% 90% 90%Scarabeo 5 70% 90% 90% 90% 90%Scarabeo 6 100% 65% 90% 68% 0%Scarabeo 7 75% 87% 90% 90% 90%Scarabeo 8 (Under Constr.) 48% 90% 90%
Scarabeo 9 (Under Constr.) 48% 90% 90%DrillshipSaipem 10000 100% 90% 90% 90% 90%
Saipem 12000(Under Constr.) 32% 90% 90%
OnshoreNumber of rigs Rig power
42 HP<=1500 98% 78% 79% 79% 79%29 1500<HP<=2000 98% 78% 79% 79% 79%10 3000 HP 98% 78% 79% 79% 79%
Source: Deutsche Bank, Company data

7 December 2009 Oil & Gas European Oil Services
Deutsche Bank AG/London Page 85
Figure 126: Seadrill asset utilisation Client Name Location Start date End date 2008 2009 2010 2011 2012
Drillships existingWest Navigator Shell Norway Oct-05 Dec-08 100%
Shell Norway Jan-09 Dec-12 100% 100% 100% 100%100% 100% 100% 100% 100%
West Capella Total Nigeria Mar-09 Mar-14 83% 100% 100% 100%Total 83% 100% 100% 100%
West Polaris Exxon Worldwide Oct-08 Oct-11 25% 100% 100% 75%Exxon Worldwide Oct-11 Oct-12 25% 75%
25% 100% 100% 100% 75%Drillships newbuildWest Gemini 0% 0% 0%
0% 0% 0%Semisub existingWest Alpha StatoilHydro Norway Feb-06 Apr-09 100% 33%
Consortium Norway May-09 Feb-12 67% 100% 100% 17%100% 100% 100% 100% 17%
West Venture StatoilHydro Norway Feb-00 Jul-10 100% 100% 58%Option 1X1 Aug-10 Aug-11
100% 100% 58% 0% 0%West Phoenix Total Norway Dec-08 Jan-12 100% 100% 100% 100% 0%
100% 100% 100% 100% 0%West Sirius Devon GOM Jul-08 Jul-14 100% 100% 100% 100% 100%
100% 100% 100% 100% 100%West Hercules Husky NA Nov-08 Nov-11 100% 100% 100% 92% 0%
100% 100% 100% 92% 0%West Aquarius Exxon Worldwide Feb-09 Feb-13 100% 100% 100% 100%
100% 100% 100% 100%West Eminence Petrobras Brazil Jun-09 Jun-15 100% 100% 100% 100%
100% 100% 100% 100%West Taurus Petrobras Brazil Feb-09 Feb-15 100% 100% 100% 100%
100% 100% 100% 100%Semisub newbuildWest Orion Petrobras Brazil Jul-10 Jul-16 100% 100% 100%
100% 100% 100%West Capricorn 0% 0%
0% 0%Jackup existingWest Epsilon StatoilHydro Oct-06 Dec-10 100% 100% 100%
100% 100% 100% 0% 0%West Janus NA NA Jun-07 Jul-08 58%
PCPPOC Malaysia Aug-08 Aug-11 42% 100% 100% 67%100% 100% 100% 67% 0%
West Larissa Viesto Petro Vietnam Oct-07 Mar-09 100% 25%Malaysia Mar-09 Dec-09 75%
100% 100% 0% 0% 0%West Titania (Sold)
West Prospero Exxon Malaysia Jul-07 Oct-08 75%Talisman Oct-08 Nov-08 17%
RSPC East Africa Dec-09 Jun-10 8% 50%92% 8% 50% 0% 0%
West Atlas Coogee Resources Australia Sep-07 Jan-09 100% 8%Coogee Resources Australia Feb-09 Oct-09 75%
100% 83% 0% 0% 0%West Triton Apache Australia Jan-08 Feb-09 100% 17%
PTTEP Australia Australia Aug-09 Nov-09 33%100% 50% 0% 0% 0%
West Ariel VSP Vietnam Jan-09 Aug-09 67%VSP Vietnam Aug-09 Oct-10 33% 100% 83%
100% 100% 83% 0% 0%Source: Deutsche Bank, Company data

7 December 2009 Oil & Gas European Oil Services
Page 86 Deutsche Bank AG/London
Figure 127: Seadrill asset utilisation continued… Client Name Location Start date End date 2008 2009 2010 2011 2012
Jackup newbuildWest Callisto 0% 0% 0%
0% 0% 0%West Juno 0% 0% 0%
0% 0% 0%West Leda 0% 0% 0%
0% 0% 0%West Elara 0% 0% 0%
0% 0% 0%Tender existingT3 NA NA Dec-07 Jun-08 50%
PTT Thailand Jul-08 Jun-12 50% 100% 100% 100% 58%100% 100% 100% 100% 58%
T4 NA NA Apr-03 Apr-08 33%Chevron Thailand Jul-08 Jul-13 58% 100% 100% 100% 100%
92% 100% 100% 100% 100%T6 CPOC/Carigali/PTTEP Thailand Dec-07 Dec-10 100% 100% 100%
100% 100% 100% 0% 0%T7 Chevron Thailand Nov-06 Oct-11 100% 100% 100% 83% 0%
100% 100% 100% 83% 0%T8 (Warm Stacked) Total Congo May-07 May-08
May-08 Jun-09
T9 Exxon Malaysia Feb-06 Jan-09 100% 8%Exxon Malaysia Feb-09 Jan-12 92% 100% 100% 8%
100% 100% 100% 100% 8%T10 CarigaliHess JDA-Gulf of Thailand Sep-07 Aug-10 100% 100% 67%Option 1 year Sep-10 Aug-11
100% 100% 67% 0% 0%Teknik Berkat Aug-07 Apr-08 33%
PetroCarigali Malaysia Apr-08 Apr-12 67% 100% 100% 100% 33%100% 100% 100% 100% 33%
West Alliance Jan-08 Jan-10 100% 8%Southeast Asia Jan-10 Jan-15 92% 100% 100% 100%
100% 100% 100% 100% 100%West Menang Total Congo Jan-08 Dec-10 100% 100% 100%
100% 100% 100% 0% 0%West Pelaut Shell Brunei Apr-04 Mar-09 100% 25%
Apr-09 Mar-12 75% 100% 100% 25%100% 100% 100% 100% 25%
West Setia Murphy Malaysia Dec-06 Dec-08 100%Murphy Malaysia Jan-09 May-09 42%
Cabinda gulf Oil co./Chevron Angola Aug-09 Aug-12 42% 100% 100% 67%100% 83% 100% 100% 67%
West Berani Newfield Malaysia Jan-07 Dec-08 100%conocoPhillips Indonesia Jan-09 Dec-11 100% 100% 100% 0%
100% 100% 100% 100% 0%T11 May-08 May-13 100% 100% 100% 100% 100%
100% 100% 100% 100% 100%Tender newbuildT12 0% 0% 0%
0% 0% 0%West Vencedor Cabinda gulf Oil co./Chevron Angola Mar-10 Mar-15 75% 100% 100%
75% 100% 100%West Berani III 0% 0%
0% 0%Source: Deutsche Bank, Company data

Deutsche B
ank AG
/London P
age 87
7 Decem
ber 2009 O
il & G
as European O
il Services
Figure 128: Subsea 7 asset utilisation Vessel type Contract award
DateClient Name Region Term Estimated term (yrs) 2008 2009 2010 2010 2012
Sealion Amazonia Pipelay and construction vesselKommandor 3000 Pipelay and construction vesselLochnagar Pipelay and construction vesselNormand Seven Pipelay and construction vessel 10-Sep-09 Petrobras Brazil 4 years, commencing
in Q3'0925% 100% 100% 100%
Seven Oceans Pipelay and construction vessel 23-Jul-07 Petrobras Brazil 2010 100%20-Aug-08 Marathon Oil corporation USA Strating in Q3 2009 1.6 10%
100% 100% 100% 10% 0%Seven Seas Pipelay and construction vessel 29-Nov-07 BP Norge AS North Sea Engg. starts
immediately, offshore installation between 2009-2011
1.6
3-Jul-08 Not disclosed West Africa NA 1.6 50%3-Sep-08 A/S Norske Shell North Sea Engg. starts
immediately, offshore installation scheduled in 2009.
1.6
4-Mar-09 StatoilHydro North Sea Completion by September 2009
2.3
50% 100% 100% 100% 100%Seven Sisters Pipelay and construction vessel 16-Jul-08 Venture Production Plc North Sea Starting Late 2008 1.6 25% 100% 35% 0%Seven Navica Pipelay and construction vessel 3-Oct-07 BP Norge AS North Sea Starting in 2010,
offshore operations start in Q2'2010
1.6
16-Jul-08 Venture Production Plc North Sea Starting Late 2008 1.6 25%25-Sep-09 Santos Limited Australia NA 2.7
25% 100% 100% 100% 100%Skandi Neptune Pipelay and construction vesselSkandi Seven Pipelay and construction vesselSubsea Viking Pipelay and construction vesselToisa Perseus Pipelay and construction vessel
Others
Rockwater 1 Dive support vessel 16-Jul-08 Venture Production Plc North Sea Starting Late 2008 1.6 25% 100% 35% 0% 0%Rockwater 2 Dive support vessel 25-Sep-09 Santos Limited Australia NA 2.7 25% 100% 100% 45%Seven Atlantic Dive support vesselSkandi Bergen ROV support vesselPelican Dive support vessel 19-Aug-09 Maersk Oil North Sea UK
Ltd North Sea Work commences in
Q4'09 2.3 38% 100% 33% 0%
Seven Spray Air diving support vesselToisa Polaris Dive support vesselKommandor Subsea 2000 ROV support vesselKommandor Subsea ROV support vesselNormand Subsea 7 ROV support vesselSeisranger ROV & survey support vesselNordica
Source: Deutsche Bank, Company data
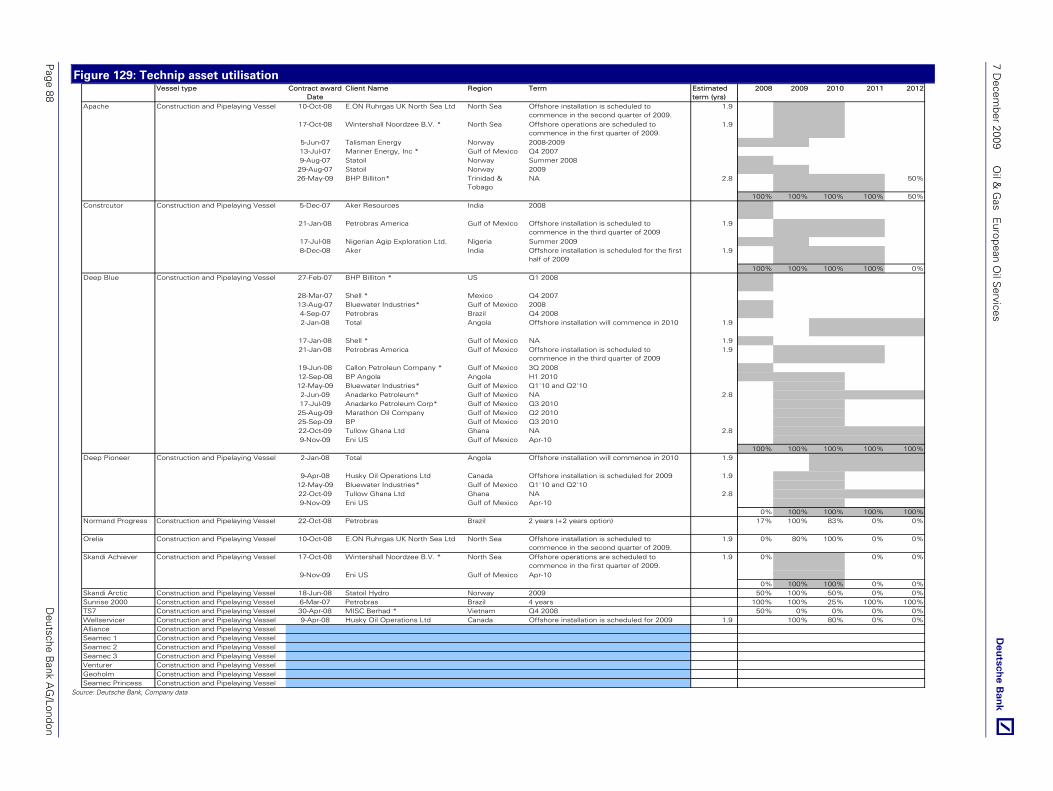
7 Decem
ber 2009 O
il & G
as European O
il Services
Page 88
Deutsche B
ank AG
/London
Figure 129: Technip asset utilisation Vessel type Contract award
DateClient Name Region Term Estimated
term (yrs)2008 2009 2010 2011 2012
Apache Construction and Pipelaying Vessel 10-Oct-08 E.ON Ruhrgas UK North Sea Ltd North Sea Offshore installation is scheduled to commence in the second quarter of 2009.
1.9
17-Oct-08 Wintershall Noordzee B.V. * North Sea Offshore operations are scheduled to commence in the first quarter of 2009.
1.9
5-Jun-07 Talisman Energy Norway 2008-200913-Jul-07 Mariner Energy, Inc * Gulf of Mexico Q4 20079-Aug-07 Statoil Norway Summer 2008
29-Aug-07 Statoil Norway 200926-May-09 BHP Billiton* Trinidad &
TobagoNA 2.8 50%
100% 100% 100% 100% 50%Constrcutor Construction and Pipelaying Vessel 5-Dec-07 Aker Resources India 2008
21-Jan-08 Petrobras America Gulf of Mexico Offshore installation is scheduled to commence in the third quarter of 2009
1.9
17-Jul-08 Nigerian Agip Exploration Ltd. Nigeria Summer 20098-Dec-08 Aker India Offshore installation is scheduled for the first
half of 2009 1.9
100% 100% 100% 100% 0%Deep Blue Construction and Pipelaying Vessel 27-Feb-07 BHP Billiton * US Q1 2008
28-Mar-07 Shell * Mexico Q4 200713-Aug-07 Bluewater Industries* Gulf of Mexico 20084-Sep-07 Petrobras Brazil Q4 20082-Jan-08 Total Angola Offshore installation will commence in 2010 1.9
17-Jan-08 Shell * Gulf of Mexico NA 1.9 21-Jan-08 Petrobras America Gulf of Mexico Offshore installation is scheduled to
commence in the third quarter of 2009 1.9
19-Jun-08 Callon Petroleun Company * Gulf of Mexico 3Q 200812-Sep-08 BP Angola Angola H1 201012-May-09 Bluewater Industries* Gulf of Mexico Q1'10 and Q2'102-Jun-09 Anadarko Petroleum* Gulf of Mexico NA 2.8 17-Jul-09 Anadarko Petroleum Corp* Gulf of Mexico Q3 201025-Aug-09 Marathon Oil Company Gulf of Mexico Q2 201025-Sep-09 BP Gulf of Mexico Q3 201022-Oct-09 Tullow Ghana Ltd Ghana NA 2.8 9-Nov-09 Eni US Gulf of Mexico Apr-10
100% 100% 100% 100% 100%Deep Pioneer Construction and Pipelaying Vessel 2-Jan-08 Total Angola Offshore installation will commence in 2010 1.9
9-Apr-08 Husky Oil Operations Ltd Canada Offshore installation is scheduled for 2009 1.9 12-May-09 Bluewater Industries* Gulf of Mexico Q1'10 and Q2'1022-Oct-09 Tullow Ghana Ltd Ghana NA 2.8 9-Nov-09 Eni US Gulf of Mexico Apr-10
0% 100% 100% 100% 100%Normand Progress Construction and Pipelaying Vessel 22-Oct-08 Petrobras Brazil 2 years (+2 years option) 17% 100% 83% 0% 0%
Orelia Construction and Pipelaying Vessel 10-Oct-08 E.ON Ruhrgas UK North Sea Ltd North Sea Offshore installation is scheduled to commence in the second quarter of 2009.
1.9 0% 80% 100% 0% 0%
Skandi Achiever Construction and Pipelaying Vessel 17-Oct-08 Wintershall Noordzee B.V. * North Sea Offshore operations are scheduled to commence in the first quarter of 2009.
1.9 0% 0% 0%
9-Nov-09 Eni US Gulf of Mexico Apr-100% 100% 100% 0% 0%
Skandi Arctic Construction and Pipelaying Vessel 18-Jun-08 Statoil Hydro Norway 2009 50% 100% 50% 0% 0%Sunrise 2000 Construction and Pipelaying Vessel 6-Mar-07 Petrobras Brazil 4 years 100% 100% 25% 100% 100%TS7 Construction and Pipelaying Vessel 30-Apr-08 MISC Berhad * Vietnam Q4 2008 50% 0% 0% 0% 0%Wellservicer Construction and Pipelaying Vessel 9-Apr-08 Husky Oil Operations Ltd Canada Offshore installation is scheduled for 2009 1.9 100% 80% 0% 0%Alliance Construction and Pipelaying VesselSeamec 1 Construction and Pipelaying VesselSeamec 2 Construction and Pipelaying VesselSeamec 3 Construction and Pipelaying VesselVenturer Construction and Pipelaying VesselGeoholm Construction and Pipelaying VesselSeamec Princess Construction and Pipelaying Vessel
Source: Deutsche Bank, Company data
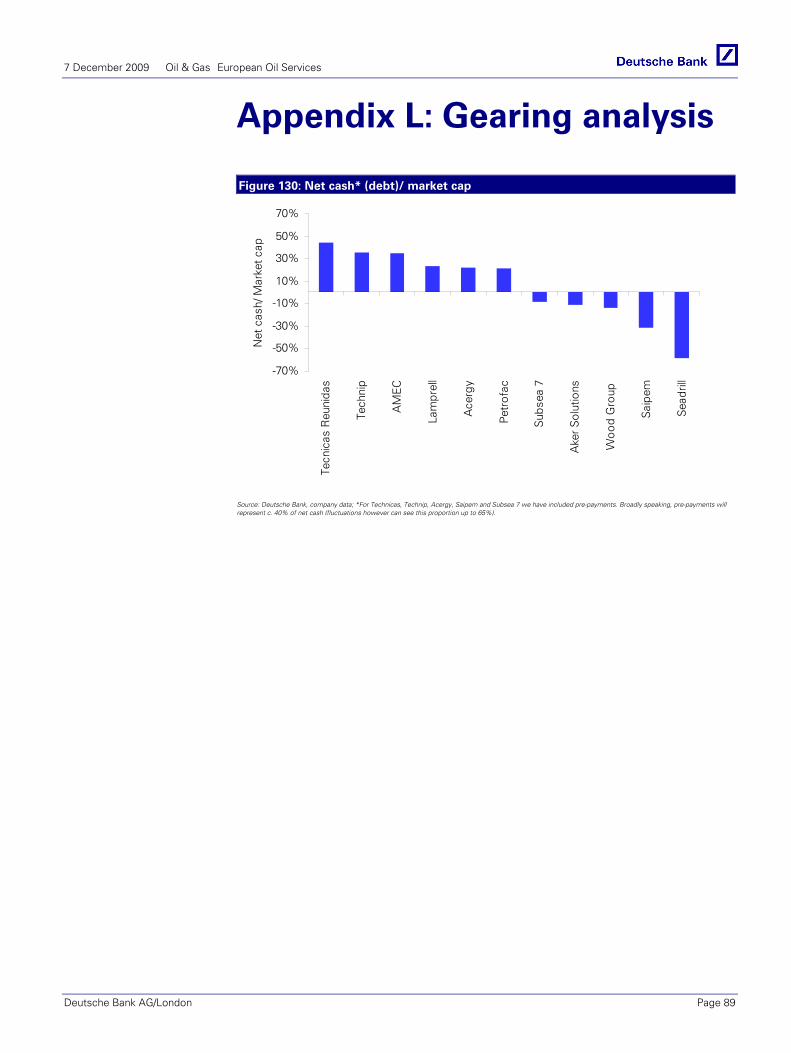
7 December 2009 Oil & Gas European Oil Services
Deutsche Bank AG/London Page 89
Appendix L: Gearing analysis Figure 130: Net cash* (debt)/ market cap
-70%
-50%
-30%
-10%
10%
30%
50%
70%
Tecn
icas
Reu
nida
s
Tech
nip
AM
EC
Lam
prel
l
Ace
rgy
Petr
ofac
Subs
ea 7
Ake
r Sol
utio
ns
Woo
d G
roup
Saip
em
Sead
rill
Net
cas
h/ M
arke
t cap
Source: Deutsche Bank, company data; *For Technicas, Technip, Acergy, Saipem and Subsea 7 we have included pre-payments. Broadly speaking, pre-payments will represent c. 40% of net cash (fluctuations however can see this proportion up to 65%).

7 December 2009 Oil & Gas European Oil Services
Page 90 Deutsche Bank AG/London
Appendix M: Contract strategy analysis
Figure 131: Acergy contract strategy Figure 132: Aker Solutions contract strategy
0%
10%
20%
30%
40%
50%
60%
70%
80%
90%
100%
2004 2005 2006 2007 2008 2009 YTD
% c
ontr
acts
10%
12%
14%
16%
18%
20%
22%
24%
EB
ITD
A m
argi
n
Lump sum Cost plus (Capex) Cost plus (Opex)
Unit price EBITDA margin *
0%
10%
20%
30%
40%
50%
60%
70%
80%
90%
100%
2004 2005 2006 2007 2008 2009 YTD
% c
ontr
acts
3%
4%
4%
5%
5%
6%
6%
7%
7%
8%
8%
EB
ITD
A m
argi
n
Lump sum Cost plus (Capex) Cost plus (Opex)
Unit price EBITDA margin *
Source: Deutsche Bank and company data, * 2007 EBITDA margin is after considering the $27 mn provisions on losses in the Mexilhao Trunkline Project (Q4'07). Source: Deutsche Bank and company data, * Excludes pulping and power division which is discontinued.
Figure 133: Amec contract strategy Figure 134: Lamprell contract strategy
0%10%20%30%40%50%60%70%80%90%
100%
2005 2006 2007 2008 2009 YTD
% c
ontr
acts
3.0%
4.0%
5.0%
6.0%
7.0%
8.0%
9.0%
10.0%
11.0%
EBIT
DA
mar
gin
Lump sum Cost plus (Capex) Cost plus (Opex)Unit price EBITDA margin
0%
10%
20%
30%
40%
50%
60%
70%
80%
90%
100%
2004 2005 2006 2007 2008 2009 YTD
% c
ontr
acts
10%
11%
12%
13%
14%
15%
16%
17%
18%
19%
20%
EB
ITD
A m
argi
n
Lump sum Cost plus (Capex) Cost plus (Opex)
Unit price EBITDA margin
Source: Deutsche Bank, company data Source: Deutsche Bank, company data
Figure 135: Petrofac contract strategy Figure 136: Saipem contract strategy
0%10%20%30%40%50%60%70%80%90%
100%
2004 2005 2006 2007 2008 2009 YTD
% c
ontr
acts
5.0%
6.0%
7.0%
8.0%
9.0%
10.0%
11.0%
EB
ITD
A m
argi
n
Lump sum Cost plus (Capex) Cost plus (Opex)
Unit price EBITDA margin *
0%10%20%30%40%50%60%70%80%90%
100%
2004 2005 2006 2007 2008 2009 YTD
% c
ontr
acts
8.5%
9.0%
9.5%
10.0%
10.5%
11.0%
11.5%
12.0%
12.5%
EBIT
DA
mar
gin
Lump sum Cost plus (Capex) Cost plus (Opex)
Unit price EBITDA margin *
Source: Deutsche Bank and company data, * Excludes pulping and power division which is discontinued. Source: Deutsche Bank and company data, * Excludes Drilling business

7 December 2009 Oil & Gas European Oil Services
Deutsche Bank AG/London Page 91
Figure 137: Subsea 7 contract strategy Figure 138: Technip contract strategy
0%
10%
20%
30%
40%
50%
60%
70%
80%
90%
100%
2005 2006 2007 2008 2009 YTD
% c
ontr
acts
10%
12%
14%
16%
18%
20%
22%
24%
EB
ITD
A m
argi
n
Lump sum Cost plus (Capex) Cost plus (Opex)
Unit price EBITDA margin
c
0%
10%
20%
30%
40%
50%
60%
70%
80%
90%
100%
2004 2005 2006 2007 2008 2009 YTD
% c
ontr
acts
4%
5%
6%
7%
8%
9%
10%
11%
12%
13%
14%
EB
ITD
A m
argi
n
Lump sum Cost plus (Capex) Cost plus (Opex)
Unit price EBITDA margin *
Source: Deutsche Bank, company data Source: Deutsche Bank and company data,.* 2007 EBITDA margin includes the impact of $50mn charge for petrochemical project in Saudi Arabia (Q3'07) and also the impact of $200mn charge in Qatargas and $70mn charge in other projects (Q4'07)
Figure 139: Tecnicas contract strategy Figure 140: Wood Group contract strategy
0%
10%
20%
30%
40%
50%
60%
70%
80%
90%
100%
2004 2005 2006 2007 2008 2009 YTD
% c
ontr
acts
3.0%
3.5%
4.0%
4.5%
5.0%
5.5%
6.0%
6.5%
EB
ITD
A m
argi
n
Lump sum Cost plus (Capex) Cost plus (Opex)
Unit price EBITDA margin
0%10%
20%30%
40%50%60%
70%80%
90%100%
2005 2006 2007 2008 2009 YTD
% c
ontr
acts
5.0%
6.0%
7.0%
8.0%
9.0%
10.0%
EBIT
DA
mar
gin
Lump sum Cost plus (Capex) Cost plus (Opex)
Unit price EBITDA margin
Source: Deutsche Bank, company data Source: Deutsche Bank, company data

7 December 2009 Oil & Gas European Oil Services
Page 92 Deutsche Bank AG/London
Appendix N: NOC/IOC exposure
Figure 141: NOC/IOC split in contract wins across 2008/ 09 YTD
LamprellAMEC Aker
SolutionsTechnipAcergyWood Group Subsea 7SaipemPetrofacTecnicas Seadrill
0%
10%
20%
30%
40%
50%
60%
70%
80%
90%
100%
2008
2009
YTD
2008
2009
YTD
2008
2009
YTD
2008
2009
YTD
2008
2009
YTD
2008
2009
YTD
2008
2009
YTD
2008
2009
YTD
2008
2009
YTD
2008
2009
YTD
2008
2009
YTD
NOC Pure IOC Average NOC exposure
Source: Deutsche Bank, Company data; Lamprell is based in the Middle East and we expect, near term, for it to win contracts from NOCs which currently represent 10% of its bid pipeline.

7 December 2009 Oil & Gas European Oil Services
Deutsche Bank AG/London Page 93
Appendix O: Licenses awarded by depth (onshore and offshore)
Figure 142: Deepwater exploration licenses (i.e. >400m)
awarded since 2000 have risen significantly
Figure 143: Deepwater development license term lengths
are generally a lot longer than exploration licenses
-
200
400
600
800
1,000
1,200
1,400
2000 2001 2002 2003 2004 2005 2006 2007 2008
Lice
nses
aw
arde
d
Exploration
-
5
10
15
20
25
30
2000 2001 2002 2003 2004 2005 2006 2007 2008Ye
ars
Exploration Development
Source: Wood Mackenzie, Deutsche Bank Source: Wood Mackenzie, Deutsche Bank
Figure 144: Shallow water licenses (i.e. <400m) awarded
since 2000 has increased almost tenfold
Figure 145: Shallow water license average term length
since 2000 has remained broadly constant
-
200
400
600
800
1,000
1,200
2000 2001 2002 2003 2004 2005 2006 2007 2008
Cou
nt o
f lic
ense
s aw
arde
d
-
5
10
15
20
25
30
2000 2001 2002 2003 2004 2005 2006 2007 2008
Yea
rs
Exploration Development
Source: Wood Mackenzie, Deutsche Bank Source: Wood Mackenzie, Deutsche Bank
Figure 146: Onshore licenses awarded since 2000 has
increased almost fourfold
Figure 147: Onshore license average term length since
2000 has remained broadly constant
-
300
600
900
1,200
1,500
1,800
2,100
2000 2001 2002 2003 2004 2005 2006 2007 2008
Cou
nt o
f lic
ense
s aw
arde
d
-
5
10
15
20
25
30
2000 2001 2002 2003 2004 2005 2006 2007 2008
Yea
rs
Exploration Development
Source: Wood Mackenzie, Deutsche Bank Source: Wood Mackenzie, Deutsche Bank

7 December 2009 Oil & Gas European Oil Services
Page 94 Deutsche Bank AG/London
Appendix P: Wind power capacity
Figure 148: Global annual wind power capacity
additions
Figure 149: Global installed wind power capacity
-
10,000
20,000
30,000
40,000
50,000
60,000
1996
1997
1998
1999
2000
2001
2002
2003
2004
2005
2006
2007
2008
2009
2010
2011
2012
2013
MW
0
50,000
100,000
150,000
200,000
250,000
300,000
350,000
2007 2008 2009 2010 2011 2012 2013
MW
Europe North America Asia Latin America Pacific Middle East and Africa
Source: Deutsche Bank, GWEC Source: Deutsche Bank, GWEC
Wind power capacity (2007/08) by region
Figure 150: Installed wind power capacity in Europe Figure 151: Installed wind power capacity in N America
-2,0004,0006,0008,000
10,00012,00014,00016,00018,000
Spai
n
Italy
Fran
ce UK
Den
mar
k
Portu
gal
Net
herla
nds
Swed
en
Irela
nd
Aust
ria
Gre
ece
Pola
nd
Nor
way
Turk
ey
RO
E *
MW
End 2007 End 2008
-
5,000
10,000
15,000
20,000
25,000
30,000
USA Canada
MW
End 2007 End 2008
Source: Deutsche Bank, GWEC, * Rest of Europe includes - Belgium,Bulgaria, Croatia, Cyprus, Czech Republic, Estonia, Faroe Islands, Finland, Hungary, Latvia, Lithuania, Luxembourg, Romania, Russia, Slovakia, Switzerland, Ukraine
Source: Deutsche Bank, GWEC,
Figure 152: Installed wind power capacity in Asia
Figure 153: Installed wind power capacity in Latin
America & Caribbean
-
2,000
4,000
6,000
8,000
10,000
12,000
India Japan Taiw an South Korea Others *
MW
End 2007 End 2008
-
50
100
150
200
250
300
350
400
Braz
il
Mex
ico
Cos
ta R
ica
Car
ibbe
an
Arge
ntin
a
Oth
ers
*
MW
End 2007 End 2008
Source: Deutsche Bank, GWEC, * Others include - Philippines, Thailand, Bangladesh, Indonesia, Sri Lanka Source: Deutsche Bank, GWEC, * Others include - Colombia, Chile, Cuba

7 December 2009 Oil & Gas European Oil Services
Deutsche Bank AG/London Page 95
Figure 154: Installed wind power capacity in Pacific
region
Figure 155: Installed wind power capacity in Middle East
and Africa
-
200
400
600
800
1,000
1,200
1,400
Australia New Zealand Pacif ic Islands
MW
End 2007 End 2008
-
50
100
150
200
250
300
350
400
Egypt Morocco Iran Tunisia Others *
MW
End 2007 End 2008
Source: Deutsche Bank, GWEC Source: Deutsche Bank, GWEC, * Others include - South Africa, Cape Verde, Israel, Lebanon, Nigeria, Jordan

7 December 2009 Oil & Gas European Oil Services
Page 96 Deutsche Bank AG/London
Appendix Q: Strategic analysis of the E&C themes Given the array of functions that exists within the oil service industry, it is no surprise that each theme across the ‘oil chain’ described above will have its own characteristic competing forces. Advanced technology and specialised hardware, relevant project management experience, local presence via assets or resource, strong financial capabilities as well as the degree of capacity creep are to list but a few of the internal dynamics that will underpin each segment’s relative and absolute margins near term.
Whilst difficult to quantify, intuitively we know that a theme, for example, with high barriers to entry, limited competition and suffering little capacity creep and cost inflation, should realise top-quartile margins against a backcloth of strong demand for its services. With this in mind we have analysed the effect of competitive forces (please refer to Appendix R) upon each of the major oil service sub-segments. Our conclusions and their implications for margins are summarised in Figure 156. This strategic analysis has helped us to determine which themes we believe are best placed to deliver relative performance over the forecast period.
Having liaised with the companies under our coverage, as well as Wood Mackenzie and various other industry professionals, we show on the next page the degree of margin evolution (both relative and absolute) we think each theme could realise across our forecast horizon.
Having established which
markets we expect to show
the greatest growth in
spend, we identify their
degree of margin
achievement both in
absolute and relative terms

7 December 2009 Oil & Gas European Oil Services
Deutsche Bank AG/London Page 97
Figure 156: Degree of absolute and relative margin achievement across the development capex spectrum
Theme Typical EBITDA
margins* 2009-12E-Base case scenario*
Summary of strategic analysis (see Appendix R)
E&C themes
Offshore infrastructure - deepwater SURF
15% -XX/XXX
Medium levels of substitution and high barriers to entry suggest that this industry is structurally robust with margins expected stay resilient relative to other service segments. Near term however, we expect a cyclical shift in pricing power to Oil Cos and acutemargin compression.
Offshore facilities - deepwater 6-7% -XX/XXX As above.
Onshore/offshore frontier (non-conventional)
5-6% -XX
Medium levels of substitution and high barriers to entry suggest that this industry is structurally robust. Near term, we expect a cyclical shift in pricing power to Oil Cos) and moderate margin compression (exception being on larger contracts with limited competition).
LNG
5-6% -XX
Medium levels of substitution and barriers to entry (highest for FLNG) suggest that structurally this industry is robust with medium quartile margins expected relative to other service segments onshore. Near term, we expect a cyclical shift in pricing power to OilCos and moderate margin compression (exception being on $1bn+ contracts with limited competition).
Onshore facilities & infrastructure
4-11% -XX/XXX
Structurally weak industry with lower quartile margins (relative to other onshore themes). Near term, however, we expect a range of margin outcomes linked to regional supply/demand dynamics and relationships with client. This should see higher margins achieved in Middle East given the structurally lower cost base.
Offshore infrastructure – shallow water OPEX
3-8% -XXX/XXXX
Structurally weak industry with bottom quartile margins. Near term we expect acute margin compression due to new entrants. Upper end of margin achieved with NOCs and internationally based clients relative to UK and Norway which are typically IOC based and where supply/demand fundamentals are weaker.
Heavy Oil sand plants
3-8% -XXX/XXXX
Whilst this industry is a relatively fertile one, we believe the large number of players operating within oil sands against a sharp slowdown in investment will see acute margin compression. Exceptions here are contractors whom can offer differentiated technology and project management services.
Offshore facilities - shallow water 3-4% -XXX
Structurally weak industry with bottom quartile margins (relative to other offshore themes). Near term, we expect compression in margins due to a cyclical shift in pricing power.
Refining and petrochemicals 3-4% -XXXX
Structurally weak industry with bottom quartile margins (relative to other onshore themes). Near term, we expect acute margin compression due to a cyclical shift in pricing powerand the large number of players operating in this segment.
Gas to Liquids plants 3-4% -X/XX Industry still relatively fertile but structurally robust.
Re-gas terminals 3-4% -XXXX
Structurally weak industry with bottom quartile margins (relative to other onshore themes). Near term, we expect acute margin compression due to a cyclical shift in pricing power.
* x = lowest margin downside, xxxx = highest margin downside Source: Company data, Deutsche Bank & Wood Mackenzie estimates

7 December 2009 Oil & Gas European Oil Services
Page 98 Deutsche Bank AG/London
Appendix R: Porter’s 5 forces on key service segments
Figure 157: Deepwater sub-sea (SURF & equipment) and facilities – We expect mid quartile margin decline near term
Levels of substitute competition - medium:
Players look to seek market share with expansion of their installation capacity through new builds, vessel charters or
converted ships
Technip (~25%), Saipem (~30%), Acergy (~15%),
Aker Solutions, Seven Seas, Subsea 7 (b/w c. 5-10% each)
Levels of substitute competition - medium:
Players look to seek market share with expansion of their installation capacity through new builds, vessel charters or
converted ships
Technip (~25%), Saipem (~30%), Acergy (~15%),
Aker Solutions, Seven Seas, Subsea 7 (b/w c. 5-10% each)
Barriers to entry – high
•Capital intensive business whose participants leverage the necessary equipment (e.g. heavy lift/pipe-laying vessels, remote operating vehicles) and their geographic flexibility to win deepwater projects. (Lead time on vessel new builds between 3-4 years and average vessel cost c. $350mn)
•Advanced technology (often with long patent expiries) on subsea equipment/systems and to a lesser degree, pipe-laying vessels/operations
•Technical human expertise in deepwater (not to mention current advances into ultra-deep) with established track records
Strength of suppliers: medium
•Suppliers equally split between steel for construction and subcontracting functions that will include procurement, construction and installation depending on level of in house capacity (e.g. owner of vessels)
•Prices of specialised equipment should be resilient.
•Note that decrease in raw material and sub-contracting prices potentially passed through to Buyer depending on initial terms & conditions of Oil Service company-Buyer contract.
Strength of buyers: medium
•Medium levels of substitution and high barriers to entry suggest that this industry is structurally robust
•Medium term, expect cyclical led shift in pricing power to Oil Co’s and subsequent margin contraction despite limited number of players
Strength of buyers: medium
•Medium levels of substitution and high barriers to entry suggest that this industry is structurally robust
•Medium term, expect cyclical led shift in pricing power to Oil Co’s and subsequent margin contraction despite limited number of players
Threat of substitutes: low
•NOC and IOC investment shifting away from shallow water fields as economics become more attractive in deepwater.
•Size of reserves, ultimate recoveries and rates of flow potentially higher in deepwater.
Threat of substitutes: low
•NOC and IOC investment shifting away from shallow water fields as economics become more attractive in deepwater.
•Size of reserves, ultimate recoveries and rates of flow potentially higher in deepwater.
Levels of substitute competition - medium:
Players look to seek market share with expansion of their installation capacity through new builds, vessel charters or
converted ships
Technip (~25%), Saipem (~30%), Acergy (~15%),
Aker Solutions, Seven Seas, Subsea 7 (b/w c. 5-10% each)
Levels of substitute competition - medium:
Players look to seek market share with expansion of their installation capacity through new builds, vessel charters or
converted ships
Technip (~25%), Saipem (~30%), Acergy (~15%),
Aker Solutions, Seven Seas, Subsea 7 (b/w c. 5-10% each)
Barriers to entry – high
•Capital intensive business whose participants leverage the necessary equipment (e.g. heavy lift/pipe-laying vessels, remote operating vehicles) and their geographic flexibility to win deepwater projects. (Lead time on vessel new builds between 3-4 years and average vessel cost c. $350mn)
•Advanced technology (often with long patent expiries) on subsea equipment/systems and to a lesser degree, pipe-laying vessels/operations
•Technical human expertise in deepwater (not to mention current advances into ultra-deep) with established track records
Strength of suppliers: medium
•Suppliers equally split between steel for construction and subcontracting functions that will include procurement, construction and installation depending on level of in house capacity (e.g. owner of vessels)
•Prices of specialised equipment should be resilient.
•Note that decrease in raw material and sub-contracting prices potentially passed through to Buyer depending on initial terms & conditions of Oil Service company-Buyer contract.
Strength of buyers: medium
•Medium levels of substitution and high barriers to entry suggest that this industry is structurally robust
•Medium term, expect cyclical led shift in pricing power to Oil Co’s and subsequent margin contraction despite limited number of players
Strength of buyers: medium
•Medium levels of substitution and high barriers to entry suggest that this industry is structurally robust
•Medium term, expect cyclical led shift in pricing power to Oil Co’s and subsequent margin contraction despite limited number of players
Threat of substitutes: low
•NOC and IOC investment shifting away from shallow water fields as economics become more attractive in deepwater.
•Size of reserves, ultimate recoveries and rates of flow potentially higher in deepwater.
Threat of substitutes: low
•NOC and IOC investment shifting away from shallow water fields as economics become more attractive in deepwater.
•Size of reserves, ultimate recoveries and rates of flow potentially higher in deepwater.
Source: Deutsche Bank

7 December 2009 Oil & Gas European Oil Services
Deutsche Bank AG/London Page 99
Figure 158: Shallow water sub-sea and facilities – We expect high quartile margin decline near term
Levels of substitute competition - high
Players look to seek market share with expansion of their installation capacity through new builds, vessel charters or
converted ships often designed for dual purpose i.e. deep and shallow water
Technip (~20%), Saipem (~25%), Acergy (~10%), Subsea 7 (~10%),
Aker Solutions, SBM Offshore, Samsung, Mcdermott, Heerema, Hyundai <5%
Barriers to entry – low
•Capital intensity (pipe-laying vessels etc) represent a low barrier here given the existing network of vessels supporting such a mature business e.g. leasing would be a simple cost effective option
•Utilises more conventional (less technically challenging) types of equipment
Strength of suppliers: medium
•Suppliers equally split between steel for construction and subcontracting functions that will include procurement, construction and installation depending on level of in house capacity (e.g. owner of vessels)
•Prices of specialised equipment should be resilient.
•Note that decrease in raw material and sub-contracting prices potentially passed through to Buyer depending on initial terms & conditions of Oil Service company-Buyer contract.
Strength of buyers: high
•High levels of substitution and low barriers to entry suggest that this industry is structurally weak
•Medium term, expect cyclical led shift in pricing power to Oil Co’s and acute margin contraction despite limited number of players
Strength of buyers: high
•High levels of substitution and low barriers to entry suggest that this industry is structurally weak
•Medium term, expect cyclical led shift in pricing power to Oil Co’s and acute margin contraction despite limited number of players
Threat of substitutes: high
•NOC and IOC investment shifting towards deepwater fields as economics become more attractive.
•Size of reserves, ultimate recoveries and rates of flow potentially higher in deepwater.
Threat of substitutes: high
•NOC and IOC investment shifting towards deepwater fields as economics become more attractive.
•Size of reserves, ultimate recoveries and rates of flow potentially higher in deepwater.
Levels of substitute competition - high
Players look to seek market share with expansion of their installation capacity through new builds, vessel charters or
converted ships often designed for dual purpose i.e. deep and shallow water
Technip (~20%), Saipem (~25%), Acergy (~10%), Subsea 7 (~10%),
Aker Solutions, SBM Offshore, Samsung, Mcdermott, Heerema, Hyundai <5%
Barriers to entry – low
•Capital intensity (pipe-laying vessels etc) represent a low barrier here given the existing network of vessels supporting such a mature business e.g. leasing would be a simple cost effective option
•Utilises more conventional (less technically challenging) types of equipment
Strength of suppliers: medium
•Suppliers equally split between steel for construction and subcontracting functions that will include procurement, construction and installation depending on level of in house capacity (e.g. owner of vessels)
•Prices of specialised equipment should be resilient.
•Note that decrease in raw material and sub-contracting prices potentially passed through to Buyer depending on initial terms & conditions of Oil Service company-Buyer contract.
Strength of buyers: high
•High levels of substitution and low barriers to entry suggest that this industry is structurally weak
•Medium term, expect cyclical led shift in pricing power to Oil Co’s and acute margin contraction despite limited number of players
Strength of buyers: high
•High levels of substitution and low barriers to entry suggest that this industry is structurally weak
•Medium term, expect cyclical led shift in pricing power to Oil Co’s and acute margin contraction despite limited number of players
Threat of substitutes: high
•NOC and IOC investment shifting towards deepwater fields as economics become more attractive.
•Size of reserves, ultimate recoveries and rates of flow potentially higher in deepwater.
Threat of substitutes: high
•NOC and IOC investment shifting towards deepwater fields as economics become more attractive.
•Size of reserves, ultimate recoveries and rates of flow potentially higher in deepwater.
Source: Deutsche Bank
Figure 159: Onshore/offshore frontier developments – We expect low quartile margin decline near term
Levels of substitute competition - medium
Players look to seek market share with expansion of resource base in these frontier areas via build of local
content (increased involvement of local personnel) and construction yards (greenfield or brownfield expansion)
Saipem, Technip, Aker Solutions, Petrofac, Daewoo, Linde, Hyundai, SNC Lavalin
Barriers to entry – high
•Technical human expertise and local presence in some of the harshest weather conditions Oil Service companies will encounter
•Superior technology (often with long patent expiries) on subsea equipment and advanced pipe-lay vessels/operations able to deal with harsh operating environments
Strength of suppliers: medium
•Main supply is steel (up to 50% of cost base) with remainder of supply chain split across various sub-contracting functions (e.g. construction, procurement)
•Prices of specialised equipment should be resilient.
•Note that decrease in raw material and sub-contracting prices potentially passed through to Buyer depending on initial terms & conditions of Oil Service company-Buyer contract.
Strength of buyers: medium
•Medium levels of substitution and barriers to entry suggest that this industry is structurally robust
•Medium term, expect margin contraction for Oil Services due to downside pressure on supplier prices and greater resistance from Oil co’s(exception: $1bn+ contracts with limited competition)
Threat of substitutes: medium
•NOC and IOC investment shifting away from traditional more accessible areas as economics become more attractive in frontier developments
•Size of reserves and ultimate recoveries potentially higher in frontier developments
Threat of substitutes: medium
•NOC and IOC investment shifting away from traditional more accessible areas as economics become more attractive in frontier developments
•Size of reserves and ultimate recoveries potentially higher in frontier developments
Levels of substitute competition - medium
Players look to seek market share with expansion of resource base in these frontier areas via build of local
content (increased involvement of local personnel) and construction yards (greenfield or brownfield expansion)
Saipem, Technip, Aker Solutions, Petrofac, Daewoo, Linde, Hyundai, SNC Lavalin
Barriers to entry – high
•Technical human expertise and local presence in some of the harshest weather conditions Oil Service companies will encounter
•Superior technology (often with long patent expiries) on subsea equipment and advanced pipe-lay vessels/operations able to deal with harsh operating environments
Strength of suppliers: medium
•Main supply is steel (up to 50% of cost base) with remainder of supply chain split across various sub-contracting functions (e.g. construction, procurement)
•Prices of specialised equipment should be resilient.
•Note that decrease in raw material and sub-contracting prices potentially passed through to Buyer depending on initial terms & conditions of Oil Service company-Buyer contract.
Strength of buyers: medium
•Medium levels of substitution and barriers to entry suggest that this industry is structurally robust
•Medium term, expect margin contraction for Oil Services due to downside pressure on supplier prices and greater resistance from Oil co’s(exception: $1bn+ contracts with limited competition)
Threat of substitutes: medium
•NOC and IOC investment shifting away from traditional more accessible areas as economics become more attractive in frontier developments
•Size of reserves and ultimate recoveries potentially higher in frontier developments
Threat of substitutes: medium
•NOC and IOC investment shifting away from traditional more accessible areas as economics become more attractive in frontier developments
•Size of reserves and ultimate recoveries potentially higher in frontier developments
Source: Deutsche Bank

7 December 2009 Oil & Gas European Oil Services
Page 100 Deutsche Bank AG/London
Figure 160: LNG – We expect low quartile margin decline near term
Levels of substitute competition - medium
Only largest players able to handle increasing number of EPIC contracts valued > $1bn.
Technip (~5%), Chiyoda (~5%), JGC (~5%), Siapem (~5%)
SNC Lavalin , KBR, CBI, Samsung (<5%)
Levels of substitute competition - medium
Only largest players able to handle increasing number of EPIC contracts valued > $1bn.
Technip (~5%), Chiyoda (~5%), JGC (~5%), Siapem (~5%)
SNC Lavalin , KBR, CBI, Samsung (<5%)
Barriers to entry – medium
•Large scale projects requiring contractors with strong balance sheets given turn key nature of LNG awards
•Established relationships with NOCs (from whom a larger number of LNG contracts originate)
•Regional presence and partnership with local personnel. Necessary infrastructure (e.g. yards) required for construction and installation phases
•Technology licensed out selectively
Barriers to entry – medium
•Large scale projects requiring contractors with strong balance sheets given turn key nature of LNG awards
•Established relationships with NOCs (from whom a larger number of LNG contracts originate)
•Regional presence and partnership with local personnel. Necessary infrastructure (e.g. yards) required for construction and installation phases
•Technology licensed out selectivelyStrength of suppliers: medium
•Main supply is steel (up to 50% of cost base) with remainder of supply chain split across various sub-contracting functions (e.g. construction, procurement)
•Prices of specialised equipment should be resilient.
•Note that decrease in raw material and sub-contracting prices potentially passed through to Buyer depending on initial terms & conditions of Oil Service company-Buyer contract.
Strength of suppliers: medium
•Main supply is steel (up to 50% of cost base) with remainder of supply chain split across various sub-contracting functions (e.g. construction, procurement)
•Prices of specialised equipment should be resilient.
•Note that decrease in raw material and sub-contracting prices potentially passed through to Buyer depending on initial terms & conditions of Oil Service company-Buyer contract.
Strength of buyers - low
•Medium levels of substitution and barriers to entry suggest that this industry is structurally robust
•Medium term, expect margin contraction for Oil Services due to downside pressure on supplier prices and greater resistance from Oil co’s (exception: $1bn+ contracts with limited competition)
Threat of substitutes: low
•Economies of scale (bolt on liquefaction trains around existing infrastructure & established supply chain) increases attractiveness of LNG vs. other advanced energy alternatives e.g. GTL
•Monetisation of gas using pipelines increasingly difficult for stranded reserves. LNG more feasible option
Levels of substitute competition - medium
Only largest players able to handle increasing number of EPIC contracts valued > $1bn.
Technip (~5%), Chiyoda (~5%), JGC (~5%), Siapem (~5%)
SNC Lavalin , KBR, CBI, Samsung (<5%)
Levels of substitute competition - medium
Only largest players able to handle increasing number of EPIC contracts valued > $1bn.
Technip (~5%), Chiyoda (~5%), JGC (~5%), Siapem (~5%)
SNC Lavalin , KBR, CBI, Samsung (<5%)
Barriers to entry – medium
•Large scale projects requiring contractors with strong balance sheets given turn key nature of LNG awards
•Established relationships with NOCs (from whom a larger number of LNG contracts originate)
•Regional presence and partnership with local personnel. Necessary infrastructure (e.g. yards) required for construction and installation phases
•Technology licensed out selectively
Barriers to entry – medium
•Large scale projects requiring contractors with strong balance sheets given turn key nature of LNG awards
•Established relationships with NOCs (from whom a larger number of LNG contracts originate)
•Regional presence and partnership with local personnel. Necessary infrastructure (e.g. yards) required for construction and installation phases
•Technology licensed out selectivelyStrength of suppliers: medium
•Main supply is steel (up to 50% of cost base) with remainder of supply chain split across various sub-contracting functions (e.g. construction, procurement)
•Prices of specialised equipment should be resilient.
•Note that decrease in raw material and sub-contracting prices potentially passed through to Buyer depending on initial terms & conditions of Oil Service company-Buyer contract.
Strength of suppliers: medium
•Main supply is steel (up to 50% of cost base) with remainder of supply chain split across various sub-contracting functions (e.g. construction, procurement)
•Prices of specialised equipment should be resilient.
•Note that decrease in raw material and sub-contracting prices potentially passed through to Buyer depending on initial terms & conditions of Oil Service company-Buyer contract.
Strength of buyers - low
•Medium levels of substitution and barriers to entry suggest that this industry is structurally robust
•Medium term, expect margin contraction for Oil Services due to downside pressure on supplier prices and greater resistance from Oil co’s (exception: $1bn+ contracts with limited competition)
Strength of buyers - low
•Medium levels of substitution and barriers to entry suggest that this industry is structurally robust
•Medium term, expect margin contraction for Oil Services due to downside pressure on supplier prices and greater resistance from Oil co’s (exception: $1bn+ contracts with limited competition)
Threat of substitutes: low
•Economies of scale (bolt on liquefaction trains around existing infrastructure & established supply chain) increases attractiveness of LNG vs. other advanced energy alternatives e.g. GTL
•Monetisation of gas using pipelines increasingly difficult for stranded reserves. LNG more feasible option
Threat of substitutes: low
•Economies of scale (bolt on liquefaction trains around existing infrastructure & established supply chain) increases attractiveness of LNG vs. other advanced energy alternatives e.g. GTL
•Monetisation of gas using pipelines increasingly difficult for stranded reserves. LNG more feasible option
Source: Deutsche Bank

7 December 2009 Oil & Gas European Oil Services
Deutsche Bank AG/London Page 101
Figure 161: Deepwater drilling – Day rates expected to show varying results; however structurally a robust industry
Levels of substitute competition - medium
Players look to seek market share with expansion of their drilling capacity through new builds and rig charters
Transocean 15%, Seadrill 10%, Pride 5%, Saipem 2%, Nabors, Scorpion, Fred Olsen <1%
Levels of substitute competition - medium
Players look to seek market share with expansion of their drilling capacity through new builds and rig charters
Transocean 15%, Seadrill 10%, Pride 5%, Saipem 2%, Nabors, Scorpion, Fred Olsen <1%
Barriers to entry – high
•Capital intensive business whose participants leverage the necessary assets (e.g. drillships, semi-submersible rigs) and their geographic flexibility to win deepwater drilling contracts. (Lead time on rig new builds between 3-4 years and average rig cost between $100-300mn)
•Advanced drilling technology required on ultra deepwater fields
•Technical human expertise with established track records
Strength of buyers: low
•Medium levels of substitution and high barriers to entry suggest that this industry is structurally robust
•Expect margin expansion for a limited number of plays given increasing demand for deepwater drilling against a relatively tight supply outlook
Strength of buyers: low
•Medium levels of substitution and high barriers to entry suggest that this industry is structurally robust
•Expect margin expansion for a limited number of plays given increasing demand for deepwater drilling against a relatively tight supply outlook
Threat of substitutes: low
•NOC and IOC investment shifting towards deepwater fields as economics become more attractive.
•Size of reserves, ultimate recoveries and rates of flow potentially higher in deepwater
Threat of substitutes: low
•NOC and IOC investment shifting towards deepwater fields as economics become more attractive.
•Size of reserves, ultimate recoveries and rates of flow potentially higher in deepwater
Strength of suppliers: low
•Key supply to drillers will be drill bit components e.g. casing, specialised fluids for well hole etc. Expect cyclical led uptick in demand for these materials and subsequent rise in supplier prices
•In the context of new build capacity main supply is steel
Strength of suppliers: low
•Key supply to drillers will be drill bit components e.g. casing, specialised fluids for well hole etc. Expect cyclical led uptick in demand for these materials and subsequent rise in supplier prices
•In the context of new build capacity main supply is steel
Levels of substitute competition - medium
Players look to seek market share with expansion of their drilling capacity through new builds and rig charters
Transocean 15%, Seadrill 10%, Pride 5%, Saipem 2%, Nabors, Scorpion, Fred Olsen <1%
Levels of substitute competition - medium
Players look to seek market share with expansion of their drilling capacity through new builds and rig charters
Transocean 15%, Seadrill 10%, Pride 5%, Saipem 2%, Nabors, Scorpion, Fred Olsen <1%
Barriers to entry – high
•Capital intensive business whose participants leverage the necessary assets (e.g. drillships, semi-submersible rigs) and their geographic flexibility to win deepwater drilling contracts. (Lead time on rig new builds between 3-4 years and average rig cost between $100-300mn)
•Advanced drilling technology required on ultra deepwater fields
•Technical human expertise with established track records
Strength of buyers: low
•Medium levels of substitution and high barriers to entry suggest that this industry is structurally robust
•Expect margin expansion for a limited number of plays given increasing demand for deepwater drilling against a relatively tight supply outlook
Strength of buyers: low
•Medium levels of substitution and high barriers to entry suggest that this industry is structurally robust
•Expect margin expansion for a limited number of plays given increasing demand for deepwater drilling against a relatively tight supply outlook
Threat of substitutes: low
•NOC and IOC investment shifting towards deepwater fields as economics become more attractive.
•Size of reserves, ultimate recoveries and rates of flow potentially higher in deepwater
Threat of substitutes: low
•NOC and IOC investment shifting towards deepwater fields as economics become more attractive.
•Size of reserves, ultimate recoveries and rates of flow potentially higher in deepwater
Strength of suppliers: low
•Key supply to drillers will be drill bit components e.g. casing, specialised fluids for well hole etc. Expect cyclical led uptick in demand for these materials and subsequent rise in supplier prices
•In the context of new build capacity main supply is steel
Strength of suppliers: low
•Key supply to drillers will be drill bit components e.g. casing, specialised fluids for well hole etc. Expect cyclical led uptick in demand for these materials and subsequent rise in supplier prices
•In the context of new build capacity main supply is steel
Source: Deutsche Bank

7 December 2009 Oil & Gas European Oil Services
Page 102 Deutsche Bank AG/London
Figure 162: Heavy oil sands – We expect high quartile margin decline near term
Levels of substitute competition - medium
Players look to seek market share as they build track record and relationships with client base (a pre-requisite for winning
contracts) often through long standing contacts in other industries
Colt Worley Parsons (5%), Jacobs (5%), Fluor (5%), Amec(5%), Hatch (5%), SNC Lavalin (5%)
Technip, SNC, Equinox, Vista, Gemini, IMV (b/w c. 2-5% each)
Barriers to entry – high
•Capital intensive business whose participants leverage the necessary equipment (e.g. heavy lifting trucks and mining equipment) to win projects.
•Established infrastructure not to mention relationships with IOCs and NOCs; track record often results in repeat contractor-client business and reluctance from client to change
•Advanced technology (often with long patent expiries) on types of extraction methods e.g. in situ bitumen production or processes e.g. tailing management.
•Technical human expertise and know how hard to reproduce
Strength of suppliers: medium
•Suppliers equally split between steel for construction and subcontracting functions that will include procurement, construction.
•Prices of specialised equipment should be resilient.
•Note that decrease in raw material and sub-contracting prices potentially passed through to Buyer depending on initial terms & conditions of Oil Service company-Buyer contract.
Strength of buyers: low
•Medium levels of substitution and barriers to entry suggest that this industry is structurally robust
• Medium term, expect margin contraction for Oil Services due to downside pressure on supplier prices and greater resistance from Oil co’s
Strength of buyers: low
•Medium levels of substitution and barriers to entry suggest that this industry is structurally robust
• Medium term, expect margin contraction for Oil Services due to downside pressure on supplier prices and greater resistance from Oil co’s
Threat of substitutes: medium
•NOC and IOC investment shifting away from traditional more accessible areas as economics become more attractive in oil sands
•Size of reserves and ultimate recoveries potentially higher in oil sands
Threat of substitutes: medium
•NOC and IOC investment shifting away from traditional more accessible areas as economics become more attractive in oil sands
•Size of reserves and ultimate recoveries potentially higher in oil sands
Levels of substitute competition - medium
Players look to seek market share as they build track record and relationships with client base (a pre-requisite for winning
contracts) often through long standing contacts in other industries
Colt Worley Parsons (5%), Jacobs (5%), Fluor (5%), Amec(5%), Hatch (5%), SNC Lavalin (5%)
Technip, SNC, Equinox, Vista, Gemini, IMV (b/w c. 2-5% each)
Barriers to entry – high
•Capital intensive business whose participants leverage the necessary equipment (e.g. heavy lifting trucks and mining equipment) to win projects.
•Established infrastructure not to mention relationships with IOCs and NOCs; track record often results in repeat contractor-client business and reluctance from client to change
•Advanced technology (often with long patent expiries) on types of extraction methods e.g. in situ bitumen production or processes e.g. tailing management.
•Technical human expertise and know how hard to reproduce
Strength of suppliers: medium
•Suppliers equally split between steel for construction and subcontracting functions that will include procurement, construction.
•Prices of specialised equipment should be resilient.
•Note that decrease in raw material and sub-contracting prices potentially passed through to Buyer depending on initial terms & conditions of Oil Service company-Buyer contract.
Strength of buyers: low
•Medium levels of substitution and barriers to entry suggest that this industry is structurally robust
• Medium term, expect margin contraction for Oil Services due to downside pressure on supplier prices and greater resistance from Oil co’s
Strength of buyers: low
•Medium levels of substitution and barriers to entry suggest that this industry is structurally robust
• Medium term, expect margin contraction for Oil Services due to downside pressure on supplier prices and greater resistance from Oil co’s
Threat of substitutes: medium
•NOC and IOC investment shifting away from traditional more accessible areas as economics become more attractive in oil sands
•Size of reserves and ultimate recoveries potentially higher in oil sands
Threat of substitutes: medium
•NOC and IOC investment shifting away from traditional more accessible areas as economics become more attractive in oil sands
•Size of reserves and ultimate recoveries potentially higher in oil sands
Source: Deutsche Bank

7 December 2009 Oil & Gas European Oil Services
Deutsche Bank AG/London Page 103
Figure 163: Rig construction services – We expect mid quartile margin decline near term
Levels of substitute competition…
…by theme: medium
•Large scale players (operating EPIC contracts > $500mn) seeking to take on smaller sized projects and accept lower prices (advantaged by economies of scale) could alter market share within each of the themes below:
Jack-up refurbishment and new build construction players:
Lamprell (40%), Keppel FELS (20%), PPL (15%), Maritime Industrial Services (5-10%), QGM (5-10%), Dubai Dry docks (5%)
Semi-sub refurbishment & new build construction players:
Keppel (15%), Sembcorop Marine (10%), Jurong (10%), J Ray Mc Dermott (10%), DubaiDryDocks (15%), PPL (10%), Samsung (10%) Daewoo (10%),
Lamprell, MIS, QGM (all <10%)
…by region: high
•Threat of ‘geographical substitution’ is real: regional markets will increasingly compete against each other for business
Regional players (includes semi/jackup refurb and new builds):
Middle East - mainly UAE (25%), Singapore (40%), S.E Asia (15%)
USA/GoM (15%), West Africa (5%),
Barriers to entry – medium
•Established relationships with IOCs, NOCs and oil service companies; track record often results in repeat contractor-client business and reluctance from client to change
•Location and partnership with local government and personnel. Clients will often opt for contractors located in close proximity
•Necessary expertise and infrastructure (e.g. yards) required for construction and procurement phases.
•Large scale projects requires contractors with strong balance sheets given turn key nature of awards
Strength of suppliers: medium
•Main supply is steel (up to 35% of cost base) with remainder of supply chain split across various sub-contracting functions (e.g. construction, procurement)
•Note that decrease in raw material and sub-contracting prices potentially passed through to Buyer depending on initial terms & conditions of Oil Service company-Buyer contract.
Strength of buyers - high
•Relatively high levels of substitution (increasingly from China) and low barriers to entry suggest that this industry is structurally weak
•Medium term, expect acute margin contraction for Oil Services due to downside pressure on supplier prices amidst weaker supply/demand fundamentals
Threat of substitutes: low
•Industry itself has no alternative
Threat of substitutes: low
•Industry itself has no alternative
Levels of substitute competition…
…by theme: medium
•Large scale players (operating EPIC contracts > $500mn) seeking to take on smaller sized projects and accept lower prices (advantaged by economies of scale) could alter market share within each of the themes below:
Jack-up refurbishment and new build construction players:
Lamprell (40%), Keppel FELS (20%), PPL (15%), Maritime Industrial Services (5-10%), QGM (5-10%), Dubai Dry docks (5%)
Semi-sub refurbishment & new build construction players:
Keppel (15%), Sembcorop Marine (10%), Jurong (10%), J Ray Mc Dermott (10%), DubaiDryDocks (15%), PPL (10%), Samsung (10%) Daewoo (10%),
Lamprell, MIS, QGM (all <10%)
…by region: high
•Threat of ‘geographical substitution’ is real: regional markets will increasingly compete against each other for business
Regional players (includes semi/jackup refurb and new builds):
Middle East - mainly UAE (25%), Singapore (40%), S.E Asia (15%)
USA/GoM (15%), West Africa (5%),
Barriers to entry – medium
•Established relationships with IOCs, NOCs and oil service companies; track record often results in repeat contractor-client business and reluctance from client to change
•Location and partnership with local government and personnel. Clients will often opt for contractors located in close proximity
•Necessary expertise and infrastructure (e.g. yards) required for construction and procurement phases.
•Large scale projects requires contractors with strong balance sheets given turn key nature of awards
Strength of suppliers: medium
•Main supply is steel (up to 35% of cost base) with remainder of supply chain split across various sub-contracting functions (e.g. construction, procurement)
•Note that decrease in raw material and sub-contracting prices potentially passed through to Buyer depending on initial terms & conditions of Oil Service company-Buyer contract.
Strength of buyers - high
•Relatively high levels of substitution (increasingly from China) and low barriers to entry suggest that this industry is structurally weak
•Medium term, expect acute margin contraction for Oil Services due to downside pressure on supplier prices amidst weaker supply/demand fundamentals
Threat of substitutes: low
•Industry itself has no alternative
Threat of substitutes: low
•Industry itself has no alternative
Source: Deutsche Bank

7 December 2009 Oil & Gas European Oil Services
Page 104 Deutsche Bank AG/London
Appendix S: The CAPEX/OPEX ‘life cycle’ explained Identifying EPIC across the CAPEX ‘value chain’
FEED (front end engineering design) and detailed engineering: highly specialised and will be involved in conceptual and detailed engineering of various phases of the development (typically in the form of design contracts awarded to the oil service company). Of course the type of qualification be it electrical, mechanical, structural and civil will determine where in the life cycle of the project the engineers will focus on.
Project management: will be involved in construction, procurement, installation to final commissioning of the development. These types of engineers will be armed with years of experience in troubleshooting, logistics/scheduling and execution. An understanding of public policy and cultural perspectives in the country/region of operation is also essential. Note that they are capable or working both in oil and gas and related industries such as power & process and their skills are generally transferable (more so in the onshore segment as offshore tends to be more specialised within oil and gas).
Procurement: sourcing the necessary equipment (e.g. drilling packages, distillation columns, reactors etc) and resources (e.g. raw materials such as cement, steel and concrete) from the appropriate supplier and assuming responsibility for logistics and pricing.
Installation: implementing the engineering design (often in parallel with the scheduling and securing of equipment). Offshore activities will require installation vessels (either owned in-house or outsourced) capable of pipe-laying and heavy lift.
Construction – in conjunction with installation/procurement and either performed in-house or outsourced via sub-contractors, typically locally based.
Figure 164: Typical revenue recognition on a capex project
0.0
0.1
0.2
0.3
0.4
0.5
0.6
0 1 2 3 4 5 6 7 8 9 10 11 12 13 14 15 16 17 18 19 20 21 22 23 24 25 26 27 28 29 30 31 32
Month
Tota
l inst
alle
d co
st (T
IC) r
e-ba
sed
Front end engineering Project management contract (PMC) Detailed engineering
Procurement (m) Construction (m) Installation (m)
5%7%
20%
24%
31%
14%
Absolute percentage contribution from each phase
Source: Deutsche Bank; m = management;
Across the last few years, we
have seen IOCs and the more
experienced NOCs prefer to
contract the engineering and
project management functions
separately in order to provide
the right solution that centres
on timely and efficient
completion at an optimal cost
(rather than the contractor
taking possession of the entire
project and arguably try to sell
internal products that work
around its own engineering
solution).

7 December 2009 Oil & Gas European Oil Services
Deutsche Bank AG/London Page 105
It is important to clarify:
The margins realised across each project phase will depend on the type of contract entered into as well as the industry in which it is operating in. In theory, the structural characteristics of e.g. upstream deepwater engineering or frontier developments are greater (and so should generate a higher relative margin) than e.g. simple upstream onshore engineering which will have less barriers to entry and more players. Note that internal advantages such as cost structure and operational efficiency should also differentiate each company’s margin realisation. The profile depicted above applies to all energy-related capex projects i.e. oil and gas, power, process and associated infrastructure.
The FEED and detailed engineering design phases will represent no more than 5-10% of the total cost of the project.
Pureplay engineering and project management companies do not own any assets and therefore will not be directly involved in the physical undertaking of these phases. A contract of this nature would typically be in the form of an EPICm – i.e. management of engineering, procurement, installation and construction). Note that onshore developments and simple facilities which are typically repeatable solutions and where there is usually a cost focus and less product or engineering differentiation will be generally be packaged as part of an EPIC lump sum contract. This is because no real technology/knowledge input is required at the front end. Also it is a relatively mature supply chain therefore easier to package up the solution. Complex projects (technically/environmentally challenging) will have bespoke solutions that often involve more technologically based products.
An engineering, procurement, installation and construction management contract will generally be <c. $100mn whilst the underlying EPIC contract itself will be much higher in value i.e. >c. $500mn. This is given the procurement, installation and construction phases will be more cost intensive (involves raw materials, equipment, installation using various types of vessels and finally construction activities).
The procurement, construction and installation phases (which will tend to also include commissioning and start-up) are generally tendered together in the form of a single contract however can also be tendered separately. The reason why an energy company may prefer to opt for the latter is to lower the risk of giving the work to one contractor preferring to choose best in class. It is worth mentioning that the engineering element of a large EPIC contract may be sub-contracted to a specialist (e.g. Amec and Wood Group).
Understanding ‘OPEX’
Below we show the opex profile typified for an energy development (be it oil, gas, power or process) that generally represents c. 30-40% of the total field life cost (indexed to 1 with the balance comprising capex; see Figure 165).

7 December 2009 Oil & Gas European Oil Services
Page 106 Deutsche Bank AG/London
Figure 165: Typical revenue recognition for on an opex contract
0.0
0.1
0.2
0.3
0.4
0 5 10 15 20 years+
Years
Tota
l afte
r life
cos
t (TA
C) r
e-ba
sed
Operations and maintenance Decommissioning
30%
70
Absolute percentage contribution from each phase
Source: Deutsche Bank
The long-term nature of an operating and maintenance contract provides excellent visibility for an oil service company given it is generally signed for 5-years+ and termed on periodic renewals aimed at giving the client an option to change the fee structure and/or the contractor itself.
7 December 2009 Oil & Gas European Oil Services
Deutsche Bank AG/London Page 107
Appendix T: Global oil service spectrum explained The global service spectrum is highly fragmented. So we take a step back and return to the basics in establishing how the various themes mentioned above, such as ‘wellhead operations’, ‘drilling’, ‘SURF’, ‘oil sands’, ‘LNG’, etc., fit into the service jigsaw (shown in Figures 166 and 167 in the form of flow sheets).

7 Decem
ber 2009 O
il & G
as European O
il Services
Page 108
Deutsche B
ank AG
/London
Figure 166: Backbone functions of the service sector across the oil life cycle*
Undiscovered oil and gas underneath seabed / groundExploratory, appraisal and development capex (below ‘mudline’) mainly US based
companies (private & listed) with relatively fewer Europeans / Asian
players
Onshore
ECI of:1) Umbilicals, risers and flowlines (SURF)2) Rigid & flexible pipes3) Topsides and hulls of platforms
ECI of conventional oil & gas processing facilities
ECI of frontier developments (harsh operating environments)
Surface facilities** Subsea Infrastructure & Equipment**
ECI of fixed platforms
DeepwaterShallow-water
Shallow-water
Deepwater
ECI or leasing of floating platforms:1) Semi-submersibles (SPAR, tension leg platforms)2) Floating production storage and offloading ships (FPSOs)
1) Conventional trunklines2) Subsea equipment / systems3) Topsides and hulls of platforms
ECI of advanced subsea equipment / systems
Produced Oil or Oil sands
Brownfield and greenfield ECI of:1) Refineries2) Petrochemicals plants3) Oil sands upgraders and process plants
Maintenance modification and operational management of offshore / onshore facilities ECI of gas to liquid
plants (GTL)
Engineering and construction (discovered oil and gas underneath seabed / ground)
Offshore
Produced Gas
ECI of liquefaction plants (LNG) followed by ECI of re-gasification terminals
Engineering & construction capex
(above ‘mudline’) mainly European and Asian based
companies (listed and private) with relatively
fewer US players
Mud line (seabed or dry land) Mud line (seabed or dry land)
Exploration (seismic, drilling, well operations, rig construction) (broken down in next chart )
ECI of oils sands. Extraction includes mining (<75m) and ‘in situ’ steam injection(>75m)
Source: Deutsche Bank *ECI is engineering, construction and installation; **Installation phase completed using various heavy lifting/pipe-laying/inspection vessels (owned or leased by E&C company) also known as lift boats

Deutsche B
ank AG
/London P
age 109
7 Decem
ber 2009 O
il & G
as European O
il Services
Figure 167: Backbone functions of the service sector within exploration based activities
Exploration*
Exploration, appraisal & development of well
Drilling Services
Associated Well head Services
Surface Subsurface
1) Casing & tubing services and products (inc cementation) 2) Coiled tubing 3) Completion equipment (e.g., TCP, tractors, safety tools) 4) Downhole drilling tools 5) Drill bits 6) drilling & completion fluids 7) Specialty chemicals 8) tubulars 9) Well servicing (other than above)10) Artificial lift (e.g. electrical submersible, rod/gas lift and progressive cavity pumps)
1) Pressure pumping** (e.g., cementing and stimulation) and compression services2) Production well testing. 3) rental and fishing4) Operations and maintenance. 5) Solids control and waste management
1) Logging while drilling 2) mud logging 3) Wireline logging (e.g., well intervention, openhole and cased hole). 4) Directional drilling 5) Operations and maintenance6) Inspection and coating7) Coiled tubing (excludes manufacturing of)
1) Surface equipment (e.g., valves & surface trees, pressure and flow control)2) Rig equipment (e.g., power tongs)3) Unit manufacturing (e.g., plug valves)
EquipmentServicingEquipment and productsServicing
Floater rigs Fixed rigs
1) 2nd generation: benign/harsh weather2) 3rd/4th
generation: benign/harsh3) 5th/6th
generation: deckload up to 5000tn/water depth up to 12,000ft (equivalent to drilling depth of 40,000 ft)
DrillshipsSub/semi-mersibles
Tenders/barges
Jack-ups (onshore/offshore)
1) 3rd/4th generation: benign/harsh environment 2) 5th/6th generation: deckload up to 5000tn/water depth up to 12,000ft (equivalent to drilling depth of 40,000 ft)
1) Anchoring system used over dynamic positioning so depths are only typically up to 500ft. Benign environment only
1) JU 200/250/300 etc through to 400ft (water depth) equivalent to drilling up to 30,000ft2) Harsh or benign environment3) Standard or high specification
Rig Construction Services
Engineering, procurement and
construction of drilling rigs
Exploration, appraisal & development of well
Newbuilds Upgrades Others
1) Semi-sub, drillship, jack-up (onshore and offshore) & tender construction
1) Maintenance and repair: rigs typically taken offline – but may also be done while in operation using remote operating vehicles)2) Construction and refurbishment of lift boats*** i.e. heavy lift construction vessels
Below ‘mudline’ (seabed or dry land)Below ‘mudline’ (seabed or dry land)
1) Refurbishment of all types of drilling rigs2) Re-activation 3) Conversion
Source: Deutsche Bank; *Note we have excluded seismic operations; **we have placed this within ‘surface’ activities but can arguably be placed in ‘subsurface’ (servicing) also; ***’lift boats’ are different to ‘rigs’ in that they are used for E&C type operations within the offshore segment. Underlying driver for this market will therefore not be exploration but offshore E&C; for simplicity we have included lift boats here as they are typically built by the same companies that construct rigs

7 December 2009 Oil & Gas European Oil Services
Page 110 Deutsche Bank AG/London
Appendix U: Glossary of terms and simplifications Understanding contingencies
Contingencies are captured either within the estimated costs for conditions or situations (often called “knowns”) or under management reserves (‘known unknowns’) i.e. they are not included in estimated costs. Contingency is an amount that must be added by the contractor to account explicitly or implicitly for knowns, i.e., those risks which are likely to occur but cannot be specifically identified at the time the estimate is prepared. Contingency thus is the amount added to the estimate to allow for providing for expenses that experience shows will likely be required, and are therefore part of the total estimated cost (not an extra), and conditions arising during the execution of the project which could not be specifically priced, foreseen or anticipated. Contingency is typically managed by the project manager and the amount is established by issues such as design definition level, estimating methodology, time frame and the probability of meeting the required schedule, whether the project involves new or emerging technology, remoteness of job site, infrastructure requirements, engineering physical progress, degree of equipment and material commitment, etc. Management reserve is an amount that the contractors’ manage, rather than the project manager, establishes to cover for execution performance risks that may arise from “known unknowns” and is not included in the estimated project cost. These “known unknowns” are risks that are neither explicit nor normally expected, i.e., risks that are typically discrete events with a low frequency of occurrence and a high severity of impact, such as shortages of trained contract administration/project controls personnel, shortages of resources, technology failures, etc.
Oil service companies and different project teams within the same company quantify risk into contingency differently for different project delivery methods and contract types. The difference in booking lump sum contracts and cost reimbursable contracts can be summed up in how the oil service company evaluates contingency. In a lump sum bid, the contingency is included in the booked backlog, and may or may not increase the margin that is realized at completion of the project. For example, if the risks included in the contingency do not emerge, margin is increased. On the other hand, if risks were not properly and adequately estimated, margins at completion will be less, such as when project execution delays occur. Note, however, that an owner/operator’s use of prescriptive specifications is tantamount to saying that this is what the owner/operator wants and expects. The oil service company only has risk associated with its execution of exactly what is called for in the contract documents. In other words, the company’s duty is to conduct a reasonably prudent review of the plans and specifications. Oil service companies recently have increased their exposure, however, to the performance of sub-contractors. When allocating construction risks, appropriate allocation is not achieved due to the inferior bargaining position held by lower tier parties. Oil service companies tend to push risk down to the lowest level through successive levels of contracting. This approach almost guarantees project delays and increased costs because:
It pushes risk to the lowest level in the contracting chain where the firms have the least financial depth.
The lowest levels have to accept the risk because they do not have the clout to ward off the allocation.
The ability of the firms who are left with the risk can do very little to alter the risk should it emerge on the project.

7 December 2009 Oil & Gas European Oil Services
Deutsche Bank AG/London Page 111
The result is that accountability is not in line with the risk and oil service companies have to fund the completion of the project, and try and recover the costs from the sub-contractors or through “extras” from the project’s owner/operator.
Variation orders, extras and changes – what’s the difference?
“Variation orders” (relating to turnkey projects) are submitted when the scope of the project changes due to a shift in client scheduling/demands, change in design specifications or execution problems that have incurred additional costs. Whilst these are usually realised across the life of the contract, delays in their approval often mean that they cannot be booked (under new IFRS rules, change orders cannot be accounted for until they are formally acknowledged by the client). Indeed, the greatest risk to contractors is that despite delivering on the contract, the client does not agree with the value of the variation orders claimed leading to a ripple of legal procedures and ultimate charges to the company’s P&L relating to the specific problem contract.
An “Extra” is an item of work or a method of performing work that is not normally required to complete to the original scope of work. It can arise in the same type contexts as changes, but it is outside what was or would be assumed as necessary to complete the original project scope. Extras are the responsibility of the owner/operator no matter the type of contract, unless there is an issue with the E&C ’s performance. For instance, issues related to the “standard of care” which the owner/operator demanded.
A “Variation” generally applies to Unit Price type contracts where the quantities are actually estimated and made a part of the contract. Variations are the difference between an estimated quantity and the quantity actually required to complete the item of work. Generally the contract specifies a band (+/-) around the estimated quantity for which the price is valid. “Variations” are the responsibility of the owner/operator, unless there is an issue with the contractor’s performance. For instance, issues related to the “standard of care” which the owner/operator demanded or issues, such as, if the E&C under-estimated the quantity. As is obvious, issues are emerging currently as project costs increase and/or are accompanied by delay concerning the “standards of care” that are applicable. Where there are disagreements between owner/operators and contractor, a change, extra and/or variation morphs into a “claim.” A claim is a bona fide disagreement between the owner/operators and the contractor for a project as to a change, extra or variation. As far as backlog and revenue recognition against such backlog is concerned, all or some of claims are booked provided the oil service company makes a reasonable assessment of the likely magnitude it will recover. If the project owner/operators and the contractor cannot agree with respect to a claim, the claim further morphs into a “dispute.” Once again, there are considerable differences between publicly traded firms in regards to whether the cost of disputed items and/or some portion should be booked and/or revenue recognised. Oil service companies must assure that they do not recognise revenue from claims or disputes that is in excess of the amount of likely recovery because it will necessitate a write down if the amount is not ultimately recovered.
As is obvious, internal or external misunderstandings create a large amount is risk which must be managed by all stakeholders. The heart of risk management is the process by which changes, extras, variations, claims and disputes are handled at the corporate level or the project level. For owner/operators it is the means of preventing or reducing contractors’ costs through efficient oversight and quality management. For contractors it means costs are properly identified and recorded, and they do not give away assets to owner/operators by improper or inadequate processes.
7 December 2009 Oil & Gas European Oil Services
Page 112 Deutsche Bank AG/London
Understanding the contract strategy
The contract strategy represents the way in which these delivery systems are packaged and paid for by the client. What is common across all types is that the owner/shareholder will insist (via the contract provisions) that the contractor, in return for being paid to execute those functions, also accepts the risk of performing those functions as per the standard and conditions laid down in the contract. We identify four generic contracting types that represent the bulk (>95%) of contracts signed between the client (NOC or IOC) and oil service companies:
Lump sum: The client pays a fixed price for any combination mentioned above. In the majority of
cases it will be the entire project cycle; so the combination spans engineering, procurement, installation and construction. Note that a FEED contract by itself will rarely be awarded on a lump sum basis as here the emphasis is on quality and breadth of technical content. The client will not want this to be constrained by a fixed price.
The bid packages are presented and the one that is chosen forms the basis of the project award value. The key characteristic here is that any unforeseen cost that is not strictly underwritten within the original contract will likely be assumed by the contractor (unless there is a change in the scope of the project in which case the unforeseen cost is chargeable to the client).
The fixed price that envelops the contract should, in theory, accommodate a worst-case scenario in case execution risks become a reality. This ‘buffer’ is calculated in the form of a contingency and can represent up to 15% of the asking price. The best case scenario is that these are not exercised in which case they are ‘released’ and materialise as additional ‘cream’ on top of the base price/margin. In the worst-case scenario, these risks exceed the contingencies put in place and erode the base margin to an extent that the contractor loses money on the project.
Cost plus: The oil service company is able to recover its costs within a contractually defined
structure. These costs typically include construction labour, materials, equipment, sub-contractors and overheads. The asking price is equivalent to a percentage or fixed amount for contingency and profit. This is split into a base portion (or ‘recovery cost’) X% and an additional Y% that is termed ‘fee at risk’ (can be fixed or variable i.e. a % of the recovery cost). If the contractor meets and/or exceeds the original specifications, it pockets the additional Y%. Conversely, the fee at risk is forfeited.
A common misperception is that there is no risk on the ‘X’% earned. Normally, if the contractor issues a poor design or demonstrates inefficiencies that result in a breach of contract, then the entire fee can be forfeited. Worst case, the contractor may actually lose money on the project if the additional costs are rebuffed by the client and exceed those implied in the base margin.
The owner/shareholder bears a significantly higher cost and schedule risk than in a lump sum contract and so its direct management of the project will be higher. As a result the client is far more likely to detect errors and defects at no additional cost to itself under a cost plus contract. Equally, given the increased management attention and performance measures, an owner may actually hold the contractor to a much more strict interpretation of the ‘standard of care’ expected (and paid for) than under any other contract strategy.
Cost plus + KPIs (key performance indicators): Same as above but includes an extra performance-related constituent (in addition to the
‘Y’%). The ability to realise this is measured against a specific set of well-defined performance metrics including: 1) achieved delivery vs. the original schedule and 2) the

7 December 2009 Oil & Gas European Oil Services
Deutsche Bank AG/London Page 113
ability to provide cost or operational efficiencies to the client beyond the original project scope. For example, assume that a project has a series of 10 specific intermediate milestone dates by which certain construction activities have to be achieved. Each of these milestones may represent a point of evaluation against a KPI set on achieving the completion of the project by the respective date. The parties can agree, for example, that achievement of any one milestone is a performance ranking of “0”, missing any one milestone is a performance ranking of “-1” and beating a milestone date is a performance ranking of “+1”. In this example, the contractor would be eligible for an incentive payment for achieving “+1” on a milestone and a penalty for achieving “-1”.
Note that while ideally all cost plus contracts would be structured to have KPIs, the reality is that not all clients accept performance-related incentives (taking the view that ‘Y’ is sufficient). Therefore, it is up to the oil service company to keep its exposure to this type of contract strategy as high as possible relative to cost plus.
Unit price (also termed target price or convertible lump sum) A hybrid of cost plus and lump sum. This type of contract is only applicable for entire
project cycles. It begins as a cost plus up to the point where all procurement is secured (and priced) and necessary sub-contractors are in place.
The client pays a fixed price for work based on the “all-inclusive cost” of a unit of an installed commodity. For example: assume the commodity is 10cm diameter single wall carbon steel pipe. The contractor would develop a “fixed price” per linear meter of pipe installed which would include the total cost to procure the pipe; the cost to ship, store and handle the pipe; the labour and materials costs to install the pipe; and, overhead and profit amounts. In effect, the price per unit installed is firm; however the number of units to be installed is not fixed. The contractor presumably bears no risk if the number of units increases or decreases during execution.
A hybrid between unit price and cost plus is one in which the cost to procure the commodity is removed from the “all-inclusive cost” of a unit. Typically in this contracting strategy the owner retains the responsibility and the cost risk of purchasing the commodity, while the contractor retains the responsibility to accurately price the cost of receiving, handling, and installing the commodity at a fixed cost, which again includes overheads and profit. The hybrid leaves the performance risk with the contractor. Again, the contractor presumably bears no risk should the total number of units increase or decrease.
Glossary
AHTS (Anchor Handling, Tug & Supply ship): Combination vessels operating in the offshore market, intended for use in anchor-handling, tug operations and transportation of supplies.
Conventional/shallow waters: Depth of up to 400 metres (1,300ft).
Cost plus: The client is charged a day rate or project rate across the life of the project, with any extra work required to complete the job added to the bill.
Deep waters: Depths of over 400 metres (1,300 ft).
Commissioning: Series of processes and procedures undertaken in order to start operations of a gas pipeline, associated plants and equipment.
Decommissioning: Series of processes and procedures undertaken in order to end operations of a gas pipeline, associated plants and equipment. It may occur at the end of the life of the plant, following an accident, for technical or financial reasons, and/or on environmental or safety grounds.

7 December 2009 Oil & Gas European Oil Services
Page 114 Deutsche Bank AG/London
Development (of a gas or oil field): All operations associated with the construction of facilities to enable the production of oil and gas.
Drillship: A maritime vessel modified to include a drilling rig and special station-keeping equipment. The vessel is typically capable of operating in deep water. A drillship must stay relatively stationary on location in the water for extended periods of time. This positioning may be accomplished with multiple anchors, dynamic propulsion (thrusters) or a combination of these. Drillships typically carry larger payloads than semi-submersible drilling vessels, but their motion characteristics are usually inferior.
Dynamically Positioned Heavy Lift Vessel: Vessel equipped with a heavy-lift crane, capable of holding a precise position through the use of thrusters, thereby counteracting the force of the wind, sea, current, etc.
EPC (Engineering, Procurement, and Construction): A type of contract typical of the onshore construction sector, comprising the provision of engineering services, procurement of materials and construction. The term ‘turnkey’ indicates that the system is delivered to the client ready for operations, i.e. already commissioned.
EPIC (Engineering, Procurement, Installation, Construction): A type of contract typical of the offshore construction sector, which relates to the realisation of a complex project where the global or main contractor (usually a construction company or a consortium) provides the engineering services, procurement of materials, construction of the system and its infrastructure, transport to site, installation and commissioning/preparatory activities to the start-up of operations.
FEED: Front-End Engineering Design
Facilities: Auxiliary services, structures and installations required to support the main systems.
Flexible flowline: Flexible pipe laid on the seabed for the transportation of production or injection fluids. It is generally an infield line, linking a sub-sea structure to another structure or to a production facility. Its length ranges from a few hundred metres to several kilometres.
Flexible riser: Riser constructed with flexible pipe (see Riser).
Floaters: Floating production units including floating platforms, and FPSOs.
Floatover: Type of module installation onto offshore platforms that does not require lifting operations. A specialised vessel transporting the module uses a ballast system to position itself directly above the location where the module is to be installed; it then proceeds to de-ballast and lower the module into place. Once this has been completed the vessel backs off and the module is secured to the support structure.
FPSO vessel: Floating Production, Storage and Offloading system comprising a large tanker equipped with a high-capacity production facility. This system, moored at the bow to maintain a geo-stationary position, is effectively a temporarily fixed platform that uses risers to connect the sub-sea wellheads to the on-board processing, storage and offloading systems.
FPU (Floating Production Unit): A ship-shaped floater or a semi-submersible used to process and export oil and gas

7 December 2009 Oil & Gas European Oil Services
Deutsche Bank AG/London Page 115
GTL (Gas-to-Liquids): Transformation of natural gas into liquid fuel (Fischer Tropsch technology).
Hydrotesting: Operation involving high-pressure (higher than operational pressure) water being pumped into a pipeline to ensure that it is devoid of defects.
IRM (Inspection, Repair and Maintenance): Routine inspection and servicing of offshore installations and sub-sea infrastructures.
Jacket: Platform underside structure fixed to the seabed using piles.
Jack-up: Mobile self-lifting unit comprising a hull and retractable legs, used for offshore drilling operations.
J-laying: Method of pipe-laying that utilises an almost vertical launch ramp, making the pipe configuration resemble a ‘J’. This configuration is suited to deep-water pipe-laying.
LNG: Liquefied natural gas is obtained by cooling down natural gas to minus 160°C at normal pressure. Gas is liquefied to make it facilitate its transportation from the place of extraction to that of processing and/or utilisation. A tonne of LNG equates to 1,400 cubic metres of gas.
Lump-sum or LSTK (lump sum turnkey project): One fixed price for the project that will typically encompass engineering, procurement, installation and construction activities.
Midstream: Sector comprising all those activities relating to the construction and management of the oil transport infrastructure.
Mobile offshore drilling unit: A generic term for several classes of self-contained floatable or floating drilling machines such as jackups, semi-submersibles, and submersibles.
Mooring buoy: Offshore mooring system.
NOC: National Oil Company
Offshore/Onshore: The term offshore indicates a portion of open sea and, by induction, the activities carried out in such area, while onshore refers to land operations.
Pre-commissioning: Comprises pipeline washing out and drying.
Regasification terminal: Coastal plant that accepts deliveries of liquefied natural gas and processes it back into gaseous form for injection into the pipeline system. Also known as a receiving terminal.
Riser: Manifold connecting the sub-sea wellhead to the surface.
ROV (Remotely Operated Vehicle): An unmanned sub-sea vehicle remotely controlled from a vessel or an offshore platform. It is equipped with manipulator arms that enable it to perform simple operations.
S-laying: Method of pipe-laying that utilises the elastic properties afforded by steel, making the pipe configuration resemble an ‘S’, with one end on the seabed and the other under tension onboard the ship. This configuration is suited to medium to shallow-water laying.
Spar: Floating production system, anchored to the seabed through a semi-rigid mooring system, comprising a vertical cylindrical hull supporting the platform structure.

7 December 2009 Oil & Gas European Oil Services
Page 116 Deutsche Bank AG/London
Spool: Connection between a sub-sea pipeline and the platform riser, or between the terminations of two pipelines.
Submersible/semi-submersible drilling rig: A particular type of floating vessel, usually used as a mobile offshore drilling unit (MODU) that is supported primarily on large pontoon-like structures submerged below the sea surface.
Sub-sea Technology: All products and services required to install and operate production installations on the seabed.
SURF facilities: Sub-sea Umbilicals Risers Flowlines – pipelines and equipment connecting the well or sub-sea system to a floating unit.
Template: Rigid and modular sub-sea structure where the oilfield wellheads are located.
Tendons: Pulling cables used on tension leg platforms used to ensure platform stability during operations.
Tension leg platform (TLP): Fixed-type floating platform held in position by a system of tendons and anchored to ballast caissons located on the seabed. These platforms are used in ultra-deep waters.
Tie-in: Connection between a production line and a sub-sea wellhead or simply a connection between two pipeline sections.
Topside: Portion of platform above the jacket.
Trunkline: Large diameter oil pipeline connecting large storage facilities to the production facilities, refineries and/or onshore terminals. Used in shallow waters.
Trenching: Burying of offshore or onshore pipelines.
Umbilical: Flexible connecting sheath, containing flexible pipes and cables.
Upstream/Downstream: The term upstream relates to exploration and production operations. The term downstream relates to all those operations that follow exploration and production operations in the oil sector.
Wellhead: Fixed structure separating the well from the outside environment.
Wellservicing: Intervention in sub-sea production wells carried out from a floating rig or a dynamically positioned vessel.
Workover: Major maintenance operation on a well or replacement of sub-sea equipment used to transport the oil to the surface.
Sources:
http://lnglicensing.conocophillips.com/about/glossary/index.htm http://www.glossary.oilfield.slb.com/Display.cfm?Term=submersible%20drilling%20rig http://www.rabt.se/index.php?id=102&L=1 http://www.skibskredit.dk/Default.aspx?ID=503 http://www.technip.com/english/html_top/p_glossaire.html Saipem Annual Report 2004

7 December 2009 Oil & Gas European Oil Services
Deutsche Bank AG/London Page 117
Appendix 1 Important Disclosures
Additional information available upon request
For disclosures pertaining to recommendations or estimates made on a security mentioned in this report, please see the most recently published company report or visit our global disclosure look-up page on our website at http://gm.db.com/ger/disclosure/DisclosureDirectory.eqsr.
Analyst Certification
The views expressed in this report accurately reflect the personal views of the undersigned lead analyst about the subject issuers and the securities of those issuers. In addition, the undersigned lead analyst has not and will not receive any compensation for providing a specific recommendation or view in this report. Christyan Malek
Equity rating key Equity rating dispersion and banking relationships
Buy: Based on a current 12- month view of total share-holder return (TSR = percentage change in share price from current price to projected target price plus pro-jected dividend yield ) , we recommend that investors buy the stock.
Sell: Based on a current 12-month view of total share-holder return, we recommend that investors sell the stock
Hold: We take a neutral view on the stock 12-months out and, based on this time horizon, do not recommend either a Buy or Sell.
Notes: 1. Newly issued research recommendations and target prices always supersede previously published research.
2. Ratings definitions prior to 27 January, 2007 were:
Buy: Expected total return (including dividends) of 10% or more over a 12-month period
Hold: Expected total return (including dividends) between -10% and 10% over a 12-month period
Sell: Expected total return (including dividends) of -10% or worse over a 12-month period
9%
47%43%
37%29%37%
0
100
200
300
400
Buy Hold Sell
European Universe
Companies Covered Cos. w/ Banking Relationship

7 December 2009 Oil & Gas European Oil Services
Page 118 Deutsche Bank AG/London
Regulatory Disclosures
1. Important Additional Conflict Disclosures
Aside from within this report, important conflict disclosures can also be found at https://gm.db.com/equities under the "Disclosures Lookup" and "Legal" tabs. Investors are strongly encouraged to review this information before investing.
2. Short-Term Trade Ideas
Deutsche Bank equity research analysts sometimes have shorter-term trade ideas (known as SOLAR ideas) that are consistent or inconsistent with Deutsche Bank's existing longer term ratings. These trade ideas can be found at the SOLAR link at http://gm.db.com.
3. Country-Specific Disclosures
Australia: This research, and any access to it, is intended only for "wholesale clients" within the meaning of the Australian Corporations Act. EU countries: Disclosures relating to our obligations under MiFiD can be found at http://globalmarkets.db.com/riskdisclosures. Japan: Disclosures under the Financial Instruments and Exchange Law: Company name - Deutsche Securities Inc. Registration number - Registered as a financial instruments dealer by the Head of the Kanto Local Finance Bureau (Kinsho) No. 117. Member of associations: JSDA, The Financial Futures Association of Japan. Commissions and risks involved in stock transactions - for stock transactions, we charge stock commissions and consumption tax by multiplying the transaction amount by the commission rate agreed with each customer. Stock transactions can lead to losses as a result of share price fluctuations and other factors. Transactions in foreign stocks can lead to additional losses stemming from foreign exchange fluctuations. New Zealand: This research is not intended for, and should not be given to, "members of the public" within the meaning of the New Zealand Securities Market Act 1988. Russia: This information, interpretation and opinions submitted herein are not in the context of, and do not constitute, any appraisal or evaluation activity requiring a license in the Russian Federation.

GRCM2009PROD017307
Deutsche Bank AG/London
European locations
Deutsche Bank AG London 1 Great Winchester Street London EC2N 2EQ Tel: (44) 20 7545 8000
Deutsche-Bank AG, Seccursale de Paris 3, Avenue de Friedland 75008 Paris Cedex 8 France Tel: (33) 1 44 95 64 00
Deutsche Bank AG Equity Research Große Gallusstraße 10-14 60272 Frankfurt am Main Germany Tel: (49) 69 910 00
Deutsche Bank Sim S.p.a Via Santa Margherita 4 20123 Milan Italy Tel: (39) 0 24 024 1
Deutsche Bank AG Herengracht 450 1017 CA Amsterdam Netherlands Tel: (31) 20 555 4911
Deutsche Securities S.V.B, S.A. P0 de la Castellana, 42 7th Floor 28046 Madrid, Spain Tel: (34) 91 782 8400
Deutsche Bank AG Stureplan 4 A, Box 5781 S-114 87 Stockholm Sweden Tel: (46) 8 463 5500
Deutsche Bank AG Uraniastrasse 9 PO Box 7370 8023 Zürich Switzerland Tel: (41) 1 224 5000
Deutsche Bank AG, Helsinki Kaivokatu 10 A, P.O.Bvox 650 FIN-00101 Helsinki Finland Tel: (358) 9 25 25 25 0
Deutsche Bank AG Hohenstaufengasse 4 1010 Vienna Austria Tel: (43) 1 5318 10
Deutsche Bank AG Aurora business park 82 bld.2 Sadovnicheskaya street Moscow, 115035 Russia Tel: (7) 495 797-5000
Deutsche Bank AG, Warsaw al.Armii Ludowej 26 Budynek FOCUS 00-609 Warsaw Poland Tel: (48) 22 579 87 00
Deutsche Bank AG, Turkey Eski Buyukdere Cad. Tekfen Tower No:209 Kat:17-18 TR-34394 Istanbul Tel: (90) 212 317 01 00
Deutsche Bank AG, Greece 23A Vassilissis Sofias Avenue 6th Floor 10674 Athens, Greece Tel: (30) 210 72 56 150
International locations
Deutsche Bank Securities Inc. 60 Wall Street New York, NY 10005 United States of America Tel: (1) 212 250 2500
Deutsche Bank AG London 1 Great Winchester Street London EC2N 2EQ United Kingdom Tel: (44) 20 7545 8000
Deutsche Bank AG Große Gallusstraße 10-14 60272 Frankfurt am Main Germany Tel: (49) 69 910 00
Deutsche Bank AG Deutsche Bank Place Level 16 Corner of Hunter & Phillip Streets Sydney, NSW 2000 Australia Tel: (61) 2 8258 1234
Deutsche Bank AG Level 55 Cheung Kong Center 2 Queen's Road Central Hong Kong Tel: (852) 2203 8888
Deutsche Securities Inc. 2-11-1 Nagatacho Sanno Park Tower Chiyoda-ku, Tokyo 100-6171 Japan Tel: (81) 3 5156 6701
Global Disclaimer The information and opinions in this report were prepared by Deutsche Bank AG or one of its affiliates (collectively "Deutsche Bank"). The information herein is believed to be reliable and has been obtained from public sources believed to be reliable. Deutsche Bank makes no representation as to the accuracy or completeness of such information.
Deutsche Bank may (1) engage in securities transactions in a manner inconsistent with this research report, (2) with respect to securities covered by this report, sell to or buy from customers on a principal basis, and (3) consider this report in deciding to trade on a proprietary basis.
Opinions, estimates and projections in this report constitute the current judgment of the author as of the date of this report. They do not necessarily reflect the opinions of Deutsche Bank and are subject to change without notice. Deutsche Bank has no obligation to update, modify or amend this report or to otherwise notify a recipient thereof in the event that any opinion, forecast or estimate set forth herein, changes or subsequently becomes inaccurate. Prices and availability of financial instruments are subject to change without notice. This report is provided for informational purposes only. It is not an offer or a solicitation of an offer to buy or sell any financial instruments or to participate in any particular trading strategy.
Deutsche Bank has instituted a new policy whereby analysts may choose not to set or maintain a target price of certain issuers under coverage with a Hold rating. In particular, this will typically occur for "Hold" rated stocks having a market cap smaller than most other companies in its sector or region. We believe that such policy will allow us to make best use of our resources. Please visit our website at http://gm.db.com to determine the target price of any stock.
The financial instruments discussed in this report may not be suitable for all investors and investors must make their own informed investment decisions. Stock transactions can lead to losses as a result of price fluctuations and other factors. If a financial instrument is denominated in a currency other than an investor's currency, a change in exchange rates may adversely affect the investment. Past performance is not necessarily indicative of future results.
Unless governing law provides otherwise, all transactions should be executed through the Deutsche Bank entity in the investor's home jurisdiction. In the U.S. this report is approved and/or distributed by Deutsche Bank Securities Inc., a member of the NYSE, the NASD, NFA and SIPC. In Germany this report is approved and/or communicated by Deutsche Bank AG Frankfurt authorized by the BaFin. In the United Kingdom this report is approved and/or communicated by Deutsche Bank AG London, a member of the London Stock Exchange and regulated by the Financial Services Authority for the conduct of investment business in the UK and authorized by the BaFin. This report is distributed in Hong Kong by Deutsche Bank AG, Hong Kong Branch, in Korea by Deutsche Securities Korea Co. This report is distributed in Singapore by Deutsche Bank AG, Singapore Branch, and recipients in Singapore of this report are to contact Deutsche Bank AG, Singapore Branch in respect of any matters arising from, or in connection with, this report. Where this report is issued or promulgated in Singapore to a person who is not an accredited investor, expert investor or institutional investor (as defined in the applicable Singapore laws and regulations), Deutsche Bank AG, Singapore Branch accepts legal responsibility to such person for the contents of this report. In Japan this report is approved and/or distributed by Deutsche Securities Inc. The information contained in this report does not constitute the provision of investment advice. In Australia, retail clients should obtain a copy of a Product Disclosure Statement (PDS) relating to any financial product referred to in this report and consider the PDS before making any decision about whether to acquire the product. Deutsche Bank AG Johannesburg is incorporated in the Federal Republic of Germany (Branch Register Number in South Africa: 1998/003298/10). Additional information relative to securities, other financial products or issuers discussed in this report is available upon request. This report may not be reproduced, distributed or published by any person for any purpose without Deutsche Bank's prior written consent. Please cite source when quoting.
Copyright © 2009 Deutsche Bank AG