fitter for walking evaluation - eltis
TRANSCRIPT

Evaluation of Living Streets’
Fitter for Walking project
January 2012

ii Fitter for Walking Evaluation Report
Authors:
Emma Adams (BHF National Centre for Physical Activity and Health, School of Sport, Exercise and Health
Sciences, Loughborough University)
Mary Goad (BHF National Centre for Physical Activity and Health, School of Sport, Exercise and Health
Sciences, Loughborough University)
Dr Nick Cavill (Cavill Associates Ltd)
The authors would like to thank Living Streets, the Fitter for Walking project co-ordinators, Local
Authority partners and community members for their support and participation in evaluation
activities.
Suggested citation:
Adams, E.J., Goad, M.A. & Cavill, N. (2012) Evaluation of Living Streets‟ Fitter for Walking project.
BHF National Centre for Physical Activity and Health, School of Sport, Exercise and Health Sciences,
Loughborough University, Loughborough, UK.

Fitter for Walking Evaluation Report iii
Executive Summary
Associations between the built environment and participation in physical activity have been well reported
and a number of attributes of the physical environment are known to be associated with participation in
specific types of physical activity such as walking. Despite this, there has been little research to date
assessing the impact of interventions which combine changes to the physical environment with
promotional activities on the use of walking as a mode of transport. The Fitter for Walking project worked
with deprived communities in 12 Local Authority (LA) areas across five regions of England to improve local
environments and promote walking for short journeys. This report summarises the evaluation of Fitter for
Walking and presents a comprehensive assessment of the delivery of these types of programmes as well as
the impact of environmental changes and promotional activities on walking levels in a sub-set of
community projects.
Aims of Fitter for Walking
The overall aim of the Fitter for Walking project was to increase awareness and promote walking as a
mode of transport for short journeys, by working with communities and LAs to improve the local
environment.
Objectives of Fitter for Walking
The objectives of Fitter for Walking were to provide information and support to local community groups;
to develop skills and capacity for promoting walking as a mode of transport; to build community cohesion
by encouraging communities to work together, and with their LA to make improvements to their local
environment; and to thus increase the number of people walking for short journeys. A Fitter for Walking
Award was developed and presented to individuals and community groups to recognise the achievements
made during the project, and to promote project sustainability.
Management and timelines of Fitter for Walking
The Fitter for Walking project was managed and delivered by Living Streets as part of a portfolio of
projects being delivered by a Consortium of the leading walking, cycling and health organisations and
funded through the Big Lottery Fund's Wellbeing Programme. The Programme provides funding to support
the development of healthier lifestyles and to improve well-being.
The Consortium is led by Sustrans and includes British Cycling, CTC, Cycling England, Living Streets,
London Cycling Campaign, the National Heart Forum, the National Obesity Forum, the Ramblers‟
Association, Campaign for Better Transport and Walk 21. It has delivered a portfolio of projects that will
enable two million people nationwide to become more physically active by walking or cycling as part of
their daily lives by 2012 (www.travelactively.org.uk).

iv Fitter for Walking Evaluation Report
Fitter for Walking received £1.7 million funding from the Big Lottery Fund‟s well-being fund and £470k
match funding from Local Authority partners. The project commenced in 2008 and is due to be completed
by March 2012.
Fitter for Walking projects
Living Streets worked with approximately 150 communities from 12 Local Authorities in five regions of
England: London (Barking & Dagenham, Redbridge), North East (Gateshead, Sunderland, Newcastle), North
West (Blackburn with Darwen, Bolton), West Midlands (Dudley, Sandwell, Wolverhampton) and Yorkshire
(Doncaster, Rotherham). These areas were selected to participate in the project by Living Streets based
on reported low levels of physical activity and high levels of obesity.
Project implementation
Five project co-ordinators were appointed (one per region) who were led by the Fitter for Walking
Manager. The role of the project co-ordinators was to work with communities and LAs to make
environmental improvements and promote walking.
There were four stages of project implementation: recruitment and engagement; consultation; delivery of
project activities; and assessment of criteria for obtaining the Fitter for Walking Award.
Recruitment and engagement
Community groups were recruited through both targeted and opportunistic approaches. Following an
initial scoping phase to meet stakeholders in the LA areas, including the local neighbourhood management
team, local contacts were used to identify possible „communities‟ to work with in the project. The term
„community‟ has been used in a broad sense and implies some kind of organised group eg, a tenants‟ and
residents‟ association (TARA), local action groups (eg, a wheelchair users group, or a “friends of” group),
specific ethnic groups or through contacts based in a particular centre like SureStart, community centres
and schools). Co-ordinators made it an objective to invite a wide range of groups to the project.
Once initial contact was made with a group, co-ordinators typically attended a regular meeting of the
group during which they explained the project to the group and delivered a set presentation which
outlined the purpose of the project, the benefits of walking and active travel and how the group could get
involved. The discussion included an initial consultation to identify the barriers to walking in the local
area and how the project might address these. The groups were encouraged to register for the project
through putting their ideas on an application form, which was then appraised by the co-ordinator as
making a case or not to proceed.
Consultation
After recruitment and registration to the project, the project co-ordinator supported the registered group
in identifying a particular route or local area to be the focus of the project. The community group, and in
some cases the wider community, were consulted to identify barriers to walking on a specific route or

Fitter for Walking Evaluation Report v
area. In many projects a community street audit was conducted to help the community group to identify
barriers to walking in the local area and possible solutions such that recommendations could be provided
to the LA for environmental improvements needed in the area. On the basis of the street audit, a report
was written and submitted to the LA partner for consideration for funding.
Project activities
There was no standardised intervention for the project; activities were overseen by a co-ordinator from
Living Streets but were delivered based on the needs and interests of the community, and funding and
resources available from LA, therefore each project was unique and included a diverse set of activities.
Project activities were delivered in three main areas: environmental improvements completed by the LA
partner, eg, new dropped kerbs, improved street lighting, resurfacing of paths, removal of encroaching
vegetation; environmental improvements led by the community, eg, litter pick-up or bulb planting; and
promotional and awareness-raising activities, eg, led walks, themed walks (for example a bat walk or
nature walk), and development of walking maps and street parties.
Fitter for Walking Award
During the project individuals, groups and communities worked towards being presented with the Fitter
for Walking Award. This was developed during the project to encourage residents to work together to
make their local neighbourhoods safer and more attractive for walking and to help bring projects to a
natural close.
The Award aimed to recognise progress towards improving the local environment and promoting walking
for short journeys, and communities worked towards achieving the Award by leading on the assessment of
their local walking environment, identifying priorities for improvement and taking steps to implement
some of the improvements with the support of the Project Co-ordinator. It may be awarded to individuals,
groups or neighbourhoods to recognise their contribution to project activities.
There were four sections in the Award, each with a number of criteria that neighbourhoods must
demonstrate progress towards relating to making environmental changes, engaging community members,
increasing walking levels and making a commitment to sustaining progress.
Fitter for Walking evaluation
An independent evaluation of Fitter for Walking was conducted by the BHF National Centre for Physical
Activity and Health at Loughborough University. The main aims of the evaluation were to:
1. Understand the processes involved in working with local authorities and communities to make changes
to the local environment
2. Assess changes in community cohesion in relation to working together to promote walking and improve
the environment

vi Fitter for Walking Evaluation Report
3. Assess change in the number of walking trips made for local journeys following improvements to an
identified walking route
4. Assess change in the health and well-being of route users and local residents following improvements
to an identified walking route
5. Conduct an economic analysis of at least one Fitter for Walking project.
A mixed methods approach was used to evaluate the Fitter for Walking project which included interviews
and focus groups with project co-ordinators on an regular basis throughout the project; one interview with
each Local Authority partner towards the end of the project; focus groups or interviews with community
members from a sub-set of projects across the five regions; route user counts and route user surveys in
seven projects and a residents‟ survey in five projects. The economic evaluation is reported elsewhere.
Key findings
Living Streets‟ co-ordinators worked with approximately 150 communities from twelve LA areas across five
regions of England as part of the FFW project and successfully supported and delivered a wide range of
environmental improvements and awareness-raising activities to promote an increase in walking. LA
contacts and community members also played a key role in delivering and supporting project activities.
Activities varied across projects according to the needs and interests of the community and LA funding
and capacity. Examples of environmental improvements included clearance of litter, glass, dog mess, and
graffiti (in some cases supported by changes to the LA cleaning regime), improved lighting, new dropped
kerbs, new or improved signposting, removal of street clutter (eg, bollards and railings); removal of
encroaching vegetation; resurfacing of footpaths; improvements to gateways and entrances,
improvements to sight lines and the installation of new benches and litter bins. Promotional activities had
an important role throughout the projects in supporting community engagement; helping the community
to identify the barriers to walking in their area; maintaining momentum during the project; engaging
additional community groups and members; and in promoting new routes and the environmental changes
which had been made, to maximise the chances of sustained behaviour change. The street audit was an
important tool for engaging the community; helping to focus the project on a specific route or area;
helping to identify the barriers to walking and potential solutions on the identified route; and providing
feedback to LAs as to the improvements that were needed. Pledge cards were also important for engaging
the wider community in the project. Other examples of activities included: led walks; themed walks (eg,
bat walks and nature walks); bulb planting; litter pick-ups; street parties and other community events;
and development of walking maps (paper-based or large maps for display boards on walking routes).
The Fitter for Walking Award was successfully developed to recognise progress in communities towards
making environmental changes, engaging community members, increasing walking levels and making a
commitment to sustaining progress. This was awarded to both individuals and communities and was well
received as recognition for what had been achieved.

Fitter for Walking Evaluation Report vii
Key findings are outlined below:
1. Fitter for Walking was almost universally welcomed by communities and local authorities. It
appeared to fill a gap in current service provision for maintenance of, and improvements to, local
community environments.
2. Environmental improvements and awareness-raising activities to promote walking were successfully
delivered in a large number of communities through the Fitter for Walking project with support from
co-ordinators, LA partners and community groups and residents.
3. The role of the co-ordinator was critical to the success of the Fitter for Walking projects and both LAs
and communities reported very positive experiences of working with them. Co-ordinators were
required to lead and co-ordinate and played a key role in engaging community groups, facilitating
relationships between the community and LA partners and maintaining the focus of the project on
walking. It was important for the co-ordinator to develop knowledge of the local area and to
understand existing relationships between the LA and communities in order for the project to be
successful.
4. LAs had a critical role in the project in reviewing and acting upon the recommendations made in
street audits. They provided funding and resources to enable environmental improvements to be
made. The Transport department was thought to be the most appropriate place for this project to be
based owing to access to budgets and existing links to departments who would carry out the work.
Regardless of location, senior management support from within the LA was essential for successful
delivery of the project to ensure resources and funds were allocated to the project.
5. LA contacts sometimes found it difficult to undertake the tasks required for FFW owing to time
pressures from their existing work, budget cuts, existing development plans for neighbourhoods or
other work pressures within the LA. This sometimes led to long delays between submitting street
audit reports and visible action in the community. It was important for co-ordinators to recognise
these issues, to be patient and understanding when working with LAs and to manage the expectations
of the community regarding timescales for the completion of environmental changes.
6. The relationship between the co-ordinator and the LA was crucial for the success of the FFW project
particularly in making environmental changes with LAs providing resources, funding and
commissioning the work to be completed through other LA departments. Understanding existing
relationships within the LA and between the LA and the community was important for developing
knowledge of local issues and understanding reasons why some environmental changes could not be
made.
7. In some areas there were differences in opinion between the co-ordinators and LAs as to which
communities should be targeted for the FFW project; this caused some tension between the two
stakeholders. Agreement should take place at the start of the project on the approach that will be
taken, taking into account the geographical area co-ordinators are expected to cover and the time
available. In future it may be beneficial for co-ordinators to work with fewer LAs or in a more
focussed area to ensure sufficient time can be allocated to each project and to allow co-ordinators to
develop the local knowledge needed to successfully deliver the projects.

viii Fitter for Walking Evaluation Report
8. The community played a key role in the project both in identifying local issues and barriers to
walking and participating in and supporting project activities. It was possible to work with many
different types of community group during the project including: Tenants‟ and Residents‟ Associations
(TARAs), community groups, „Friends of…‟ groups, churches, schools, parent support advisors
(through schools), scouts and other youth groups and community interest groups (such as gardening or
allotments).
9. Multiple strategies were used to recruit community groups and engage them in the project.
Community consultation took place using street audits and other community events, and this
approach was seen to be a key factor in the success of the projects. It was seen to be important that
the community are allowed to develop their interest in the local environment and walking, rather
than an agenda being imposed upon them.
10. In many projects the time taken for community engagement and environmental improvements to be
made was much longer than expected; the overall timescale for each project was therefore much
greater than anticipated and co-ordinators were able to complete far fewer projects than they had
originally planned. It is important for project planning to recognise the time required for these
activities, particularly with regard to environmental improvements, so as not to raise the
expectations of the community. These longer timescales should also be taken into consideration when
planning the number of communities to work with over a specific time period.
11. Co-ordinators were very involved and „hands-on‟ in some community projects to the extent that
community members felt they were now part of their local community. There was a perceived need
for the co-ordinator‟s involvement and support in order for community activities to take place and
continue, thus there were concerns that when the co-ordinators „leave‟ at the end of the project
there may be some loss of momentum. LAs also had concerns over the sustainability of activities at
the end of the project once funding ceased and the co-ordinators were no longer in post. Building
interest, capacity and skills in communities is important so that communities are not dependent on
the co-ordinators for action to take place, and project activities can be self-sustaining in the longer-
term.
12. Match funding for this project was provided by the participating LAs. During the project, cuts in local
government funding meant that there was pressure on LAs and a reduction in the budgets available
for use in the project which may have impacted on the project activities, particularly environmental
changes, they were able to deliver.
13. Community members were very aware of the environmental, social and psychological barriers that
prevented them and others in their community from walking. A large number of environmental
barriers to walking were addressed and removed during the project and this was reflected in the
findings from the evaluation. Across all projects evaluated, fewer environmental barriers to walking
were reported at follow-up and many route users and residents were aware of the environmental
improvements that had taken place even though they did not necessarily associate them with the
FFW project.

Fitter for Walking Evaluation Report ix
14. FFW also addressed a number of social barriers through its awareness-raising and promotional
activities. Route users, residents and communities all reported perceptions of improvements in
community cohesion and social interaction in most of the projects and some community members
reported an overwhelming impact of the project on the daily lives of people living in their local area.
In many cases the social changes were seen to be more important for increasing the number of
people who walk in the local area than the environmental changes, therefore improving the physical
environment alone may not be sufficient to change behaviour and increase levels of walking.
15. At the end of the project, increases in the number of pedestrians using the project routes were
observed in six of the seven community projects evaluated and up to 25% of route users perceived
they had used the route more often in the last 12-18 months. Route users reported undertaking more
transport-related walking overall and were walking for a wider variety of journey
purposes. Community members and residents reported doing more walking in their local area,
discovering new places to walk to as well as new routes to get to their destinations, and there was a
general perception that more people were walking in the local area.
Conclusions
Living Streets‟ co-ordinators, Local Authorities and communities successfully worked together in the Fitter
for Walking project to make improvements to the physical environment on specific local routes and
deliver awareness-raising activities to promote use of the improved routes.
Community members were overwhelmingly positive about the impact of the project in their local areas
and many felt the changes would not have happened without the project and specifically the leadership
from the project co-ordinators. A wide range of environmental barriers to walking were removed through
the Fitter for Walking project and an increase in the number of people walking was observed on most of
the project routes evaluated. There was a perception amongst some route users that they had used the
route more often in the last 12-18 months and findings suggest route users were doing more transport-
related walking overall and for a wider variety of journey purposes. Similarly, some residents reported
they were doing more walking, had discovered new routes for walking and new places to walk to, and that
there were more people walking in their local area. Improvements in social interaction and community
cohesion were also reported, which may be as, or even more, important than changing the physical
environment to create safe and supportive environments for walking.
It is recommended that the FFW model is expanded to other communities in the UK as an approach to
community engagement, increasing social interaction and improving the physical environment to promote
walking as a mode of transport. However, further research and evaluation is also needed to assess the
impact of changing the physical environment and improving community cohesion, either alone or in
combination, on individual levels of walking for transport, overall physical activity, and health and well-
being.

x Fitter for Walking Evaluation Report
Table of Contents
CHAPTER 1. OVERVIEW OF FITTER FOR WALKING 1
1.1 BACKGROUND 1
1.2 PROJECT AIMS AND OBJECTIVES 1
1.3 TARGET OUTCOMES 2
1.4 PROJECT MANAGEMENT AND DELIVERY 3
1.5 PROJECT PARTNERS 4
1.6 PROJECT IMPLEMENTATION 4
1.7 OVERVIEW OF FITTER FOR WALKING PROJECTS 7
1.8 EVALUATION OF FITTER FOR WALKING 7
CHAPTER 2. EVALUATION OF FITTER FOR WALKING 9
2.1 INTRODUCTION AND OBJECTIVES 9
2.2 PARTICIPATION IN EVALUATION ACTIVITIES 10
2.3 DATA COLLECTION METHODS 12
2.4 DATA ANALYSIS 14
2.5 ETHICAL APPROVAL 15
CHAPTER 3. PERCEPTIONS OF PROGRAMME IMPLEMENTATION 16
3.1 PROJECT CO-ORDINATOR PERSPECTIVES 19
3.2 LOCAL AUTHORITY PERSPECTIVES 33
3.3 COMMUNITY PERSPECTIVES 41
CHAPTER 4. CASE STUDIES 51
4.1 CASE STUDY A: MARKS GATE, LONDON 55
4.2 CASE STUDY B: BYKER LINK, NEWCASTLE 83
4.3 CASE STUDY C: BENSHAM, GATESHEAD 109
4.4 CASE STUDY D: TAYLOR STREET, BLACKBURN 116
4.5 CASE STUDY E: ‘OUR BACK FIELD’, BOLTON 143
4.6 CASE STUDY F: WEDDELL WYND, WOLVERHAMPTON 162
4.7 CASE STUDY G: CLIFF HILLS, ROTHERHAM 187

Fitter for Walking Evaluation Report xi
CHAPTER 5. KEY FINDINGS AND CONCLUSIONS 212
5.1 KEY FINDINGS 213
5.2 EVALUATION STRENGTHS AND LIMITATIONS 224
5.3 SUMMARY OF KEY FINDINGS 225
5.4 CONCLUSIONS 229
CHAPTER 6. RECOMMENDATIONS 230
CHAPTER 7. REFERENCES 232
APPENDIX A FITTER FOR WALKING PROJECT SUMMARIES 235
APPENDIX B DATA COLLECTION TOOLS 262

xii Fitter for Walking Evaluation Report

Fitter for Walking Evaluation Report 1
CHAPTER 1. Overview of Fitter for Walking
1.1 Background
The overall benefits of physical activity for improving health and well-being have been well reported
(Department of Health, 2004). Despite this, a high proportion of adults in England, 39% of males and 29%
of females, do not meet the current recommended levels of physical activity (Department of Health, 2008)
and strategies are urgently needed to increase physical activity and reduce the incidence of non-
communicable disease. In recent years there has been a shift to promoting more lifestyle based activities
that can be built into our daily lives and might appeal to a wider segment of the population. Active travel,
in particular walking, provides one such opportunity to accumulate shorter bouts of moderate physical
activity which can contribute to meeting the overall recommendation of 30 minutes of physical activity
per day. Walking has been described as the “perfect exercise” (Morris and Hardman, 1997). It is known
to provide significant benefits to health when done at a moderate level including reduced risk of
cardiovascular disease and type 2 diabetes, reduced blood pressure and improved mental health and well-
being (Department of Health, 2004). Although walking is the most frequently reported leisure-time
activity for both men and women (Sport England, 2010), only 32% of journeys under 2 miles are made on
foot (in contrast to 56% being made by car) (Department for Transport, 2010). Walking is free, does not
require any special equipment or infrastructure and provides a safe and accessible mode of transport for
short journeys for the majority of the population. Interventions to promote walking may therefore offer a
potential mechanism for increasing physical activity, particularly in the most sedentary (Ogilvie et al.,
2007).
A number of recent reviews have highlighted the importance of improving the environment and investing
in environmental changes to promote active travel with the aim of not only increasing physical activity,
but also reducing traffic congestion and CO2 emissions, improving air quality, reducing social and health
inequalities and making our communities a more pleasant place to live (NICE, 2008; Department for
Transport, 2010; Marmot, 2010, Sinnett et al., 2011). Associations between the built environment and
participation in physical activity have been well reported (Baumann and Bull, 2007), and a number of
attributes of the physical environment are known to be associated with specific types of physical activity
such as walking (Owen et al., 2004; Lee and Moudon, 2006; Saelens and Handy, 2008). Despite this, there
has been little research to date assessing the impact of interventions which combine changes to the
physical environment with promotional activities on the use of walking as a mode of transport. The Fitter
for Walking (FFW) project aimed to work with communities and local authorities to improve local
environments and promote walking for short journeys.
1.2 Project aims and objectives
Fitter for Walking (FFW) is a community based project which has been delivered by Living Streets in
conjunction with local authorities to support community groups and residents in making improvements to

2 Fitter for Walking Evaluation Report
their neighbourhood environment to promote walking as mode of travel for local journeys. The overall
aims of the FFW project were:
to increase awareness of walking as a mode of transport for short journeys
to increase the number of people walking for short journeys
to improve the local walking environment and provide tools to support walking
to improve health and well-being through walking
to encourage communities and local residents to work together to promote walking
to increase capacity for promoting and delivery walking initiatives in the community
to develop an award scheme to encourage communities to work together to improve their local
environment and promote walking.
The main objectives of the FFW project were:
1. to improve the walking environment on particular walking routes, eg, to a key facility or trip
generator such as shopping centre, town centre, train station, bus station or health facility to increase
walking levels in the community targeting local trips up to fifteen minutes‟ walk from people‟s homes
2. to provide information and support to community groups and local residents to increase awareness of
walking as a mode of transport
3. to provide tools to help communities to promote walking
4. to promote community cohesion by encouraging local residents to work together to achieve the FFW
award
5. to improve the health and well-being of route users and the local community by increasing walking.
1.3 Target outcomes
A number of outcomes were identified at the start of the project as part of the funding agreement with
Big Lottery. These build on the aims and objectives of the project and were listed as follows by Living
Streets:
A total of 5,000 beneficiaries will be identified from each project region that will gain an increased
awareness of opportunities to be more physically active through walking, and about 2,500 will walk
more either directly through project activities or as a result of improvements made in the local
walking environment.
Project beneficiaries will experience improved mental and physical health, improved community
cohesion, increased pride in their local area and will feel more empowered to work with their Local
Authority (LA) as a result of the project.
Communities in the target areas will be supported to make their local environment „Fitter for Walking‟
and to promote walking to the local community.

Fitter for Walking Evaluation Report 3
Communities that achieve the Fitter for Walking Award will use the project manual to sustain progress
made through the project.
Local authorities will provide more resources focused on improving the walking environment in some,
or all, of the FFW communities, based on audit recommendations.
1.4 Project management and delivery
The Fitter for Walking project was managed and delivered by Living Streets as part of a portfolio of
projects being delivered by a Consortium of the leading walking, cycling and health organisations and
funded through the Big Lottery Fund's Wellbeing Programme. The Programme provides funding to support
the development of healthier lifestyles and to improve well-being.
The Consortium is led by Sustrans and includes British Cycling, CTC, Cycling England, Living Streets,
London Cycling Campaign, the National Heart Forum, the National Obesity Forum, the Ramblers‟
Association, Campaign for Better Transport and Walk 21. It has delivered a portfolio of projects that will
enable two million people nationwide to become more physically active by walking or cycling as part of
their daily lives by 2012 (www.travelactively.org.uk).
Fitter for Walking received £1.7 million funding from the Big Lottery Fund‟s well-being fund.
The project was conducted with approximately 150 communities across 12 local authorities in 5 regions of
England: London (Barking & Dagenham, Redbridge), North East (Gateshead, Sunderland, Newcastle), North
West (Blackburn with Darwen, Bolton), West Midlands (Dudley, Sandwell, Wolverhampton) and Yorkshire
(Doncaster, Rotherham). These areas were selected by Living Streets to participate in the project based
on reported low levels of physical activity and high levels of obesity.
Five project co-ordinators were appointed (one per region) who were led by the Fitter for Walking
Manager. The role of the project co-ordinators was to work with communities and LAs to make
environmental improvements and promote walking. Key tasks for the co-ordinators were to promote the
FFW project, recruit communities to participate in the project, provide support to the communities and
links to the LA to make environmental improvements, provide communities with the skills, knowledge and
equipment to help them promote walking on a sustainable basis and to help communities work towards
achieving the Fitter for Walking Award.
The project commenced in 2008 and is due to be completed in March 2012. Co-ordinators anticipated
being involved with each specific community project for 6-12 months, with plans to develop an
appropriate exit strategy linked to presenting the Fitter for Walking Award bringing projects to a natural
close. The Fitter for Walking Award aimed to recognise progress made by communities but also to build
capacity in the community to ensure projects could be sustained beyond the conclusion of Living Streets‟
involvement.

4 Fitter for Walking Evaluation Report
1.5 Project partners
A number of partners were involved in the delivery of the project. The LA in each of the areas identified
above was a key partner in the delivery and funding of the project. Each LA was required to match fund
the project to demonstrate their commitment to the project. Approximately £470K match funding had
been provided across the local authorities by June 2011. A number of other partners were involved in the
project, for example: neighbourhood management teams, community groups, schools and shops.
1.6 Project implementation
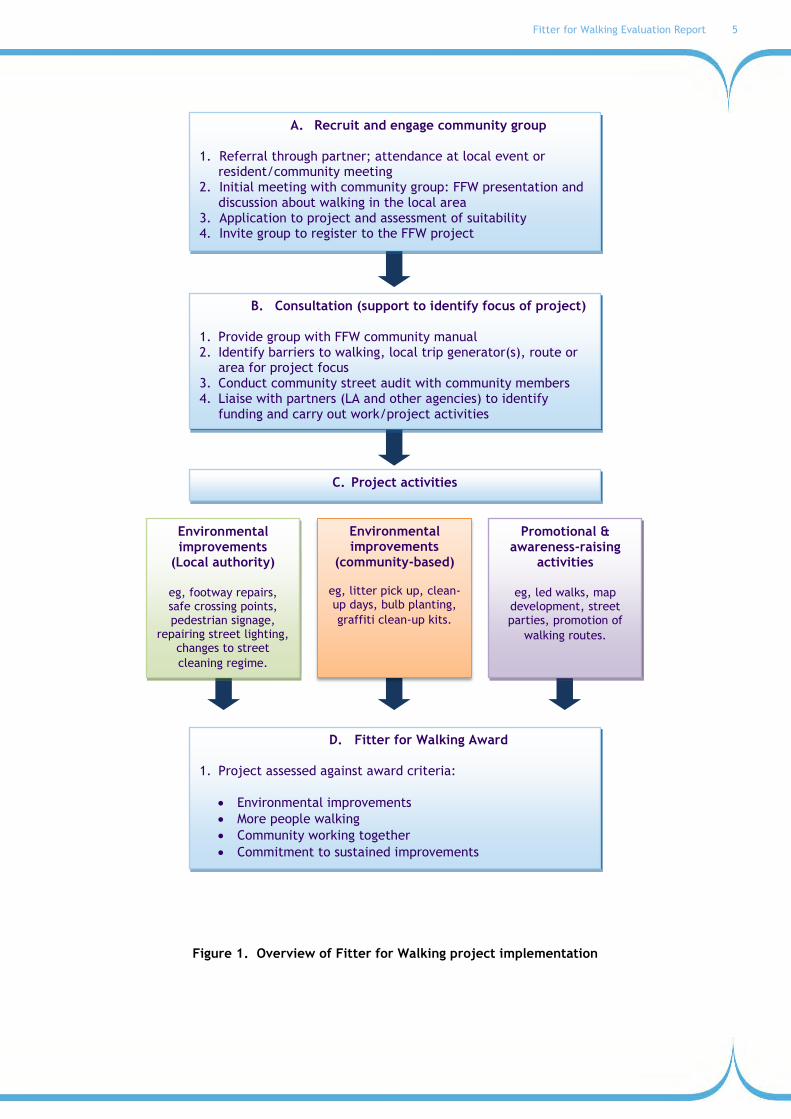
There were four key stages in delivering the FFW project in each community (Figure 1).
A. Recruitment and engagement
Community groups were recruited through both targeted and opportunistic approaches. Following an
initial scoping phase to meet stakeholders in the LA areas, including the local neighbourhood management
team, local contacts were used to identify possible „communities‟ to work with in the project. The term
„community‟ has been used in a broad sense and implies some kind of organised group eg, a tenants and
residents association (TARA), local action groups (eg, a wheelchair users group, or a “friends of” group),
specific ethnic groups or through contacts based in a particular centre like SureStart, community centres
and schools). Co-ordinators made it an objective to invite a wide range of groups to the project.
Once initial contact was made with a group, co-ordinators typically attended a regular meeting of the
group during which they explained the project to the group and delivered a set presentation which
outlined the purpose of the project, the benefits of walking and active travel and how the group could get
involved. The discussion included an initial consultation to identify the barriers to walking in the local
area and how the project might address these. The groups were encouraged to register for the project
through putting their ideas on an application form, which was then appraised by the co-ordinator as
making a case or not to proceed.
B. Consultation
After recruitment and registration to the project, the project co-ordinator supported the registered group
in identifying a particular route or local area to be the focus of the project. The community group, and in
some cases the wider community, were consulted to identify barriers to walking on a specific route or
area. In many projects a community street audit was conducted to help the community group to identify
barriers to walking in the local area and possible solutions such that recommendations could be provided
to the LA for environmental improvements needed in the area. On the basis of the street audit, a report
was written and submitted to the LA partner for consideration for funding.
Fitter for Walking Evaluation Report 5
Figure 1. Overview of Fitter for Walking project implementation
Environmental improvements
(Local authority)
eg, footway repairs, safe crossing points, pedestrian signage,
repairing street lighting, changes to street
cleaning regime.
Promotional & awareness-raising
activities
eg, led walks, map development, street parties, promotion of
walking routes.
A. Recruit and engage community group
1. Referral through partner; attendance at local event or resident/community meeting
2. Initial meeting with community group: FFW presentation and discussion about walking in the local area
3. Application to project and assessment of suitability 4. Invite group to register to the FFW project
B. Consultation (support to identify focus of project)
1. Provide group with FFW community manual 2. Identify barriers to walking, local trip generator(s), route or
area for project focus 3. Conduct community street audit with community members 4. Liaise with partners (LA and other agencies) to identify
funding and carry out work/project activities
D. Fitter for Walking Award
1. Project assessed against award criteria:
Environmental improvements
More people walking
Community working together
Commitment to sustained improvements
Environmental improvements
(community-based)
eg, litter pick up, clean-up days, bulb planting,
graffiti clean-up kits.
C. Project activities

6 Fitter for Walking Evaluation Report
C. Project activities
There was no standardised intervention for the project; activities were overseen by a co-ordinator from
Living Streets but were delivered based on the needs and interests of the community, and funding and
resources available from LA, therefore each project was unique and included a diverse set of activities.
Project activities were delivered in three main areas: environmental improvements completed by the LA
partner, eg, new dropped kerbs, improved street lighting, resurfacing of paths, removal of encroaching
vegetation, environmental improvements led by the community, eg, litter pick-up or bulb planting; and
promotional and awareness-raising activities, eg, led walks, themed walks (for example a bat walk or
nature walk), development of walking maps and street parties.
D. Fitter for Walking Award
During the project individuals, groups and communities worked towards being presented with the Fitter
for Walking Award. This was developed during the project to encourage residents to work together to
make their local neighbourhoods safer and more attractive for walking and to help bring projects to a
natural close.
The Award aimed to recognise progress towards improving the local environment and promoting walking
for short journeys, and communities worked towards achieving the Award by leading on the assessment of
their local walking environment, identifying priorities for improvement and taking steps to implement
some of the improvements with the support of the Project Co-ordinator. It may be awarded to individuals,
groups or neighbourhoods to recognise their contribution to project activities.
There are four sections in the Award, each with a number of criteria that neighbourhoods must
demonstrate progress against:
1. Made the environment Fitter for Walking
a. Audited environment
b. Community led improvements to the environment
c. LA led improvements to environment
d. Campaign started for longer term change
2. People have walked more
a. Delivered led walks and/or walking challenges
b. People have pledged to walk local journeys
3. Community working together
a. Raised awareness and gained support from the wider community
b. Actions have promoted community cohesion and streets for all

Fitter for Walking Evaluation Report 7
4. Committed to sustaining progress
a. Individuals/groups are able and committed to sustain work achieved
b. Agreements are in place from partners, including the LA, to sustain the work achieved
c. Groups are committed to working towards a vision and exert influence that makes their streets
Fitter for Walking
d. Affiliation to Living Streets
e. Project Manual handed to registered group
The first Fitter for Walking Awards were presented in June 2010 to three projects: Plains Farm
(Sunderland), Marks Gate (London) and Monkearmouth (Sunderland).
1.7 Overview of Fitter for Walking projects
The FFW team were aiming to work with 228 communities over the course of the project. This proved to
be a challenge owing to the timescales for community engagement and making environmental
improvements. At the time of this report the team had worked with around 150 communities (Table 1.1).
The notion of primary and secondary projects was utilised to distinguish between projects which involved
a registered group from the community who took part in a street audit, provided a report to the LA with
recommendations, oversaw the environmental improvements that were made and started to promote
walking in the community (primary group) from those who became involved or engaged at a later stage
where the emphasis was more on promoting use of route which had already been improved by the primary
group, and delivering educational and awareness-raising activities such as themed walks and engaging
local school children in the projects (secondary group). A full summary of these projects is provided in
Appendix A.
1.8 Evaluation of Fitter for Walking
The BHF National Centre for Physical Activity and Health, based in the School of Sport, Exercise and
Health Sciences at Loughborough University, were commissioned by Living Streets to undertake an
independent evaluation of the FFW project. The evaluation team designed the evaluation, developed
appropriate evaluation tools and had responsibility for all data collection and analysis. The evaluators
remained independent of the project delivery team and did not engage in the development of project-
specific activities. The remainder of this report presents the evaluation methods, results, key findings and
recommendations from the evaluation of the FFW project.

8 Fitter for Walking Evaluation Report
Table 1.1 Number of Fitter for Walking projects by Local Authority and region
Number of Projects*#
Region Local Authority Primary Secondary Total
London Barking & Dagenham 4 8 12
Redbridge 7 3 10
TOTAL 11 11 22
North East Gateshead 5 7 12
Newcastle 3 2 5
Sunderland 4 0 4
TOTAL 12 9 21
North West Blackburn 11 14 25
Bolton 10 6 16
TOTAL 21 20 41
West Midlands Dudley 7 1 8
Sandwell 8 3 11
Wolverhampton 6 5 11
TOTAL 21 9 30
Yorkshire Doncaster 16 1 17
Rotherham 15 0 15
TOTAL 31 1 31
TOTAL 96 50 146
*Information provided on project logs (September 2011) #This includes some projects who showed initial interest in the project but did not then go on to register, or registered then withdrew

Fitter for Walking Evaluation Report 9
CHAPTER 2. Evaluation of Fitter for Walking
2.1 Introduction and objectives
The BHF National Centre for Physical Activity and Health, based in the School of Sport, Exercise and
Health Sciences at Loughborough University, were commissioned by Living Streets to undertake an
independent evaluation of the Fitter for Walking (FFW) project. The evaluators designed the evaluation,
developed appropriate evaluation tools and had responsibility for all data collection and analysis.
Projects were selected for participation in the evaluation in consultation with the co-ordinators and the
FFW Manager. The evaluation aimed to assess a number of objectives:
1. to understand the processes involved in working with local authorities and communities to make
changes to the local environment
2. to assess changes in community cohesion in relation to working together to promote walking and
improve the environment
3. to assess change in the number of walking trips made for local journeys following improvements to an
identified walking route
4. to assess change in the health and well-being of route users and local residents following improvements
to an identified walking route
5. to conduct an economic analysis of at least one Fitter for Walking project.
A mixed methods approach was used to assess the evaluation objectives as follows:
Objective 1:
key informant interviews with representatives from local authorities
focus groups/key informant interviews with project co-ordinators
focus groups/key informant interviews with community groups/members.
Objectives 2, 3 and 4:
pre- and post- route user counts
pre- and post- route user surveys
post-only residents‟ survey
Objective 5:
Economic analysis of FFW using the HEAT tool (this is reported elsewhere: see Sinnett & Powell, 2012)

10 Fitter for Walking Evaluation Report
2.2 Participation in evaluation activities
Owing to budget constraints and capacity of the evaluation team, it was only possible to conduct route
user counts, route user surveys, residents‟ surveys and qualitative evaluation with community members in
a sub-set of community projects. In order to identify potential projects for evaluation activities and
monitor project progress, each project co-ordinator was asked to maintain a project log (Microsoft Excel
spread sheet) for each Local Authority area on which they recorded the key characteristics of each of
their projects. The log was updated on a monthly basis (at the end of each month) by the Project Co-
ordinator and forwarded to the evaluator and Fitter for Walking Manager. The project logs were reviewed
each month and suitable projects for evaluation identified in discussion with the appropriate Co-ordinator
and the Fitter for Walking Manager. A number of criteria were used to help select projects for evaluation;
these included the following:
Route user counts and route user surveys:
The project needed to include plans to conduct both substantial environmental improvements and
awareness-raising and promotional activities.
There needed to be some certainty that the planned environmental improvements and project
activities would go ahead before baseline evaluation activities took place.
A realistic expectation that the project was likely to lead to a detectable change in walking levels
was required.
Residents‟ surveys:
Residents‟ surveys were undertaken in a sub-set of the projects where route user counts and surveys
took place to supplement findings from data collected using those approaches.
Focus groups/key informant interviews with community groups:
Qualitative evaluation was conducted in projects where sufficient project activity had taken place to
have a useful discussion about the project. In some cases this included projects where only
promotional and awareness-raising activities had taken place and no environmental improvements
had been made.
Assessing programme implementation:
Qualitative evaluation was conducted with the co-ordinators on a regular basis throughout the
project and on one occasion towards the middle or end of the project with each of the LA partners.
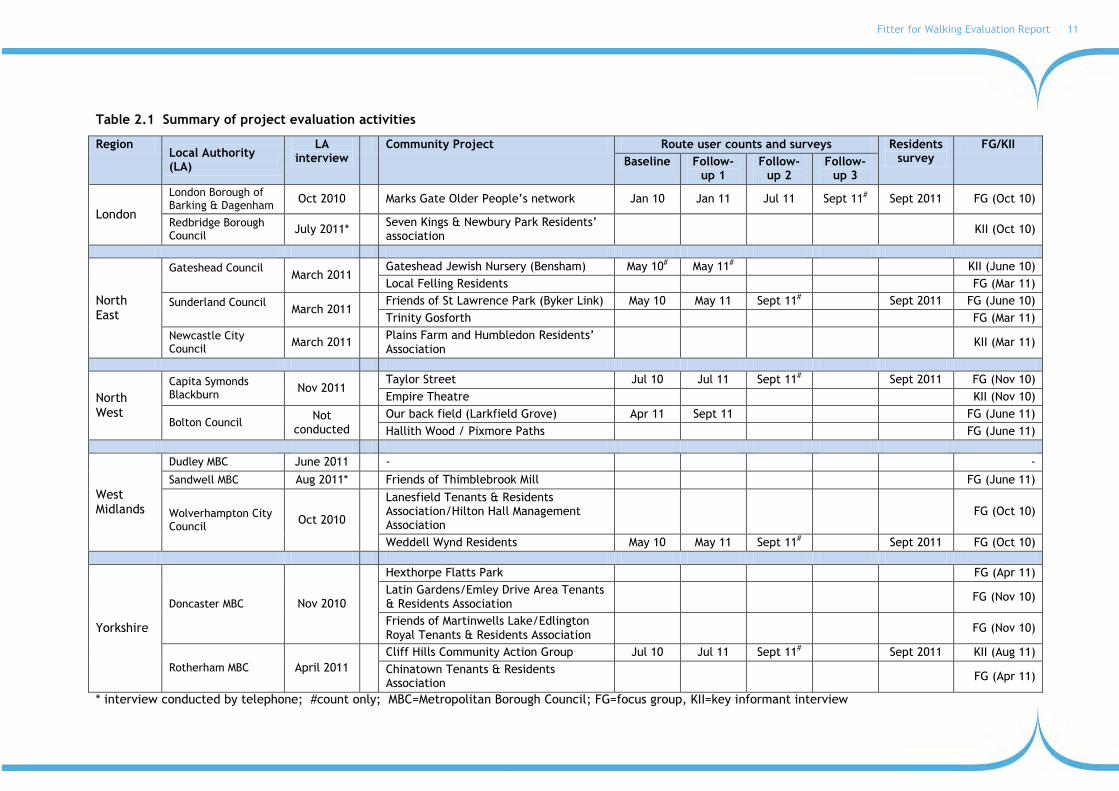
An overview of the evaluation activities which were conducted with LA partners and community projects
is provided in Table 2.1.
Fitter for Walking Evaluation Report 11
Table 2.1 Summary of project evaluation activities
Region Local Authority (LA)
LA interview
Community Project Route user counts and surveys Residents survey
FG/KII
Baseline Follow-up 1
Follow-up 2
Follow-up 3
London
London Borough of Barking & Dagenham
Oct 2010 Marks Gate Older People‟s network Jan 10 Jan 11 Jul 11 Sept 11# Sept 2011 FG (Oct 10)
Redbridge Borough Council
July 2011* Seven Kings & Newbury Park Residents‟ association
KII (Oct 10)
North East
Gateshead Council
March 2011
Gateshead Jewish Nursery (Bensham) May 10# May 11# KII (June 10)
Local Felling Residents FG (Mar 11)
Sunderland Council
March 2011
Friends of St Lawrence Park (Byker Link) May 10 May 11 Sept 11# Sept 2011 FG (June 10)
Trinity Gosforth FG (Mar 11)
Newcastle City Council
March 2011 Plains Farm and Humbledon Residents‟ Association
KII (Mar 11)
North West
Capita Symonds Blackburn
Nov 2011 Taylor Street Jul 10 Jul 11 Sept 11# Sept 2011 FG (Nov 10)
Empire Theatre KII (Nov 10)
Bolton Council Not
conducted
Our back field (Larkfield Grove) Apr 11 Sept 11 FG (June 11)
Hallith Wood / Pixmore Paths FG (June 11)
West Midlands
Dudley MBC June 2011 - -
Sandwell MBC Aug 2011* Friends of Thimblebrook Mill FG (June 11)
Wolverhampton City Council
Oct 2010
Lanesfield Tenants & Residents Association/Hilton Hall Management Association
FG (Oct 10)
Weddell Wynd Residents May 10 May 11 Sept 11# Sept 2011 FG (Oct 10)
Yorkshire
Doncaster MBC Nov 2010
Hexthorpe Flatts Park FG (Apr 11)
Latin Gardens/Emley Drive Area Tenants & Residents Association
FG (Nov 10)
Friends of Martinwells Lake/Edlington Royal Tenants & Residents Association
FG (Nov 10)
Rotherham MBC April 2011
Cliff Hills Community Action Group Jul 10 Jul 11 Sept 11# Sept 2011 KII (Aug 11)
Chinatown Tenants & Residents Association
FG (Apr 11)
* interview conducted by telephone; #count only; MBC=Metropolitan Borough Council; FG=focus group, KII=key informant interview

12 Fitter for Walking Evaluation Report
2.3 Data collection methods
2.3.1 Qualitative evaluation
Local Authority partners
Interviews were conducted with 11 of the 12 LA contacts (Table 2.2). Local Authority partners were invited
to participate in the interview by the co-ordinator or the evaluator. The interview was arranged at a time
and location to suit the interviewee and lasted approximately 30-45 minutes. The purpose of this interview
was to learn about the LA partners‟ experiences of the projects, the context in which the projects are
taking place, the agendas that might affect these projects and challenges for the partner‟s role in
completing their role in the project. A semi-structured questionnaire schedule was used to initiate and
guide the discussions through the theme areas including: roles and responsibilities, leadership,
communication, project implementation, challenges and successes and sustainability. A copy of the
interview schedule is provided in Appendix B. Consent to participate was obtained and, with the
participants‟ agreement, the discussions were recorded and later transcribed ready for analysis.
Project co-ordinators
Project co-ordinators took part in three focus groups (December 2008, November 2009, October 2011), and
two individual face to face interviews (October/November 2010 and October 2011) to enable programme
implementation to be explored on an on-going basis. Interviews and focus groups lasted 45 minutes to 1
hour. Semi-structured questionnaire schedules were used to guide the discussions and key themes included
roles and responsibilities; leadership; communication; project implementation; challenges and successes;
and sustainability. An example of the interview and focus group schedule is provided in Appendix B.
Consent to participate was obtained and, with the participants‟ agreement, the discussions were recorded
and later transcribed ready for analysis.
Community groups and members
Focus groups with community groups or interviews with key community members were conducted in 19
projects taking part in FFW (Table 2.1). The purpose of these was to explore community perceptions of the
projects and to learn about their experiences of taking part in such a project.
One focus group or interview was conducted in each of the 19 projects once substantial progress had been
made with project activities. Participants were recruited to take part in the discussions by the co-ordinator
or lead member of the community group. Typically participants had been heavily involved in project
activities and were therefore inevitably positively biased towards the project. Focus groups and interviews
were arranged in the project region and where possible at a time and location to suit the participants. The
discussions lasted approximately 45 minutes. A semi-structured questionnaire schedule was used to initiate
and guide the discussions through theme areas which included: barriers to walking, experiences of working
with the co-ordinator and LA and perceived impact of the project activities. A copy of the interview

Fitter for Walking Evaluation Report 13
schedule is provided in Appendix B. Consent to participate was obtained and, with the participants‟
agreement, the discussions were recorded and later transcribed ready for analysis. The co-ordinators did
not take part in the community focus groups or interviews.
2.3.2 Route user counts
Manual route user counts were conducted in seven community projects at baseline and post-intervention
(Table 2.1). One or more follow-up counts were conducted at each location depending on the duration and
timelines for the project. The route user counts were conducted by a sub-contractor (CTS Traffic and
Transportation http://www.ctstraffic.co.uk/) who provide trained staff to undertake the counts. A copy of
the route user count sheet is provided in Appendix B.
Counts were taken via direct observation at one or more locations on each route and were conducted over a
12 hour period between 07:00 and 19:00 over two days to include one week and one weekend day. Route
users travelling in all directions were counted. Baseline and follow-up counts were conducted in
comparable seasons and time points where possible (eg, term time or school holidays). The total number of
route users each day was recorded by mode of travel (walking, cycling, jogging, wheelchair users, infants in
pushchairs, other modes), along with a breakdown by hour. In addition, surveyors recorded the gender and
estimated age of route users (minor 0-15; adult 16-59 or older adult 60+). Data were entered into a
Microsoft Excel spread sheet by the sub-contractor and returned to the evaluation team at Loughborough.
2.3.3 Route user surveys
Route user intercept surveys were conducted concurrently with the route user counts in six community
projects (Table 2.1). One or more follow-up surveys were conducted at each location depending on the
duration and timelines for the project. The route user surveys were conducted by a sub-contractor (CTS
Traffic and Transportation http://www.ctstraffic.co.uk/) who provide trained staff to undertake the
surveys.
Surveys were conducted with route users at one or more locations on each route over a 12 hour period
between 07:00 and 19:00 over two days to include one week and one weekend day. Baseline and follow-up
surveys were conducted in comparable seasons and time points (eg, term time or school holidays). All
route users over the age of 16 were invited to take part in the survey, however priority was given to
pedestrians. The reasons for route users declining to take part in the surveys were recorded. The main
purpose of the intercept survey was to find out about the current journey the route user was undertaking,
to assess change in route use, change in views on community cohesion, awareness of project activities and
route user characteristics. A copy of the route user survey is provided in Appendix B. Survey data were
entered into a Microsoft Excel spread sheet by the sub-contractor and returned to the evaluation team at
Loughborough.
2.3.4 Residents’ surveys

14 Fitter for Walking Evaluation Report
A post-only residents‟ survey was conducted in five projects (Table 2.1) with 200 households invited to
participate from each project area. Each co-ordinator was provided with 200 survey packs containing a
letter of invitation inviting a member of the household over the age of 16 to take part, a survey, an
information sheet and a freepost return envelope. Co-ordinators were asked to distribute the survey packs
to a random selection of households located within one mile of where the project environmental
improvements had taken place (a map was provided to identify the appropriate area). The survey was also
available for completion online.
The purpose of this survey was to assess the wider impact of project activities on the community in
particular on route use, walking levels, community cohesion and awareness of project activities. The
survey was tailored for each project to ask specifically about use of the project route where environmental
improvements had taken place. A copy of the survey is provided in Appendix B.
2.4 Data analysis
Qualitative analysis of LA, community and project co-ordinator focus groups and key informant interviews
was conducted by Dr Nick Cavill (Cavill Associates Limited). Transcripts were reviewed and coded and
analysed using HyperRESEARCH and key themes were identified under which results are reported.
Data analyses of route user counts, route user surveys and residents‟ surveys were conducted by the
evaluation team at Loughborough University. Route user count data were provided in a Microsoft Excel
spread sheet by the Surveyor. Data were summed to provide:
Total number of route users by week day, weekend day and overall
Total number of route users by mode for a week day, weekend day and overall
Total number of route users by age and gender overall
The proportion of change in the number of route users between baseline and follow-up counts overall and
for pedestrians only was computed and reported for each project.
Route user survey data were provided in a Microsoft Excel spread sheet by the Surveyor. Residents‟ survey
data were entered into Survey Monkey and downloaded into Microsoft Excel. Data from both the route user
survey and the residents‟ survey were imported into SPSS Version 19.0 and variables were checked for range,
logic and plausibility. Questions with no response were coded as missing variables. Data from both surveys
were summarised using descriptive analysis.
Statistical analyses were conducted for route user survey data. Data from baseline and follow-up route user
surveys were treated as independent samples. Continuous data were analysed to test for significant
differences over time using an independent t-test. Where data was not normally distributed, non-
parametric tests (Mann-Whitney) were utilised. For categorical data Chi squared tests were conducted
assessing change in proportion between baseline and follow-up. Statistical significance is presented at the
0.05 and 0.01 levels.

Fitter for Walking Evaluation Report 15
Owing to the low response rate in some route user surveys and in the residents‟ surveys, results should be
interpreted with caution.
2.5 Ethical approval
Ethics approval for all evaluation activities was obtained from Loughborough University Ethical Advisory
Committee.

16 Fitter for Walking Evaluation Report
CHAPTER 3. Perceptions of programme implementation
SUMMARY
This chapter reports on the views and perceptions of three key groups of people engaged with Fitter for
Walking: project co-ordinators, Local Authority staff and community members. The data are taken from
qualitative interviews conducted either as part of a focus group or as a one-to-one interview; key themes
discussed included:
Aims of FFW
Roles and responsibilities
Project partnerships
Project delivery and activities
Challenges and successes
Project achievements and perceived impact
Sustainability
The methods are described in full in Chapter 2. Quotes are used to illustrate points, but in order to
respect people‟s identity, interviewees have remained anonymous. Where “…” appears in a quotation it
is used to truncate the quote (often removing unnecessary phrases such as „you know‟ or „um‟) but never
to change the meaning.
KEY FINDINGS
Project co-ordinator perspectives
Co-ordinators‟ key role was to lead and coordinate the project, engage community groups, facilitate
relationships between the community and LA partners and maintain the focus of the project on
walking.
The relationship with the LA was critical to the success of the project as they provided funding and
resources to make environmental changes in the communities.
Working with communities was a fundamental part of the co-ordinator‟s role; however, engaging
communities was challenging. It was important to allow the communities to develop their interest in
their local environment and walking without imposing Living Streets‟ or the LAs agendas. Small quick-
win activities were needed to establish a rapport, build momentum and demonstrate progress.
Key project activities that were important for community engagement included street audits, led
walks, pledge cards and the Fitter for Walking Award.
Challenges included balancing the needs of different stakeholders, finding the right people within the
LA and the community to work with, using appropriate communication methods, coping with the
geographical spread of LA and community projects and the timescales for community engagement and

Fitter for Walking Evaluation Report 17
for environmental improvements to be made, which were much longer than expected. There were
concerns over funding and sustainability in the longer-term.
The main achievements identified by the co-ordinators were making clear progress working in some
deprived communities with complex issues, improving community relationships and increasing
community involvement. Co-ordinators were less sure of the impact on walking levels.
Local Authority perspectives
The role of the LA was to provide match funding and technical resources to make the environmental
improvements identified by communities in street audit reports.
LAs were generally very positive about their experiences of working with the FFW project which
helped to link action on walking across the LA, gave access to communities and helped improve
community relations.
Living Streets were perceived to provide leadership for the project with the LA providing support as
needed along with funding and resources from within the LA. The independent nature of Living
Streets was thought to be important for working with communities.
Street audits were thought to be excellent and LAs strongly supported their concept and execution.
The formal consultation process allowed a clear focus on walking and helped the LA to identify and
prioritise actions needed to improve the local walking environment.
Challenges included disagreement with the co-ordinators as to which communities to work in,
capacity within LA staff to review and act upon recommendations in audit reports, budget cuts during
the project and raised expectations in the community as to changes that might be made. LAs also
raised concerns over funding and long-term sustainability of the project.
LAs were very positive about FFW and its achievements. In particular they noted the efficiency of the
audit process, improved community relations and positive changes to local areas. LAs expressed
concerns over there being a measurable increase in walking.
Community perspectives
Communities had a clear understanding of the aims of the FFW project and were able to identify
environmental, social and psychological barriers to walking in their local neighbourhoods.
They were universally positive about the role of the co-ordinator and their contribution to the project
and community action and in particular their “hands-on” approach.
FFW helped communities to build confidence in dealing with the LA and other partners and
communities reported making new connections and strong working partnerships for future action.
The role of the project in linking communities with people in the LA who could take action was seen
to be critical.
Street audits were well received, becoming great community events in themselves and giving
communities a new perspective on their local area from the view point of a pedestrian.
Led walks were seen to be important for engaging new members of the community, discovering new

18 Fitter for Walking Evaluation Report
places to walk in the local area and for celebrating success and showcasing environmental
improvements once they had been completed.
The FFW Award was well received by communities and individuals as recognition for the work they
had completed.
The main concerns relating to the project were the time taken for environmental changes to be made
and for long-term sustainability in maintaining improvements and continuing activities once the co-
ordinator left.
Key achievements noted by communities related to social and community aspects of the project, eg,
engaging new members of the community and raising awareness of community issues, rather than the
environmental improvements which had been made.
Community members perceived there to have been an increase in the number of people walking in
the local area; however, this may have been influenced by the positive experiences of taking part in
the FFW project activities.

Fitter for Walking Evaluation Report 19
3.1 Project co-ordinator perspectives
A. Initial views on the aims of FFW
Co-ordinators were first interviewed in December 2008 and were asked about their views of the aims of the
project. They appeared to be very clear about what the project was trying to do and the approach it was
going to take. They understood that the eventual aim was to increase walking but that the route to that
was through working with communities and removing the environmental barriers to walking.
…the aim of the project is to work with local communities to identify some of the barriers to walking in those communities and also think about how to address them through the community, so without large scale infrastructure changes to the walking environment.
Project co-ordinator (2008)
At this stage there was perhaps a slightly idealised view of the project, as the co-ordinators had not
encountered too many of the real barriers to community action.
...it‟s more than a walking project, it‟s about getting people out of their houses and walking more on cleaner, healthier and safer streets. So it‟s about making the environment fitter for walking as well as making people generally fitter for walking that are walking in that environment.
Project co-ordinator (2008)
However, it was clear from these interviews that the co-ordinators understood that the project was going to
be far from simple, that it depended on the sometimes complex relations in communities and that it would
have a number of inter-related outcomes. It was interesting to note that the co-ordinators were very
focused on the project being a learning experience. They did not see their job as being focused only on
increasing walking (with walking the only measurable outcome of interest) but were very interested in what
would be learnt on the way.
…what I want from the project is basically to find out what makes various community groups tick so… we can learn on the success points to find out what does initiate behavioural changes. I think active travel in general as a project or as a programme, is going to be needed for quite a few more years beyond the length of our project and it‟s something I‟d like to still be involved with…this is very, very early days to say when we‟ll even crack them yet, but…
Project co-ordinator (2008)
There was also at this stage some indication of an awareness of the issue of promoting walking through
environmental change and the need to connect this to promotional activity. Co-ordinators did seem aware
of the need to combine the two types of action but were in general more focused on environmental change.
I think something that would be really interesting is the kind of relationship between the built environment and people‟s actual behaviour. But I think with Living Streets, there‟s assumptions that if you remove street clutter, those people are going to [do more] walking but I don‟t know how much of a difference it actually makes, it might be felt over a very

20 Fitter for Walking Evaluation Report
long period, so we‟re trying to do both at the same time and it‟s quite a challenge. I suppose it would be good to see if people do respond to changes in their environment and actually do start to walk more.
Project co-ordinator (2008)
At this stage there was very little discussion of the role of led walks or promotional activity, with most of
the focus on making small changes to the built environment, stimulated by community consultation.
B. The developing role of the co-ordinator
As the role developed, it seems that the co-ordinators not only kept a firm grip on the overall aim of the
project but also developed a very detailed and focused understanding of the day-to-day demands of the
role. Top of the list of attributes for the co-ordinator role is to be a „people person‟: able to relate to
people from different backgrounds, talk to them at the appropriate level, respect their views and act on
them as appropriate.
…you need to get on with people from a lot of different areas and a lot of different backgrounds and you need to, you‟ve got to get them on board so you‟ve got to sell the project a little bit but then you‟ve got to keep it fun and interesting.
Project co-ordinator (2010)
The co-ordinators also understood that they needed to develop a detailed understanding of the local areas
(although it was not thought essential to live in the area). It was also important to be patient, not only
with the communities but with the partners (local authorities and others), as the pace of change can
sometimes be frustratingly slow.
To be patient and not to take things personally, that things take a really long time, especially for things like dealing with Network Rail and things, they work in a different… they work in kind of an engineering timescale and unfortunately it‟s not the same as the community engagement timescale.
Project co-ordinator (2011)
It was clear from the interviews that the co-ordinators were all experienced in using community
development methods, were able to relate well to the communities and to liaise effectively with the local
authorities and other partners. It was mentioned that realism was an important part of the role too:
making sure that expectations were managed.
…from my point of view, everything that we do boils down to good community engagement, it‟s clear communication and I think it‟s being organised and accountable as well. It‟s being realistic with community groups about what you can achieve in the timeframe that we have and managing expectations really… if you say you‟re going to do something, make sure you do it and so that people have the positive experience of the project and of the charity and of the Local Authority as well.
Project co-ordinator (2011)

Fitter for Walking Evaluation Report 21
The co-ordinators recognised that there was a delicate balance to be struck on the issue of who was driving
or leading the project. The co-ordinators saw their role as very firmly to be in the driving seat of the
project: identifying communities, leading the consultation with them, identifying clear action plans to
address problems and keeping the focus on walking. However, in many cases it was seen to be important to
recognise that both local communities and the LA want to be seen to be leading some aspects of the project.
In this way, the co-ordinators had to be more like quiet facilitators, driving the project from the back seat.
Let‟s think about what that means about being in control. I mean, ultimately…I am guiding that community group. I‟m not there to sort of manage them, I suppose, I‟m just guiding them and giving them the tools and funding to be able to take their own action, I suppose and I‟m just the conduit of getting their views and issues and concerns to the council in a … format that the council will take seriously and respect and hopefully do something about…
Project co-ordinator (2010)
This task was complicated a little by the relatively low awareness of Living Streets as an organisation. The
co-ordinators did not say this was a massive issue, but it was something that often had to be addressed, eg,
explaining the organisation and its role before gaining the trust of the community.
…when I go and present the project to people, not many people have heard of Living Streets to be perfectly honest, you know, and even when I say, well we used to [be] the Pedestrians Association, there‟s still a lot of blank looks, you know.
Project co-ordinator (2010)
However, when this was explained it was always met with a positive reaction; it was clearly a major
advantage for the project to be delivered by an organisation that was independent of local government.
C. Working with project partners
The key partners involved in the delivery of the FFW project were the local authorities. Other individuals,
groups and organisations involved in project activities and who supported project delivery in various ways
and to various extents, included:
Neighbourhood Management Teams
Police
Local Councillors
NHS Healthy Communities Partnerships
Primary Care Trusts
Walking the Way to Health
Allied groups such as Groundwork.
Community groups were recruited to take part in the project and included:

22 Fitter for Walking Evaluation Report
Tenants and residents‟ associations (TARAs)
Community groups
„Friends of…‟ groups
Churches
Parent support advisors (through schools)
Scouts and other young people‟s groups
Interest groups (such as gardening or allotments).
Working with local authorities
Project co-ordinators recognised that their relationship with LA staff was absolutely critical to the success
of the project; without them, there would not be much of a project as there would be problems in
accessing the necessary funding to make improvements.
Well I suppose you can‟t really do much without the Local Authority, so in every case, we‟re hoping that they will point us in the right direction either through their councillors or through their teams on the ground who actually know what‟s happening on the ground. And because each engagement with the community is quite short really, between six months and a year, we don‟t have time to really do a lot of work to get a neighbourhood or a community group ready to become more active. So we have to rely on what‟s already in place, which means relying on the council mechanisms or housing, some of their tenants and residents association mechanisms that are already in place.
Project co-ordinator (2011)
The problem with this is that in many cases this relies on the personality and interest of the main LA
contact; if they are not keen on the project then it is hard to take it much further.
…if you‟re quite reliant on the Local Authority to deliver it that can be a big impediment if that person isn‟t enthusiastic because you don‟t want to do things without them, you don‟t want to go behind their back because we‟re working in partnership with them.
Project co-ordinator (2010)
In the majority of cases, relationships with the LA staff were positive, with the co-ordinators working with
the community to identify problems and ideas for solutions, and the LA staff focusing on identifying the
matched funding and then setting the wheels in motion to commission the work. However, problems
emerged when the contact in the LA was either not interested or was not able to become involved.
He‟s very on-board with Living Streets, but he just doesn‟t kind of push anything, so we have to push from other ends. So, for example, in a recent project, I‟ve just done a community street audit and the planning team has been really interested because they‟re looking at green routes into town centres and the park and conservation team is really interested, because they want to look at biodiversity in the more urban areas. So they‟ve got really engaged, whereas the [LA contact] is kind of “Oh, well, we don‟t have much money” kind of attitude.
Project co-ordinator (2011)

Fitter for Walking Evaluation Report 23
Indeed, the location of the key contact seemed to be a critical issue. In the vast majority of cases, the key
contact was in the transport department of the LA. It was here where the key decisions could be made and
where there was an understanding of walking issues and the ability to commission works efficiently. This
was seen to be the most appropriate department for the key FFW contact, as long as there was senior-level
commitment to the project. Without this, the project could falter as officers questioned the value of the
project or their authority‟s commitment to it.
Well, in both authorities it‟s the transport section that have signed the memorandum of understanding... I think it went to the health side first and maybe went to the NHS PCT and maybe to green spaces as well… but it is the transport section …I take my reports to and they‟re my… first point of call really and then they… delegate and disseminate that information and reports down to whoever they see fit.
Project co-ordinator (2010)
There was, however, evidence of a tension between dealing with the transport section and with
neighbourhood management teams. These teams have the responsibility for specific neighbourhoods, with
an aim of restoring or boosting local democracy. In some cases the co-ordinators had very positive
experiences of working with neighbourhood management teams, who understood the local issues and ways
of working with local communities. However, these teams have been disbanded in many places (and some
closed during the FFW project) which left the FFW co-ordinators helping to fill the hole left by the previous
neighbourhood management team and in some cases almost acting as the „go-between‟ with a focus on
walking and cycling.
…they deal with litter and antisocial behaviour and things like that but they don‟t actually look at things from a …sustainable transport perspective at all. So ours was, really added value to the neighbourhood management… team in terms of it working better with the transport department.
Project co-ordinator (2011)
In one case there was a further complication in that many council services were outsourced to a private
company, including direct works and other maintenance services; this led to a very messy relationship.
So in that case the partnership that we started was signed with [the private company] and in particular it was the Road Safety Team that I‟ve always been based with. Now, it‟s changed three, four times, we‟ve had four different contacts really in two and a half years from that as lead workers… and the current one has actually admitted to me that he would have done it differently if he‟d have been on it from day one.
Project co-ordinator (2010)
However, it is important to bear in mind that this project, and the working relationships on which it relied
so heavily, was a new approach for both Living Streets and the local authorities.
I think we were all very entering the unknown at the outset and through time, we‟ve grown in confidence, as maybe our partners have as well.

24 Fitter for Walking Evaluation Report
Project co-ordinator (2010)
Working with other groups and organisations
In general, the level of involvement from PCTs was disappointing. In many regions the PCT was signed up at
the start of the project, but in most cases they seemed to struggle to understand how they could deliver on
the project. With no direct involvement through commissioning or managing environmental improvements,
their role seemed to come down to either strategic support for the project or walk leader training.
…their impression was they may have been able to add more to the project and although we‟ve tried to explore how we could have worked better, we were still struggling to identify that. However, where they have helped is, they‟ve provided walk leader training to individuals and therefore those people have continued the walks outside of my involvement. So, over the project, we‟ve set up three or four walks, regular walks by community groups which have actually been accountable to the Walking for Health programme now, so it‟s helped in their boroughs, the national scheme.
Project co-ordinator (2011)
Other partnerships sometimes became important, especially in areas where other groups or organisations
had begun work in the area. One example was Groundwork, who had been conducting environmental work
in one project area. It became important (and relatively easy) to work closely with them to coordinate
activity.
Working with communities
This was recognised by co-ordinators as a fundamental part of their role. One of the very first tasks for
each co-ordinator was to make connections with local communities, often through existing organisations,
and get themselves on the agenda of a meeting or talk to them in some way about walking and about the
project.
Co-ordinators were very aware of the need to „tread lightly‟ with initial relationships with community
organisations and to establish their interest in walking and in improving the local environment, rather than
imposing Living Streets‟ ideas upon them. In some cases this meant getting on with some small and quick
initial projects to establish a rapport and to demonstrate progress.
So it‟s about trying to balance, I think, and work with communities to find things as well that can be more quick-wins because lots of the things that do make a difference are those smaller things about litter-picking and cutting back vegetation and painting over graffiti and lots of little things. And I think that builds momentum for things, not only within the community, but actually, also, within the Council… if you can get a better balance, some of those bigger things become more negotiable if people feel less pushed into a corner…
Project co-ordinator (2011)
It seemed essential to find a strong starting point: a „spark‟ that might set things off. In some cases this was
a local hotspot (or „grot spot‟ as one co-ordinator put it) where nothing had been done for years; in others

Fitter for Walking Evaluation Report 25
it was helping people to see the area from the point of view of the walker – an essential component of the
street audit (see later). Or it was about convening led walks to bring people together and get them
thinking (and talking) about the local area. In some cases this came from quite unlikely places, but it was
essential to seize any initial enthusiasm and work with it.
…we‟ve got a Youth Leader with a group of ten, twelve young Asian boys and they want … do some like green work, you know, environmental work so they‟re creating a garden in the back of their community centre that they want to own as their building so we‟re going to support it as a Living Streets project because they‟re going to open the garden up. At the minute it‟s all fenced in, so they want to put gates in so that everyone can use it.
Project co-ordinator (2010)
In the early stage, the role was described as that of being a „travelling salesman‟, selling the benefits of the
project (and of walking in general) to whoever would listen. However, there was a tension in identifying the
community groups who really could represent the local community rather than just listening to the people
who were always vocal in community matters.
I‟ve worked in this sort of area…for the last ten years and I consciously didn‟t want to go to the same groups that I‟ve always gone to because they‟re the top one percent of [this town] who get everything, you know, they come to every event and pick up every free carrier bag and go away with every free pedometer. I didn‟t want to use them.
Project co-ordinator (2010)
One of the key skills of the co-ordinator became tailoring the discussion, and the potential solutions offered,
to the needs of each community group. In working closely with them over time, the aim in each case was
to make sure that there was „added value‟: that the co-ordinator was helping the communities to help
themselves.
…in most of the areas where we‟ve had success and most of the communities we‟ve had success, that what‟s happened, wouldn‟t have happened without us, you know, the community groups wouldn‟t have been able to drive that, necessarily, themselves and the local authorities wouldn‟t have been doing that same work. So it‟s very much come from ourselves as instigating the work and the aims of the project.
Project co-ordinator (2010)
There were a number of challenging aspects to the community liaison role, including: having to be
„everywhere all the time‟, knowing who to listen to, not over-promising, representing the community‟s
views fairly and prioritising actions.
D. Feedback on specific elements of the FFW approach
Community Street Audits

26 Fitter for Walking Evaluation Report
The co-ordinators saw street audits as an essential component of the FFW approach. To conduct an audit
requires technical skills but is a relatively easy way of beginning to engage the local community. They vary
in their formality, some being presented as a walk around the area, others as a more formal approved
process. Co-ordinators said that the process of conducting an audit was a very effective way to capture the
community‟s interest and forge a plan of action.
The easiest to deliver, if the group wants to do it, is an audit because it‟s what Living Streets are all about. We‟ve got good support, we all know how to do them, they‟re quite interesting for people to do, you don‟t need a big group so you only need to get about 10 to 12 people and if you get something positive happening as a result of the audit recommendations then you can get the group to do loads of things from then, it‟s easier to sustain.
Project co-ordinator (2010)
They are also a method for highlighting the positive aspects of the local built environment as well as the
negatives.
Because when we do Community Street Audits, it‟s always about sort of highlighting the positives as well as the negative, we‟re also quite clear on that when we do audits so we‟re not just looking at the bad things about your local street scene, it‟s also the good things. It might be good lighting, it might be good footway construction, there might be a lot of good things about your neighbourhood so I do sort of make point of putting that in the report, what‟s good about a certain area and what‟s good about the council.
Project co-ordinator (2010)
The co-ordinators found the audits straightforward to carry out as even though they may sound quite
official and intimidating, they are basically a walk around the local area pointing out the good and bad
things. But critically they are conducted through the eyes of a walker; something that does not often
happen. This is especially useful for local authorities who may separate issues into different „silos‟
according to their delivery mechanisms.
The only dissenting voice was one co-ordinator who felt that while the walk and talk approach of the audit
was extremely useful, it was not always necessary to formalise it and produce a lengthy report.
For me they‟ve not been very important. And going into long lengthy reports, I haven‟t done it. Hand on heart, I‟ve only done two or three of those…. the audit‟s great, you know, the walkabout and getting people to write the pads and write what they think. Doesn‟t always bring up enough, I don‟t think, to do a full-blown report…we could be accused of just padding something out just to make it look like a lengthy document because, you know, the same things are basically coming up… we don‟t need a twenty page report on dog fouling…
Project co-ordinator (2010)
FFW Manual

Fitter for Walking Evaluation Report 27
Each group that registered with the project was provided with a FFW Manual. This provided the group with
ideas and support for delivering project activities in the community and working towards the FFW Award.
The manual was generally found to be very useful as it gave solid guidance and offered the communities a
route to the Fitter for Walking Award.
Now obviously we have the community manual that has this criteria in so it‟s something we talk about up front with the communities, we can say that what we like to do is work with communities and we try and get you to achieve this award but there are certain things you have to do as part of that and some of that is walking or encouraging people to walk more or raising awareness of walking opportunities in the local area, making improvements to the local street scene.
Project co-ordinator (2010)
Led walks
In general the co-ordinators found led walks an easy way to engage with the community, especially in the
early days of establishing relationships. They were always seen as a means to an end (engaging the
community to make environmental changes to support walking) rather than an end in themselves. Problems
with walks were mainly to do with attendance and some specific issues such as engaging with schools.
I don‟t find led walks that easy because people often just don‟t come. I don‟t think I‟m very good at organising those. But it‟s much easier to go into a school and get the whole school marching round the school field for twenty minutes, and then get them very excited about walking and try and get them to tell their parents walking‟s great.
Project co-ordinator (2010)
Pledge cards
These were introduced later in the project as a device that people could use to write down how they were
going to walk more. Co-ordinators found these very useful as they made people think about walking and
show their commitment to making a change.
…where the pledge cards have been useful for me, because I‟ve been terrible at doing led walks really, I just haven‟t had the time to promote them, but with the pledge cards, it‟s not about a group coming together and going off on a walk, it‟s about people‟s independent journeys that they just do in their own time. And that‟s enabled me to get hundreds of people to pledge to walk more for the journeys that are useful to them and practical to their everyday lives that‟s what the streets are for really, isn‟t it, streets aren‟t made for led walks really…
Project co-ordinator (2011)
FFW Award
The FFW award was presented to communities or specific individuals when they had completed a project
and demonstrated that it had made a difference. Co-ordinators were very supportive of the award as it
provided an opportunity to bring together apparently diverse actions under one umbrella, to reward the
communities, to demonstrate to others what had been achieved and to provide a natural „close‟ to the
project.

28 Fitter for Walking Evaluation Report
I think people there… got a lot of out of it to see what, how they‟d hit the various criteria, and then we did an awards ceremony at the festival and that was quite fun so I think there was a certain sense of achievement at the end which is a good way to… you need that to close down your links really.
Project co-ordinator (2010)
However there was an awareness that the award should not be seen as an end it itself.
I think it varies from project to project, some projects are really keen on it, some, I think, are much more focused on the improvement and the award is very much secondary to that.
Project co-ordinator (2011)
E. Challenges for project co-ordinators
This was not a straightforward job; project co-ordinators had to balance a number of conflicting priorities
and balance the needs of a number of stakeholders including Living Streets, the local community, the LA
and the Lottery (the funders of the project). Although the co-ordinators focused mainly on the successes of
the projects and the things they had learnt, they also outlined some of the main issues that made the job
particularly challenging.
People
Perhaps the most significant challenge facing the co-ordinators was finding and developing relationships
with the right people. As well as working with the right community groups (not just being used to deliver
walks or address another agenda), it was essential to locate and work with the right person in the LA.
Main challenges for me has been my contact with the Local Authority and being able to put the time towards it to really… nail that relationship with them but… find the right community groups and keep working with them. So, like I said, it‟s very kind of labour intensive, like just doing very small things.
Project co-ordinator (2010)
And if it turned out that this person was not keen on the project then it could lead to a lot of wasted time.
I think my challenge I‟ve had with him is that I‟m not sure he‟d completely bought in to the project at the beginning, and again I wasn‟t involved when he was first involved. But it‟s very challenging too, it doesn‟t always feel that he‟s completely kind of bought in to the Living Streets idea, as opposed to what I‟m hearing from other Local Authorities.
Project co-ordinator (2010)
There was also the issue that even when the right person was located, there were issues with
communication within the LA, especially between neighbourhood management and transport departments.
This meant a lot of chasing up activity from the co-ordinators, checking that the LA staff had done what
they said they would and were following up on actions from meetings and audits.

Fitter for Walking Evaluation Report 29
In some cases, co-ordinators also faced problems with the local communities; some events had very low
attendance, and one or two had specific issues such as lack of buy-in from specific groups or resistance to
certain approaches. In general this was not a major issue; communities typically welcomed the FFW project
and the way it was working.
Funding
Throughout the project, lack of funding per se was not a significant issue, as FFW had a budget that it
offered to the local authorities as match funding for projects. The project secured a large amount of match
funding (see Chapter 1) for improvements throughout the project‟s life. However, as the project came to an
end, there were many concerns that the impetus of the project would be lost as project funding stopped.
This was exacerbated by the deep funding cuts taking place across the public sector. This is raising concerns
about whether there would be any remaining budget to continue making environmental improvements after
the FFW team left.
I think obviously the big one at the moment is budget cuts and my partners have always feared raising expectations for those communities I‟m working with…
Project co-ordinator (2010)
They‟ve just closed five libraries so, so some of the money‟s disappearing shall we say, that is a real frustration…I mean the match fund that was supposed to be on the table from each of the authorities just isn‟t there anymore…and you end up matching officer time… but you don‟t seem to get the…ten, twenty grand that was supposed to be on the table from each authority, to do the direct works.
Project co-ordinator (2011)
Indeed there is considerable concern among the co-ordinators around the long-term sustainability of the
promotion of walking in the FFW communities. It was recognised that the environmental improvements
would remain, and that in many cases there were established groups taking up led walks and other
promotional activity, but in general the worry is that without continued funds from the LA and, more
importantly, without the stimulus from a project co-ordinator, the momentum will be lost.
Geographical spread
An issue for two of the co-ordinators was a disagreement with the LA on where they should be working. The
project approach was to identify the LA (through a combination of data on deprivation and knowledge and
contacts on who would be willing to work with the project) and then to find suitable areas and case studies
through discussion with the community. In this way, the project co-ordinators felt that they were more
likely to get buy in from the community, as they had worked with them to identify the project areas.
However, in two cases the LA felt that this was unfair and that the project should be working equally across
the whole borough. This was deemed to be impractical with the project staff numbers, so may have led to
some friction with the LA staff and certainly led to difficulties with time management.

30 Fitter for Walking Evaluation Report
For me, it has been time management… because three boroughs, ideally I would like to spread my time equally across all three and it just doesn‟t happen, and I think sometimes your time is taken up with those that are working well so you‟re spending more time with those than those that may not necessarily be going according to plan… it‟s just a lot to keep on top of and balance…
Project co-ordinator (2010)
Timescales and completion of projects
Project co-ordinators found projects took much longer than originally anticipated particularly where project
activities included infrastructural changes requiring LA resources. Many of the delays in projects were due
to back-and-forth between the communities and the LA and completion of various approval procedures.
But it has taken quite a long time because it‟s had to go through design and consultation and through, you know, kind of Council cabinet meetings and things like that and it had to be redrawn and resubmitted, and passed again through cabinet and that kind of thing and it all takes time to do that.
Project Co-ordinator (2010)
Project co-ordinators appeared to become embedded into the communities in which they were working and
found it difficult to close projects even when they had completed most of their works. The FFW Award
represented a clear opportunity for „closure‟ in many cases, but they still tended to find it difficult to say a
project had completely finished. There was always more to be done, even if only litter picks or organising
more walks.
F. Project achievements
Project co-ordinators were in general very positive about the achievements of the projects in their areas.
Overall, it is clear that the project has made some very positive progress in a very short amount of time
addressing a very difficult issue in a number of complex and quite deprived communities.
…we‟ve got almost thirty or forty pretty good projects…in whole neighbourhoods and it‟s actually enormous really just with a team of five. I think we‟ve achieved an enormous amount and we‟ve got an enormous amount of added value to our local authorities from it. It‟s just difficult to demonstrate it because… each project is so unique, each neighbourhood is so unique, and each partner in each neighbourhood is… different and you don‟t necessarily get one person seeing it and saying “oh yeah, all that‟s happened”. But, and our partners don‟t necessarily see it because they‟re stuck, they‟re transport officers stuck in their offices and it‟s difficult to get them off their seats. But yeah, I do think we‟ve actually achieved an enormous amount.
Project co-ordinator (2011)

Fitter for Walking Evaluation Report 31
Community engagement
Co-ordinators were initially very focused on the extent to which communities had been engaged in the
project and their views heard and addressed. For co-ordinators who had been working hard in their
communities for the last few years, there was nothing more gratifying than feeling that the communities
were working together better.
…one of the things that I personally get satisfaction from is when the different groups say “oh we‟ve worked with the school and met this group and… we‟ve been really working together as a community” …and I think people take a lot of pride in that and that strengthens that neighbourhood.
Project co-ordinator (2011)
This was assessed in various ways: through seeing a good turnout at an event they had organised, through
getting positive feedback from community figures or from seeing first-hand the improved relationships
between the communities and the local authorities.
For the project co-ordinators community engagement was nearly always expressed as being more important
than increases in walking.
…people want to be proud of where they live and that‟s a real driver I think. That people can become aware of small scale interventions almost as much as big ones in some cases where they live, if they‟ve been involved in them or been consulted and that can, you know, just feel as good as a big scheme.
Project co-ordinator (2011)
The successes have been the events… I‟ve been involved in street parties and getting people out to recognise the work that‟s been done. The Awards Ceremony: I‟ve always turned the awards into an event… sometimes we‟ve done a walk and then an event afterwards…and they‟re quite good, I like to do that.
Project co-ordinator (2011)
However, co-ordinators were aware that the principal objective of the project was to increase walking, and
this may have created a little tension to some extent.
I suppose it depends how you measure it: whether you measure it in terms of the level of the kind of ownership people take of it; or the level of improvement that‟s made; or the level of walking that‟s increased; and you could argue different schemes in different ways really.
Project co-ordinator (2011)
This was particularly evident when discussing the monitoring of numbers of people walking for the lottery
targets. These were obviously designed to ensure a focus on walking was retained throughout the project,
and the co-ordinators had no problem with that. However, they did appear to feel uncomfortable about
putting this objective above one on community involvement.

32 Fitter for Walking Evaluation Report
Perceptions of increases in walking
Co-ordinators were very uncertain about whether walking levels had increased. On one hand they had been
pushed to focus quite carefully on beneficiary numbers for the Lottery funders of the project, on the other,
it was acknowledged that they were not the best people to assess reliably whether more people were
walking.
…we can point to this and „look at that, look what we‟ve done there and look how much better that is and how much improved that is‟ but then the Lottery will say „well, are more people walking in that area?‟ And that‟s the kind of battle we‟ve had, we‟ve got to keep us eye on us targets… because that‟s what we‟re judged on.
Project co-ordinator (2010)
I don‟t feel a hundred percent confident that hundreds of people will be walking more in that area but we‟ve made some small changes to change it and probably affected some people.
Project co-ordinator (2010)
However it is very clear that the project has achieved far more beyond simple counts of walkers, and for
the communities that is probably of greater importance.
People don‟t come up to us and say “oh I haven‟t seen more people walking so it‟s been a failure”, I‟ve never heard that.
Project co-ordinator (2011)
G. Project learning
As discussed earlier, project co-ordinators were very keen to learn from the experience of working on the
FFW project, and they saw the project as an experiment in new ways of working and engaging with
communities and local authorities. They set out a number of bits of advice that they would pass on to
others who were considering doing such a project in the future.
That people can become aware of small scale interventions almost as much as big ones in some cases where they live, if they‟ve been involved in them or been consulted and that can, you know, just feel as good as a big scheme.
Project co-ordinator (2010)
…do some small steps, that way you keep your group interested and if they are an active team they‟ll take more on and they‟ll add things on. They‟ll say: „right, can we do this as well‟?
Project co-ordinator (2010)
I would have got to grips with being involved with communities quicker and not worry so much about the whole structure and contacts. I would have done it the other way around and built up towards the contacts I needed.
Project co-ordinator (2010)
Fitter for Walking Evaluation Report 33
You can never do enough leafleting in some of these places (to raise awareness and increase attendance).
Project co-ordinator (2011)
…set targets at the start with groups… talk enthusiastically about the project and to get them excited about the project and success breeds success.
Project co-ordinator (2011)
There are lots of people out there…who want to be able to take an active step to do things themselves. And often they need a bit of a shove or help in putting that together, but you definitely…realise in these community groups that there are people that are willing to put their time towards things.
Project co-ordinator (2011)
…what I‟ve learnt personally is, not to make things harder than they needed to be and to think about actually where your expertise and knowledge lie and maybe to tailor things to that.
Project co-ordinator (2011)
…get things booked into your diary, don‟t just let people walk away saying they‟re interested, get a date and what you‟re going to do and what they‟re going to do to support that happening.
Project co-ordinator (2011)
3.2 Local Authority perspectives
The main contact in each of the local authorities took part in one interview half way through or towards the
end of the project. All quotes below are from these LA contacts; regional affiliation has been removed to
protect the identity of interviewees.
A. Understanding of the aims of FFW
Members of staff in local authorities were very clear about the core idea of what FFW was trying to do,
at the level of the project being concerned with promoting walking through changes to the local
environment, in conjunction with local communities.
…for Living Streets to work with communities to see how they could be encouraged to walk more and walk more certainly for local trips and local sort of utilitarian trips kind of shops and picking kids up from school and that sort of thing.
However, many interviewees looked more deeply into the issue and identified a number of subsidiary
objectives that addressed issues of concern to the LA.
The first of these was social inclusion. It was recognised that FFW was concerned with (relatively) deprived
areas and was aiming to address some issues of health and social exclusion.

34 Fitter for Walking Evaluation Report
I was particularly interested in this project because it brings in the social inclusion issue, it strengthens the link between transport and health.
Linking transport and health was mentioned by a number of interviewees, who recognised that the project
enabled the LA to make tangible connections between the two issues, and allowed a more focused approach
than usually took place. It was clear that FFW helped some local authorities to have a focus on walking as
an issue, when it was often in the background.
…as a council, walking was never really pushed… consequently we considered it as a mode of travel and addressed it as accessibility as part of the wider scheme, but never actually looked at designated particular walking schemes. So it was quite a good opportunity, and the timing actually was just perfect.
Finally, a number of LA interviewees recognised that FFW provided either a new model of community
engagement or at least access to an external resource for community engagement.
There was one dissenting voice who thought the aim of the project had changed too much throughout the
project, with a shift in emphasis towards measurable targets and a focus on health walks.
Well I mean the purpose was unclear right from the start. We believe when we entered into the memorandum of understanding…we believed that the main purpose of the project was to bring around built improvements to the walking environment and we were supportive of that because we wanted long lasting … legacy in these areas. However, you know throughout the project the emphasis has changed… it‟s changed a lot so that Living Streets can achieve results which they want to see, and… there‟s been a lot of emphasis put on health walks and walks for schools and things, which we already do… so it‟s been replicating effort you know, to an extent.
B. Perceived role of Local Authorities
The core role of local authorities was generally clear: their job was to provide matched funding and the
technical facilities for the proposed works to be done, as identified by the local communities through street
audits. Where there was tension was when the LA felt that this was overlapping with their role of
community liaison, especially the role of neighbourhood teams. But in general the local authorities saw
Living Streets as providing a very useful addition to their core role.
C. Working with project partners
Working with Living Streets
Local Authority officers were generally very positive about their experiences of working with the FFW
project. They appeared keen in many cases to explain that the project was not offering anything
extraordinarily innovative but was helping to catalyse action on walking.
I think where we‟ve often struggled is…pedestrian movement and where people walk and things like that… and we‟ve tended to get stuck in spending a lot of money on doing drop
Fitter for Walking Evaluation Report 35
kerbs and things like that and that was where money was going…and I think we had an idea that we wanted to more and I think this was a sort of more coordinated approach to…doing that…I think that it was a better way of spending our money and perhaps a more focused way of spending our money than we were doing.
The project seemed to offer the opportunity to bring together what were often disparate efforts on the
walking environment, into a coherent project.
…we‟d already set up or devised walking groups in various areas of the city around parks and open spaces…and we‟d also initiated several walking groups ourselves as part of our GP referral systems…so we already had a set of initiatives happening in the city already, so it was important that when this project came up we integrated those into those rather than set up projects next door to projects that we had running.
In a number of cases the project helped to link action on walking across the LA. In the vast majority of
cases, the main project contact was based in the Transport department. This was deemed to be appropriate
in most cases, as the transport officers had direct access to the relevant budgets. However, there was
something of a tension noted between the transport team and the neighbourhood teams (who have the
responsibility for designated neighbourhoods) in the way the project unfolded. In good examples, FFW
became a conduit for communication between the two departments, in others there were some
communication problems.
…if we‟d have engaged with the Neighbourhoods more it could have been…a much more simplistic approach…visit a few communities and say “well these are the sort of areas we want you to look at”, not just looking at areas on a map and sort of saying, “Well this area and that area.” That might have given him more help.
In a small minority of cases, the project contact was outside of Transport, either in Leisure Services or in
Road Safety. There didn‟t seem to be any particular issues around this, it just depended on the way the LA
was structured and perhaps the interests of individual officers. Overall, the link to transport was thought to
be the right one.
….I think the benefit of [ ] being linked with us in Transportation is … to do with how the funding works for future schemes. I think it makes it easier for that decision to be made… he‟s got a direct door to us as a result.
The most positive aspect of working with Living Streets and the FFW project was the link that it allowed to
the local communities. Although local authorities are clearly very focused on assessing and addressing the
needs of local communities, it was recognised that an outside agency can bring a new perspective to this.
From our point of view, to be honest, Living Streets are vital. They‟re expertise at engaging with the community, liaising, getting local bodies together in an area, getting people interested in it. It‟s something which I think, as an outside source, it‟s different from the council, it‟s a lot more beneficial...

36 Fitter for Walking Evaluation Report
The FFW project also offered more resources to the participating LA, not just the budget but especially the
time and expertise of the community co-ordinators, who allowed the LA to be seen to be working more
closely with communities than their resources allowed.
…[the FFW co-ordinators] have been brilliant at what they do and they've absolutely taken it on board and got people involved and done a lot for very little cost. You know, so I think that's also a point to be made that they've effectively taken some of the cost burden off the Council and done it themselves.
Most of the local authorities seemed to be happy to let the FFW co-ordinators work on their own as much as
they needed to, just offering help and further links to specific people in the LA when needed. Living
Streets were seen, in most cases, to be the natural leaders of the project, with the LA taking the lead in
identifying specific streams of funding within the authority and linking to other departments such as
neighbourhoods, in one case referred to as a „shepherding‟ role. Once or twice, LA staff explained that
they sometimes had to „step in‟ to clarify matters or to limit expectations within communities about what
could be delivered, but in general the independence of the project team was appreciated.
I like to think that‟s because the Council‟s stepped back a little bit and allowed someone else to do it a little bit differently.
However, a small number of LA officers said that the project only really sped up what they might have done
anyway.
…we would have had to have found some solutions; whether we would have found the same solutions in the same way in the same timescale as Living Streets is a different matter.
I think they‟ve been important, but it‟s difficult to say whether or not… I mean …we were going to do that anyway, it was going to get picked up anyway. It‟s whether the project would have taken the shape and form that it did, probably not, but it would have taken another shape and form.
Working with Primary Care Trusts
This was seen to be a less successful aspect of partnership working on the project. Although most
interviewees noted that there were many reasons for a strong partnership with the NHS, due to the focus on
healthy walking and links to communities, this had often not materialised. Local Authority officers
mentioned attending project board meetings and strategy groups, but action on the FFW project had not
tended to materialise from the PCTs.
…the PCT, they did sign up at the onset but they haven‟t been particularly well engaged if I‟m being honest.
The problem seems to be that the PCTs had trouble finding their role on the project, beyond walk leader
training. The LA had a more tangible function in funding and carrying out the physical works, leaving the
PCT mainly offering little more than support for the project‟s aims.

Fitter for Walking Evaluation Report 37
Working with communities
As mentioned above, linking the LA to the local community was an important aspect of the FFW project.
The independence of Living Streets was seen as a key asset, as it enabled the project to relate more
directly to community members and then to relay those concerns to the LA.
….so it does assist greatly when we have third parties, that we have a good working relationship, because they sometimes have more productive relationships with the local communities and then can act as a pressure group on the council, which believe it or not is usually welcomed because it just gives us more intelligence on where to spend what resources we‟ve got. So that‟s actually pretty helpful I‟ve found, so having Living Streets in place has been helpful in that respect.
In addition, key functions were bringing the communities together, focusing on walking and identifying and
prioritising actions that could improve the environment for walking. In some cases the LA felt that this had
improved their relationships with community groups, irrespective of the impact on walking.
The downside of this partnership was the amount of time that such a labour-intensive approach to
community development takes, as it takes time to develop relationships and work through the project steps.
F. Feedback on specific elements of the FFW approach
Community Street Audits
In general the concept and execution of the street audits was very strongly supported by LA officers. They
recognised that it formalised the consultation process and allowed a clear focus on walking and on a
specific geographical area.
The first thing I‟d like to say is I think the Street Audits are excellent and I‟m really impressed with them and I think the whole concept and the way they are done is fantastic and I think it‟s something we really should be supporting.
In some cases local authorities have been so impressed with the street audit approach that they have
commissioned Living Streets to conduct further audits outside of the FFW project.
What officers particularly liked was that the street audit reports gave such a clear set of recommended
actions that the authority could take. These were usually far more focused and detailed than the authority
would normally do. The role of the LA officer was then to identify which of the actions they could (and
could not) do and to coordinate action across the authority. The main downside to the audits was that they
usually identified more actions than the authority could afford.
We knew that the community street audits were a key part to it, but I think the first one that came back we thought „crikey, there‟s a lot of stuff in there‟, and of course that was the first of a number, probably half a dosen that came through. I mean, it has been an issue to deal with the amount of things that are thrown at us and that we certainly have to pass on and disseminate between different offices, but that‟s what the project‟s about, to try and improve the people who can work with it, to try and improve the issues.

38 Fitter for Walking Evaluation Report
There was a concern that the audits may have raised expectations among community members – especially
those who did not realise that the Living Streets staff were independent of the LA.
The other issue raised by one or two officers was whether an audit report was really necessary for some of
the more simple changes (dropped kerbs and dog mess, for example). It seems that the optimal report for
most local authorities would be one that would clearly identify the problems and their proposed solutions,
without too much unnecessary detail.
G. Challenges for local authorities
Funding
One of the most significant barriers to progress in the on-going effort to improve the walking environment is
clearly the reduction in budgets in local authorities in recent years.
Nothing is ring fenced any more so in terms of local government and spending going forward that brings opportunities as well as problems. I mean if you‟ve got a good case for stuff and you‟ve got good people that can make those cases it might be, it might be a positive because you can shout loudest in the bonfire that‟s going to come and that‟s how I see it anyway. So we‟ll see, we‟ve nothing ring fenced any more.
It was appreciated that the FFW project brought money with it, and in many cases, interviewees recognised
that this paid for some things that would not normally have been funded by the authority itself. But there
was concern that this would dry up and the cuts being made across all public services would have an impact.
In some cases this meant that the project had raised expectations that would not now be met.
I think in some respects, because some of the issues raised do require some quite substantial funding in some aspects, we‟re not always able to find a funding stream to sort of hook that onto. It sort of raises the expectations of the members of the public.
Staff capacity
An issues linked to funding is that of human resources. Interviewees were very grateful for the additional
people available through the FFW project to conduct audits and consult with communities but were still
concerned that the project demanded additional human resource.
...the Community Street Audits… are, I think extremely useful, very very good. But the actions coming from them are very labour intensive for us because it requires someone like myself to actually go through a list, farm them out, chase them up, and then follow them up with people, and that is very labour intensive.
There was also concern about what happened when the FFW staff disappeared.

Fitter for Walking Evaluation Report 39
But you know you‟ve got to question whether a lot of these things are going to stand the test of time you know, and that‟s my concern…we‟d make an area fitter for walking you know… they want to make people fitter for walking by putting on loads of health walks and things…and who‟s going to staff those in the future…?
Sustainability
Linked to the above, by far the biggest concern was that the project might not be sustainable in the long
term.
I don‟t know what will happen in the future, but at this point in time the Local Authority will end up picking bits of the projects up, I think that‟s pretty inevitable.
So I think that‟s one way that‟s a bit more productive than just saying the Local Authority should pick it up, in this changed climate I just don‟t know how to answer that, I mean whether there‟s a future for, you know, this sort of project through Living Streets or if it‟s developed, I don‟t know. There‟s mixed messages from central government on these issues, you know, so I don‟t know.
And it doesn‟t, I don‟t think it encourages more people to walk in the future I think it‟s…very short term-ish…
…on the whole I think they‟ve been fairly modest, which I think is one of the problems that the physical changes that we bought about will be fairly modest. The changes, the actual changes in the communities, time will tell I think is what we need to say.
Geographical spread
There was also some tension in a few authorities regarding how areas were selected for the project. While
some authorities were happy to take a case study approach, where priority communities came up with ideas
and the most appropriate were selected, others thought there should be an even spread of projects across a
LA area.
…one of my criticisms of the project is that it‟s very much focused on two or three areas basically. And the problem is, is that…whereas we wanted to see a…spread of the borough and benefits across the borough, we haven‟t, we haven‟t seen that at all you know, and it‟s something that we‟ve got to explain … it‟s put us in a difficult situation.
Time
The final significant barrier was lack of time to do the project real justice. Community development work
takes concentrated time, to build relationships with the community and needs to continue for as long as
possible. Many interviewees regretted that the project was not given the time it deserved.
…I under estimated how much time it would take and overestimated how much time I could give it, which means there has been a significant gap between the amount of time I‟ve been able to give supporting the project, and what I would have liked to have done, given how important I think it is, and that‟s been a source of frustration to me.
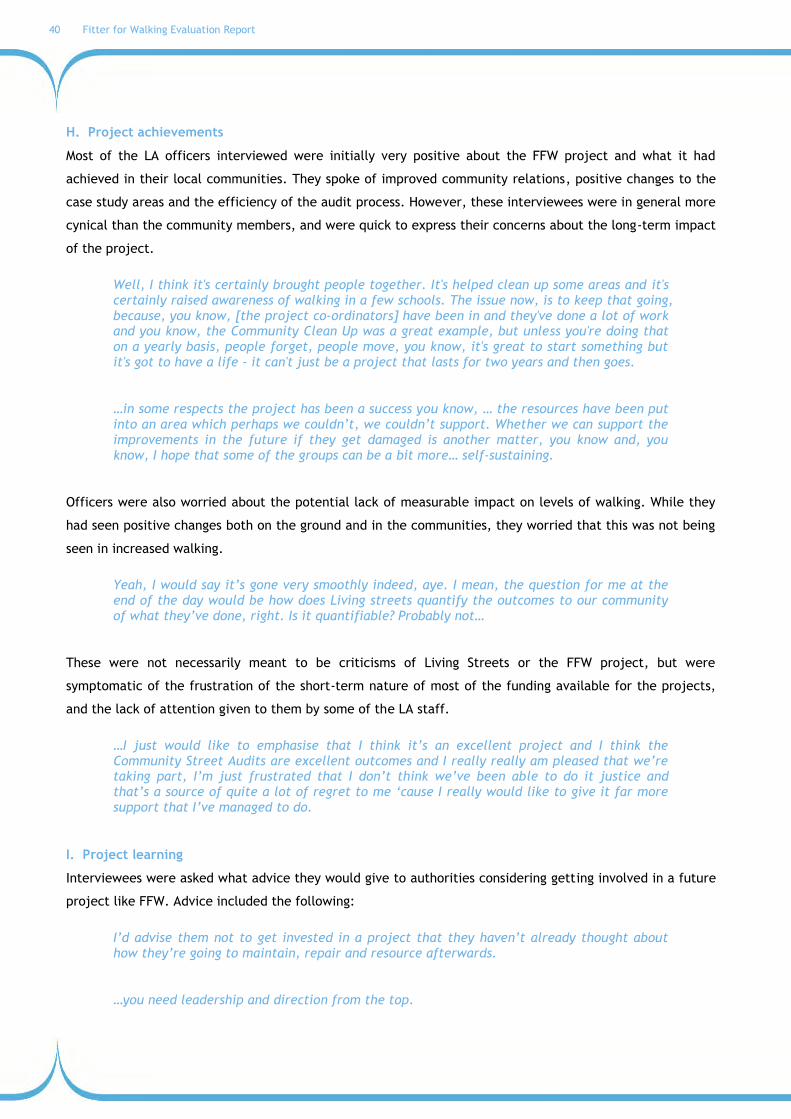
40 Fitter for Walking Evaluation Report
H. Project achievements
Most of the LA officers interviewed were initially very positive about the FFW project and what it had
achieved in their local communities. They spoke of improved community relations, positive changes to the
case study areas and the efficiency of the audit process. However, these interviewees were in general more
cynical than the community members, and were quick to express their concerns about the long-term impact
of the project.
Well, I think it's certainly brought people together. It's helped clean up some areas and it's certainly raised awareness of walking in a few schools. The issue now, is to keep that going, because, you know, [the project co-ordinators] have been in and they've done a lot of work and you know, the Community Clean Up was a great example, but unless you're doing that on a yearly basis, people forget, people move, you know, it's great to start something but it's got to have a life - it can't just be a project that lasts for two years and then goes.
…in some respects the project has been a success you know, … the resources have been put into an area which perhaps we couldn‟t, we couldn‟t support. Whether we can support the improvements in the future if they get damaged is another matter, you know and, you know, I hope that some of the groups can be a bit more… self-sustaining.
Officers were also worried about the potential lack of measurable impact on levels of walking. While they
had seen positive changes both on the ground and in the communities, they worried that this was not being
seen in increased walking.
Yeah, I would say it‟s gone very smoothly indeed, aye. I mean, the question for me at the end of the day would be how does Living streets quantify the outcomes to our community of what they‟ve done, right. Is it quantifiable? Probably not…
These were not necessarily meant to be criticisms of Living Streets or the FFW project, but were
symptomatic of the frustration of the short-term nature of most of the funding available for the projects,
and the lack of attention given to them by some of the LA staff.
…I just would like to emphasise that I think it‟s an excellent project and I think the Community Street Audits are excellent outcomes and I really really am pleased that we‟re taking part, I‟m just frustrated that I don‟t think we‟ve been able to do it justice and that‟s a source of quite a lot of regret to me „cause I really would like to give it far more support that I‟ve managed to do.
I. Project learning
Interviewees were asked what advice they would give to authorities considering getting involved in a future
project like FFW. Advice included the following:
I‟d advise them not to get invested in a project that they haven‟t already thought about how they‟re going to maintain, repair and resource afterwards.
…you need leadership and direction from the top.

Fitter for Walking Evaluation Report 41
…it‟s about getting the right audience, the right community group with an active person…and if they‟re keen you can get it to work.
I think that they have to be very clear on what they want, what they want to get out of the project. I think that they have to realise that they‟ll probably put in a lot more time than they think they will at the start.
I just generally think it‟s a good project. It‟s a…good goal, good ideals. I hope they can find some resources to sustain that.
3.3 Community perspectives
A. Understanding of the aims of FFW
Interviews with community members showed that there was a clear initial understanding of the basic
concept of FFW and agreement with its general aims.
…the project is Fitter for Walking so it is all about making the environment better and trying to get more people to walk more…
Community member, Yorkshire
For many interviewees there was more emphasis on the fitness component („getting fitter for walking‟)
while for some it was linked to reducing car use.
Well I think the main purpose is to get people moving and active around, you know, their own legs rather than their car and their motor vehicle.
Neighbourhood Manager, North East
However, by far the strongest element of the project that was well understood by the community was the
link to the local environment for walking. Interviewees were very positive about the focus of the project on
improving the local environment and making small changes that could make their local areas more
amenable.
…the big thing is getting improvements in place around us to encourage people to walk more and to get to us more by walking and to get to other places more by walking.
Community member, North East
… it‟s like reclaiming back the place that you live and just making the healthy choice, the easy choice by using the resources around you that you‟ve got.
Community member, North West
B. Barriers to walking

42 Fitter for Walking Evaluation Report
Interviewees were very aware of the issues that stopped them, and other people in the community, from
walking more. These could generally be divided into three categories: environmental, social and
psychological.
Environmental barriers were the most frequently cited by community members. As the sample was largely
comprised of community activists and people engaged in improving the local area it is perhaps no surprise
that they were generally proud of their local environments. They spoke passionately about the local area
and the possibilities for walking, often in hidden or relatively unknown areas. However, they were also very
aware of the negative aspects of the local environment, notably dog mess, litter, graffiti and overgrown or
blocked paths caused by lack of lack of maintenance. These were most often in public shared space in the
local community, but there were also many problems cited of lack of maintenance by private householders,
which impinged on public space.
…some of the gardens around the estate they look awful basically, that‟s not a Living Streets problem…but it‟s an aesthetic thing you know.
Community worker, North East
In a number of case study areas there were very specific issues, such as dropped kerbs in specific locations,
that could be solved relatively easily but had never been tackled before.
…and a few overgrown trees as well on two of the ginnels through the estate. We mentioned them after we‟d been for one walk and then… they‟d cut it all back so it was a nicer path to go through. But I think everything did get sorted, just the odd little things like the dog mess and things like that it did get sorted for the next time we walked round.
Community member, North West
Social barriers were primarily to do with concerns over personal safety due to areas being taken over by
youths (or others), particularly in the evening, for behaviour deemed to be anti-social including drinking
alcohol, riding motorbikes and sometimes drug use. This had turned a number of areas into „no-go areas‟,
either because people had witnessed anti-social behaviour or had seen the signs of young people
congregating and didn‟t want to take the risk of walking in the area.
…unfortunately there‟s a lot of vandalism goes on out there.
Community member, West Midlands
Another social or behavioural issue highlighted by a number of interviewees was pavement parking, which
prevented people from using the pavements, especially those pushing buggies or in wheelchairs.
…we do have a problem with cars parking on grass verges and that‟s a major concern on certain areas of the road... there are times that if you‟re a mother with a pushchair and there‟s a car actually driven up, not onto the grass verge, but actually parking on the pavement which is beyond the grass verge, you have to leave the pavement, go onto a slipway and down and then back up again.

Fitter for Walking Evaluation Report 43
Community member, West Midlands
‘Psychological’ barriers included a perception that some sections of the community lacked the motivation
or personal inclination to walk, whatever the environment. Again it is important to remember that this
sample is mainly drawn from the more active sections of the community (if not physically active, then
socially active), and there may have been a tendency for people to have been a little bit judgmental when
thinking about less active sections of the community.
…there was only one or two who were saying absolutely no chance, it doesn‟t matter what you do, I‟m still driving, but you‟re always going to get that.
Community worker, North East
However, by far the most prevalent issue to do with psychological barriers to walking is the notion that
many people simply did not know about the nice areas in their community. Time and time again in the
interviews, people said that the led walks showed people areas and walks that they had never seen before,
despite living in the area for ten or twenty years in some cases.
…we‟ve just had a walk around and some of them have known the area but some of them have been really surprised at just how green, how open it is… I think one of the things is that just how nice it is and it‟s right here… and next to us and a lot of people don‟t realise just how much pleasant walking there is.
Community member, North West
This was a constant source of surprise to those working on the project in the communities, but it also
represented a very real opportunity for intervention. In many cases, led walks provided very valuable
opportunities to show the local community the „jewels on their doorsteps‟ and encourage them to get
involved in the project. Led walks were also used to „show off‟ at the end of a project and to demonstrate
the improvements that had been made.
C. The role of Fitter for Walking and the Living Streets co-ordinator
Interviewees were universally positive about the contribution that the project co-ordinators had made to
the project and to community action in their areas. The overriding theme was that many of the successes of
the project simply would not have happened without the work of the co-ordinators.
…he has really put his heart and soul into everything he‟s done … without him it wouldn‟t have been done, so I think he has made it a big impact on the estate.
Community member, North West
And I can‟t say enough about her to be honest… I can‟t say enough…absolutely brilliant.
Community member, West Midlands

44 Fitter for Walking Evaluation Report
...certainly with regards to [ ] it‟s been massively positive because if he‟s said he‟s going to do something it‟s done… I wish we had more people round here like [ ] .
Community member, Yorkshire
…he‟s so enthusiastic and he‟s got lots of contacts, he seems to know where to get information about things, yeah he‟s been very helpful.
Community member, London
It was noted that the co-ordinators needed a range of skills to carry out their job and needed to be able to
communicate well with a wide range of people including ordinary members of the community, LA staff and
politicians. It was particularly well received when co-ordinators did not just „show up with promises of
money‟ but rolled up their sleeves and got stuck in (with litter picks or clean-up days).
The main strength of the co-ordinators was seen to be making things happen. It was often acknowledged
that many people in the community knew what needed to be done, but the FFW co-ordinators helped to
crystallise this and focus on the necessary action.
It‟s a doing thing which is quite unusual because lots of people like to talk about things for several years before ever enacting anything which is a real pain.
Neighbourhood manager, North East
The co-ordinators helped to „keep and eye on the ball‟ and, critically, knew who to contact to get things
done.
I think [ ] has been instrumental in providing us with the sort of impetus to sort of get going if you like and a bit of enthusiasm you know, “shall we do this then, we‟ll do that”, just to you know sort of get the ball rolling.
Community member, Yorkshire
D. Engaging the local community
A key part of FFW was engaging the local community and helping to understand their needs, and shape this
into meaningful action. This is more an art than a science and required a great deal of tenacity on the part
of the co-ordinator, and help and participation by the local community members.
…the question that we‟re always asking each other is, “How do you get people involved?” And I think what Living Streets does is it shows that a lot of people would like to get involved but often it‟s something like shyness or suspicion or a feeling of, “Well whatever we do there‟s no point because it will just get destroyed,”… [but] it‟s like taking their hand and bringing them through the front door… the map is I think a big achievement but it was a vehicle, wasn‟t it? It was a vehicle to get people to get together really. And that was what was really good.
Community member, North West
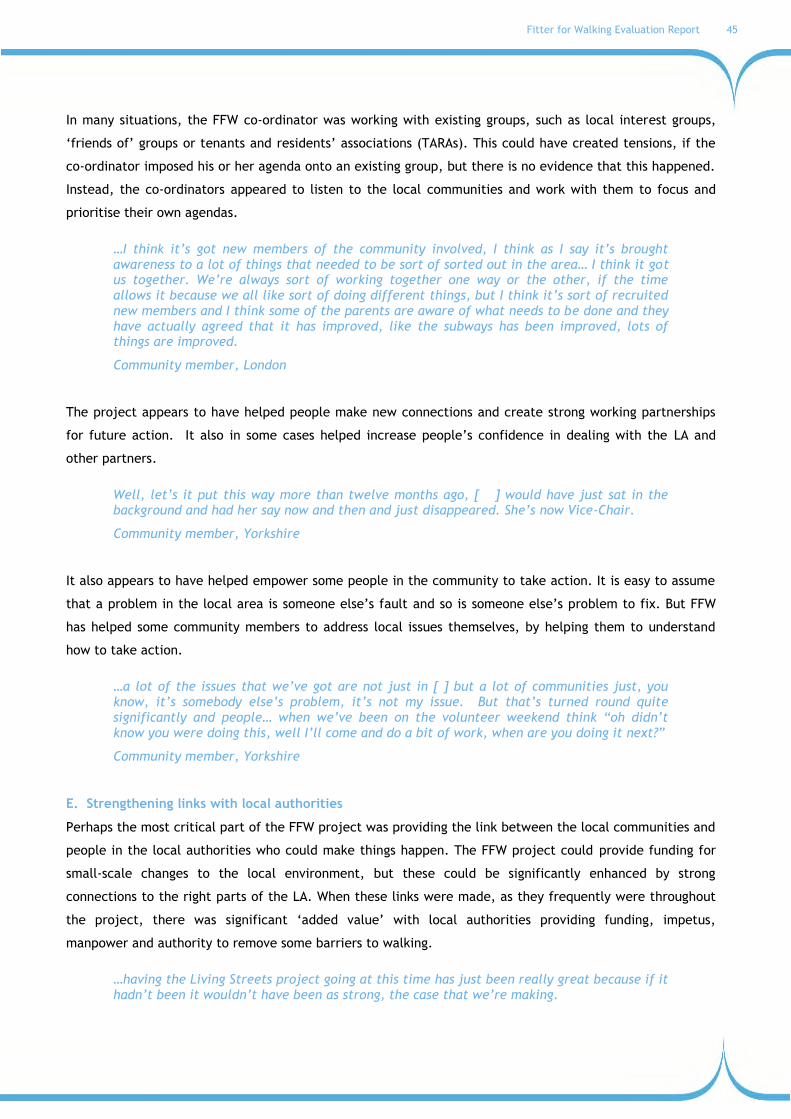
Fitter for Walking Evaluation Report 45
In many situations, the FFW co-ordinator was working with existing groups, such as local interest groups,
„friends of‟ groups or tenants and residents‟ associations (TARAs). This could have created tensions, if the
co-ordinator imposed his or her agenda onto an existing group, but there is no evidence that this happened.
Instead, the co-ordinators appeared to listen to the local communities and work with them to focus and
prioritise their own agendas.
…I think it‟s got new members of the community involved, I think as I say it‟s brought awareness to a lot of things that needed to be sort of sorted out in the area… I think it got us together. We‟re always sort of working together one way or the other, if the time allows it because we all like sort of doing different things, but I think it‟s sort of recruited new members and I think some of the parents are aware of what needs to be done and they have actually agreed that it has improved, like the subways has been improved, lots of things are improved.
Community member, London
The project appears to have helped people make new connections and create strong working partnerships
for future action. It also in some cases helped increase people‟s confidence in dealing with the LA and
other partners.
Well, let‟s it put this way more than twelve months ago, [ ] would have just sat in the background and had her say now and then and just disappeared. She‟s now Vice-Chair.
Community member, Yorkshire
It also appears to have helped empower some people in the community to take action. It is easy to assume
that a problem in the local area is someone else‟s fault and so is someone else‟s problem to fix. But FFW
has helped some community members to address local issues themselves, by helping them to understand
how to take action.
…a lot of the issues that we‟ve got are not just in [ ] but a lot of communities just, you know, it‟s somebody else‟s problem, it‟s not my issue. But that‟s turned round quite significantly and people… when we‟ve been on the volunteer weekend think “oh didn‟t know you were doing this, well I‟ll come and do a bit of work, when are you doing it next?”
Community member, Yorkshire
E. Strengthening links with local authorities
Perhaps the most critical part of the FFW project was providing the link between the local communities and
people in the local authorities who could make things happen. The FFW project could provide funding for
small-scale changes to the local environment, but these could be significantly enhanced by strong
connections to the right parts of the LA. When these links were made, as they frequently were throughout
the project, there was significant „added value‟ with local authorities providing funding, impetus,
manpower and authority to remove some barriers to walking.
…having the Living Streets project going at this time has just been really great because if it hadn‟t been it wouldn‟t have been as strong, the case that we‟re making.

46 Fitter for Walking Evaluation Report
Community member, North West
Living Streets cannot take all the credit for this: in many cases the co-ordinators were building on existing
relationships between community groups and the local authorities, but there did seem to be a strong
perception that in most cases the relationship had been enhanced by the project.
I think the relationship with the Council over the last say three, four years has become better, it‟s got better and better, that‟s not particularly because of Fitter for Walking although that helped, it‟s because of the formation of the Residents‟ Association… we hold monthly meetings and there‟s quite a lot has happened in the last two or three years to actually improve things on the estate, and I think the relationship between ourselves and the Council is about as good as it can be really.
Community member, North East
What FFW seemed to offer was a model of participation that worked particularly well with the communities
concerned and with the focus on creating or improving environments for walking. In one case this
contrasted sharply with the established model of participation which was described as a „rent a crowd‟
model where „officers ingratiate themselves with their communities, with very small representative
tokenistic communities.‟
One relationship that does not appear to have been altogether successful was linking to primary care trusts.
Whether this was due to the pressures on the NHS or to a lack of motivation from PCT staff was not clear,
but it does appear that the PCTs were slow to engage.
I would have hoped that there would have been more support from some of the council services and the PCT in terms of how they connect maybe their cardiac therapy…
Community member, North East
…it varies from practice to practice, but they have put the posters up, I suppose that‟s one thing, yeah. Put the Change for Life posters up.
Community member, Yorkshire
F. Elements of the FFW projects
Many of the FFW projects used a number of common elements to stimulate community action. These
included street audits, led walks; pledges; and the FFW award.
Street audits were one of the first things the project co-ordinator usually did as part of FFW. This is a
formal process, initiated by Living Streets, which basically involved walking through an area making a note
of and discussing any potential barriers to walking and potential improvements. In many cases interviewees
said that this process was helpful in opening their eyes to problems, or to seeing things more from a new
perspective, notably that of a disabled person or someone pushing a buggy.

Fitter for Walking Evaluation Report 47
…I think it‟s to look at things in a different way as well because you just see them with your eyes but actually see them from a different perspective sort of, you know made you think about things different.
Community member, North East
The audits were also great community events in themselves. They were focal points for meeting local
councillors or officials, and it was sometimes found that people often „tagged along‟ when they saw an
audit happening. These street audits then were used as the way to open the door to broader discussions
about what needed to be done, and to engaging other parts of the local community.
Led walks were a common approach. These were generally not seen to be an end in themselves (as they
might be in the Walking for Health project for example) but as a means to engaging the community in the
project. This was at a number of stages: increasing initial interest; as part of an audit; ensuring on-going
engagement in a project; linking to new groups; checking on progress; and celebrating success. In some
places themed walks were popular: bat walks; toddler walks or history walks for example. Walks were
either led by the community co-ordinator, or in conjunction with trained walk leaders from other projects.
As with other led walks projects, attendance was sometimes an issue.
It will be interesting to see the extent to which led walks continue to be a part of the project in the future:
it could be argued that they are an essential part of ensuring that people continue to walk in the new
improved environment.
Community pledges were used as a method to increase people‟s engagement with the project. People
were encouraged to make pledges to walk more, and to identify where and when they would do this. Pledge
cards were provided in the form of a fridge magnet on which community members could record their pledge.
These seemed to be popular with children and adults pledging to walk more. In some cases people used
these as a bargaining device: pledging to walk more only if some of the promised environmental
improvements were made.
The Fitter for Walking Award was developed during the project as a way of rewarding communities for
action taken to make their areas fitter for walking. Communities had to achieve set criteria relating to
environmental change; community engagement; increased walking levels and a commitment to sustaining
progress. This appeared to be extremely well received by communities and individuals to whom it was
awarded, as they saw it as recognition for their work.
I think for me it was a personal achievement, that someone had actually recognised that I am a resident, you know, and I do work hard. So just to have somebody come along and give me something back meant so much, because it‟s very rare that you get that, to be appreciated, you‟re just there and you get on with it, but as a resident it did mean a lot to get the award.
Community member, North West
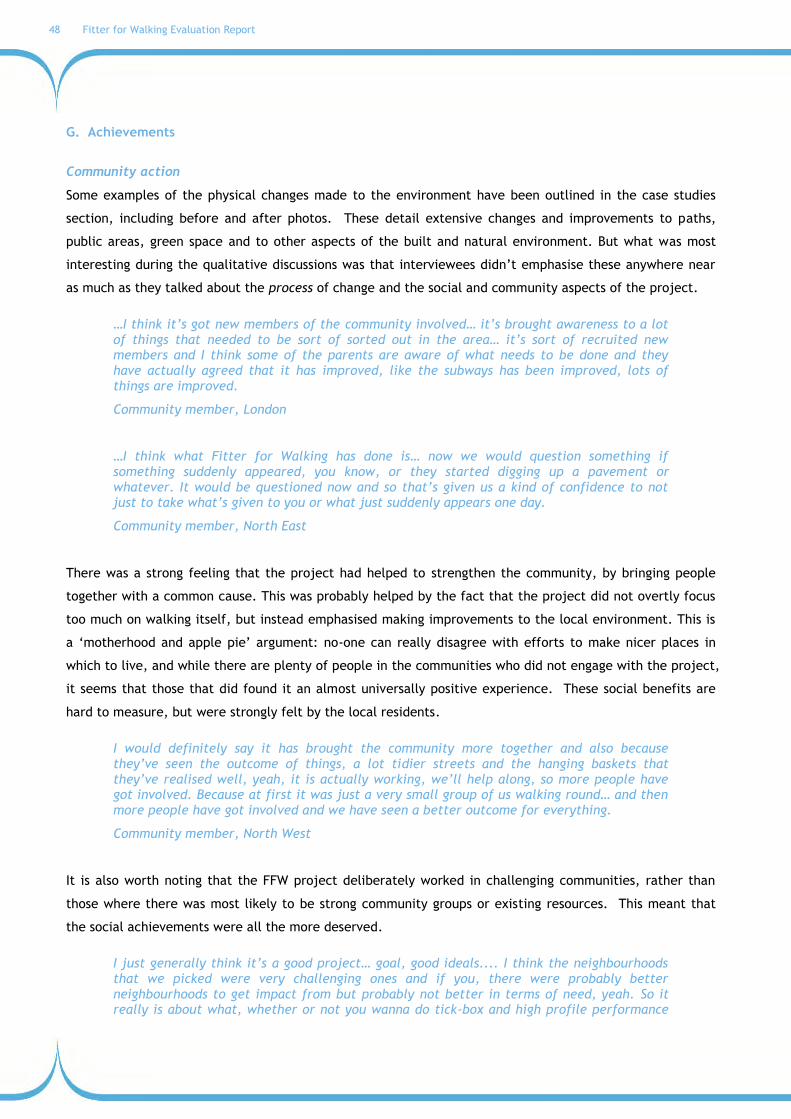
48 Fitter for Walking Evaluation Report
G. Achievements
Community action
Some examples of the physical changes made to the environment have been outlined in the case studies
section, including before and after photos. These detail extensive changes and improvements to paths,
public areas, green space and to other aspects of the built and natural environment. But what was most
interesting during the qualitative discussions was that interviewees didn‟t emphasise these anywhere near
as much as they talked about the process of change and the social and community aspects of the project.
…I think it‟s got new members of the community involved… it‟s brought awareness to a lot of things that needed to be sort of sorted out in the area… it‟s sort of recruited new members and I think some of the parents are aware of what needs to be done and they have actually agreed that it has improved, like the subways has been improved, lots of things are improved.
Community member, London
…I think what Fitter for Walking has done is… now we would question something if something suddenly appeared, you know, or they started digging up a pavement or whatever. It would be questioned now and so that‟s given us a kind of confidence to not just to take what‟s given to you or what just suddenly appears one day.
Community member, North East
There was a strong feeling that the project had helped to strengthen the community, by bringing people
together with a common cause. This was probably helped by the fact that the project did not overtly focus
too much on walking itself, but instead emphasised making improvements to the local environment. This is
a „motherhood and apple pie‟ argument: no-one can really disagree with efforts to make nicer places in
which to live, and while there are plenty of people in the communities who did not engage with the project,
it seems that those that did found it an almost universally positive experience. These social benefits are
hard to measure, but were strongly felt by the local residents.
I would definitely say it has brought the community more together and also because they‟ve seen the outcome of things, a lot tidier streets and the hanging baskets that they‟ve realised well, yeah, it is actually working, we‟ll help along, so more people have got involved. Because at first it was just a very small group of us walking round… and then more people have got involved and we have seen a better outcome for everything.
Community member, North West
It is also worth noting that the FFW project deliberately worked in challenging communities, rather than
those where there was most likely to be strong community groups or existing resources. This meant that
the social achievements were all the more deserved.
I just generally think it‟s a good project… goal, good ideals.... I think the neighbourhoods that we picked were very challenging ones and if you, there were probably better neighbourhoods to get impact from but probably not better in terms of need, yeah. So it really is about what, whether or not you wanna do tick-box and high profile performance

Fitter for Walking Evaluation Report 49
stuff which we have to do on a regular basis or whether or not you wanna really go out and challenge need.
Neighbourhood Manager, North East
The only negative comments were about the pace of change: some residents would have liked things to
happen more quickly. This was particularly the case in one case study area where residents had been
promised regeneration for years and they were hoping FFW would provide some sort of short cut.
Increases in walking
One of the main objectives of the FFW project was to improve the environment so more people walked.
This is being measured through route user surveys and counts in case study areas. But do community
members think that more people are walking in the local area?
For most community members, there was a general perception that there were more people walking in the
areas where they had been working.
…where I live… I‟ve seen quite a few people walking up in groups of three, four.
Community member, North West
I see a lot of people that were on the health walks in the beginning that are walking around now that maybe weren‟t walking before.
Community member, North West
I would say a hundred percent plus probably. And across the day time, you know, again not so much in the evening but when you go... there‟s still people wandering round about eight, nine o‟clock, half past nine, which you wouldn‟t see before.
Community member, North East
However, these are perceptions only and are doubtless coloured by the positive views that people hold
about the areas following their FFW activities. What is more interesting is that the increase in levels of
walking was very rarely the first point that people made when asked about the success of the project. For
most community members, success was measured in the changes in community cohesion and social
interaction.
H. Sustainability
Finally, it is worth exploring perceptions of the extent to which people thought the changes brought about
in the project would be sustainable, especially after the FFW teams had left.
There was a strong desire and intention to continue with the changes that had been made in the FFW areas.

50 Fitter for Walking Evaluation Report
Well, we‟d carry on, we‟d definitely fight to carry on because they‟ve given us the strength and the initiative to do that. It would be a shame to lose them as part of this now because we see them as part of our team.
Community member, Yorkshire
In some cases people were beginning to make concrete plans for sustaining the project, but in general there
was just a simple willingness to continue.
I think probably it‟s making this sustainable, I mean personally I‟d like to see the walks established and in place and… the green gym equipment, you know, some of that dotted around so that we can sort of take it up that next level.
Community member, Yorkshire
Well we‟re going to do another litter pick later in the year. We‟re hoping to maybe do some bulbs, plant some bulbs or something later in the year ready for next year, and it‟s things like that we‟re looking at, at the moment.
Community member, North West
However, there is a real danger that for some people the project will lose impetus when the funding and,
more importantly, the co-ordinators disappear. Many communities commented that the co-ordinators had
become embedded in their communities and there were major concerns over their roles ending and the
impact that might have on the community.
I think because it‟s such a big project… and it‟s still a very new and novel idea to us, so I think it would be hard to carry on without some guidance at the moment, but I mean in the future that might be different. But at the moment, yeah I think it would be quite hard to carry on without somebody‟s guidance.
Community member North West
I think if [co-ordinator] was to go, as volunteers, who have we got? You know, we are losing staff all the time, and volunteers need support, without support there‟s no volunteers, and that is the big problem.
Community member North West

Fitter for Walking Evaluation Report 51
Chapter 4. Case studies
SUMMARY
This chapter reports detailed findings from the in-depth evaluation of seven Fitter for Walking projects. In
each of these projects route user counts and surveys were conducted along with a focus group or interview
with the registered group or other community members. In five of these projects a residents‟ survey was
also conducted. The results of the route user counts and surveys, residents‟ surveys and project co-
ordinator and community perspectives of the projects are presented. The findings in this chapter relate to
the assessment of evaluation objectives 2, 3 and 4.
Case studies are presented as follows:
- Case study A: Marks Gate, London
- Case study B: Byker Link, Newcastle
- Case study C: Bensham, Gateshead
- Case study D: Taylor Street, Blackburn
- Case study E: „Our back field‟, Bolton
- Case study F: Weddell Wynd, Wolverhampton
- Case study G: Cliff Hills, Maltby, Rotherham
KEY FINDINGS:
Barriers to walking
Route users were asked to indicate what improvements they thought were needed on the project route
to encourage people to use it more often. At follow-up, there was a clear reduction in the proportion of
route users reporting barriers to walking that had been mentioned at baseline eg, clearance of
rubbish/glass; clearance of dog mess; clearance of graffiti; improved crossings; and improved lighting,
which typically corresponded with issues that had been addressed through the FFW project. This
provides some evidence that the FFW project was successful in removing barriers to walking in local
communities.
Awareness of project improvements and participation
Route users were asked if they were aware of any recent improvements that had been made on the
route. At follow-up route users were most frequently aware of the following changes: clearance of
rubbish/glass (case studies A, B, D and E); clearance of graffiti (case studies A and D); resurfacing of
path (case studies A, E and G); a wider path or pavements (case studies F and G); and removal of
overgrown hedges (case studies B and F). These reported changes also largely corresponded with
changes that had been made as part of the FFW project.
At follow-up, awareness of Living Streets and the Fitter for Walking project was higher than at baseline
in 3 case studies (A, B and D). Awareness of Living Streets ranged from 2% to 21% and awareness of
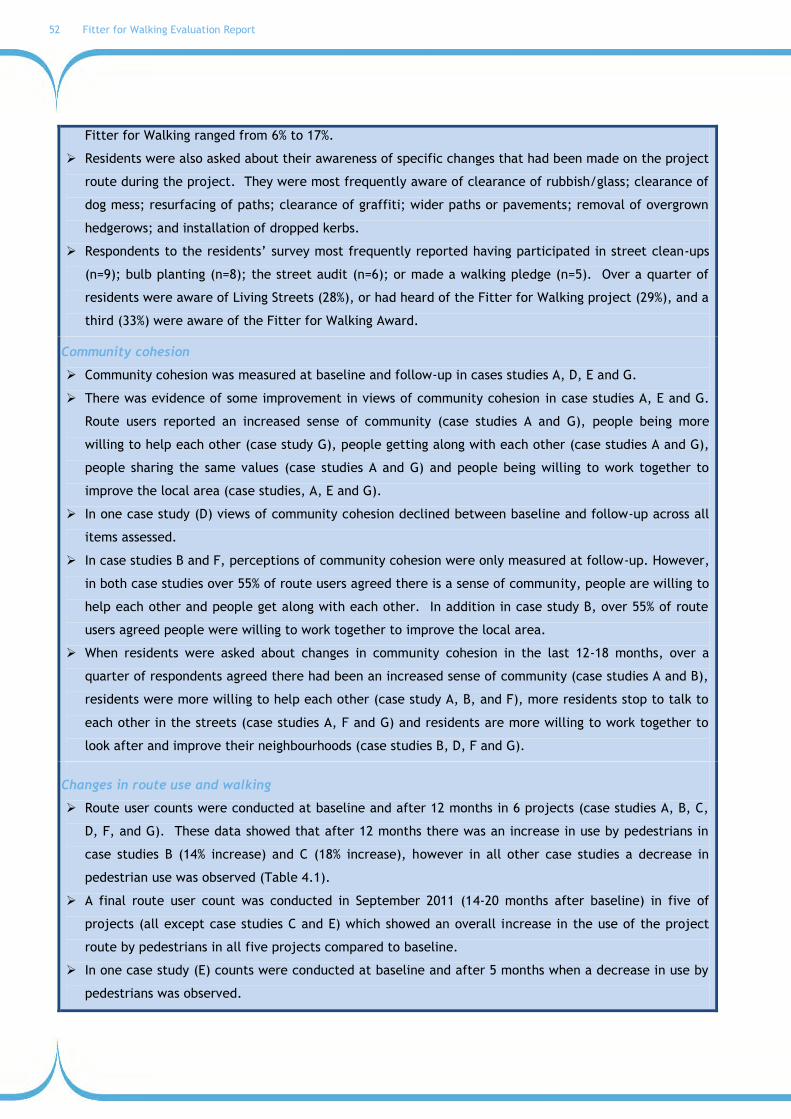
52 Fitter for Walking Evaluation Report
Fitter for Walking ranged from 6% to 17%.
Residents were also asked about their awareness of specific changes that had been made on the project
route during the project. They were most frequently aware of clearance of rubbish/glass; clearance of
dog mess; resurfacing of paths; clearance of graffiti; wider paths or pavements; removal of overgrown
hedgerows; and installation of dropped kerbs.
Respondents to the residents‟ survey most frequently reported having participated in street clean-ups
(n=9); bulb planting (n=8); the street audit (n=6); or made a walking pledge (n=5). Over a quarter of
residents were aware of Living Streets (28%), or had heard of the Fitter for Walking project (29%), and a
third (33%) were aware of the Fitter for Walking Award.
Community cohesion
Community cohesion was measured at baseline and follow-up in cases studies A, D, E and G.
There was evidence of some improvement in views of community cohesion in case studies A, E and G.
Route users reported an increased sense of community (case studies A and G), people being more
willing to help each other (case study G), people getting along with each other (case studies A and G),
people sharing the same values (case studies A and G) and people being willing to work together to
improve the local area (case studies, A, E and G).
In one case study (D) views of community cohesion declined between baseline and follow-up across all
items assessed.
In case studies B and F, perceptions of community cohesion were only measured at follow-up. However,
in both case studies over 55% of route users agreed there is a sense of community, people are willing to
help each other and people get along with each other. In addition in case study B, over 55% of route
users agreed people were willing to work together to improve the local area.
When residents were asked about changes in community cohesion in the last 12-18 months, over a
quarter of respondents agreed there had been an increased sense of community (case studies A and B),
residents were more willing to help each other (case study A, B, and F), more residents stop to talk to
each other in the streets (case studies A, F and G) and residents are more willing to work together to
look after and improve their neighbourhoods (case studies B, D, F and G).
Changes in route use and walking
Route user counts were conducted at baseline and after 12 months in 6 projects (case studies A, B, C,
D, F, and G). These data showed that after 12 months there was an increase in use by pedestrians in
case studies B (14% increase) and C (18% increase), however in all other case studies a decrease in
pedestrian use was observed (Table 4.1).
A final route user count was conducted in September 2011 (14-20 months after baseline) in five of
projects (all except case studies C and E) which showed an overall increase in the use of the project
route by pedestrians in all five projects compared to baseline.
In one case study (E) counts were conducted at baseline and after 5 months when a decrease in use by
pedestrians was observed.

Fitter for Walking Evaluation Report 53
There was some variation in use of the routes on week and weekend days at the different survey
periods across all projects. Route use by pedestrians was higher on a week day for case studies A, C
and D, higher on a weekend day for case study E, and varied across the different survey points for case
studies B, F and G.
Route users in case studies A, B, C, D, E and G were asked whether their use of the project route had
changed in the last 12-18 months. The proportion of respondents reporting they had increased their
use of the route varied from 6% to 25% (Table 4.1). Far fewer route users reported a decrease in the
use of the route (2% to 12%).
At follow-up, a higher proportion of route users reported using the project route on a daily basis in case
studies A, D and E.
Table 4.1 Summary of pedestrian route use across 7 case studies
Baseline
Follow-up 1 (12 months)
Follow-up 2 (14-20 months)
Proportion of route users perceiving an increase or
decrease in route use in last 12-18 months
n n % change
from baseline
n % change
from baseline
% perceiving an increase
% perceiving a decrease
A. Marks Gate, London 856 736 14.0 964 12.6 15.8 8.8
B. Byker Link, Newcastle 129 147 14.0 205 58.9 15.1 9.4
C. Bensham, Gateshead 4702 5566 18.4 ND ND ND ND
D. Taylor Street, Blackburn 621 367 40.9 732 17.9 5.9 3.9
E. Our back field, Bolton 174 140* 19.5 ND ND 21.4* 11.9*
F. Weddell Wynd, Wolverhampton
280 134 52.1 378 35.0 ND ND
G. Cliff Hills, Rotherham 1197 1072 10.4 1262 5.4 24.0 2.0
ND= no data *follow-up data collection took place after 5 months
Route users were also asked about the factors influencing their decision to travel actively (walk or
cycle) on the project route. At follow-up, over 60% of respondents in all case studies strongly agreed or
agreed that they walked or cycled on the route because they could go straight to their destination; it
was the best transport option, it was the most convenient route; they could save money by using the
route; and walking or cycling added to the exercise they get from other parts of their life.
At follow-up, route users appeared to be walking more for a variety of journey purposes (though this
was not specifically related to walking on the project route): to travel to and from work (case studies
A, B, D, E and F); to get to and from school (case studies B and D); for business trips (case studies A, B,
D and E); for shopping (case studies A, B and G); to get to leisure facilities (case studies A, B, D, F and
G); to travel to friends or relatives (case studies A and B); and for personal business (case studies A, B
and D). In addition, the total mean minutes of walking for transport per week undertaken by route

54 Fitter for Walking Evaluation Report
users was higher at follow-up in four case studies (A, B, E and F) than at baseline suggesting route users
were doing more walking overall.
Residents also reported using the routes more often in the last 12-18 months for a variety of trip
purposes. The greatest increases in use were for social activities (case studies A, B, D, F and G); to get
to public transport (case studies A, B and G); for personal business/shopping (case studies B and D); and
for recreation or fitness (case studies B, D and F).
A high proportion of residents (83%) reported that they usually walked for short journeys in their
neighbourhood and 64% (n=40) strongly agreed or agreed they had walked more in their neighbourhood
in the last 18 months. The main reasons given for why residents had changed their mode of travel were
due to a change in income, to get healthier/fitter; because the cost of petrol or the cost of public
transport fares had increased; and because knowledge of the area had improved.
Around half of respondents to the residents‟ survey strongly agreed or agreed that in the last 18 months
they had seen more people walking the neighbourhood (53%); found new routes for walking (48%);
thought it was now more pleasant to walk around the neighbourhood (48%); had discovered new places
to walk to (45%) and thought it was safer to walk in their neighbourhood (40%).
Improvements in health and well-being
The increases in walking observed in this project are likely to lead to benefits for health and well-being
in the longer-term; however it was not possible to measure changes in health and well-being as part of
this evaluation.
Residents‟ views on the benefits of using the project route varied but the most frequently cited
included: visiting local shops more, feeling less stressed, feeling fitter, increasing level of physical
activity and feeling more satisfied with their neighbourhood.
Overall
A wide range of environmental barriers to walking appear to have been removed through the Fitter for
Walking project based on route users perceptions of what is still needed to improve the routes to
encourage walking. Many route users and residents were aware of improvements which had already
been made along the route though they did not always associate the changes with the Fitter for
Walking project.
Across most of the case studies route users and residents reported an improved sense of community.
Although there are some limitations to the evaluation and the findings are mixed across the case
studies, there was a trend towards there being more people walking on the project routes by the end of
the project. There was a perception amongst some route users that they had used the route more
often in the last 12-18 months and findings suggest they were doing more transport-related walking
overall and for a wider variety of journey purposes. Similarly, some residents reported they were using
the project route more often, were doing more walking, had discovered new routes for walking and
new places to walk to, and that there were more people walking in the local area.

Fitter for Walking Evaluation Report 55
4.1 CASE STUDY A: Marks Gate, London
PROJECT SUMMARY
Local Authority: Barking and Dagenham
Residents of Marks Gate receiving the Fitter for Walking Award (June 2010)
Location: Marks Gate
Registered group: Marks Gate Older People‟s Network
Date of registration: November 2008
Date of completion: June 2010
The primary focus of this project is the route through a subway under the A12 Eastern Avenue between
Marks Gate and Chadwell Heath. The subway was identified as a particular barrier to walking by the Marks
Gate Older People‟s Network. A street audit was conducted in January 2009 and recommendations
submitted to the Local Authority specifically related to concerns about the subway and parking issues.
Subsequently, secondary groups have become involved in the project including WellGate Children‟s
Centre, Friends of Padnell Lake, Marks Gate Junior School and Marks Gate Church.
The Fitter for Walking Award was presented to the community in June 2010.
Project activities
Street audit (January 2009)
Changes made to this route include:
- Creation of a „walking corridor‟ including improved crossings; installation of dropped kerbs; removal
of street clutter; improved signage, resurfacing and installation of bollarded way finding (March
2010)
Other project activities have included:
- bulb and shrub planting (October 2009 and June 2010)
- path clean up (October 2009)
- attendance at local events to promote walking and reduce pavement parking
- an art project with the local school to produce a map of the route (November 2010)

56 Fitter for Walking Evaluation Report
Examples of project activities
Route BEFORE removal of street clutter
Route AFTER removal of street clutter
Signage BEFORE project New signage installed as part of project
New map of area installed as part of project

Fitter for Walking Evaluation Report 57
SUMMARY OF RESULTS
The project co-ordinator‟s and community members‟ views of this project are presented below. A summary
of the findings from the route user counts, intercept surveys and residents‟ surveys are also reported below,
followed by a detailed breakdown of results.
Project Co-ordinator’s views
The project co-ordinator was interviewed to ask about the background to this project and their experiences
of working with this community.
…there‟s this subway under the A12 and that‟s the main route from Marks Gate into Chadwell Heath which is the main shopping centre and there‟s a train station there, it‟s only about a twenty minute walk but it is through this subway which is kind of quite notorious or has had a very bad reputation. And so the only way to get out of Marks Gate on foot is through three subways and… we focused on the one in the middle…a big, you know, negative in terms of pedestrian accessibility… we thought it would be a good idea to look at that route as a key walking route for the residents of Marks Gate… there are actually quite a few negatives about that route other than the subway…the truck [which parked blocking the path], the guard railing, the litter around the subway…
Project Co-ordinator, London
The project was successful in accessing Transport for London (TfL) funding in addition to project funds so
was able to carry out quite extensive improvements. The key to this was seeing the route as not just a
series of subways but as a key link to the local centre. This helped to justify the project to TfL and to the
Local Authority (LA). The LA was a willing partner and helped introduce the project co-ordinator to leading
members of the local community. A lot of effort was put into cleaning the area (of dog mess and graffiti
etc.) as well as the core works. Local people have reported seeing more people walking in the area, more
social activity and more people helping to keep the area clean.
…people seem happier with where they live and more satisfied where they live, and that they‟re actually walking more.
Project Co-ordinator, London
The project achieved the Fitter for Walking Award earlier this year, as a sign of progress and to
demonstrate this phase of the project was complete. The project co-ordinator was optimistic that at least
some of the impetus would be sustained when the project is completed.
That I think will mean the work is sustained, and of course the community street audit and I think the group is going to become an affiliate to Living Streets… they seem keen to because they want to take forward the work that was done.
Project Co-ordinator, London
58 Fitter for Walking Evaluation Report
Community members’ views
Qualitative interviews were conducted with some members of the local community who had become
involved in the case study. These showed that they were very pleased with what had been achieved. Right
from the start, when the initial audit was conducted, it appears that the project has helped the local
community to look at their area from the perspective of a walker – and someone pushing a buggy or using a
wheelchair.
…removing barriers, dropping pavements - so you can now go from here down to Chadwell Heath which is approximately a mile - you‟ve got a slope for everything which is much improved, much improved.
Community member, Marks Gate
In particular they thought it had had some significant benefits in terms of bringing the community together.
…I think it‟s got new members of the community involved… it‟s brought awareness to a lot of things that needed to be sort of sorted out in the area…some of the parents are aware of what needs to be done and they have actually agreed that it has improved, like the subways has been improved, lots of things are improved.
Community member, Marks Gate
As with many other case study areas, it was mentioned that while they had always known about the
problems in the area, it took the project (and the co-ordinator‟s perseverance) to focus their action.
It‟s been very informative you know, its‟ been, [co-ordinator] has been gung-ho with what he‟s been doing you know… I never thought about it until he came along, it‟s like all these things, until somebody puts the idea in your head… somebody puts the idea in my head and then I follow along with it.
Community member, Marks Gate
There was an unfortunate incident during the project when some people objected to a project sign that
used photographs of some local children and tore it down. But this was a minor incident compared to the
overall feelings of success.
The community is now planning a number of events to sustain the momentum including fun runs, and an
annual „Marks Gate Day‟.
Route user counts, route user surveys and residents’ surveys
Route user counts were conducted on the route at baseline (January 2010), and after 12 months (January
2011), 18 months (July 2011) and 20 months (September 2011). Route user intercept surveys were
conducted simultaneously on the first three of these occasions (January 2010, January 2011 and July 2011).
Counts and surveys were conducted over 2 days on each occasion, one week day and one weekend day for
Fitter for Walking Evaluation Report 59
12 hours on each day. At baseline 29 route users participated in the intercept survey with 52 respondents
taking part in the 12 month survey and 59 respondents taking part in the 18 month survey.
In addition a survey was conducted with a small number of residents living within 1 mile of the route. Only
16 residents responded to the survey therefore the results from the residents‟ surveys should be interpreted
with caution owing to the low response rates.
Full methods are reported in Chapter 2.
Barriers to walking
At baseline respondents to the route user survey highlighted a number of improvements that were required
to encourage walking on the project route including: clearance of rubbish/glass (59%), improved lighting
(48%), clearance of dog mess (38%) and improved crossings (14%). At both follow-ups clearance of
rubbish/glass was still highlighted as an issue (suggested by 40% of respondents at follow-up 1 and 48% of
respondents at follow-up 2) along with clearance of graffiti which became an issue during the project
(suggested by 27% of respondents at follow-up 1 and 36% of respondents at follow-up 2); however a much
lower proportion of respondents reported the need for clearance of dog mess and improved crossings,
suggesting that some of the barriers to walking in the area have been removed during the FFW project.
Project awareness and participation
Only 7% of route users had heard of Living Streets and 12% of FFW. A small minority noticed changes to the
route such as resurfacing (22%), clearance of rubbish/glass (17%), clearance of graffiti (15%) and improved
lighting (12%). A high proportion of respondents to the residents‟ survey also noticed clearance of graffiti
and resurfacing of the path but few residents reported participating in FFW activities.
Some of the respondents to the residents‟ survey were aware of the clearance of graffiti in the area and
resurfacing of the path on the route. Only one respondent noted clearer signage, new information
boards/maps, improved lighting, a wider path/pavement, improved crossings and new dropped kerbs.
Whilst five respondents had heard of the FFW project, only 2 had taken part in any of the project activities.
Community cohesion
Route user survey data indicated that there were improvements in views of community cohesion in the area;
notably there were higher numbers of people at follow-up agreeing that „people are willing to work
together to improve the local area‟. Smaller increases were also observed in the proportion of route users
agreeing that „there is a sense of community‟; „people get along with each other‟; and „people share the
same values‟.
Walking & route use

60 Fitter for Walking Evaluation Report
The route user counts show that use of the Marks Gate route by pedestrians appears to have increased. In
September 2011, there were 11% more walkers than at baseline (January 2010) despite similar weather. At
baseline and follow-up 1 almost half of route users were children and half were adults aged 16-59. At
follow-up 2 and follow-up 3 a higher proportion of route users were adults with a similar number of males
and females using the route. Few older adults (age 60 or over) were reported to be using the route. At all
survey periods route use by pedestrians was higher on a week day than on a weekend day.
Route user survey data showed that for around two thirds of survey respondents walking was the only mode
of transport being used for their journey (61% at baseline, 56% at follow-up 1 and 61% at follow-up 2). A
high proportion of the remaining third reported using public transport for part of their current journey. At
baseline around half of respondents were travelling home (52%), for personal business/shopping (24%) or to
get to or from work (14%). Similarly at follow-up 1 just over half were travelling home (54%) or for personal
business / shopping (21%) but much fewer were travelling to get to or from work (8%). At follow-up 2 a high
proportion of respondents were travelling for personal business / shopping (39%) and to get home (25%).
Respondents‟ mean journey duration decreased by seven minutes between follow-up 1 and follow-up 2.
There was a 13% increase in daily route use between baseline and follow-up 2. At follow-up respondents
agreed that factors influencing their decision to travel actively (walk or cycle) on the route included: being
able to go straight to their destination (96%), the most convenient route (90%), the best transport option
(86%), using the route adds to the respondent‟s exercise (78%) and the respondent saves money by using the
route (71%). Almost a quarter of respondents at follow-up 1 (22%) and a smaller proportion at follow-up 2
(16%) reported they had used the route more in the last 12 to 18 months.
Half of respondents to the residents‟ survey (n=8) agreed they had increased the amount of walking they do
for short journeys around their neighbourhood in the last 12 months. The main reasons for this change were
the cost of petrol going up and to get fitter and healthier. Residents reported an increase in use of the
route for social activities and to get to public transport.
Residents reported the perceived benefits of using the route to include a decrease in stress levels, feeling
healthier, feeling fitter, saving money, using the car less and visiting local shops more. Half of respondents
to the residents‟ survey agreed they had seen more people walking around their neighbourhood in the last
18 months and they themselves had found new walking routes. Two fifths of respondents also agreed they
had discovered new places to walk to and that over the last 18 months the neighbourhood has felt safer and
more pleasant to walk around.
Health and well-being
The increases in walking observed in this project are likely to lead to benefits for health and well-being in
the longer-term; however it was not possible to measure changes in health and well-being as part of the
evaluation.
Overall comments

Fitter for Walking Evaluation Report 61
This was a well-run project that addressed a clear community need and opened up a strategic walking route.
Significant improvements were made to the route including improved crossings, removal of street clutter,
improved signage and changes to the LA cleaning regime near the subway. A number of activities took
place to raise awareness and promote walking in the area including bulb planting, street clean-ups and
development of a local walking map. More people appear to be walking along the route, and there is
general perception that more people are walking in the area.

62 Fitter for Walking Evaluation Report
RESULTS
4.1.1 Route user perspectives
Route user counts were conducted on four occasions commencing in January 2010 (baseline) and repeated
after 12 months (follow-up 1), 18 months (follow-up 2) and 20 months (follow-up 3). Route user intercept
surveys took place simultaneously on three of these occasions: baseline, follow-up 1 and follow-up 2. At
each time point the counts and surveys took place over 2 days, one week day and one weekend day. The
methods are reported in full in Chapter 2. The weather on the days when the counts and surveys took place
varied (Table 4.1.1).
Table 4.1.1 Dates, days and weather for route user counts and surveys
Dates Days Weather
Baseline 28-Jan-10 Thursday Mainly cold and mostly dry with three periods of
heavy rain.
30-Jan-10 Saturday Cold and mostly dry all day.
Follow-up 1 29-Jan-11 Saturday Cold and mostly dry all day.
01-Feb-11 Tuesday
Cold and mostly dry with two periods of damp
/overcast weather and one longer period of
cold/mostly wet in the afternoon.
Follow-up 2
21-Jul-11 Thursday
Three periods of heavy rain were followed by wet
periods until 10am. Warm/hot and dry until 3pm
when it became overcast for the remainder of the
survey period.
23-Jul-11 Saturday Warm and dry all day.
Follow-up 3#
08-Sep-11 Thursday
Cold but mostly dry all day apart from one period of
heavy rain at 2pm. From 5pm onwards it was warm
and dry.
10-Sep-11 Saturday
Warm and dry for most of the day. Became cool but
dry from 4.30pm and there was heavy rain from 6-
7pm. #Count only (no survey)
The surveyor noted two incidents which may have affected route use during follow-up 1 and follow-up 2.
During follow-up 1 an accident on the A12 caused traffic to be diverted through road works causing
increased congestion, and no buses were running from the two bus stops on either side of the subway until
midday. During follow-up 2 the surveyor noted some schools had already broken up for the summer
holidays when the count took place on Thursday, 21st July 2011. Most schools had finished for the summer
when the second day of counting was conducted on Saturday, 23rd July 2011.

Fitter for Walking Evaluation Report 63
4.1.2.1 Route user counts
A. Characteristics of route users
Table 4.1.2 shows the proportion of route users by age category and gender. Minors represented the
highest proportion of those using the subway across all time points except at follow-up 2. Older adults
accounted for the lowest proportion of route users.
Table 4.1.2 Route user characteristics by age and gender at baseline and follow-up
Baseline Follow-up 1 Follow-up 2 Follow-up 3
% % % %
Minor (age 0-15) 49.7 42.7 26.6 33.5
Adult Male (age 16-59) 24.1 27.3 32.5 30.7
Adult Female (age 16-59) 22.6 23.0 33.5 30.0
Older Male (age 60+) 1.5 3.2 3.3 3.0
Older Female (age 60+) 2.1 3.7 4.2 2.8
B. Route use
Overall 910 individuals used the route at baseline; this included walkers, cyclists, wheelchair users, joggers
and infants in pushchairs. At follow-up 1, route use decreased by 12% to 803 individuals. A similar level of
route use was observed at follow-up 2 (831 individuals), but after 20 months (follow-up 3) route use
increased by 24% compared to baseline (Figure 4.1.1). At all survey points, route use was higher on a
weekday than on a weekend day.
Figure 4.1.2 shows route use for pedestrians only. At baseline, 856 pedestrians used the route over the two
day survey period. While the number of pedestrians on the week day at follow-up 1 increased slightly, the
overall number of pedestrians decreased by 14%. A decrease in pedestrian traffic was again seen at follow-
up 2 (a 20% reduction compared with baseline), but at follow-up 3 route usage increased by 11% compared
with baseline. While pedestrian usage during the weekend day remained fairly consistent between baseline,
follow-up 2 and follow-up 3, the lower number of pedestrian route users observed during follow-up 1 may
have been the result of there being no buses running as a result of a traffic accident on the A12 and
diversions being put in place.

64 Fitter for Walking Evaluation Report
Figure 4.1.1 Number of route users (all modes of travel) at baseline and follow-up
Figure 4.1.2 Number of route users (pedestrians only) at baseline and follow-up
910
803 831
1129
524 574
476
733
386
229
355 396
0
200
400
600
800
1000
1200
Baseline Follow-up 1 Follow-up 2 Follow-up 3
Num
ber
of
indiv
iduals
Total Week day Weekend day
856
736
682
964
499
527
390
636
357
209
292 328
0
200
400
600
800
1000
1200
Baseline Follow-up 1 Follow-up 2 Follow-up 3
Num
ber
of
indiv
iduals
Total Week day Weekend day

Fitter for Walking Evaluation Report 65
4.1.2.2 Route User Intercept Surveys
A. Response rates
Route user intercept surveys were conducted three times during the project: baseline, 12 months (follow-
up 1) and 18 months (follow-up 2). The response rate to the survey varied across the three data collection
periods (11-43%) (Table 4.1.3).
Table 4.1.3 Route user survey responses
Surveys completed
(n)
Surveys declined
(n)
Response rate (%)
Main reasons for declining
Baseline Thursday 28th January 2010
Saturday 30th January 2010 29 274 10
Refused (74.8%)
In a hurry (18.2%)
Communication difficulties (6.6%)
Follow-up 1 Saturday 29th January 2011
Tuesday 1st February 2011 52 122 30
In a hurry (50.0%)
Refused (21.3%)
Work (10.7%)
Follow-up 2 Thursday 21st July 2011
Saturday 23rd July 2011 59 212 22
In a hurry (40.1%)
Refused (29.7%)
Communication difficulties (17.0%)
B. Route user characteristics
The characteristics of respondents surveyed at each time point are shown in Table 4.1.4. At baseline and
both follow-up measurements a higher proportion of males than females took part in the survey. The
highest proportions of respondents were aged 35-44 at baseline and the first follow-up; at the second
follow-up the highest proportion were aged 25-34. At all three measurement point, the greatest number of
respondents indicated they were in full-time employment and over two thirds were of white ethnic
background; around half of respondents indicated they were in excellent or good health. The proportion of
respondents meeting physical activity recommendations (30 minutes or more of moderate intensity physical
activity on at least 5 days of the week) varied with a higher proportion of route user meeting
recommendations at baseline (62%) compare to follow-up (35% at follow-up 1 and 39% at follow-up 2).

66 Fitter for Walking Evaluation Report
Table 4.1.4 Route user survey respondent characteristics
Baseline
(n=29)
Follow-up 1
(n=52)
Follow-up 2
(n=59)
% % %
Gender Male 58.6 61.2 54.2
Female 41.4 38.8 45.8
Age 16-24 10.3 18.4 10.2
25-34 13.8 14.3 27.1
35-44 24.1 26.5 15.3
45-54 10.3 12.2 18.6
55-64 20.7 10.2 13.6
65+ 20.7 18.4 15.3
Ethnic group White 72.4 73.5 67.8
Employment status
Employed full-time 41.4 36.7 35.6
Employed part-time 13.8 6.1 16.9
Retired 24.1 26.5 16.9
Other 20.6 30.5 30.5
Health Status Excellent/Very Good 44.8 59.2 45.8
Physical activity Meeting
recommendations* 62.1 34.7 39.0
*measured using the single-item physical activity questionnaire (Milton et. al., 2010) which assessed the number of days respondents took part in 30 minutes or more of moderate intensity physical activity in the past week.
C. Journey characteristics
Mode of travel
The most common activity being undertaken by respondents at the time of the interview was walking
(Figure 4.1.3). Whilst a high proportion of respondents indicated walking was the only mode of transport
used to complete their current journey (61%, 56% and 61% at baseline, follow-up 1 and follow-up 2
respectively), multi-modal trips were common with over a third of respondents also using a bus, train or
taxi to complete part of their journey (data not shown). A small proportion of respondents indicated they
used a car or van for part of their journey (7%; 0%; 5% at baseline, follow-up 1 and follow-up 2 respectively)
in addition to walking (data not shown).

Fitter for Walking Evaluation Report 67
Figure 4.1.3 Activity being undertaken by respondents at time of interview
Journey purpose
The main purpose for respondents‟ journeys is shown in Table 4.1.5. At baseline and follow-up 1 over half
of respondents were travelling home (52% and 54% respectively); in contrast, at follow-up 2 only a quarter
of respondents were travelling for this journey purpose (25%). Travelling for personal business was
frequently cited as the purpose for the journey however few respondents reported travelling during the
course of work (<2%).
Table 4.1.5 Journey purpose
Baseline Follow-up 1 Follow-up 2
% yes % yes % yes
Home 51.7 53.8 25.4
Personal business / shopping 24.1 21.2 39.0
Work 10.3 3.8 8.5
Recreational activity* 6.9 7.7 5.1
Social / entertainment 3.4 7.7 8.5
Education 0.0 3.8 3.4
In the course of work 0.0 1.9 0.0
Recreation (sport and leisure) 0.0 0.0 10.2 *the respondent was just going for a walk or cycle ride around the local area for health, fitness or leisure, there was no specific destination
Journey duration
Respondents were asked about the duration of their journey on foot or by bicycle (depending on which
mode they were using at the time of the survey). Journey duration decreased between follow-up 1 and
follow-up 2 for both walking and cycling (Figure 4.1.6).
75%
80%
85%
90%
95%
100%
Baseline Follow-up 1 Follow-up 2
Walking Cycling Dog walking Other

68 Fitter for Walking Evaluation Report
Table 4.1.6 Journey duration on foot / by bike*
Follow-up 1 Follow-up 2
Mean minutes ±SD Mean minutes ±SD
Walking 19.0 ±18.8 12.5 ±11.1
Cycling 43.6 ±62.9 25.0 ±36.6
*This question was not asked at baseline
Frequency of journey
Respondents were asked how frequently they completed their current journey. Over 50% of respondents at
baseline and follow-up 1 reported they made the walking journey multiple times throughout the week, and
at both follow-up time points under 10% reported they only completed the journey once a year (Figure
4.1.4). An increase in the proportion of respondents using the route on a daily basis was observed between
baseline and follow-up 2. Overall a significant difference was observed in journey frequency between
baseline and follow-up measurements (p<0.05).
Figure 4.1.4 Frequency of route use for current journey by respondents
27.6
58.6
13.8
0.0
22.0
54.0
16.0
8.0
40.7
49.2
6.8 3.4
0
10
20
30
40
50
60
70
Daily Weekly Monthly Yearly
% o
f re
spondents
Baseline Follow-up 1 Follow-up 2

Fitter for Walking Evaluation Report 69
D. Characteristics of route use
Frequency of route use during the day and night
A high proportion of respondents reported using the route daily or weekly during the day time at baseline
and follow-up (Figure 4.1.5). Overall there was increase in the proportion of respondents using the route
on a daily basis during the day between baseline, follow-up 1 and follow-up 2. There was a significant
difference in the frequency of route use during the day time between baseline and follow-up measurements
(p<0.05).
Figure 4.1.5 Proportion of respondents using the route in the daytime
The proportion of respondents reporting using the route at night time on a regular basis was low (Figure
4.1.6). At baseline and both follow-up measurements over 60% of respondents reported only using the
route at night time once a year. An increase in regular route use at night time was observed between
baseline and follow-up 2 (daily) and between follow-up 1 and follow-up 2 (weekly). A significant difference
in route use at night time between baseline and both follow-ups were observed (p<0.05).
Route use in the last 7 days
Respondents were asked on how many days in the past week they had used the route (Figure 4.1.7). At all
three time points over two thirds of respondents indicated they used the route on five or more days over
the past week (45%, 39% and 36% at baseline, follow-up 1 and follow- up 2, respectively). At baseline only
28% of respondents indicated they used the route twice a week or less, whereas that proportion increased
at follow-up 1 (41%) and follow-up 2 (35%). There was no significant change in route use in the past seven
days between baseline and follow-up measurements.
37.9
55.2
0.0
6.9
46.9
36.7
10.2
6.1
54.2
37.3
1.7
6.8
0
10
20
30
40
50
60
Daily Weekly Monthly Yearly
% o
f re
spondents
Baseline Follow-up 1 Follow-up 2

70 Fitter for Walking Evaluation Report
Figure 4.1.6 Proportion of respondents using the route in the night time
Figure 4.1.7 Route use over the past seven days
Factors influencing route use
Respondents were asked a set of questions regarding which factors influenced their decision to use the
particular route for their journey (Table 4.1.7). At baseline and follow-up over 85% agreed the route
allowed them to go straight to their destination. Similarly, over 85% at baseline and follow-up 2 reported
that the route was the most convenient route and active travel provided the best transportation option for
their journey. At follow-up 1 and 2 less than 50% of respondents reported they liked the surroundings on
the route and thought the route felt safe.
6.9
24.1
0.0
69.0
24.5
10.2
4.1
61.2
13.6
20.5
2.3
63.6
0
10
20
30
40
50
60
70
80
Daily Weekly Monthly Yearly
% o
f re
spondents
Baseline Follow-up 1 Follow-up 2
27.6 27.6
44.8
40.8
20.4
38.8
34.5
29.3
36.2
0
10
20
30
40
50
0-2 Days 3-4 Days 5-7 Days
% o
f re
spondents
Baseline Follow-up 1 Follow-up 2

Fitter for Walking Evaluation Report 71
Table 4.1.7 Factors influencing respondents’ decision to use active travel for their journey
Baseline Follow-up 1 Follow-up 2 Sig.
% agree/
strongly agree % agree/
strongly agree % agree/
strongly agree
Can go straight to destination 100.0 85.7 96.6 *
Best transport option 86.2 79.6 86.4 *
Most convenient route 89.7 79.6 89.8 *
Save money by using this route 82.1 65.3 71.2 NS
Like the surroundings on this route 51.7 34.7 47.5 #
Route feels safe 58.6 40.8 37.3 *
This is the only exercise I get1 58.6 16.3 15.3 #
Using this route adds to the exercise I get1 ND 73.5 78.0 NS
Environmental concerns 65.5 49.0 54.2 *
*p<0.05 #p<0.01 NS=not significant 1At baseline these two items were combined for this project
When asked about route safety in relation to exposure to other people, exposure to traffic and quality of
the surface, at baseline and follow-up 1 over 75% thought the route was safe in regards to exposure to other
people and exposure to traffic. At follow-up 2 three quarters of respondents thought the route was safe in
its exposure to traffic (79%), while only 43% thought it safe in regards to its exposure to other people (data
not shown). Around of half of respondents perceived the surface quality to be unsafe at baseline and
follow-up (48%, 63% and 39% at baseline, follow-up 1 and follow-up 2 respectively).
Improvements needed to encourage use of route
At baseline and follow-up respondents were asked what specific improvements would help to encourage use
of the route. The most frequently cited improvements suggested were clearance of rubbish/glass,
clearance of graffiti and improved lighting (Table 4.1.8).

72 Fitter for Walking Evaluation Report
Table 4.1.8 Improvements needed to encourage use of route
Baseline Follow-up 1 Follow-up 2
% yes % yes % yes
Clearance of rubbish/ glass 58.6 40.4 47.5
Improved lighting 48.3 26.9 44.1
Clearance of dog mess 37.9 7.7 13.6
Improved crossings 13.8 3.8 3.4
Wider path or pavement 6.9 1.9 5.1
Clearance of graffiti 3.4 26.9 35.6
Planting of new bulbs 3.4 3.8 5.1
Clearer information / signage 3.4 0.0 5.1
Removal of overgrown hedges 3.4 0.0 3.4
Traffic calming: speed humps / cushions ND 3.8 0.0
Dropped kerbs installed ND 0.0 1.7
ND=No data collected for these questions
Perceived change in route use
At follow-up 1 a quarter of respondents thought they had used the route more (22%), whereas at follow-up
2 only 16% of respondents had done so. A high proportion of respondents indicated that over the last 12
and 18 months there had been no change in the amount they had used the route (Figure 4.1.8). Only a
small proportion indicated they had used the route less in the last 12 to 18 months.
Figure 4.1.8 Perceived change in route use over the last 12 and 18 months
22.4
65.3
12.2 15.8
75.4
8.8
0
10
20
30
40
50
60
70
80
More About the same Less
% o
f re
spondents
Follow-up 1 Follow-up 2

Fitter for Walking Evaluation Report 73
E. Project Awareness
No data was collected in regards to organisational awareness at baseline for this project. At follow-up 1
only a small proportion of respondents had heard of Living Streets (8%) and 16% were aware of the FFW. A
similar proportion of respondents had heard of Living Streets (7%), and were aware of the FFW project (12%)
at follow-up 2.
When asked about their awareness of improvements on the route through the subway at follow-up 1 and 2
only a quarter noticed the path had been resurfaced (25% and 22%, respectively). Some respondents
noticed the rubbish and glass had been cleared (12% and 17% at follow-up 1 and 2 respectively) and 14%
(follow-up 1) and 15% (follow-up 2) noticed the graffiti had been cleaned. Less than 10% were aware of any
improvements in lighting at follow-up 1, whereas at follow-up 2 12% of respondents thought there was an
improvement (Table 4.1.9).
Table 4.1.9 Respondents’ awareness of improvements to route
Follow-up 1 Follow-up 2
% yes % yes
Resurfacing of path 25.0 22.0
Clearance of graffiti 13.5 15.3
Clearance of rubbish/ glass 11.5 16.9
Improved lighting 7.7 11.9
Clearance of dog mess 5.8 8.5
Dropped kerbs installed 3.8 5.1
Removal of overgrown hedges 1.9 3.4
Clearer information / signage 1.9 1.7
Improved crossings 1.9 1.7
20 miles per hour speed limit 1.9 1.7
Wider path or pavement 0.0 3.4
Traffic calming: speed humps / cushions 0.0 3.4
Planting of new bulbs 0.0 3.4
F. Walking for travel and physical activity
Walking for travel
The proportion of respondents walking for travel on five or more days in the past week declined between
baseline, follow-up 1 and follow-up 2 (Table 4.1.10). There was no significant difference in the number of
days respondents walked for travel across the three time points. Mean minutes of walking undertaken by
respondents increased between baseline and follow-up 1 but declined again between follow-up 1 and
follow-up 2 (Table 4.1.10). These changes in mean walking minutes were significantly different between
time points (p<0.001).

74 Fitter for Walking Evaluation Report
Table 4.1.10 Total walking for travel in the past week
Baseline Follow-up 1 Follow-up 2
Mean minutes ±SD Mean minutes ±SD Mean minutes ±SD
Duration of walking for travel
229.7 ±204.1 289.8 ±313.6 274.0 ±305.7
Frequency of walking for travel
% yes % yes % yes
0-2 days 10.3 10.0 20.3
3-4 days 20.7 28.0 20.3
5-7 days 69.0 62.0 59.3
At baseline, respondents most frequently reported walking for journeys to the shops (48%), to and from
work (35%), to get to school or college (28%), to get to leisure facilities (28%) or to visit friends and family
(10%) (Figure 4.1.9). At follow-up a much higher proportion of respondents indicated that they walked to
the shops (73% and 64%, follow-up 1 and 2, respectively). More individuals walked for personal business, at
follow-up 1 and follow-up 2 than at baseline (64% and 41% respectively). Walking for social and leisure
journeys also followed this trend with an increase in walking to visit friends and family (56% at follow-up 1
and 44% at follow-up 2) and walking to visit leisure facilities (54% at follow-up 1 and 42% at follow-up 2). In
contrast, fewer individuals reported walking for journey to school or college journey at follow-up 1 and 2
(23% and 15% respectively).
Figure 4.1.9 Types of journeys respondents normally walked for
Respondents were asked to what extent they agreed with two statements asking about their intention to
walk more and likelihood of walking more in the next 12 months. At baseline over 80% strongly agreed they
intended to and were likely to walk more in the coming year (Table 4.1.11). The proportion agreeing they
intended to walk more or were likely to walk more decreased between baseline and follow-up 1, however
34.5
27.6
3.4
48.3
27.6
10.3
0.0
28.8
23.1
9.6
73.1
53.8 55.8
63.5
40.7
15.3 8.5
64.4
42.4 44.1 40.7
0
10
20
30
40
50
60
70
80
Work commute School / collegeBusiness-relatedtrips
Shopping Recreationand fitness
To visit friendsand family
For personal business
% o
f re
spondents
Baseline Follow-up 1 Follow-up 2

Fitter for Walking Evaluation Report 75
the proportion agreeing was similar between follow-up 1 and follow-up 2. Overall the changes between
baseline and follow-up were statistically significant.
Table 4.1.11 Intention and likelihood of walking more in the next 12 months
Baseline Follow-up 1 Follow-up 2 Sig.
% agree/ strongly agree
% agree/ strongly agree
% agree/ strongly agree
I intend to walk more in the next 12 months 86.2 57.2 56.0 *
It is likely that I will walk more in the next 12 months
82.7 59.3 61.1 *
*p<0.05
Physical activity
There was significant difference between baseline and follow-up measurements in the proportion of
respondents meeting physical activity recommendations (p<0.05). At baseline, over 60% of respondents
reported taking part in at least 30 minutes of moderate physical activity for five or more days in the past
week. Conversely, at both follow-up measurements, over 60% over respondents were not meeting physical
activity recommendations (Figure 4.1.10).
Figure 4.1.10 Proportion of respondents meeting physical activity recommendations
0%
10%
20%
30%
40%
50%
60%
70%
80%
90%
100%
Baseline Follow-up 1 Follow-up 2
Meeting recommendations Not meeting recommendations

76 Fitter for Walking Evaluation Report
G. Community cohesion
Respondents were asked whether they agreed or disagreed with a set of statements regarding the
community in the neighbourhood where they live (Table 4.1.12). At both follow-up measurements, over 50%
of participants agreed there was a sense of community in their neighbourhood and there was small increase
in the proportion of respondents who agreed with this statement. An increase in the proportion of
respondents agreeing that people get along with each and are willing to work together to improve the local
area was also seen between follow-up 1 and follow-up 2. The proportion of respondents agreeing that
people are willing to help each other declined.
Table 4.1.12 Perceptions of community cohesion*
Follow-up 1 Follow-up 2
% agree/strongly agree % agree/strongly agree
There is a sense of community 53.1 55.9
People are willing to help each other 51.0 44.1
People get along with each other 57.1 61.0
People share the same values 32.7 33.9
People are willing to work together to improve the local area
28.6 45.8
*these questions were not asked at baseline for this project
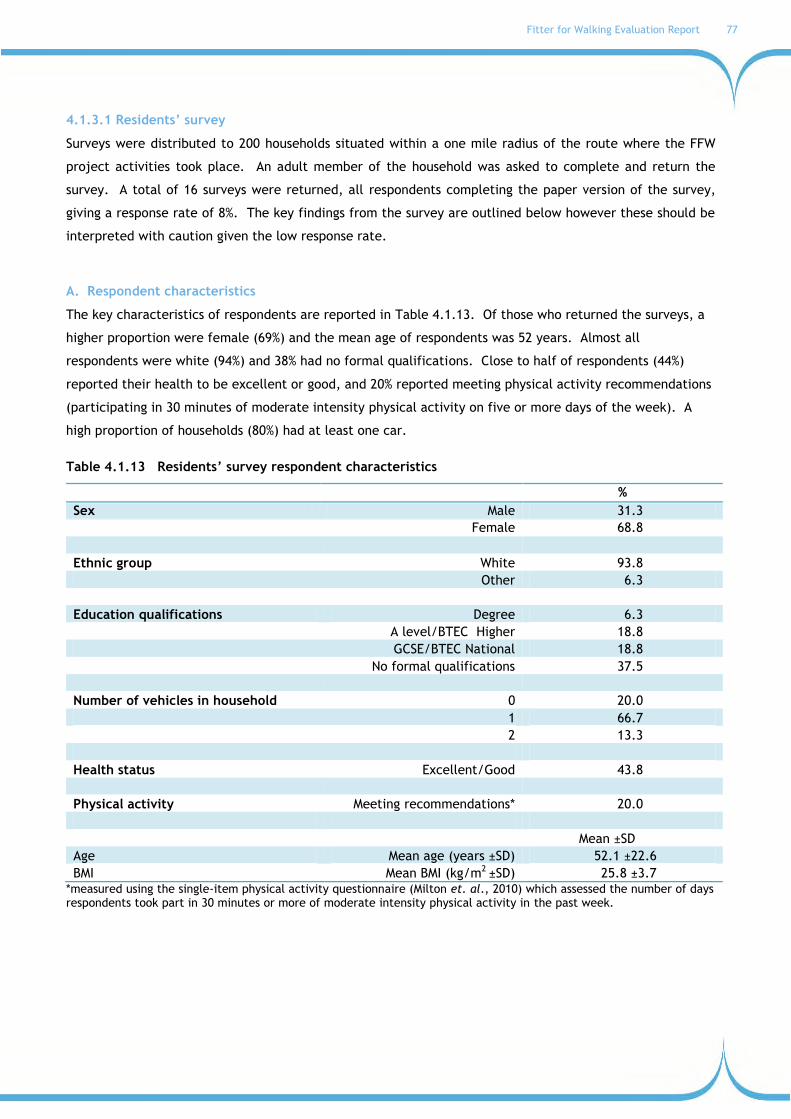
Fitter for Walking Evaluation Report 77
4.1.3.1 Residents’ survey
Surveys were distributed to 200 households situated within a one mile radius of the route where the FFW
project activities took place. An adult member of the household was asked to complete and return the
survey. A total of 16 surveys were returned, all respondents completing the paper version of the survey,
giving a response rate of 8%. The key findings from the survey are outlined below however these should be
interpreted with caution given the low response rate.
A. Respondent characteristics
The key characteristics of respondents are reported in Table 4.1.13. Of those who returned the surveys, a
higher proportion were female (69%) and the mean age of respondents was 52 years. Almost all
respondents were white (94%) and 38% had no formal qualifications. Close to half of respondents (44%)
reported their health to be excellent or good, and 20% reported meeting physical activity recommendations
(participating in 30 minutes of moderate intensity physical activity on five or more days of the week). A
high proportion of households (80%) had at least one car.
Table 4.1.13 Residents’ survey respondent characteristics
%
Sex Male 31.3
Female 68.8
Ethnic group White 93.8
Other 6.3
Education qualifications Degree 6.3
A level/BTEC Higher 18.8
GCSE/BTEC National 18.8
No formal qualifications 37.5
Number of vehicles in household 0 20.0
1 66.7
2 13.3
Health status Excellent/Good 43.8
Physical activity Meeting recommendations* 20.0
Mean ±SD
Age Mean age (years ±SD) 52.1 ±22.6
BMI Mean BMI (kg/m2 ±SD) 25.8 ±3.7 *measured using the single-item physical activity questionnaire (Milton et. al., 2010) which assessed the number of days respondents took part in 30 minutes or more of moderate intensity physical activity in the past week.

78 Fitter for Walking Evaluation Report
B. Residents’ travel behaviour
Respondents were asked to identify which modes of travel they usually used when travelling for short
journeys in their neighbourhood. Walking was the most frequently reported mode of travel (n=13, 81%)
(Figure 4.1.11). Almost two fifths of respondents (n=6, 38%) reported driving a car; however nobody
reported being driven to their destination as a passenger. Taking the bus was the only reported form of
public transport used by 31% of respondents (n=5).
Figure 4.1.11 Mode of transport respondents usually use for short journeys
When asked about changes in travel mode for short journeys in the neighbourhood over the last 18 months,
33% of respondents (n=5) agreed they had made no change to the way they travel. Half of respondents
agreed they had increased the amount of walking they do around their neighbourhood (n=8), and 44% (n=7)
agreed they used the bus more. No one reported increased car usage for short journeys over the last 18
months. The main reasons for changing mode of travel for journeys in the neighbourhood included an
increase in petrol prices (n=6, 38%), to improve health and fitness (n=6, 38%) and as a result of improved
knowledge of the local area (n=3, 19%) (Table 4.1.14).
81.3
6.3
37.5
31.3
0
10
20
30
40
50
60
70
80
90
Walk Cycle Car (as driver) Bus
% o
f re
spondents

Fitter for Walking Evaluation Report 79
Table 4.1.14 Reasons for changes in travel behaviour in the last 18 months by travel mode
C. Residents’ route use
Just over one third of respondents reported using the project route eight or more times per week (n=6,
36%); a further third reported using it only once a week (n=4, 36%). One respondent (9%) reported using the
route on five occasions throughout a normal week, however the remaining respondents (n=2, 18%) reported
not normally using the route at all (data not shown).
In comparison to 18 months ago, most respondents indicated their current use of the route was about the
same. Respondents indicated the greatest increase in use of the route was for social activities (n=2, 13%)
and to get to public transport (n=2, 14%). The greatest decrease in route use over the last 18 months was
reported for trips to school/college (n=2, 17%) and shopping/personal business (n=5, 33%) (Table 4.1.12).
Of the respondents who reported using the route (n=8), 75% perceived they saved money by using the route,
but only 25% thought they used their car less. The most frequently reported improvements in health since
starting to use the route were a perceived decrease in stress levels (n=4, 50%), feeling healthier (n=3, 38%)
and feeling fitter (n=3, 38%). Half of the respondents also reported that since starting to walk along the
route they have been visiting more local shops (Figure 4.1.13).
Walk Cycle Bus Train
n n n n
Agree/strongly agree to increased use of mode 7 1 7 1
Reason for change in mode:
Cost of petrol has gone up 4 0 4 0
Cost of public transport has gone up 0 0 1 0
Change of income 1 0 2 0
No longer have a car 0 0 1 0
Knowledge of area improved 1 0 3 1
Know more people in the area 0 0 2 0
It feels safer 0 0 1 0
Local environment has improved 1 0 1 0
To get fitter and healthier 3 1 3 0

80 Fitter for Walking Evaluation Report
Figure 4.1.12 Route use compared to 18 months ago by journey purpose
Figure 4.1.13 Perceived benefits of route use
D. Perceived changes in the community
Respondents were asked to what extent they agreed with a set of statements relating to walking in their
neighbourhood over the last 18 months. Over half the respondents agreed they had seen more people
walking around their neighbourhood (n=8, 53%) and they themselves had found new walking routes (n=7,
50%). Furthermore, 43% of respondents (n=6) agreed they have discovered new places to walk to in their
0.0 0.0 0.0
6.7
14.3 13.3
0.0
15.4
8.3 8.3
20.0
35.7
26.7
23.1
7.7 8.3
16.7
33.3
0.0
6.7
0.0 0
10
20
30
40
Workcommute
Business-relatedtrips
School/college
Personalbusiness
To get topublic
transport
Social visits Recreationor fitness
% o
f re
spondents
More Same Less
12.5
18.8 18.8
25.0
12.5
37.5
6.3
25.0
0.0
10.0
20.0
30.0
40.0
IncreasedPA levels
Feelhealthier
Feelfitter
Lessstressed
Use acar less
Savemoney
Neighbourhoodsatisfaction
Visit localshops more
% o
f re
spondents

Fitter for Walking Evaluation Report 81
neighbourhood in the last 18 months. A similar proportion of respondents agreed that over the last 18
months the neighbourhood has felt safer (n=6, 40%) and more pleasant (n=6, 43%) to walk around.
When asked about community involvement to help make the neighbourhood safer and more attractive place
to walk, only 19% agreed (n=3) they had personally been involved in community activities while 44% (n=7)
believed other members of the community had been involved in activities. One third of respondents agreed
there was an increased sense of community (n=5, 31%), residents were more willing to help each other (n=6,
38%) and more residents stop to chat to each other in the streets (n=6, 38%).
E. Project awareness and participation
Respondents were asked what specific improvements or changes they have noticed along the project route
in the last 18 months. The main improvement reported by respondents was the clearance of graffiti around
the area (n=7, 44%). A quarter of respondents (n=4, 25%) also noted the path had been resurfaced (Figure
4.1.14). In each of the following categories, only one respondent cited they were aware of any difference:
clearer signage, new information board/maps, improved lighting, a wider path/pavement, improved
crossing or instillation of a dropped kerb (data not shown).
While only one respondent indicated he/she had heard of Living Streets (9%), two fifths of respondents had
heard of the Fitter for Walking project (n=5, 39%) and were aware of the award presented by Living Streets
for efforts to improve the community walking environment and get people walking (n=6, 43%).
Figure 4.1.14 Number of participants aware of project activities and improvements
0
1
2
3
4
5
6
7
8
Num
ber
of
resp
ondents

82 Fitter for Walking Evaluation Report
Survey respondents reported little participation in the FFW activities. Activities respondents did participate
in are listed in Table 4.1.15, along with the number of respondents who were involved in each activity. No
respondents reported they helped plant bulbs around the area or specified any other project-related
activities in which they took part.
Table 4.1.15 Participation in Fitter for Walking project activities
Number of respondents
Street audit 1
Led walks 1
Made a walking pledge 1
Pledge to park more considerately 2
Helped clean streets 2
Finally, while no respondents indicated they would be willing to donate financially to help improve the
walking environment or provide walking focused activities, such as street audits, led walks and street
parties, two individuals indicated they would be willing to donate time to help with such activities.

Fitter for Walking Evaluation Report 83
4.2 CASE STUDY B: Byker Link, Newcastle
PROJECT SUMMARY
Local Authority: Newcastle
Byker Link
Location: Byker Link, Byker, Newcastle
Registered group: Friends of St Lawrence Park
Date of registration: October 2008
Date of completion: April 2010
The focus of this project is the Byker Link route which is a traffic-free pedestrian and cycle route within
the built up area of Byker, Newcastle. The main interests of the group were to improve the Byker Link for
pedestrians and encourage more people to visit St Lawrence Park on foot. The link is a main route to St
Lawrence Park, the Quayside, Shields Road (local high street) and a local leisure centre. The main barriers
to walking and use of the Byker Link identified by the group were the poor reputation of the area, a lack
of maintenance of the route and dog fouling. A community award and individual Fitter for Walking Award
were presented in June 2010. In 2011, Byker YMCA signed up as a secondary group to support the Friends
of St Lawrence Park with work on the Byker link.
Project activities
Street audit (December 2008)
Changes made to this route include:
- Removal of a smoking shelter which was blocking the route
- Installation of a display board at the start of the route
- New signage on the route
Other project activities have included:
- Community clean-up day (supported by Royal Navy volunteers and the council) (March 2009)
- Led walks
- Themed walks eg, bat walks (which were organised by the registered group without support from
the FFW co-ordinator);
- The secondary group were involved in planting, led walks and promoting the link as a walking route.
- A group was established to resolve the flooding problem on the link by diverting the water from the
path to nature ponds.

84 Fitter for Walking Evaluation Report
Examples of project activities
Clean up on the Byker Link with Royal Navy Volunteers

Fitter for Walking Evaluation Report 85
SUMMARY OF RESULTS
The project co-ordinator‟s and community members‟ views of this project are presented below. A summary
of the findings from the route user counts, intercept surveys and residents‟ surveys are also reported below,
followed by a detailed breakdown of results.
Project Co-ordinator’s views
The project co-ordinator was interviewed to ask about the background to the project and their experiences
of working with this community.
One of the strongest findings to come from the interviews with project co-ordinators in this area was the
extent to which they had challenges in working with the LA. It seemed that the initial response to the
project was very lukewarm from the LA and there were real and practical problems in getting things done –
such as waiting months for as response that should have come in a few days. But the communication issues
led to some groups disengaging from the project.
…it was a very frustrating scenario and it cut off a lot of groups that I work with… just went, „well that‟s just a waste of time‟ and that‟s how projects fall down, just over little things like that and people just think, „well I can‟t access council services‟ because this hasn‟t worked. It was not a good indictment I‟m afraid.
Project Co-ordinator, North East
Co-ordinators eventually managed to get engagement in the project from people higher up in the council,
which unlocked things to some extent. Dog dirt was a particular issue on the path and it was a major
achievement to get the council to take this seriously and to start regular waste collections, and to organize
a major clean-up day.
I couldn‟t have organised a clean-up day of that scale myself because there was like 30 nearly volunteers, maybe 15 Council staff, fans, press and everybody was fed as well in the Council canteen and a minibus there and back so, you know, they did do quite a lot for that.
Project Co-ordinator, North East
Once that hurdle had been cleared, a major issue then became persuading the local community – including
local walking groups – that the path was clean and tidy and safe to use. Persuading people to use the space
at night also became an issue, as it had become known for anti-social behaviour.
…dog poo was a problem, we‟ve sorted it. Now please feel like you can come and use the space and be part of it and be part of that process as well.
Project Co-ordinator, North East
This was achieved through led walks and some innovative promotions such as „Bat Walks‟ – walking at dusk
to spot bats. Also the co-ordinator was successful in getting the local waking group to pledge to use the
route again after it had been cleaned.

86 Fitter for Walking Evaluation Report
In spite of these challenges, the co-ordinators felt they had achieved a great deal and that the community
had actually benefited from learning how to circumnavigate the council bureaucracy.
Community members’ views
For members of the local community, the Byker link was a facility that had been neglected for many years
but offered great potential for people to enjoy walking and cycling in the local area, and for accessing St
Lawrence Park.
…the Byker Link because it‟s such a wonderful facility and it had just been falling to rack and ruin really which limits people being able to come down to the park a bit more because kids, families and so on just weren‟t interested in using it or using the park at the time…
Community member, Byker
Many previous attempts had been made by members of the local community to do something to sort out the
area but they reported facing many obstacles from the LA, such as being passed from one department to
the other just to clear up dog mess. This was particularly frustrating for the community as they had made
great strides in improving the park, but the access routes were still unattractive for walking.
And we‟ve created this marvelous play area and improvements in the park and yet to get there was an absolute... It was awful the Byker Link...
Community member, Byker
The FFW project therefore offered a good opportunity to do something positive with the area, to improve
access to the improved park, and to make stronger links with the local community. The project was
deemed to have been very successful in this respect, through community clean-ups and removal of dog
mess. As a result of the project, the LA also appears to be more responsive to feedback from the
community and the community indicated that they feel more confident in approaching the LA to address
local issues.
Fitter for Walking and the St. Lawrence got together and we‟ve had a few clean-ups and now when you ring… after about twenty minutes telling them exactly where it is and how to get onto it...they will come along.
Community member, Byker
…you don‟t feel as though you‟ve got any right to complain about them or you don‟t know that they‟re legal or whatever but I think now we would question something if something suddenly appeared, you know, or they started digging up a pavement or whatever. It would be questioned now and so that‟s given us a kind of confidence to not just to take what‟s given to you or what just suddenly appears one day.
Community member, Byker

Fitter for Walking Evaluation Report 87
Route user counts, route user surveys and residents’ surveys
Route user counts were conducted on the route at baseline (May 2010), 12 months (May 2011) and 16
months (September 2011). Route user intercept surveys were conducted simultaneously on the first two
occasions (May 2010 and May 2011). Counts and surveys were conducted over two days on each occasion,
one week day and one weekend day for 12 hours on each day. At baseline 38 route users participated in
the intercept survey with 53 respondents taking part at the 12 month survey.
In addition a survey was conducted with a small number of residents living within one mile of the route.
Only 14 residents responded to the survey, therefore the results from the residents‟ surveys should be
interpreted with caution due to the low response rates.
Full methods are reported in Chapter 2.
Barriers to walking
At baseline respondents to the route user survey highlighted two improvements that were required to
encourage walking on the project route including: clearance of rubbish/glass (45%) and clearance of dog
mess (76%). At follow-up after the project improvements had been made, there was a reduction in the
proportion of respondents reporting that improvements were needed to address these issues suggesting that
some of the barriers to walking in the area have been removed during the FFW project.
Project awareness and participation
Few route users had heard of Living Streets (3%) or the FFW project (5%) at baseline. A larger proportion
had heard of both at follow-up (21% and 17%, respectively). Respondents reported being aware of the
following improvements that had been made to the area: clearance of rubbish/glass (26%), removal of
overgrown hedges (19%) and clearance of dog mess (13%).
Few respondents to the residents‟ survey were aware of any changes to the area. Only three respondents
thought the dog mess had been cleared, new bulbs had been planted and clearer information/signage was
installed. Similarly, few respondents participated in any FFW project activities: street audit (n=3), helped
plant bulbs (n=3) and helped clean streets (n=3).
Community cohesion
Route user survey data at follow-up indicated that two thirds of respondents felt there was a sense of
community in their neighbourhood, other residents are willing to help each other, and people get along.
Walking & route use
The route user counts show that use of the route along the Byker Link route by pedestrians appears to have
increased since the improvements were made to the area. Overall, there were 14% more walkers in May
2011 and 59% more in September 2011 than at baseline (May 2010). The route was largely used by adults
between the ages of 16-59 year with only a small proportion of older adults (<10%) using the route. At
88 Fitter for Walking Evaluation Report
baseline a higher proportion of respondents were using the route on a week day than a weekend day
however the reverse was true at the first follow-up (May 2011). Route use was the same across the week
day and weekend day at follow-up 2 (September 2011).
Route user survey data showed that for a high proportion of survey respondents walking was the only mode
of transport being used for their journey (62% at baseline and 93% at follow-up). Most respondents reported
they were either out for a recreational walk or were travelling home. Respondents‟ mean journey duration
decreased by 20 minutes between baseline and follow-up. There was a 20% reduction in respondents using
the route on a daily basis between baseline and follow-up however use on a weekly basis increased by 19%.
At follow-up respondents agreed that the factors influencing their decision to travel actively (walk or cycle)
on the route included: adding to their daily exercise (91%), the possibility to go straight to their destination
(87%), it‟s the most convenient route (81%) and pleasant surroundings on the route (79%). A high proportion
(>89%) of respondents to the route user surveys thought the route was safe in regards to surface quality and
exposure to other people and traffic at both baseline and follow-up.
A small proportion of respondents to the route user survey reported they had used the route more in the
last 12 months (15%). However, there was a 14% decrease in those who intended to walk more in the next
12 months and an 8% decrease in those who were likely to walk more.
Over half of the respondents to the residents survey agreed they had increased the amount of walking (n=10)
they do for short journeys around their neighbourhood in the last 12 months. The reason given for this
increase was an improved knowledge of the area. A small proportion of residents indicated they had
undertaken more journeys for the purpose of: personal business (31%), to get to public transport (17%),
travel to social activities (33%) or leisure facilities (17%) over the last 12 months. The perceived benefits of
using the route included: increase physical activity level, feeling fitter and healthier and increased
community satisfaction. Two thirds of respondents agreed they had seen more people walking around their
neighbourhood and they themselves had found new places to walk in the last 18 months, while half of the
respondents had found new walking route and thought the route felt safer.
Health and well-being
The increases in walking observed in this project are likely to lead to benefits for health and well-being in
the longer-term; however it was not possible to measure changes in health and well-being as part of this
evaluation.
Overall comments
This project tackled issues on an important local walking route which had been neglected for a number of
years. A number of improvements were made including making the path clean and tidy to use and a wide
range of promotional activities were undertaken to encourage local people back into the area and to use
the route in the day and night time. This appears to have been successful as there was an increase in use
of the route by pedestrians at the last follow-up measurement.

Fitter for Walking Evaluation Report 89
RESULTS
4.2.1 Route User Perspectives
Route user counts were conducted on three occasions commencing in May 2010 (baseline) and repeated
after 12 months (follow-up 1), and 16 months (follow-up 2). At each time point the counts took place over
two days, one week day and one weekend day. The weather on the days when the counts and surveys took
place varied (Table 4.2.1). Route user intercept surveys took place on two occasions: baseline and follow-
up 1. No incidents were reported by the surveyor which may have affected the route user surveys or counts.
Methods are reported in full in Chapter 2.
Table 4.2.1 Dates, days and weather for route user counts and surveys
Dates Days Weather
Baseline 15 May 2010 Saturday Warm and mostly dry all day.
18 May 2010 Tuesday Warm and mostly dry all day.
Follow-up 1 14 May 2011 Saturday
Cold and mostly dry until 10am, warm for the remainder of the day with some showers between 1-2pm.
17 May 2011 Tuesday Warm and mostly dry all day.
Follow-up 2# 8 Sept 2011 Thursday Cold and dry until 10am, then warm and dry for the remainder of the day.
10 Sept 2011 Saturday Mainly damp and overcast until 11am, warm for most of the rest of day with some showers between 2.30-3pm and 6.30-7pm.
#Count only (no survey)

90 Fitter for Walking Evaluation Report
4.2.1.1 Route user counts
A. Characteristics of route users
Table 4.2.2 shows the proportion of route users by age category and gender. Adult males represented the
highest proportion of those using the route across the three time points. Older adults accounted for the
lowest proportion of route users.
Table 4.2.2 Route user characteristics by age and gender at baseline and follow-up
Baseline Follow-up 1 Follow-up 2
% % %
Minor (age 0-15) 20.5 14.6 7.9
Adult Male (age 16-59) 56.2 58.9 47.8
Adult Female (age 16-59) 20.5 24.8 33.0
Older Male (age 60+) 0.4 0.8 9.1
Older Female (age 60+) 2.4 0.8 2.2
B. Route Use
Overall 249 individuals used the route at baseline. This included walkers, cyclists, wheelchair users,
joggers and infants in pushchairs. At follow-up 1 route use decreased by 1%, however at follow-up 2 a 28%
increase in route use was observed compared to baseline. Route use on week and weekend days varies
across the three survey periods (Figure 4.2.1).
Figure 4.2.2 shows route use for pedestrians only. At baseline 129 pedestrians used the route over the two
day survey period. Route use by pedestrians increased by 14% at follow-up 1 and 59% at follow-up 2
compared to baseline. These increases in pedestrian traffic were seen on the weekend day at follow-up 1
and on both week and weekend days at follow-up 2.
Figure 4.2.1 Number of route users (all modes of travel) at baseline and follow-up
249 246
318
149
107
159
100
139 159
0
50
100
150
200
250
300
350
Baseline Follow-up 1 Follow-up 2
Num
ber
of
indiv
iduals
Total Week day Weekend day

Fitter for Walking Evaluation Report 91
Figure 4.2.2 Number of route users (pedestrians only) at baseline and follow-up
4.2.2.2 Route User Intercept Surveys
A. Response rates
Route user intercept surveys were conducted twice during the project: at baseline and 12 months (follow-
up). Table 4.2.3 shows the number of individuals who completed the survey at each time point, the
number of individuals who declined to participate and the most frequently cited reasons for not
participating.
Table 4.2.3 Route user survey responses
Surveys completed
(n)
Surveys declined
(n)
Response rate (%)
Main reasons for declining
Baseline Saturday 15 May 2010
Tuesday 18 May 2010 38 60 39
Refused (66.7%)
In a hurry (30.0%)
Already interviewed (3.3%)
Follow-up 1 Saturday 14 May 2011
Tuesday 17 May 2011 53 53 50
Refused (45.3%)
Already interviewed (15.1%)
Communication difficulties (13.2%)
B. Respondent characteristics
The characteristics of respondents surveyed at each time point are shown in Table 4.2.4. At baseline there
was a similar response rate from males and females, but at follow-up a higher proportion of males than
females took part in the survey. The highest proportions of respondents were aged 55-64 at baseline and
aged 35-44 at follow-up. At both survey points, almost all respondents were of white ethnic background
and the greatest proportion of respondents indicated that they were in full-time employment. Just over
129
147
205
73 60
103
56
87
102
0
50
100
150
200
250
Baseline Follow-up 1 Follow-up 2
Num
ber
of
indiv
iduals
Total Week day Weekend day
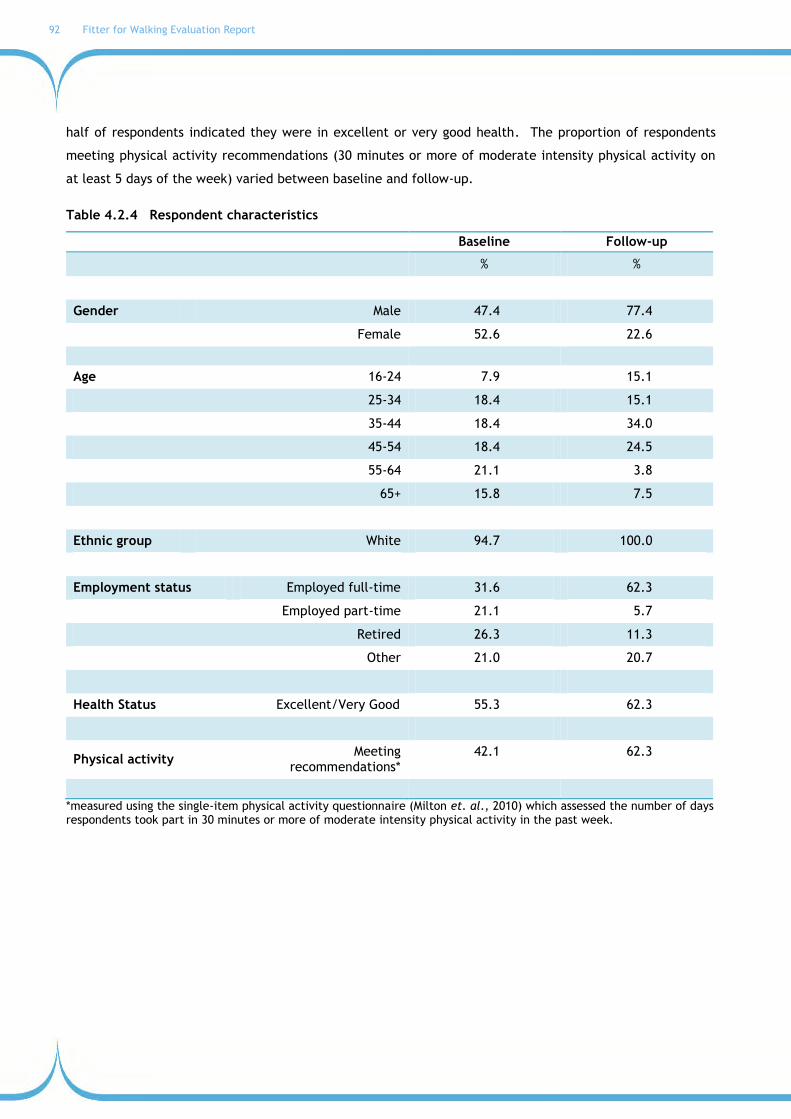
92 Fitter for Walking Evaluation Report
half of respondents indicated they were in excellent or very good health. The proportion of respondents
meeting physical activity recommendations (30 minutes or more of moderate intensity physical activity on
at least 5 days of the week) varied between baseline and follow-up.
Table 4.2.4 Respondent characteristics
Baseline Follow-up
% %
Gender Male 47.4 77.4
Female 52.6 22.6
Age 16-24 7.9 15.1
25-34 18.4 15.1
35-44 18.4 34.0
45-54 18.4 24.5
55-64 21.1 3.8
65+ 15.8 7.5
Ethnic group White 94.7 100.0
Employment status Employed full-time 31.6 62.3
Employed part-time 21.1 5.7
Retired 26.3 11.3
Other 21.0 20.7
Health Status Excellent/Very Good 55.3 62.3
Physical activity Meeting
recommendations* 42.1 62.3
*measured using the single-item physical activity questionnaire (Milton et. al., 2010) which assessed the number of days respondents took part in 30 minutes or more of moderate intensity physical activity in the past week.
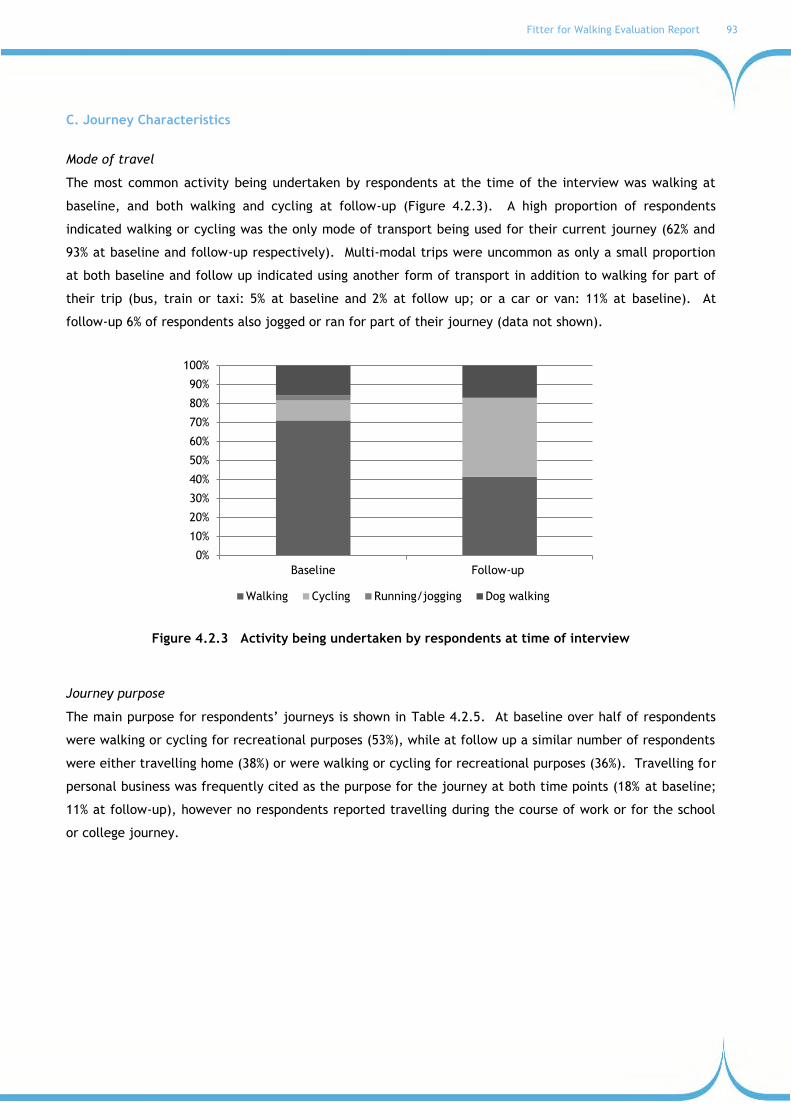
Fitter for Walking Evaluation Report 93
C. Journey Characteristics
Mode of travel
The most common activity being undertaken by respondents at the time of the interview was walking at
baseline, and both walking and cycling at follow-up (Figure 4.2.3). A high proportion of respondents
indicated walking or cycling was the only mode of transport being used for their current journey (62% and
93% at baseline and follow-up respectively). Multi-modal trips were uncommon as only a small proportion
at both baseline and follow up indicated using another form of transport in addition to walking for part of
their trip (bus, train or taxi: 5% at baseline and 2% at follow up; or a car or van: 11% at baseline). At
follow-up 6% of respondents also jogged or ran for part of their journey (data not shown).
Figure 4.2.3 Activity being undertaken by respondents at time of interview
Journey purpose
The main purpose for respondents‟ journeys is shown in Table 4.2.5. At baseline over half of respondents
were walking or cycling for recreational purposes (53%), while at follow up a similar number of respondents
were either travelling home (38%) or were walking or cycling for recreational purposes (36%). Travelling for
personal business was frequently cited as the purpose for the journey at both time points (18% at baseline;
11% at follow-up), however no respondents reported travelling during the course of work or for the school
or college journey.
0%
10%
20%
30%
40%
50%
60%
70%
80%
90%
100%
Baseline Follow-up
Walking Cycling Running/jogging Dog walking

94 Fitter for Walking Evaluation Report
Table 4.2.5 Journey purpose
Baseline Follow-up
% %
Home 13.2 37.7
Recreational activity* 52.6 35.8
Work 10.5 9.4
Personal business / shopping 18.4 11.3
Social / entertainment 0.0 3.8
Recreation (sport and leisure) 5.3 1.9
*the respondent was just going for a walk or cycle ride around the local area for health, fitness or leisure, there was no specific destination
Journey duration and distance
Respondents were asked about the duration of their journey on foot or by bicycle (depending on which
mode they were using at the time of the survey). Mean journey duration decreased between baseline and
follow-up for both walking and cycling (Table 4.2.6).
Table 4.2.6 Journey duration on foot / by bike
Baseline Follow-up
Mean minutes ±SD Mean minutes ±SD
Walking 50.2 ±46.1 29.9 ±25.0
Cycling 165.0 ±57.4 64.2 ±75.1
Frequency of journey
Respondents were asked how frequently they completed their current journey (Figure 4.2.4). Over 60% of
respondents at baseline reported they completed the walking journey on a daily basis. At follow-up there
was a reduction in use of the route on a daily basis, with a corresponding increase in route use on a weekly
basis. Only a small proportion of respondents indicated they completed their current journey once a year
or less (6% at both baseline and follow-up). Overall a significant change was observed in journey frequency
between baseline and follow-up measurements.

Fitter for Walking Evaluation Report 95
Figure 4.2.4 Frequency of current route use by respondents
D. Characteristics of route use
Frequency of route use during the day and night
A high proportion of respondents reported using the route daily or weekly during the day time at baseline
and follow-up but there was a 15% decrease in daily route use between baseline and follow-up (Figure
4.2.5). There was no significant change in the frequency of route use during the day time between the two
measurements.
Figure 4.2.5 Proportion of respondents using the route in the daytime
At baseline almost 50% of respondents reported using the route at night time on a daily or weekly basis,
whereas this proportion decreased at follow up with just under a third of respondents reporting this
frequency of use (Figure 4.2.6). A significant change in route use was observed at night time between
baseline and follow-up.
61.1
27.8
5.6 5.6
41.5
47.2
5.7 5.7
0
10
20
30
40
50
60
70
Daily Weekly Monthly Yearly
% o
f re
spondents
Baseline Follow-up
73.7
18.4
0
7.9
58.5
30.2
3.8
7.5
0
10
20
30
40
50
60
70
80
Daily Weekly Monthly Yearly
% o
f re
spondents
Baseline Follow-up

96 Fitter for Walking Evaluation Report
Figure 4.2.6 Proportion of respondents using the route in the night time
Route use in the last 7 days
Respondents were asked on how many days in the past week they had used the route. Frequency of route
use decreased between baseline and follow-up (Figure 4.2.7). At baseline 45% of respondents used the
route on 5-7 days a week, whereas only 38% reported using it this often at follow-up. Similarly, at baseline
29% of respondents reported using the route on 3-4 days in the past week, while at follow-up only 21%
reported this level of usage. There was no significant change in the number of days of route use between
baseline and follow-up.
Figure 4.2.7 Route use over the past seven days
36.8
10.5
0.0
52.6
7.5
22.6
3.8
66.0
0
10
20
30
40
50
60
70
Daily Weekly Monthly Yearly
% o
f re
spondents
Baseline Follow-up
26.3
28.9
44.7
41.5
20.8
37.7
0
10
20
30
40
50
0-2 Days 3-4 Days 5-7 Days
% o
f re
spondents
Baseline Follow-up

Fitter for Walking Evaluation Report 97
Factors influencing route use
Respondents were asked a set of questions regarding which factors influenced their decision to use this
particular route for their journey (Table 4.2.7). At baseline and follow-up 66% agreed that active travel
provided the best mode of transportation. A higher proportion of respondents at follow-up agreed this route
allowed them to go straight to their destination and the respondents chose active travel because of
environmental concerns. While respondents‟ perception of route safety decreased between baseline (92%)
and follow-up (72%), more people had a positive view of surroundings (55% and 79%, baseline and follow-up
respectively).
Table 4.2.7 Factors influencing respondents’ decision to use active travel for their journey
Baseline Follow-up Sig.
% agree/strongly
agree
% agree/strongly
agree
Can go straight to destination 65.8 86.8 *
Best transport option 65.8 65.8 NS
Most convenient route 76.3 81.1 *
Save money by using this route 65.8 71.7 NS
Like the surroundings on this route 55.3 79.2 #
Route feels safe 92.1 71.7 #
This is the only exercise I get 52.6 11.3 #
Using this route adds to the exercise I get 57.9 90.6 #
Environmental concerns 47.4 60.4 #
*p<0.05 #p<0.01 NS=not significant
When asked about route safety in relation to exposure to other people, exposure to traffic and surface
quality, around 90% of respondents thought the route was safe in these regards (Figure 4.2.8). At follow-up
a slight decrease was noted in the proportion of respondents who agreed that the surface quality was safe,
while for safety in relation to exposure to other people and traffic there was a slight increase in agreement.
These changes were not statistically significant.

98 Fitter for Walking Evaluation Report
Figure 4.2.8 Perceptions of route safety
Improvements needed to encourage use of route
Respondents were asked which specific improvements would help to encourage use of the route (Table
4.2.8). At baseline 45% respondents thought rubbish and glass needed to be cleared, whereas only 26%
cited this as a necessary improvement at follow-up. Likewise, 76% of respondents indicated that dog mess
needed to be cleared at baseline, but less than 2% thought this was the case at follow-up. This may be a
reflection of the project activities which have taken place between baseline and follow-up.
Table 4.2.8 Improvements needed to encourage use of route
Baseline Follow-up
% yes % yes
Clearance of rubbish/ glass 44.7 26.4
Clearance of dog mess 76.3 1.9
Clearance of graffiti 2.6 3.8
Clearer information / signage 5.3 20.8
Improved lighting 2.6 0.0
Resurfacing of path ND 43.4
Wider path or pavement 10.5 7.5
Removal of overgrown hedges 5.3 9.4
Improved crossings 0.0 3.8
Dropped kerbs installed 2.6 1.9
20 mph speed limit 5.3 0.0
Planting of new bulbs 2.6 5.7
ND=no data
92.1
89.5
94.7
88.7 90.6
96.2
75
80
85
90
95
100
Surface quality Exposure to other people Exposure to traffic
% o
f re
spondents
Baseline Follow-up

Fitter for Walking Evaluation Report 99
Perceived change in route use
A high proportion of respondents indicated over the last 12 months there had been no change in the amount
they had used the route (Figure 4.2.9). At follow-up 15% of respondents thought they had used the route
more and only a small proportion (9%) indicated they had used the route less.
Figure 4.2.9 Perceived change in route use over the last 12 months
E. Project Awareness
Respondents were asked about their awareness of Living Streets and the FFW project. Respondents were
more familiar with both Living Streets and the FFW project at follow-up (Figure 4.2.10). At baseline 8% of
respondents were members of the Friends of St Lawrence Park group; at follow-up 17% of respondents were
members of a local resident or community action group (data not shown).
Figure 4.2.10 Respondents’ organisational and project awareness
15.1
75.5
9.4
0
10
20
30
40
50
60
70
80
More About the same Less
% o
f re
spondents
2.6
5.3
20.8
17.0
0
5
10
15
20
25
Heard of Living Streets Heard of Fitter for Walkingproject
% o
f re
spondents
Baseline Follow-up

100 Fitter for Walking Evaluation Report
When asked about their awareness of improvements on the route through the route at baseline and follow-
up, the main improvements cited were: clearance of rubbish/glass, clearance of dog mess, and removal of
overgrown hedges (Table 4.2.9).
Table 4.2.9 Respondents’ awareness of improvements to route
Baseline Follow-up
% yes % yes
Clearance of rubbish/ glass 63.2 26.4
Clearance of dog mess 42.1 13.2
Clearance of graffiti 0.0 1.9
Clearer information / signage 5.3 0.0
Improved lighting 13.2 7.5
Resurfacing of path 5.3 5.7
Wider path or pavement 21.1 3.8
Removal of overgrown hedges 13.2 18.9
Improved crossings 0.0 1.9
Planting of new bulbs 2.6 0.0
F. Walking for travel and physical activity
Walking for travel
The proportion of respondents walking for travel on 5-7 days in the past week increased between baseline
and follow-up though this was not significant (Table 4.2.10). Mean minutes of walking for travel undertaken
by respondents in the past week significantly increased between baseline and follow-up (Table 4.2.10).
Table 4.2.10 Total walking for travel in the past week
Baseline Follow-up
Mean minutes ±SD Mean minutes ±SD
Duration of walking for travel 224.1 ±185.1 367.0 ±347.7#
Frequency of walking for travel % yes % yes
0-2 days 21.6 22.6
3-4 days 24.3 15.1
5-7 days 54.1 62.3
#p<0.01
At baseline respondents most frequently reported walking for journeys to the shops (37%), to and from work
(21%) and to leisure or sports facilities (50%) (Figure 4.2.11). Increases in walking trips were reported
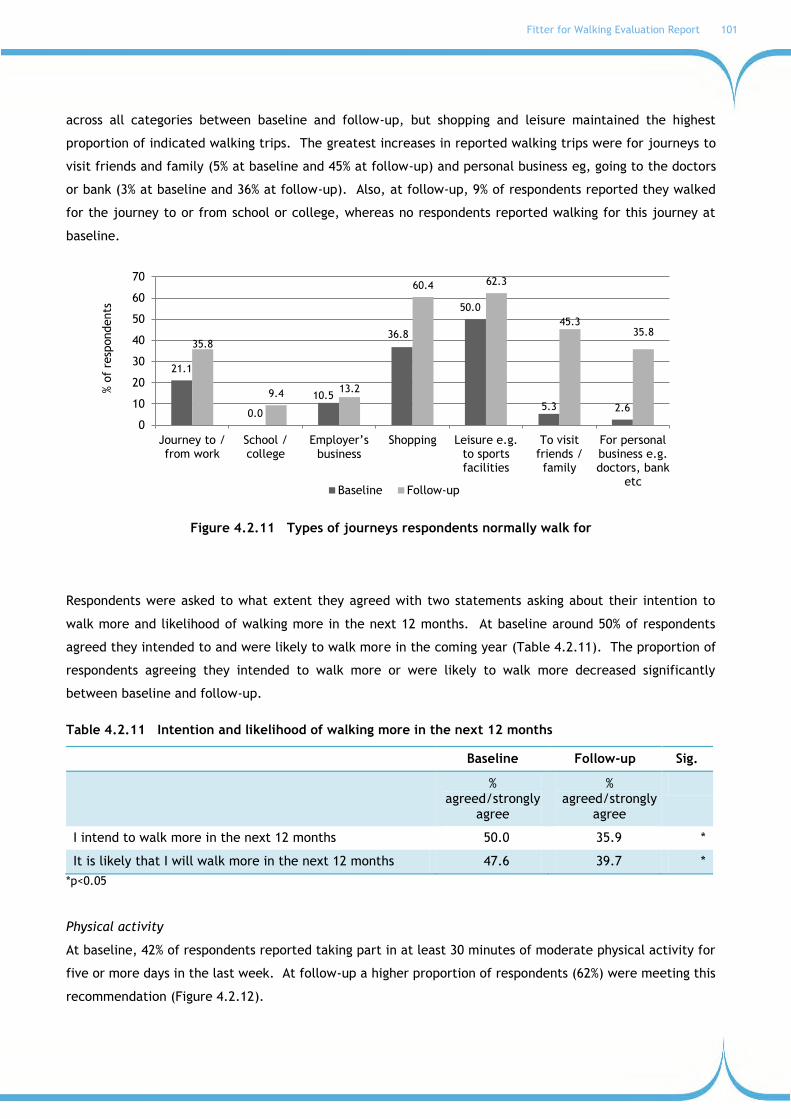
Fitter for Walking Evaluation Report 101
across all categories between baseline and follow-up, but shopping and leisure maintained the highest
proportion of indicated walking trips. The greatest increases in reported walking trips were for journeys to
visit friends and family (5% at baseline and 45% at follow-up) and personal business eg, going to the doctors
or bank (3% at baseline and 36% at follow-up). Also, at follow-up, 9% of respondents reported they walked
for the journey to or from school or college, whereas no respondents reported walking for this journey at
baseline.
Figure 4.2.11 Types of journeys respondents normally walk for
Respondents were asked to what extent they agreed with two statements asking about their intention to
walk more and likelihood of walking more in the next 12 months. At baseline around 50% of respondents
agreed they intended to and were likely to walk more in the coming year (Table 4.2.11). The proportion of
respondents agreeing they intended to walk more or were likely to walk more decreased significantly
between baseline and follow-up.
Table 4.2.11 Intention and likelihood of walking more in the next 12 months
Baseline Follow-up Sig.
% agreed/strongly
agree
% agreed/strongly
agree
I intend to walk more in the next 12 months 50.0 35.9 *
It is likely that I will walk more in the next 12 months 47.6 39.7 *
*p<0.05
Physical activity
At baseline, 42% of respondents reported taking part in at least 30 minutes of moderate physical activity for
five or more days in the last week. At follow-up a higher proportion of respondents (62%) were meeting this
recommendation (Figure 4.2.12).
21.1
0.0
10.5
36.8
50.0
5.3 2.6
35.8
9.4 13.2
60.4 62.3
45.3 35.8
0
10
20
30
40
50
60
70
Journey to /from work
School /college
Employer‟s business
Shopping Leisure e.g.to sportsfacilities
To visitfriends /family
For personalbusiness e.g.doctors, bank
etc
% o
f re
spondents
Baseline Follow-up

102 Fitter for Walking Evaluation Report
Figure 4.2.12 Proportion of respondents meeting physical activity recommendations
G. Community cohesion
Respondents were asked whether they agreed or disagreed with a set of statements regarding the
community in the neighbourhood in which they lived (Table 4.2.12). Data were only collected at follow-up.
Two thirds of respondents agreed that there is a sense of community (64%), people are willing to help (68%)
and people get along with each other (64%). Correspondingly, 59% of respondents agreed that people are
willing to work together to improve the local area.
Table 4.2.12 Perceptions of community cohesion*
Follow-up
% strongly agree/agree
There is a sense of community 64.2
People are willing to help each other 67.9
People get along with each other 64.2
People share the same values 41.5
People are willing to work together to improve the local area 58.5
*these questions were not asked at baseline for this project
0%
10%
20%
30%
40%
50%
60%
70%
80%
90%
100%
Baseline Follow-up
% o
f re
spondents
Meeting recommendations Not meeting recommendations

Fitter for Walking Evaluation Report 103
4.2.1 Residents’ survey
Surveys were distributed to 200 household situated within a one mile radius of the route where the FFW
project activities had taken place. An adult member of the household was asked to complete and return the
survey. A total of 14 surveys were returned, all respondents completing the paper version of the survey,
giving a response rate of 7%. The key findings from the survey are outlined below; however these should be
interpreted with caution given the low response rate.
A. Respondent characteristics
The key characteristics of respondents are reported in Table 4.2.13. Of those who returned the survey, a
higher proportion were female (71%) and the mean age of respondents was 51 years. Almost all
respondents were white (93%), and 23% had no formal qualifications. Over three quarters of respondents
(79%) reported their health to be excellent or good, and 50% reported meeting physical activity
recommendations (participating in 30 minutes of moderate intensity physical activity on five or more days
of the week). Just over half of respondents had at least one car (55%).
Table 4.2.3 Respondent characteristics
%
Sex Male 26.8
Female 71.4
Ethnic group White 92.9
Other 7.1
Education qualifications Degree 53.8
A level/BTEC Higher 15.4
GCSE/BTEC National 7.7
No formal qualifications 23.1
Number of vehicles in household 0 45.5
1 54.5
2 0.0
Health status Excellent/Good 78.6
Physical activity Meeting recommendations* 50.0
Mean ±SD
Age Mean age (years ±SD) 51.4±19.5
BMI Mean BMI (kg/m2 ±SD) 23.2±3.9 *measured using the single-item physical activity questionnaire (Milton et. al., 2010) which assessed the number of days respondents took part in 30 minutes or more of moderate intensity physical activity in the past week.
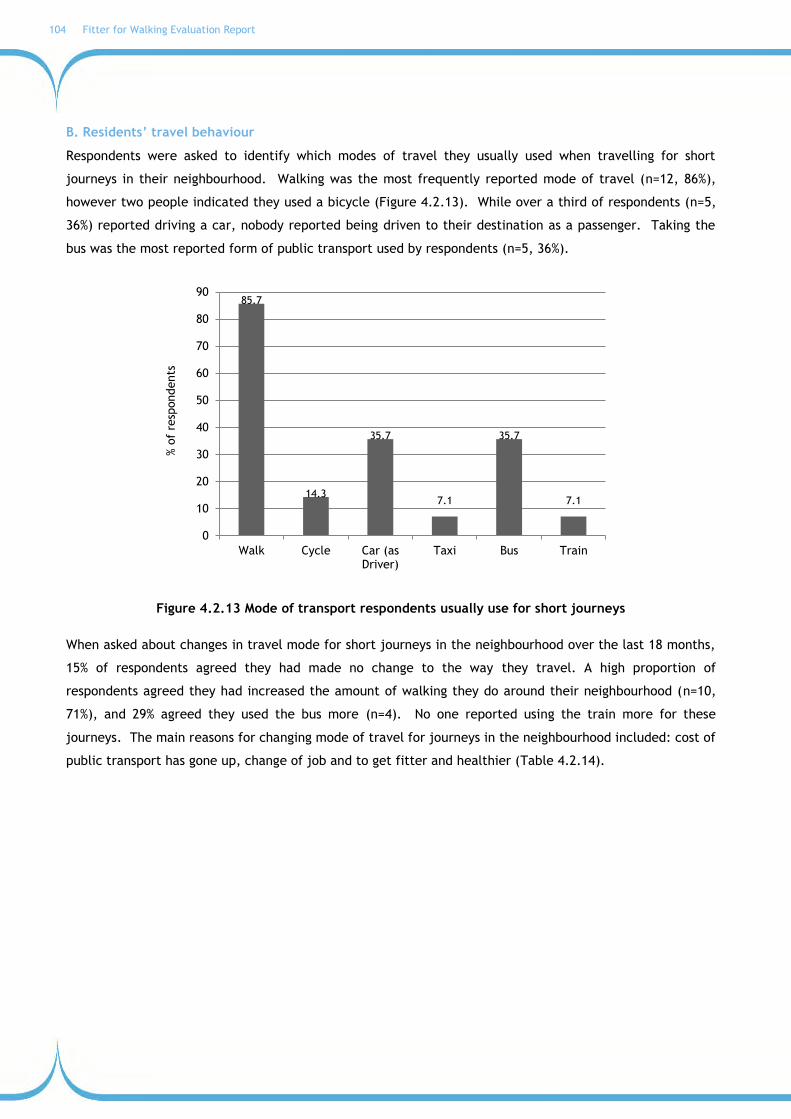
104 Fitter for Walking Evaluation Report
B. Residents’ travel behaviour
Respondents were asked to identify which modes of travel they usually used when travelling for short
journeys in their neighbourhood. Walking was the most frequently reported mode of travel (n=12, 86%),
however two people indicated they used a bicycle (Figure 4.2.13). While over a third of respondents (n=5,
36%) reported driving a car, nobody reported being driven to their destination as a passenger. Taking the
bus was the most reported form of public transport used by respondents (n=5, 36%).
Figure 4.2.13 Mode of transport respondents usually use for short journeys
When asked about changes in travel mode for short journeys in the neighbourhood over the last 18 months,
15% of respondents agreed they had made no change to the way they travel. A high proportion of
respondents agreed they had increased the amount of walking they do around their neighbourhood (n=10,
71%), and 29% agreed they used the bus more (n=4). No one reported using the train more for these
journeys. The main reasons for changing mode of travel for journeys in the neighbourhood included: cost of
public transport has gone up, change of job and to get fitter and healthier (Table 4.2.14).
85.7
14.3
35.7
7.1
35.7
7.1
0
10
20
30
40
50
60
70
80
90
Walk Cycle Car (asDriver)
Taxi Bus Train
% o
f re
spondents

Fitter for Walking Evaluation Report 105
Table 4.2.14 Reasons for changes in travel behaviour in the last 18 months by travel modes
Walk Cycle
Car (as driver)
Bus
n n n n
Agree/strongly agree to increased use of mode 10 2 1 4
Reason for change in mode:
Cost of petrol has gone up 1 0 0 1
Cost of public transport has gone up 4 0 1 0
Change of job 2 1 1 0
Change of income 3 0 0 0
Moved house 2 1 0 0
Bought a new car 1 0 0 0
No longer have a car 1 0 0 0
Knowledge of area improved 2 1 0 0
To get fitter and healthier 4 0 0 1
C. Residents’ route use
The greatest proportion of respondents reported using the route either two (n=3, 27%) or four (n=3, 27%)
times a week. A further 18% (n=2) reported using the route eight or more times a week. The remaining
respondents reported single weekly use (n=1), five trips per week (n=1) or seven trips per week (n=1) (data
not shown).
The greatest proportion of respondents indicated they currently use the route more frequently for journeys
for personal business (n=4, 31%) and social activities (n=4, 33%) than they did 18 months ago. The greatest
decrease in route use over the last 18 months was reported for commuting to work (n=3, 25%), and no one
reported using the route less to get to public transport or for recreation or fitness purposes (Figure 4.2.14).
Figure 4.2.14 Use of route compared to 18 months ago reported by journey purpose
8.3 8.3
0.0
30.8
16.7
33.3
16.7
8.3
16.7 18.2
38.5
25.0
16.7
25.0 25.0
8.3 9.1 7.7
0.0
8.3
0.0 0
10
20
30
40
50
Workcommute
Business-related
trips
School/college Personalbusiness
To get topublic
transport
Social activites Recreationor fitness
% o
f re
spondnets
More Same Less

106 Fitter for Walking Evaluation Report
Of the respondents who reported using the route (n=11), 55% perceived their levels of physical activity have
increased (n=6); 55% reported they feel healthier and fitter (n=6). No respondents reported using their car
less since starting to use the route, but two respondents indicated they have saved money (14%). Over a
third of respondents also reported since starting to walk along the route they have been visiting more local
shops (n=5, 36%), and similarly, 43% reported (n=6) they feel more satisfied with the neighbourhood (Figure
4.2.15).
Figure 4.2.15 Perceived benefits of route use
D. Perceived changes in the community
Respondents were asked to what extent they agreed with a set of statements relating to walking in their
neighbourhood over the last 18 months. Over two thirds of the respondents agreed they had seen more
people walking around their neighbourhood (n=9, 69%), and over half agreed they themselves had found
new walking routes (n=7, 54%). Furthermore, 62% of respondents (n=8) agreed they have discovered new
places to walk to and their neighbourhood has been more pleasant to walk around in the last 18 months. A
slightly smaller proportion of respondents agreed that over the last 18 months the neighbourhood has felt
safer (n=6, 46%). When asked about community involvement to help make the neighbourhood safer and
more attractive place to walk, 30% agreed (n=4) they had personally been involved in community activities
while 46% (n=6) believed other members of the community had been involved in activities. Half of
respondents agreed there was an increased sense of community (n=7, 54%), residents were more friendly
(n=7, 50%) and residents were more willing to help each other (n=6, 46%), but only 36% (n=5) thought
residents were more willing to work together.
E. Project awareness and participation
Respondents were asked which specific improvements or changes they have noticed along the project route
in the last 18 months. The main improvement reported by respondents was the clearance of rubbish or
glass around the area (n=6, 43%). A quarter of respondents also noted the path had been widened and new
42.9 42.9 42.9
35.7
14.3
42.9
35.7
0
10
20
30
40
50
IncreasedPA levels
Feelhealthier
Feelfitter
Lessstressed
Savemoney
Neighbourhoodsatisfaction
Visit localshops more
% o
f re
spondents

Fitter for Walking Evaluation Report 107
information boards and maps had been added to the area (n=4, 29%). Only one respondent cited being
aware of the clearance of graffiti and removal of overgrown hedges (Figure 4.2.16).
Figure 4.2.16 Number of participants aware of project activities and improvements
When asked about their awareness of Living Streets and the FFW project, a third of respondents indicated
they knew of the organisation (n=4, 36%) and of the project (n=4, 33%). Similarly, 36% (n=5) were also
aware of the award presented by Living Streets for efforts to improve the community walking environment
and get people walking.
Survey respondents reported little participation in the Fitter for Walking activities. The activities
respondents did participate in are listed in Table 4.2.15, along with the number of respondents who were
involved in each activity. The most popular activities respondents participated in were street audits,
planting bulbs and cleaning streets.
Table 4.2.15 Participation in Fitter for Walking project activities
Number of Respondents
Street audit 3
Led walks 2
Made a walking pledge 1
Helped plant bulbs 3
Helped clean streets 3
Had a street party 1
Other community activities 1
Finally, four respondents indicated they would be willing to donate time to help improve the walking
environment or provide walking focused activities, and one respondent additionally indicated they would be
3 3
2 2 2
3
6
0
1
2
3
4
5
6
7
Clearance ofdog mess
Clearerinfo/signage
Improvedlighting
Pathresurfacing
New droppedkerb
New bulbs Not aware ofchanges
Num
ber
of
resp
ondents

108 Fitter for Walking Evaluation Report
willing to donate financially. The time respondents indicated they would be willing to volunteer ranged
from one hour a week to one day a month.

Fitter for Walking Evaluation Report 109
4.3 CASE STUDY C: Bensham, Gateshead
PROJECT SUMMARY
Local Authority: Gateshead
Walking to School in Bensham
Location: Bensham, Gateshead
Registered group: Gateshead Jewish Nursery
Date of registration: May 2009
Date of completion: May 2010
The primary focus of this project is a safe route to a local school and nursery to encourage more pupils
and parents to leave the car at home and walk to school. Gateshead Jewish Nursery registered as the
primary group in May 2009. The main concerns of the group were narrow pavements, poorly sited street
furniture, no pedestrian crossing facilities and heavy traffic particularly at the start and end of the
school day. The target community are the Orthodox Jewish Community in Bensham and Saltwell and
other residents who use Alexandra Road to travel to the school, nursery, Matov Children's Centre, Jewish
Community Centre (Bewick Centre), Coatsworth Road shopping area and the Jewish colleges.
Project activities
Street audit (June 2009)
Changes made to this route include:
- A new pedestrian crossing and traffic calming scheme
Other project activities have included:
- Talks and meetings with parents and pupils to encourage walking to school using Living Streets‟
WOW (Walk Once a Week) tactics and FFW pledge cards
- An engagement and information sharing event was held at the Jewish Community Centre in
February 2010 which included FFW craft activities with children focussing on road safety and
walking; use of pledge cards; attended by representatives from Council Transport department,
Parking Enforcement, Neighbourhood Management and the Police.

110 Fitter for Walking Evaluation Report
Examples of project activities
Guard rail prior to FFW intervention
Guard rail and change in road layout after FFW intervention

Fitter for Walking Evaluation Report 111
SUMMARY OF RESULTS
The views of the project from the project co-ordinator and community members are presented below. A
summary of the findings from the route user counts are also reported below, followed by a detailed
breakdown of results.
Project Co-ordinator’s views
The project co-ordinator was interviewed to ask about the background to the project and their experiences
of working with this community.
From the co-ordinator‟s perspective, the Bensham project was something that was urgently needed. The
street audit had shown very clear problems of safety outside the school, caused by a combination of poor
safety infrastructure and bad driver behaviour. This need was clearly identified by the community, and
enabled the FFW co-ordinator to engage with the community, by focusing on a very tangible project:
… there was an issue of dangerous walking to school… it was a poor environment and… that was the opening they gave you so that‟s what you go for. After that we‟ve done the community events and the pledges and the fun stuff and they‟ve really enjoyed it but you just wouldn‟t have got the support from the hierarchy of the community if you hadn‟t done what you set out to do in the first
place
Project co-ordinator, North East
From the project co-ordinator‟s point of view, it seems that the Bensham project was particularly
challenging, as it involved detailed consultation with a community that does not generally get involved in
council business. For example this meant that the normal plans for a public event to give out an award and
seek publicity were not necessarily appropriate:
they‟re a very orthodox community, they‟re not keen on having their photos taken and they‟re not keen on wider publicity, so I‟m not sure what publicity we‟ll be able to negotiate about that, which is a shame because there‟s a lot of money gone into that scheme
Project co-ordinator, North East
However, this challenge turned into one of the project‟s greatest successes, as the project was very well
able to engage with the Jewish community, to win their trust and work with them to address the safety
issues.
I know that Gateshead were particularly impressed with the fact that we could work with the orthodox Jewish community in Gateshead because it‟s not something they had a lot of reason to get engaged with because it was an insular community so a project that opened them up a little bit, the Council immediately supported the recommendations and the audit, we got pretty much everything in place on a large scale capital scheme and thousands of pounds spent and I think that was, you know, as good for them as it was for us and the community, they were pleased to be involved as well.
Project co-ordinator, North East

112 Fitter for Walking Evaluation Report
While the project focused on the physical improvements to the street crossings, it seems that many of the
successes of the project were to do with strong community liaison and connections.
I think from the community‟s point of view, it‟s nearly always physical change… that‟s how the Jewish community view the success as being the improvements to the crossing… I might think well, it has improved relationships between the Council and the community and we‟ve got beneficiaries out of it or a pledge to walk more and we‟ve got people doing other things in that area like looking at the local park and how improvements could be made there. But I think mostly for the community, it is very simply about „is the walking route different?‟ And the rest are kind of incidental…
Project co-ordinator, North East
Community members’ views
The community members really brought home the concerns that they had about safety in this particular
location.
It is total chaos, cars going both ways, kids running in all directions, it‟s terrifying. Every time we‟ve stood here, we‟ve recorded what, five near misses each time?
The pavements are too narrow, there‟s barriers in the wrong places, the kids have to go in the road, people have to walk in the road, it‟s impossible. And the other thing that originally got me thinking was when we were talking about street furniture, and soon as we started talking about street furniture, we thought about this bit here where the street furniture is just ridiculous.
You have to be here, he came along here, there‟s this beautiful quiet street, you have to be here for 20 the minutes between ten to nine and ten past nine and it‟s just unbelievable.
Community members, Bensham
Because of the severity of the road safety concerns (and perhaps because of the close-knit nature of the
community) the project got very good community engagement. There was an issue explaining to people
that the project did not intend to close the street or make any draconian anti-car measures:
I think, at first, people were a little bit suspicious because they thought we were going to close off the street and make it pedestrian only and things like that, we needed to get the message it wasn‟t anti-car and we understand, we had to explain to people it‟s not anti-car and I have one myself. But no, I think the people were very keen, once they realised what was going on and that it wasn‟t anti-car, it was actually supporting making it safer for the kids….
Community member, Bensham
The co-ordinator had to overcome some objections from people who wanted to continue driving to the
school, and to explain that the more people walking, the safer the area would be. Pledge cards were used
and in some cases people filled this in to pledge to walk only if the improvements were made:
the people most noticed were the people who filled the pledge cards in and said well try walking to kinder once a week or we‟ll walk to school once a week. And a lot of them put

Fitter for Walking Evaluation Report 113
the disclaimer on „once the improvements…‟ which I think is really good because that‟s like the bargaining chip that will be used all the time.
In the end the project galvanized action from right across the community, including the schools; the Jewish Community Council; the road safety team from the Council, parking; planning; Children‟s Centre; and the roads department.
Community member, Bensham
Finally the project got involved with a range of promotional activities:
But effectively, you‟ve got walking buses, sort of ad hoc walking buses, there‟s groups of friends coming together and mothers coming with neighbour‟s kids as well and things.
Community member, Bensham
Route user counts
Route user counts were conducted on the route at baseline (May 2010) and repeated in May 2011 (follow-
up). Counts were conducted over two days on each occasion, one week day and one weekend day for 12
hours on each day. No route user surveys or residents‟ surveys were conducted in this project.
Full methods are reported in Chapter 2.
Walking & route use
The route user counts show that use of the route around the Gateshead Jewish Nursery by pedestrians
appears to have increased since the improvements were made to the area. Overall, in May 2011 there were
16% more walkers than at baseline (May 2010). The route was largely used by children and adults females
under the age of 60 with only a small proportion of older adults (<5%) using the route. While route use was
higher on week days at both baseline and follow-up, the difference between use on a week day and use of a
weekend day decreased at follow-up.
Overall comments
This project addressed a concern around the safety of children travelling to the local school, in particular
the high volume of traffic at the school gate as well as problems with narrow pavements, poorly cited
street furniture and a lack of pedestrian crossings. These problems were successfully addressed through
the project. Environmental improvements were made and a number of promotional activities delivered to
help the community understand the importance of walking, rather than using the car, for their children‟s
journey to school. There was a clear increase in pedestrian use around the area where the improvements
were made on a weekday and a weekend day.
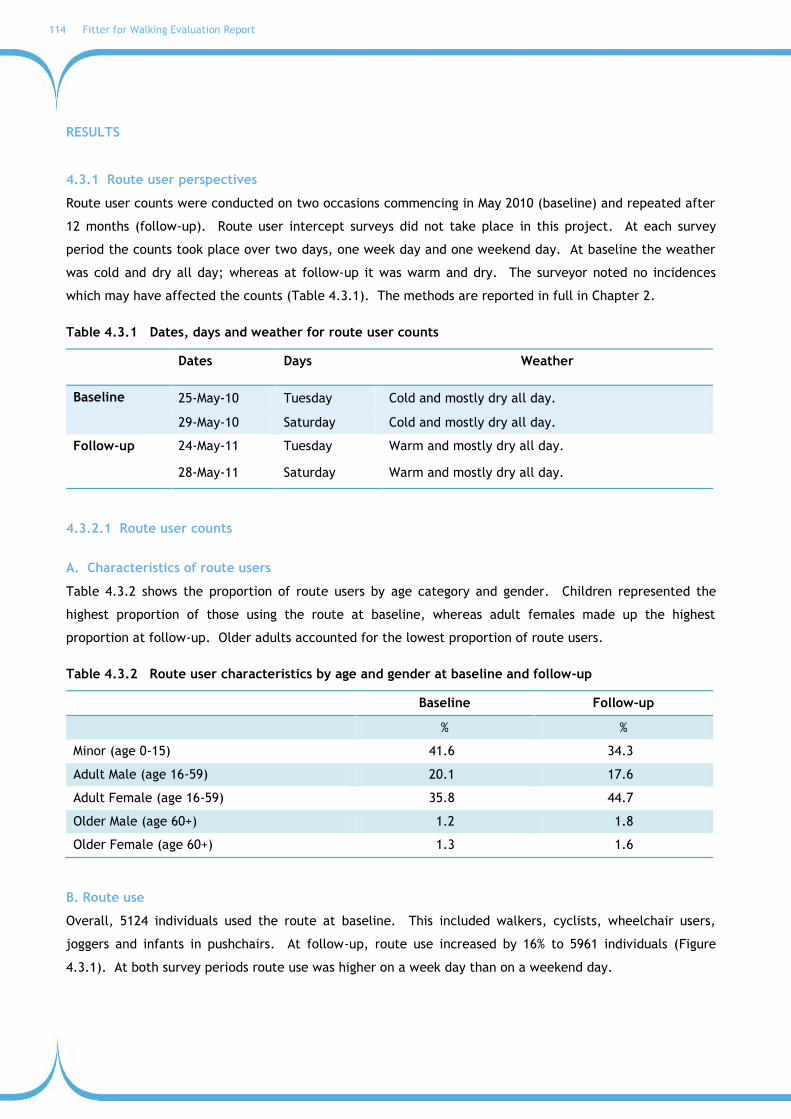
114 Fitter for Walking Evaluation Report
RESULTS
4.3.1 Route user perspectives
Route user counts were conducted on two occasions commencing in May 2010 (baseline) and repeated after
12 months (follow-up). Route user intercept surveys did not take place in this project. At each survey
period the counts took place over two days, one week day and one weekend day. At baseline the weather
was cold and dry all day; whereas at follow-up it was warm and dry. The surveyor noted no incidences
which may have affected the counts (Table 4.3.1). The methods are reported in full in Chapter 2.
Table 4.3.1 Dates, days and weather for route user counts
Dates Days Weather
Baseline 25-May-10 Tuesday Cold and mostly dry all day.
29-May-10 Saturday Cold and mostly dry all day.
Follow-up 24-May-11 Tuesday Warm and mostly dry all day.
28-May-11 Saturday Warm and mostly dry all day.
4.3.2.1 Route user counts
A. Characteristics of route users
Table 4.3.2 shows the proportion of route users by age category and gender. Children represented the
highest proportion of those using the route at baseline, whereas adult females made up the highest
proportion at follow-up. Older adults accounted for the lowest proportion of route users.
Table 4.3.2 Route user characteristics by age and gender at baseline and follow-up
Baseline Follow-up
% %
Minor (age 0-15) 41.6 34.3
Adult Male (age 16-59) 20.1 17.6
Adult Female (age 16-59) 35.8 44.7
Older Male (age 60+) 1.2 1.8
Older Female (age 60+) 1.3 1.6
B. Route use
Overall, 5124 individuals used the route at baseline. This included walkers, cyclists, wheelchair users,
joggers and infants in pushchairs. At follow-up, route use increased by 16% to 5961 individuals (Figure
4.3.1). At both survey periods route use was higher on a week day than on a weekend day.

Fitter for Walking Evaluation Report 115
Figure 4.3.2 shows route use for pedestrians only. At baseline 4702 pedestrians used the route over the two
day survey period. Pedestrians use increased by 16% at follow-up to 5566 individuals. Increases were seen
on both the week and weekend day.
Figure 4.3.1 Number of route users (all modes of travel) at baseline and follow-up
Figure 4.3.2 Number of route users (pedestrians only) at baseline and follow-up
5124
5961
3522
3677
1602
2284
0
1000
2000
3000
4000
5000
6000
7000
Baseline Follow-up
Num
ber
of
indiv
iduals
Total Week day Weekend day
4702
5566
3142 3331
1560
2235
0
1000
2000
3000
4000
5000
6000
Baseline Follow-up
Num
ber
of
indiv
iduals
Total Week day Weekend day

116 Fitter for Walking Evaluation Report
4.4 CASE STUDY D: Taylor Street, Blackburn
PROJECT SUMMARY
Local Authority: Blackburn
Teddy bear walk (September 2010)
Location: Taylor Street, Blackburn
Registered group: Taylor Street
Date of registration: September 2008
Date of completion: September 2010
The primary focus of this project was the route under the bridge on Taylor Street. It is a route to local
schools, the church, shops and an alternative route to town. Fitter for Walking were approached by the
neighbourhood manager to tackle the issues of cleaning up the walking route, improving signage,
removing graffiti on the bridge, poor lighting and fly tipping. Local groups involved in the project
include Cleaner Greener Griffin, St Luke‟s Church and Stansfeld Day Centre.
Fitter for Walking Awards were presented to two members of the community in July 2010.
Project activities
Street audit (October 2008)
Changes made to this route include:
- New lighting (Spring 2009)
- Extra bollards installed to prevent traffic using the route under the bridge (Spring 2009)
- Removal of graffiti (Spring 2009)
- Painting the bridge with anti-graffiti paint (November 2010)
- Footstep and play markings on pavement under bridge (July 2011)
Other project activities have included:
- Community clean-up
- Led walks including the Teddy Bear walk

Fitter for Walking Evaluation Report 117
Examples of project activities
Bridge on Taylor Street before improvements
Bridge on Taylor Street after painting with anti-graffiti paint
New footsteps marked on pavement under bridge

118 Fitter for Walking Evaluation Report
SUMMARY OF RESULTS
The project co-ordinator‟s and community members‟ views of this project are presented below. A summary
of the findings from the route user counts, intercept surveys and residents‟ surveys are also reported below,
followed by a detailed breakdown of results.
Project Co-ordinator’s views
The project co-ordinator was interviewed to ask about the background to the project and their experiences
of working with this community.
The Taylor Street project focused on a well-known local route that passed under a bridge that for a
number of reasons made walking unpleasant.
…a badly lit and much abused route under a bridge linking to two estates and it was just antisocial behaviour, sex crimes, everything was going on…it was like just a bad episode of… EastEnders going on beneath it…
Project Co-ordinator, North West
A community street audit was conducted that identified problems of graffiti, lighting, dog fouling, bad
drainage as well as the social problems due to the route attractive anti-social behaviour. The approach
taken by the project was to tackle each of the problems head-on, and make all aspects of the route (and
especially the bridge) more pleasant. The main focus was painting the bridge: covering up the graffiti and
giving it a brighter cleaner look.
…[we did] a litter pick, and Network Rail, another partner, they were brought in to do blasting the graffiti off… so that was like the first stage and then we worked the local schools to say „well it could do with brightening up‟, and that‟s when the idea of painting it came along, so the whole wall were painted a nice colour of blue… renamed it the Blue Bridge… so it‟s now looks a little, a lot more appealing…
Project Co-ordinator, North West
In this way, without major capital expenditure, the project appears to have transformed the route, making
it useable again by all sections of the community.
…people that were already using it were local residents, but some of them actually said „well sometimes I won‟t walk under it, I‟ll walk round rather than walk under it‟… people have said it‟s now, it‟s a lot easier and friendlier to walk under, we haven‟t changed anything structurally, we haven‟t took any miles off the route or anything but we‟ve just… made it feel like you want to walk that way.
Project Co-ordinator, North West
One of the perceived successes of the project was the degree to which it involved many parts of the local
community, with the co-ordinator making links to groups such as the local Children‟s Centre, the school, a
local environment group, and the „Cleaner Greener Group‟. This meant that attendance at some of the

Fitter for Walking Evaluation Report 119
events was good, especially for the community clean-up day and the final celebration. The freshened-up
route beneath the newly painted blue bridge was launched at a celebratory event including street games
organized by Neighbourhood Recreation and Play Services. This event showed the positive views from many
members of the community.
…we had … loads of people turn up that day… we played street games under the bridge, and everyone kept just coming through… saying „it‟s so much better‟ you know, everybody, everybody, „what a great venue‟…
Project Co-ordinator, North West
Community members’ views
The community groups involved in this project identified a clear need for some work on the bridge, as they
saw that it was a barrier to walking in the area.
And with the Taylor Street Project as well, I think it‟s about making that area feel safer… it‟s just not a nice place to walk through, and with the work that‟s been done now it‟s just making it more easier really, for people to feel safer going through that area.
Community member, Taylor Street
There has been very positive feedback from the community member involved in the project, who noted
that the project involved many different parts of the community, but had benefitted everyone.
The social side, the impact of bringing people together, bringing agencies together, so it‟s promoted partnerships, its promoted community cohesion, inter-generational work. It‟s made the places a lot safer, better.
Community member, Taylor Street
But the project was not just about cleaning and painting the bridge: there was planting along the route,
and use of painted footprints to „advertise‟ the route, and also lots of walks put on, including local history
walks, that were well attended by the local community.
It has been fantastic really… I took my daughter on them walks because it were learning about our local history, and I‟ve lived round that area all my life and I didn‟t know half the things that we learned from that. So yeah, I thought it were good, and they were well attended…
Community member, Taylor Street
Overall, there was a very positive reaction to Living Streets‟ involvement in the area.
Since they got involved, we cleaned it all up, the bridge has been painted, there‟s been new lampposts put in, and as its all near the school it‟s just benefited everybody, it‟s made such a big, huge difference. There‟s also a park been built there as well now, you know, for the children, so it has made a massive improvement, definitely.
Community member, Taylor Street

120 Fitter for Walking Evaluation Report
Route user counts, route user surveys and residents’ surveys
Route user counts were conducted on the route at baseline (July 2010), 12 months (July 2011), and 14
months (September 2011). Route user intercept surveys were conducted simultaneously on the first two of
these occasions (July 2010 and July 2011). Counts and surveys were conducted over 2 days on each
occasion, one week day and one weekend day for 12 hours on each day. At baseline 73 route users
participated in the intercept survey with 41 route users taking part in the 12 month survey.
In addition a survey was conducted with a small number of residents living within 1 mile of the route. Only
18 residents responded to the survey therefore the results from the residents‟ surveys should be interpreted
with caution due to the low response rate.
Full methods are reported in Chapter 2.
Barriers to walking
At baseline respondents to the route user survey highlighted a number of improvements that were required
to encourage walking on the project route including: clearance of rubbish/glass (84%), clearance of graffiti
(64%), improved lighting (62%), clearance of dog mess (32%) and removal of overgrown hedges (30%). At
follow-up, removal of overgrown hedges was still highlighted as an issue (41%), however a much lower
proportion of respondents reported the need for clearance of rubbish/glass (20%); clearance of graffiti (8%),
improved lighting (20%) and clearance of dog mess (12%) suggesting that some of the barriers to walking in
the area have been removed through the FFW project.
Project awareness and participation
Only 4% of route users had heard of Living Streets and 16% of FFW at follow-up. A high proportion of route
users noticed changes to the route such as new clearance of graffiti (61%), new paint on the bridge (57%)
and clearance of rubbish/glass (49%). A high proportion of respondents to the residents‟ survey noticed
clearance of dog mess (89%) and new street furniture (eg, bollards) (80%) but few residents reported
participating in FFW activities.
Community cohesion
Route user survey data indicated there was a decline in the views of community cohesion in the area.
There were much lower numbers of respondents at follow-up agreeing that „there is a sense of community‟,
„people are willing to help each other‟, „people get along with each other‟, „people share the same values‟,
and „people are willing to work together to improve the local area‟. In contrast, respondents to the
residents‟ survey agreed that resident have been more willing to help each other (65%), more friendly (59%)
and more willing to work together (50%).
Fitter for Walking Evaluation Report 121
Walking & route use
The route user counts show that use of the route along Taylor Street by pedestrians appears to have
increased since the improvements were made to the area. Overall, in September 2011 there were 18%
more walkers than at baseline (July 2010). A high proportion of route users were children (range 31%-58%
across the survey periods) with the majority of other users being adults aged 16-59; few older adults used
the route (<3%). During all survey periods, route use was higher on a week day than on a weekend day.
Route user survey data showed that for a high proportion of survey respondents walking was the only mode
of transport used to complete their current journey (85% at baseline and 84% at follow-up). The main
purpose for respondent‟s journeys was for social entertainment and to get home at baseline. At follow-up
main journey purposes were for social entertainment, to get home and to get to and from work.
Respondent‟s mean journey duration decreased by 4 minutes between baseline and follow-up, however use
on a weekly basis increased by 10%. At follow-up, respondents agreed that factors influencing their
decision to travel actively (walk or cycle) on the route included being able to go straight to their
destination (96%), it being the most convenient route (96%), saving money by using the route (90%),
addressing environmental concerns (90%), it being the only exercise the respondent gets (83%) and it being
the best transport option (80%).
A small proportion of route users (6%) indicated they had used the route more in the last 12 months and
there were significant increases in the proportion of respondents intending to walk more (19% increase) and
likely to walk more (31%) in the next 12 months.
A high number of respondents to the residents‟ survey (n=14) agreed they had increased the amount of
walking they do for short journeys around their neighbourhood in the last 18 months. The main reasons for
given for increasing walking included change of income, having children and knowing more people in the
local area. An increase in the use of the project route was reported for all journey purposes compared to
18 months ago. Residents reported the perceived benefits of using the route to include increased
satisfaction with where the respondent lived; visiting more local shops, saving money by using the route and
increasing physical activity levels. Two thirds of respondents agreed they had seen more people walking
around their neighbourhood and they themselves had found new walking routes. Half of respondents had
also discovered new places to walk to in their neighbourhood in the last 18 months and thought it felt safer
and was more pleasant to walk around their neighbourhood.
Health and well-being
The increases in walking observed in this project are likely to lead to benefits for health and well-being in
the longer-term; however it was not possible to measure changes in health and well-being as part of the
evaluation.

122 Fitter for Walking Evaluation Report
Overall comments
This project addressed a clear need to tackle the issues raised by the community to clean up the walking
route under the bridge on Taylor Street in Blackburn. A number of improvements were successfully made
including cleaning the area of litter and glass, new lighting, new bollards, removal of graffiti from the
bridge and painting the bridge with anti-graffiti paint. Both route users and residents were aware of
improvements that had been made though few had actually heard of FFW or taken part in project activities.
There was an increase in the number of people walking along the project route at the last follow-up
measurement, however there were mixed views from route users and residents as to whether there were
any improvements in community cohesion.
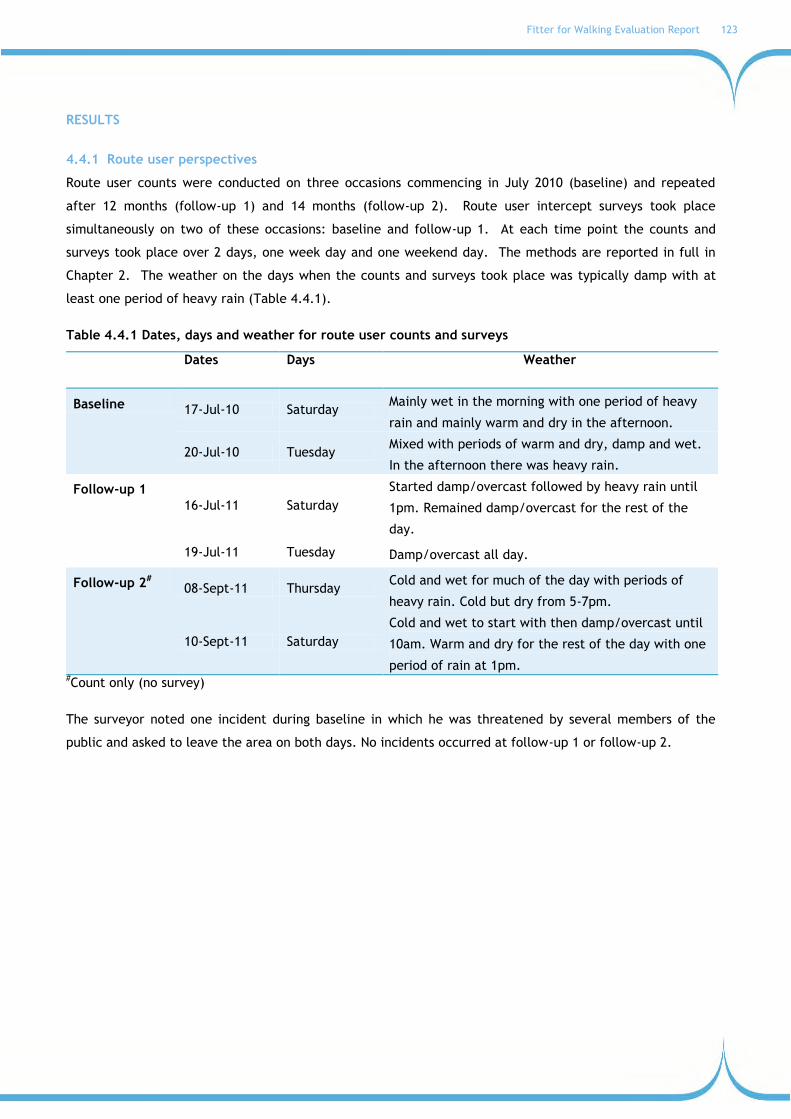
Fitter for Walking Evaluation Report 123
RESULTS
4.4.1 Route user perspectives
Route user counts were conducted on three occasions commencing in July 2010 (baseline) and repeated
after 12 months (follow-up 1) and 14 months (follow-up 2). Route user intercept surveys took place
simultaneously on two of these occasions: baseline and follow-up 1. At each time point the counts and
surveys took place over 2 days, one week day and one weekend day. The methods are reported in full in
Chapter 2. The weather on the days when the counts and surveys took place was typically damp with at
least one period of heavy rain (Table 4.4.1).
Table 4.4.1 Dates, days and weather for route user counts and surveys
Dates Days Weather
Baseline 17-Jul-10 Saturday Mainly wet in the morning with one period of heavy
rain and mainly warm and dry in the afternoon.
20-Jul-10 Tuesday Mixed with periods of warm and dry, damp and wet.
In the afternoon there was heavy rain.
Follow-up 1
16-Jul-11 Saturday
Started damp/overcast followed by heavy rain until
1pm. Remained damp/overcast for the rest of the
day.
19-Jul-11 Tuesday Damp/overcast all day.
Follow-up 2# 08-Sept-11 Thursday Cold and wet for much of the day with periods of
heavy rain. Cold but dry from 5-7pm.
10-Sept-11 Saturday
Cold and wet to start with then damp/overcast until
10am. Warm and dry for the rest of the day with one
period of rain at 1pm. #Count only (no survey)
The surveyor noted one incident during baseline in which he was threatened by several members of the
public and asked to leave the area on both days. No incidents occurred at follow-up 1 or follow-up 2.

124 Fitter for Walking Evaluation Report
4.4.1.2 Route user counts
A. Characteristics of route users
Table 4.4.2 shows the proportion of route users by age category and gender. Minors represented the
highest proportion of those using the route at baseline (41%) and follow-up 1 (58%), whereas adult males
represented the highest proportion at follow-up 2 (37%). Older adults accounted for the lowest proportion
of route users across all three survey periods.
Table 4.4.2 Route user characteristics by age and gender at baseline and follow-up
Baseline Follow-up 1 Follow-up 2
% % %
Minor (age 0-15) 40.9 58.2 30.8
Adult Male (age 16-59) 35.6 18.9 37.0
Adult Female (age 16-59) 19.5 20.8 29.6
Older Male (age 60+) 1.7 0.7 2.1
Older Female (age 60+) 2.4 1.4 0.6
B. Route use
Overall 717 individuals used the route at baseline. This included walkers, cyclists, wheelchair users,
joggers and infants in pushchairs. At follow-up 1 overall route use decreased by 42%, however route use
increased by 15% at follow-up 2 compared to baseline (Figure 4.4.1). At baseline route use was slightly
higher on the weekend day but at both follow-up time points, route use was higher on the week day.
Figure 4.4.1 Number of route users (all modes of travel) at baseline and follow-up
717
419
828
345
258
512
372
161
316
0
100
200
300
400
500
600
700
800
900
Baseline Follow-up 1 Follow-up 2
Num
ber
of
indiv
iduals
Total Week day Weekend day

Fitter for Walking Evaluation Report 125
Figure 4.4.2 shows route use for pedestrians only. At baseline 621 pedestrians used the route over the two
day survey period. Pedestrian use at follow-up 1 decreased by 41% compared to baseline, but there was an
18% increase in pedestrians at follow up 2 compared to baseline. Route use by pedestrians was higher on a
week day than a weekend day at all three survey points.
Figure 4.4.2 Number of route users (pedestrians only) at baseline and follow-up
621
367
732
318
235
451
303
132
281
0
100
200
300
400
500
600
700
800
Baseline Follow-up 1 Follow-up 2
Num
ber
of
indiv
iduals
Total Week day Weekend day

126 Fitter for Walking Evaluation Report
4.4.1.2 Route User Intercept Surveys
A. Response rates
Route user intercept surveys were conducted twice during the project: baseline and 12 months (follow-up
1). The response rate to the survey varied across the two data collection periods (35-43%) (Table 4.4.3).
Table 4.4.3 Route user survey responses
Surveys completed
(n)
Surveys declined
(n)
Response rate (%)
Main reasons for declining
Baseline Saturday, 17 Jul 2010
Tuesday, 20 Jul 2010 73 96 43
In a hurry (36.5%)
Refused (32.3%)
Already interviewed (25.0%)
Follow-up 1 Saturday, 16 Jul 2011
Tuesday, 19 Jul 2011 41 77 35
Refused (27.3%)
In a hurry (23.4%)
Communication difficulties (20.8%)
B. Route user characteristics
The characteristics of respondents surveyed at each time point are shown in Table 4.4.4. At both baseline
and follow-up, a higher proportion of males than females took part in the survey and the highest
proportions of respondents were aged 35-44. At both survey points over 40% indicated they were in full
time employment and most were of a white ethnic background.
Almost half (49%) of respondents indicated they were in excellent or very good health at baseline, but this
was much lower at follow-up (37%). At baseline only 37% of respondents met physical activity
recommendations (30 minutes or more of moderate intensity physical activity on at least 5 days of the
week). In contrast, 57% of respondents reported meeting physical activity recommendations at follow-up.

Fitter for Walking Evaluation Report 127
Table 4.4.4 Route user survey respondent characteristics
Baseline Follow-up
% %
Gender Male 60.3 51.0
Female 39.7 49.0
Age 16-24 15.1 9.8
25-34 20.5 7.8
35-44 23.3 31.4
45-54 16.4 25.5
55-64 13.7 21.6
65+ 11.0 3.9
Ethnic group White 86.3 98.0
Employment status Employed full-time 41.1 47.1
Employed part-time 11.0 13.7
Retired 15.1 9.8
Other 32.8 29.4
Health Status Excellent/Very good 48.6 37.3
Physical activity Meeting recommendations* 37.0 56.8
*measured using the single-item physical activity questionnaire (Milton et al., 2010) which assessed the number of days respondents took part in 30 minutes or more of moderate intensity physical activity in the past week.
C. Journey characteristics
Mode of travel
The most common activity being undertaken by respondents at the time of the interview was walking
(Figure 4.4.3). A high proportion of respondents indicated walking was the only mode of transport used to
complete their current journey (85% and 84% at baseline and follow-up, respectively). Multi-modal trips
were less common with only 14% at baseline and 12% at follow-up reporting using a bus, train or taxi to
complete part of their journey (data not shown). A small proportion of respondents indicated they used a
car or van for part of their journey at baseline (1%), and 4% at follow-up also jogged for part of the route
(data not shown).

128 Fitter for Walking Evaluation Report
Figure 4.4.3 Activity being undertaken by respondents at time of interview
Journey purpose
The main purpose for respondents‟ journeys is shown in Table 4.4.5. At baseline the highest proportion of
respondents were travelling for social or entertainment activities (34%). Travelling home was the most
frequently cited journey purpose at follow-up (37%) and similarly was the second most reported journey
destination at baseline (29%).
Table 4.4.5 Journey purpose
Baseline Follow-up
% yes % yes
Home 28.8 37.3
Recreational activity* 1.4 3.9
Work 11.0 19.6
Education 4.1 0.0
Personal business / shopping 13.7 17.6
Social / entertainment 34.2 2.0
Recreation (sport and leisure) 5.5 2.0
*the respondent was just going for a walk or cycle ride around the local area for health, fitness or leisure, there was no specific destination
Journey duration
Respondents were asked about the duration of their journey on foot or by bicycle (depending on which
mode they were using at the time of the survey). The duration of respondents‟ walking journeys decreased
by 4 minutes between baseline and follow-up (Table 4.4.6). No respondents reported cycling at follow-up
therefore it is not possible to compare journey times.
0%
10%
20%
30%
40%
50%
60%
70%
80%
90%
100%
Baseline Follow-up
Walking Dog walking Cycling

Fitter for Walking Evaluation Report 129
Table 4.4.6 Journey duration on foot / by bike
Baseline Follow-up
Mean minutes ±SD Mean minutes ±SD
Walking 23.5 ±23.9 19.3 ±11.9
Cycling 65.0 ±77.8 None reported
Frequency of journey
Respondents were asked how frequently they completed their current journey. At baseline almost half of
respondents reported they made the walking journey daily (45%) or multiple times throughout the week
(47%) (Figure 4.4.4). A slight shift was seen at follow-up with fewer respondents reporting completing their
journey on a daily basis but a higher proportion of respondents completing their journey on a weekly basis
(57%). Overall, there was no significant difference in journey frequency between baseline and follow-up.
Figure 4.4.4 Frequency of route use for current journey by respondents
D. Characteristics of route use
Frequency of route use during the day and night
A high proportion of respondents (≥95%) reported using the route daily or weekly during the day time at
baseline and follow-up (Figure 4.4.5). There was an increase in the proportion of respondents using the
route on a daily basis during the day between baseline and follow-up. Route use frequency during the day
time was significantly different between baseline and follow-up (p<0.05).
45.2 46.6
2.7 5.5
39.2
56.9
0.0
3.9
0
10
20
30
40
50
60
Daily Weekly Monthly Yearly
% o
f re
spondents
Baseline Follow-up

130 Fitter for Walking Evaluation Report
Figure 4.4.5 Proportion of respondents using the route in the daytime
The proportion of respondents reporting using the route at night time on a regular basis was low (Figure
4.4.6). At baseline a small proportion of respondents reported using the route on a daily (10%) or weekly
(14%) basis. A decrease in regular use at night with only 6% using the route weekly at night time compared
to 14% at baseline. Changes in frequency of route use at night was statistically significant (p<0.05).
Figure 4.4.6 Proportion of respondents using the route in the night time
69.9
26.0
0.0 4.1
76.5
21.6
2.0 0.0 0
10
20
30
40
50
60
70
80
90
Daily Weekly Monthly Yearly
% o
f re
spondents
Baseline Follow-up
9.6 13.7
76.7
2.0
5.9
92.2
0
10
20
30
40
50
60
70
80
90
100
Daily Weekly Yearly
% o
f re
spondents
Baseline Follow-up
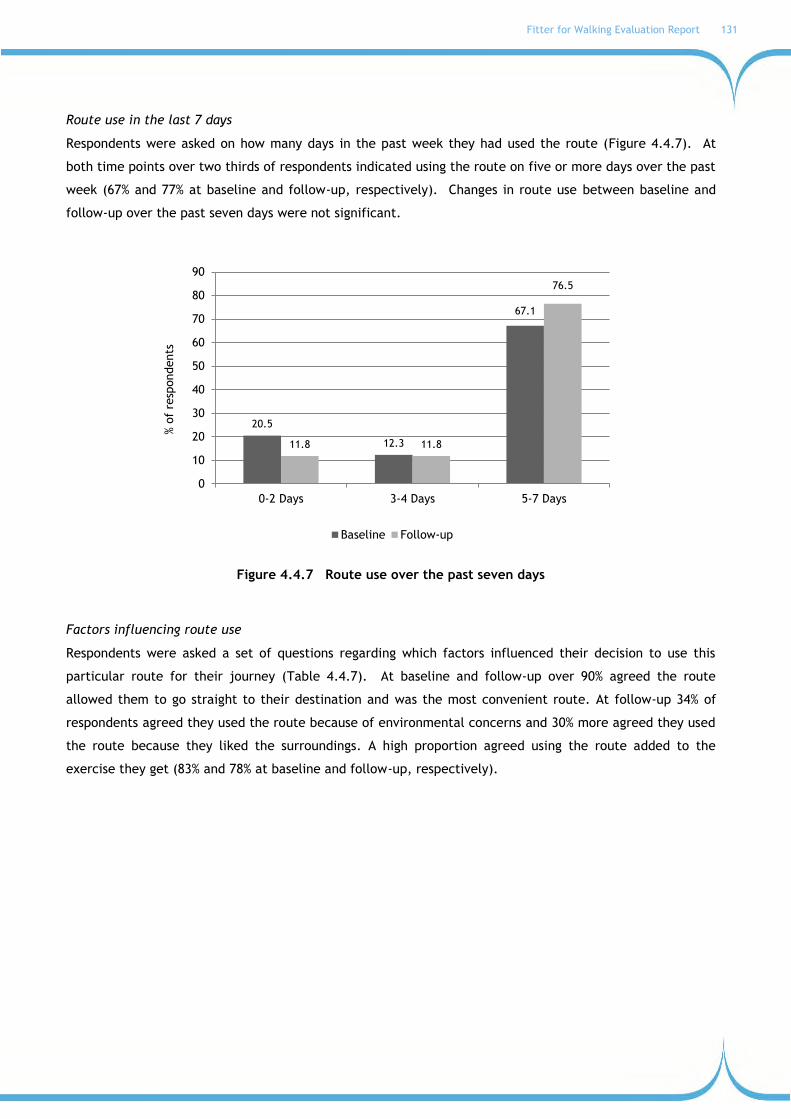
Fitter for Walking Evaluation Report 131
Route use in the last 7 days
Respondents were asked on how many days in the past week they had used the route (Figure 4.4.7). At
both time points over two thirds of respondents indicated using the route on five or more days over the past
week (67% and 77% at baseline and follow-up, respectively). Changes in route use between baseline and
follow-up over the past seven days were not significant.
Figure 4.4.7 Route use over the past seven days
Factors influencing route use
Respondents were asked a set of questions regarding which factors influenced their decision to use this
particular route for their journey (Table 4.4.7). At baseline and follow-up over 90% agreed the route
allowed them to go straight to their destination and was the most convenient route. At follow-up 34% of
respondents agreed they used the route because of environmental concerns and 30% more agreed they used
the route because they liked the surroundings. A high proportion agreed using the route added to the
exercise they get (83% and 78% at baseline and follow-up, respectively).
20.5
12.3
67.1
11.8 11.8
76.5
0
10
20
30
40
50
60
70
80
90
0-2 Days 3-4 Days 5-7 Days
% o
f re
spondents
Baseline Follow-up

132 Fitter for Walking Evaluation Report
Table 4.4.7 Factors influencing respondents’ decision to use active travel for their journey
Baseline Follow-up Sig.
% agree/strongly agree
% agree/strongly agree
Can go straight to destination 90.1 96.1 NS
Best transport option 64.8 80.4 *
Most convenient route 98.6 96.1 NS
Save money by using this route 77.5 90.2 *
Like the surroundings on this route 15.5 45.1 #
Route feels safe 23.9 17.6 #
This is the only exercise I get 21.1 5.9 #
Using this route adds to the exercise I get 83.1 78.4 *
Environmental concerns 56.3 90.2 #
*p<0.05 #p<0.01 NS=not significant
When asked about route safety in relation to exposure to other people, exposure to traffic and quality of
the surface, at baseline only 33% agreed the surface quality was safe though 78% agreed the route was safe
in regards to exposure to traffic. At follow-up 98% of respondents thought the route was safe in regards to
exposure to traffic and surface quality. There was little change between baseline and follow-up in route
users‟ opinion of safety in relation to exposure to other people (41% and 43%, respectively) (data not
shown).
Improvements needed to encourage use of route
At baseline and follow-up respondents were asked what specific improvements would help to encourage use
of the route. The most frequently cited improvements suggested were clearance of rubbish/glass,
clearance of graffiti, improved lighting, clearance of dog mess and removal of overgrown hedges (Table
4.4.8). At follow-up the most frequently cited improvement was the removal of overgrown hedges.
Table 4.4.8 Improvements needed to encourage use of route
Baseline Follow-up
% yes % yes
Clearance of rubbish/ glass 83.6 19.6
Clearance of dog mess 31.5 11.8
Clearance of graffiti 64.4 7.8
Improved lighting 61.6 19.6
Removal of overgrown hedges 30.1 41.2
Traffic calming: speed humps / cushions 1.4 0.0

Fitter for Walking Evaluation Report 133
Perceived change in route use
At follow-up, a small proportion of respondents (6%) indicated they used the route more in the last 12
months, however 90% of respondents indicated no change in route use. (Figure 4.4.8).
Figure 4.4.8 Change in route use over the last 12 months
E. Project Awareness
At baseline <2% of respondents had heard of Living Streets while 11% were aware of the FFW project. At
follow-up 4% had heard of Living Streets and 16% were aware of the project.
When asked about their awareness of improvements on the route, 61% noticed the graffiti had been cleaned,
57% the bridge had been painted and 49% of respondents noticed that glass and rubbish had been cleared
away (Table 4.4.9).
Table 4.4.9 Respondents’ awareness of improvements to route
Baseline Follow-up
% yes % yes
Clearance of rubbish/ glass 8.2 49.0
Clearance of dog mess 1.4 2.0
Clearance of graffiti 1.4 60.8
Improved lighting 0.0 3.9
New paint on the bridge ND 56.8
ND=No data collected
5.9
90.2
3.9
0
10
20
30
40
50
60
70
80
90
100
More About the same Less
% o
f re
spondents

134 Fitter for Walking Evaluation Report
F. Walking for travel and physical activity
Walking for travel
The proportion of respondents walking for travel on five or more days in the past week increased by 4%
between baseline and follow-up however this change was not significant (Table 4.4.10).
Table 4.4.10 Total walking for travel respondents in the past week
Baseline Follow-up
Mean minutes ±SD Mean minutes ±SD
Duration of walking for travel 659.1 ±329.9 261.8 ±103.4
Frequency of walking for travel % yes % yes
0-2 days 4.1 0.0
3-4 days 5.5 5.9
5-7 days 90.4 94.1
There was a significant decrease in the total number of minutes respondents reported walking for travel in
the last week (p<0.001) (Table 4.4.10).
At baseline respondents most frequently reported walking for journeys to the shops (74%), to visit friends
and family (71%) and for the work commute (41%) (Figure 4.4.9). At follow-up a much higher proportion of
respondents indicated they walked for personal business (75%), for recreation and fitness purposes (55%)
and for the work commute (57%) compared with baseline. Walking to visit friends and family and shopping
both decreased at follow-up.
Figure 4.4.9 Types of journeys respondents normally walked for
41.1
6.8
1.4
74.0
16.4
71.2
20.5
56.9
9.8
3.9
51.0 54.9 51.0
74.5
0
10
20
30
40
50
60
70
80
Work Commute School/College Business-relatedtrips
Shopping Recreationand fitness
To visit friendsand family
For personalbusiness
% o
f re
spondents
Baseline Follow-up

Fitter for Walking Evaluation Report 135
Respondents were asked to what extent they agreed with two statements asking about their intention to
walk more and likelihood of walking more in the next 12 months. At baseline, over 60% strongly agreed
they intended to walk more in the coming year but only 47% agreed they were more likely to (Table 4.4.11).
The proportion agreeing they intended to walk more or were likely to walk more increased significantly
between baseline and follow-up.
Table 4.4.11 Intention and likelihood of walking more in the next 12 months
Baseline Follow-up Sig.
% agree/strongly agree
% agree/strongly agree
I intend to walk more in the next 12 months 59.7 78.4 #
It is likely that I will walk more in the next 12 months 47.2 78.4 #
#p<0.01
Physical activity
At baseline only 37% of respondents reported taking part in at least 30 minutes of moderate physical
activity for five or more days in the past week. In contrast, at follow-up 57% of respondents reported
meeting physical activity recommendations (Figure 4.4.10). There was a significant difference in the
proportion of respondents meeting physical activity recommendations between baseline and follow-up
(p<0.05).
Figure 4.4.10 Proportion of respondents meeting physical activity recommendations
0%
10%
20%
30%
40%
50%
60%
70%
80%
90%
100%
Baseline Follow-up
% o
f re
spondents
Meeting recommendations

136 Fitter for Walking Evaluation Report
F. Community cohesion
Respondents were asked whether they agreed or disagreed with a set of statements regarding the
community in the neighbourhood where they live (Table 4.4.12). At baseline around half of respondents
agreed there is a sense of community in their neighbourhood (53%), people are willing to help each other
(47%) and people get along with each other (48%). The proportion of respondents agreeing with each
statement decreased at follow-up. The largest decrease (25%) was seen in the proportion of respondents
who agreed there was a sense of community in their area.
Table 4.4.12 Perceptions of community cohesion
Baseline Follow-up
% agree/strongly agree % agree/strongly agree
There is a sense of community 53.4 27.5
People are willing to help each other 46.6 33.3
People get along with each other 47.9 29.4
People share the same values 31.5 13.7
People are willing to work together to improve the local area
35.6 15.7

Fitter for Walking Evaluation Report 137
4.4.2.1 Residents’ survey
Surveys were distributed to 200 households situated within a 1 mile radius of the route where the FFW
project activities took place. An adult member of the household was asked to complete and return the
survey. A total of 18 surveys were returned, all respondents completing the paper version of the survey,
giving a response rate of 9%. The key findings from the survey are outlined below however these should be
interpreted with caution given the low response rate.
A. Respondent characteristics
The key characteristics of respondents are reported in Table 4.4.13. Of those who returned the surveys a
higher proportion were female (72%) and the mean age of respondents was 38 years. Most respondents
were white (89%) and the highest proportion of respondents were educated to GCSE / BTEC National level
(44%). Over three-quarters of respondents (77%) reported their health to be excellent or good, and 71%
reported meeting physical activity recommendations (participating in 30 minutes of moderate intensity
physical activity on five or more days of the week). A high proportion of households (67%) did not own a car.
Table 4.4.13 Residents’ survey respondent characteristics
%
Sex Male 27.8
Female 72.2
Ethnic group White 88.9
Other 11.1
Education qualifications Degree 5.6
A level/BTEC Higher 16.7
GCSE/BTEC National 44.4
No formal qualifications 22.2
Other qualifications 11.1
Number of vehicles in household 0 66.7
1 33.3
Health status Excellent/Good 76.5
Physical activity Meeting recommendations* 70.6
Mean ±SD
Age Mean age (years ±SD) 38.4 ±17.3
BMI Mean BMI (kg/m2 ±SD) 24.4 ±5.0
*measured using the single-item physical activity questionnaire (Milton et al., 2010) which assessed the number of days respondents took part in 30 minutes or more of moderate intensity physical activity in the past week.
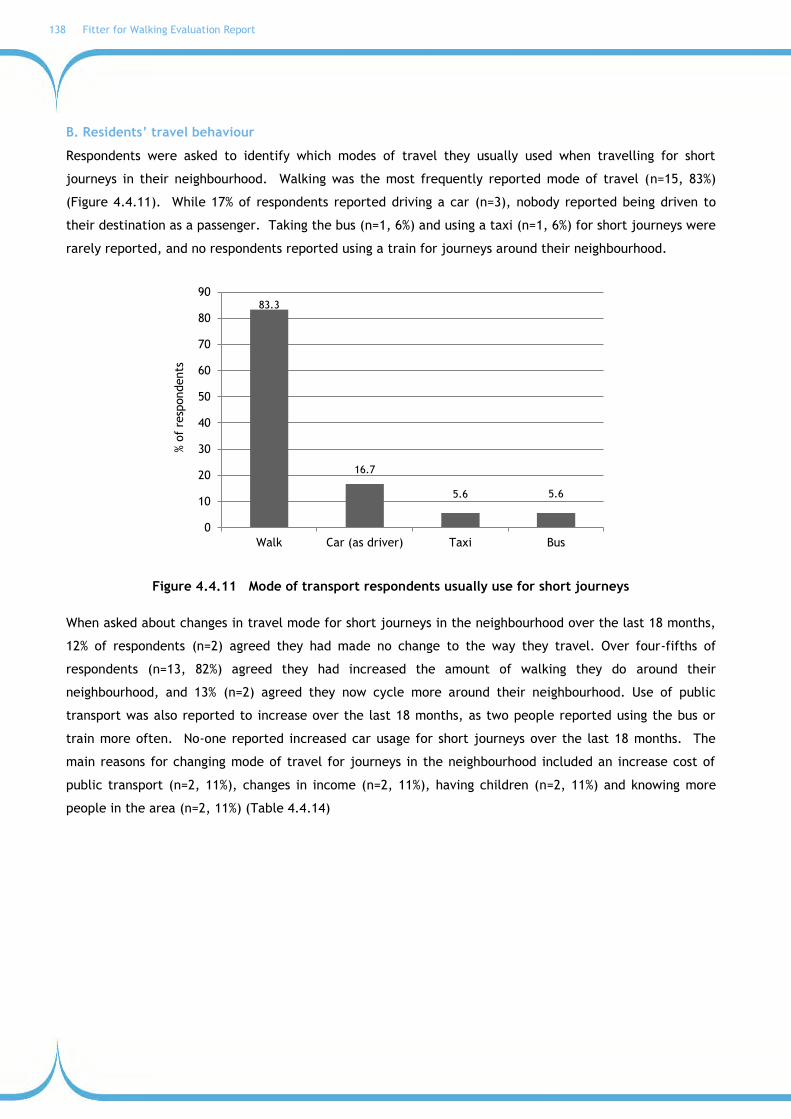
138 Fitter for Walking Evaluation Report
B. Residents’ travel behaviour
Respondents were asked to identify which modes of travel they usually used when travelling for short
journeys in their neighbourhood. Walking was the most frequently reported mode of travel (n=15, 83%)
(Figure 4.4.11). While 17% of respondents reported driving a car (n=3), nobody reported being driven to
their destination as a passenger. Taking the bus (n=1, 6%) and using a taxi (n=1, 6%) for short journeys were
rarely reported, and no respondents reported using a train for journeys around their neighbourhood.
Figure 4.4.11 Mode of transport respondents usually use for short journeys
When asked about changes in travel mode for short journeys in the neighbourhood over the last 18 months,
12% of respondents (n=2) agreed they had made no change to the way they travel. Over four-fifths of
respondents (n=13, 82%) agreed they had increased the amount of walking they do around their
neighbourhood, and 13% (n=2) agreed they now cycle more around their neighbourhood. Use of public
transport was also reported to increase over the last 18 months, as two people reported using the bus or
train more often. No-one reported increased car usage for short journeys over the last 18 months. The
main reasons for changing mode of travel for journeys in the neighbourhood included an increase cost of
public transport (n=2, 11%), changes in income (n=2, 11%), having children (n=2, 11%) and knowing more
people in the area (n=2, 11%) (Table 4.4.14)
83.3
16.7
5.6 5.6
0
10
20
30
40
50
60
70
80
90
Walk Car (as driver) Taxi Bus
% o
f re
spondents

Fitter for Walking Evaluation Report 139
Table 4.4.14 Reasons for changes in travel behaviour in the last 18 months by travel mode
Walk Cycle Bus Train
n n n n
Agree/strongly agree to increased use of mode 13 2 2 2
Reason for change in mode:
Cost of petrol has gone up 1 1 0 1
Cost of public transport has gone up 1 1 0 2
Change of income 2 1 0 1
Moved house 1 1 0 1
Had children 2 1 1 1
Knowledge of area improved 1 0 0 0
Know more people in the area 2 1 0 1
It feels safer 1 0 0 0
Local environment has improved 1 0 0 0
C. Residents’ route use
A quarter of respondents (n=3) reported using the project route eight or more times per week and a further
three reported using it four times a week. One respondent (8%) reported using the route seven times per
week. The remaining respondents reported using the route three times a week (n=2), twice a week (n=2) or
once a week (n=1) (data not shown).
Respondents reported an increase in the use of the route in comparison to 18 months ago for all journey
types except business related journeys (Figure 4.4.12). The greatest increases in route use were reported
for shopping (n=7, 47%), social activities (n=7, 41%) and recreation and fitness (n=7, 44%). While two
respondents (13%) reported they used the route less to catch public transport, in all other categories only
one respondent reported a decrease in use.
When respondents were asked about the benefits of using the route, over a third of respondents reported
experiencing an increase in satisfaction with where they live (n=7, 39%) and visiting more local shops (n=6,
33%). Over a quarter of respondents indicated they had saved money using the route (n=5, 28%), and
increased their physical activity levels (n=5, 28%) (Figure 4.4.13). Only two respondents indicated they had
used their cars less as a result of using the route (11%), and two respondents reported not using the route at
all (11%).

140 Fitter for Walking Evaluation Report
Figure 4.4.12 Use of route compared to 18 months ago reported by journey purpose
Figure 4.4.13 Perceived benefits of route use
D. Perceived changes in the community
Respondents were asked to what extent they agreed with a set of statements relating to walking in their
neighbourhood over the last 18 months. Two thirds of respondents agreed they had seen more people
walking around their neighbourhood (n=12, 67%) and they themselves had found new walking routes (n=10,
63%). Furthermore, 56% of respondents (n=9) agreed they have discovered new places to walk to in their
neighbourhood in the last 18 months and it feels safer (n=9) and more pleasant to walk around the
neighbourhood (n=9).
6.7
0.0
13.3
46.7
33.3
41.2 43.8
6.7 13.3
6.7
20.0
13.3 11.8
0.0
6.7 6.7 6.7
6.7
13.3
5.9 5.6
0
10
20
30
40
50
Work commute Business-related
trips
School/college Personalbusiness
To get topublic
transport
Social activities Recreationor
fitness
% o
f re
spondents
More Same Less
27.8
16.7 16.7
22.2
11.1
27.8
38.9
33.3
0
10
20
30
40
50
IncreasedPA levels
Feelhealthier
Feelfitter
Lessstressed
Use acar less
Savemoney
Neighbourhoodsatisfaction
Visit localshops more
% o
f re
spondents

Fitter for Walking Evaluation Report 141
When asked about community involvement to help make the neighbourhood safer and more attractive place
to walk, 44% agreed they had personally been involved in community activities (n=7) while 50% (n=9)
believed other members of the community had been involved in activities. Half of the respondents agreed
that over the last 18 months residents have been more willing to work together (n=8), and 59% (n=10)
thought residents have been friendlier. Lastly, 65% of respondents (n=11) agreed residents have been more
willing to help each other.
E. Project awareness and participation
Over a third of the respondents indicated they had heard of Living Streets (n=7, 39%). Conversely, only 20%
(n=3) were aware of the FFW and a similar 21% (n=3) were aware of the award presented by Living Street
for efforts to improve the community walking environment and get people walking.
Respondents were asked what specific improvements or changes they have noticed along the project route
in the last 18 months. The main improvements reported by respondents were the clearance of dog mess
around the area (n=9) and clearer information/signage (n=7) (Figure 4.4.14). Only one respondent was
aware of changes in the following categories: clearance of rubbish/glass, wider path or pavement, traffic
calming measures and planting of new bulbs.
Figure 4.4.14 Number of participants aware of project activities and improvements
Survey respondents reported little participation in the FFW activities. Activities respondents did participate
in are listed in Table 4.4.15, along with the number of respondents who were involved in each activity.
0
1
2
3
4
5
6
7
8
9
10
Num
ber
of
resp
ondents

142 Fitter for Walking Evaluation Report
Table 4.4.15 Participation in Fitter for Walking project activities
Number of respondents
Street audit 1
Made a walking pledge 1
Helped plant bulbs 3
Helped clean streets 4
Street party 1
Finally, almost half of respondents indicated they would be willing to donate either time and/or money to
help improve the walking environment or provide walking focused activities (n=9, 47%). Those who were
willing to help financially would be willing to donate up to £5. Respondents were also willing to volunteer
from one day a month to a few hours a week.

Fitter for Walking Evaluation Report 143
4.5 CASE STUDY E: ‘Our back field’, Bolton
PROJECT SUMMARY
Local Authority: Bolton
Opening of the new gate (May 2011)
Location: “Our back field” Larkfield Grove, Bolton
Registered group: Entwistle Residents‟ Association
Date of registration:
December 2010
Date of completion:
June 2011
The primary focus of this project is route across a field which links two estates to the town and schools.
A site visit took place with residents in January 2011. The route was muddy and there was no indication
that the path exists. The local community group (Entwistle Residents Association) wanted to improve the
path and install signage. The path had the potential to benefit approximately 600 residents living on or
close to Entwistle Street. A consultation took place with residents during March 2011.
Project activities
Site visit with residents (January 2011) and consultation with residents (March 2011)
Changes made to this route include:
- New gateway installed at entrance to field (designed by local school children) (May 2011)
Other project activities have included:
- Official opening of gates
- Fun day
- Litter picks
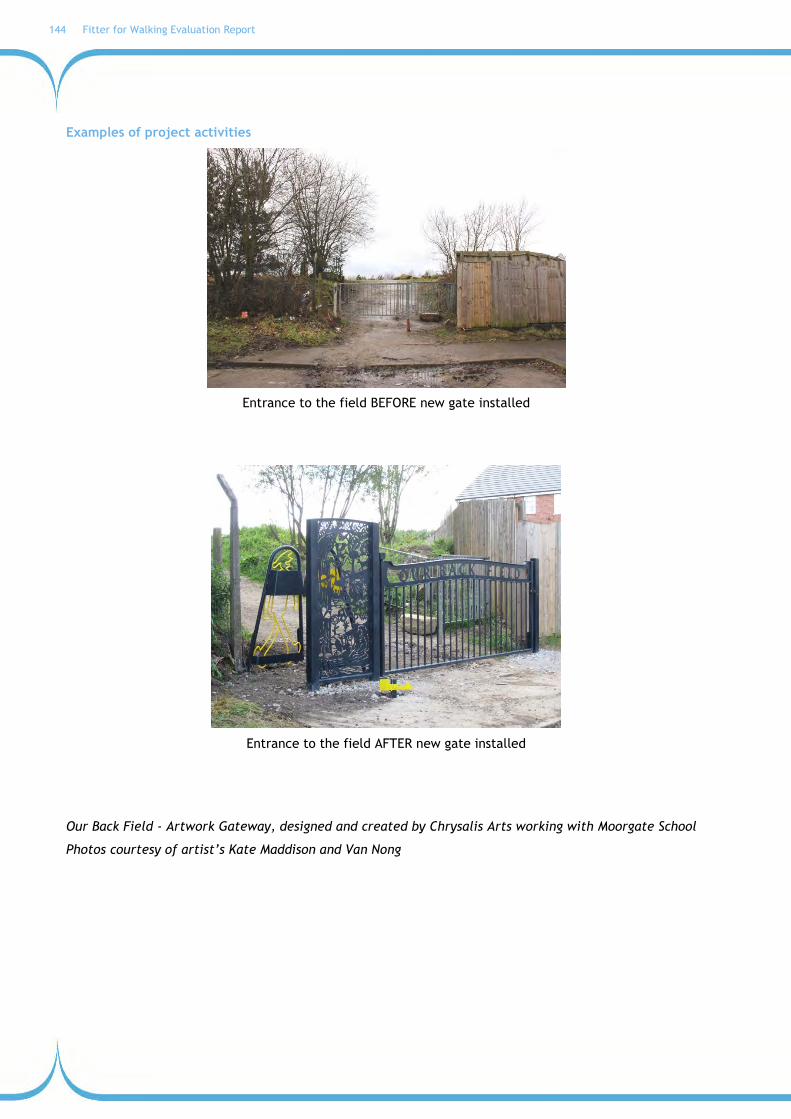
144 Fitter for Walking Evaluation Report
Examples of project activities
Entrance to the field BEFORE new gate installed
Entrance to the field AFTER new gate installed
Our Back Field - Artwork Gateway, designed and created by Chrysalis Arts working with Moorgate School
Photos courtesy of artist‟s Kate Maddison and Van Nong

Fitter for Walking Evaluation Report 145
SUMMARY OF RESULTS
The project co-ordinator‟s and community members‟ views of this project are presented below. A summary
of the findings from the route user counts and intercept surveys are also reported below, followed by a
detailed breakdown of results.
Project Co-ordinator’s views
The project co-ordinator was interviewed to ask about the background to the project and their experiences
of working with this community.
The project area was identified by a residents‟ association, comprising people who lived near a former
piece of wasteland, and were interested in getting involved in its upkeep.
…it‟s been a tip basically and they‟ve covered it over with soil and they want people to walk… they just want to get rid of it I think basically. So the Resident Association said „oh yeah, well we‟ve always wanted to like own it and use it, but it‟s really bad entrance wise, you can‟t tell how to get in, there‟s no visible signs‟, so that‟s when we did a walkabout on that field and said „let‟s look at how we‟re going to get access to the field and how we‟re going to tell people where it goes to and where it comes from‟ etc… because it does link up to two main roads.
Project Co-ordinator, North West
The field was part of a local walking route, but the condition of the field meant that the route was
underused, and was sometimes blighted by motorcross bikes and other anti-social behaviour.
…it‟s a walking route and… the residents from this side of the estate just walked onto the field and walked off again, but I think what I were keen to show is that there is actually a route through into town, you know, you can actually walk this green route and get into town and that‟s what the signs that are going up now are actually going to say,
Project Co-ordinator, North West
The project therefore focused on some gates at the entrance to the field, and signage to help to link the
field into the existing routes into town. This has gone down very well with the residents, who have been
increasingly involved in the project, helping to design the gate and a logo that was printed on the signs and
on T-shirts.
…the residents are very pleased with the gate, you know, because we put this new gateway in that says Our Back Field and prevents motor cross bikes from getting on as well.
Project Co-ordinator, North West
The remaining challenge now for the project is to ensure that the final stages of the work are completed,
which sometimes looks less likely in the face of continued cuts to public finances.
…that is a real frustration… I know everybody‟s feeling it… the cuts aren‟t they, but I mean the match fund that was supposed to be on the table from each of the authorities just isn‟t… there anymore, and you…end up matching officer time… but you don‟t seem to get
146 Fitter for Walking Evaluation Report
the, what was it, ten, twenty grand that was supposed to be on the table from each authority, to do the direct works.
Project Co-ordinator, North West
Community members’ views
From the community perspective, the work on the „back field‟ was long overdue and very helpful in linking
together some disconnected areas. It was a way of reclaiming the former waste ground and making good
use of it.
…since they stopped using it as a landfill site and it was a bit of top soil put on it and it‟s just been, and some trees planted and it‟s just been left, it‟s been monitored for the gases coming off it and things like that, but now we‟re trying to improve it, shall we say, and make it a bit more used by the community and so that‟s how it all started…
Community member, Entwistle Residents‟ Association
The community got heavily involved in promoting the work and consulting with local people, through
consultation days, leafleting, litter picks, led walks, and promotions. These have been very successful,
helping to show people that the place they might have thought of as a „landfill site‟ has been transformed.
I think some of them just thought, “It‟s the landfill site,” but didn‟t realise that for all it‟s still the old landfill site it is more a nature park, because I mean there is a lot of wildlife up there and there is quite a few different plants and things up there, so I think it has awakened quite a few people‟s interest…
Community member, Entwistle Residents‟ Association
A major success of the project appears to have been not just the physical reclamation, but the involvement
of all parts of the community, especially in the clean-up efforts.
I think it‟s been good for the children especially, because I think it‟s like given them some ownership of it because they‟ve been involved with the design of the gates and things like that, and then they are going to be involved in other things as well.
Community member, Entwistle Residents‟ Association
Future plans include continued maintenance and upkeep of the area involving the community.
Well we‟re going to do another litter pick later in the year. We‟re hoping to …plant some bulbs or something later in the year ready for next year, and it‟s things like that we‟re looking at the moment. We are hoping to maybe try and improve the paths a little bit…
Community member, Entwistle Residents‟ Association

Fitter for Walking Evaluation Report 147
Route user counts, route user surveys and residents’ surveys
Route user counts were conducted on the route at baseline (April 2011) and at a 5 month follow-up
(September 2011). Route user intercept surveys took place simultaneously on both occasions. Counts and
surveys were conducted over two days on each occasion, one week day and one weekend day for 12 hours
on each day. At baseline 13 route users participated in the intercept survey with 42 respondents at the 5
month survey. Full methods are reported in Chapter 2.
Barriers to walking
At baseline respondents to the route user survey highlighted a number of improvements that were required
to encourage walking including: clearance of rubbish/glass (54%), improved lighting (39%) and clearance of
dog mess (23%). After the project improvements had been made, there was a reduction in the proportion of
respondents reporting the need for clearance of rubbish/glass and improved lighting to increase the use of
the route suggesting that some of the barriers to walking in the area have been removed through the FFW
project.
Project awareness and participation
Few route users had heard of Living Streets or the Fitter for Walking project at both baseline and follow-up
(n≤2), but two thirds of respondents were aware that a new gate had been installed along the route (62%).
Community cohesion
Route user survey data indicated there were improvements in the view that „people are willing to work
together to improve the local area‟.
Walking & route use
Route user counts show that use of the project route decreased between baseline and follow-up. At follow-
up (September 2011), there were 20% fewer walkers than at baseline (April 2011). Weather could have
possibly affected route use as, at baseline, both survey days were dry whereas both follow-up days had
periods of wet or heavy rain. The route was mostly used by adult males (age 16-59) and minors. On both
occasions, a higher proportion of route users were using the route on a weekend day than a week day.
Route user survey data showed that for a high proportion of survey respondents, walking was the only mode
of transport being used for their journey (92% at baseline and 93% at follow-up). Also, most respondents
cited they were out for a recreational walk or were on their way home. Respondents‟ mean journey
duration decreased by three minutes between baseline and follow-up. There was no change in respondents‟
use of the route on a daily basis between baseline and follow-up, however use on a weekly basis decreased
by 6%. Respondents agreed that the factors influencing their decision to travel actively (walk or cycle) on
the route included it was the most convenient route (88%), using the route helped save money (81%), using
the route added to the exercise they already undertake (74%) and the route allowed them to go straight to

148 Fitter for Walking Evaluation Report
their destination (74%). Most respondents to the route user survey agreed the surface quality was safer at
follow-up compared to baseline and perceived it to be safe in regards to exposure to traffic and other
people.
Almost a quarter of respondents to the route user survey reported that they had used the route more in the
last 3 months (21%), and there were increases in the proportion of respondents indicating they intended to
walk more (12% increase) or were likely to walk more (2%) increase in the next 12 months.
Health and well-being
It was not possible to measure changes in health and well-being as part of this evaluation.
Overall comments
This project aimed to increase the use of path across a field linking to estates to the town and schools. The
main change to the route was a new gateway at the entrance to the field which was designed by local
school children. In addition, a fun day and litter picks were held. The gateway was successfully installed
and this was celebrated with an official opening. Overall there was a decrease in pedestrian use of the
route however this may have been a result of the weather during the survey period which was mainly dry at
baseline, but mainly wet at follow-up.

Fitter for Walking Evaluation Report 149
RESULTS
4.5.1 Route user perspectives
Route user counts were conducted on two occasions commencing in April 2011 (baseline) and repeated after
5 months (follow-up). Route user intercept surveys took place simultaneously on both occasions. At each
time point the counts and surveys took place over two days, one week day and one weekend day. The
weather on the days when the counts and surveys took place varied (Table 4.5.1). No incidents were
reported by the surveyor on either occasion. The methods are reported in full in Chapter 2.
Table 4.5.1 Dates, days and weather for route user counts and surveys
Dates Days Weather
Baseline 09-Apr-11 Saturday Warm and mostly dry all day.
12-Apr-11 Tuesday Cold and mostly dry all day.
Follow-up 08-Sept-11 Thursday
Warm but mostly wet throughout the day with three
periods of heavy rain. Warm and mostly dry from
4pm onwards
10-Sept-11 Saturday Warm and wet to start with but warm and dry from
9.30am onwards. Cool and dry from 6pm-7pm.
4.5.2.1 Route user counts
A. Characteristics of route users
Table 4.5.2 shows the proportion of route users by age category and gender. Adult males represented the
highest proportion of those using the route at baseline, whereas at follow-up a slightly higher proportion of
children. Older adults accounted for the lowest proportion of route users.
Table 4.5.2 Route user characteristics by age and gender at baseline and follow-up
Baseline Follow-up
% %
Minor (age 0-15) 26.9 38.3
Adult Male (age 16-59) 43.5 37.0
Adult Female (age 16-59) 22.8 18.2
Older Male (age 60+) 2.6 5.2
Older Female (age 60+) 4.1 1.3

150 Fitter for Walking Evaluation Report
B. Route use
Overall 193 individuals used the route at baseline. This included walkers, cyclists, wheelchair users,
joggers and infants in pushchairs. At follow-up, route use decreased by 20% to 154 individuals (Figure 4.5.1).
Route use was higher on the weekend day at both time points.
Figure 4.5.2 shows route use for pedestrians only. At baseline 174 pedestrians used the route over the two
day survey period; route use by pedestrians also decreased by 20% at follow-up. Pedestrian route use was
higher on weekend days than on a week day at both time points.
Figure 4.5.1 Number of route users (all modes of travel) at baseline and follow-up
Figure 4.5.2 Number of route users (pedestrians only) at baseline and follow-up
193
154
83 62
110 92
0
50
100
150
200
250
Baseline Follow-up
Num
ber
of
indiv
iduals
Total Week day Weekend day
174
140
77
53
97 87
0
50
100
150
200
Baseline Follow-up
Num
ber
of
indiv
iduals
Total Week day Weekend day

Fitter for Walking Evaluation Report 151
4.5.2.2 Route User Intercept Surveys
A. Response rates
Route user intercept surveys were conducted twice during the project: baseline and 5 months later (follow-
up). Table 4.5.3 shows the number of individuals who completed the survey at each time point, the
number of individuals who declined to participate and the most frequently cited reasons for not
participating.
Table 4.5.3 Route user survey responses
Surveys completed
(n)
Surveys declined
(n)
Response rate (%)
Main reasons for declining
Baseline Saturday 09 April 2011
Tuesday 12 April 2011 13 82 14
Refused (37.8%)
In a hurry (22.0%)
Already interviewed (14.6%)
Follow-up Thursday 08 Sept 2011
Saturday 10 Sept 2011 42 42 50
Already interviewed (45.2%)
In a hurry (31.0%)
Refused (11.9%)
B. Route user characteristics
The characteristics of respondents surveyed at each time point are shown in Table 4.5.4. At both baseline
follow-up, a higher proportion of males than females took part in the survey. The highest proportions of
respondents were aged 45-54 at baseline and 35-44 at follow-up. At both measurement points the greatest
number of respondents indicated they were in full-time employment and almost all respondents were of
white ethnic background. A third of respondents at baseline indicated they were in very good or excellent
health (62%); at follow-up this decreased to 52%. At baseline, 31% of respondents were meeting physical
activity recommendations (30 minutes or more of moderate intensity physical activity on at least 5 days of
the week), in contrast at follow-up 45% of route users were meeting recommendations.

152 Fitter for Walking Evaluation Report
Table 4.5.4 Route users survey respondent characteristics
Baseline Follow-up
% %
Gender Male 61.5 69.0
Female 38.5 31.0
Age 16-24 15.4 7.1
25-34 0.0 26.2
35-44 23.1 28.6
45-54 30.8 11.9
55-64 15.4 9.5
65+ 15.4 16.7
Ethnic group White 100.0 95.2
Employment status Employed full-time 38.5 57.1
Employed part-time 0.0 16.7
Retired 23.1 14.3
Other 38.4 11.9
Health Status Excellent/Very Good 61.5 52.4
Physical activity Meeting recommendations* 30.8 45.2
*measured using the single-item physical activity questionnaire (Milton et. al., 2010) which assessed the number of days respondents took part in 30 minutes or more of moderate intensity physical activity in the past week.
C. Journey characteristics
Mode of travel
The most common activity being undertaken by respondents at the time of the interview was either dog
walking (baseline) or walking (follow-up) (Figure 4.5.3). Most respondents indicated walking or cycling was
the only mode of transport used to complete their current journey (92% and 93% at baseline and follow-up,
respectively). One respondent at baseline and three respondents at follow-up cited using a form of public
transport for part of their journey (bus, train or taxi) in addition to walking (data not shown).

Fitter for Walking Evaluation Report 153
Figure 4.5.3 Activity being undertaken by respondents at time of interview
Journey purpose
The main purpose for respondents‟ journeys is shown in Table 4.5.5. Two thirds of respondents were out
for a recreational walk or cycle at baseline (62%). At follow-up over half of the respondents were travelling
home (57%). Only a small number of respondents were travelling for the work or school commute (<3%).
Table 4.5.5 Journey purpose
Baseline Follow-up
% %
Home 30.8 57.1
Recreational activity* 61.5 19.0
Work 0.0 2.4
Education 0.0 2.4
Personal business 7.7 11.9
Social / entertainment 0.0 7.1
*the respondent was just going for a walk or cycle ride around the local area for health, fitness or leisure, there was no specific destination
Journey duration
Respondents were asked about the duration of their journey on foot or by bicycle (depending on which
mode they were using at the time of the survey). Journey duration decreased between baseline and follow-
up for both walking and cycling (Table 4.5.6).
0%
10%
20%
30%
40%
50%
60%
70%
80%
90%
100%
Baseline Follow-up
Walking Cycling Dog Walking

154 Fitter for Walking Evaluation Report
Table 4.5.6 Journey duration on foot / by bike
Baseline Follow-up
Mean minutes ±SD Mean minutes ±SD
Walking 35.0 ±22.9 32.2 ±29.8
Cycling 180.0 ±0.0 33.3 ±25.2
Frequency of journey
Respondents were asked how frequently they completed their current journey (Figure 4.5.4). There was no
change in the proportion of respondents who made their current trip on a daily basis between baseline and
follow-up. There was, however, a slight decrease in the proportion of respondents who used it weekly (46%
at baseline and 41% at follow-up) and an increase in monthly use at follow-up. Overall this change in the
frequency of route use was not significant.
Figure 4.5.4 Frequency of route use for current journey by respondents
D. Characteristics of route use
Frequency of route use during the day and night
Half of the respondents at both survey periods reported using the route on a daily basis during the day time
(50% a baseline and 55% at follow-up) (Figure 4.5.5). While there was a slight increase in daily use at
follow-up, the proportion of those using the route on a weekly basis decreased. Overall changes in route
use during the day time were not significant.
46.2 46.2
0.0
7.7
45.2
40.5
7.1 7.1
0
10
20
30
40
50
Daily Weekly Monthly Yearly
% o
f re
spondente
s
Baseline Follow-up
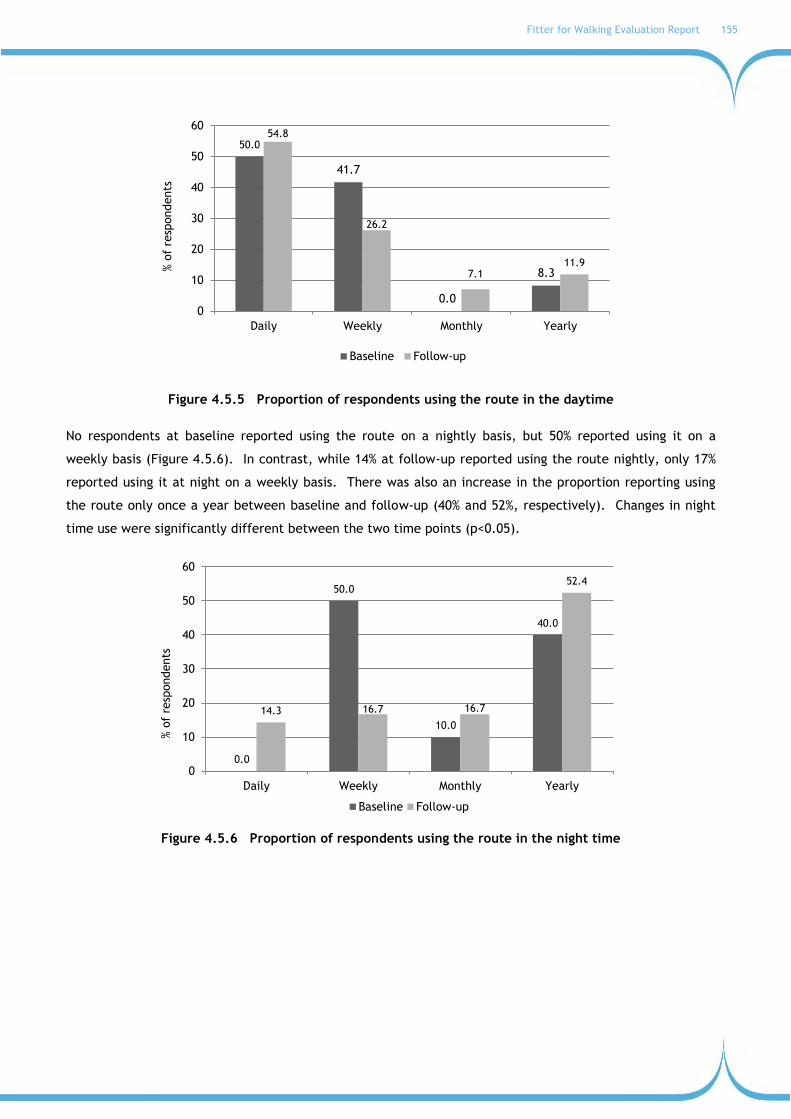
Fitter for Walking Evaluation Report 155
Figure 4.5.5 Proportion of respondents using the route in the daytime
No respondents at baseline reported using the route on a nightly basis, but 50% reported using it on a
weekly basis (Figure 4.5.6). In contrast, while 14% at follow-up reported using the route nightly, only 17%
reported using it at night on a weekly basis. There was also an increase in the proportion reporting using
the route only once a year between baseline and follow-up (40% and 52%, respectively). Changes in night
time use were significantly different between the two time points (p<0.05).
Figure 4.5.6 Proportion of respondents using the route in the night time
50.0
41.7
0.0
8.3
54.8
26.2
7.1 11.9
0
10
20
30
40
50
60
Daily Weekly Monthly Yearly
% o
f re
spondents
Baseline Follow-up
0.0
50.0
10.0
40.0
14.3 16.7 16.7
52.4
0
10
20
30
40
50
60
Daily Weekly Monthly Yearly
% o
f re
spondents
Baseline Follow-up
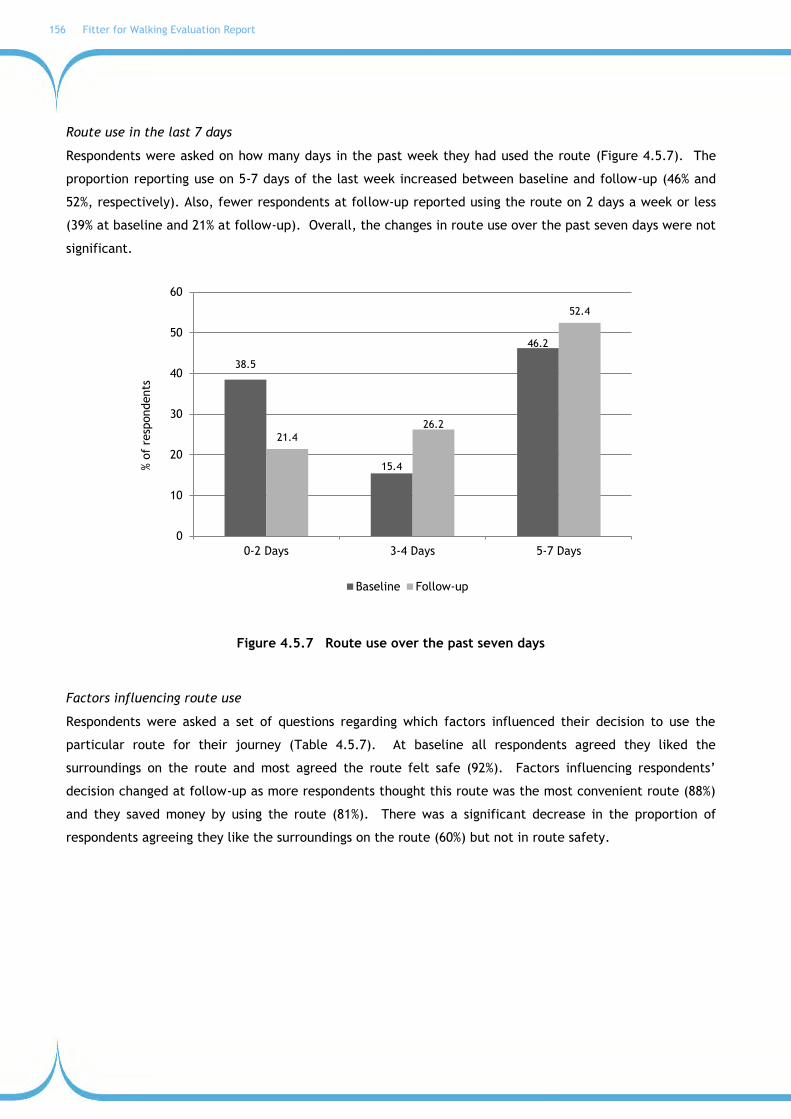
156 Fitter for Walking Evaluation Report
Route use in the last 7 days
Respondents were asked on how many days in the past week they had used the route (Figure 4.5.7). The
proportion reporting use on 5-7 days of the last week increased between baseline and follow-up (46% and
52%, respectively). Also, fewer respondents at follow-up reported using the route on 2 days a week or less
(39% at baseline and 21% at follow-up). Overall, the changes in route use over the past seven days were not
significant.
Figure 4.5.7 Route use over the past seven days
Factors influencing route use
Respondents were asked a set of questions regarding which factors influenced their decision to use the
particular route for their journey (Table 4.5.7). At baseline all respondents agreed they liked the
surroundings on the route and most agreed the route felt safe (92%). Factors influencing respondents‟
decision changed at follow-up as more respondents thought this route was the most convenient route (88%)
and they saved money by using the route (81%). There was a significant decrease in the proportion of
respondents agreeing they like the surroundings on the route (60%) but not in route safety.
38.5
15.4
46.2
21.4
26.2
52.4
0
10
20
30
40
50
60
0-2 Days 3-4 Days 5-7 Days
% o
f re
spondents
Baseline Follow-up

Fitter for Walking Evaluation Report 157
Table 4.5.7 Factors influencing respondents’ decision to use active travel for their journey
Baseline Follow-up Sig.
% agree/strongly agree % agree/strongly agree
Can go straight to destination 30.8 73.8 #
Best transport option 38.5 66.7 #
Most convenient route 61.5 88.1 #
Save money by using this route 23.1 81.0 #
Like the surroundings on this route 100.0 59.5 #
Route feels safe 92.3 64.3 NS
This is the only exercise I get 23.1 16.7 NS
Using this route adds to the exercise I get 69.2 73.8 NS
Environmental concerns 46.2 26.2 NS
#p<0.01 NS=not significant
When asked about route safety in relation to exposure to other people, exposure to traffic and quality of
the surface, at baseline most respondents thought the route safe in these regards (100%, 100% and 92%,
respectively). At follow-up, the proportion of respondents agreeing with route safety decreased. A quarter
of respondents still though it safe in regards to exposure to other people and traffic (76% and 74%,
respectively), but only 62% considered the surface quality safe. This may have been a result of the wet
weather during the second survey period.
Improvements needed to encourage use of route
At baseline and follow-up respondents were asked what specific improvements would help to encourage use
of the route. The most frequently cited improvements suggested were clearance of rubbish/glass,
clearance of dog mess and improved lighting (Table 4.5.8).
Table 4.5.8 Improvements needed to encourage use of route
Baseline Follow-up
% yes % yes
Clearance of rubbish/ glass 53.8 21.4
Clearance of dog mess 23.1 26.2
Clearance of graffiti 0.0 2.4
Clearer information / signage 7.7 2.4
Improved lighting 38.5 23.8
Resurfacing of path 15.4 0.0
Wider path or pavement 7.7 11.9
Planting of new bulbs 0.0 2.4

158 Fitter for Walking Evaluation Report
Perceived change in route use
Just over two fifths of respondents at follow-up (21%) indicated they had used the route more in the last 3
months. A high proportion (67%) indicated their route use had remained the same, but only 12% of
respondents indicated they had used the route less (Figure 4.5.8).
Figure 4.5.8 Perceived change in route use over the last 3 months
E. Project Awareness
Only a small number of respondents were aware of Living Streets (one respondent) or the Fitter for Walking
project (two respondents) at both baseline and follow-up. Only three respondents reported being a
member of a local community or action group.
When asked about their awareness of improvements on the route, at baseline the only cited improvement
was the clearance of rubbish/glass (15%). Almost two thirds of respondents were aware of the new gate
(62%), while only a small proportion of respondents were aware other improvements (Table 4.5.9).
Table 4.5.9 Respondents’ awareness of improvements to route
Baseline Follow-up
% yes % yes
Clearance of rubbish/ glass 15.4 9.5
Clearance of dog mess 0.0 2.4
Clearance of graffiti 0.0 4.8
Resurfacing of path 0.0 9.5
Removal of overgrown hedges 0.0 2.4
New gate ND 61.9
ND=No data collected for this question
21.4
66.7
11.9
0
10
20
30
40
50
60
70
80
More About the same Less
% o
f re
spondents

Fitter for Walking Evaluation Report 159
F. Walking for travel and physical activity
Walking for travel
The proportion of respondents walking for travel on 5-7 days in the past week did not change between
baseline and follow-up. Respondents reported walking more frequently at follow-up as the proportion using
it on 3-4 days increased by 10%. This change in route use frequency, however, was not significant. While
mean minutes of walking undertaken by respondents increased by 109 minutes between baseline and
follow-up, this increase was not significant (Table 4.5.10).
Table 4.5.10 Total walking for travel in the past week
Baseline Follow-up
Mean minutes ±SD Mean minutes ±SD
Duration of walking for travel 528.5 ±440.1 637.9 ±435.2
Frequency of walking for travel % %
0-2 days 15.4 7.1
3-4 days 0.0 9.5
5-7 days 84.6 83.3
At baseline respondents most frequently reported walking for journeys to leisure facilities (85%), to the
shops (69%) and to visit friends and family (62%) (Figure 4.5.9). At follow-up a higher proportion of
respondents indicated they walked for the work commute (48%) and for business-related trips (10%). While
half of the respondents still reported walking for journeys to the shops, to leisure facilities and to visit
friends and family (55%, 74% and 48%, respectively), all three decreased in comparison to baseline.
Figure 4.5.9 Types of journeys respondents normally walked for
7.7
15.4
7.7
69.2
84.6
61.5
38.5
47.6
11.9 9.5
54.8
73.8
47.6
16.7
0
10
20
30
40
50
60
70
80
90
Work commute School/college Business-relatedtrips
Shopping Recreationand fitness
To visit friendsand family
For personalbusiness
% o
f re
spondents
Baseline Follow-up

160 Fitter for Walking Evaluation Report
Respondents were asked to what extent they agreed with two statements asking about their intention to
walk more and likelihood of walking more in the next 12 months. At baseline only 39% agreed they
intended to and were likely to walk more in the coming year (Table 4.5.11). At follow-up, half of the
respondents agreed they intended to walk more, and there was a slight increase in those who thought it
likely they would walk more. Overall the changes between baseline and follow-up were not statistically
significant.
Table 4.5.11 Intention and likelihood of walking more in the next 12 months
Baseline Follow-up Sig.
% agree/strongly agree %agree/strongly agree
I intend to walk more in the next 12 months
38.5 50.0 NS
It is likely that I will walk more in the next 12 months
38.5 40.5 NS
NS= Not significant
Physical activity
There was an increase in the proportion of respondents meeting physical activity recommendation between
baseline and follow-up (31% and 45%, respectively). This increase, however, was not significant (Figure
4.5.10).
Figure 4.5.10 Proportion of respondents meeting physical activity recommendations
0%
10%
20%
30%
40%
50%
60%
70%
80%
90%
100%
Baseline Follow-up
Meeting recommendations Not meeting recommendations

Fitter for Walking Evaluation Report 161
G. Community cohesion
Respondents were asked whether they agreed or disagreed with a set of statements regarding the
community in the neighbourhood in which they lived (Table 4.5.12). At both time points over 50% of
respondents agreed there was a sense of community in their neighbourhood. While all respondents at
baseline agreed that people were willing to help each other, only 39% agreed people were willing to work
together to improve the local area. In contrast, at follow-up, while respondents‟ perceptions of people‟s
willingness to help each other decreased, more thought people were willing to work together to improve
the area (64% and 52%, respectively).
Table 4.5.12 Perceptions of community cohesion
Baseline Follow-up
% agree/strongly agree % agree/strongly agree
There is a sense of community 69.2 54.8
People are willing to help each other 100.0 64.3
People get along with each other 84.6 64.3
People share the same values 61.5 40.5
People are willing to work together to improve the local area
38.5 52.4

162 Fitter for Walking Evaluation Report
4.6 CASE STUDY F: Weddell Wynd, Wolverhampton
PROJECT SUMMARY
Local Authority: Wolverhampton
Path entrance after improvements
Location: Weddell Wynd,
Wolverhampton
Registered group: Weddell Wynd Residents
Date of registration: February 2009
Date of completion: December 2010
The primary focus of this project is the Weddell Wynd Linear Path which runs along the boundary
between Wolverhampton and Sandwell. The path is a route to Asda, a sports academy and there are links
to canals, open green space, a youth club, fishing pool and metro tramline station. Although it was
already a well-used path, barriers to walking identified along the path included the condition of path,
dog fouling, litter and water pooling on the path.
The Fitter for Walking Award was presented to the Residents‟ group in May 2011.
Project activities
Street audit (August 2009)
Changes made to this route include:
- Footway maintenance on the linear path, removal of vegetation and encroachment, removal of
high kerb, new litter bin (February 2010)
- Removal of a mound of earth to improve sight lines (June 2010)
- New benches were installed (October 2010)
Other project activities have included:
- Bulb planting (to help hide metal fencing at the back of residents‟ properties) (December 2009)
- Led walks
- Wildlife related activities

Fitter for Walking Evaluation Report 163
Examples of project activities
Kissing gate BEFORE Kissing gate AFTER
Footpath BEFORE Footpath AFTER

164 Fitter for Walking Evaluation Report
SUMMARY OF RESULTS
The project co-ordinator‟s and community members‟ views of this project are presented below. A summary
of the findings from the route user counts, intercept surveys and residents‟ surveys are also reported below,
followed by a detailed breakdown of results.
Project Co-ordinator’s views
The project co-ordinator was interviewed to ask about the background to the project and their experiences
of working with this community.
The project was based around a path that had been neglected for some time and as a result had a number
of problems preventing local people from using it.
…issues of fly tipping, the actual state of the path, the grass verges either side of the path had been unattended so what was a four or five foot width path had actually gone down to a foot in some areas with encroachment, dog fouling, issues with a mound visibility, beyond that people‟s concerns over their safety because you couldn‟t see around the mound.
Project Co-ordinator, West Midlands
The challenges of the project were confounded by the fact that it was split across two local authorities.
The path is on the boundary of Wolverhampton and Sandwell, and at the end of the path there‟s an open
space which is split between the two boroughs. This meant that the co-ordinator had to split time and
effort between two authorities. Although there were a number of problems with one of the authorities,
these were largely overcome and the co-ordinator was successful in encouraging action from both sides.
Yes, Sandwell have cleared fly tipping, changed the locks on a gate that was allowing unauthorised access for vehicles to actually fly tip on the site. Wolverhampton have cleared the path, the mound, installed a bin that was never there, cut back trees and I‟ve asked them to do that maintenance year on year or so which is a big thing because it adds onto their budget.
Project Co-ordinator, West Midlands
There appears to have been good cooperation between the authorities as a result of the project, with each
body taking on its responsibilities (and in some cases, working on each other‟s areas). Money was a
challenge as the area didn‟t have a specific budget attached to it, so the FFW co-ordinator had to convince
both authorities that the potential for walking made this worth the investment.
The other challenge of this project was that there was not a clear residents‟ association to work with: the
co-ordinator had to make links with a number of community members to understand their needs and work
with them. But this seemed to work well and added value to the project by adding a legitimate
communication route.

Fitter for Walking Evaluation Report 165
I think some residents are quite well known amongst local authorities for kind of calling up and so there is always that, „they‟re on the phone again‟, so the conversation or the outcome‟s not always successful, whereas we… come in and be that body between the Local Authority and the community, we‟re independent and we just use our skills for negotiating things better with our partners and relaying things that are achievable.
Project Co-ordinator, West Midlands
The physical works were also supplemented by community action to get people involved in making
improvements to the area.
We‟ve done planting with the local residents; we‟ve worked with a primary school to do wildlife planting in an afterschool environmental club.
Project co-ordinator, West Midlands
The group has now received a FFW award to reward their activity and to encourage them to plan for the
future.
Community members’ views
Community members identified the Weddell Wynd as an area that needed improvement, especially as it had
the potential to link together so many different parts of the area.
It‟s got several exits and entrances, there‟s like almost a crossroads between the Rocket and the Wednesbury Oak Estate. Children use it for school… its now called RSA Academy. People use it for the Asda, they use it to get to Princes End, they use it to get to the sports unit on the rocky side, so it is a bit of a thoroughfare actually. I suppose it‟s not in brilliant condition, but it is fairly useful all the same because it‟s there, and people also use it for keeping horses.
Community member, Weddell Wynd Residents
Although there was not an „official‟ community or residents‟ association, a number of community members
came together to help the project co-ordinator think through the plans. They found the street audit
extremely helpful in focusing on the area‟s problems.
I thought [the street audit] was absolutely brilliant. It was so well laid out and so well thought out, I thought it was absolutely brilliant. It was sold to me on my eyes really to how good the organisation is, you know, how thorough they are. You know, wonderful, I‟m glad I got involved.
Community member, Weddell Wynd Residents
The community members interviewed were very happy with the improvements to the area and noted a lot
more use, especially by school children and parents. The one remaining problem is that one part of the path
is very steep and slippery and presents a real problem to some people – especially disabled people or those
pushing buggies. The project co-ordinator tried on many occasions to persuade the local authorities to

166 Fitter for Walking Evaluation Report
tackle this but they were unwilling to spend the money to either reduce the gradient or resurface the path;
this remains a challenge.
I take two walking sticks if I‟m going walking myself to help me up, because you can just imagine, like a mountain, like a big slope, and it‟s just straight, there‟s no steps. I managed to get that tarmac put up there because at one point it was just sludge and clay, you know.
Community member, Weddell Wynd Residents
Route user counts, route user surveys and residents’ surveys
Route user counts were conducted on the project route at baseline (May 2010), 12 months (May 2011), 16
months (September 2011). Route user intercept surveys were conducted simultaneously on the first two of
these occasions (May 2010 and May 2011). Counts and surveys were conducted over 2 days on each occasion,
one week day and one weekend day for 12 hours on each day. At baseline 35 route users participated in
the intercept survey with 17 respondents taking part in the 12 month survey.
In addition a survey was conducted with a small number of residents living within 1 mile of the route. Only
11 residents responded to the survey therefore the results from the residents‟ surveys should be interpreted
with caution due to the low response rates.
Full details of the data collection methods are provided in Chapter 2.
Barriers to walking
At baseline, respondents to the route user survey highlighted a number of improvements that were required
to the area to encourage walking on the route including: clearance of rubbish/glass (26%); improved lighting
(26%); clearance of dog mess (17%); wider path or pavement (9%) and clearer information/signage (9%). At
follow-up the main improvements suggested to encourage use of the route were resurfacing of the path
(12%) and removal of overgrown hedges (12%) however no-one mentioned the need for clearance of
rubbish/glass or dog mess suggesting that some of the barriers to walking have been removed through the
Fitter for Walking project.
Project awareness and participation
At baseline, 17% of respondents had heard of Living Streets and 20% knew of the Fitter for Walking project
however at follow-up only one respondent had heard of Living Streets and knew of the project. Almost a
third of respondents at follow-up were aware of the removal of overgrown hedges (29%) and 12% though the
path was wider.
Some of the respondents to the residents‟ survey were aware of the clearance of rubbish/glass on the path
and thought the path was wider. Two residents were aware of the Fitter for Walking Award presented by
Living Streets to the community.

Fitter for Walking Evaluation Report 167
A third of respondents to the residents‟ survey reported they had personally been involved in community
activities to make the neighbourhood safer and a more pleasant place to walk.
Community cohesion
At follow-up route users reported that there was a sense of community (59%) in the neighbourhood where
they lived and around three quarters agreed people in their neighbourhood are willing to help each other
(77%) and get along with each other (71%). Residents reported people in their neighbourhood being more
willing to help each other and more willing to work together than 18 months ago and half of respondents
agreed more people stop to talk to each other in the streets.
Walking & route use
Route user counts showed that use of the Weddell Wynd by pedestrians appears to have increased. In
September 2011, there were 35% more walkers than at baseline (May 2010). During all survey periods adult
males (aged 16-59) accounted for the highest proportion of route users (almost half of route users and
baseline and follow-up 1). Children (aged 0-15) accounted for around a quarter of route users during survey
periods. Older females were the least frequent users of the route. At baseline route use was higher on a
weekend day, however at both follow-ups route use was higher on a week day.
Route user survey data showed that the majority of respondents were using the route to walk their dogs (74%
at baseline and 71% at follow-up). Only around 23% of route users were walking for other purposes and no
other modes of transport were being used for their journeys. At baseline 80% of respondents were
travelling home; 9% were travelling for personal business or shopping and 6% were travelling to get to school
or college. At follow-up 53% of respondents were travelling for recreational purposes (for health, fitness of
leisure including dog walking) and 41% were travelling home. Respondents mean journey time increased by
4 minutes between baseline and follow-up. There was an 8% increase in route use on a daily basis between
baseline and follow-up. At follow-up, respondents agreed that factors influencing their decision to travel
actively (walk or cycle) on the route included being able to go straight to their destination (94%); the most
convenient route (88%); the best transport option (82%) and having environmental concerns (82%).
Half of respondents to the residents‟ survey (n=5) agreed they had increased the amount of walking they do
for short journeys around their neighbourhood in the last 12-18 months. The main reasons for the change
were the cost of public transport going up, changing job, the area feeling safer and to get fitter and
healthier.
Residents reported the perceived benefits of using the route to include a decrease in stress, increased
physical activity levels and feeling fitter and healthier. Over a third of respondents to the residents‟ survey
agreed they had seen more people walking in their neighbourhood and reported finding new walking routes.
A third also reported it was more pleasant to walk around their neighbourhood.

168 Fitter for Walking Evaluation Report
Health and well-being
The increases in walking observed in this project are likely to lead to benefits for health and well-being in
the longer-term; however it was not possible to measure changes in health and well-being as part of this
evaluation.
Overall comments
This project identified a clear need to remove barriers to walking on the Weddell Wynd linear path.
Factors preventing its‟ use included dog fouling, litter and pooling on the path which were successfully
addressed as part of the project. In addition, encroaching hedgerows were removed from parts of the path
and some of the path was resurfaced. New benches and litter bins were installed on the path and
promotional activities such as led walks took place to encourage its use. Both route users and residents
were aware of the changes that had been made as part of the project though few had heard of Fitter for
Walking or taken part in project activities. Residents appear to have noticed some improvements in
community cohesion in the last 12-18 months. This route is popular for recreational purposes (eg, dog
walking) as well as being a route to get to local shops, schools etc. and more people appear to be walking
along the route following project activities.

Fitter for Walking Evaluation Report 169
RESULTS
4.6.1 Route user perspectives
Route user counts were conducted on three occasions commencing in May 2010 (baseline) and repeated
after 12 months (follow-up 1) and 16 months (follow-up 2). Route user intercept surveys took place
simultaneously on two of these occasions: baseline and follow-up 1. At each time point, the counts and
surveys took place over two days, one week day and one weekend day. The methods are reported in full in
Chapter 2.
The weather on the days when the counts and surveys took place usually started out cold/damp but became
warm in the afternoon. During follow-up 1 there was also rain on both days, and the weekend day of
follow-up 2 had heavy rain in the early evening (Table 4.6.1). Across all three survey periods, no incidents
were noted that may have affected route use.
Table 4.6.1 Dates, days and weather for route user counts and surveys
Dates Days Weather
Baseline 15-May-10 Saturday Cold and mostly dry all day.
18-May-10 Tuesday Cold and mostly dry all day.
Follow-up 1
14-May-11 Saturday
Mixed, cold with some rain until 10.30am,
damp/overcast until 2pm then warm but wet until
5pm, remaining wet and cold until 7pm.
17-May-11 Tuesday
Started cold and mostly dry, from 10.00am-3.30pm
it was warm and mostly dry, the weather was then
mixed with some rain between 6-7pm.
Follow-up 2# 08-Sept-11 Thursday Damp/overcast to start with, cold and dry until
1400hrs then warm and dry for the rest of the day.
10-Sept-11 Saturday
Warm and dry for most of the day apart from 9-
9.30pm when it was warm, but wet and a period of
heavy rain at 5.30pm. #Count only (no survey)

170 Fitter for Walking Evaluation Report
4.6.2.1 Route user counts
A. Characteristics of route users
Table 4.6.2 shows the proportion of route users by age category and gender. Adult males represented the
highest proportion of those using the route across all three time points. Older female adults accounted for
the lowest proportion of route users.
Table 4.6.2 Route user characteristics by age and gender at baseline and follow-up
Baseline Follow-up 1 Follow-up 2
% % %
Minor (age 0-15) 26.3 20.8 27.9
Adult Male (age 16-59) 48.8 47.4 33.3
Adult Female (age 16-59) 22.8 18.8 21.7
Older Male (age 60+) 2.2 12.3 13.3
Older Female (age 60+) 0.3 0.6 3.8
B. Route use
Overall 320 individuals used the route at baseline. This included walkers, cyclists, wheelchair users,
joggers and infants in pushchairs. At follow-up 1 route use decreased by 52% however, at follow-up 2, the
number of individuals using the route increased by 31% compared to baseline (Figure 4.6.1). Route use was
highest on the weekend day at baseline but at both follow-up periods week day use was greatest.
Figure 4.6.2 shows route use for pedestrians only. At baseline 280 pedestrians used the route over the two
day survey period. At follow-up 2 the number of pedestrian users increased by 35% compared to baseline.

Fitter for Walking Evaluation Report 171
Figure 4.6.1 Number of route users (all modes of travel) at baseline and follow-up
Figure 4.6.2 Number of route users (pedestrians only) at baseline and follow-up
320
154
420
141
94
233
179
60
187
0
50
100
150
200
250
300
350
400
450
Baseline Follow-up 1 Follow-up 2
Num
ber
of
indiv
iduals
Total Week day Weekend day
280
134
378
128
81
214
152
53
164
0
50
100
150
200
250
300
350
400
Baseline Follow-up 1 Follow-up 2
Num
ber
of
indiv
iduals
Total Week day Weekend day

172 Fitter for Walking Evaluation Report
4.6.2.2 Route User Intercept Surveys
A. Response rates
Route user intercept surveys were conducted on two occasions during the project: baseline and 12 months
(follow-up). The response rate to the survey varied between the two data collection periods (Table 4.6.3).
Table 4.6.3 Route user survey responses
Surveys completed
(n)
Surveys declined
(n)
Response rate (%)
Main reasons for declining
Baseline Saturday 15 May 2010
Tuesday 18 May 2010 35 37 49
Already interviewed (48.6%)
Communication difficulties (18.9%)
Refused (16.2%)
Follow-up Saturday 14 May 2011
Tuesday 17 May 2011 17 75 18
Refused (42.7%)
Communication difficulties (16.0%)
Already interviewed (13.3%)
B. Route user characteristics
The characteristics of respondents surveyed at each data collection point are shown in Table 4.6.4. At
baseline and both follow-up measurements a higher proportion of males than females took part in the
survey. The highest proportions of respondents were aged 45-54 at both baseline and follow-up. All
respondents were of white ethnic background, and almost half reported being in full time employment at
baseline and follow-up. A high proportion of respondents indicated they were in excellent or good health
(60% at baseline and 88% at follow-up), but a low proportion of respondents reported meeting physical
activity recommendations (30 minutes or more of moderate intensity physical activity on at least 5 days of
the week) at both baseline (20%) and follow-up (18%).
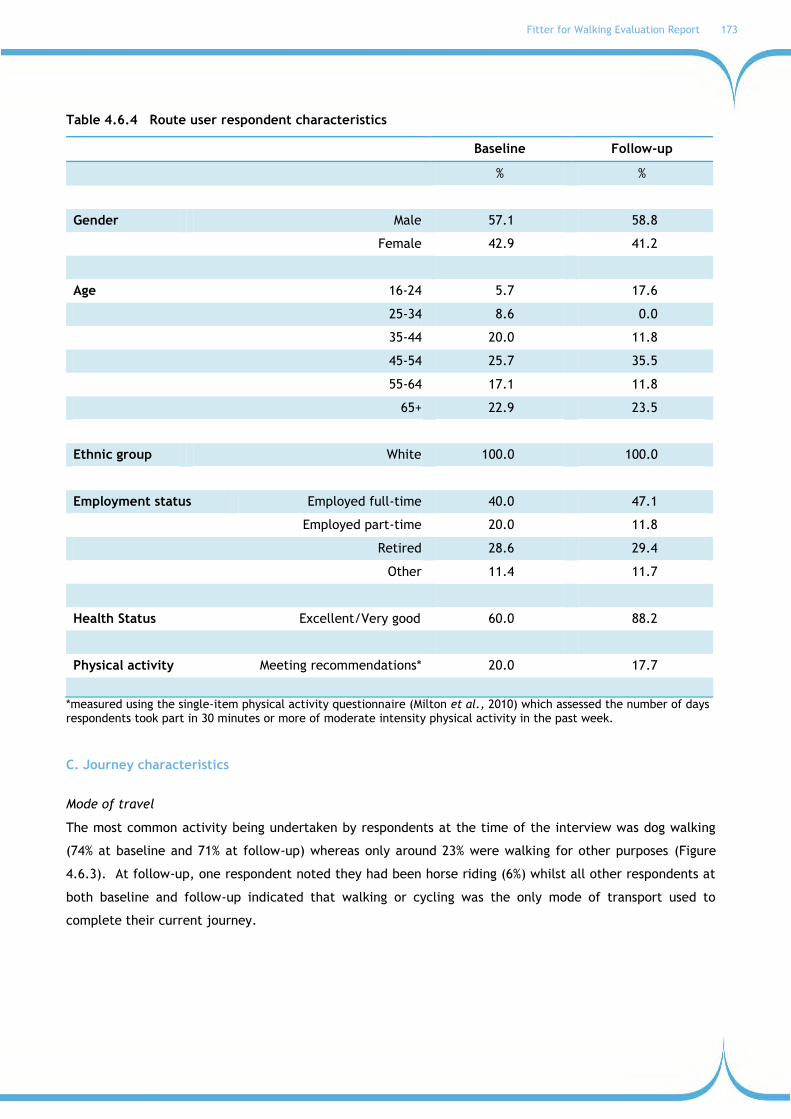
Fitter for Walking Evaluation Report 173
Table 4.6.4 Route user respondent characteristics
Baseline Follow-up
% %
Gender Male 57.1 58.8
Female 42.9 41.2
Age 16-24 5.7 17.6
25-34 8.6 0.0
35-44 20.0 11.8
45-54 25.7 35.5
55-64 17.1 11.8
65+ 22.9 23.5
Ethnic group White 100.0 100.0
Employment status Employed full-time 40.0 47.1
Employed part-time 20.0 11.8
Retired 28.6 29.4
Other 11.4 11.7
Health Status Excellent/Very good 60.0 88.2
Physical activity Meeting recommendations* 20.0 17.7
*measured using the single-item physical activity questionnaire (Milton et al., 2010) which assessed the number of days respondents took part in 30 minutes or more of moderate intensity physical activity in the past week.
C. Journey characteristics
Mode of travel
The most common activity being undertaken by respondents at the time of the interview was dog walking
(74% at baseline and 71% at follow-up) whereas only around 23% were walking for other purposes (Figure
4.6.3). At follow-up, one respondent noted they had been horse riding (6%) whilst all other respondents at
both baseline and follow-up indicated that walking or cycling was the only mode of transport used to
complete their current journey.
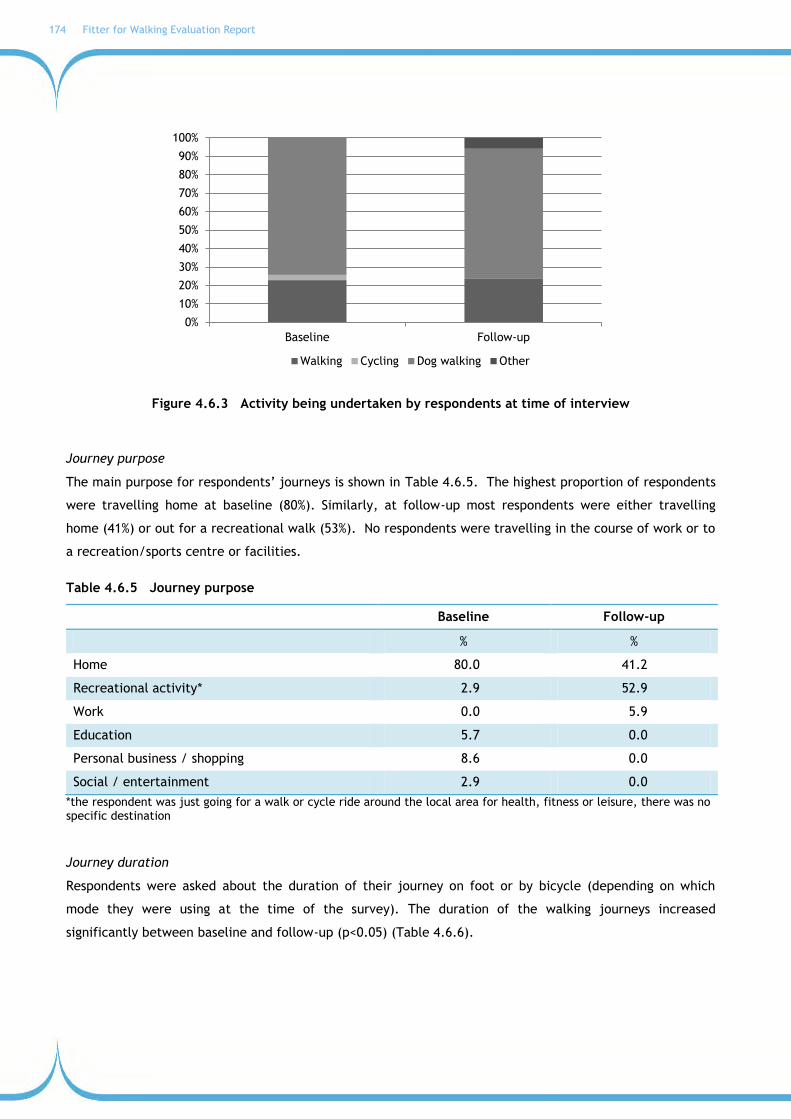
174 Fitter for Walking Evaluation Report
Figure 4.6.3 Activity being undertaken by respondents at time of interview
Journey purpose
The main purpose for respondents‟ journeys is shown in Table 4.6.5. The highest proportion of respondents
were travelling home at baseline (80%). Similarly, at follow-up most respondents were either travelling
home (41%) or out for a recreational walk (53%). No respondents were travelling in the course of work or to
a recreation/sports centre or facilities.
Table 4.6.5 Journey purpose
Baseline Follow-up
% %
Home 80.0 41.2
Recreational activity* 2.9 52.9
Work 0.0 5.9
Education 5.7 0.0
Personal business / shopping 8.6 0.0
Social / entertainment 2.9 0.0
*the respondent was just going for a walk or cycle ride around the local area for health, fitness or leisure, there was no specific destination
Journey duration
Respondents were asked about the duration of their journey on foot or by bicycle (depending on which
mode they were using at the time of the survey). The duration of the walking journeys increased
significantly between baseline and follow-up (p<0.05) (Table 4.6.6).
0%
10%
20%
30%
40%
50%
60%
70%
80%
90%
100%
Baseline Follow-up
Walking Cycling Dog walking Other

Fitter for Walking Evaluation Report 175
Table 4.6.6 Journey duration on foot
Baseline Follow-up
Mean minutes ±SD Mean minutes ±SD
Walking 17.5 ±17.9 21.3 ±10.3
Frequency of journey
Respondents were asked how frequently they completed their current journey. At baseline, most
respondents indicated they made this journey on a daily basis or multiple times throughout the week (63%
and 34%, respectively). Use of the route on a daily basis increased by 8% between baseline and follow-up
however weekly use declined by 11%. Only a small proportion indicated they complete their current
journey only on a monthly (6% at follow-up) or yearly (3% at baseline) basis (Figure 4.6.4). The changes in
journey frequency between baseline and follow-up were not significant.
Figure 4.6.4 Frequency of route use for current journey by respondents
D. Characteristics of route use
Frequency of route use during the day and night
Data concerning daytime and night time use of the route was only collected at baseline for this project.
Over two thirds of respondents reported using this route on a daily basis (68%), while only a very small
proportion (6%) reported using the route at this frequency at night time. Most respondents indicated they
rarely used the route at night time (83%) (Figure 4.6.5).
62.9
34.3
0.0 2.9
70.6
23.5
5.9 0.0
0
10
20
30
40
50
60
70
80
Daily Weekly Monthly Yearly
% o
f re
spondents
Baseline

176 Fitter for Walking Evaluation Report
Figure 4.6.5 Proportion of respondents using the route at day and night times
Route use in the last 7 days
Respondents were asked on how many days in the past week they had used the route. This data was only
collected at baseline for this project. The highest proportion of respondents reported using this route on 5
-7 days over the past week (60%). A quarter of respondents reported they used the route 3-4 of the past
seven days, and only 14% reported using it less frequently (data not shown).
Factors influencing route use
Respondents were asked a set of questions regarding which factors influenced their decision to use an
active mode of travel on the particular route for their journey (Table 4.6.7). At baseline a high proportion
of respondents agreed that it was the most convenient route (91%); the best transport option (90%); they
liked the surroundings on the route (86%) and the route feels safe (79%). There was also agreement with
these factors at follow-up and in addition a high proportion of respondents agreed they could go straight to
their destination (94%); they had environmental concerns (82%); it was the only exercise they got (77%);
they saved money by using the route (71%) and using the route adds to their exercise (71%).
Questions regarding respondents‟ perceptions of route safety in relation to exposure to other people,
exposure to traffic and quality of the surface were only asked at baseline. Almost all respondents (97%)
thought the route was safe in regards to exposure to other people. Similarly, 77% reported they thought
path‟s surface quality was safe. Only 9% reported the route felt safe in regards to exposure to traffic (data
not shown).
67.6
29.4
2.9
5.7 11.4
82.9
0
10
20
30
40
50
60
70
80
90
Daily Weekly Yearly
% o
f re
spondents
Daytime Night time

Fitter for Walking Evaluation Report 177
Table 4.6.7 Factors influencing respondents’ decision to use active travel for their journey
Baseline Follow-up Sig.
% agree/strongly agree % agree/strongly agree
Can go straight to destination 45.2 94.1 *
Best transport option 90.3 82.4 NS
Most convenient route 91.2 88.2 NS
Save money by using this route 22.6 70.6 *
Like the surroundings on this route 85.7 76.5 #
Route feels safe 79.4 82.4 NS
This is the only exercise I get 54.3 76.5 *
Using this route adds to the exercise I get 48.6 70.6 *
Environmental concerns 22.9 82.4 *
*p<0.05 #p<0.01 NS=not significant
Improvements needed to encourage use of route
At baseline and follow-up respondents were asked what specific improvements would help to encourage use
of the route. The most frequently cited improvements suggested at baseline were clearance of
rubbish/glass (26%), improved lighting (26%) and clearance of dog mess (17%), whereas at follow-up,
clearance of rubbish/glass (12%) and removal of overgrown hedges (12%) were identified as the most
necessary improvements needed to encourage use (Table 4.6.8).
Table 4.6.8 Improvements needed to encourage use of route
Baseline Follow-up
% yes % yes
Clearance of rubbish/glass 25.7 11.8
Clearance of dog mess 17.1 0.0
Clearance of graffiti 2.9 0.0
Clearer information/signage 8.6 0.0
Improved lighting 25.7 5.9
Resurfacing of path 0.0 5.9
Wider path or pavement 8.6 5.9
Removal of overgrown hedges 5.7 11.8
Dropped kerbs installed 2.9 0.0
Planting of new bulbs 2.9 0.0

178 Fitter for Walking Evaluation Report
Perceived change in route use
It is not possible to report on perceived change in route use for this project as this question was not
answered by respondents at follow-up.
E. Project Awareness
At baseline, 17% of respondents reported they had heard of Living Streets and 20% knew of the FFW project.
At follow-up only one respondent indicated they had heard of the Living Streets (6%) and one respondent
knew of the project (6%). Membership of a local residents or community action group was also low at both
survey points (6% at both baseline and follow-up).
When asked about their awareness of improvements on the route, at both baseline and follow-up the
highest proportion of respondents noted overgrown hedges had been removed (51% at baseline and 29% at
follow-up). A third of respondents were also aware of the installation of new benches (35%). Less than 10%
were aware of any clean-up of rubbish/glass and two respondents thought the path/pavement was wider
(Table 4.6.9).
Table 4.6.9 Respondents’ awareness of improvements to route
Baseline Follow-up
% yes % yes
Clearance of rubbish/ glass 8.6 5.9
Clearance of graffiti 0.0 5.9
Clearer information / signage 0.0 5.9
Resurfacing of path 0.0 5.9
Wider path or pavement 5.7 11.8
Removal of overgrown hedges 51.4 29.4
New seating ND 35.2
New waste bins ND 11.7
ND= no data collected
F. Walking for travel and physical activity
Walking for travel
A higher proportion of respondents walked for travel on 5-7 days of the week at follow-up compared to
baseline. Decreases were seen in both those reporting 3-4 days and 2 or less days of walking for travel over
the past week at follow-up. Changes in walking for travel over the past week between baseline and follow-
up were significant (p<0.05). Mean minutes of walking for travel in the past week was significantly higher
for respondents at follow-up than at baseline (Table 4.6.10).

Fitter for Walking Evaluation Report 179
Table 4.6.10 Total walking for travel in the past week
Baseline Follow-up
Mean minutes ±SD Mean minutes ±SD
Duration of walking for travel 151.3 ±186.3 667.1 ±371.6#
Frequency of walking for travel % %
0-2 days 40.0 5.9
3-4 days 20.0 17.6
5-7 days 40.0 76.5
#p<0.01
At baseline respondents most frequently reported walking for journeys to the shops (60%), to visit friends
and family (29%) and to get to leisure facilities (29%) (Figure 4.6.9). At follow-up a much higher proportion
of respondents indicated they walked to get to leisure facilities (77%) but fewer reported walking to the
shops (12%). There was little or no change in the proportion of individuals walking for the work commute
(17% at baseline and 18% at follow-up) and for personal business or shopping (14% at baseline and 12% at
follow-up).
Figure 4.6.9 Types of journeys respondents normally walked for
Respondents were asked to what extent they agreed with two statements asking about their intention to
walk more and likelihood of walking more in the next 12 months. At baseline almost half of respondents
(46%) agreed they intended to walk more in the coming year, but only 18% agreed they were likely to (Table
17.1
5.7
60.0
28.6 28.6
14.3
17.6
0.0
11.8
76.5
11.8 11.8
0
10
20
30
40
50
60
70
80
90
Work commute School/College Shopping Recreationand fitness
To visit friendsand family
For personalbusiness
% o
f re
spondents
Baseline Follow-up

180 Fitter for Walking Evaluation Report
4.6.11). The proportion agreeing they intended to walk more or were likely to walk more decreased at
follow-up. Overall, the changes between baseline and follow-up were statistically significant.
Table 4.6.11 Intention and likelihood of walking more in the next 12 months
Baseline Follow-up Sig.
% agree/strongly agree
% agree/strongly agree
I intend to walk more in the next 12 months 45.7 17.6 *
It is likely that I will walk more in the next 12 months 51.4 0.0 *
*p<0.05 #p<0.01
Physical activity
There was no significant change in the proportion of respondents meeting physical activity
recommendations between baseline and follow-up. At baseline only 20% of respondents reported taking
part in at least 30 minutes of moderate physical activity for five or more days in the past week. Similarly,
at follow-up only 18% were meeting physical activity recommendations (Figure 4.6.10).
Figure 4.6.10 Proportion of respondents meeting physical activity recommendations
G. Community cohesion
Respondents were asked whether they agreed or disagreed with a set of statements regarding the
community in the neighbourhood where they lived (Table 4.6.12). Over half of respondents agreed there is
a sense of community in their neighbourhood (59%). About three quarters of respondents also agreed
people in their neighbourhood are willing to help each other and people in their neighbourhood get along
with each other (77% and 71%, respectively).
0%
10%
20%
30%
40%
50%
60%
70%
80%
90%
100%
Baseline Follow-up
Meeting recommendations Not meeting recommendations

Fitter for Walking Evaluation Report 181
Table 4.6.12 Perceptions of community cohesion*
Follow-up
% agree/strongly agree
There is a sense of community 58.8
People are willing to help each other 76.5
People get along with each other 70.6
People share the same values 23.5
People are willing to work together to improve the local area 41.2
*these questions were not asked at baseline for this project

182 Fitter for Walking Evaluation Report
4.6.3.1 Residents’ survey
Surveys were distributed to 200 households situated within a one mile radius of the route where the FFW
project activities took place. An adult member of the household was asked to complete and return the
survey. A total of 11 surveys were returned, all respondents completing the paper version of the survey,
giving a response rate of 6%. The key findings from the survey are outlined below however these should be
interpreted with caution given the low response rate.
A. Respondent characteristics
The key characteristics of respondents are reported in Table 4.6.13. Of those who returned the surveys, a
higher proportion were female (82%), and the mean age of respondents was 61 years. All respondents were
white (100%), and only 18% had no formal qualifications. Almost two-thirds of respondents (64%) reported
their health to be excellent or good, and 36% were meeting physical activity recommendations
(participating in 30 minutes of moderate intensity physical activity on five or more days of the week). All
household had access to a vehicle, with 46% having two or more vehicles available for household use.
Table 4.6.13 Respondent Characteristics
%
Sex Male 18.2
Female 81.8
Ethnic group White 100.0
Other 0.0
Education qualifications Degree 9.1
A level/BTEC Higher 27.3
GCSE/BTEC National 36.4
No formal qualifications 18.2
Number of vehicles in household 0 0.0
1 54.5
≥2 45.5
Health status Excellent/Good 63.6
Physical activity Meeting recommendations* 36.4
Mean ±SD
Age Mean age (years ±SD) 61.2 ±12.2
BMI Mean BMI (kg/m2 ±SD) 26.1 ±3.4
*measured using the single-item physical activity questionnaire (Milton et al., 2010) which assessed the number of days respondents took part in 30 minutes or more of moderate intensity physical activity in the past week.

Fitter for Walking Evaluation Report 183
B. Residents’ travel behaviour
Respondents were asked to identify which modes of travel they usually used when travelling for short
journeys in their neighbourhood. While walking was the most frequently reported mode of travel (n=9, 82%),
over half of the respondents also drove their cars (n=6, 55%) (Figure 4.6.11). Buses were the only form of
public transport used (n=2, 18%), and no respondents cycled or used the car as a passenger for short trips.
Figure 4.6.11 Mode of transport respondents usually use for short journeys
When asked about changes in travel mode for short journeys in the neighbourhood over the last 18 months,
20% of respondents (n=2) agreed they had made no change to the way they travel. Half of the respondents
agreed they had increased the amount of walking they do around their neighbourhood (n=5, 50%), and a
third of respondents agreed they use the bus more (n=3, 33%). One respondent (12.5%) indicated increased
car use in the past 18 months for short journeys. No one reported an increase in train usage or cycling for
short journeys. The main reasons for changing mode of travel included the rising cost of petrol (n=2, 18%)
and to get fitter and healthier (n=2, 18%) (Table 4.6.14).
Table 4.6.14 Reasons for changes in travel behaviour by travel mode
Walk
Car (as driver) Bus
n n n
Agree/strongly agree to increased use of mode in the last 18 months 5 1 3
Reason for change in mode:
Cost of petrol has gone up 0 0 1
Cost of public transport has gone up 1 1 0
Change of job 1 1 0
Change of income 0 0 1
It feels safer 1 1 0
To get fitter and healthier 1 0 0
C. Residents’ route use
81.8
54.5
18.2
0
10
20
30
40
50
60
70
80
90
Walk Car (as driver) Bus
% o
f re
spondents

184 Fitter for Walking Evaluation Report
The highest proportion of respondents reported only using the route once a week (n=3, 33%) with 22% (n=2)
using it only twice a week. In contrast, a fifth of respondents reported using the route on eight or more
occasions (n=2, 22%) with the remaining respondents using it seven or five times a week (n=1, 11% each)
(data not shown).
Respondents were asked to rate their current route use in comparison to 18 months ago. Most respondents
indicated they did not use the route except for recreation, heath or fitness purposes. Over half of the
respondents (n=5) reported they used the route more for recreation or fitness compared to 18 months ago.
In contrast, two respondents (22%) used the route less for recreation or fitness and one respondent (13%)
used the route less for the work commute (Figure 4.6.12). No one reported using the route for business
related trips, the journey to school or college or for personal business.
When respondents were asked about the benefits from using the route, 46% (n=5) reported they felt less
stressed. Over a quarter of respondents reported their physical activity levels had increased (n=3, 27%) and
they felt fitter (n=2, 27%), with a further third reporting they also felt healthier since starting to use the
route (n=4, 36%). No one indicated they saved money or visited local shops more by using the route (Figure
4.6.13).
Figure 4.6.12 Route use compared to 18 months ago by journey purpose
0.0 0.0
12.5
55.6
0.0
25.0
12.5 11.1
12.5
0 0
22.2
0
10
20
30
40
50
60
Work commute To get to publictransport
Social activities Recreation or fitness
% o
f re
spondents
More Same Less
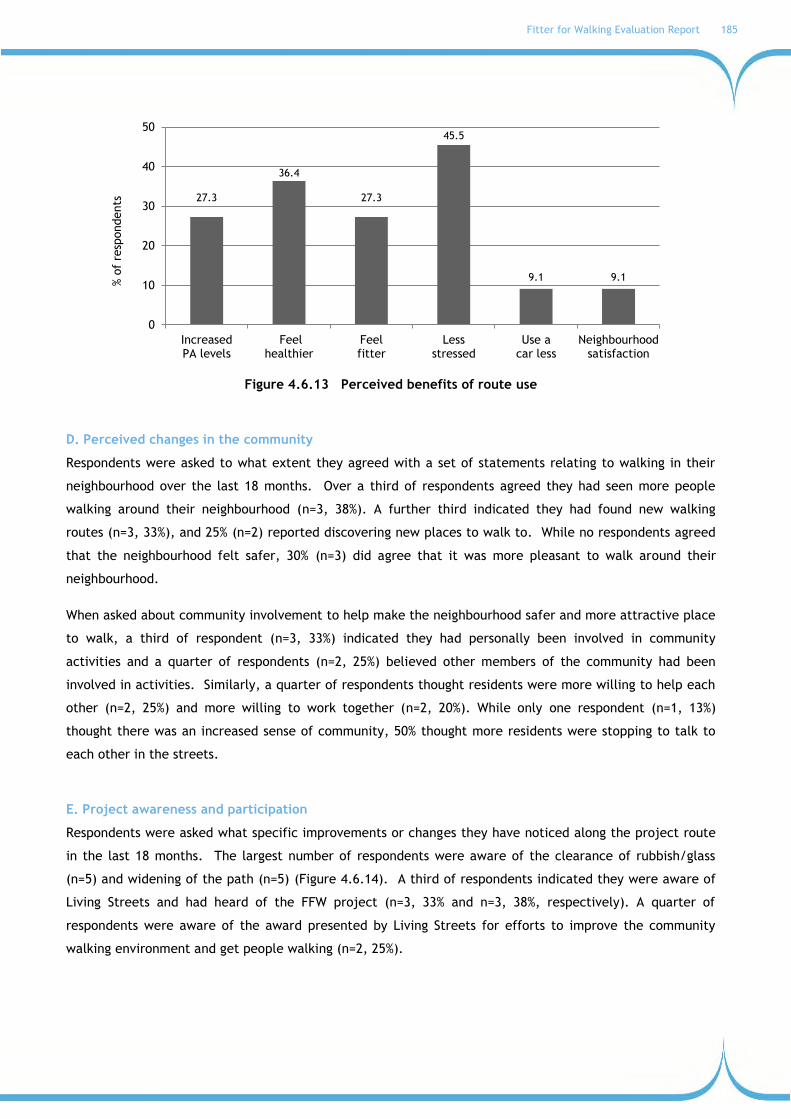
Fitter for Walking Evaluation Report 185
Figure 4.6.13 Perceived benefits of route use
D. Perceived changes in the community
Respondents were asked to what extent they agreed with a set of statements relating to walking in their
neighbourhood over the last 18 months. Over a third of respondents agreed they had seen more people
walking around their neighbourhood (n=3, 38%). A further third indicated they had found new walking
routes (n=3, 33%), and 25% (n=2) reported discovering new places to walk to. While no respondents agreed
that the neighbourhood felt safer, 30% (n=3) did agree that it was more pleasant to walk around their
neighbourhood.
When asked about community involvement to help make the neighbourhood safer and more attractive place
to walk, a third of respondent (n=3, 33%) indicated they had personally been involved in community
activities and a quarter of respondents (n=2, 25%) believed other members of the community had been
involved in activities. Similarly, a quarter of respondents thought residents were more willing to help each
other (n=2, 25%) and more willing to work together (n=2, 20%). While only one respondent (n=1, 13%)
thought there was an increased sense of community, 50% thought more residents were stopping to talk to
each other in the streets.
E. Project awareness and participation
Respondents were asked what specific improvements or changes they have noticed along the project route
in the last 18 months. The largest number of respondents were aware of the clearance of rubbish/glass
(n=5) and widening of the path (n=5) (Figure 4.6.14). A third of respondents indicated they were aware of
Living Streets and had heard of the FFW project (n=3, 33% and n=3, 38%, respectively). A quarter of
respondents were aware of the award presented by Living Streets for efforts to improve the community
walking environment and get people walking (n=2, 25%).
27.3
36.4
27.3
45.5
9.1 9.1
0
10
20
30
40
50
IncreasedPA levels
Feelhealthier
Feelfitter
Lessstressed
Use acar less
Neighbourhoodsatisfaction
% o
f re
spondents

186 Fitter for Walking Evaluation Report
Figure 4.6.14 Number of participants aware of project activities and improvements
Survey respondents reported little participation in the FFW activities. The activities respondents did
participate in are listed in Table 4.6.15, along with the number of respondents who were involved in each
activity.
Table 4.6.15 Fitter for Walking activities
Number of respondents
Street audit 1
Made a walking pledge 2
Helped plant bulbs 2
Finally, while no respondents indicated they would be willing to donate financially to help improve the
walking environment or provide walking focused activities, such as street audits, led walks and street
parties, three individuals indicated they would be willing to donate an hour or two a week to help with such
activities.
5
2 2
5
4
2
4 4 4
0
1
2
3
4
5
6
Clearanceof
rubbish/glass
Clearanceof
dog mess
New infoboards/maps
Wider path Hedgetrimming
Improvedaccess
New benches New litterbins
Bulb planting
Num
ber
of
resp
ondents

Fitter for Walking Evaluation Report 187
4.7 CASE STUDY G: Cliff Hills, Rotherham
PROJECT SUMMARY
Local Authority: Rotherham
Street audit, October 2008
Location: Cliff Hills, Maltby, Rotherham,
Yorkshire
Registered group: Cliff Hills Community Action
Group
Date of registration: October 2008
Date of completion: Expected November 2011
The main concern of the registered group was around safety in crossing Addison Road to the shops on
Laburnum Parade, particularly for the elderly and children from local special schools. The group wished
to improve crossing points and extend existing paths on the green in front of the shops. This had the
potential to benefit all residents in the Cliff Hills area but particularly those living on the opposite side of
Addison Road to where the shops are. Plans were developed to install a dropped kerb crossing point and
extend and improve the path around a small green space in front of the shops. The work was delayed on
several occasions but was finally completed in June 2011. Additional FFW activities took place on
Addision Road in November 2011 including bulb planting by school children from Maltby Redwood Junior
and Infant School and presentation of the Fitter for Walking Neighbourhood Award by the Mayor and
Mayoress of Rotherham to Cliff Hills Community Action Group.
Project activities
Street audit (November 2008)
Changes made to this route include:
- Installation of dropped kerb crossing points
- Extension of the path around a small green space in front of the shops (June 2011)
Other project activities have included:
- School assembly at local primary school to raise awareness of improvements and promote walking
(September 2011)
- Bulb planting with local school and day centre (October/November 2011)

188 Fitter for Walking Evaluation Report
Examples of project activities
Green space in front of Laburnum Parade shops
before the improvements
New dropped kerb and path in front of the Spar around
green space at Laburnum Parade shops
New dropped kerb crossing on Addison Road
Fitter for Walking Evaluation Report 189
SUMMARY OF RESULTS
The project co-ordinator‟s and community members‟ views of this project are presented below. A summary
of the findings from the route user counts, intercept surveys and residents‟ surveys are also reported below,
followed by a detailed breakdown of results.
Project Co-ordinator’s views
The project began after the project co-ordinator was introduced to the Cliff Hills Community Group. They
had already identified a number of problems with the walking environment.
In the Cliff Hills area there‟s a kind of arcade of shops and in front of the shops there‟s a green space, but the routes to and from those shops were kind of very indistinct and very poor, and people that would walk towards the shops had to cross to this green space, or they had to walk in the road to actually get to the shops; the paths didn‟t exist; there was no crossing points either, so I could see that there was a need to kind of improve accessibility to these shops and services.
Project Co-ordinator, Yorkshire.
These were subsequently endorsed in a very well attended community street audit that made some clear
recommendations: for crossings; extending the paths along the green space; and tackling pavement parking.
For the project co-ordinator, this project represented an important step as it was one of the first
community groups he worked with as part of FFW so was a chance to establish working methods and
relationships with the LA. The results of this initial audit were submitted to the LA contact, who confirmed
that this was exactly the sort of report and interaction they were expecting from the project. This helped
to get the project going quickly.
Progress was slow after this initial enthusiasm however, mainly due to finding the funds for the work and
making sure that the works teams were available.
But it has taken quite a long time because it‟s had to go through design and consultation and through, you know, kind of Council cabinet meetings and things like that and it had to be redrawn and resubmitted, and passed again through cabinet and that kind of thing and it all takes time to do that.
Project Co-ordinator, Yorkshire
However, after 2-3 years there were some significant improvements made, including dropped kerbs; new
pathways around the green space; bollards to stop pavement parking; and extra resurfacing. In total around
£50,000 was spent on the project. To launch the project and raise awareness, the co-ordinator organized
the local school to plant bulbs in the middle of the green, and organised the presentation of the FFW award
by the local mayor.
The approach to the project seems to have been appreciated by the LA key contact, who has said that no-
one in the LA really works in this manner, taking time to consult with the community in detail.

190 Fitter for Walking Evaluation Report
I‟m sure they‟ve got, you know, their neighbourhood teams and that that go out and do a bit of kind of public… face-to-face stuff and walking the streets, estate walks where they‟re meeting residents, but there‟s kind of no-one really doing what we‟re doing, to the level that we‟re doing that in terms of engagement and communication and bringing aspects of the community together, bringing services together.
Project Co-ordinator, Yorkshire
Community members’ views
The community members interviewed for the project were very happy with the progress that had been
made, although they were at pains to point out that it took a great deal of work and coordination.
Oh yes, yes, [co-ordinator] did a lot of work for us, he came to us Saturday morning meetings and he pressurised the Councillors and the people that he worked for at Rotherham and…he got involved… we have a Maltby newspaper and we arranged for them to come down and take photos of the area, you know before it were done… we got a good feedback from them so that pushed it along a little bit.
Community member, Cliff Hills
The main challenge was the amount of time it took, due to the long negotiations with the council, but
despite that the community members appreciated the changes and the improved safety in the area.
There‟s a lot of people commented about it and it‟s much safer now because there‟s four or five schools all in the vicinity, you know, and people, young people with pushchairs and old people getting off of busses from shopping and going to shopping, they don‟t have to walk on these busy roads now.
Community member, Cliff Hills
Route user counts, route user surveys and residents’ surveys
Route user counts were conducted on the route at baseline (July 2010), 12 months (July 2011) and 14
months (September 2011). Route user intercept surveys were conducted simultaneously with the counts on
the first two of these occasions (July 2010 and July 2011). Counts and surveys were conducted over two
days on each occasion, one week day and one weekend day for 12 hours on each day. At baseline 90 route
users participated in the intercept survey with 100 respondents at the 12 month survey.
In addition a survey was conducted with a small number of residents living within one mile of the route.
Only 10 residents responded to the survey therefore the results from the residents‟ survey should be
interpreted with caution due to the low response rates.
Full methods are reported in Chapter 2.

Fitter for Walking Evaluation Report 191
Barriers to walking
At baseline respondents to the route user survey highlighted a number of improvements that were required
to the area to encourage walking on the route including: improved crossings (38%), traffic calming (23%),
20mph speed limit (22%), clearance of rubbish/glass (20%), clearance of graffiti (20%) and dropped kerbs
(18%). At follow-up, after the project improvements had been made, there was a reduction in the
proportion of respondents reporting that improvements were needed to address these issues suggesting that
some of the barriers to walking in the area have been removed through the FFW project.
Project awareness and participation
Few route users had heard of Living Streets (≤2% at baseline and follow-up) and only a small proportion had
heard of the Fitter for Walking project (8% at baseline and 7% at follow-up). Respondents reported being
aware of the following improvements that had been made to the area: resurfacing of pavement (38%),
installation of dropped kerbs (16%) and widening of pavements (12%).
Almost all respondents to the residents‟ survey were aware of the path resurfacing and new dropped kerbs
which had been installed in the project area, and half were aware of a wider pavement. Survey
respondents did not report any participation in FFW project activities.
Community cohesion
Route user survey data indicated there were improvements in the views of community cohesion in the area.
Notably there much higher numbers of respondents at follow-up agreeing that „people are willing to help
each other‟, „people are willing to work together to improve the local area‟ and „people share the same
values‟. Smaller increases were also observed in the proportion of route users agreeing that „there is a
sense of community‟ and „people get along with each other‟.
Walking & route use
The route user counts show that use of the route around the Laburnum Parade shops by pedestrians appears
to have increased since the improvements were made to the area. Overall, in September 2011 there were 5%
more walkers than at baseline (July 2010). The route was largely used by children and adults under the age
of 60 with only a small proportion of older adults (<10%) using the route. At baseline a higher proportion of
route users were using the route on a weekend day than a week day however the reverse was true at
follow-up.
Route user survey data showed that for a high proportion of survey respondents walking was the only mode
of transport being used for their journey (69% at baseline and 76% at follow-up). For a high proportion of
respondents their journey purpose was for personal business/shopping or to get home. Respondents‟ mean
journey duration decreased by two minutes between baseline and follow-up. There was a 4% reduction in
respondents using the route on a daily basis between baseline and follow-up however use on a weekly basis
increased by 11%. At follow-up respondents agreed that the factors influencing their decision to travel

192 Fitter for Walking Evaluation Report
actively (walk or cycle) on the route included the possibility to go straight to their destination (86%), it was
the most convenient route (86%), using the route adds to the respondent‟s exercise (86%), the route felt
safe (83%) and active travel is the best transport option (79%). A high proportion of respondents to the
route user survey (80%) agreed the surface quality was safe at follow-up compared to baseline (38%).
Perceived safety in relation to traffic increased by 10% between baseline and follow-up.
Almost a quarter of respondents to the route user survey reported that they had used the route more in the
last 12 months (24%), and there were small increases in the proportion of respondents indicating they
intended to walk more (5% increase) or were likely to walk more (2% increase) increase in the next 12
months.
Half of respondents to the residents‟ survey (n=5) agreed they had increased the amount of walking they do
for short journeys around their neighbourhood in the last 18 months. The reasons given for increasing
walking, however, did not relate to improvements in the local environment and residents indicated that
their use of the project route was about the same compared to 18 months ago. Residents reported the
perceived benefits of using the route to include visiting the local shops more, feeling fitter, using the car
less, saving money and feeling more satisfied with where they live. Almost a quarter of respondents to the
residents‟ survey agreed they had seen more people walking around their neighbourhood in the last 18
months; a third had found new walking routes, and a quarter had found new places to walk. Two fifths of
respondents agreed it felt safer and more pleasant to walk around their neighbourhood compared to 18
months ago.
Health and well-being
The increases in walking observed in this project are likely to lead to benefits for health and well-being in
the longer-term; however it was not possible to measure changes in health and well-being as part of the
evaluation.
Overall comments
This project addressed a clear community need to improve the safety of access to the shops at Laburnum
Parade. A number of improvements were successfully made including installation of a new dropped kerb
crossing, new footpaths and improvements to existing footpaths. Both route users and residents were
aware of the changes that had been made as part of the project though few had actually heard of Fitter for
Walking or taken part in project activities. More people appear to be walking in the area following project
activities, and both route users and residents appeared to have noticed some improvements in community
cohesion in the last 12-18 months.

Fitter for Walking Evaluation Report 193
RESULTS
4.7.1 Route user perspectives
Route user counts were conducted on three occasions commencing in July 2010 (baseline) and repeated
after 12 months (follow-up 1) and 14 months (follow-up 2). Route user intercept surveys took place
simultaneously on two of these occasions: baseline and follow-up 1. At each time point the counts and
surveys took place over two days, one week day and one weekend day. The weather varied from day to day
with both periods of warm and dry weather or wet and cold (Table 4.7.1). The methods are reported in full
in Chapter 2.
Table 4.7.1 Dates, days and weather for route user counts and surveys
Dates Days Weather
Baseline 17-Jul-10 Saturday Warm and mostly dry until 11am, warm but wet
until 3:30pm, then warm and dry until 7pm.
20-Jul-10 Tuesday Warm and mostly dry all day, except for some rain
between 1:30pm and 2:30pm.
Follow-up 1
16-Jul-11 Saturday
Cold and wet to start with, heavy rain from 8:30am
to 12:30pm. Wet until 3:30pm then warm and dry
until 7pm.
19-Jul-11 Tuesday Wet until 2:30pm with heavy rain for much of the
time, warm and dry from 3:30pm onwards.
Follow-up 2# 08-Sept-11 Thursday Cold but dry until noon, then warm and dry for the
rest of the day.
10-Sept-11 Saturday Warm and dry for the whole day. #Count only (no survey)
At baseline (July 2010), the surveyor noted that the survey site at Laburnum Road (west crossing south) was
being resurfaced from 8:30am-1pm. The footpath was open to pedestrians, but it was too noisy to conduct
any interviews; no other incidents were reported.
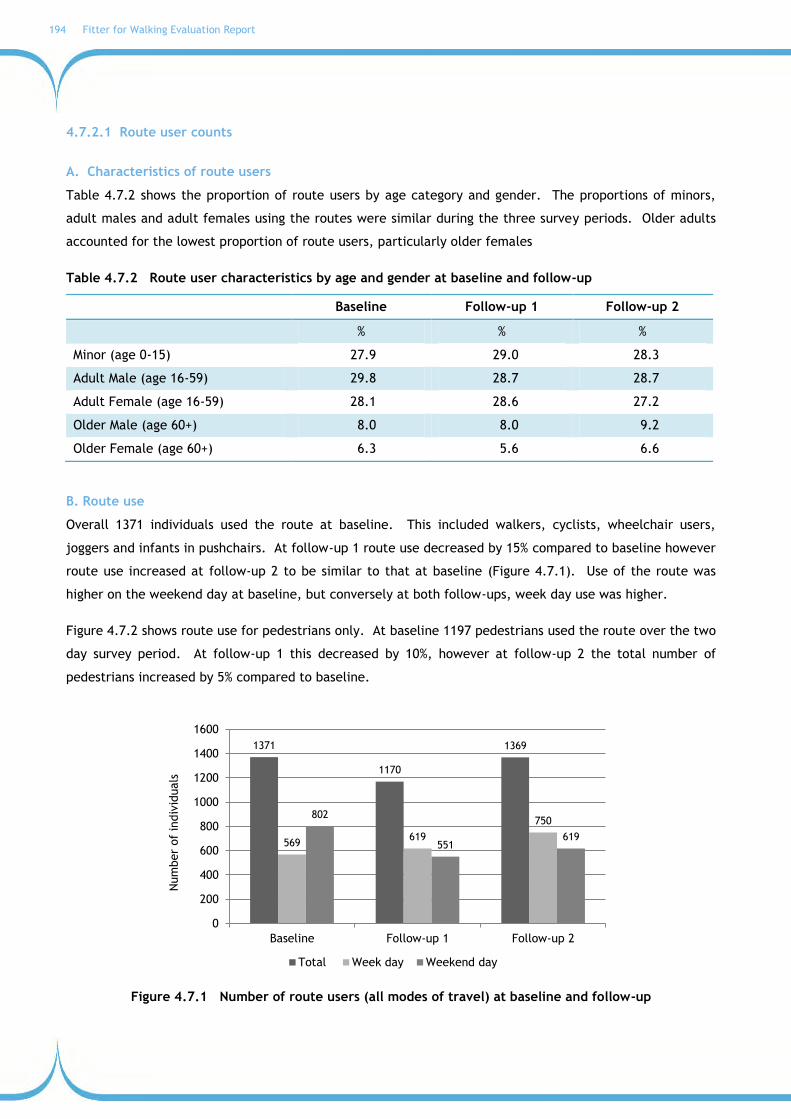
194 Fitter for Walking Evaluation Report
4.7.2.1 Route user counts
A. Characteristics of route users
Table 4.7.2 shows the proportion of route users by age category and gender. The proportions of minors,
adult males and adult females using the routes were similar during the three survey periods. Older adults
accounted for the lowest proportion of route users, particularly older females
Table 4.7.2 Route user characteristics by age and gender at baseline and follow-up
Baseline Follow-up 1 Follow-up 2
% % %
Minor (age 0-15) 27.9 29.0 28.3
Adult Male (age 16-59) 29.8 28.7 28.7
Adult Female (age 16-59) 28.1 28.6 27.2
Older Male (age 60+) 8.0 8.0 9.2
Older Female (age 60+) 6.3 5.6 6.6
B. Route use
Overall 1371 individuals used the route at baseline. This included walkers, cyclists, wheelchair users,
joggers and infants in pushchairs. At follow-up 1 route use decreased by 15% compared to baseline however
route use increased at follow-up 2 to be similar to that at baseline (Figure 4.7.1). Use of the route was
higher on the weekend day at baseline, but conversely at both follow-ups, week day use was higher.
Figure 4.7.2 shows route use for pedestrians only. At baseline 1197 pedestrians used the route over the two
day survey period. At follow-up 1 this decreased by 10%, however at follow-up 2 the total number of
pedestrians increased by 5% compared to baseline.
Figure 4.7.1 Number of route users (all modes of travel) at baseline and follow-up
1371
1170
1369
569 619
750 802
551 619
0
200
400
600
800
1000
1200
1400
1600
Baseline Follow-up 1 Follow-up 2
Num
ber
of
indiv
iduals
Total Week day Weekend day

Fitter for Walking Evaluation Report 195
Figure 4.7.2 Number of route users (pedestrians only) at baseline and follow-up
1197
1072
1262
513
577 702 684
495 560
0
200
400
600
800
1000
1200
1400
Baseline Follow-up 1 Follow-up 2
Num
ber
of
indiv
iduals
Total Week day Weekend day

196 Fitter for Walking Evaluation Report
4.7.2.2 Route User Intercept Surveys
A. Response rates
Route user intercept surveys were conducted twice during the project at baseline and 12 months (follow-
up). Table 4.7.3 shows the number of individuals who completed the survey at each time point, the
number of individuals who declined to participate and the most frequently cited reasons for not
participating.
Table 4.7.3 Route user survey responses
Surveys completed
(n)
Surveys declined
(n)
Response Rate (%)
Main reasons for declining
Baseline Saturday 17 July 2010
Tuesday 20 July 2010 90 285 24
Refused (57.5%)
In a hurry (17.9%)
Already interviewed (17.2%)
Follow-up Saturday 16 July 2011
Tuesday 19 July 2011 100 290 26
Refused (29.0%)
In a hurry (22.4%)
Already interviewed (16.9%)
B. Route user characteristics
The characteristics of respondents surveyed at each time point are shown in Table 4.7.4. At baseline a
slightly higher proportion of males than females took part in the survey, but the reverse was true at follow-
up. The highest proportions of respondents were aged 65+ at both baseline and follow-up, and almost all
respondents were of a white ethnic background. Many respondents were either in full time employment (31%
baseline and 33% follow-up) or retired (30% baseline and 33% follow-up). Around half of respondents at
baseline and follow-up reported to be in very good or excellent health. At baseline 40% of respondents
reported meeting physical activity recommendations (30 minutes or more of moderate intensity physical
activity on at least 5 days of the week); a higher proportion of route users (49%) reported meeting physical
activity recommendations at follow-up.
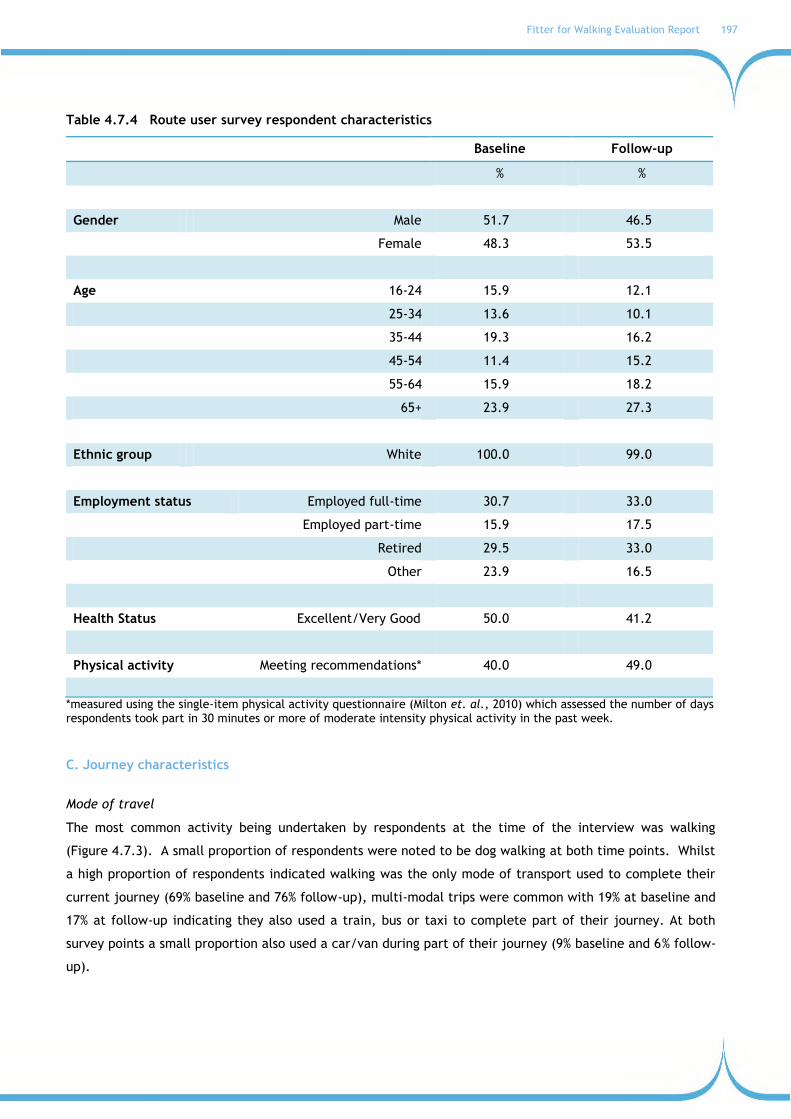
Fitter for Walking Evaluation Report 197
Table 4.7.4 Route user survey respondent characteristics
Baseline Follow-up
% %
Gender Male 51.7 46.5
Female 48.3 53.5
Age 16-24 15.9 12.1
25-34 13.6 10.1
35-44 19.3 16.2
45-54 11.4 15.2
55-64 15.9 18.2
65+ 23.9 27.3
Ethnic group White 100.0 99.0
Employment status Employed full-time 30.7 33.0
Employed part-time 15.9 17.5
Retired 29.5 33.0
Other 23.9 16.5
Health Status Excellent/Very Good 50.0 41.2
Physical activity Meeting recommendations* 40.0 49.0
*measured using the single-item physical activity questionnaire (Milton et. al., 2010) which assessed the number of days respondents took part in 30 minutes or more of moderate intensity physical activity in the past week.
C. Journey characteristics
Mode of travel
The most common activity being undertaken by respondents at the time of the interview was walking
(Figure 4.7.3). A small proportion of respondents were noted to be dog walking at both time points. Whilst
a high proportion of respondents indicated walking was the only mode of transport used to complete their
current journey (69% baseline and 76% follow-up), multi-modal trips were common with 19% at baseline and
17% at follow-up indicating they also used a train, bus or taxi to complete part of their journey. At both
survey points a small proportion also used a car/van during part of their journey (9% baseline and 6% follow-
up).

198 Fitter for Walking Evaluation Report
Figure 4.7.3 Activity being undertaken by respondents at time of interview
Journey purpose
The main purpose for respondents‟ journeys is shown in Table 4.7.5. The largest proportions of respondents
were either travelling for personal business/shopping (47% baseline and 43% follow-up) or on their way
home (31% baseline and 40% follow-up). Few respondents were travelling for work or education (≤2% at
both survey points).
Table 4.7.5 Journey purpose
Baseline Follow-up
% %
Home 31.1 40.0
Recreational activity* 5.6 1.0
Work 1.1 2.0
In the course of work 0.0 1.0
Education 1.1 0.0
Personal business / shopping 46.7 43.0
Social / entertainment 11.1 6.0
Recreation (sport and leisure) 1.1 5.0
Other (including holiday base) 2.2 2.0
*the respondent was just going for a walk or cycle ride around the local area for health, fitness or leisure, there was no specific destination
0%
10%
20%
30%
40%
50%
60%
70%
80%
90%
100%
Baseline Follow-up
Walking Dog walking Other

Fitter for Walking Evaluation Report 199
Journey duration
Respondents were asked about the duration of their journey on foot or by bicycle (depending on which
mode they were using at the time of the survey). Walking journey times decreased significantly between
baseline and follow-up (p<0.01) (Table 4.7.6). No respondents were cycling at the time of the interviews.
Table 4.7.6 Journey duration on foot / by bike
Baseline Follow-up
Mean minutes ±SD Mean minutes ±SD
Walking 17.1 ±32.9 15.0 ±22.3
Frequency of journey
Respondents were asked how frequently they completed their current journey (Figure 4.7.4). At baseline,
most respondents indicated they made their current journey on a daily basis (48%) or multiple times
throughout the week (39%). While a similar proportion of respondents indicated using the route on a daily
basis at follow-up (44%), there was an increase in the proportion of respondents using the route on a weekly
basis (51%). Overall changes in journey frequency were significant between baseline and follow-up (p<0.05).
Figure 4.7.4 Frequency of route use for current journey by respondents
D. Characteristics of route use
Frequency of route use during the day and night
A high proportion of respondents reported using the route daily or weekly during the day time at baseline
and follow-up (Figure 4.7.5). There were no significant changes in frequency of use between the two
survey points.
48.3
39.3
7.9
4.5
44.4
50.5
4.0 1.0
0
10
20
30
40
50
60
Daily Weekly Monthly Yearly
% o
f re
spondents
Baseline Follow-up

200 Fitter for Walking Evaluation Report
Figure 4.7.5 Proportion of respondents using the route in the daytime
At baseline, the proportion of respondents reporting using the route at night time on a daily or weekly basis
was high (Figure 4.7.6). Regular route use at night time decreased at follow-up with a higher proportion of
respondents using the route only once a year or less (44% follow-up versus 33% baseline). Changes in route
use at night between baseline and follow-up were significant (p<0.01).
Route use in the last 7 days
Respondents were asked on how many days in the past week they had used the route (Figure 4.7.7). At
both survey points over two thirds of respondents indicated they used the route on five or more days over
the past week (66% at baseline and 69% at follow-up). The proportion of respondents reporting use of the
route on two days a week or less decreased between baseline and follow-up (20% and 14%, respectively).
There were no significant changes in route use in the past seven days between baseline and follow-up
measurements.
Figure 4.7.6 Proportion of respondents using the route in the night time
65.5
28.7
2.3 3.4
64.9
29.9
2.1 3.1
0
10
20
30
40
50
60
70
Daily Weekly Monthly Yearly
% o
f re
spondents
Baseline Follow-up
17.2
41.4
8.6
32.8
19.6 21.6
14.4
44.3
0
10
20
30
40
50
Daily Weekly Monthly Yearly
% o
f re
spondents
Baseline Follow-up

Fitter for Walking Evaluation Report 201
Figure 4.7.7 Route use over the past seven days
Factors influencing route use
Respondents were asked a set of questions regarding which factors influenced their decision to use this
particular route for their journey (Table 4.7.7). The proportion of respondents agreeing that this is the
most convenient route for their journey purpose decreased between baseline and follow-up however this
was not significant. For all other questions, there were significant increases in the proportion of
respondents agreeing with the statements between baseline and follow-up. Between baseline and follow-
up the greatest increase was observed in those who agreed with the statement relating to perceptions of
route safety.
Table 4.7.17 Factors influencing respondents’ decision to use active travel for their journey
Baseline Follow-up Sig.
% agree/strongly agree % agree/strongly agree
Can go straight to destination 77.3 85.9 #
Best transport option 71.6 78.8 #
Most convenient route 94.3 85.9 NS
Save money by using this route 47.1 63.3 #
Like the surroundings on this route 47.7 57.6 #
Route feels safe 59.8 82.8 #
This is the only exercise I get 18.4 23.2 #
Using this route adds to the exercise I get 69.0 86.0 #
Environmental concerns 33.0 35.4 #
#=p<0.01 NS=not significant
20.2
13.5
66.3
14.3
16.3
69.4
0
10
20
30
40
50
60
70
80
0-2 Days 3-4 Days 5-7 Days
% o
f re
spondents
Baseline Follow-up

202 Fitter for Walking Evaluation Report
Questions regarding respondents‟ perceptions of route safety in relation to exposure to other people,
exposure to traffic and quality of the surface were asked at baseline and follow-up. A higher proportion of
respondents thought the surface quality was safe at follow-up (80%) compared with baseline (38%). An
increased perception of safety in regards to exposure to traffic was also noted at follow-up (54%) compared
to baseline (44%). At baseline 78% of respondents agreed that the route was safe in regards to exposure to
other people however this declined at follow-up (70%) (data not shown).
Improvements needed to encourage use of route
At baseline and follow-up respondents were asked what specific improvements would help to encourage use
of the route. The most frequently cited improvements suggested at baseline were improved crossings,
traffic calming measure such as speed humps or cushions and a slower 20 miles per hour speed limit. At
follow-up, improved crossing was still the most frequently cited improvement needed, with clearance of
dog mess also being highly cited as necessary to encourage route use (Table 4.7.8).
Table 4.7.8 Improvements needed to encourage use of route
Baseline Follow-up
% yes % yes
Clearance of rubbish/ glass 20.0 9.0
Clearance of dog mess 20.0 11.0
Clearance of graffiti 3.3 3.0
Clearer information / signage 12.2 0.0
Improved lighting 11.1 1.0
Wider path or pavement 13.3 4.0
Removal of overgrown hedges 5.6 3.0
Improved crossing 37.8 15.0
Dropped kerbs 17.8 4.0
Traffic calming: speed humps/cushions 23.3 8.0
20 miles per hour speed limit 22.2 7.0
Planting of new bulbs 7.8 0.0
Perceived change in route use
Respondents were asked, at follow-up only, to what extent their route use had changed in the last 12
months. Almost a quarter of respondents (24%) indicated they have used the route more, whereas only 2%
thought they had used it less (Figure 4.7.8).

Fitter for Walking Evaluation Report 203
Figure 4.7.8 Change in route use over the last 12 months
E. Project Awareness
Respondents were asked at both baseline and follow-up if they had heard of Living Streets and the FFW
project. While most respondents were not aware of Living Streets (≤2% at both baseline and follow-up), a
small number of respondents had heard of the project (8% at baseline and 7% at follow-up). A higher
proportion of respondents were members of a local residents‟ or community action group at baseline than
at follow-up (12% and 9% respectively).
When asked about their awareness of any improvements on the route, at baseline the highest proportion of
respondents noted traffic calming measures had been put in place (14%), glass/rubbish had been cleared
(11%) and dropped kerbs had been installed (10%). A much higher proportion of respondents noticed at
follow-up that the pavement had been resurfaced and was wider (38% and 12%, respectively) and a dropped
kerb had been installed (16%) (Table 4.7.9).
Table 4.7.9 Respondents’ awareness of improvements to route
Baseline Follow-up
% yes % yes
Clearance of rubbish/ glass 11.1 5.0
Clearance of dog mess 8.9 2.0
Clearer information / signage 2.2 0.0
Improved lighting 2.2 2.0
Resurfacing of path 6.7 38.0
Wider path or pavement 2.2 12.0
Removal of overgrown hedges 1.1 1.0
Improved crossings 2.2 3.0
Dropped kerbs installed 10.0 16.0
Traffic calming: speed humps/cushions 14.4 2.0
20 miles per hour speed limit 1.1 5.5
Planting of new bulbs 6.7 0.0
24.0
74.0
2.0 0
10
20
30
40
50
60
70
80
More About the same Less
% o
f re
spondents

204 Fitter for Walking Evaluation Report
F. Walking for travel and physical activity
Walking for travel
There was a small non-significant decrease in the proportion of respondents who walked for travel on 5-7
days in the past week between baseline and follow-up (Table 4.7.10). The mean minutes of walking for
travel undertaken by respondents decreased significantly (p<0.001) between baseline and follow-up (Table
4.7.10)).
Table 4.7.10 Total walking for travel in the past week
Baseline Follow-up
Mean minutes ±SD Mean minutes ±SD
Duration of walking for travel 371.2 ±372.6 283.7 ±275.6
Frequency of walking for travel % %
0-2 days 11.2 11.1
3-4 days 7.9 11.1
5-7 days 80.9 77.8
At baseline, respondents most frequently reported walking for journeys to the shops (70%), to visit friends
and family (63%) and to get to leisure facilities (42%) (Figure 4.7.9). At follow-up more respondents
reported walking to the shops (80%) and to leisure facilities (60%) but fewer reported walking to visit friends
and family (52%). A decrease in respondents reporting walking for personal business was noted between
baseline and follow-up (40% and 22% respectively).
Figure 4.7.9 Types of journeys respondents normally walked for
28.9
14.4 10.0
70.0
42.2
63.3
40.0
20.0
5.0 8.0
80.0
60.0
52.0
22.0
0
10
20
30
40
50
60
70
80
90
Work commute School/College Business-relatedtrips
Shopping Recreationand fitness
To visit friendsand family
For personalbusiness
% o
f re
spondents
Baseline Follow-up

Fitter for Walking Evaluation Report 205
Respondents were asked to what extent they agreed with two statements asking about their intention to
walk more and likelihood of walking more in the next 12 months. At baseline over a third of respondents
(37%) strongly agreed they intended to walk more in the coming year, and 41% agreed they were likely to
walk more (Table 4.7.11). Both the proportion agreeing they intended to walk more and were likely to
walk more increased at follow-up (42% and 43%, respectively). Overall the changes between baseline and
follow-up were not statistically significant.
Table 4.7.11 Intention and likelihood of walking more in the next 12 months
Baseline Follow-up Sig.
% agree
/strongly agree
% agree
/strongly agree
I intend to walk more in the next 12 months 37.1 42.4 NS
It is likely that I will walk more in the next 12 months 41.4 43.4 NS
NS=not significant
Physical activity
While more respondents reported taking part in at least 30 minutes of moderate intensity physical activity
for five or more days in the past week at follow-up than at baseline, this increase was not significant
(Figure 4.7.10).
Figure 4.7.10 Proportion of respondents meeting physical activity recommendations
G. Community cohesion
Respondents were asked whether they agreed or disagreed with a set of statements regarding the
community in which they lived (Table 4.7.12). A higher proportion of respondents agreed with all the
statements at follow-up compared to baseline, with the greatest increase being in regards to the statement
concerning people‟s willingness to help each other.
0%
10%
20%
30%
40%
50%
60%
70%
80%
90%
100%
Baseline Follow-up
Meeting recomendations Not meeting recomendations

206 Fitter for Walking Evaluation Report
Table 4.7.12 Perceptions of community cohesion
Baseline Follow-up
% agree/strongly agree % agree/strongly agree
There is a sense of community 65.5 69.4
People are willing to help each other 58.6 72.4
People get along with each other 73.3 78.6
People share the same values 47.7 57.7
People are willing to work together to improve the local area
43.7 52.6

Fitter for Walking Evaluation Report 207
4.7.3.1 Residents’ survey
Surveys were distributed to 200 households situated within one mile radius of the route where the Fitter for
Walking project activities took place. An adult member of the household was asked to complete and return
the survey. A total of 10 surveys were returned, all respondents completing the paper version of the survey,
giving a response rate of 5%. The key findings from the survey are outlined below however these should be
interpreted with caution given the low response rate.
A. Respondent characteristics
The key characteristics of respondents are reported in Table 4.7.13. Of those who returned the surveys a
higher proportion were female (60%) and the mean age of respondents was 57 years. All respondents were
white, and 50% had no formal qualifications. Two-fifths of respondents (40%) reported their health to be
excellent or good, but only 20% reported meeting physical activity recommendations (participating in 30
minutes of moderate intensity physical activity on five or more days of the week). A high proportion of
households (70%) reported not owning a car.
Table 4.7.13 Respondent Characteristics
%
Sex Male 40.0
Female 60.0
Ethnic group White 100.0
Other 0.0
Education qualifications Degree 0.0
A level/BTEC Higher 0.0
GCSE/BTEC National 50.0
No formal qualifications 50.0
Number of vehicles in household 0 70.0
1 30.0
Health status Excellent/Good 40.0
Physical activity Meeting recommendations* 20.0
Mean ±SD
Age Mean age (years ±SD) 56.9 ±16.5
BMI Mean BMI (kg/m2 ±SD) 27.2 ±7.3 *measured using the single-item physical activity questionnaire (Milton et. al., 2010) which assessed the number of days respondents took part in 30 minutes or more of moderate intensity physical activity in the past week.
B. Residents’ travel behaviour
Respondents were asked to identify which modes of travel they usually used when travelling for short
journeys in their neighbourhood. Walking was the most frequently reported mode of travel (n=8, 80%),
however one individual indicated they used a bicycle (Figure 4.7.11). A fifth of respondents (n=2, 20%)

208 Fitter for Walking Evaluation Report
reported being driven to their destination as a passenger, and 30% (n=3) reported driving a car for short
journeys. Taking the bus was the only reported form of public transport and was used by 50% of
respondents (n=5).
Figure 4.7.11 Mode of transport respondents usually use for short journeys
When asked about changes in travel mode for short journeys in the neighbourhood over the last 18 months,
20% of respondents (n=2) reported making no change to the way they travel. More than half of the
respondents agreed they had increased the amount of walking they do around their neighbourhood (n=5,
56%), and a third of respondents (n=3, 33%) agreed they used the bus more. One respondent (13%) reported
that they have used their car or bike more in the past 18 months for short journeys. No one reported an
increase in train usage for short journeys. The main reasons for changes in mode of travel for journeys in
the neighbourhood included changes in income (n=2, 20%), an increase in petrol prices (n=1, 10%), no longer
owning a car (n=1, 10%) and to improve health and fitness (n=1, 10%) (Table 4.7.14). Even though
respondents reporting use their cars and the bus more often, no reason for change was given under these
two categories.
Table 4.7.14 Reasons for changes in travel behaviour in the last 18 months by travel mode
Walk Cycle
n n
Agree/strongly agree to increased use of mode in the last 18 months 5 1
Reason for change in mode:
Cost of petrol has gone up 1 0
Change of income 2 1
No longer have a car 1 1
To get fitter and healthier 1 1
80.0
10.0
30.0
20.0
50.0
0
10
20
30
40
50
60
70
80
90
Walk Cycle Car (as driver) Car (aspassenger)
Bus
% o
f re
spondents

Fitter for Walking Evaluation Report 209
C. Residents route use
Half of the respondents reported using the project route seven or more times per week (n=5, 50%), and a
further 40% (n=10) reported using it five times a week. Only one respondent (10%) reported using the route
less often, on three occasions throughout a normal week (data not shown).
In comparison to 18 months ago respondents indicated their current use of the route was about the same.
Respondents indicated the greatest increase in route use was for social activities (n=2, 25%) and to get to
public transport (n=2, 25%). The greatest decrease in route use over the last 18 months was reported for
shopping/personal business (n=2, 20%) (Figure 4.7.12). No one reported using the route for the journey to
school or college.
When respondents were asked about the benefits of using the route, 70% thought they visited local shops
more (n=7). While 40% reported they felt fitter (n=4), only 20% perceived they had increased their physical
activity levels (n=2) and felt healthier (n=2). No one indicated they did not walk along the route (Figure
4.7.13).
Figure 4.7.12 Use of route compared to 18 months ago reported by journey purpose
0.0 0.0
10.0
25.0 25.0
0.0
50.0
14.3
50.0 50.0 50.0
42.9
0.0
14.3
20.0
12.5 12.5 14.3
0
10
20
30
40
50
60
Work commute Business-relatedtrips
Personalbusiness
To get to publictransport
Social activities Recreation orfitness
% o
f re
spondents
More Same Less
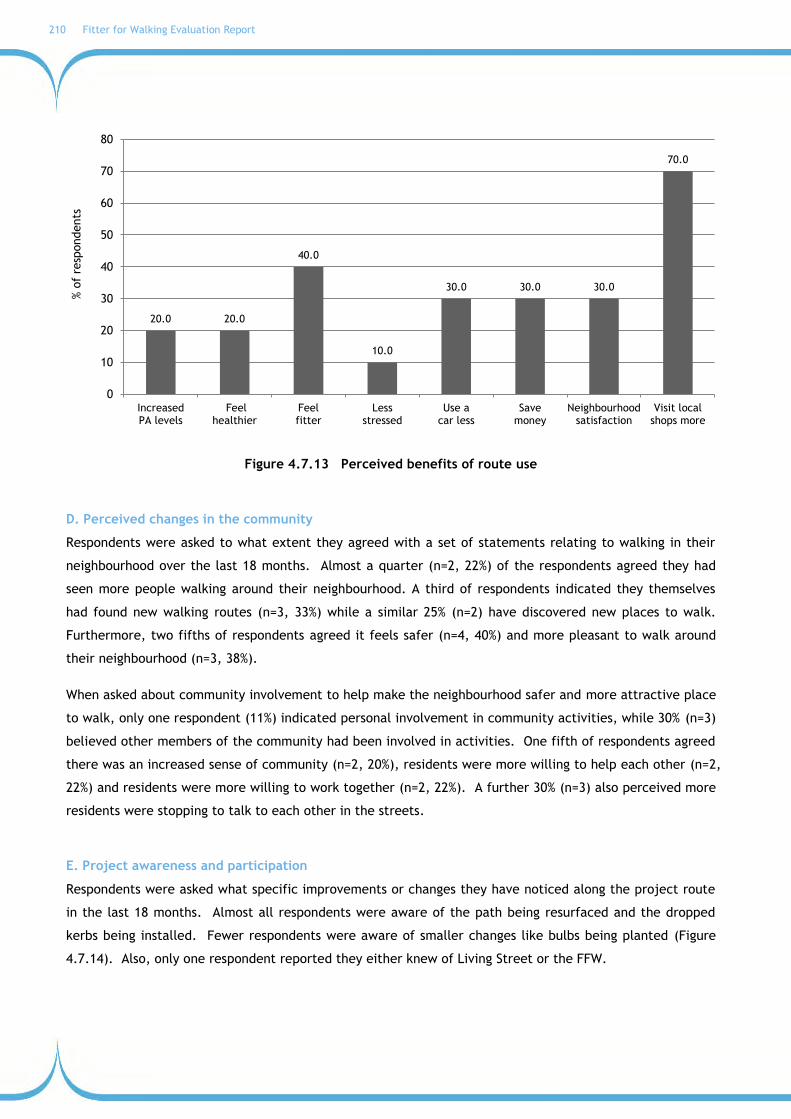
210 Fitter for Walking Evaluation Report
Figure 4.7.13 Perceived benefits of route use
D. Perceived changes in the community
Respondents were asked to what extent they agreed with a set of statements relating to walking in their
neighbourhood over the last 18 months. Almost a quarter (n=2, 22%) of the respondents agreed they had
seen more people walking around their neighbourhood. A third of respondents indicated they themselves
had found new walking routes (n=3, 33%) while a similar 25% (n=2) have discovered new places to walk.
Furthermore, two fifths of respondents agreed it feels safer (n=4, 40%) and more pleasant to walk around
their neighbourhood (n=3, 38%).
When asked about community involvement to help make the neighbourhood safer and more attractive place
to walk, only one respondent (11%) indicated personal involvement in community activities, while 30% (n=3)
believed other members of the community had been involved in activities. One fifth of respondents agreed
there was an increased sense of community (n=2, 20%), residents were more willing to help each other (n=2,
22%) and residents were more willing to work together (n=2, 22%). A further 30% (n=3) also perceived more
residents were stopping to talk to each other in the streets.
E. Project awareness and participation
Respondents were asked what specific improvements or changes they have noticed along the project route
in the last 18 months. Almost all respondents were aware of the path being resurfaced and the dropped
kerbs being installed. Fewer respondents were aware of smaller changes like bulbs being planted (Figure
4.7.14). Also, only one respondent reported they either knew of Living Street or the FFW.
20.0 20.0
40.0
10.0
30.0 30.0 30.0
70.0
0
10
20
30
40
50
60
70
80
IncreasedPA levels
Feelhealthier
Feelfitter
Lessstressed
Use acar less
Savemoney
Neighbourhoodsatisfaction
Visit localshops more
% o
f re
spondents

Fitter for Walking Evaluation Report 211
Figure 4.7.14 Number of participants aware of project activities and improvements
Survey respondents did not report any participation in the Fitter for walking activities. Furthermore, no
respondents indicated they would be willing to donate either time or money to improving the walking
environment.
9
5
9
3
4
0
1
2
3
4
5
6
7
8
9
10
Path resurfacing Widerpath/pavement
Dropped kerbinstalled
Bulbs planted Improvedcrossings
Num
ber
of
resp
ondents

212 Fitter for Walking Evaluation Report
CHAPTER 5. Key findings and conclusions
The Fitter for Walking (FFW) project aimed to work with communities and local authorities to change the
environment to promote walking for local journeys. This report summarises the evaluation of FFW and
presents the experiences and perceptions of the project from co-ordinators, Local Authority (LA) partners
and community representatives and findings from an in-depth evaluation of seven case studies. In this
chapter the results from previous chapters are brought together to help develop an overall understanding of
the FFW project. Key findings are presented as well as a review of the strengths and limitations of the
evaluation methods.
The specific objectives of the FFW project were:
1. to improve the walking environment on particular walking routes eg, to a key facility or trip generator
such as shopping centre, town centre, train station, bus station, health facility to increase walking
levels in the community targeting local trips up to fifteen minutes‟ walk from people‟s homes
2. to provide information and support to community groups and local residents to increase awareness of
walking as a mode of transport
3. to provide tools to help communities to promote walking
4. to promote community cohesion by encouraging local residents to work together to achieve the Fitter
for Walking Award
5. to improve the health and well-being of route users and the local community by increasing walking.
The FFW evaluation aimed to assess the extent to which the project objectives had been met. The specific
evaluation objectives were:
1. to understand the processes involved in working with local authorities and communities to make changes
to the local environment
2. to assess changes in community cohesion in relation to working together to promote walking and improve
the environment
3. to assess change in the number of walking trips made for local journeys following improvements to an
identified walking route
4. to assess change in the health and well-being of route users and local residents following improvements
to an identified walking route
5. to conduct an economic analysis of at least one FFW project.

Fitter for Walking Evaluation Report 213
The evaluation objectives have been assessed using both quantitative and qualitative methods.
Quantitative approaches included route user counts, route user surveys and small-scale community surveys
(residents‟ surveys). The findings from the residents‟ surveys should be interpreted with caution owing to
the low response rate. Qualitative evaluation included focus groups and interviews with project co-
ordinators, LA partners and community members. An economic evaluation was also conducted using route
user count and route user survey data; this is reported elsewhere (Sinnett & Powell, 2012). The methods
are reported in full in Chapter 2.
5.1 Key findings
Evaluation objective 1: Understanding the processes involved in working with local authorities and
communities to make changes to the local environment
Living Streets’ co-ordinators
Evidence from qualitative feedback indicates that the role of the project co-ordinator was critical to the
success of the FFW project. Co-ordinators made a substantial contribution to the leadership and co-
ordination of the project and played a key role in engaging community groups, facilitating relationships
between the community and LA partners and maintaining the focus of the project on walking. In the
majority of cases the project co-ordinators became personally involved in the projects, both delivering
and taking part in project activities. The hands-on role of the co-ordinator in project activities was very
well received by the community and may have played a key role in the project‟s success.
Co-ordinators required a number of key skills and attributes in order to complete their role in the
project. People skills were seen to be important, in particular, being able to relate to people from
different backgrounds. Developing a good understanding of LA structure, inter-departmental
relationships in the LA and existing issues between the LA and communities was seen as critical for the
success of the project and for identifying suitable communities to work with. Being able to tailor
discussions with different community groups to identify solutions for their specific issues was important
for community engagement. Understanding the timescales for LA work to be completed, the ability to be
patient and to manage community expectations was also an essential skill for co-ordinators.
LAs provided very positive feedback on their experiences of working with Living Streets‟ co-ordinators.
They valued Living Streets‟ expertise in building relations with the community, the new perspective on
working with communities and the capacity (time and budget) which removed some of the burden on the
LA. The independent nature of the co-ordinators was seen to be important for the success of the project
and in engaging communities.
Community members were universally positive about the co-ordinators‟ role and their contribution to
project and community action. The main strengths of the co-ordinators were viewed as their ability to
understand community needs and shape this into meaningful action, and to provide ideas and useful
contacts which in many cases led to new partnerships with other community groups or organisations.
214 Fitter for Walking Evaluation Report
Local Authority partners
Local Authority partners also played a key role in the delivery of the FFW project, providing resources
and match funding for some of the project activities. They were responsible for reviewing and acting
upon recommendations made in street audit reports, identifying funding and resources and arranging for
environmental improvements to be made on the selected project routes.
The location of the contact within the LA was seen to be important for their role, with the Transport
department being identified as most appropriate owing to access to budgets and existing relationships
with departments who would carry out the environmental improvements. Regardless of location, senior
management support for the project within the LA was essential to ensure resources and funds were
allocated to the project.
Other partners and organisations
Although Primary Care Trusts (PCTs) showed an interest at the start of the project, most found it
difficult to get involved in project delivery other than to provide strategic support or walk leader
training; PCTs had no involvement in commissioning or managing environmental improvements.
New partnerships developed with other organisations and groups during the project which were seen to
be mutually beneficial. These partners included neighbourhood managers (although many of these
disappeared during the project because of funding cuts in local government), NHS health community
partnerships, the police and organisations such as Groundwork and the Wildlife Trust, who worked with
the co-ordinators to deliver project activities.
Community groups and local residents played an important role in identifying barriers to walking in their
local area, participating in project activities and promoting the project and its achievements in their
local neighbourhoods.
5.1.2 Lessons learnt: Project delivery
Understanding FFW project aims
Co-ordinators, LA partners and community members all understood the main aims of the project to be
making changes to the local environment to promote walking.
In addition, each stakeholder identified additional aims and objectives which varied between the three
groups reflecting different perspectives on the project. The co-ordinators also saw the project to be a
learning experience to develop skills in working in with communities to deliver this type of initiative. LA
partners noted further objectives to be social inclusion (as the project was working in more deprived
areas), strengthening the links between health and transport, providing a clear focus to promote walking
and testing a new approach to community engagement for promoting walking, using external resources
to conduct engagement activities. Communities noted increasing fitness and a reduction in car use as
additional objectives.

Fitter for Walking Evaluation Report 215
Co-ordinators experiences of working with local authorities
The relationship between the co-ordinator and the LA was crucial to the success of the FFW as the
project relied on support from the LA (in terms of funding and manpower to undertake the work) to
make the environmental improvements. Without this support some of these improvements, eg, the
installation of dropped kerbs would not have been made.
Problems occurred when the LA contact was not able to become involved with the FFW project activities
as a result of time pressures from their existing work, when budgets, existing plans for the
neighbourhood or LA work pressures did not permit the requested changes to the environment to be
made, or where there were long delays between submitting the street audit report to visible action
occurring in the local community. Co-ordinators and community members often found this frustrating
and managing this time delay was a challenge for co-ordinators.
In some cases, the specific working methods or opinions of the LA contact presented some barriers to
effective working.
Changes in staff at the LA during the project also presented a challenge for the project as it resulted in
a lack of continuity and differing levels of interest and support from different members of staff.
Understanding relationships between departments within the LA and between the LA and the community
prior to starting the project may have helped in some projects where some of the requested
environmental changes were not possible. Gaining knowledge of local issues is important for managing
the expectations of the community in what might be achievable through the project and within what
timescales.
Co-ordinators’ experiences of community engagement
Working with communities was a fundamental part of project delivery. Many different community groups
engaged in the FFW project including: Tenants‟ and Residents‟ associations (TARAs), community groups,
„Friends of…‟ groups, churches, schools, parent support advisors (through schools), scouts and other
youth groups and community interest groups (such as gardening or allotments) reflecting interest from a
broad range of people in the local environment and walking. Capitalising on this interest was important
for the success of the project.
Many different approaches were used to recruit potential groups to the project which varied across
regions and within LA areas. Some groups were recruited opportunistically whereas others were
recruited through a more targeted approach. Recruitment and engagement of community groups was
more challenging than co-ordinators originally anticipated owing to multiple issues being tackled on
community groups‟ agendas. The FFW project had to fit in alongside these and wasn‟t always a priority
for the group.
Co-ordinators found it was important to tread lightly in their initial approach to groups and whilst
developing relationships with groups not to impose Living Streets‟ agenda, but rather to allow the
community to develop their interest in walking and their local environment.
The first challenge was to steer the community towards looking at the environment from a pedestrian‟s
point of view to get them thinking and talking about their local walking environment. Small “quick-win”

216 Fitter for Walking Evaluation Report
activities were important for engaging communities, establishing a rapport, demonstrating progress and
building momentum. Over time the co-ordinators helped the community to build their own capacity and
skills for assessing their local walking environment and confidence to approach the LA to address barriers
to walking and request improvements.
Co-ordinators’ experiences: challenges for project delivery
Overall, for co-ordinators the main challenges were balancing conflicting priorities and the needs of
different stakeholders (Living Streets, the LA, local communities and the Big Lottery (funders of the
project)).
Finding, developing and maintaining relationships with the right people was important for the success of
the project; this included both within the LA and in community groups.
Communication was thought to be important both in working with the LA (ensuring the LA contact was
taking action and communicating with other departments within the authority as needed) and finding
strategies that worked within the community to ensure high attendance at events, buy-in from difficult
groups and to overcome resistance to certain approaches.
There were some differences of opinion as to where the co-ordinators should work in some LA areas.
Co-ordinators were keen to find suitable areas and projects through discussion with the community to
ensure buy-in from local residents, however in two cases the LA wanted the co-ordinator to work across
the whole borough. Co-ordinators found this to be impractical owing to time constraints, travelling
distance and gaining sufficient knowledge of the areas (particularly when working with multiple LAs),
which caused friction with LA staff.
The projects took much longer than expected owing to the time taken to engage communities, conduct
the street audit, receive feedback on the audit report, for the LA to take action on the audit report, and
for work to be completed to make the environmental changes. The main challenges of working with the
community were seen to be “having to be „everywhere all the time‟”, “knowing who to listen to”, “not
over-promising”, “representing the community‟s views fairly” and “prioritising actions”.
Co-ordinators found it hard to declare a project as „closed‟ or completed, particularly in those where
they had become more embedded in the communities and were seen to be needed in order for project
activities and momentum to continue.
Although funding was provided for project activities from Big Lottery, and match funding was
contributed by the LA, there were concerns over sustainability and long-term maintenance of
improvements made to the environment through the project, particularly given recent funding cuts
across local government. Although the improvements made will remain and established walks and other
promotional activities will continue, without continued LA funds, or co-ordinator support there were
concerns momentum would be lost and project activities would discontinue.
Local Authority experiences
FFW was seen to provide a co-ordinated, coherent approach to catalyse action on walking giving more
focus for investment in infrastructure and helping link action on walking across the LA area.
Fitter for Walking Evaluation Report 217
The project was seen to provide an important link between the LA and the community, assisting the LA
with bringing communities together to determine what the issues were in relation to walking, prioritising
actions and identifying where money needed to be spent.
Living Streets were perceived to be the natural leaders of the project and most LAs were happy for the
co-ordinators to work independently with support and direction from the LA as needed. The LAs took the
lead in acting on street audit reports, identifying funding and resources and commissioning work within
the LA to complete the environmental improvements.
Whilst the FFW co-ordinator provided an additional resource for community working, some LA contacts
found it difficult to spend sufficient time on the project as part of their normal role. They reported that
the time required for reviewing and acting upon audit reports was labour-intensive.
Some LAs felt there was a lack of time to do the project real justice in terms of community development
and that the approach taken to community development, to develop relationships and work through the
stages of the project took too long.
There was some tension around the selection of community groups in some LA areas. Many were happy
with Living Streets‟ approach of finding interested community groups, however others would have
preferred a more even spread across the area, though this was difficult for co-ordinators to manage.
Budget cuts within the LA were a challenge for the project and, although FFW brought money in to fund
activities not normally covered by the LA, there were concerns that funding would no longer be available
which would impact on project activities. Some of the environmental changes requested required
substantial funding and the cuts meant these could no longer be delivered. The project therefore raised
community expectations for improvements that it was no longer possible to make.
The main concern was over sustainability of the project in the long-term and concerns over what would
happen when the FFW project came to an end and the co-ordinator was no longer in post.
Community experiences
Community members thought the project had helped people make new connections and create strong
working partnerships for future action, in particular building community confidence in dealing with the
LA and other partners.
The critical part of FFW was to provide a link between communities and people in the LA who could
make things happen. In some cases the co-ordinators built on existing links between communities and
LAs and the FFW project enhanced this relationship in most cases.
The project has helped some community members to address local issues themselves by helping them to
understand how to take action; and seeing people out working in the community has helped to engage
other local residents too.
Community members were overwhelmingly positive about working the co-ordinators and the impact of
the FFW project in their local areas.
5.1.3 Lessons learnt: Project activities
Over 100 communities engaged in the FFW project across the five regions with wide variation in terms of
what was delivered in each community. Activities tended to vary according to the needs and interests of

218 Fitter for Walking Evaluation Report
the community and the funding and resources available from the LA, but included both environmental
changes and promotional and awareness-raising activities (for example led walks, bulb planting, and
community street parties). These promotional activities were particularly important in maintaining
community interest and involvement whilst waiting for the environmental improvements to be made
through the LA area.
Barriers to walking
Community members were very aware of the environmental, social and psychological barriers that
prevented them and others in their community from walking.
Environmental factors were most frequently mentioned during discussions, for example dog mess, litter,
graffiti, and overgrown or blocked paths caused by lack of maintenance. These were most often in public
shared space in the local community, but there were also many problems cited of lack of maintenance
by private householders, which impinged on public space.
Social factors included concerns over personal safety owing to areas being taken over by youths, anti-
social behaviour, riding motor bikes, drinking alcohol and drug use, all of which put people off walking in
the area. Pavement parking was also highlighted as an issue, forcing pedestrians and those in mobility
scooters or pushing buggies, to walk in the road.
Psychological barriers included a lack of motivation or personal inclination to walk, and it was noted
that, however pleasant the environment is, there will always be some people who will drive.
The FFW project successfully addressed a number of the environmental barriers through the
interventions and activities that were delivered during the project. At follow-up, there was a clear
reduction in the proportion of route users reporting barriers to walking that had previously been
mentioned at baseline eg, clearance of rubbish/glass; clearance of dog mess; clearance of graffiti;
improved crossings; and improved lighting. These typically corresponded with issues that had been
tackled through the FFW project.
Route users, residents and community members in most projects also highlighted a number of social
changes that had occurred in their communities during the FFW project. This included increased social
interaction and an increased sense of community which made the local area feel much safer. Therefore
some of the social barriers to walking were also successfully addressed during the project (see
evaluation objective 2).
Street audits
After a community group had registered to the project, in many communities a street audit (or more
informal walk about) was conducted with community members and other local representatives (eg,
neighbourhood management teams, police, local councillors) to help them view the local area from a
pedestrian‟s point of view. Positive and negative aspects of the environment were highlighted, and
potential solutions to the negative aspects were identified. Co-ordinators provided feedback on the
audit and recommendations for action to the LA, which typically had to be approved for funding and
scheduled to fit LA work plans.

Fitter for Walking Evaluation Report 219
Street audits were seen to be an essential component of the FFW project by some co-ordinators,
whereas one co-ordinator thought they were less important. Co-ordinators found them easy to deliver
and an easy way to engage community groups and develop an action plan.
LAs thought street audits were excellent and strongly supported the concept and execution. The audits
were recognised as a formal consultation process and provided a clear focus on walking in a specific
geographical area with a clear set of recommended actions for improvements. The reports were
reviewed by the LA who identified which changes were possible and co-ordinated action across the
appropriate LA departments.
Negative aspects of the street audit from a LA point of view were that they often could not fund all the
changes requested, and there was a perception that the audits raised the expectations of the community
in some cases. Some LAs thought the formal report was not required for some of the smaller changes
identified by the community.
Community members found the street audits were extremely helpful in enabling them to see their local
environment from the perspective of a pedestrian (particularly highlighting the difficulties that might be
faced by a less able person or someone pushing a buggy) and provided opportunities to meet local
councillors and officials as well as attracting other local residents‟ attention while they were taking
place, thus engaging some new members of the community in project activities.
Led walks
Co-ordinators found that led walks were an easy way to engage the community, rather than as an
integral part of the project. Attendance at walks was however sometimes low. Despite this co-ordinators
often found the walks helped residents to discover new places to walk to and new routes in their local
area and indeed many local residents reported discovering new pleasant areas and green spaces for
walking in their neighbourhood that they were not previously aware of.
Community members felt the walks had a number of purposes including increasing initial interest in the
project, ensuring on-going engagement, linking to new groups, checking progress and celebrating success.
Led walks were often used once environmental improvements were completed in order to show the
community what had been achieved. Themed walks eg, bat walks, toddler walks and history or nature
walks, were popular with the local communities. It was felt that these led walks played an important
part of ensuring people continue to walk in the new improved environment.
Although initially walks were led by the co-ordinators, in some projects, members of the community
trained as walk leaders and some of the walks became part of the walks series provided through the
Walking for Health project.
Pledge cards
Pledge cards were introduced part of the way through the project to act as an engagement tool and to
make people think about walking and commit to making a change. These were also important tool for
engaging new members of the community in the project and for increasing beneficiaries from the
project for the purposes of monitoring by the Big Lottery.

220 Fitter for Walking Evaluation Report
Community members felt the pledge cards were popular with adults and children in making pledges to
walk more; however, in some cases these were used as a bargaining tool where the community would
only pledge to walk more if some of the promised environmental changes were made.
An evaluation of the pledge cards is reported elsewhere (Sustrans, 2011).
Fitter for Walking Award
One of the aims of the FFW project was to develop an award scheme to recognise progress and successes
made by community in making environmental changes and promoting walking in their communities. This
was successfully developed during the first 18 months of the project.
The award was presented to communities or individuals who had made a substantial contribution to the
project, after they had demonstrated progress towards meeting a set of criteria relating to
environmental change, community engagement, increased walking levels and a commitment to
sustaining progress.
Though it was not seen as an essential part of the project by co-ordinators in order to engage community
groups, the award was very well received by the communities and individuals to whom it was awarded,
since they saw it as recognition for their work and an opportunity for a final celebration and some
publicity. The award helped to provide a natural „close‟ to the project.
5.1.4 Lessons learnt: Project awareness and participation
Few route users and residents had heard of Living Streets or FFW. However, in some of the case studies
a higher proportion of route users were aware of the organisation and project at follow-up.
A high proportion of route users were aware of environmental changes that had been made along the
project routes even though they did not associate them with the Fitter for Walking project. Similarly,
when surveyed, local residents were aware of changes that had been made though few reported
participating in project activities. This suggests that participation in project activities was perhaps
limited to those who are already active in community projects and further outreach work may be
required to promote the project and engage the wider community in project activities.
5.1.5 Lessons learnt: Overall achievements and perceived success of the FFW project
Co-ordinators
Co-ordinators felt they had made clear progress in a short amount of time working in some very deprived
areas with complex issues. They felt they had been successful in getting communities working together
and working more effectively.
There was generally a good turnout at events, positive feedback from community figures and co-
ordinators saw first-hand the improved relationships between the community and the LA.
Co-ordinators felt the project enabled residents to feel proud of where they lived and that consulting
them or engaging them in small interventions was just as important as larger ones.

Fitter for Walking Evaluation Report 221
Co-ordinators felt that community involvement in the project may be more important than the project‟s
principal aim to increase walking, and they were unsure whether walking levels would have increased as
a result of the project in the areas where they were working.
Local authorities
LAs were very positive about the FFW project and its achievements.
They noted improved community relations, positive changes to local areas and the efficiency of the
audit process.
The LAs were much more concerned about sustainability and long-term impact than community members
and thought it was important to build capacity in the community so the project could be self-sustaining.
Overall LAs thought it was an excellent project and although they had seen the changes on the ground
there were some concerns that there might not be a measurable increase in walking levels.
Communities
Community members placed much stronger emphasis on the success of the social and community aspects
of the project than on the environmental changes that were made. In particular they noted the project
has been successful in getting new members of the community involved, raising awareness of issues that
needed to be addressed, and building confidence to address issues and challenge changes the community
does not want or like.
The project was thought to strengthen the community bringing people together with a common interest
and goal possibly because the project did not focus on walking but emphasised making improvements to
the local neighbourhood. While there are plenty of people in the communities who did not engage with
the project, it seems that those that did found it an almost universally positive experience.
The only negative comments were about the time taken for environmental improvements to be made
and there were some concerns about the co-ordinator „leaving‟ but community members held a strong
desire and intention to sustain the improvements which had been made and to continue to make changes
after the end of the project. Despite this it is inevitable that in some projects will lose impetus when
the funding and co-ordinators disappear.
Evaluation objective 2: Assessing changes in community cohesion in relation to working together to
promote walking and improve the environment
There was evidence from route users, residents and community members that there had been
improvements in community cohesion and social interaction in most of the project areas.
Some route users in some projects reported an increased sense of community; people being more willing
to help each other; people getting along with each other; people sharing the same values; and people
being willing to work together to improve the local area.
Residents also reported some improvements in community cohesion in the last 12-18 months agreeing
that the sense of community had increased, residents were more willing to help each other, more
222 Fitter for Walking Evaluation Report
residents were stopping to talk to each other in the streets and residents were thought to be more
willing to work together to look after and improve their neighbourhoods. This was supported by
qualitative feedback from community members.
Co-ordinators felt they had been successful in getting communities working together and this community
involvement may have been more important than increasing walking.
Communities were overwhelmingly positive about the social and community aspects of the FFW project
and the impact in their local area. New members of the community were seen to get involved and the
project brought together people with a common interest and goal.
For most community members, success was measured in terms of the improvements in community
cohesion and social interaction; rather than increases in walking.
Evaluation objective 3: Assessing changes in the number of walking trips made for local journeys
following improvements to an identified walking route
The primary aim of the FFW project was to increase the number of people walking for short journeys in
their local neighbourhood by improving the local environment to make it safer and more attractive for
walking.
Community members perceived that there had been an increase in the number of people walking in their
local area; however this perception may have been influenced by their positive experiences of
participating in FFW project activities. Co-ordinators and LAs were less certain about the impact of the
project on walking levels.
Overall, route user data indicated there were increases in the number of people walking on the project
routes following environmental improvements and promotional activities in most projects evaluated;
however this increase was only evident after more than 12 months in most case studies (Table 4.1)
suggesting it may take some time for environmental and social changes to have an impact on walking
levels.
The decline in the number of pedestrians using the routes at the 12 month follow-up in most projects
may have been a result of a number of factors, for example the weather or memories of work being
completed on the route which may have temporarily made the route less pleasant for walking.
At the second follow-up (14-20 months after baseline), increases in the number of pedestrians using the
project route were observed in five projects compared to baseline. However, these increases may also
have been a result of differences in the weather during the survey period.
There is, however, other evidence to suggest that route use did increase in the project areas with up to
a quarter of route users perceiving they had used the project route more in the last 12-18 months. In
three of the case studies more route users reported using the project route on a daily basis at follow-up
compared to baseline.
The project may also have had a wider impact on route use and walking levels. Over 60% of route users
agreed that walking on the route enabled them to go straight to their destination; it was the best

Fitter for Walking Evaluation Report 223
transport option, it was the most convenient route; they could save money by using the route; and
walking added to the exercise they get from other parts of their life.
More route users were walking for a wider variety of journey purposes at follow-up, and the total mean
minutes of walking for transport per week was higher at follow-up in route users in four projects,
suggesting that the use of walking as a mode of transport may have become more widely recognised
during the project. In projects where the total mean minutes of walking for transport per week
decreased at follow-up, this could be because the project improvements created a shorter route for
residents to get to their destination (improved connectivity).
Residents also reported using the routes more often in the last 12-18 months for a variety of trip
purposes. The greatest increases in use were for journeys to get to social activities, to get to public
transport, for personal business/shopping and for recreation or fitness. Almost two thirds of residents
reported having walked more in their local area in the last 18 months for a variety of reasons including:
a change in income, to get healthier/fitter; because the cost of petrol or the cost of public transport
fares had increased; and because knowledge of the area had improved.
Around half of residents strongly agreed or agreed that in the last 18 months they had seen more people
walking the neighbourhood; found new routes for walking; thought it was now more pleasant to walk
around the neighbourhood; had discovered new places to walk to and thought it was safer to walk in
their neighbourhood.
Evaluation objective 4: Assessing change in the health and well-being of route users and local residents
following improvements to an identified walking route
The increases in walking observed in this project are likely to lead to benefits for health and well-being
in the longer-term; however it was not possible to measure changes in health and well-being as part of
the evaluation.
Residents‟ views on the benefits of using the project route varied, but the most frequently cited
benefits included: visiting local shops more, feeling less stressed, feeling fitter, increasing their level of
physical activity and feeling more satisfied with their neighbourhood which suggests residents perceived
there to be some benefits for health and well-being.
Evaluation objective 5: Economic evaluation of Fitter for Walking
An economic evaluation of Fitter for Walking was conducted using data from route user counts and route
user surveys in Marks Gate, London; Byker Link, Newcastle; Taylor Street, Blackburn; Weddell Wynd,
Wolverhampton and Cliff Hills, Rotherham.
Benefit to cost ratios (BCRs) of improvements to the walking environment in these areas were estimated
and it was found that the environmental improvements were generally likely to result in significant
financial savings from decreased mortality as a result of an increased number of people walking.

224 Fitter for Walking Evaluation Report
There are a large number of limitations presented by the methodological challenges of estimating cost-
effectiveness for the Fitter for Walking (FFW) projects.
The results and methodological limitations are presented in full elsewhere (Sinnett & Powell, 2012).
5.2 Evaluation strengths and limitations
The evaluation of the FFW project was completed mostly as intended.
A standard set of evaluation tools and interview and focus groups schedules were developed to evaluate
the projects which were being delivered in different contexts and allowed for the different interventions
and project activities taking place.
Route user counts and surveys
Route user counts and surveys were conducted at baseline and follow-up in seven projects. These
projects were selected on the basis of more substantial environmental improvements being made, the
improvements being made within the timeframe of the evaluation and there being some clear potential
for an increase in walking levels. In some cases, some of the environmental improvements or project
activities may have taken place before the baseline measurement took place; however, this was
unavoidable owing to the need to address the selection criteria outlined above.
Counts and surveys were conducted by an external contractor. The surveyors had to make some
judgement in categorising adults into age groups (16-59 and over 60) and there may have been errors in
some cases.
The response rate to the route user surveys varied and in some case studies was low, which may limit
the interpretation of the data collected, and hence there is a strong possibility of selection bias. Many
respondents declined to take part because they were in a hurry.
The route user counts and surveys only took place over two days at each survey period (one week and
one weekend day), therefore they only represent a snapshot of route use. There may be high variation in
route use depending on a wide range of factors, in particular the weather, therefore the results should
be interpreted with some caution.
In future, evaluators involved in the assessment of route use may wish to consider conducting more
frequent counts/surveys or continuous automated monitoring of route use where budget allows in order
to obtain more robust data. In addition, using a shorter survey, or providing route users with a copy of
the survey to complete at home, may help to increase the number of respondents.
Residents’ surveys
Residents‟ surveys were conducted in five of the seven projects where route user count/surveys took
place.
Only 200 surveys were distributed in each project, to a random selection of residents living within one
mile of where environmental improvements had taken place on the project route.
Co-ordinators assisted with the distribution of surveys and, despite instructions to distribute the survey
to every other household to ensure a random selection of participants, may have approached residents

Fitter for Walking Evaluation Report 225
whom they knew were aware of the project, possibly leading to some bias in those who responded. The
response rate to residents‟ surveys was extremely low, and the results should therefore be interpreted
with caution.
In future, an alternative method of surveying residents might be used (eg, telephone surveys) to increase
response rates. Alternatively surveys could be posted to a random selection of households or distributed
by persons independent from the project in order to ensure there is no selection bias.
Qualitative evaluation
Interviews or focus groups were conducted with project co-ordinators on a regular basis throughout the
project, providing an opportunity to learn from their early expectations, on-going experiences and later
their reflections on actual practice and progress.
Interviews were successfully conducted with the key representatives from 11 of the 12 LA partners,
providing an opportunity to learn about the role and experiences of these partners in delivering this type
of project.
Focus groups and interviews were conducted with a large number of community groups and
representatives, providing a broad perspective on working with communities in varying contexts to
tackle a wide range of issues relating to the local environment and promotion of walking. Attendees at
focus groups varied in their level of involvement in project activities; however, in many cases, they were
more active members of the communities in which they lived or were people who had played a key role
in the project, potentially leading to biased opinions on their experiences of the project.
Other issues related to the evaluation and interpretation of the Fitter for Walking evaluation
It was only possible to evaluate a small sub-set of the FFW projects which took place and, given the wide
variation in context, community engagement and project activities across the project, there may have
been more variation in experiences of the project than can be reported here. There was however
considerable variation in the projects that were evaluated, including in the way they were delivered and
the project activities that took place, providing evidence from multiple different contexts.
During the FFW project there was change in Government and growing economic crisis, which led to cuts
in funding across LAs. This may have affected the ability of the LAs to complete their role in the project
and may have prevented some of the requested environmental improvements from taking place.
The evaluation did not include any control or comparison communities, and therefore the changes
observed may or may not be solely attributable to FFW project activities. Other factors, eg, increases in
petrol prices and public transport fares may also have impacted on the success of the projects.
5.3 Summary of key findings
Living Streets‟ co-ordinators worked with approximately 150 communities from twelve LA areas across five
regions of England as part of the FFW project and successfully supported and delivered a wide range of

226 Fitter for Walking Evaluation Report
environmental improvements and awareness-raising activities to promote an increase in walking. LA
contacts and community members also played a key role in delivering and supporting project activities.
Activities varied across projects according to the needs and interests of the community and LA funding and
capacity. Examples of environmental improvements included clearance of litter, glass, dog mess, and
graffiti (in some cases supported by changes to the LA cleaning regime), improved lighting, new dropped
kerbs, new or improved signposting, removal of street clutter (eg, bollards and railings); removal of
encroaching vegetation; resurfacing of footpaths; improvements to gateways and entrances, improvements
to sight lines and the installation of new benches and litter bins. Promotional activities had an important
role throughout the projects in supporting community engagement; helping the community to identify the
barriers to walking in their area; maintaining momentum during the project; engaging additional community
groups and members; and in promoting new routes and the environmental changes which had been made,
to maximise the chances of sustained behaviour change. The street audit was an important tool for
engaging the community; helping to focus the project on a specific route or area; helping to identify the
barriers to walking and potential solutions on the identified route; and providing feedback to LAs as to the
improvements that were needed. Pledge cards were also important for engaging the wider community in
the project. Other examples of activities included: led walks; themed walks (eg, bat walks and nature
walks); bulb planting; litter pick-ups; street parties and other community events; and development of
walking maps (paper-based or large maps for display boards on walking routes).
The Fitter for Walking Award was successfully developed to recognise progress in communities towards
making environmental changes, engaging community members, increasing walking levels and making a
commitment to sustaining progress. This was awarded to both individuals and communities and was well
received as recognition for what had been achieved.
Key findings are outlined below:
1. Fitter for Walking was almost universally welcomed by communities and local authorities. It appeared
to fill a gap in current service provision for maintenance of, and improvements to, local community
environments.
2. Environmental improvements and awareness-raising activities to promote walking were successfully
delivered in a large number of communities through the Fitter for Walking project with support from
co-ordinators, LA partners and community groups and residents.
3. The role of the co-ordinator was critical to the success of the Fitter for Walking projects and both LAs
and communities reported very positive experiences of working with them. Co-ordinators were
required to lead and co-ordinate and played a key role in engaging community groups, facilitating
relationships between the community and LA partners and maintaining the focus of the project on
walking. It was important for the co-ordinator to develop knowledge of the local area and to
understand existing relationships between the LA and communities in order for the project to be
successful.

Fitter for Walking Evaluation Report 227
4. LAs had a critical role in the project in reviewing and acting upon the recommendations made in street
audits. They provided funding and resources to enable environmental improvements to be made. The
Transport department was thought to be the most appropriate place for this project to be based owing
to access to budgets and existing links to departments who would carry out the work. Regardless of
location, senior management support from within the LA was essential for successful delivery of the
project to ensure resources and funds were allocated to the project.
5. LA contacts sometimes found it difficult to undertake the tasks required for FFW owing to time
pressures from their existing work, budget cuts, existing development plans for neighbourhoods or
other work pressures within the LA. This sometimes led to long delays between submitting street audit
reports and visible action in the community. It was important for co-ordinators to recognise these
issues, to be patient and understanding when working with LAs and to manage the expectations of the
community regarding timescales for the completion of environmental changes.
6. The relationship between the co-ordinator and the LA was crucial for the success of the FFW project
particularly in making environmental changes with LAs providing resources, funding and commissioning
the work to be completed through other LA departments. Understanding existing relationships within
the LA and between the LA and the community was important for developing knowledge of local issues
and understanding reasons why some environmental changes could not be made.
7. In some areas there were differences in opinion between the co-ordinators and LAs as to which
communities should be targeted for the FFW project; this caused some tension between the two
stakeholders. Agreement should take place at the start of the project on the approach that will be
taken, taking into account the geographical area co-ordinators are expected to cover and the time
available. In future it may be beneficial for co-ordinators to work with fewer LAs or in a more focussed
area to ensure sufficient time can be allocated to each project and to allow co-ordinators to develop
the local knowledge needed to successfully deliver the projects.
8. The community played a key role in the project both in identifying local issues and barriers to walking
and participating in and supporting project activities. It was possible to work with many different types
of community group during the project including: Tenants‟ and Residents‟ Associations (TARAs),
community groups, „Friends of…‟ groups, churches, schools, parent support advisors (through schools),
scouts and other youth groups and community interest groups (such as gardening or allotments).
9. Multiple strategies were used to recruit community groups and engage them in the project.
Community consultation took place using street audits and other community events, and this approach
was seen to be a key factor in the success of the projects. It was seen to be important that the
community are allowed to develop their interest in the local environment and walking, rather than an
agenda being imposed upon them.
10. In many projects the time taken for community engagement and environmental improvements to be
made was much longer than expected; the overall timescale for each project was therefore much
greater than anticipated and co-ordinators were able to complete far fewer projects than they had
originally planned. It is important for project planning to recognise the time required for these
activities, particularly with regard to environmental improvements, so as not to raise the expectations

228 Fitter for Walking Evaluation Report
of the community. These longer timescales should also be taken into consideration when planning the
number of communities to work with over a specific time period.
11. Co-ordinators were very involved and „hands-on‟ in some community projects to the extent that
community members felt they were now part of their local community. There was a perceived need
for the co-ordinator‟s involvement and support in order for community activities to take place and
continue, thus there were concerns that when the co-ordinators „leave‟ at the end of the project there
may be some loss of momentum. LAs also had concerns over the sustainability of activities at the end
of the project once funding ceased and the co-ordinators were no longer in post. Building interest,
capacity and skills in communities is important so that communities are not dependent on the co-
ordinators for action to take place, and project activities can be self-sustaining in the longer-term.
12. Match funding for this project was provided by the participating LAs. During the project, cuts in local
government funding meant that there was pressure on LAs and a reduction in the budgets available for
use in the project which may have impacted on the project activities, particularly environmental
changes, they were able to deliver.
13. Community members were very aware of the environmental, social and psychological barriers that
prevented them and others in their community from walking. A large number of environmental barriers
to walking were addressed and removed during the project and this was reflected in the findings from
the evaluation. Across all projects evaluated, fewer environmental barriers to walking were reported
at follow-up and many route users and residents were aware of the environmental improvements that
had taken place even though they did not necessarily associate them with the FFW project.
14. FFW also addressed a number of social barriers through its awareness-raising and promotional activities.
Route users, residents and communities all reported perceptions of improvements in community
cohesion and social interaction in most of the projects and some community members reported an
overwhelming impact of the project on the daily lives of people living in their local area. In many cases
the social changes were seen to be more important for increasing the number of people who walk in
the local area than the environmental changes, therefore improving the physical environment alone
may not be sufficient to change behaviour and increase levels of walking.
15. At the end of the project, increases in the number of pedestrians using the project routes were
observed in six of the seven community projects evaluated and up to 25% of route users perceived they
had used the route more often in the last 12-18 months. Route users reported undertaking more
transport-related walking overall and were walking for a wider variety of journey
purposes. Community members and residents reported doing more walking in their local area,
discovering new places to walk to as well as new routes to get to their destinations, and there was a
general perception that more people were walking in the local area.
Fitter for Walking Evaluation Report 229
5.4 Conclusions
Living Streets‟ co-ordinators, Local Authorities and communities successfully worked together in the Fitter
for Walking project to make improvements to the physical environment on specific local routes and deliver
awareness-raising activities to promote use of the improved routes.
Community members were overwhelmingly positive about the impact of the project in their local areas and
many felt the changes would not have happened without the project and specifically the leadership from
the project co-ordinators. A wide range of environmental barriers to walking were removed through the
Fitter for Walking project and an increase in the number of people walking was observed on most of the
project routes evaluated. There was a perception amongst some route users that they had used the route
more often in the last 12-18 months and findings suggest route users were doing more transport-related
walking overall and for a wider variety of journey purposes. Similarly, some residents reported they were
doing more walking, had discovered new routes for walking and new places to walk to, and that there were
more people walking in their local area. Improvements in social interaction and community cohesion were
also reported, which may be as, or even more, important than changing the physical environment to create
safe and supportive environments for walking.
It is recommended that the FFW model is expanded to other communities in the UK as an approach to
community engagement, increasing social interaction and improving the physical environment to promote
walking as a mode of transport. However, further research and evaluation is also needed to assess the
impact of changing the physical environment and improving community cohesion, either alone or in
combination, on individual levels of walking for transport, overall physical activity, and health and well-
being.

230 Fitter for Walking Evaluation Report
CHAPTER 6. Recommendations
Overall
When funding becomes available the Fitter for Walking model should be refined and expanded across the
UK as an approach to community engagement, increasing community interaction, improving the
environment and promoting walking.
Further evaluation is needed to assess the impact of this approach on individual levels of walking and
overall physical activity in the longer-term.
For project delivery
Project co-ordinators should be employed in deprived areas, with a small enough geographical patch to
allow them to concentrate on specific projects, develop knowledge of the local area and issues and to
establish strong community links.
The project should continue to combine LA and community-led environmental improvements with
promotional and awareness-raising activities.
Additional outreach work may be required to expand into the wider community and engage more people
in project activities.
For local authorities
LAs should engage with this type of project to help develop relationships with the community and
support the development of pedestrian-friendly environments.
For communities
Communities should be persuaded that this is a walking project; social objectives are important but
increasing walking is the primary objective.
For policy makers
Increases in walking require long-term investment in infrastructure and highly labour-intensive
community development methods; but this investment can reap long-term health and social rewards.
For researchers and evaluators
Future evaluations of this type should consider the following:
repeating the approach of conducting regular qualitative interviews
exploring different methods of quantitative data collection and using short questionnaires to boost
response rate
ensuring route counts are as representative as possible of regular walking/cycling flows along a path
(consider using on-going automatic monitoring if possible)
assessing individual level changes in walking and the impact on overall physical activity levels

Fitter for Walking Evaluation Report 231
using a control or comparison area.

232 Fitter for Walking Evaluation Report
CHAPTER 7. References
Baumann, A.E. & Bull, F.C. (2007) Environmental Correlates of Physical Activity and Walking in Adults and
Children: A Review of Reviews. Review undertaken for National Institute of Health and Clinical
Excellence, London, UK
Department of Health (2004) At least five a week: Evidence on the impact of physical activity and its
relationship to health. London: Department of Health.
Craig, R., Mindell, J. & Hirani, V. (2009) Health Survey for England 2008. The NHS Information Centre, UK.
Department of Health (2009) Be Active, Be Healthy: a plan for getting the nation moving. Department of
Health, London.
Department of Health (2011) Start active, stay active: a report on physical activity for health from the four
home countries‟ Chief Medical Officers. Department of Health, London.
Department for Transport (2011) National Travel Survey Available at:
http://www.dft.gov.uk/statistics/releases/national-travel-survey-2010 (accessed 30th November
2011)
Department for Transport (2010) Active Travel Strategy Available at:
http://www2.dft.gov.uk/pgr/sustainable/cycling/activetravelstrategy/ (accessed 30th November
2011)
Lee, C., & Moudon, A.V. (2006) Correlates of walking for transportation or recreation purposes. Journal of
Physical Activity and Health. 3, S1, S77-S98
Marmot, M. (2010) Fair Society, Healthy Lives: the Marmot Review. Strategic review of health inequalities
in England post 2010. Published by the Marmot Review February 2010.
Milton, K., Bull, & F.C., Baumann, A. (2010) Reliability and validity testing of a single-item physical activity
measure. British Journal of Sports Medicine.
http://bjsm.bmj.com/content/early/2010/05/12/bjsm.2009.068395.full.pdf (accessed 30th
November 2011)
National Institute for Health and Clinical Excellence (2008) Promoting and creating built or natural
environments that encourage and support physical activity. Available at:
http://www.nice.org.uk/nicemedia/pdf/PH008Guidancev2.pdf (accessed 30th November 2011)
Fitter for Walking Evaluation Report 233
Ogilvie, D., Foster, C.E., Rothnie, H., Cavill, N., Hamilton, V., Fitzsimons, C.F., Mutrie, N. (2007)
Interventions to promote walking: systematic review. British Medical Journal. 334. Available at:
http://www.bmj.com/content/334/7605/1204.full (accessed 5th December 2011)
Owen, N., Humpel, N., Leslie, E., Baumann, A., & Sallis, J.F. (2004) Understanding environmental
influences on walking Review and research agenda. American Journal of Preventive Medicine. 27
(1), 67-76.
Saelens, B.E. & Handy, S.L. (2008) Built environment correlates of walking: A review. Medicine and Science
in Sports and Exercise. 40 (7S) S550-S566.
Sinnet, D., Williams, K., Chatterjee, K., & Cavill, N.(2011) Making the case for investment in the
walking environment: a review of the evidence. Living Streets, London, UK.
Sinnet, D. & Powell, J. (2012) Economic Evaluation of Fitter for Walking. Conducted by University of
West of England, published by British Heart Foundation National Centre for Physical Activity and
Health, Loughborough University.
Sport England (2010) Active People Survey 4, Sport England, UK.
Sustrans (2011) Living Streets Fitter for Walking: Pledge follow-up summary. Sustrans, November
2011.

234 Fitter for Walking Evaluation Report
APPENDICES

Fitter for Walking Evaluation Report 235
APPENDIX A Fitter for Walking Project Summaries

236 Fitter for Walking Evaluation Report
Fitter for Walking Project Summaries
The tables below provide a summary of the community projects that took place as part of the Fitter for Walking project. The information about each project was
provided by project coordinators in a project log which was completed on a monthly basis during the project. Where information was not provided in the project log,
this is noted as ND (no data). The tables below only include projects where project activities actually took place.
Each project is identified with a regional and local authority code (e.g. London: Barking and Dagenham is represented by LXBD) and a number starting at 01 within
each local authority area. In addition to the project number, primary projects are labelled with an “A” and are denoted in blue. Secondary projects are labelled from
B onwards and are denoted in black.
The notion of primary and secondary projects was utilised to distinguish between projects which involved a registered group from the community who took part in a
street audit, provided a report to the local authority with recommendations, oversaw the environmental improvements that were made and started to promote
walking in the community (primary group) from those who became involved or engaged at a later stage where the emphasis was more on promoting use of the
improved route and delivering educational and awareness-raising activities such as themed walks and engaging local school children in the projects (secondary group).
The information below was up to date as of December 2011.

Fitter for Walking Evaluation Report 237
London: Barking and Dagenham
Registered group
Date of registration/ completion Project area/route
Barriers to walking identified by group
Date of street audit
Key project activities
Environmental improvements Awareness-raising activities
LXBD01A. Marks Gate Older People's Network
Start: 01/11/08 End: 20/06/10
A route through the subway linking to Chadwell Heath High Road, the station and St Chads park
Cars parked inappropriately on the pavement
Lack of benches
Accessibility of subway
12/01/09 Display map of route to Chadwell Heath
Walking corridor created to Chadwell Heath
Resurfacing, dropped kerbs, clutter removal, pedestrian signage
Stalls at the school fete, summer festival and walking event to promote better parking and walking promotion.
Bulb and shrub planting
Nice gardens walk
LXBD01B. WellGate children's centre
Start: 01/04/09 End: 20/06/10
Route through the subway to Kids Kingdom and possibly Sainsbury in the future
Residents perceptions of distances to be walked
Not done ND Organised walk to Kids Kingdom and to Sainsbury's
LXBD01C. Friends of Padnell Lake
Start: 01/10/09 End: 20/06/10
The route into the subway from Chadwell Heath
ND Not done ND Clean up and beautification near the subway
LXBD01D. Marks Gate Junior school
Start: 01/05/10 End: 27/05/10
Journeys to school, shops and Chadwell Heath
ND Not done Map installed along the route Art project to create map as a display board
Walk to school week Family Walking Challenge
LXBD01E. Marks Gate church
Start: ND End: 20/06/10
ND Lack area walking map Not done Map installed along the route Art project to create map as display board
Walking pledges
LXBD01F. Marks Gate Agenda 21 group
Start: ND End: 20/06/10
A route through the subway to Chadwell Heath High Street
Littering in the subway 12/01/09 ND Marks Gate fun run and walk 2009 and 2010.
Consultation and awareness raising exercises.
LXBD01G. Marks Gate Infants school
Start: 14/10/10 End: 20/06/10
ND Congested car parking at school drop-off and pick-up times
Poor examples of walking behaviours as parents drive children to school
Not done ND Walk to school month walking challenge
LXBD02A. Resurrection Life Centre
Start: 01/02/09 End: ND
The alleyway through to the RLC centre
Centre's unstructured "green travel plan"
Dark alleyways
Uneven path surface
Poor attitudes towards walking
Not done ND An active travel survey completed by centre/church users
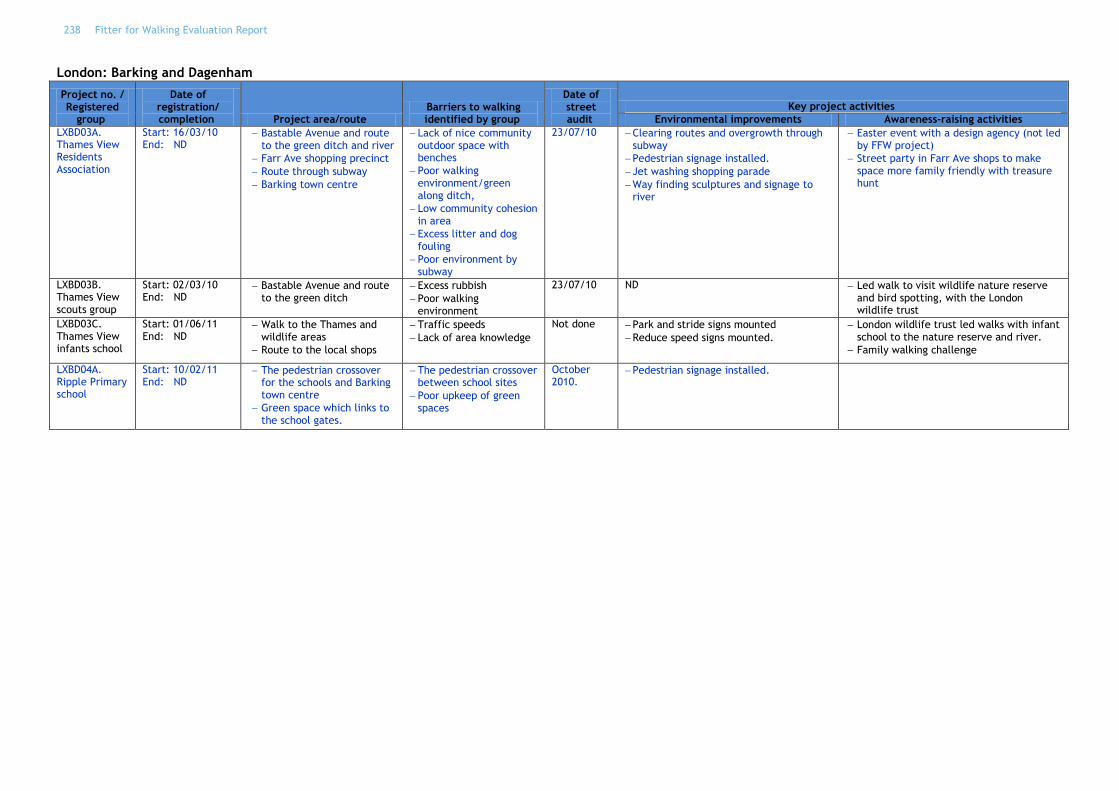
238 Fitter for Walking Evaluation Report
London: Barking and Dagenham
Project no. / Registered
group
Date of registration/ completion Project area/route
Barriers to walking identified by group
Date of street audit
Key project activities
Environmental improvements Awareness-raising activities
LXBD03A. Thames View Residents Association
Start: 16/03/10 End: ND
Bastable Avenue and route to the green ditch and river
Farr Ave shopping precinct
Route through subway
Barking town centre
Lack of nice community outdoor space with benches
Poor walking environment/green along ditch,
Low community cohesion in area
Excess litter and dog fouling
Poor environment by subway
23/07/10 Clearing routes and overgrowth through subway
Pedestrian signage installed.
Jet washing shopping parade
Way finding sculptures and signage to river
Easter event with a design agency (not led by FFW project)
Street party in Farr Ave shops to make space more family friendly with treasure hunt
LXBD03B. Thames View scouts group
Start: 02/03/10 End: ND
Bastable Avenue and route to the green ditch
Excess rubbish
Poor walking environment
23/07/10 ND Led walk to visit wildlife nature reserve and bird spotting, with the London wildlife trust
LXBD03C. Thames View infants school
Start: 01/06/11 End: ND
Walk to the Thames and wildlife areas
Route to the local shops
Traffic speeds
Lack of area knowledge
Not done Park and stride signs mounted
Reduce speed signs mounted.
London wildlife trust led walks with infant school to the nature reserve and river.
Family walking challenge
LXBD04A. Ripple Primary school
Start: 10/02/11 End: ND
The pedestrian crossover for the schools and Barking town centre
Green space which links to the school gates.
The pedestrian crossover between school sites
Poor upkeep of green spaces
October 2010.
Pedestrian signage installed.

Fitter for Walking Evaluation Report 239
London: Redbridge
Project no. / Registered
group
Date of registration/ completion Project area/route
Barriers to walking identified by group
Date of street audit
Key project activities
Environmental improvements Awareness-raising activities
LXRE01A Orchard Estate Community Group
Start: 01/06/09 End: ND
Route to Ray Lodge School especially crossing at Broadmead Road
Route along Finchingfield Avenue
Lack of safe pedestrian crossings on the route to school
Poor general walking safety and lack of confidence on the estate
23/09/09 Redbridge announce they have put new crossing into borough spending plans - later noted as unlikely to go ahead
Pledge cards used at Fun Day
Led walk
Petition about crossing
LXRE01B. Ray Lodge primary school
Start: 01/09/09 (initial meeting) End: ND
Route to Ray Lodge School especially crossing at Broadmead Road
Route along Finchingfield Avenue
Inadequate safety in children's active travel plan to school
23/09/09 ND Walk to school month launch
LXRE02A.
Commonwealth
gardeners
Start: 19/07/11 End: ND
Route between Valentine park and Ilford town centre
Poor and un-kept walking environment
Unsuitable pavements over bridge
Traffic around school entrance
20/09/11 ND ND
LXRE03A. Take Action Seven Kings
Start: 08/01/10 End: ND
Links between High Road and Meads Lane including Seven Kings tube station and two primary schools
Poor walking environment
Uninspiring and car dominated
Poor awareness to good quality green spaces in the locality
20/02/10 (cancelled due to low turnout)
ND ND
LXRE04A. Seven Kings and Newbury Park RA
Start: 01/03/10 End: 21/05/11
Aldborough Road which provides links between the High Street and multiple Tube stations, William Torbit School, Downshall Primary School, local shops/businesses and park.
Poor quality walking environment
Heavy congestion
06/03/10 Front garden of St Johns church created as community green space
Bench and plant lockers installed
Street clean-up
Removal of waste from people's front gardens
Community events
LXRE04B. St Johns Church
Start: 01/07/10 End: 21/05/11
Aldborough Road which provides links between the High Street and multiple Tube stations, William Torbit School, Downshall Primary School, local shops/businesses and local park.
Lack of community space on Aldborough Road South
06/03/10 Front garden of St Johns church created as community green space
- Bench and plant lockers installed
Art Trail map created between 4 local churches
A led walk of the map route.

240 Fitter for Walking Evaluation Report
London: Redbridge
Project no. / Registered
group
Date of registration/ completion Project area/route
Barriers to walking identified by group
Date of street audit
Key project activities
Environmental improvements Awareness-raising activities
LXRE04C. Downshall Primary School
Start: 01/03/11 End: 21/05/11
The roads directly outside the School, Aldborough Rd South in particular.
Traffic on Aldborough Road South in front of school
Visually unappealing walking environment
Not done - Mural created on school wall School walking trips so to raise awareness to local facilities in particular Seven Kings Park
School walking challenge with pledge cards.
LXRE05A. Hainault Community Project
Start: 19/01/10 End: ND
Route behind Hyneholt pub and between Robina Close and Long Green
Routes unsafe due to issues such poor lighting and high vegetation
General poor quality walking environments and attitudes towards walking
Not done ND ND
LXRE06A. Hainault 1st Scouts
Start: 20/01/10 End: ND
Routes to and around the new scout community centre, particularly the adjacent alleyway
Lack of healthy behaviour/walking knowledge amongst Children
Alleyways unsafe and unattractive places to walk
04/02/10 and 05/02/10
Tree identified as causing problems in the alleyway removed
Two walkabout events with Beavers and Scouts including mini audit and quiz.
Parents meeting to discuss concerns around the alleyway
LXRE07A. Goodmayes Safer Neighbourhood
Team Panel
Start: 19/08/10 End: ND
Route from school, including crossing over Mayfield Road and Greenside
Busy roads outside school 10/03/11 ND School will be running a petition and spoke with students before street audit
Possibly take part in Free your Feet

Fitter for Walking Evaluation Report 241
North East: Gateshead
Project no. / Registered
group
Date of registration/ completion Project area/route
Barriers to walking identified by group
Date of street audit
Key project activities
Environmental improvements Awareness-raising activities
NEGA01A. Kingsmeadow School
Start: 01/04/09 End: ND
Routes to the school via local shopping parade and Dunston park
Traffic
Perception of distances to school from residential areas being too far to walk
20/10/09 ND Led Walks:
Pledge cards to be used at event planned for the Spring to promote the routes identified during the led walks
NEGA01B. Dunston Hill Primary School
Start: 14/01/11 End: ND
Routes to school, local shops, park and community centre
Heavy traffic Not done ND Assembly
Led walks with Healthy Parenting Group
NEGA02A. Gateshead Jewish Nursery
Start: 26/05/09 End: 31/10/11
Routes to schools/nursery, Matov Children's Centre, Jewish Community Centre (Bewick Centre), Coatsworth Road shopping area and Jewish colleges
Narrow pavements
Poorly sited street furniture
No pedestrian crossing facilities
Heavy traffic
30/06/09 New raised crossing area with traffic calming
Removal of street furniture
Widened pavements
Talks and meetings are planned with parents and pupils to encourage walking to school using WOW tactics and FFW pledge cards.
Led walks in the new year with fathers and children via the Matov Children Centre are also planned.
Engagement / info sharing event organised for 11 Feb at the Jewish Community Centre (Bewick Centre).
11/02 Bewick Centre Event: 65 people pledge to walk more often for short journeys especially to school and kinder.
Children took part in FFW craft activities, which were road safety and walking themed.
NEGA02B. Jewish Boys School
Start: 13/01/11 End: 31/10/11
Route to school, local shops and community facilities
Concerns about road safety
Not done ND Assembly to promote walking and road safety
NEGA02C. Jewish Girls School
Start: 26/10/10 End: 31/10/11
Routes to schools/nursery, Matov Children's Centre, Jewish Community Centre (Bewick Centre), Coatsworth Road shopping area and Jewish colleges
Narrow pavements
Poorly sited street furniture
No pedestrian crossing facilities
Heavy traffic
Not done ND Assembly and pledge cards to promote walking
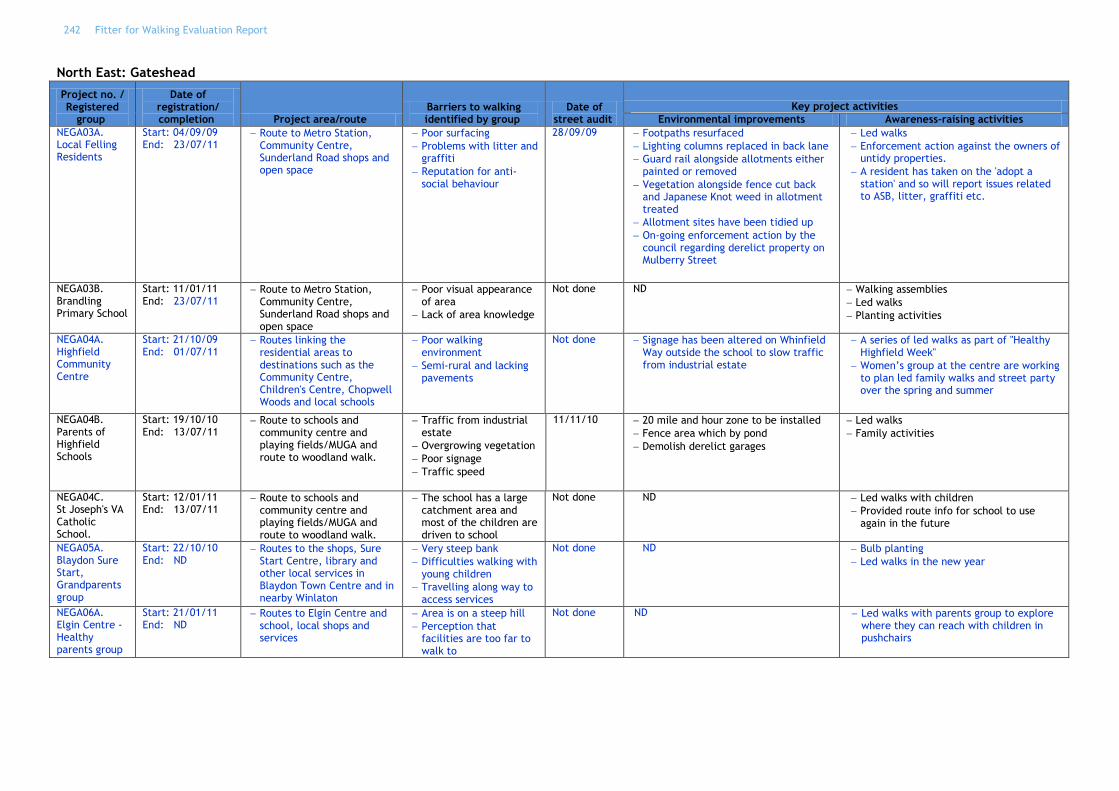
242 Fitter for Walking Evaluation Report
North East: Gateshead
Project no. / Registered
group
Date of registration/ completion Project area/route
Barriers to walking identified by group
Date of street audit
Key project activities
Environmental improvements Awareness-raising activities
NEGA03A. Local Felling Residents
Start: 04/09/09 End: 23/07/11
Route to Metro Station, Community Centre, Sunderland Road shops and open space
Poor surfacing
Problems with litter and graffiti
Reputation for anti-social behaviour
28/09/09 Footpaths resurfaced
Lighting columns replaced in back lane
Guard rail alongside allotments either painted or removed
Vegetation alongside fence cut back and Japanese Knot weed in allotment treated
Allotment sites have been tidied up
On-going enforcement action by the council regarding derelict property on Mulberry Street
Led walks
Enforcement action against the owners of untidy properties.
A resident has taken on the 'adopt a station' and so will report issues related to ASB, litter, graffiti etc.
NEGA03B. Brandling Primary School
Start: 11/01/11 End: 23/07/11
Route to Metro Station, Community Centre, Sunderland Road shops and open space
Poor visual appearance of area
Lack of area knowledge
Not done ND Walking assemblies
Led walks
Planting activities
NEGA04A. Highfield Community Centre
Start: 21/10/09 End: 01/07/11
Routes linking the residential areas to destinations such as the Community Centre, Children's Centre, Chopwell Woods and local schools
Poor walking environment
Semi-rural and lacking pavements
Not done Signage has been altered on Whinfield Way outside the school to slow traffic from industrial estate
A series of led walks as part of "Healthy Highfield Week"
Women‟s group at the centre are working to plan led family walks and street party over the spring and summer
NEGA04B. Parents of Highfield Schools
Start: 19/10/10 End: 13/07/11
Route to schools and community centre and playing fields/MUGA and route to woodland walk.
Traffic from industrial estate
Overgrowing vegetation
Poor signage
Traffic speed
11/11/10 20 mile and hour zone to be installed
Fence area which by pond
Demolish derelict garages
Led walks
Family activities
NEGA04C. St Joseph's VA Catholic School.
Start: 12/01/11 End: 13/07/11
Route to schools and community centre and playing fields/MUGA and route to woodland walk.
The school has a large catchment area and most of the children are driven to school
Not done ND Led walks with children
Provided route info for school to use again in the future
NEGA05A. Blaydon Sure Start, Grandparents group
Start: 22/10/10 End: ND
Routes to the shops, Sure Start Centre, library and other local services in Blaydon Town Centre and in nearby Winlaton
Very steep bank
Difficulties walking with young children
Travelling along way to access services
Not done ND Bulb planting
Led walks in the new year
NEGA06A. Elgin Centre - Healthy parents group
Start: 21/01/11 End: ND
Routes to Elgin Centre and school, local shops and services
Area is on a steep hill
Perception that facilities are too far to walk to
Not done ND Led walks with parents group to explore where they can reach with children in pushchairs

Fitter for Walking Evaluation Report 243
North East: Newcastle
Project no. / Registered
group
Date of registration/ completion Project area/route
Barriers to walking identified by group
Date of street audit
Key project activities
Environmental improvements Awareness-raising activities
NENE01A. Friends of St Lawrence Park
Start: 10/11/08 End: 23/06/10
The Byker Link - with trips to St Lawrence Park, the Quayside, Shields Road and leisure centre
Poor reputation of the area
Lack of maintenance of the route
Dog fouling
16/12/08 ND Led various walks throughout the year
FSLP have organised nature walks along the Byker Link attracting 40+ local residents
Large scale community clean-up day
NENE01B. Byker Primary School
Start: 02/02/11 End: ND
Route to school, Byker link, shopping area and metro
Negative perception of walking environments
Excessive rubbish and graffiti
Not done ND Assembly and family pledge cards
NENE01C. Byker YMCA
Start: 24/02/11 End: ND
Byker link and route to Quayside, Ouseburn farm, local shops, school and metro
Negative perfection of walking environments
Excessive rubbish and graffiti
Not done ND Led walks during Feb
NENE02A. Nunsmoor Centre
Start: 01/02/10 End: ND
Four local routes to key destinations: Morrisons Store, Fenham Library and Pool, Leaze Park and Exhibition Park
An unwilling to walk, due to an unfamiliarity with the local area
Not done ND Led walks
Pledge cards and maps to promote local walks that are approximately 15 minutes from Nunsmoor
NENE03A. Trinity Gosforth
Start: 15/10/09 End: 22/09/11
Existing Gosforth High Street History Walks; routes to schools; access to the Trinity Centre from surrounding residential areas
Reliance on the car for short journeys
Poor street environment (Gosforth High St)
Not done An interpretation board of the map installed in the park.
Local walks
Engagement with primary schools to coincide with Walk 2 School Week
Local history walking map has been distributed to Northern Rock employees, the history group, local schools and residents.
NENE04A. Friends of St James Cemetery, Benwell
Start: 01/03/11 End: ND
Routes to church, transport links and local services
Steep location
Elderly population.
Not done A new hose and tap have been installed so that these can be maintained.
Local walks on heritage trail
Planting sessions
Map produced to promote the trail

244 Fitter for Walking Evaluation Report
North East: Sunderland
Project no. / Registered
group
Date of registration/ completion Project area/route
Barriers to walking identified by group
Date of street audit
Key project activities
Environmental improvements Awareness-raising activities
NESU01A. Walking With Wheels
Start: 22/12/08 End: 01/03/10
Route connecting two communities including metro station, shops and schools
Poor surfaces
No signage
Overgrown vegetation
Litter, broken glass and dog fouling
03/02/09 Major resurfacing of a section of the route
ND
NESU02A. Grange Park Primary School
Start: 19/02/09 End: 22/06/10
Route connecting residential area and school to the Sunderland Aquatic Centre and the Stadium of Light
Perceptions of distance
Traffic
19/05/09 Pedestrian desire line formally resurfaced
Graffiti removed from the gable at end property
Untidy property cleared
Community visit with pupils to Thompson Park Community Centre,
Walk to School launch event
School wide pedometer challenge
NESU03A. Sunderland Bangladeshi Community Centre
Start: 20/02/09 End: ND
Local routes to Winter Gardens, Riverside Quarter and Leisure Centre
Fear of anti-social behaviour
Lack of confidence in walking around local area
Not done ND Led Walks
NESU04A. Plains Farm and Humbledon Residents Association
Start: 12/05/09 End: 18/06/10
Route from residential area to shops and leisure facilities
Poor pedestrian access across the estate
A lack of dropped kerbs
Heavy traffic
Litter
28/08/09 Instillation of dropped kerbs Led walks
Walk to School Week activities with Plains Farm Primary School who have also completed a walking themed poster competition and a week-long family walking challenge
NESU05A. High Downs Community Reference Group
Start: 02/11/10 (initial meeting) End: ND
Routes to shops, library, sports centre and local services in Hetton and Houghton le Spring
Route to Nature Reserve and local shops
Footpaths are very underfoot
Route to the nature reserve does not have a formal path from the estate
No signage
Poor distance perceptions to facilities
Not done ND ND

Fitter for Walking Evaluation Report 245
North West: Blackburn
Project no. / Registered
group
Date of registration/ completion Project area/route
Barriers to walking identified by group
Date of street audit
Key project activities
Environmental improvements Awareness-raising activities
NWBL01A. Taylor St
Start: 10/09/08 End: ND
Routes around school/children‟s centre, church, shops and alternative routes to town
Poor lighting under rail bridge
Walls heavily graffittied
Area subject to fly tipping
No/poor route signage
27/10/08 New Lighting
Extra bollards to prevent traffic entering bridge illegally
Community clean up with residents
School involvement in artwork at later date
NWBL01B. Cleaner Greener Griffin
Start: 10/09/08 End: 08/08/09
Areas around Griffin that needed improving to make more appealing to the eye
Streets create uninviting walking environment
27/10/08 Clearing of weeds from raised planter beds and addition of herbaceous perennials.
Community Clean up with residents
Planting of bedding plants and bulbs in Cavendish Place
Community/group involvement in SW neighbourhood board
NWBL02A. Daisyfield School
Start: 01/12/08 End: 01/03/09
Routes around school/children centre to shops, canal walks and alternative routes to town
Women did not feel comfortable walking off route
Little knowledge of area walking routes
Not done ND Group walking routes established
Council led walks
NWBL03A. Sunnybower Route to Roe Lee
Start: ND End: ND
Route to park and school Poor quality of path surfaces
Lack of distance perception along routes
Need better signage and benches
10/04/10 New path surface from Capita requested but not completed
Working with school during Walk to School activities
NWBL04A. Empire Theatre
Start: 01/09/09 End: 01/08/10
Civic walk surrounding history of Empire Theatre and its relationship with the neighbourhood
No apparent knowledge/perception of distance to theatre or value to local area
01/12/09 ND Production of self-led walking maps to schools, visitors and wider general public
Led walks over centenary celebrations
NWBL05A. Springbank Court Walking Group
Start: ND End: ND
Route to Ewood Park football stadium and Theatre
Insufficient pathways around sheltered housing estates
No dropped kerbs
Problems with pavement parking
Not done Installation of dropped kerbs Led walks
Provide maps to group of route to theatre
NWBL06A. Westbury Gardens
Start: 01/01/11 End: 1/11/11
Circular route with options for rest and refreshments at each church or mosque
Lack of perception/understanding of walking distances
Poor links between places of worship
30/10/09 ND Production of local maps
Launch event

246 Fitter for Walking Evaluation Report
North West: Blackburn
Project no. / Registered group
Date of registration/ completion Project area/route
Barriers to walking identified by group
Date of street audit
Key project activities
Environmental improvements Awareness-raising activities
NWBL01C.
St Lukes Walk to Witton
Start: ND
End: ND
Route from Church to Local park and amenities
Not knowing how close the park was and did not feel safe as single people walking
NA NONE Weekly walks to highlight the routes
NWBL01D.
Stansfeld Day Centre
Start: ND
End: ND
As above Centre for adults with disabilities
ND ND Joined in walks with St Lukes Group
NWBL0
Residents of Sunnyhurst
Start: 01/09/10
End: ND
Area around Sunnyhurst Darwen
Reluctance of neighbours to join in and get walking
ND NA Events held in streets in form of street parties and street theatre.
NWBL0
Salesbury School
Start: Sept 2011
End: Dec 2011
Route from former orphanage to school
Not knowing the route existed and awareness of how walk used to be done every day by children.
Heritage project
ND None Heritage walk and school assemblies
NWBL0
Beardwood to Lammack
Started 2010-To be completed early 2012
Route through Lammack and Beardwood
No centre for residents to meet.
Maps, activity points and bird boxes to be installed.
Walks to map out the route
NWBL0
Beardwood to Lammack
Start: ND
End: ND
ND ND ND ND ND
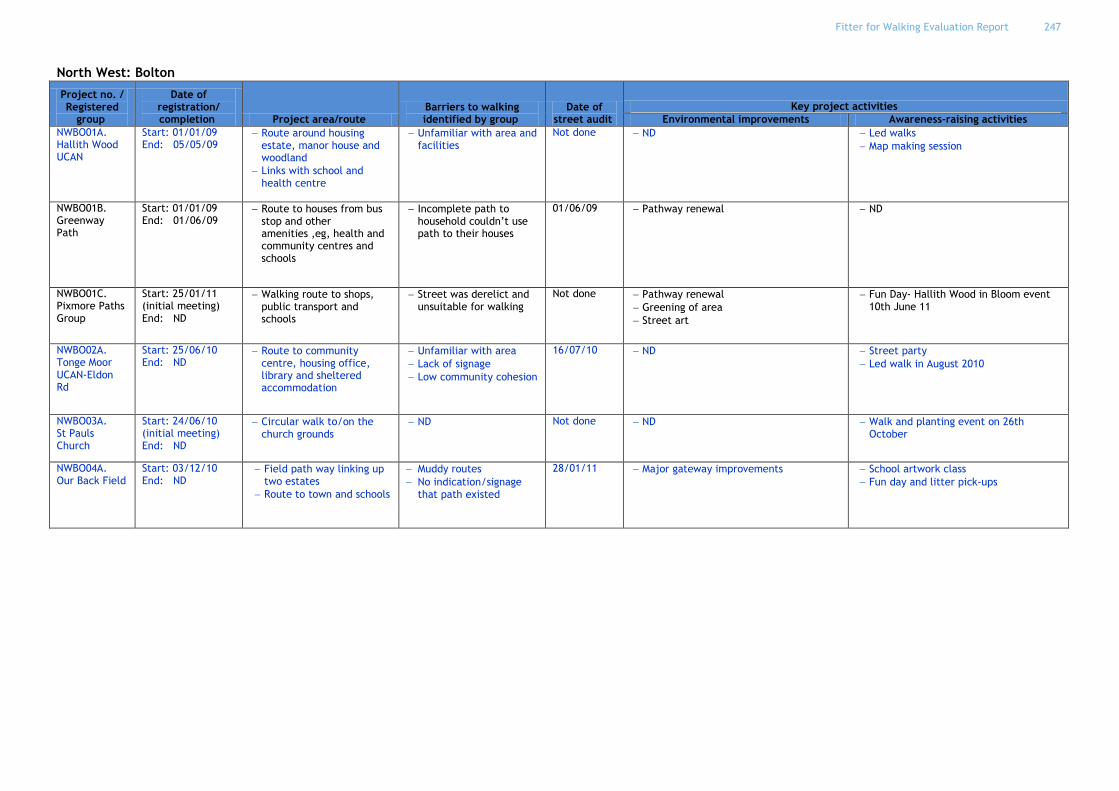
Fitter for Walking Evaluation Report 247
North West: Bolton
Project no. / Registered
group
Date of registration/ completion Project area/route
Barriers to walking identified by group
Date of street audit
Key project activities
Environmental improvements Awareness-raising activities
NWBO01A. Hallith Wood UCAN
Start: 01/01/09 End: 05/05/09
Route around housing estate, manor house and woodland
Links with school and health centre
Unfamiliar with area and facilities
Not done ND Led walks
Map making session
NWBO01B. Greenway Path
Start: 01/01/09 End: 01/06/09
Route to houses from bus stop and other amenities ,eg, health and community centres and schools
Incomplete path to household couldn‟t use path to their houses
01/06/09 Pathway renewal ND
NWBO01C. Pixmore Paths Group
Start: 25/01/11 (initial meeting) End: ND
Walking route to shops, public transport and schools
Street was derelict and unsuitable for walking
Not done Pathway renewal
Greening of area
Street art
Fun Day- Hallith Wood in Bloom event 10th June 11
NWBO02A. Tonge Moor UCAN-Eldon Rd
Start: 25/06/10 End: ND
Route to community centre, housing office, library and sheltered accommodation
Unfamiliar with area
Lack of signage
Low community cohesion
16/07/10 ND Street party
Led walk in August 2010
NWBO03A. St Pauls Church
Start: 24/06/10 (initial meeting) End: ND
Circular walk to/on the church grounds
ND Not done ND Walk and planting event on 26th October
NWBO04A. Our Back Field
Start: 03/12/10 End: ND
Field path way linking up two estates
Route to town and schools
Muddy routes
No indication/signage that path existed
28/01/11 Major gateway improvements School artwork class
Fun day and litter pick-ups

248 Fitter for Walking Evaluation Report
North West: Bolton
Project no. / Registered
group
Date of registration/ completion Project area/route
Barriers to walking identified by group
Date of street audit
Key project activities
Environmental improvements Awareness-raising activities
NWBO0 Sarah Lodge
Start: 02/03/11 (initial meeting) End: ND
Routes to schools, children centre and community centre
Unfamiliar with area
Lack of confidence/desire to be physically active
ND ND Weekly walks planned
Street Party August
NWBO0 Cobden St Community
Start: 30/06/10 End: ND
Woodland walk that gives access to main road for schools etc.
Cultural barriers, ,eg,, Asian ladies not really permitted to walks as a group
ND ND Clean up planned for new year
NWBO0 Uthreach Gardens
Start: 24/06/10 End: ND
Route to community centre and garden
Lack of central location/green space to meet and start walking groups
ND Replace railings with an opening gate ND

Fitter for Walking Evaluation Report 249
West Midlands: Dudley
Project no. / Registered
group
Date of registration/ completion Project area/route
Barriers to walking identified by group
Date of street audit
Key project activities
Environmental improvements Awareness-raising activities
WMDU01A. Beacon Centre for the Blind (Dudley)
Start: 01/03/09 End: 03/11/09
Walking to and from the Beacon Centre
Routes to open green spaces and the Sedgley town centre
Lack of guides or assistants to accompany walkers to the centre
Not done Led 3 walks (24/07; 07/08; 21/08)
WMDU03A. Blowers Green Primary School
Start: 12/10/09 End: March 2012
Route to school (path at the back of the school)
Route used by pupils when walking to Dudley Leisure Centre for their swimming sessions
Lack of personal and pedestrian safety
Unclean streets
Excessive traffic speeds
26/01/10 Cutting back of tree and scrub encroachment (July 10 )
Path and hand rail repair (Oct 10)
CSA 26/01/10
Assembly using Family Pledge cards (Mar 11)
School based activities with pupils ~ litter picks (Mar 11); wildlife walks (Apr 11)
Blowers Green Primary School ~ litter pick-ups 15 & 17 Mar 11; wildlife walks 5 & 7 Apr 11
Blowers Green Nursery ~ bird walks 18 Mar 11; mini-beast walks 23 Mar 11
Follow up school assembly highlighting the work and the school working towards the FFW Award (08/04/11)
Park and Stride scheme to start in Jan 12
WMDU04A. Halesowen Asian Elderly Group
Start: 12/10/09 End: Nov 11
Walking route along Long Lane, which is the main street to Blackheath town centre and local day centres
Traffic speeds
Poor crossing facilities
Lack of personal and pedestrian safety
Unclean streets
Poor lighting on streets
15/03/10 None Ladies led walks 16 Mar & 13 May (2010)
Men's led walks 29 Mar, 19 & 26 Apr (2010)
CSA 15.03.10
WMDU05A. Tenterfields Children's Centre
Start: 28/10/09 End: 07/04/10
Routes to Centre, local primary school and shops in Halesowen town centre
Lack of personal/ pedestrian safety, especially those with pushchairs
Poor signage to town centre and other points of interest
Not done Project never got started due to lack of community involvement
none

250 Fitter for Walking Evaluation Report
West Midlands: Dudley
Project no. / Registered
group
Date of registration/ completion Project area/route
Barriers to walking identified by group
Date of street audit
Key project activities
Environmental improvements Awareness-raising activities
WMDU06A. Bowling Green TARA
Start: 19/05/10 End: March 12
Route linking main residential area to shops, schools and public transport facilities
Lack of personal and pedestrian safety
Poor condition of alleys
Congestion around Netherbrook Primary School
14/07/10 DMBC have undertaken some physical improvements following the CSA which includes narrowing two junctions
Council are in consultation with residents regarding some Traffic Road Orders proposals that are looking at tackling parking issues. These improvements will play a part in the Safer Routes to Schools. Works are approx. £10000
Four walks planned for 27 Oct 3, 10 17 Nov 10
Litter pick event 26/02/11 (cancelled due to poor weather conditions)
The community have cleared two alleys (one audited) as part of clean up days
WMDU06B. Netherbrook Primary School
Start: 10/02/11 End: March 12
Route linking main residential area to shops and public transport
Route to Dudley Canal No 2 and Bumblehole Nature Reserve
Lack of confidence to initiate walks to Canal
Lack of initial support
Unclean streets
Not done School assembly using the family pledge cards (28/03/11)
WMDU07A. Whittingham Road residents
Start: 07/06/10 End: March 12
Route from residents area, school and college to Halesowen Town Centre
Lack of personal and pedestrian safety, especially for those with pushchairs
Poor condition of walking routes
Congestion around primary school and college
23/11/10 Relocation of road name (July 11)
Side alley resurfaced with tarmac (June/July 11)
Removal of graffiti (July 11)
New dropped kerbs (July 11)
Led walk (incorporating audited route) 15/09/11 and 04.10.11
Bulb planting by residents 06.12.11

Fitter for Walking Evaluation Report 251
West Midlands: Sandwell
Project no. / Registered
group
Date of registration/ completion Project area/route
Barriers to walking identified by group
Date of street audit
Key project activities
Environmental improvements Awareness-raising activities
WMSA01A. Haywood's Farm residents
Start: 23/03/09 End: 21/08/10
Alley behind residential area which leads through the Windmill Farm open space to Bustleholme Lane/local shops
Lack of personal safety
Anti-social behaviour
Issues with fly tipping and litter
01/08/09 None Led wildlife walks and activities: 19 June (Mini beast Walk); 17 July (Butterfly Walk); 21 August
WMSA02A. Millersdale Residents
Start: 18/02/10 End: Group withdrew 21/01/10
Alley behind residential area which leads through the Windmill Farm open space to Bustleholme Lane/local shops
Issues with litter
Vegetation encroachment
Not done None Led wildlife walks and activities: 19 June (Mini beast Walk); 17 July (Butterfly Walk); 21 August
WMSA03A. Burnt Tree Children's Centre
Start: 16/03/09 End: 03/08/10
Routes to and around Tipton town centre including leisure centre, library, supermarket, train station and local park
Lack of personal safety
Poor reputation held by Tipton residents
Not done Installation of dropped kerbs along the walking route
Led two walks on 29.05 & 06.06
WMSA04A. Friends of Thimblemill Brook
Start: 28/10/09 End: 27/05/11
Path along section two (Norman Road) of the Brook which links to local green space, library, swimming centre, shops and schools
Access to the brook from the streets
Local knowledge and awareness of the brook and it's features
23/01/10 New dog waste bins have been installed and the unsafe positioned bin has been removed and repositioned
Path/pavement have been repaired (04/04/11)
Information panel installed (15/07/11)
Dropped kerbs on Bowling Green Drive installed as a result of CSA (July 11)
A new second information panel to be installed along section 3 of the Brook, Jan 12
Community Litter Pick 27.03.10
Monthly health walks set up with Sandwell Strides
Thimblemill Library Fun Day (promoted the new walk and work of the FO group)
Community bulb planting/pledge cards events 23.02.11 (bulbs donated by local business)
Attended Uplands Manor Primary School Summer Fayre (09.07.11), Thimblemill Brook Library‟s Fun Day (16.07.11), Picnic in the Park (17.07.11) and Bearwood Primary's Summer Fayre (19.07.11) to promote walking along the Brook, used walking pledge cards
Four monthly led walks (Jan-Apr10)
Bearwood Sure Start group 26/01/11: presentation, bulb planting and pledge cards
Wildlife Spotter Sheet devised for use at the Brook; 5000 printed, available via Thimbelmill Library and given to every school involved and FFW registered with the Brook work

252 Fitter for Walking Evaluation Report
West Midlands: Sandwell
Project no. / Registered
group
Date of registration/ completion Project area/route
Barriers to walking identified by group
Date of street audit
Key project activities
Environmental improvements Awareness-raising activities
WMSA04B. Uplands Manor Primary School
Start: 07/02/11 End: 20/07/11
Section 3 of Thimblemill Brook
Lack of confidence to initiate walks to Brook
No initial support to help with encourage and improving brook walks
Not done None School assembly using the family pledge cards (04.03.11)
Four after school activities with the Eco Buddies to take place on site at Section 3 of the Brook (Mar 11)
Walking challenge for the school during May 11
Wildlife walks scheduled for 17, 18, 20, 23, 25 May and 6 & 10 June (for years 1 to 6, totalling 19 classes)
Attended school's summer fayre, used walking pledge cards to engage with parents/families 09.07.11
Wildflower planting 17.10.11 (with one year 4 class). The pupils wrote a letter to local residents informing them of the planting and their work with LS and why they didn‟t want the grass cut in order to allow the native flowers to grow.
WMSA04C. Bearwood Primary School
Start: 05/04/11 End: ND
Section 2 and 3 of Thimblemill Brook
Lack of confidence to initiate walks to Brook
No initial support to help with improving brook walks
Not done None School assembly using the family pledge cards (17/05/11)
Wildlife walks May/June 11
Wildflower planting May/June 11
Attended school's summer fayre, used walking pledge cards to engage with parents/families 19/07/11
WMSA04D. St Gregorys Catholic Primary School
Start: 15/06/11 End: ND
Section 2 of Thimblemill Brook
Lack of confidence and information to initiate walks to Brook
No initial support to help improve brook walks
Not done None School assembly using the family pledge cards (01/07/11)
3 wildlife led walks July 11
4 wildflower planting sessions Oct 11
WMSA05A. Abbey Junior School
Start: 08/02/10 End: 19/07/11
Routes along Abbey Road and Katherine Road to Thimblemill Swimming Centre
Excessive dog fouling
Lack of pedestrian crossing facilities
22/05/10 None Bulb planting 26.11.10
Four bird walks as part of National Nest Box Week down to Thimblemill Brook (in partnership with Black Country Living Landscapes) 14/02/11
Follow up bird walks were undertaken with the 4 classes, showing them their class bird boxes that had been mounted (25/03/11)
Follow up school assembly highlighting the work and efforts towards the FFW Award (19/05/11)

Fitter for Walking Evaluation Report 253
West Midlands: Sandwell
Project no. / Registered
group
Date of registration/ completion Project area/route
Barriers to walking identified by group
Date of street audit
Key project activities
Environmental improvements Awareness-raising activities
WMSA06A. Highfields Primary School
Start: 23/03/10 End: March 12
Green space opposite the school with links to Haden Hill Leisure Centre
Anti-social behaviour
Excessive dog fouling
Overgrown foliage
Poorly maintained local green space
22/07/10 Cut back of encroachment on the green space
Cutting back trees and clearing the alley leading from the open space to Highfield Road
Replacement of missing dog bin
Walk to School with family pledge cards re-launch assembly 11/05/11
Community consultation and walking pledge cards undertaken at school summer fayre 25.06.11
WMSA07A. Great Bridge Traders Association
Start: 20/10/10 End: March 12
Routes from Great Bridge Town Centre to local residential areas and Sheepwash Country Park
Overgrown foliage
Anti-social behaviour as area used a place where adults gather to drink alcohol
Poorly advocated/used as a local walking route
01/01/11 New vehicle barrier installed (Sept/Oct 11)
Repairs to metal bridge (Oct/Nov 11)
Street cleaned and over hedge edges cleared
Path edging cleared of encroachment
CSA 05/05/11
WMWO04B. Wednesbury Oak Primary School (in Sandwell but linked to WMWO04A.)
Start: 04/03/10 End: 01/06/11
Weddell Wynd Linear path including local walking routes
Unclean walking environment
Lack of walking promotions/support for local routes
Not done ND Six after school walks/activities (Apr/May 10)
Follow up school assembly highlighting the work and the school working towards the FFW Award and used the family pledge cards (24/03/11)
WMWO04C. RSA Academy (in Sandwell but linked to WMWO04A.)
Start: 26/05/11 End: March 12
Weddell Wynd Linear path Unclean walking environment
Poorly maintained footpaths
Residents unaware of biodiversity site
Poor signage to site
Not done Instillation of new information panel in Jan/Feb 12
Various activities to include led walk; tree identification; worm survey; building wildlife habitats (Sept-Dec 11)
Academy have committed to undertaking monthly litter picks, LS will fund the equipment for this activity
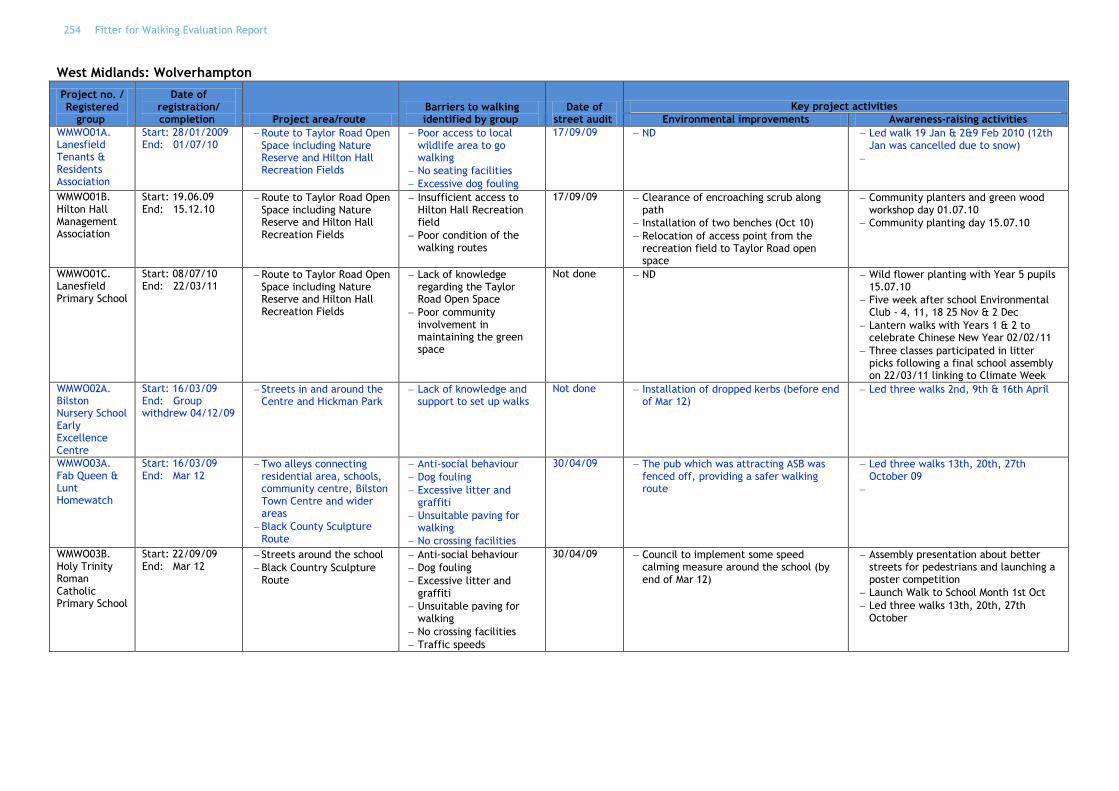
254 Fitter for Walking Evaluation Report
West Midlands: Wolverhampton
Project no. / Registered
group
Date of registration/ completion Project area/route
Barriers to walking identified by group
Date of street audit
Key project activities
Environmental improvements Awareness-raising activities
WMWO01A. Lanesfield Tenants & Residents Association
Start: 28/01/2009 End: 01/07/10
Route to Taylor Road Open Space including Nature Reserve and Hilton Hall Recreation Fields
Poor access to local wildlife area to go walking
No seating facilities
Excessive dog fouling
17/09/09 ND Led walk 19 Jan & 2&9 Feb 2010 (12th Jan was cancelled due to snow)
WMWO01B. Hilton Hall Management Association
Start: 19.06.09 End: 15.12.10
Route to Taylor Road Open Space including Nature Reserve and Hilton Hall Recreation Fields
Insufficient access to Hilton Hall Recreation field
Poor condition of the walking routes
17/09/09 Clearance of encroaching scrub along path
Installation of two benches (Oct 10)
Relocation of access point from the recreation field to Taylor Road open space
Community planters and green wood workshop day 01.07.10
Community planting day 15.07.10
WMWO01C. Lanesfield Primary School
Start: 08/07/10 End: 22/03/11
Route to Taylor Road Open Space including Nature Reserve and Hilton Hall Recreation Fields
Lack of knowledge regarding the Taylor Road Open Space
Poor community involvement in maintaining the green space
Not done ND Wild flower planting with Year 5 pupils 15.07.10
Five week after school Environmental Club - 4, 11, 18 25 Nov & 2 Dec
Lantern walks with Years 1 & 2 to celebrate Chinese New Year 02/02/11
Three classes participated in litter picks following a final school assembly on 22/03/11 linking to Climate Week
WMWO02A. Bilston Nursery School Early Excellence Centre
Start: 16/03/09 End: Group withdrew 04/12/09
Streets in and around the Centre and Hickman Park
Lack of knowledge and support to set up walks
Not done Installation of dropped kerbs (before end of Mar 12)
Led three walks 2nd, 9th & 16th April
WMWO03A. Fab Queen & Lunt Homewatch
Start: 16/03/09 End: Mar 12
Two alleys connecting residential area, schools, community centre, Bilston Town Centre and wider areas
Black County Sculpture Route
Anti-social behaviour
Dog fouling
Excessive litter and graffiti
Unsuitable paving for walking
No crossing facilities
30/04/09 The pub which was attracting ASB was fenced off, providing a safer walking route
Led three walks 13th, 20th, 27th October 09
WMWO03B. Holy Trinity Roman Catholic Primary School
Start: 22/09/09 End: Mar 12
Streets around the school
Black Country Sculpture Route
Anti-social behaviour
Dog fouling
Excessive litter and graffiti
Unsuitable paving for walking
No crossing facilities
Traffic speeds
30/04/09 Council to implement some speed calming measure around the school (by end of Mar 12)
Assembly presentation about better streets for pedestrians and launching a poster competition
Launch Walk to School Month 1st Oct
Led three walks 13th, 20th, 27th October

Fitter for Walking Evaluation Report 255
West Midlands: Wolverhampton
Project no. / Registered
group
Date of registration/ completion Project area/route
Barriers to walking identified by group
Date of street audit
Key project activities
Environmental improvements Awareness-raising activities
WMWO04A. Weddell Wynd Residents (Also see projects WMW004AB & WMWO004C in Sandwell)
Start: 20/02/09 End: 16/05/11
Weddell Wynd Linear Path which leads to shops, sports academy, metro (tram) station, youth centre, fishing pools, canals and an open green space
Poor condition of linear path
Excessive dog fouling and litter
Water pooling on the path
25/09/09 Footway maintenance to linear path
Installation of litter bin
Removal of high dropped curb and replaced with flat tarmac
Installation of two benches
Bulb planting 08/12/09
WMWO05A. Bilston CofE Primary School
Start: 05/02/10 End: Mar 12
Streets near to/around the school
Poor condition of streets near to the school
Parking issues around school
11/05/10 Installation of 4 sets of dropped kerbs (by Mar 12)
Narrowing of Hickman Road/Mill Street junction, to improve crossing provision and reducing vehicle speed
Assembly with school council informing the school about better streets for pedestrians
CSA May 10
Activities leading up to Walk to School Week
Piggybacked onto the Council's Health & Wellbeing event hosted at the school
Two set school walks
School assembly with family pledge cards given on 28/02/11
Two litter pick sessions with the Eco Buddies (11 pupils) 15 & 29 Mar 11

256 Fitter for Walking Evaluation Report
Yorkshire: Doncaster
Project no. / Registered
group
Date of registration/ completion Project area/route
Barriers to walking identified by group
Date of street audit
Key project activities
Environmental improvements Awareness-raising activities
YHDO01A Bentley Community Kids
Start: 30/03/09 End: Group withdrew
Route to allotments Culture of apathy among residents and particularly these kids' parents.
Not done ND NA
YHDO02A Bentley Heritage Society
Start: 01/05/09 End: Group withdrew
The route takes in approx. 12 sites/places of historic interest, all within the town centre area, and passes by shops and local services
Two unsuitable short lengths of public footpath that stopped the trail being accessed by all.
01/05/09 NA NA
YHDO03A Bentley Day Service
Start: 04/03/09 End: 10/06/09
Different routes to a local park in Bentley and the Pavilion Tea Room
Abilities of target group
Unsuitable routes for wheelchair users
Not done ND A series of led walks took place between March and June 09.
First S. Yorks group to be recognised with a Community Award.
YHDO04A Friends of Hexthorpe Flatts Park group
Start: 03/03/09 End: 01/05/11
Routes in park with many features and facilities
Route to local school
Perceptions of anti-social behaviour in the park
Apathy of local residents
Not done Noticeboard is installed at the entrance to the park and looks really good.
Planting of spring bulbs has taken place in the park with some of the neighbourhood team and pupils from Hexthorpe Primary School
Led walks around park starting at the local school involving parents and local residents
A family fun day with a stall that had FFW literature, pledge cards etc.
Regular walking group established with 2 newly trained (Nov ‟11) Walk Leaders.
YHDO05A Latin Gardens/ Emley Drive Area TARA
Start: 10/09/08 End: 01/07/10
Route along the Roman Ridge which leads to a local primary school, some shops and the post office
Poor access to Roman Ridge (a local footpath linking the estates to local amenities)
Overgrown hedges blocking lighting around the green space
10/09/09 Improved access path to Roman Ridge
New street signs have been installed and hedges have been cut down around play area
Installing new junior goal posts
Re-siting of a street sign
Inviting the Doncaster Belles to lead a training session there
Repainting of a street sign
Cutting down of bushes around school entrance and around playing field.
YHDO05B Scawsby Rosedale School
Start: 23/10/09 End: 01/05/10
A small patch of land outside the school entrance which leads to two housing estates
Untidy space outside school entrance
Not done Knee rail to be installed around the perimeter of this land
A plaque installed to celebrate the planting
A series of walks involving the school - planned for Spring 2010
Led walk involving the whole school on May 21st in WTS week
Planting of winning design on garden in May 19th

Fitter for Walking Evaluation Report 257
Yorkshire: Doncaster
Project no. / Registered
group
Date of registration/ completion Project area/route
Barriers to walking identified by group
Date of street audit
Key project activities
Environmental improvements Awareness-raising activities
YHDO06A. Friends of Martinwells Lake
Start: 26/09/09 End: 01/07/10
A lake surrounded by some woodland and grassland bordered by a housing estate
Recent problems with anti-social behaviour
Unused/untidy parcel of land
Not done Installation of new benches
Boardwalks repaired and painted
Completion of lake path
New entranceways, gates and signage on site
Monthly community clean-ups
Planting of spring bulbs by primary school
Led walk as part of Walking Festival
Lantern walk in November
Project film and submitted to Walk 21 conference in Vancouver
YHDO07A. Edlington Royal TARA
Start: 25/02/10 End: Nov ‟11.
Small area of grass land which is a route from housing to local shops and services.
Excessive litter
Area is unlit
01/04/10 Lighting upgrade/improvements Planting and litter picking day
Lantern walk x 2. Both walks were attended by 50+ people.
YHDO08A. Hexthorpe NDC Streets
Start: 03/11/09 End: ND
Residential housing area with leads to local shops, services and business area
Vandalism
Untidy bits of land and features due to lack of ownership
Apathy from (some) residents
Not done ND Removal of unwanted, badly damaged planters
Repair and planting in kept planters
YHDO09A. Hexthorpe School
Start: 16/10/09 End: ND
The park opposite the school.
Not done ND Spring and winter planting session with school
Developed a walking group for parents
Community Street Audit with the kids to look at crossing issues at Urban Road
Led walks and Walk To School Week
YHDO10A Armthorpe 'CALM' TARA
Start: 01/05/10 End: Dec ‟11.
Routes to community centre in the middle of the estate
Apathy of local residents 09/06/10 New section of path has been installed (Jan 2011)
Notice board installed (Mar 2011)
Winter and spring bulb planting sessions (Oct/Nov 2010)
Led walks in March 2011 and July 2011
Planting session with kids – Nov ‟11.
Neighbourhood award presented Dec 7th 2011.
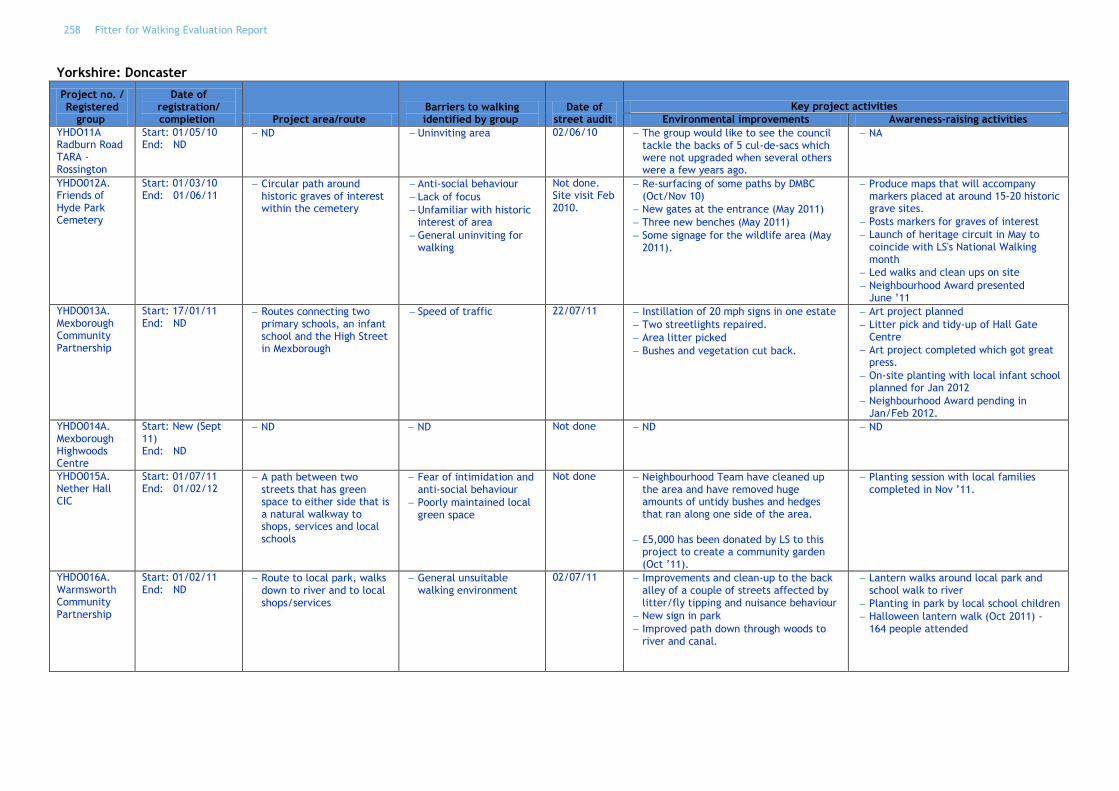
258 Fitter for Walking Evaluation Report
Yorkshire: Doncaster
Project no. / Registered
group
Date of registration/ completion Project area/route
Barriers to walking identified by group
Date of street audit
Key project activities
Environmental improvements Awareness-raising activities
YHDO11A Radburn Road TARA - Rossington
Start: 01/05/10 End: ND
ND Uninviting area 02/06/10 The group would like to see the council tackle the backs of 5 cul-de-sacs which were not upgraded when several others were a few years ago.
NA
YHDO012A. Friends of Hyde Park Cemetery
Start: 01/03/10 End: 01/06/11
Circular path around historic graves of interest within the cemetery
Anti-social behaviour
Lack of focus
Unfamiliar with historic interest of area
General uninviting for walking
Not done. Site visit Feb 2010.
Re-surfacing of some paths by DMBC (Oct/Nov 10)
New gates at the entrance (May 2011)
Three new benches (May 2011)
Some signage for the wildlife area (May 2011).
Produce maps that will accompany markers placed at around 15-20 historic grave sites.
Posts markers for graves of interest
Launch of heritage circuit in May to coincide with LS's National Walking month
Led walks and clean ups on site
Neighbourhood Award presented June ‟11
YHDO013A. Mexborough Community Partnership
Start: 17/01/11 End: ND
Routes connecting two primary schools, an infant school and the High Street in Mexborough
Speed of traffic 22/07/11 Instillation of 20 mph signs in one estate
Two streetlights repaired.
Area litter picked
Bushes and vegetation cut back.
Art project planned
Litter pick and tidy-up of Hall Gate Centre
Art project completed which got great press.
On-site planting with local infant school planned for Jan 2012
Neighbourhood Award pending in Jan/Feb 2012.
YHDO014A. Mexborough Highwoods Centre
Start: New (Sept 11) End: ND
ND ND Not done ND ND
YHDO015A. Nether Hall CIC
Start: 01/07/11 End: 01/02/12
A path between two streets that has green space to either side that is a natural walkway to shops, services and local schools
Fear of intimidation and anti-social behaviour
Poorly maintained local green space
Not done Neighbourhood Team have cleaned up the area and have removed huge amounts of untidy bushes and hedges that ran along one side of the area.
£5,000 has been donated by LS to this project to create a community garden (Oct ‟11).
Planting session with local families completed in Nov ‟11.
YHDO016A. Warmsworth Community Partnership
Start: 01/02/11 End: ND
Route to local park, walks down to river and to local shops/services
General unsuitable walking environment
02/07/11 Improvements and clean-up to the back alley of a couple of streets affected by litter/fly tipping and nuisance behaviour
New sign in park
Improved path down through woods to river and canal.
Lantern walks around local park and school walk to river
Planting in park by local school children
Halloween lantern walk (Oct 2011) - 164 people attended
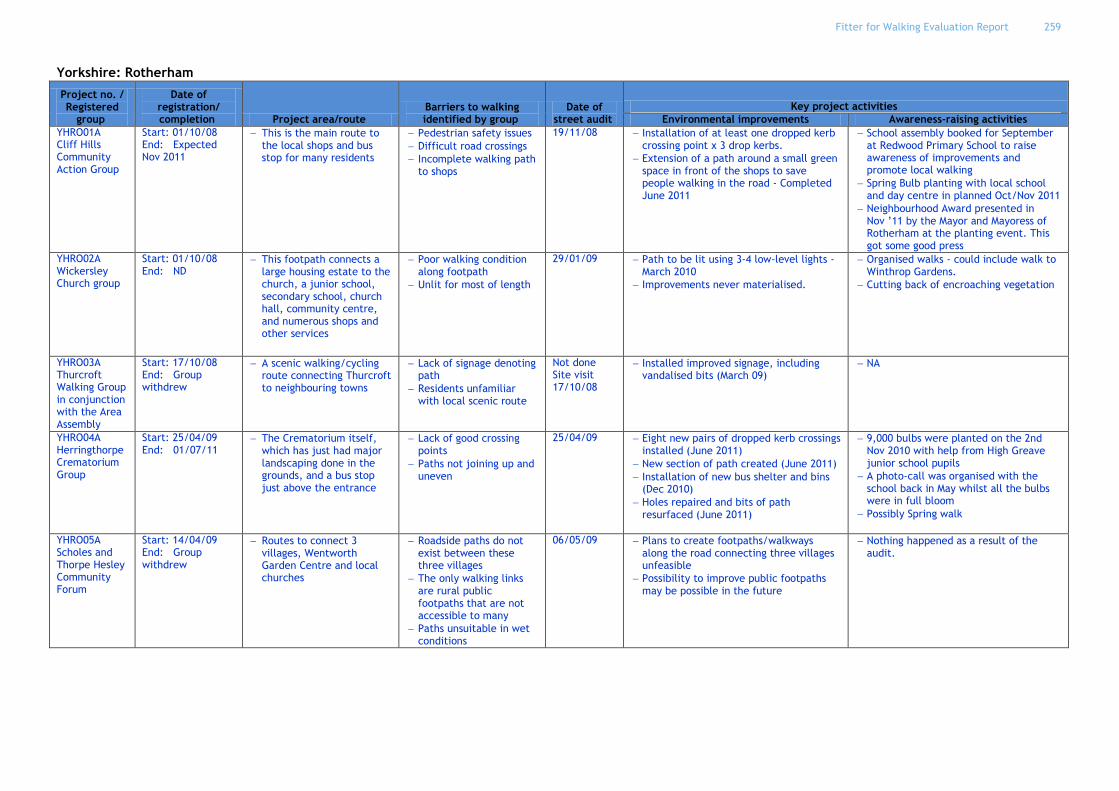
Fitter for Walking Evaluation Report 259
Yorkshire: Rotherham
Project no. / Registered
group
Date of registration/ completion Project area/route
Barriers to walking identified by group
Date of street audit
Key project activities
Environmental improvements Awareness-raising activities
YHRO01A Cliff Hills Community Action Group
Start: 01/10/08 End: Expected Nov 2011
This is the main route to the local shops and bus stop for many residents
Pedestrian safety issues
Difficult road crossings
Incomplete walking path to shops
19/11/08 Installation of at least one dropped kerb crossing point x 3 drop kerbs.
Extension of a path around a small green space in front of the shops to save people walking in the road - Completed June 2011
School assembly booked for September at Redwood Primary School to raise awareness of improvements and promote local walking
Spring Bulb planting with local school and day centre in planned Oct/Nov 2011
Neighbourhood Award presented in Nov ‟11 by the Mayor and Mayoress of Rotherham at the planting event. This got some good press
YHRO02A Wickersley Church group
Start: 01/10/08 End: ND
This footpath connects a large housing estate to the church, a junior school, secondary school, church hall, community centre, and numerous shops and other services
Poor walking condition along footpath
Unlit for most of length
29/01/09 Path to be lit using 3-4 low-level lights - March 2010
Improvements never materialised.
Organised walks - could include walk to Winthrop Gardens.
Cutting back of encroaching vegetation
YHRO03A Thurcroft Walking Group in conjunction with the Area Assembly
Start: 17/10/08 End: Group withdrew
A scenic walking/cycling route connecting Thurcroft to neighbouring towns
Lack of signage denoting path
Residents unfamiliar with local scenic route
Not done Site visit 17/10/08
Installed improved signage, including vandalised bits (March 09)
NA
YHRO04A Herringthorpe Crematorium Group
Start: 25/04/09 End: 01/07/11
The Crematorium itself, which has just had major landscaping done in the grounds, and a bus stop just above the entrance
Lack of good crossing points
Paths not joining up and uneven
25/04/09 Eight new pairs of dropped kerb crossings installed (June 2011)
New section of path created (June 2011)
Installation of new bus shelter and bins (Dec 2010)
Holes repaired and bits of path resurfaced (June 2011)
9,000 bulbs were planted on the 2nd Nov 2010 with help from High Greave junior school pupils
A photo-call was organised with the school back in May whilst all the bulbs were in full bloom
Possibly Spring walk
YHRO05A Scholes and Thorpe Hesley Community Forum
Start: 14/04/09 End: Group withdrew
Routes to connect 3 villages, Wentworth Garden Centre and local churches
Roadside paths do not exist between these three villages
The only walking links are rural public footpaths that are not accessible to many
Paths unsuitable in wet conditions
06/05/09 Plans to create footpaths/walkways along the road connecting three villages unfeasible
Possibility to improve public footpaths may be possible in the future
Nothing happened as a result of the audit.
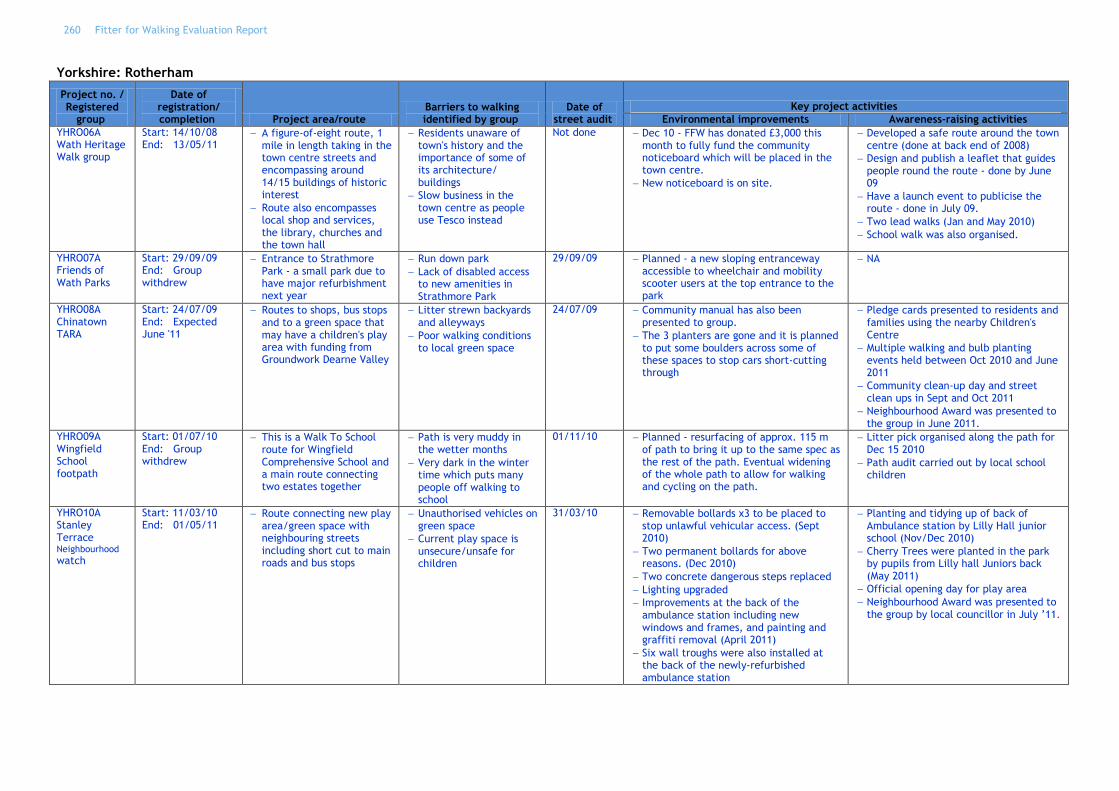
260 Fitter for Walking Evaluation Report
Yorkshire: Rotherham
Project no. / Registered
group
Date of registration/ completion Project area/route
Barriers to walking identified by group
Date of street audit
Key project activities
Environmental improvements Awareness-raising activities
YHRO06A Wath Heritage Walk group
Start: 14/10/08 End: 13/05/11
A figure-of-eight route, 1 mile in length taking in the town centre streets and encompassing around 14/15 buildings of historic interest
Route also encompasses local shop and services, the library, churches and the town hall
Residents unaware of town's history and the importance of some of its architecture/ buildings
Slow business in the town centre as people use Tesco instead
Not done Dec 10 - FFW has donated £3,000 this month to fully fund the community noticeboard which will be placed in the town centre.
New noticeboard is on site.
Developed a safe route around the town centre (done at back end of 2008)
Design and publish a leaflet that guides people round the route - done by June 09
Have a launch event to publicise the route - done in July 09.
Two lead walks (Jan and May 2010)
School walk was also organised.
YHRO07A Friends of Wath Parks
Start: 29/09/09 End: Group withdrew
Entrance to Strathmore Park - a small park due to have major refurbishment next year
Run down park
Lack of disabled access to new amenities in Strathmore Park
29/09/09 Planned - a new sloping entranceway accessible to wheelchair and mobility scooter users at the top entrance to the park
NA
YHRO08A Chinatown TARA
Start: 24/07/09 End: Expected June '11
Routes to shops, bus stops and to a green space that may have a children's play area with funding from Groundwork Dearne Valley
Litter strewn backyards and alleyways
Poor walking conditions to local green space
24/07/09 Community manual has also been presented to group.
The 3 planters are gone and it is planned to put some boulders across some of these spaces to stop cars short-cutting through
Pledge cards presented to residents and families using the nearby Children's Centre
Multiple walking and bulb planting events held between Oct 2010 and June 2011
Community clean-up day and street clean ups in Sept and Oct 2011
Neighbourhood Award was presented to the group in June 2011.
YHRO09A Wingfield School footpath
Start: 01/07/10 End: Group withdrew
This is a Walk To School route for Wingfield Comprehensive School and a main route connecting two estates together
Path is very muddy in the wetter months
Very dark in the winter time which puts many people off walking to school
01/11/10 Planned - resurfacing of approx. 115 m of path to bring it up to the same spec as the rest of the path. Eventual widening of the whole path to allow for walking and cycling on the path.
Litter pick organised along the path for Dec 15 2010
Path audit carried out by local school children
YHRO10A Stanley Terrace Neighbourhood
watch
Start: 11/03/10 End: 01/05/11
Route connecting new play area/green space with neighbouring streets including short cut to main roads and bus stops
Unauthorised vehicles on green space
Current play space is unsecure/unsafe for children
31/03/10 Removable bollards x3 to be placed to stop unlawful vehicular access. (Sept 2010)
Two permanent bollards for above reasons. (Dec 2010)
Two concrete dangerous steps replaced
Lighting upgraded
Improvements at the back of the ambulance station including new windows and frames, and painting and graffiti removal (April 2011)
Six wall troughs were also installed at the back of the newly-refurbished ambulance station
Planting and tidying up of back of Ambulance station by Lilly Hall junior school (Nov/Dec 2010)
Cherry Trees were planted in the park by pupils from Lilly hall Juniors back (May 2011)
Official opening day for play area
Neighbourhood Award was presented to the group by local councillor in July ‟11.

Fitter for Walking Evaluation Report 261
Yorkshire: Rotherham
Project no. / Registered
group
Date of registration/ completion Project area/route
Barriers to walking identified by group
Date of street audit
Key project activities
Environmental improvements Awareness-raising activities
YHRO11A Flanderwell Art Project
Start: 01/02/11 End: ND
Route to connect shops and primary school
Disenfranchised youth in area
Estate unkempt and an eyesore
Not done Old tarmac has been removed ready for timber raised beds to be installed. This will be done and planted up in Jan-Feb 2012.
Art Wall completed April 2011
Art project on bare wall (to involve the local school) that was once a bin store (April 2011)
Some raised bed planting underneath (to involve the local TARA)
YHRO012A Rother Valley South Area Housing Panel
Start: 01/02/11 End: ND
Route to scout hut off main road in Dinnington
Lack of involvement in community spaces
Not done New lighting has been installed around the Scout Hut which is used by many community groups.
ND
YHRO013A Harthill Walks/Maps
Start: 01/02/11 End: ND
The route incorporates three lakes linked by footpaths on the edge of the village
Harthill residents unaware of walking opportunities and resources close by
Not done Improvements such as a picnic area and pond-dipping platform are planned for 2012.
Seven maps are planned as part of a series of local walks
A lantern walk is planned for later in the year involving local families walking around the largest lake

262 Fitter for Walking Evaluation Report
APPENDIX B Data Collection Tools

Fitter for Walking Evaluation Report 263
APPENDIX B.1
Local Authority Interview Sample Protocol Schedule

264 Fitter for Walking Evaluation Report
A. BACKGROUND and CONTEXT
1. Can you briefly outline your role in the Fitter for Walking project and when you became involved in the project?
2. How does this role fit with your activities in your normal daily work?
3. Do you know why the Local Authority decided to get involved in the FFW project – were there any particular drivers?
4. Which department/section within the LA is the FFW project based? Is that the right place for it? Is it linked to other departments/sections? Should it be?
5. Have there been any internal agendas or pressures which may have affected the project?
6. Have there been any external agendas or pressures which may have affected the project?
B. PROJECT PURPOSE AND GOALS
1. What do you think the main purpose of the Fitter for Walking project is?
2. Are there any specific local agendas, policies or issues that you are aware of which the Fitter for Walking project is addressing or might contribute to? How do you think the FFW project does this?
C. LEADERSHIP
1. Overall, who do you think is leading or driving the Fitter for Walking project forward?
2. Do you think this is where the leadership should come from? If no, who should be leading

Fitter for Walking Evaluation Report 265
D. ROLES AND RESPONSIBILITIES
Role of the Local Authority
1. What do you see as the main roles for the local authority in the project?
- Can you tell me a bit more about the process of receiving and acting on street audit reports?
- How do you decide which projects/parts of projects to fund – any criteria? Priority areas?
- What happens to audit reports? Who reviews? Agrees?
- Once proceeding, what happens then?
- What are the challenges of acting on audit reports – how long does it take?
- What might cause delays in action being taken?
Receiving street audit report / acting on audit reports
Member of project board
2. What have been the main challenges for the local authority in completing this role?
How have these been overcome?
3. What have been the main successes for the local authority?
Role of the project board
1. What is the role of the project board?
2. How often do you meet? Is this often enough?
Role of the project co-ordinator
1. How do you see Living Streets project co-ordinator‟s role in the project?
2. How important has it been to have a project co-ordinator from Living Streets?
3. Would this type of work happen without Living Streets support / co-ordinator?
Role of the registered groups
1. How do you see the role of the registered groups in this project?
2. Do you think it is important to engage with community groups to undertake this type of
work? Is their involvement needed for success?
If yes – why?
If no - why not?
Other groups
1. Was anyone else involved? Should anyone else be involved in this work? If yes, who?

266 Fitter for Walking Evaluation Report
E. COMMUNICATION
1. How easy has it been to find out about the project and what‟s been going on?
2. Overall, do you think there has there been sufficient communication with the local authority from Living Streets?
Websites / newsletter, e-mail bulletins, timetables, poster boards
3. What are the best ways for communicating information about the projects to the Local Authorities? What might have been a better way?
Well advertised / publicised?
Provision of up to date information
4. Has the local authority had direct communication with community groups / residents about this project? If yes – can you tell me more about this?
5. Who else is it important for you/the Local Authority to communicate with about this project?
F. PROJECT IMPLEMENTATION
1. Do you have any other comments on how the project has been implemented?
e.g. recruitment of community groups; identifying a focus for each group; completing the audit report; delivering initiatives; completing infrastructural changes; working with the local authority;
2. What has worked well? What hasn‟t worked so well?
3. What do you think could be done differently?
4. How could the project be improved?
5. If the project were to be run in other areas, what advice would you give to other local authorities who might be interested in being involved in the project?

Fitter for Walking Evaluation Report 267
G. IMPACT OF THE PROJECT
1. What impact do you think the FFW project activities and improvements have had so far on local communities/ the local area?
Increase walking? Health? Reduction in car use? Empowered communities?
2. Do you think there have been any negative effects of the Fitter for Walking project?
3. Have there been any unexpected effects of the project?
H. SUSTAINABILITY/FUTURE OF FFW
1. Do you think the changes and improvements that have been made as part of the project will be sustainable?
2. What do you think will be needed to ensure this happens?
3. Who do you think should take responsibility for sustaining the impact of the project?
4. What might the local authorities‟ role be in sustaining the impact of the project?
5. Do you think Living Streets / a co-ordinator is needed to ensure the projects are sustainable?
6. Do you think Living Streets / a co-ordinator have a role in the future for working with local communities in this way?
If no, who might do it, or why is it not needed?
H. ADDITIONAL COMMENTS
1. Do you have anything other comments you would like to add about Fitter for Walking, or do you have any questions for me?
THANK YOU FOR YOUR TIME
268 Fitter for Walking Evaluation Report
APPENDIX B.2
Community Focus Group Sample Protocol Schedule

Fitter for Walking Evaluation Report 269
A. BACKGROUND and CONTEXT
1. Can you tell me about the [registered group]?
Who you are, how were you set up, how often you meet
and what you do/what your priorities are?
2. Can you tell me a bit more about local area, in particular the walking routes and the area of
interest for the Fitter for Walking project?
Who uses it? How do people use it?
Where does it go to?
How important is the area in the local community?
B. PROJECT PURPOSE AND GOALS
1. What do you think the main purpose of the Fitter for Walking project is?
2. How did you find out about/get involved with the Fitter for Walking project?
3. What were the main reasons you wanted to get involved in the Fitter for Walking project? / What
are the main barriers to walking in your community?
4. How do you think the FFW project has or might address these issues/barriers?
C. PROJECT ACTIVITIES
1. Did you take part in a street audit? Where did you do the street audit?
What did you think of doing the street audit? Likes/dislikes about street audit?
Any changes made as a result of street audit?
2. What activities have taken place / what changes have been made as part of the Fitter for
Walking project? How well attended were project activities?
3. Is there anything else that you think should have been done? If yes, what?
4. What could have been done differently?
5. What has been good about the FFW project / improvements to the walking routes in your
community?
6. What problems or challenges have there been with the FFW project?

270 Fitter for Walking Evaluation Report
D. ROLES AND RESPONSIBILITIES
Leadership
1. Overall, who do you think has led or driven the Fitter for Walking activities forward?
Role of the registered group
2. What has the group‟s role been in the project?
3. How important has it been for you to be involved in this project?
4. Has the project involved members of the group in planning and implementation of the
programme events and activities?
If yes – why?
If no - why not?
Role of the community
5. Did other members of the community / local residents get involved in the project?
How did they get involved?
What were the challenges in engaging other members of the community?
How might these be overcome?
- if yes, how
- if no, why not? What were the challenges?
How might these be overcome?
6. How important has it been to get members of the community involved?
Role of the project co-ordinator
7. How do you see the project co-ordinator‟s role in the project?
8. How important has it been to have a project co-ordinator from Living Streets?
Role of the Local Authority
9. Has the local authority been involved in the project? How? - if yes, how
- if no, why not?
10. How important has it been to have the LA involved?
Other groups
11. Was anyone else involved? Should anyone else have been involved in this work? - if yes, who?

Fitter for Walking Evaluation Report 271
E. COMMUNICATION
1. How easy has it been to find out about the project and what‟s been going on? How has this been
communicated?
Websites / newsletter, e-mail bulletins, timetables,
poster boards
2. Overall, has there been sufficient communication/notices/promotion of the events and
activities?
Well advertised / publicised?
Provision of up to date information
3. What have been best ways for communicating information about the events and activities? What
might have been a better way?
4. How was information about the project / activities communicated to the local community?
F. IMPACT OF THE PROJECT
1. To what extent do you think local residents have walked more along the route as a result of FFW? - increased walking / cycling
- improved health
2. What impact has the Fitter for Walking project had more generally?
Changed the community in anyway?
3. Have there been any negative effects of the Fitter for Walking project?
4. Has anything unexpected happened as a result of the project activities?
6. How important is the Fitter for Walking Award for your group / the community?
7. Overall, has the Fitter for Walking project met your expectations?
G. LESSONS LEARNT
1. What are the key things you have learnt about this type of project?
2. What advice would you give to another group starting this type of project?

272 Fitter for Walking Evaluation Report
H. SUSTAINABILITY
1. Do you think your group / or the community have developed any ownership of the project
activities/walking routes?
2. Do you think the changes and improvements that have been made to the will be maintained in the
foreseeable future?
3. What do you think will be needed to ensure this happens?
4. Who do you think should take responsibility for maintaining the walking routes in the area?
5. What will your group‟s role / level of interest be in maintaining the walking routes in the area?
I. ADDITIONAL COMMENTS
1. Do you have anything other comments you would like to add about Fitter for Walking or do you
have any questions for me?
THANK YOU FOR YOUR TIME

Fitter for Walking Evaluation Report 273
APPENDIX B.3
Project Co-ordinator Focus Group/Interview Schedule Sample
Protocol Schedule

274 Fitter for Walking Evaluation Report
A. PROJECT CO-ORDINATOR ROLE
1. How would you describe your main role and responsibilities in the project?
2. What are the key skills, knowledge and attributes that you think you need to be a FFW co-ordinator and why? [personal skills or knowledge of area]
3. Is working for Living Streets an important factor within your role?
B. DELIVERY PARTNERS
Local Authority
1. What type of people are your key contacts in the local authorities? [planners, transport etc.]
2. What strategies have you used to engage them in the project? How successful have these been? What were the challenges of engaging the LA?
3. What are the challenges of with working local authorities?
4. What challenges might they face?
5. How have you sustained your relationship with the LA? / their involvement in the project?
Examples of other partners involved in delivery e.g. PCTs, Residents’ groups, Neighbourhood Managers
6. Who else do you need to engage with for this project?
7. What is their role? How important are they?
8. What strategies have you used to engage them in the project?
9. How successful have they been?
10. What are the challenges of with working with these groups?
11. What challenges might they face in undertaking this role?
C. LEADERSHIP
12. Where do you think the direction and leadership for this project is coming from?
13. Where do you think it should come from?

Fitter for Walking Evaluation Report 275
D. IMPLEMENTATION ACTIVITIES
PROMOTION & RECRUITMENT
1. What have been the main challenges in recruiting groups to the project?
2. Do you think the method of recruitment has an impact on how successful the project is?
What are the key drivers for engaging groups in the project?
COMMUNITY ENGAGEMENT
3. What have been the challenges so far in engaging communities?
4. Are there any groups that are particularly easy or difficult to work with?
5. How much of a role are the communities taking on in programme planning and implementation?
6. What evidence have you seen of changes in community cohesion/capacity building? Examples?
What is your role in engaging the community / local residents?
PROJECT ACTIVITIES
7. What are the main factors which influence what activities happen within a project?
8. What are the most important factors in determining whether any larger infrastructural changes are made and what?
9. What do you think are the easiest types of activity to deliver?
10. Which are the hardest?
11. Which have been most successful in terms of engaging communities?
RESOURCES – Pledge cards
Which have been the most successful initiatives in terms of engaging the community
FITTER FOR WALKING AWARD
12. How important do you think the award is in this project?
13. Would groups register without having the standard to work towards?
DURATION OF INVOLVEMENT / Sustainability
14. What brings your involvement to an end?
15. Do you have an “exit strategy”?
16. Do you think the projects will have sustainable impacts?
17. How might the impact of the projects be sustained once your involvement ends? Any evidence of this?

276 Fitter for Walking Evaluation Report
E. PROJECT CO-ORDINATOR EXPERIENCES (10 minutes)
1. How would you define success for the project?
2. What would you consider to be some indicators of this?
3. What do you think might affect how successful the project is?
4. Have there been any unexpected consequences either positive or negative?
Increase awareness of walking
Increase walking
Improve the environment
Improve health and well-being
Promote community cohesion
5. What are the main challenges you have faced so far in implementing the project?
6. What are the key things you have learnt from this project so far?
7. If you repeated the project, what would you do differently in the project and why?
8. What advice would you give to a new project co-ordinator trying to set up a new FFW project?
9. What do you hope to achieve for the remainder of the project?
F. ANY OTHER COMMENTS (5 minutes)
1. Do you have anything other comments you would like to add about the project or do you have any questions for me?
THANK YOU FOR YOUR TIME

Fitter for Walking Evaluation Report 277
APPENDIX B.4
Route User Count Sample Survey Sheet

278 Fitter for Walking Evaluation Report
FITTER FOR WALKING ROUTE USER COUNT
Survey site number N.B. USE A NEW SHEET FOR EACH HALF HOUR
Date / /
Day type (select one choice only) Weekday Weekend Bank holiday
DD MM YY
Location Weather type (select one choice only) Hot & mostly dry Warm & mostly dry Cold & mostly dry
Damp/overcast Warm & mostly wet Cold & mostly wet Heavy rain
Day Surveyor Half hour started (24hr):
: Remember to fill in the totals boxes at the end of each period. If there is nothing to record just leave them blank, please do not cross, draw lines or insert 0 into the boxes.
Towards:
A Child Adult (16-59 years) Elderly (60+) (0-15 years) Male Female Male Female
Cycles
Pedestrians
Wheelchairs Horse Riders Joggers
Pushchairs
Notes / Others
Towards:
B Child Adult (16-59 years) Elderly (60+) (0-15 years) Male Female Male Female
Cycles
Pedestrians
Wheelchairs Horse Riders Joggers
Pushchairs
Notes / Others
*Adapted from Sustrans Route User Count Survey

Fitter for Walking Evaluation Report 279
APPENDIX B.5
Route User Survey Sample Survey

280 Fitter for Walking Evaluation Report FITTER FOR WALKING ROUTE USER SURVEY
Survey site number - Interview number
Location
Date / /
DD MM YY
Time interview started :
Interviewer initials
Day type? (tick one only)
Weekday……. Weekend…….. Bank holiday.. School holiday or term time? (tick one only)
School Holidays……..…. Term Time…..……. Q1 Activity undertaken? (tick one only)
Walking…………… Wheelchair Use…….. Cycling……………. Roller Skating………. Running/jogging…. Horse Riding………... Dog Walking……… Other…………………
Q2 If you are in a group, how many of you are
there? (please write in)
Adults…………………..
Children………………...
ABOUT YOUR CURRENT JOURNEY Q3 What is the purpose of your current journey? Tick One
From Tick One
To
Home…………………………….. Home-Recreation……………..... Work………………………………
In course of work……………….. Education (school/college etc)…
Shopping………………………… Personal business……………… Visiting friends/family……………
Recreation Sports / leisure facilities………...
Social / entertainment………….. Holiday base…………………..... Escort to school………………….
Other escort……………………... Other……………………………...
Q4 Where did you start your journey today? Postcode, location or street name
Q5 Where will you finish your journey today? Postcode, location or street name
Q6 If you are travelling to a particular destination on your journey please state:
Q7 Approximately how long do you estimate your journey on foot/by bike will take today? (write in)
Hours……………........
Minutes……………….
Q8 Approximately how far do you estimate you will travel today on foot/by bike? (write in)
Miles…………...…......
Kilometres….………

Fitter for Walking Evaluation Report 281
FITTER FOR WALKING ROUTE USER SURVEY
Q9 Did you or will you use any other mode of transport for part of this journey today? (select one choice only – main type)
Car / van…………... Taxi…………………. Train……………….. Jogging…………….. Bus……………….... Horse riding……….. JUST cycle or walk
Q10 How often do you make this journey? (select one choice only)
Daily…….………… Monthly…………….. 2-5 times per week Yearly………………. Weekly…………… Less frequently……. Fortnightly…………
Other:
Q11 To what extent have the following factors influenced your decision to walk, cycle or use a wheelchair today? (Tick one box on each row)
Strongly Agree Agree Neutral Disagre
e Strongly Disagree
I can go straight to my destination
It’s the best transport option
This the most convenient route
I save money by using this route
I like the surroundings on this route
This route feels safe
This is the only exercise I get
This adds to the exercise I get from other parts of my life
I have environmental concerns
ABOUT WALKING FOR TRAVEL
Q12 In the past week, on how many days have you
walked to travel from place to place?
0 1 2 3 4 5 6 7 Days
Q13 How much time IN TOTAL have you spent walking to travel from place to place in the past week?
Hours……………......
Minutes……………...
Q14 What type of journeys do you usually walk for? (Tick all that apply)
Journey to/from work Journey to school/college Employer’s business Shopping Leisure (e.g. to sports facilities) To visit friends/family For personal business (e.g. doctors, bank etc)
Q15 To what extent do you agree or disagree with the following statements? (Tick one box on each row).
Strongly Agree Agree Neutral Disagree Strongly
Disagree I intend to walk more in the next 12 months
It is likely that I will walk more in the next 12 months

282 Fitter for Walking Evaluation Report
FITTER FOR WALKING ROUTE USER COUNT
ABOUT THE ROUTE/AREA Q16 In the past week, on how many days have
you used this route?
0 1 2 3 4 5 6 7 Days
Q17 How often do you use this route in the….….
(select one choice in each column only)
DAY time
NIGHT time
More than once a day…………… Daily………………………………… Several times per week…………… Once a week ……………………… Once or twice per month………… Less frequently……………………
Q17a In the last 12 months have you used this route
more, about the same or less than before:
More About the same Less
Q18 How safe do you think this route through the subway is in terms of the following? (Tick one box on each row).
Very safe
Fairly safe
Fairly unsafe
Very unsafe
Don’t know
Surface quality
Exposure to traffic Exposure to other people
Q19 Are you aware of any improvements that
have been made on this route/area recently? DO NOT PROMPT THE RESPONDENT (Tick all that apply)
Clearance of rubbish / glass…………………… Clearance of dog mess………………………… Clearance of graffiti………………………… Clearer information / signage………………… Improved lighting……………………………… Resurfacing of path…………………………… Wider path or pavement………………………… Removal of overgrown hedges………………… Improved crossings…………………………… Dropped kerbs installed………………………… Traffic calming: speed humps/cushions…….… 20 miles per hour speed limit………………… Planting of new bulbs…………………………… Other (write in)
Q20 What improvements to this route/area would
encourage you to use it more often? DO NOT PROMPT THE RESPONDENT (Tick all that apply)
Clearance of rubbish / glass……………………….. Clearance of dog mess…………………………….. Clearance of graffiti…………………………………. Clearer information / signage………………………. Improved lighting……………………………………. Wider path or pavement……………………………. Removal of overgrown hedges……………………. Improved crossings…………………………………. Dropped kerbs installed…………………………….. Traffic calming: speed humps/cushions…….…….. 20 miles per hour speed limit………………………. Planting of new bulbs……………………………….. Other (write in)
Q21 Have you heard of either of the following?
(Tick one box on each line)
Yes No Living Streets………………………………… The Fitter for Walking project……………….
ABOUT WHERE YOU LIVE
Q22 To what extent do you agree or disagree with
the following statements about your neighbourhood? (Tick one box on each row).
Strongly Agree Agree Neutral Disagree Strongly
Disagree There is a sense of community People are willing to help each other People get along with each other People share the same values People are willing to work together to improve the local area
Q23 Are you a member of a local
resident or community action group? (Tick one box)
Yes No
If yes, please specify below:

Fitter for Walking Evaluation Report 283
FITTER FOR WALKING ROUTE USER SURVEY
ABOUT YOU Q24 Are you?
Male…………… Female………….
Q25 Which age group do you fit into? (select one choice only)
16-24………… 45-54………… 25-34………… 55-64………… 35-44………… 65+……………
Q26 Which of the following best describes your
working status? (select one choice only)
Employed full-time (30+ hours)……………….. Employed part-time…………………………….. Looking after home/family……………………... Unemployed/sick leave………………………… Retired…………………………………………… Studying…………………………………………. Voluntary worker……………………………….. Other (write in)
Q27 Which of the following groups do you
consider you belong to? (select one choice only)
White………………… Caribbean………….. Mixed………………... African……………… Indian……………….. Other Black………… Pakistani……………. Chinese…………….. Bangladeshi………… Other ethnic group… Other Asian………… Prefer not to say……
Q28 Overall, how would you rate your general
health over the last four weeks? (select one choice only)
Excellent………….. Fair……………
Very good………… Poor…………….
Good……………… Very poor………
Q29 In the past week, on how many days completed 30 minutes or more physical activity that was enough to raise your breathing rate? (This may include sport, exercise and brisk walking or cycling for recreation)
0 1 2 3 4 5 6 7 Days
Q30 What is your postcode?
If not UK, write in country…….
I hereby consent to the information provided on this questionnaire to be processed by Loughborough University for the purpose of evaluating the impact of their projects. I agree with this statement……………………. A sample of these surveys will be followed up as part of our quality control procedures and so we would be grateful if you could ask for the respondents name, e-mail address and house number. It is also possible that we may need this information if we are to do a household survey. Please inform the respondent that this information will not be used for any other purpose or given to anyone else. If the respondent is happy to give this information but does not wish to be followed up, please put a cross in the “DO NOT CONTACT” box. Name
E-mail address
House number…………………………..
Do not contact…………………………………..
- End of Survey –
*Adapted from Sustrans Route User Survey

284 Fitter for Walking Evaluation Report
APPENDIX B.6
Residents’ Survey Sample Survey

Neighbourhood Travel Survey
Dear Resident
Tell us what you think about your neighbourhood and win a £10 gift voucher!
We’d like to invite a member of your household who is over 16 years of age to take part in a short survey about where you live and how you travel around your local area. This survey is part of a national project that is taking part in five areas of England. Your answers will help us to understand how changes to your neighbourhood can improve local travel options.
Taking part is easy and will only take 10 minutes of your time.
Just fill in the consent form (located on the back of this letter) and the survey and return them using the freepost envelope provided. You will then be entered into a prize draw to win a £10 gift voucher. Please complete and return this survey by Friday 7th October 2011.
If you’d prefer to complete the survey on-line, please use the link below to access the survey on your computer: www.surveymonkey.com/s/NTS2011MarksGate
How to complete the questionnaire
Please use a black or blue pen to complete the questionnaire.
No question is compulsory. However, to make our study a success, we need you to answer as many
questions as you can. Remember, there are no right or wrong answers.
Some questions ask you to tick a box. Please tick the box that applies to you.
Example Are you male or female? Tick one only Male Female
Other questions ask you to write numbers in a box.
Example What is your age? 34 years
Don’t worry if you make a mistake – just cross out the mistake and put in the correct answer.
Example Are you able to walk continuously on level ground for at least 5 minutes? Yes No
YOUR ANSWERS WILL BE TREATED AS STRICTLY
Questions?
You will find further information on the enclosed information sheet if you need it. If you have any questions, we’d be pleased to help you. Just e-mail Emma at [email protected]. Thank you for considering this invitation.
X

CONSENT FORM
Please read the following statements, tick the boxes if you agree with the statements and then sign and print your name below.
I have read and understood the information sheet and this consent form.
I have had an opportunity to ask questions about my participation.
I understand that all the information I provide will be treated in strict confidence.
I agree to participate in this survey.
Please complete this section
Your name
Your signature
Date
PRIZE DRAW
If you would like to be entered into the prize draw please complete the information below:
Address
Town
Postcode
NOTE: This page will be used only for the purposes of obtaining your consent to participate in the project and to contact you if you are a winner in the prize draw. The information will be stored in accordance with Data Protection Act 1998 in a secure location and separately from the remainder of the questionnaire.

SECTION A – ABOUT TRAVEL IN YOUR NEIGHBOURHOOD
These questions ask about travelling in your neighbourhood. By neighbourhood we mean the area within 10-15 minutes from your home.
1. In general, how do you usually travel for a short journey, say less than 2 miles, in your neighbourhood? Tick all that apply
I usually….
Walk Get a taxi
Cycle Get the bus
Drive a car or van (as driver) Get the train
Get a lift in a car or van as a passenger Other (specify): 2. Thinking about the last 18 months……
To what extent do you agree or disagree with the following statements about travelling in your neighbourhood? Tick one box per row
Compared to 18 months ago….. STRONGLY AGREE
SOMEWHAT AGREE
NEITHER AGREE NOR
DISAGREE SOMEWHAT DISAGREE
STRONGLY DISAGREE
a. I have made no changes to the way I travel around my neighbourhood
b. I now walk more often around my neighbourhood
c. I now cycle more often around my neighbourhood
d. I now use the car more often to travel around my neighbourhood
e. I now use the bus more often to travel around my neighbourhood
f. I now use the train more often to travel around my neighbourhood
3. What are the main reasons for changing how you travel around your neighbourhood in the last 18 months? Tick all that apply
I haven’t changed the way I travel (go to Question 4)
Cost of petrol has gone up Bought a new car
Cost of public transport has gone up No longer have a car
Cost of public transport has gone down My knowledge of the area has improved
Change of job I know more people in the area
Change of income It feels safer
Moved house The local environment has improved
Had children To get fitter and healthier
Other (please specify):

SECTION A – ABOUT TRAVEL IN YOUR NEIGHBOURHOOD
4. Thinking about the last 18 months….. To what extent do you agree or disagree with the following statements about walking in your neighbourhood? Tick one box per row
In the last 18 months…. STRONGLY AGREE
SOMEWHAT AGREE
NEITHER AGREE NOR
DISAGREE SOMEWHAT DISAGREE
STRONGLY DISAGREE
a. I have seen more people walking in my neighbourhood
b. I have found new routes for walking
c. I have discovered new places to walk to
d. It now feels safer to walk around my neighbourhood
e. It is now more pleasant to walk around my neighbourhood
5. Thinking about the last 18 months….. To what extent do you agree or disagree with the following statements about your neighbourhood? Tick one box per row
In the last 18 months…. STRONGLY AGREE
SOMEWHAT AGREE
NEITHER AGREE NOR
DISAGREE SOMEWHAT DISAGREE
STRONGLY DISAGREE
a. I have been involved in local community activities to make my neighbourhood a safer and more attractive place to walk
b. Other residents have helped to make my neighbourhood a safer and more attractive place to walk
c. There has been an increased sense of community
d. Residents are more willing to help each other
e. More residents stop to chat to each other in the streets
f. Residents are more willing to work together to look after and improve my neighbourhood
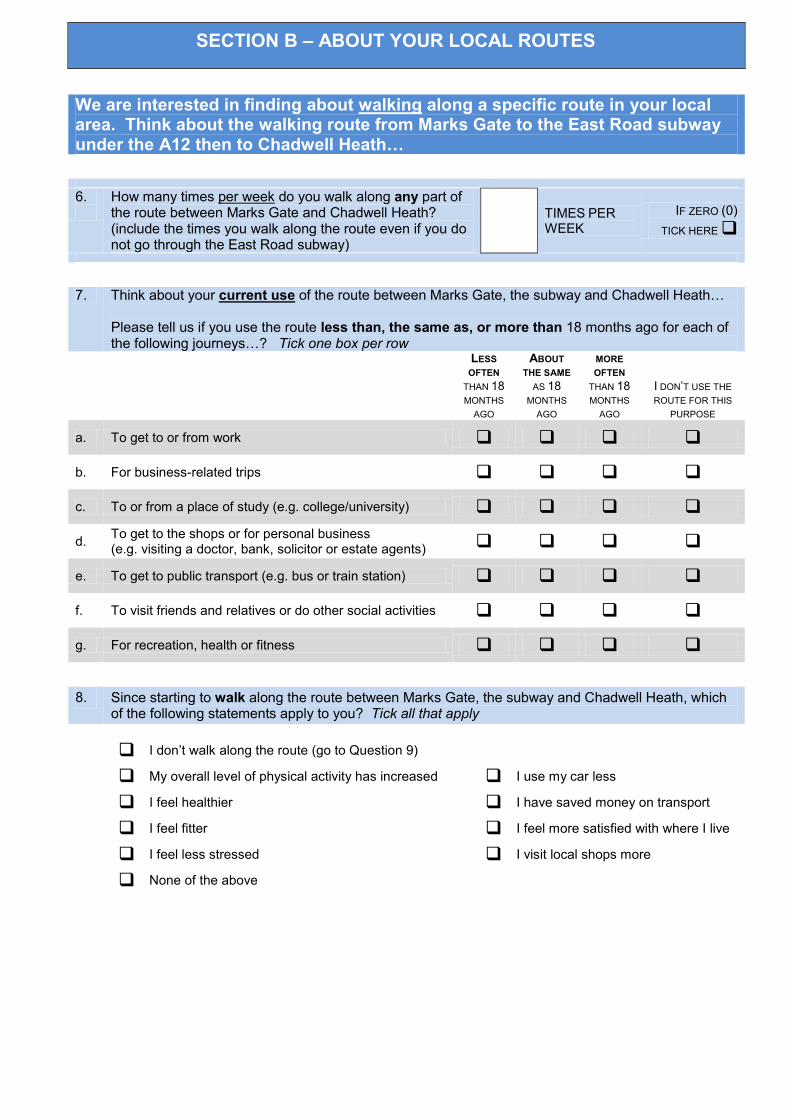
SECTION B – ABOUT YOUR LOCAL ROUTES
We are interested in finding about walking along a specific route in your local area. Think about the walking route from Marks Gate to the East Road subway under the A12 then to Chadwell Heath…
6.
How many times per week do you walk along any part of the route between Marks Gate and Chadwell Heath? (include the times you walk along the route even if you do not go through the East Road subway)
TIMES PER WEEK
IF ZERO (0) TICK HERE
7. Think about your current use of the route between Marks Gate, the subway and Chadwell Heath…
Please tell us if you use the route less than, the same as, or more than 18 months ago for each of the following journeys…? Tick one box per row
LESS OFTEN
THAN 18 MONTHS
AGO
ABOUT THE SAME
AS 18 MONTHS
AGO
MORE OFTEN
THAN 18 MONTHS
AGO
I DON’T USE THE ROUTE FOR THIS
PURPOSE
a. To get to or from work
b. For business-related trips
c. To or from a place of study (e.g. college/university)
d. To get to the shops or for personal business (e.g. visiting a doctor, bank, solicitor or estate agents)
e. To get to public transport (e.g. bus or train station)
f. To visit friends and relatives or do other social activities
g. For recreation, health or fitness
8. Since starting to walk along the route between Marks Gate, the subway and Chadwell Heath, which of the following statements apply to you? Tick all that apply
I don’t walk along the route (go to Question 9)
My overall level of physical activity has increased I use my car less
I feel healthier I have saved money on transport
I feel fitter I feel more satisfied with where I live
I feel less stressed I visit local shops more
None of the above
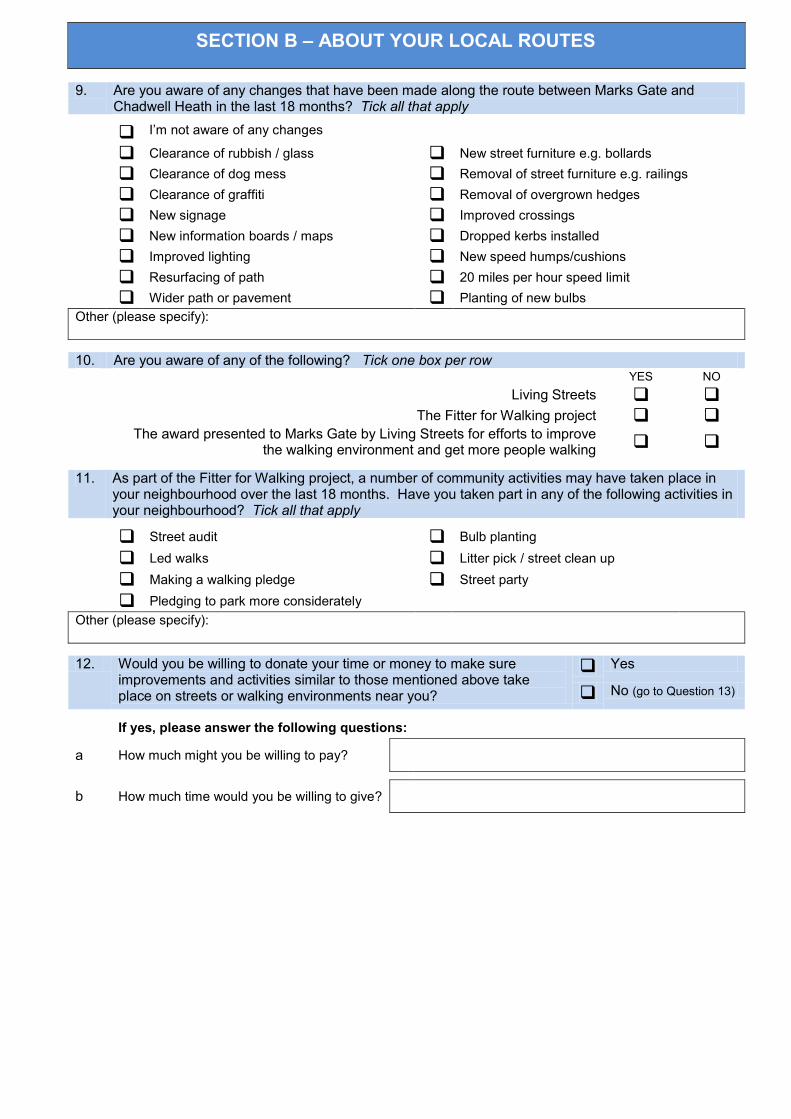
SECTION B – ABOUT YOUR LOCAL ROUTES
9. Are you aware of any changes that have been made along the route between Marks Gate and Chadwell Heath in the last 18 months? Tick all that apply
I’m not aware of any changes Clearance of rubbish / glass New street furniture e.g. bollards Clearance of dog mess Removal of street furniture e.g. railings Clearance of graffiti Removal of overgrown hedges New signage Improved crossings New information boards / maps Dropped kerbs installed Improved lighting New speed humps/cushions Resurfacing of path 20 miles per hour speed limit Wider path or pavement Planting of new bulbs
Other (please specify):
10. Are you aware of any of the following? Tick one box per row YES NO Living Streets The Fitter for Walking project The award presented to Marks Gate by Living Streets for efforts to improve
the walking environment and get more people walking 11. As part of the Fitter for Walking project, a number of community activities may have taken place in
your neighbourhood over the last 18 months. Have you taken part in any of the following activities in your neighbourhood? Tick all that apply
Street audit Bulb planting Led walks Litter pick / street clean up Making a walking pledge Street party Pledging to park more considerately
Other (please specify):
12. Would you be willing to donate your time or money to make sure
improvements and activities similar to those mentioned above take place on streets or walking environments near you?
Yes
No (go to Question 13)
If yes, please answer the following questions: a How much might you be willing to pay?
b How much time would you be willing to give?

SECTION B – ABOUT YOUR LOCAL ROUTES
13. Please add any comments you have about the walking route from Marks Gate to Chadwell Heath, or the Fitter for Walking project.
SECTION C – ABOUT YOUR HEALTH and PHYSICAL ACTIVITY
14. How much do you weigh in light indoor clothes?
stones lbs OR kg
15. How tall are you without shoes on?
feet inches OR cm
16. Would you say that for someone of your age your own health in general is… Tick one only
Excellent Good Fair Poor
17. In the past week, on how many days have you done a total of 30 minutes or more of physical
activity, which was enough to raise your breathing rate?
This may include sport, exercise, and brisk walking or cycling for recreation or to get to and from
places, but should not include housework or physical activity that may be part of your job.
Number of days:
0 1 2 3 4 5 6 7

SECTION D – ABOUT YOU
18. Are you male or female? Tick one only Male Female
19. How old are you? YEARS
20. Which of the following groups do you consider you belong to? Tick one only
White Asian or Asian British
Mixed ethnic group Black or Black British
Other (please specify): 21. What is your highest educational qualification? Tick one only
Degree, NVQ4, NVQ5 or equivalent
BTEC (Higher), BEC (Higher), TEC (Higher), HNC, HND or equivalent
GCE A’ Level, NVQ3, Scottish Higher or equivalent
BTEC (National), BEC (National), TEC (National), ONC, OND or equivalent
GSE Grades A to C, GCSE O’ Level, CSE Grade 1, NV2 or equivalent
Other qualifications
No formal qualifications
22. How many cars or vans are normally available for use by you or any members of your household? Include any provided by employers if normally available for private use by you or other members of your household.
NUMBER OF CARS OR VANS
23. How long have you lived in your current home? YEARS MONTHS
24. What is your postcode? Note: this will only be used for the purposes of looking at walking routes around where you live
25. Please enter the date on which you are completing this survey
DAY MONTH YEAR
/ /
CONGRATULATIONS YOU’VE COMPLETED THE QUESTIONNAIRE - THANK YOU!!
PLEASE RETURN YOUR COMPLETED SURVEY IN THE FREEPOST
ENVELOPE PROVIDED AS SOON AS POSSIBLE

Fitter for Walking Evaluation Report 293

294 Fitter for Walking Evaluation Report