fitzroy wqip supporting studies: key findings, gaps and
TRANSCRIPT

Fitzroy WQIP Supporting Studies:
Key findings, gaps and
recommendations
2015
Prepared by Jane Waterhouse, Nicole Flint and Johanna Johnson for the Fitzroy Basin
Association.

Fitzroy WQIP Supporting Studies:
Key findings, gaps and recommendations
Prepared by Jane Waterhouse1, Nicole Flint2 and Johanna Johnson1
1 Climate Coasts Oceans, C2O Consulting
2 CQUniversity
The information has been drawn from reports led by Megan Star, Jon Brodie, Stephen Lewis,
Johanna Johnson, Jane Waterhouse, Nicole Flint, John Gunn, Colette Thomas, Shane
Westley, Tim Marsden, Roger Jaensch and Ronnie Baker with contributions from many co-
authors.

This report should be cited as:
Waterhouse, J., Flint, N., Johnson, J. 2015. Fitzroy WQIP Supporting Studies: Key findings, gaps and
recommendations. A report to the Fitzroy Basin Association to support the Fitzroy Water Quality
Improvement Plan. November 2015.
Acknowledgements
The authors of this report would like to thank the Fitzroy Basin Association for the project funding,
and to all of the authors of the supporting studies for their valuable contributions to this report.
This report has been compiled from the following studies that were completed to support the
Fitzroy Water Quality Improvement Plan, 2015.
Baker, R. 2015. Ecosystem Repair Prioritisation. Report to the Fitzroy Basin Association for the
Fitzroy Water Quality Improvement Plan, July 2015.
Brodie, J., Lewis, S., Wooldridge, S., Bainbridge, Z., Waterhouse, J., Honchin, C. 2015. Ecologically
relevant targets for pollutant discharge from the drainage basins of the Fitzroy Region, Great Barrier
Reef. Report to Fitzroy Basin Association for the Fitzroy Water Quality Improvement Plan.
Flint, N., Jackson, E., Wilson, S., Verlis, K., Rolfe, J. 2015. Synthesis of water quality influences in ports
of the Fitzroy region, Queensland. A report to the Fitzroy Basin Association for the Fitzroy Water
Quality Improvement Plan. CQUniversity Australia, North Rockhampton, Queensland.
GBRMPA [Great Barrier Reef Marine Park Authority] 2015. Ecological Calculator assessment for the
Fitzroy region. Draft report to the Fitzroy Basin Association.
Gunn, J. 2015. Gladstone Urban Profile for the Fitzroy Basin Water Quality Improvement Plan, Fitzroy
Basin Association, Rockhampton.
Jaensch, R., Westley, S., Smith, P. 2015. A prioritisation of Fitzroy Basin wetlands for NRM
investment. Report to Fitzroy Basin Association.
Johnson, J., Brodie, B., Flint, N. 2015. Status of marine and coastal natural assets in the Fitzroy NRM
region. Report to Fitzroy Basin Association for the Fitzroy Water Quality Improvement Plan.
Lewis, S., Packett, R., Dougall, C., Brodie, J., Bartley, R., Silburn, M. 2015. Fitzroy sediment story.
Report to Fitzroy Basin Association for the Fitzroy Water Quality Improvement Plan.
Marsden, T. 2015. Fitzroy Basin Association: Fish Barrier Prioritisation Update 2015. Report to the
Fitzroy Basin Association. Australasian Fish Passage Services, 36pp.

Maynard, J., Heron, S., Tracey, D. 2015. Improved ocean colour variable outputs for use in Great
Barrier Reef Water Quality Improvement Plans and a future Great Barrier Reef-wide risk assessment.
Outcomes of a joint project for the Cape York, Burdekin and Fitzroy Water Quality Improvement
Plans, 2015 (funded by Cape York NRM, NQ Dry Tropics and the Fitzroy Basin Association).
Petus, C., Devlin, M., da Silva, E., Brodie, J. 2015. Mapping uncertainty in chlorophyll a assessments
from remote sensing in the Great Barrier Reef. Outcomes of a joint project for the Cape York,
Burdekin and Fitzroy Water Quality Improvement Plans, 2015 (funded by Cape York NRM, NQ Dry
Tropics and the Fitzroy Basin Association).
Star, M., Beutel, T., Scrobback, P., Rolfe, J., McCosker, K., Ellis, R. 2015a. Prioritisation of
neighbourhood catchments in the Fitzroy Basin. Report to Fitzroy Basin Association for the Fitzroy
Water Quality Improvement Plan.
Star, M., Beutel, T., Scrobback, P., Rolfe, J., McCosker, K., Ellis, R. 2015b. Prioritisation of
neighbourhood catchments: Recommendations, gaps and future research. Report to Fitzroy Basin
Association for the Fitzroy Water Quality Improvement Plan.
Waterhouse, J. Tracey, D. Brodie, J. Lewis, S. da Silva, E. Devlin. M. Wenger, A. O’Brien, D. Johnson, J.
Maynard, J. Heron, S. Petus, C. 2015a. Assessment of the relative risk of water quality to ecosystems
of the Fitzroy NRM Region, Great Barrier Reef. Report to Fitzroy Basin Association for the Fitzroy
Water Quality Improvement Plan.
Waterhouse, J., Brodie, J., Petus, C., Devlin, M., da Silva, E., Maynard, J., Heron, S., Tracey, D. (2015b)
Recent findings of an assessment of remote sensing data for water quality measurement in the
Great Barrier Reef: Supporting information for the GBR Water Quality Improvement Plans.
TropWATER Report, Townsville, Australia.

Contents
1. Introduction .................................................................................................................................... 1
1.1. Background ............................................................................................................................. 1
1.2. Building the evidence base ..................................................................................................... 3
2. Current status ................................................................................................................................. 6
2.1 Regional Overview .................................................................................................................. 6
2.1.1 Population and coastal development ............................................................................. 6
2.1.2 Climate and geography ................................................................................................... 6
2.1.3 Land use .......................................................................................................................... 6
2.2 Status, trends and threats ..................................................................................................... 12
2.2.1 Freshwater .................................................................................................................... 12
2.2.2 Coastal wetlands ........................................................................................................... 12
2.2.3 Marine ecosystems ....................................................................................................... 14
2.3 Pollutant sources .................................................................................................................. 25
2.3.1 Key pollutants and sources ........................................................................................... 25
2.3.2 Priority basins for reducing pollutant run-off ............................................................... 35
3. Management Goals and Targets ................................................................................................... 50
3.1 Environmental Values and Water Quality Objectives ................................................................. 50
3.2 Pollutant load reduction targets ........................................................................................... 51
3.2.1 Reef Plan targets .................................................................................................................. 51
3.2.2 Defining ecologically relevant targets .................................................................................. 52
3.2.3 Reef 2050 Long-Term Sustainability Plan targets ......................................................... 56
3.2.4 Summary of targets for the Fitzroy Basin ..................................................................... 57
4. Management options and regional priorities ............................................................................... 58
4.1 Agricultural land uses ............................................................................................................ 60
4.1.1 Grazing lands ................................................................................................................. 60
4.1.2 Cropping systems .......................................................................................................... 63
4.1.3 Additional spatial and bio-physical knowledge to assist in management prioritisation
64
4.1.4 Management priorities in agricultural lands................................................................. 65
4.1.5 Costs to achieve the sediment targets .......................................................................... 78
4.1.6 Options for delivery and implementation .................................................................... 79

4.2 Ports ...................................................................................................................................... 80
4.3 Urban .................................................................................................................................... 83
4.3.1 Gladstone ............................................................................................................................. 83
4.4 Other land uses ..................................................................................................................... 84
4.4.1 Mining ........................................................................................................................... 84
4.4.2 Coal seam gas extraction .............................................................................................. 85
4.4.3 Industries and power generation .................................................................................. 85
4.5 System repair and landscape function .................................................................................. 87
4.5.1 Wetland prioritisation ................................................................................................... 88
4.5.2 Ecological Process Calculator (Eco-Process Calculator) ................................................ 93
4.5.3 Fish Barrier Prioritisation .............................................................................................. 94
4.5.4 Integrated System Repair Prioritisation Tool ................................................................ 98
5. Conclusions and recommendations to support the WQIP Implementation Plan ...................... 101
6. Limitations and key knowledge gaps .......................................................................................... 108
6.1 Marine water quality and ecosystem health ...................................................................... 108
6.2 Priority pollutants and material delivery ............................................................................ 111
6.3 Relative risk assessment ..................................................................................................... 112
6.4 Targets ................................................................................................................................ 113
6.5 Management prioritisation for TSS ..................................................................................... 114
6.6 System repair prioritisation ................................................................................................ 117
7. Closure ........................................................................................................................................ 118
8. References .................................................................................................................................. 119

List of Figures
Figure 1.1. Map showing the Fitzroy Natural Resource Management region, and the major basins.
Inset shows the six GBR NRM regions, and highlights the Fitzroy NRM region. .................................... 2
Figure 1.2. The scope of the Fitzroy WQIP, showing the two major components of catchment
waterway condition and ecosystem health, and Reef water quality and ecosystem health. ................ 3
Figure 1.3. Illustration of how the supporting studies inform the Fitzroy WQIP. The light blue boxes
indicate steps completed as part of the previous WQIP and Healthy Waters Management Process
(HWMP) planning processes, green boxes indicate current work, and orange boxes represent future
steps (over five years). ............................................................................................................................ 5
Figure 2.1. Spatial distribution of average annual rainfall in the Fitzroy NRM region. Source: Dougall
et al. (2014). ............................................................................................................................................ 7
Figure 2.2. Land use map of the Fitzroy region. Prepared using Queensland Land Use Mapping
Program (QLUMP) 2009 data. Source: Dougall et al. (2014). ................................................................. 8
Figure 2.3. Land use characteristics in each basin, showing the proportion of the area of each basin in
each land use. Source: Derived from Dougall et al. (2014). ................................................................. 10
Figure 2.4. Wetland areas of the Fitzroy Basin and coastal catchments, showing nationally and
internationally important wetlands that are part of the national Directory of Important Wetlands. . 13
Figure 2.5. Map of Fitzroy Basin catchments, and the marine area with key habitats. ....................... 15
Figure 2.6. Coral health index for inshore reefs in the Fitzroy marine area. Colours: dark green: ‘very
good’; light green: ‘good’; yellow: ‘moderate’; orange: ‘poor’; red: ‘very poor’. Trends in Foram index
and benthic community variables are represented by blue lines with blue shaded areas defining 95%
confidence intervals, grey lines represent observed profiles averaged over depth at individual reefs
(Source: Thompson et al. 2013). ........................................................................................................... 17
Figure 2.7. Monitoring results of seagrass status indicators and index for the Fitzroy region ............ 18
(averaged across sites). Values are indexed scores scaled from 0-100; ■ = very good (80-100),
■ = good (60 - <80), ■ = moderate (40 - <60), ■ = poor (20 - <40), ■ = very poor (0 - <20) (Source:
McKenzie et al. 2014). ........................................................................................................................... 18
Figure 2.8. Annual load estimates for TSS from the basins in the Fitzroy region. The graphs show (a)
Total (2008) and anthropogenic loads (2008) (in kilotonnes), and (b) the proportion that the
anthropogenic TSS from each basin contributes to the regional Total TSS Load. ................................ 27
Figure 2.9. Total TSS loads by land use for each basin in the Fitzroy NRM region. Source: Derived
from Dougall et al. (2014). .................................................................................................................... 29
Figure 2.10. Annual load estimates for DIN from the basins in the Fitzroy region. The graphs show (a)
Total (2008) and anthropogenic loads (2008) (tonnes), and (b) the proportion that the anthropogenic
DIN from each basin contributes to the regional Total DIN Load. ........................................................ 30
Figure 2.11. Annual load estimates for PSII herbicide toxic equivalent loads from the basins in the
Fitzroy region. The graphs show (a) anthropogenic loads (2008) (in kilograms), and (b) the proportion
that these contributes to the regional total. ........................................................................................ 30
Figure 2.12. Annual load estimates for Particulate Nitrogen (PN) from the basins in the Fitzroy
region. The graphs show (a) Total (2008) and anthropogenic loads (2008) (tonnes), and (b) the
proportion that the anthropogenic PN from each basin contributes to the regional Total PN Load. . 31

Figure 2.13. Annual load estimates for Dissolved Inorganic Phosphorus (DIP) from the basins in the
Fitzroy region. The graphs show (a) Total (2008) and anthropogenic loads (2008) (tonnes), and (b)
the proportion that the anthropogenic DIP from each basin contributes to the regional Total DIP
Load. ...................................................................................................................................................... 31
Figure 2.14. Annual load estimates for Particulate Phosphorus (PP) from the basins in the Fitzroy
region. The graphs show (a) Total (2008) and anthropogenic loads (2008) (tonnes), and (b) the
proportion that the anthropogenic PP from each basin contributes to the regional Total PP Load. .. 32
Figure 2.15. Zones of influence modelled for the (a) Water Park Creek, (b) Fitzroy River [note change
in scale], (c) Calliope River and (d) Boyne River based on application of a threshold to the wet season
mean of the tracer data that equates to a salinity of 36 ppt, in the wet seasons of 2008–09, 2010–11,
2011–12 and 2012–13. The method for deriving these zones is described in Waterhouse et al.
(2015). ................................................................................................................................................... 37
Figure 2.16. Results of all variables presented for comparison and identification of the areas of
highest relative risk from individual variables in the Fitzroy NRM region. ........................................... 42
Figure 2.17. Combined assessment (1 km2 resolution) of the relative risk of water quality variables.
The areas (in km2) of habitat types within each class are shown in Table 3.7. .................................... 43
Figure 4.1. Neighbourhood Catchments within the Fitzroy NRM region. Catchment and basin
boundaries are shown in red. ............................................................................................................... 59
Figure 4.2. Components considered in Scenario Two. ......................................................................... 68
Figure 4.3 The top 20 Neighbourhood Catchment priorities based on a cost effectiveness for meeting
the Reef Plan sediment 20% reduction target — all land uses. ............................................................ 70
Figure 4.4 Highest quartile for sediment loads (Dark Blue; lowest quartile in pale blue) with grazing
on the left and cropping on the right.................................................................................................... 73
Figure 4.5. Total Scores for Scenario Two— Ecologically Relevant Targets; where 4 is the highest
score. ..................................................................................................................................................... 76
Figure 4.6. Key steps for determining the overall costs of achieving the sediment reduction targets.
.............................................................................................................................................................. 78
Figure 4.7. Assessment of the range of cost per tonne of sediment reduction for the Fitzroy region to
achieve the 390,200 tonne reduction target. ...................................................................................... 79
Figure 4.8. Assessment of the cost per tonne of sediment reduction for grazing and grains cropping
in the Fitzroy region to achieve the 20% reduction target of 390,200 tonnes. .................................... 79
Figure 4.9. The Fitzroy Region and the boundaries of the Ports of Gladstone and Rockhampton (Flint
et al. 2015). ........................................................................................................................................... 81
Figure 4.10. Some of the International agreements, Australian Government and Queensland
Government legislation relating to managing water quality, and managing matters that may be
affected by water quality, in the Ports of Gladstone and Rockhampton (Flint et al. 2015). ................ 83
Figure 4.11. Location and map of the Port of Gladstone, showing rail and road link and major
industries (Flint et al. 2015). ................................................................................................................. 86
Figure 4.12. Wetland prioritisation results from the application of the Secondary Wetlands DSS to 20
wetlands in the FBA region. .................................................................................................................. 91
Figure 4.13. Map of Fitzroy wetland prioritisation results from the application of the Secondary
Wetlands DSS to 20 wetlands in the FBA region. ................................................................................. 92

Figure 4.14. Example output of Blue Maps for part of the GBR catchment indicating the level of
connectivity to waters of the GBR (left). Orange lines indicate boundaries of river basins. The data
layers and connectivity frequencies used to define the regions in Blue Maps are shown to the right of
the map. ................................................................................................................................................ 94
Figure 4.15. Location of the 2015 top 46 priority fish barriers in the Fitzroy region. .......................... 97
Figure 4.16. Normalised scores for each of the system repair prioritisation tools: a) Wetlands DSS, b)
Fish Barrier Prioritisation; c) GBRMPA Blue Maps. ............................................................................. 100
List of Tables
Table 1.1. Summary of the supporting studies commissioned to assist FBA in the development of the
Fitzroy WQIP. .......................................................................................................................................... 4
Table 2.1. Estimated land use by area (km2) in the Fitzroy region (based on QLUMP data used in
Source Catchments). Source: Dougall et al. (2014). ............................................................................... 9
Table 2.3. Land use contribution to total TSS loads for the basins of the Fitzroy region. .................... 28
Table 2.4. Total and anthropogenic loads for TSS, DIN and PSII herbicides from basins in the Fitzroy
region, and as percentages of the total regional load and regional anthropogenic load. ................... 33
Table 2.5. Total and anthropogenic loads for PN, DIP and PP loads from basins in the Fitzroy region,
and as percentages of the total regional load and regional anthropogenic load................................. 34
Table 2.6. Examples of major sewage treatment plants in the Fitzroy region. .................................... 35
Table 2.7. Summary of the potential hotspot areas for highest relative risk for each variable in the
Fitzroy NRM region. .............................................................................................................................. 40
Table 2.8. Results of the relative risk assessment for important habitat features in the Very High to
Low areas of the Fitzroy region. ........................................................................................................... 44
Table 2.9. Priority pollutants for each industry in terms of relative risk to water quality, in order of
importance. ........................................................................................................................................... 47
Table 4.1. P2R classification of management practices in the grazing industry. .................................. 61
Table 4.2. Percentage of grazier classification of management practice across the different erosion
process in the Fitzroy (as at 2013). ....................................................................................................... 62
Table 4.3. P2R classification of management practices in the grains cropping industry...................... 63
Table 4.4. Percentage of grains cropping management practices effectiveness on cropping land in the
Fitzroy region (as at 2013). ................................................................................................................... 63
Table 4.5. Prioritisation scenarios for managing sediment losses at a neighbourhood catchments
scale. ..................................................................................................................................................... 66
Table 4.6. Parameters and ranking based on Scenario One — cost effective approach for meeting
Reef Plan sediment 20% reduction target — all land uses. .................................................................. 69

Table 4.7. Parameters and ranking based on Scenario One — cost effective approach for meeting
Reef Plan sediment 20% reduction target in grazing lands. ................................................................. 71
Table 4.8. Parameters and ranking based on Scenario One — cost effective approach for meeting
Reef Plan sediment 20% reduction target in cropping lands................................................................ 72
Table 4.9. Parameters and ranking based on Scenario Two — meeting the Ecologically Relevant
Targets for sediment in the Fitzroy region. .......................................................................................... 74
Table 4.10. Potential mix of mechanisms to achieve more efficient sediment reductions in the Fitzroy
region. ................................................................................................................................................... 80
Table 4.11. Criteria applied in the Wetland DSS, and weightings applied to each criterion. Source:
Jaensch et al. (2015). ............................................................................................................................ 89
Table 4.12. Wetland rankings from running the DSS application; refer to map in Figure 4.12 for
location. ................................................................................................................................................ 90
Table 4.13. Prioritisation of the 46 fish passage barriers in the FBA region, re-assessed in the 2015
project. Source: Marsden (2015). ......................................................................................................... 95
Table 5.1. Regional priorities for progressing achievement of pollutant reduction targets and system
repair priorities in the Fitzroy NRM region. The relative regional priority is derived from the marine
relative risk assessment (Waterhouse et al. 2015a) in the major basins and is based on expert
opinion for the catchments within the Fitzroy Basin taking into account the priority NCs. The NCs
highlighted in bold show examples of multiple priorities in a Catchment. Note: 1 derived from Star et
al. (2015a); 2 has been developed by FBA using Star et al. (2015a). .................................................. 105
Table 6.1. Knowledge gaps in marine water quality influences in the Fitzroy region (adapted from
Flint et al. 2015). ................................................................................................................................. 109

1
1. Introduction
1.1. Background
Exposure to land-sourced pollution has been identified as an important factor in the world-wide
decline in coral reef condition (Pandolfi et al. 2003; Burke et al. 2011). Different parts of the Great
Barrier Reef World Heritage Area (GBRWHA) are exposed to different degrees of influence from
land-sourced pollutants. The degree of exposure is a function of factors such as distance from the
coast and river mouths, the magnitude of river discharges, wind and current directions, the mobility
of different pollutant types, and the different land-uses in the Great Barrier Reef (GBR) catchment
(Brodie et al. 2012). This differential exposure to land-sourced pollutants results in varying levels of
direct and indirect threats to coastal and marine ecosystems in the GBR including coral reefs and
seagrass. Understanding and managing these differences is important for the future of the GBR.
The Fitzroy Natural Resource Management (NRM) region is one of six NRM regions in the GBR
catchment (see inset Figure 1.1). The region is part of the Great Barrier Reef World Heritage Area
and Great Barrier Reef Marine Park. The NRM region has an approximate catchment area of 156,000
km2 and is approximately 37% of the total GBR catchment area (423,122 km2) (Dougall et al. 2014).
There are six Australian Water Resources Council Basins that make up the region (ANRA 2002). From
north to south they are Styx, Shoalwater, Water Park Creek, Fitzroy, Calliope and Boyne (Figure 1.1).
The Fitzroy Basin dominates in terms of area (93%), while the smaller basins make up the remainder
(7%). Due to the size of the Fitzroy Basin, it is commonly discussed in terms of its catchments, which
include the Callide, Comet, Connors, Fitzroy (lower), Lower Dawson, Lower Isaac, Mackenzie, Nogoa,
Theresa, Upper Dawson and Upper Isaac catchments (Figure 1.1). These areas are also divided
further into 192 ‘Neighbourhood Catchments’, which is the management unit used in the region for
delivering NRM programs (see Section 4).
The Queensland and Australian governments’ Reef Water Quality Protection Plan (Reef Plan, State of
Queensland 20131) initially established in 2003 and revised in 2009 and 2013, provides the
foundation for managing water quality in the GBR. Reef Plan 2013 states that its long-term goal is
“to ensure that by 2020 the quality of water entering the reef from broadscale land use has no
detrimental effect on the health and resilience of the Great Barrier Reef”. The Plan includes the
deliverable of ”a Water Quality Improvement Planning process (aligned with Healthy Waters
Management Plan guideline under the Environment Protection Policy Water) to consider Reef Plan’s
long term goal and use of consistent modelling information to set regional and subregional water
quality and management action targets that align with Reef Plan”. In August 2014, the Australian
Government's Reef Programme committed to funding a Water Quality Improvement Plan (WQIP) for
the Fitzroy NRM region. Continued investment towards a water quality grant program for the region
has also occurred through the Australian Government’s Reef Programme (formerly Reef Rescue),
guided by the region’s existing Fitzroy Basin Water Quality Improvement Report (Johnston et al.
2008).
1 http://www.reefplan.qld.gov.au/

2
A WQIP is designed to identify the main issues impacting waterways and the coastal and marine
environments from land-based activities, and to identify and prioritise management actions that will
halt or reverse the trend of declining water quality within a region. The scope of the Fitzroy WQIP is
illustrated in Figure 1.2. The plan contains two major system components that interact to deliver a
holistic approach to water quality management in the Fitzroy region: the catchment waterways and
freshwater ecosystems and then the receiving waters of the GBR coastal and marine environments.
Figure 1.1. Map showing the Fitzroy Natural Resource Management region, and the major basins. Inset shows
the six GBR NRM regions, and highlights the Fitzroy NRM region.

3
Figure 1.2. The scope of the Fitzroy WQIP, showing the two major components of catchment waterway
condition and ecosystem health, and Reef water quality and ecosystem health.
1.2. Building the evidence base
The Fitzroy WQIP will be built on existing knowledge in the region and the Healthy Waters
Management Process. Fitzroy Basin Association (FBA) has adopted the principle of utilising the best
available knowledge for the development of the WQIP, and commissioned a number of supporting
science studies to assist in building this current information base. The studies are listed in Table 1.1.
Each of the studies informs one or several steps in the development of the WQIP. Figure 1.3
illustrates how the studies fit into the overall WQIP framework, derived from the National Water
Quality Management Strategy.
The supporting studies have generated standalone reports that have been independently peer
reviewed by the Fitzroy Partnership for River Health Science Panel to inform the WQIP. The key
findings have been incorporated into the plan where relevant.

4
Table 1.1. Summary of the supporting studies commissioned to assist FBA in the development of
the Fitzroy WQIP.
Supporting studies Delivery Partner / Consultant
Project Leaders Report Reference
1. Status of catchment, coastal and marine ecosystems
a) Review on water quality information in each of the major catchments of the Fitzroy and coastal catchments and collate existing information on environmental values and water quality objectives
TropWATER, JCU Dominique O’Brien, Jane Waterhouse Material incorporated to website
b) State of the coastal and marine environment review C2O Consulting CQUniversity
Johanna Johnson, Jon Brodie, Nicole Flint Johnson et al. (2015)
c) Environmental-economic values of marine and coastal natural assets: Fitzroy NRM region
TropWATER JCU
Colette Thomas, Jon Brodie Thomas & Brodie (2015)
2. Setting management targets
a) Ecologically relevant targets for pollutant discharge from the drainage basins of the Fitzroy Region
TropWATER JCU GBRMPA
Jon Brodie, Steve Lewis, Scott Wooldridge, Jane Waterhouse, Carol Honchin Brodie et al. (2015)
3. Scoping and risk assessment of water quality issues
a) Synthesis of water quality influences in ports of the Fitzroy region, Queensland
CQUniversity Nicole Flint, Emma Jackson, Scott Wilson, Krista Verlis, John Rolfe Flint et al. (2015)
b) Rockhampton and Gladstone urban scoping studies Earth Environmental
John Gunn Gunn (2015)
c) Assessment of the relative risk of degraded water quality to GBR ecosystems in the Fitzroy NRM region, including improvements to the Marine Risk Index
TropWATER JCU C2O Consulting Maynard Marine NOAA
Jane Waterhouse, Dieter Tracey, Jon Brodie, Steve Lewis, Eduardo da Silva, Michelle Devlin, Amelia Wenger, Dominique O’Brien, Johanna Johnson, Jeffrey Maynard, Scott Heron, Caroline Petus Waterhouse et al. (2015a, 2015b), Maynard et al. (2015), Petus et al. (2015)
d) Fitzroy sediment story TropWATER JCU DNRM DSITI CSIRO
Stephen Lewis, Bob Packett, Cameron Dougall, Jon Brodie, Rebecca Bartley, Mark Silburn Lewis et al. (2015)
4. Regional prioritisation
a) Coastal ecosystems status and priorities including specific wetland prioritisation and Ecological Calculator
FBA Australasian Fish Passage Services Jaensch Ornithology & Conservation GBRMPA
Ronnie Baker, Roger Jaensch, Peter Smith, Tim Marsden, Shane Westley Paul Groves, Donna Audas Baker (2015) Jaensch et al. (2015) Marsden (2015)
b) Bioeconomic modelling and Neighbourhood Catchments prioritisation
DAF DNRM CQUniversity
Megan Star, Terry Beutel, Kev McCosker, Adam Northey, Rob Ellis, John Rolfe Star et al. (2015a, 2015b)

5
Figure 1.3. Illustration of how the supporting studies inform the Fitzroy WQIP. The light blue boxes indicate steps completed as part of the previous WQIP and Healthy
Waters Management Process (HWMP) planning processes, green boxes indicate current work, and orange boxes represent future steps (over five years).
6
2. Current status
2.1 Regional Overview
2.1.1 Population and coastal development
Approximately 280,000 people live in the Fitzroy region. The major centres include Rockhampton,
with a population of approximately 73,000 people; Gladstone, with a (regional council area)
population of approximately 58,000; Emerald, with about 13,000; and the Livingstone Shire Council
area, which includes the town of Yeppoon, also approximately 13,000 people. There are a number of
smaller coastal towns and townships, and also regional towns servicing the agricultural and resource
industries in the western area of the Fitzroy.
2.1.2 Climate and geography
The Fitzroy region experiences a typical sub-tropical climate with humid, wet summers and mild, dry
winters. Average yearly rainfall in the catchment ranges from 1,700 mm in north-eastern parts to
less than 600 mm in south-western areas (Figure 2.1); however, totals can be highly variable due to
climatic drivers such as the El Niño Southern Oscillation (ENSO) and the Pacific Decadal Oscillation
(PDO). Long-term rainfall and stream flow reconstructions (1600–2000) correlate well with ENSO
records, indicating a long-term climatic cycle of extended dry and wet conditions (Lough 2007; Lough
2010). The mean annual flow is estimated as ~5,800 GL (1986–2009), of this the Fitzroy produces the
majority of the discharge ~80%, with the coastal basins discharging the remaining 20% (Dougall et al.
2014). Flows are summer/wet season dominant and are highly variable within and between years.
The mean maximum temperature in Rockhampton is 32.1°C in December, and the mean minimum
temperature occurs in July at 23.1°C.
Shields and Forster (1992) describe the soils of the Fitzroy NRM region as very diverse due to wide
variations in lithology, climate and geomorphic processes. No one soils group is dominant and there
have been over 100 soils types described with a complex distribution pattern. Cracking clays are
predominantly used for cropping throughout the basin, with high erosion on sloping ground where
surface cover is low (Carroll et al. 1997). Surface and gully erosion can occur on texture contrast (or
duplex) soils where hard setting surfaces increase run-off. Where run-off concentrates and there is a
high Exchangeable Sodium Percentage in the clay subsoil, gully erosion is accentuated (Dougall et al.
2014).
2.1.3 Land use
Land use characteristics of the Fitzroy region are shown in Table 2.1, and mapped in Figure 2.2. This
information is all derived from Dougall et al. (2014). The dominant land uses by area are grazing
(~78%), conservation (~8%), forestry (~6%) and dryland cropping (5%). Other land uses including
urban, resource extraction, horticulture, irrigated cropping and sugarcane are all less than 1% of the
regional land use area.

7
Grazing is the most common land use in the Fitzroy NRM region, with majority of the region
dedicated to cattle production (Figure 2.3). Large areas of dryland cropping occur in the western
part of the basin; while irrigated cropping (including cotton) occurs around the townships of
Emerald, Theodore and Biloela. There is also extensive coal mining occurring in the Bowen Basin,
especially around the townships of Moranbah, Dysart, Blackwater, Moura and Middlemount. The
coastal basins have a mix of land uses, dominated by grazing and conservation areas.
Figure 2.1. Spatial distribution of average annual rainfall in the Fitzroy NRM region. Source: Dougall et al.
(2014).

8
Figure 2.2. Land use map of the Fitzroy region. Prepared using Queensland Land Use Mapping Program
(QLUMP) 2009 data. Source: Dougall et al. (2014).

9
Table 2.1. Estimated land use by area (km2) in the Fitzroy region (based on QLUMP data used in Source Catchments). Source: Dougall et al. (2014).
Basin Grazing
Forested Grazing Open
Dryland Cropping
Irrigated Cropping
Forestry Horticulture Sugarcane Urban Conservation Water Other Total
Styx 1,075 1,339 5 0 76 <1 0 1 148 370 2 3,015
Shoalwater 672 792 0 0 12 0 0 <1 1,685 441 5 3,608
Water Park Creek
179 114 <1 <1 191 8 0 73 1,157 115 7 1,845
Fitzroy 40,339 73,320 7,929 1,210 9,156 48 3 331 8,350 1,018 1,159 142,86
3
Calliope 842 989 <1 <1 133 3 0 43 107 93 36 2,244
Boyne 1,384 467 0 3 134 1 0 17 385 77 33 2,502
Total 44,491 77,021 7,934 1,213 9,701 60 3 465 11,832 2,113 1,242 156,07
6

10
Figure 2.3. Land use characteristics in each basin, showing the proportion of the area of each basin in each land use. Source: Derived from Dougall et al. (2014).

11
The area and land use characteristics of the basins are varied. To summarise:
Styx: 80% of the basin is utilised for grazing of livestock (beef cattle). The bulk of reminder area
within the basin forms waterways (~12%; i.e. river, wetlands, dam, lake or storage) and conservation
and natural environments (~5%). Agriculture and plantations within the basin, both dryland and
irrigated, cover less than 2.5% of the total basin area.
Shoalwater: Approximately 60% of land within the Shoalwater Basin is classified as water
(marsh/wetland, river and reservoir/dam — 12%) and conservation and natural environments. The
majority of the conservation and natural environment of the Shoalwater Basin is under the control
of the Australian Defence Force (Shoalwater Bay Training Area; SWBTA) and <1% of land is
conserved under natural feature protection or classified as national park. The remaining area (~40%)
is mostly used for grazing.
Water Park: The majority of land within the basin falls under conservation or natural environments
(63%), grazing (16%) and forestry (10%). The remaining land within the catchment includes ~5%
water (marsh/wetlands, river and reservoir/dam); <5% intensive uses (residential and associated
services/industry); and <1% of production from dryland/irrigated agriculture and plantations.
Fitzroy: The majority of land is used for grazing (~85%). The remaining land use within the
catchment includes approximately 5% dryland cropping, 6% of conservation and natural
environments (nature conservation, minimal use including defence lands, and managed resource
protection); and other land uses including intensive use (i.e. coal mining, coal seam gas extraction,
industry, residential, transport and utilities) and irrigated agriculture and plantations. There is also a
significant abandoned gold mine in the basin.
Calliope: The majority of land within the basin is used for grazing (~82%) and production from
forestry (~6%). The remaining land use within the basin includes approximately 5% of conservation
and natural environments (nature conservation and minimal use); 7% of intensive use (i.e.
residential, industry, transport and utilities) and 4% water (marsh/wetland, river, reservoir/dam).
Boyne: The majority of land within the basin is used for grazing (~74%) and production from forestry
(~5%). The remaining land use within the basin includes approximately ~12% of conservation and
natural environments (nature conservation and minimal use); 2.5% of intensive use (i.e. residential,
industry, transport and utilities) and ~5% water (marshland/wetland, river, reservoir/dam).

12
2.2 Status, trends and threats
2.2.1 Freshwater
The Fitzroy Basin contains numerous freshwater wetlands, floodplains and lagoon systems and while
some remain in good condition many others have suffered degradation as a result of historical and
some continuing land use practices (Packett et al. 2009). The large size of the Fitzroy Basin and the
variability resulting from natural variations in climate, flow, geography, geology and soils as well as
variations relating to diverse anthropogenic activities, are reflected in variable water quality across
the basin’s many wetlands (Flint et al. 2013). There are 28 dams and weirs modifying the natural
hydrology of rivers and creeks of the Fitzroy Basin, and the Connors River is the only remaining
tributary that is not regulated by dams or weirs. The Fitzroy River barrage has shortened the length
of the Fitzroy estuary by half its natural tidal range, resulting in loss of habitat and changes to the
natural hydrodynamic characteristics (Connell et al. 1981).
Many of the palustrine, lacustrine, riverine and artificial/modified freshwater habitats of the Fitzroy
Basin are ephemeral (seasonally dry) but are also prone to extensive flooding (Flint et al. 2013). The
seven major tributaries of the Fitzroy Basin are Callide Creek, Comet River, Dawson River, Isaac
River, Mackenzie River, Nogoa River and the Fitzroy River. The Fitzroy River collects waters from all
other rivers and streams of the Fitzroy Basin and meets the coast at the Fitzroy River Delta. There
are 18 nationally important wetlands in the Fitzroy Basin and coastal catchments (Johnson et al.
2015).
The Fitzroy Partnership for River Health reports annually on aquatic ecosystem health of the Fitzroy
Basin. The 11 freshwater catchments of the Fitzroy Basin are each scored separately, and grades of
‘B – good’ or ‘C – fair’ have been reported for the catchments over the four reports released to date
(2010–11 to 2013–14)2, with the latest report for 2013–14 rating the Fitzroy Basin as ‘B – good’
overall.
2.2.2 Coastal wetlands
Of the 18 nationally important wetlands in the Fitzroy Basin and coastal catchments (see Figure 2.4),
11 can be classified as coastal (Johnson et al. 2015). The Shoalwater and Corio Bays wetland is listed
as a Ramsar wetland of international importance. The Shoalwater Bay Training Area includes
portions of several nationally and internationally important wetlands, and the area is considered to
be of particularly high natural integrity and high species diversity (O’Neill 2009).
Despite the long-acknowledged economic, social, cultural and ecosystem values associated with
coastal wetlands, wetland loss and degradation in Australia has been estimated at more than 50%
over the past 200 years (Finlayson 2000). Wetland losses may be even higher in Queensland at
between 70 and 90% (GBRMPA 2009). Threats to wetland habitats and species include coastal
development (particularly clearing or modifying vegetation), the continuing influence of past
management practices, damage by feral animals, grazing, illegal dumping, weeds, pollution, and
2 http://riverhealth.org.au/ Accessed July 2015

13
changes to upstream flows and water quality (Flint et al. 2014; Johnson et al. 2015). The 670 km2 of
palustrine wetlands throughout the Fitzroy region include marine plain wetlands in the coastal zone.
Marine plains are of importance in the region for their function as waterbird breeding habitat,
including for species such as the vulnerable Australian painted snipe, and are the primary habitat for
bird species of concern including zitting cisticolas and the critically endangered Capricorn yellow chat
(Houston et al. 2013). Palustrine wetland areas in the Shoalwater and Styx catchments have
increased in extent since European settlement due to the construction of bund walls (tidal exclusion
dams), which convert estuarine wetlands into freshwater ponded pastures for grazing.
Figure 2.4. Wetland areas of the Fitzroy Basin and coastal catchments, showing nationally and internationally
important wetlands that are part of the national Directory of Important Wetlands.

14
The Fitzroy Basin and coastal catchments region has approximately 1,430 km2 of estuarine coastal
wetlands (Queensland WetlandInfo3). Mangroves are often the dominant flora and are diverse in the
Fitzroy region; at least 13 mangrove species have been recorded in the Fitzroy estuary and 23
species in Shoalwater Bay (Johnson et al. 2015). Estuaries in the Fitzroy Basin region are located at
the major river mouths — Fitzroy, Boyne and Calliope rivers — as well as along the smaller river
deltas (e.g. Ross Creek, Kinka Creek). The estuaries of the Fitzroy region make up 7.7% of total
estuary extent in the entire GBR catchment (GBRMPA 2013).
Important estuaries in the region include the Fitzroy River Delta, which is the only estuary of the
largest seaward draining catchment on Australia’s east coast (the Fitzroy Basin), the Ramsar-listed
Shoalwater and Corio Bay Area, and the estuaries of Gladstone Harbour. The health of the Fitzroy
River Delta was scored as ‘B – good’ in 2013–14 and ‘C – fair’ in 2012–13, based mostly on water
quality indicators (Fitzroy Partnership for River Health Annual Report Card 4). The State of the
Environment Report for Shoalwater Bay states that this area is of particularly high natural integrity
and high species diversity (Department of Defence 2009). Gladstone Harbour was scored ‘C –
Satisfactory’ for water quality (Gladstone Healthy Harbour Partnership’s 2014 Pilot Report Card5).
Intertidal seagrass meadows exist in sheltered areas of the Fitzroy region’s estuaries and coasts,
particularly in Shoalwater Bay and Port Curtis (Gladstone Harbour). SeagrassWatch in 2011–12
assessed the condition of estuarine seagrass beds in the region as ‘moderate’; since 2007–08
condition has fluctuated between ‘poor’ and ‘moderate’. Condition was poorest in 2006–07, when
they were rated ‘very poor’, attributed to high temperature stress during that summer period
(McKenzie et al. 2014).
2.2.3 Marine ecosystems
The Fitzroy marine area covers 85,515 km2 and is recognised for its diverse and unique marine and
coastal environments, including coral reefs, seagrass meadows, coastal wetlands, estuaries,
continental and offshore islands and the species they support. Some of these species are listed as
threatened or vulnerable, and have significant cultural values. These highly diverse marine and
coastal ecosystems support important industries, including tourism (mainly to the Keppel and
Capricorn Bunker islands and reefs) and recreational beach activities worth $252 million in 2011–12
(Rolfe & Gregg 2012, Deloitte Access Economics 2013). Recreational and commercial fisheries are
estimated to be worth $10 million and $35 million annually respectively, and target reef fish, mud
crabs, and inshore species like barramundi and mangrove jack (GBRMPA 2013); and coastal
aquaculture ventures for finfish worth $300,000 annually (Deloitte Access Economics 2013). From 1
November 2015, the Fitzroy River and Capricorn Coast will be classified as a net-free zone and net
fishing (such as commercial gill nets) will not be permitted to operate in this area6.
The Fitzroy Basin region has a significant length of coastline that includes estuaries, coastal wetlands
(tidal and ephemeral freshwater) and many coastal islands and cays (Figure 2.5). Notable among
3 http://wetlandinfo.ehp.qld.gov.au/wetlands/facts-maps/ Accessed March 2015 4 http://riverhealth.org.au/ Accessed June 2015 5 http://rc.ghhp.org.au/report-cards#resultPanelEnvironmental Accessed June 2015 6 https://www.business.qld.gov.au/industry/fisheries/commercial-fishing/net-free-zones Accessed October 2015

15
these are the continental islands of Curtis, Facing and Townshend islands, the inshore Keppel Island
Group, and the offshore Capricorn-Bunker Group of islands. The region includes a total of 125
islands, the largest being Curtis Island off Gladstone and within port limits, as well as the Keppel
Island and Capricorn-Bunker groups that support nesting and migratory species, fisheries and marine
tourism. The region also includes the Shoalwater Bay Training Area, which covers 4,545 km2
including the Warginburra Peninsula, the Torilla Peninsula, Townshend and Leicester islands, and a
substantial area of the Shoalwater Bay hinterland north of Byfield. The area has been used
exclusively for defence training activities since 1965.
Figure 2.5. Map of Fitzroy Basin catchments, and the marine area with key habitats.

16
Coral reefs and seagrass meadows
The area of mapped reefs in the Fitzroy marine area is 4,855 km2, representing 13% of total reef area
in the GBR. There are estimated to be 241 km2 of shallow seagrass areas (<15 m depth),
representing 0.2% of total seagrass area in the GBR (McKenzie et al. 2010), and 5,775 km2 total
seagrass area including modelled deep-water meadows (Brodie et al. 2013a; see Figure 2.5). The
Fitzroy marine area lies within the GBR World Heritage Area, listed in 1981 for its outstanding
universal values under all four natural criteria7.
The region has inshore reefs, primarily fringing reefs around the Keppel Islands; mid-shelf reefs in
the Capricorn-Bunker Group, although their characteristics resemble more offshore reefs; and the
remote Swains Reefs that are located on the outer continental shelf. Keppel Island reefs used to
have relatively high coral cover and diversity for inshore reefs, with representatives from 68% of the
~244 coral species previously described for the southern GBR (Jones et al. 2011). However, results of
Reef Rescue Marine Monitoring Program (MMP) inshore reef surveys show a decline in coral cover
from ~50% in 2005 to ~20% in 2012, with the condition of coral reefs assessed as ‘very poor’ in
2012–13 (Thompson et al. 2013). All indicators of reef health have shown declines in 2012–13,
including coral cover that declined to ‘very poor’, the rate of change in coral cover and the density of
juveniles were both ‘very poor’, while macroalgae remained ‘poor’ indicating high cover that can
outcompete coral recruits for substrate. The number of juvenile coral colonies has remained
relatively stable (Figure 2.6; Thompson et al. 2013).
7 http://www.gbrmpa.gov.au/about-the-reef/heritage/great-barrier-reef-world-heritage-area

17
Figure 2.6. Coral health index for inshore reefs in the Fitzroy marine area. Colours: dark green: ‘very good’; light
green: ‘good’; yellow: ‘moderate’; orange: ‘poor’; red: ‘very poor’. Trends in Foram index and benthic
community variables are represented by blue lines with blue shaded areas defining 95% confidence intervals,
grey lines represent observed profiles averaged over depth at individual reefs (Source: Thompson et al. 2013).
Surveys in 2014 by the AIMS Long-Term Monitoring Program (LTMP) recorded average coral cover
for mid- and offshore reefs at Capricorn-Bunker and Swains reefs as 10-30% (AIMS website8). There
are clear signs of recovery in mid- and offshore reefs after the damaging and widespread effects of
severe tropical cyclone (TC) Hamish in 2009. Survey conducted in 2007 prior to TC Hamish recorded
the highest hard coral cover GBR-wide on reefs in the Capricorn-Bunker Group of 55% (AIMS 2013).
Since TC Hamish, high numbers of coral recruits have been observed at all mid- and offshore reefs
surveyed, suggesting that coral recovery is underway. Analysis of AIMS long-term monitoring data
for the Southern Region9 shows current hard coral cover has declined significantly from 37.4% in
8 http://www.aims.gov.au/reef-monitoring/capricorn-bunker-and-swains-2014 Accessed July 2015. 9 The study analysed coral cover in three broad zones of the GBR; these figures are from the southern zone (20.0–23.9°S), which includes the Fitzroy marine region.

18
1985 to 8.2% in 2012, exceeding the estimated 50% decline GBR-wide on inshore and mid-shelf reefs
over the past 27 years (De’ath et al. 2012). This severe decline has been attributed in part to coral
predation by crown-of-thorns starfish (COTS) but the greatest impacts in the Southern Region have
been from cyclones and storms, especially between 2009–2012.
The overall condition of inshore reefs in the Fitzroy region as monitored by the MMP has continued
to decline since 2010, and in 2013 was assessed as being in ‘very poor’ condition (Thompson et al.
2013). This is due to a significant decline in coral cover from the impacts of flooding in early 2011
due to ex-TC Tasha causing a massive flood plume that inundated reefs up to 12 km offshore and
caused 40–100% coral mortality due to low salinity on Keppel island fringing reefs down to a depth
of 8 m (Jones & Berkelmans 2014). Ex-TC Oswald in January 2013 also caused moderate flooding of
the Fitzroy River and was followed by a general increase in macroalgal cover, high levels of coral
disease and coral loss. The diversity of most reefs that were monitored has also declined, with the
cover of Acroporidae corals declining since 2010 (Thompson et al. 2013). These declines in coral are
similar to those documented after the previous big flood event in 1991 (van Woesik et al. 1995).
Results of inshore MMP seagrass monitoring show declines in 2011–12 mainly in coastal meadows in
the Fitzroy region, which appear to be the consequence of local-scale disturbances (e.g. sediment or
sand bank movement). In contrast, seagrass abundances observed in the estuarine meadows of the
Fitzroy region in 2011–12 were some of the highest recorded since monitoring was established
(Figure 2.7).
Figure 2.7. Monitoring results of seagrass status indicators and index for the Fitzroy region (averaged across
sites). Values are indexed scores scaled from 0-100; ■ = very good (80-100), ■ = good (60 - <80), ■ = moderate
(40 - <60), ■ = poor (20 - <40), ■ = very poor (0 - <20) (Source: McKenzie et al. 2014).

19
Despite this high abundance of estuarine seagrass, the MMP rated overall conditions as ‘poor’ for all
seagrass habitat types due to other indicators of seagrass health, such as ‘poor’ to ‘very poor’
reproductive effort and the ‘very poor’ condition of reef seagrass (McKenzie et al. 2014). Despite this
poor state of seagrass meadows in the region, recovery is possible. Areas that have supported
seagrass communities in the past can in theory do so again, provided environmental conditions are
suitable for colonisation and maintenance of meadows (Weston & Goosem 2004). Recent
monitoring results indicate that recovery may have begun in some locations with a shift to the
colonising species Halophila ovalis (McKenzie et al. 2014). Once re‐established, seagrass meadows
are expected to increase in abundance and distribution if environmental conditions remain
favourable.
Species of conservation interest
The Fitzroy marine area supports populations of species of conservation interest, including dugong,
six marine turtle species (green, loggerhead, hawksbill, flatback, olive ridley and leatherback),
humpback whales, three species of inshore dolphins, many species of shorebirds and seabirds,
sawfish and sharks. Wetlands in this region provide important habitat and transport corridors for
migratory bird (and other) species with the adjacent marine waters, many of which are listed under
the Australian Environment Protection and Biodiversity Conservation Act 1999 (EPBC Act) and
International agreements including: Japan-Australia Migratory Bird Agreement (JAMBA), China-
Australia Migratory Bird Agreement (CAMBA), and the Convention on Conservation of Migratory
Species of Wild Animals (Bonn Convention).
There are 10 migratory marine bird species, two species of migratory mammals (dugongs and
humpback whales) and seven migratory reptiles (e.g. marine turtles and saltwater crocodiles) found
within the Fitzroy region (GBRMPA 2013). The status of these species of conservation interest
depend on the life history characteristics of each group, and range from ‘very poor’ (e.g. dugongs
and loggerhead turtles) to ‘good’ (e.g. humpback whales and crocodiles).
Many islands in the Fitzroy region are important marine turtle nesting sites: Peak Island, Curtis Island
and the cays of the Capricorn-Bunker Group; and offshore islands and cays that provide critical
nesting habitat for seabirds (GBRMPA 2013). Globally important populations of loggerhead (Caretta
caretta), green (Chelonia mydas), hawksbill (Eretmochelys imbricata) and flatback (Natator
depressus) turtles nest on the islands of the Fitzroy region and forage in nearby waters (Hamann et
al. 2007).
Water quality influences
The Fitzroy River drains the single largest area (approximately 143,000 km2) of the GBR catchments
and discharges into the largest estuary of the GBR (~60 km in length) and then into Keppel Bay. Due
to catchment geomorphology and land-use activities, pollutant loads of the Fitzroy Basin rivers are
one of the largest sources of suspended sediment to the GBR lagoon, as well as delivering significant
loads of pesticides and nutrients (Brodie et al. 2013a). Concentrations of particulate water quality
variables such as TSS, N and P, chlorophyll a as well as Secchi depth (a measure of water clarity) have
increased in the coastal and inshore areas compared to the offshore lagoon (Brodie et al. 2007;
De’ath & Fabricius 2008; De’ath & Fabricius 2010; Fabricius et al. 2013a; Logan et al. 2014). This
decreased water quality is linked to greatly increased discharges of fine suspended sediment,

20
nutrients and pesticides in the period since about 1830 following agricultural development and
associated land clearing in the catchments.
It is estimated that TSS loads from the Fitzroy Basin are now about three times higher than pre-1830
(depending on estimation methodology) (Kroon et al. 2012; Carroll et al. 2012; Dougall et al. 2014;
Waters et al. 2014). Dissolved inorganic nitrogen (DIN) is estimated at two times higher, dissolved
inorganic phosphorus (DIP) two times higher, particulate phosphorus (PP) three times higher, and
particulate nitrogen (PN) two times higher. Large uncertainties remain in the estimates of increases
in current loading compared to pre-European loads due to the uncertainty with estimating pre-
European loads. However, more recent results from source catchments modelling in the Paddock to
Reef Program (Carroll et al. 2012; Waters et al. 2014; Dougall et al. 2014) are considered robust.
Coral geochemical records (Ba/Ca and Y/Ca ratios: proxies of sediment loads) from the Keppel
Islands reveal the influence of the Fitzroy River on the Keppel Island fringing reefs. In particular,
coral Ba/Ca ratios displayed very high spikes that were 2 to 14-fold higher than baseline levels after
1950, which coincides with the clearing of the Brigalow country (Rodriguez-Ramirez 2013). The
sediment derived from Tertiary basalt and Thompson Fold Belt sources are preferentially
transported through the Fitzroy River catchment and into the GBR lagoon, with the Nogoa and
Comet catchments likely to be delivering much higher sediment loads (Lewis et al. 2015). Fine-
grained (<16 µm) suspended sediment delivered from the Fitzroy River during moderate to large
events likely travels the longest distance in the marine environment and impinges on coral reefs and
seagrass meadows in the southern GBR (Lewis et al. 2015).
Suspended sediment and nutrient discharges from the Fitzroy Basin originating from agricultural
activities (Packett et al. 2009) have been shown to extend for hundreds of kilometres from the river
mouth, generally to the north but also less frequently offshore to the Capricorn-Bunker Island Group
(Byron & O’Neill 1992,; Brodie & Mitchell 1992). The plumes impact directly on the Keppel Island
reefs (Packett 2007) with severe effects. The plumes in extreme flow years such as 1991 and 2011,
with their low salinity water, fine sediment and nutrient content caused massive mortality in shallow
reef biota, including mortality to corals (Tan et al. 2012) but also much of the benthic biota such as
molluscs, algae, soft corals, sponges and bryozoans (Coates 1992,; van Woesik et al. 1995,; Jones &
Berkelmans 2014).
Inshore water quality has declined due to the influence of the Fitzroy River floods but was still
assessed as ‘good’ by the MMP (Thompson et al. 2013). Changes in inshore water quality have been
driven by relatively large fluctuations in chlorophyll a compared to total suspended solids (TSS).
Chlorophyll a was rated as ‘very poor’ in both 2011–12 and 2012–13 and exceeded the Water
Quality Guidelines (GBRMPA 2010) for a significant period in both the dry and wet seasons. TSS was
rated as ‘moderate’ in 2011–12 and 2012–13, though concentrations exceeded the Water Quality
Guidelines for periods during both the dry and wet seasons in 2012–13 (State of Queensland 2014).
However, it is now clearly understood that chlorophyll a and TSS concentrations derived from the
remote sensing algorithms used in the MMP are highly unreliable based on a remote sensing
evaluation (Waterhouse et al. 2015a) that found that assessments for chlorophyll and TSS have low
confidence (Maynard et al. 2015; Petus et al. 2015).

21
Pesticide monitoring identified tebuthiuron as the only pesticide that exceeded the Water Quality
Guidelines at a routine monitoring site at North Keppel Island, which also exceeded the Australian
and New Zealand Environment Conservation Council (ANZECC) and Agriculture and Resources
Management Council of Australia and New Zealand (ARMCANZ) Interim Working Level for marine
waters guidelines. Tebuthiuron is used by the grazing industry and is typically found at elevated
concentrations in the Fitzroy region due to the high proportion of land used for grazing activities. A
range of other pesticides detected in the Fitzroy region from 2002 to 2013 included atrazine and its
breakdown products, diuron, hexazinone, simazine, ametryn, prometryn and metolachlor (Packett et
al. 2009; State of Queensland 2014).
Cumulative disturbances and ecological responses
In the summer of 2012–13, ex-TC Oswald delivered above-average rainfall to the GBR catchment.
This system tracked down the coast and flooded many rivers from Cairns to Bundaberg, including
the Fitzroy River in Rockhampton. The Calliope, Boyne and Burnett rivers also had above-median
discharge in 2012–13 (State of Queensland 2014). The flooding effects of ex-TC Oswald severely
impacted producers in the Fitzroy region, and caused damage to coral reefs and seagrass meadows.
In addition, ex-TC Tasha in 2010–11 and TC Marcia in 2015 affected marine and coastal
environments in the Fitzroy region. These have likely contributed to the ‘poor’ marine ecosystem
condition in the Fitzroy region.
The impacts of poor water quality on coral reefs and seagrass beds can manifest as either acute,
short-term changes associated with high-nutrient, high-sediment, low-salinity flood plumes, or more
chronic impacts associated with changes in long-term water quality conditions (Devlin et al. 2012).
Large-scale mortality events associated with flooding have been documented for coral reefs in the
Fitzroy region (van Woesik et al. 1995; Berkelmans et al. 2012; Jones & Berkelmans 2014) and
seagrass meadows (McKenzie et al. 2010; McKenzie et al. 2014). Chronic exposure to increased
concentrations of nutrients, turbidity and sedimentation can affect the recovery potential and
resilience of some species (Fabricius 2011; Thompson et al. 2013). Reduced water quality including
decreased clarity, increased nutrient status (nitrification) and increased pesticide concentrations, is
therefore likely to lower reef resilience through three mechanisms: (1) bottom-up enhancement of
macroalgal growth (Schaffelke 1999; De’ath & Fabricius 2010), (2) negative impacts on coral
physiology (Fabricius et al. 2013b; Flores et al. 2012), and (3) loss of top-down control of macroalgal
abundance through loss or displacement of herbivores.
Other pressures also affect the marine and coastal assets of the Fitzroy region, including COTS
outbreaks, coastal development and port activities, severe storms, and thermal stress. The Swain
Reefs in the Fitzroy region have had low-level chronic COTS infestations throughout most of the past
three decades, which may be explained by the high density of available coral and upwelling of
nutrients through regional oceanography (Thompson et al. 2013). A primary outbreak of COTS was
also recorded in the southern Capricorn-Bunker Group in 2008 and peaked in 2014; however, it does
not appear to be correlated with flooding (Miller et al. 2015). In the Fitzroy region urban expansion
is occurring along the Capricorn Coast from Yeppoon to the south of Emu Park and around the main
regional centres of Rockhampton and Gladstone. Further inland towns and regional centres such as

22
Emerald continue to expand cyclically at a rate driven principally by coal mining and gas extraction
activities (Gunn 2015).
Both the Port of Gladstone and the smaller Port of Rockhampton (situated in the Fitzroy River Delta
at Port Alma) are within the Fitzroy Basin region. The Port of Gladstone was recently expanded to
facilitate the new liquefied natural gas (LNG) facilities and increase port access by deepening,
widening and creating new shipping channels to the Western Basin10. Future developments are
proposed for the Port of Gladstone including a Channel Duplication Project to allow for two-way
passage for ships11 and land reclamation for a Fishermans Landing expansion project12. Proposals for
large-scale development of the Port of Rockhampton to accommodate increased coal exports have
recently been suspended13,14.
Periods of higher-than-normal sea surface temperature are stressful to corals and caused severe and
spatially-extensive coral bleaching events in the GBR in 1998 and 2002 (Hoegh-Guldberg et al. 2007).
These previous mass bleaching events impacted reefs over broad areas of the GBR but had little
impact on reefs in the Keppel Islands in terms of mortality (Berkelmans et al. 2004; Diaz-Pulido et al.
2009). However, Keppel Island reefs experienced significant local thermal bleaching in 2006 that
affected 95% of Scleractinian corals and resulted in 15% mortality (Diaz-Pulido et al. 2009).
Subsequent surveys recorded coral cover increasing post-bleaching, demonstrating the resilience of
hard corals in this region to these events (Sweatman et al. 2008). Thermal stress has also been linked
to increased frequency of coral diseases (Selig et al. 2006; Bruno et al. 2007) as well as elevated
nutrients (Bruno et al. 2003; Haapkyla et al. 2011). The incidence of coral disease on inshore reefs in
the Fitzroy region has shown distinct peaks; the first associated with the coral bleaching event in
2006, while subsequent high levels of disease followed extreme flood events in 2010 and 2011
(Thompson et al. 2013).
Tropical seagrasses can also be impacted by prolonged periods of above-average sea temperatures,
as they prefer water temperatures of 25–35°C. When sea temperatures rise to 35–40°C,
photosynthesis declines due to the breakdown of photosynthetic enzymes (Ralph 1998) and can
result in reduced growth rates (Waycott et al. 2011).
The species that depend on coral reef and seagrass habitats can also be affected by these
disturbances directly. For example, there was a high incidence of marine turtle strandings after the
2011 and 2012 flood events (Queensland StrandNet Data 2015); and poor seabird foraging in the
Capricorn-Bunker Group during intense ENSO conditions (Devney et al. 2010). Effects can also be
caused indirectly due to habitat loss, for example, high dugong mortality during the 2011 and 2012
flood events (Queensland StrandNet Data 2015). Fish assemblages have also been shown to decline
in response to loss of coral habitat (Halford et al. 2004; Yahya et al. 2011; Wilson et al. 2009;
10 http://www.westernbasinportdevelopment.com.au/. Accessed May 2015. 11 http://www.gpcl.com.au/OperationsDevelopment/ChannelDuplicationProject.aspx. Accessed May 2015. 12 http://www.gpcl.com.au/OperationsDevelopment/FishermansLandingExpansion.aspx. Accessed May 2015. 13 http://www.statedevelopment.qld.gov.au/assessments-and-approvals/balaclava-island-coal-export-terminal.html. Accessed May 2015. 14 http://www.statedevelopment.qld.gov.au/assessments-and-approvals/fitzroy-terminal-project.html. Accessed May 2015.

23
Williamson et al. 2014). Conversely, some marine species can benefit from intense flood events, as
there are ecological benefits of rainfall and flood events when considering assets that rely on
connected catchment to reef ecosystems such as fish stocks, waterways and wetland-associated
vegetation. Floods are naturally occurring and have a role in maintaining ecosystem health and
mobile species that rely on connected environments for breeding, such as barramundi and prawns,
can benefit with improved reproductive success (Vance et al. 1998; Halliday et al. 2011).
Overall, the changing climate as observed and predicted within the GBR will increase the frequency
with which coral reefs, seagrass meadows, and coastal wetlands are being disturbed by extreme
events such as floods, tropical cyclones and thermal stress. Response to and recovery after these
acute events will be exacerbated by chronic poor water quality, which also influences other drivers
of ecosystem condition such as COTS outbreaks and disease. The magnitude of impacts and the
ability of ecosystems to recover from these events or transition to an alternative state, will depend
on their condition prior to the disturbance, chronic environmental pressures, such as water quality,
and the return period between events compared with recovery time (Johnson et al. 2013).
Current status and trends
Assessment of the current status of key marine and coastal assets in the Fitzroy Basin region has
identified a number of assets that are in poor or very poor condition. These include inshore coral
reefs, inshore and reef seagrass meadows, dugong, turtles, dolphins, low-lying islands, and species
of climate-sensitive seabirds (Table 2.2).

24
Table 2.2. Assessment matrix summarising the current status of and threats to coastal and marine assets in the Fitzroy region. Where: ■ = very good, ■ = good, ■ = moderate, ■ = poor, ■ = very poor.
Asset Value/service Status* Trends Pressures/threats
Inshore coral reefs
Tourism, critical habitat, coastal protection and stabilisation
Very poor Declines due to TC Hamish and flooding in 2010–11, 2013; Coral cover 20%; Limited recovery
Elevated sediment and pesticides, turbidity, freshwater inputs, coastal development/ports, extreme weather (i.e. tropical cyclones, floods), increasing SST (coral bleaching), ocean acidification
Mid-shelf and offshore coral reefs
Reef tourism, critical habitat, coastal protection
Poor Declines due to TC Hamish; Coral cover 10–30%; Signs of recovery
COTS, extreme weather (i.e. tropical cyclones), increasing SST (coral bleaching), ocean acidification
Inshore seagrass meadows
Critical habitat (especially for dugong), coastal stabilisation, nutrient cycling
Very poor Declines due to high turbidity and flooding in 2010–11, 2013; Signs of recovery
Elevated sediment, turbidity, low tide exposure, coastal development/ports, extreme weather (floods, cyclones)
Mid-shelf and offshore (reef) seagrasses
Critical habitat, nutrient cycling, part of reef matrix
Poor Recent declines due to low tide exposure; Signs of recovery
Extreme weather (cyclones)
Coastal wetlands Critical habitat, coastal protection and stabilisation, nutrient cycling, aquatic ecosystem protection
Very good to poor (Wetland-dependent)
Localised declines in wetland extent; Impacts of catchment activities on water quality
Elevated sediment, nutrients and pesticides, introduced pests and weeds, coastal development, extreme weather (i.e. tropical cyclones, floods, storm surges), sea level rise
Island environments
Tourism income, critical habitat (especially for seabirds and turtle nesting)
Moderate Changes to island vegetation and area
Human disturbance, introduced pests, extreme weather (i.e. tropical cyclones), sea level rise, changing rainfall patterns
Dugong Tourism income, cultural importance, ecosystem role
Very poor Significant declines due to flooding events in 2010–11, 2013
Declining seagrass condition, human disturbance/interactions, vessel strikes
Marine turtles Tourism income, cultural importance, ecosystem role
Moderate (Poor for some species that nest on low-lying cays)
Stable Human disturbance/interactions, declining nesting island condition, increasing air/sand temperatures
Fish/sharks Commercial and recreational fisheries, herbivore grazing macroalgae, apex predators
Species-dependent
Species-dependent
Declining habitat condition, unsustainable fishing practices, increasing SST

25
Asset Value/service Status* Trends Pressures/threats
Cetaceans Tourism income, iconic megafauna, apex predators
Species-dependent (consider conservation status)
Stable Human disturbance/interactions, reduced prey availability, declining habitat condition
Seabirds Tourism income, iconic fauna, apex predators
Species-dependent (consider conservation status)
Stable or some species in decline (e.g. common noddy)
Human disturbance/interactions, reduced prey availability, declining habitat condition
* Status based on semi-quantitative assessment, e.g. RWQPP report card five-point scoring system or
expert judgement where not available.
Pressures in blue are those that are beyond the scope of the WQIP.
The threats identified in Table 2.2 indicate that declines are likely to continue for some marine and
coastal ecosystems and species due to the cumulative pressures of poor water quality, COTS
outbreaks, climate change and coastal development. It is for this reason that addressing chronic
stressors caused by human activities, like degraded water quality, are important for maintaining and
improving ecosystem condition. Improving water quality can decrease the sensitivity of corals and
seagrasses to episodic disturbances when they occur, and improve recovery post-disturbance
(Wiedenmann et al. 2012; Thompson et al. 2013). The events of recent years have shown that
disturbances can occur in some areas every year for consecutive years and can even occur during
the same year. As the return period between intense disturbances is predicted to decrease (Climate
Commission 2013), recovery will depend on maintaining ecological resilience and minimising chronic
pressures such as poor water quality.
Wenger et al. (2015) postulated that fringing reefs of the Keppel Islands have reduced resistance to
withstand repeated exposures of river flood plumes and associated constituents from the Fitzroy
River. From a longer-term perspective, Rodriguez-Ramirez (2013) showed little variation in the living
and dead coral assemblages of the Keppel Island fringing reefs. In fact, the coral death assemblages
were all linked to disturbance events over the past three decades, suggesting that these reefs are
well-adapted and resilient to periodic discharge from the Fitzroy River (Rodriguez-Ramirez 2013).
2.3 Pollutant sources
2.3.1 Key pollutants and sources
The largest sources of pollutants to the GBR are from agricultural land uses (Waters et al. 2014);
however, other sources include point sources such as intensive animal production, manufacturing
and industry, mining, rural and urban residential, transport and communication, waste water
treatment and disposal, ports and shipping. Compared to diffuse sources, most contributions of such
point sources are relatively small but could be locally and over short time periods highly significant.

26
Point sources are associated with regulated activities (termed ‘environmentally relevant activities’ or
ERAs) that have strict regulations regarding their waste outputs, particularly water quality.
Losses of different types of pollutants are typically associated with different land uses in the GBR
catchments (Kroon et al. 2013). For example, grazing landscapes, primarily in the Fitzroy and
Burdekin catchments, contribute 75% of the total suspended solids load to the GBR. Dryland
cropping can also generate high loads of sediment per unit area (Packett et al. 2009). Urban
development sites can be local high impact sources of suspended sediment (e.g. Rohde et al. 2008).
Mining may also contribute to erosion and TSS loads (Lucas et al. 2010), but this is an under-
researched area in the GBR context. A strong relationship exists between the areas of nitrogen-
fertilised land use in a catchment and the average dissolved inorganic nitrogen (DIN) concentration
during high flow conditions, implicating fertiliser residues as the source of DIN. Concentrations of
pesticides in waterways are highest in areas of intensive agricultural activity including sugar cane
and to a lesser extent, dryland cropping (Waters et al. 2014). Of the herbicide residues most
commonly found in surface waters in the GBR region, diuron, atrazine, ametryn, hexazinone derive
largely from areas of sugar cane cultivation, while tebuthiuron is derived from rangeland beef
grazing areas. The distribution of land uses in the region therefore has an important influence on
regional priorities for water quality management.
The 2013 Reef Report Card Source Catchment modelled end-of-catchment baseline (2008) pollutant
load estimates15 for the Fitzroy region (derived from Dougall et al. 2014) to describe pollutant loads
by land use and basin so that management priorities can be determined within the region. The three
different types of loads presented here include the total baseline and anthropogenic baseline loads
(total baseline — predevelopment) (based on management data as at July 2008) and Report Card
2013 loads (representing management as at July 2013). All loads are generated from the same static
climate period (1986–2009) and the same land use (2009). The results indicate that a large
proportion of the total load is derived from anthropogenic changes, with the following proportions
of anthropogenically derived loads: total suspended solids (TSS) 72%, dissolved inorganic nitrogen
(DIN) 4%, dissolved inorganic phosphate (DIP) 8%, Photosyntheses II inhibiting herbicide (PSII
herbicide) 100%, particulate nitrogen (PN) 76% and particulate phosphorous (PP) 77%.
Within the Fitzroy region, the Fitzroy Basin is the highest contributor for all constituents,
contributing at least 87% of the total regional load for each constituent, and is also the largest basin
at more than 142,000 km2 (the second largest basin is Shoalwater at 3,601km2). Approximately 85%
of the Fitzroy Basin is used for grazing. The differences in load contributions between the Styx,
Shoalwater, Water Park, Calliope and Boyne basins are relatively small. However, of these basins,
the Styx Basin is the highest contributor to all constituents except for PSII herbicide toxic equivalent
loads in the Boyne Basin, which are slightly higher; however, this result is based on limited
monitoring results. The Styx Basin is 80% grazing land use.
The key findings for each constituent are summarised below.
15 The estimates are based on the 2008 baseline estimates ran in 2013 for Report Card 4 and 5.

27
TSS: The Fitzroy Basin contributes 89% of the total regional TSS load, and the greatest anthropogenic
TSS load in the region, estimated at 1,300 kilotonnes per year. The anthropogenic contribution
accounts for 67% of the total regional load. All other basins in the region each contribute less than
3% of the regional anthropogenic load (Figure 2.8), with the greatest contribution from the Styx
Basin (2.8%). The lowest contributions are from the Water Park and Boyne basins. In comparison to
all other GBR basins, the Fitzroy Basin is the second largest contributor of TSS to the total GBR TSS
load (20%). In comparison to other NRM regions, the Fitzroy region contributes 23% of the total GBR
TSS load.
Grazing (open and closed) are the greatest contributors of TSS load to export by land use comprising
approximately 60% of the total TSS exported (see Table 2.3 and Figure 2.9).
Dryland cropping is the next largest contributor at only 7%, and is important in the Central Highlands
and the Callide Valley.
Figure 2.8. Annual load estimates for TSS from the basins in the Fitzroy region. The graphs show (a) Total
(2008) and anthropogenic loads (2008) (in kilotonnes), and (b) the proportion that the anthropogenic TSS from
each basin contributes to the regional Total TSS Load.

28
Table 2.3. Land use contribution to total TSS loads for the basins of the Fitzroy region.
Total TSS exported load, kilotonnes per year
Basin Grazing Forested
Grazing Open
Dryland Cropping
Irrigated Cropping
Forestry Horticulture Sugarcane Urban Conservation Stream Other Total
Styx 23.8 29.2 0.2 0.0 1.8 0.0 0.0 0.0 2.9 10.1 0.0 68.1
Shoalwater 13.6 16.0 0.0 0.0 0.2 0.0 0.0 0.0 18.0 5.2 0.0 53.0
Water Park Creek
3.8 3.6 0.0 0.2 4.9 0.1 0.0 0.8 18.0 0.6 0.1 32.2
Fitzroy 345.1 723.8 142.5 14.4 42.1 0.4 0.2 1.0 37.7 435.3 1.0 1743.4
Calliope 16.3 16.9 0.0 0.0 1.6 0.0 0.0 0.3 1.5 7.5 0.2 44.3
Boyne 5.1 1.8 0.0 0.0 0.3 0.0 0.0 0.1 1.0 2.5 0.1 10.9
Total 407.7 791.4 142.7 14.6 50.9 0.5 0.2 2.1 79.2 461.1 1.4 1,951.9

29
Figure 2.9. Total TSS loads by land use for each basin in the Fitzroy NRM region. Source: Derived from Dougall et al. (2014).

30
DIN: The Fitzroy Basin contributes 87% of the total regional DIN load, and the greatest anthropogenic
DIN load in the region, estimated at 48 tonnes per year. However, the anthropogenic contribution
accounts for only 4% of the total regional load. In the model, all other basins in the region contribute
very small amounts of the regional anthropogenic load (reported as 0 tonnes in the model; Figure 2.10);
however, this requires further investigation as there are cropping areas that are fertilised and sewage
treatment plants in these basins that are likely to contribute some DIN load. In comparison to other
NRM regions, the Fitzroy region has the third largest total DIN load (11% of total GBR load).
Figure 2.10. Annual load estimates for DIN from the basins in the Fitzroy region. The graphs show (a) Total (2008)
and anthropogenic loads (2008) (tonnes), and (b) the proportion that the anthropogenic DIN from each basin
contributes to the regional Total DIN Load.
PSII herbicides (toxic equivalent load): The Fitzroy Basin contributes 99% of the total regional PSII
herbicide toxic equivalent load, estimated at 119 kg per year. In the model, all other basins in the region
do not contribute detectable equivalent loads to the regional anthropogenic load (except for the Boyne
Basin reported as <1kg) (Figure 2.11). In comparison to other NRM regions, the Fitzroy region
contributes <2% of the total GBR PSII herbicide toxic equivalent load.
Figure 2.11. Annual load estimates for PSII herbicide toxic equivalent loads from the basins in the Fitzroy region.
The graphs show (a) anthropogenic loads (2008) (in kilograms), and (b) the proportion that these contributes to the
regional total.

31
PN: The Fitzroy Basin contributes 88% of the total regional PN load, and the greatest anthropogenic PN
load in the region, estimated at 802 tonnes per year. The anthropogenic contribution accounts for 90%
of the total regional load. All other basins in the region each contribute less than 4% of the regional
anthropogenic load (Figure 2.12). The lowest contributions are from the Water Park and Boyne basins.
In comparison to other NRM regions, the Fitzroy region has the third largest total PN load (10% of total
GBR load).
Figure 2.12. Annual load estimates for Particulate Nitrogen (PN) from the basins in the Fitzroy region. The graphs
show (a) Total (2008) and anthropogenic loads (2008) (tonnes), and (b) the proportion that the anthropogenic PN
from each basin contributes to the regional Total PN Load.
DIP: The Fitzroy Basin contributes 88% of the total regional DIP load, and the greatest anthropogenic DIP
load in the region, estimated at 20 tonnes per year. The anthropogenic contribution accounts for 95% of
the total regional load. All other basins in the region each contribute less than 4% of the regional
anthropogenic load (Figure 2.13). In the model, all other basins in the region contribute very small
amounts of the regional anthropogenic load (reported as 0 tonnes in the model; Figure 2.13); however,
as for DIN, there is low confidence in this result given our knowledge of land uses in these basins. In
comparison to other NRM regions, the Fitzroy region has the second largest total DIP load (24% of total
GBR load).
Figure 2.13. Annual load estimates for Dissolved Inorganic Phosphorus (DIP) from the basins in the Fitzroy region.
The graphs show (a) Total (2008) and anthropogenic loads (2008) (tonnes), and (b) the proportion that the
anthropogenic DIP from each basin contributes to the regional Total DIP Load.

32
PP: The Fitzroy Basin contributes 90% of the total regional PP load, and the greatest anthropogenic DIP
load in the region, estimated at 542 tonnes per year. The anthropogenic contribution accounts for 93%
of the total regional load. All other basins in the region each contribute less than 4% of the regional
anthropogenic load (Figure 2.14). The lowest contributions are from the Water Park and Boyne basins.
In comparison to other NRM regions, the Fitzroy region has the third largest total PP load (17% of total
GBR load).
Figure 2.14. Annual load estimates for Particulate Phosphorus (PP) from the basins in the Fitzroy region. The graphs
show (a) Total (2008) and anthropogenic loads (2008) (tonnes), and (b) the proportion that the anthropogenic PP
from each basin contributes to the regional Total PP Load.
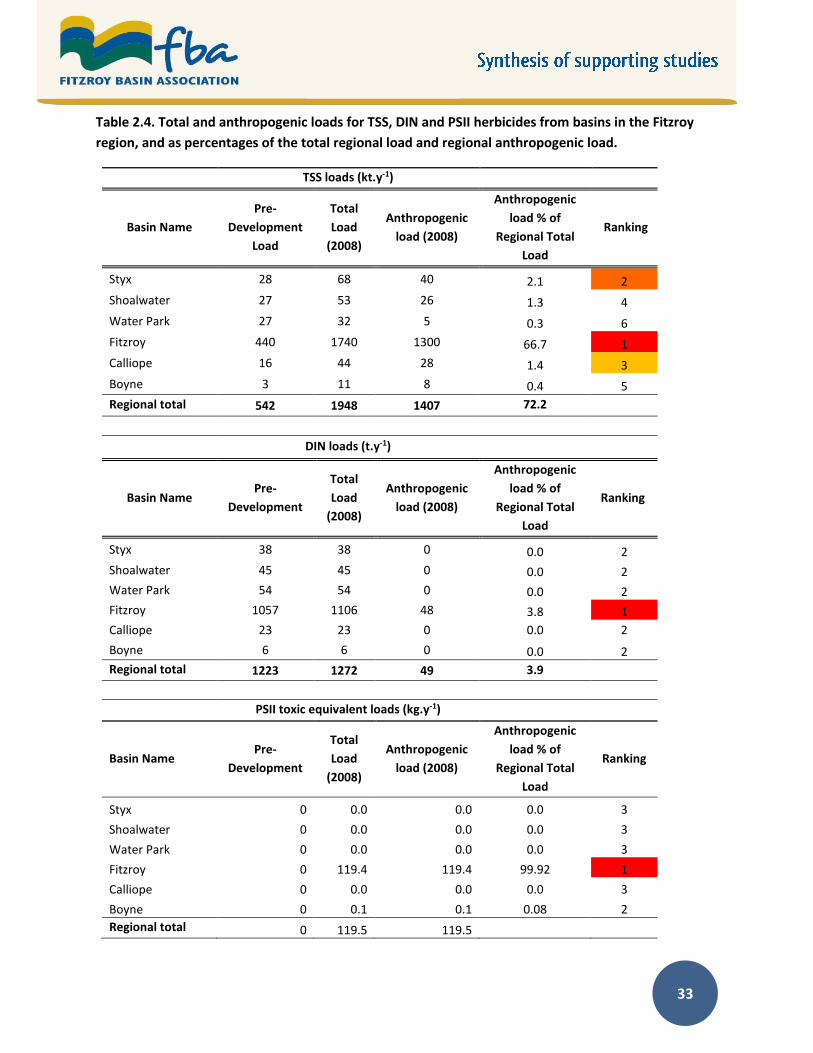
33
Table 2.4. Total and anthropogenic loads for TSS, DIN and PSII herbicides from basins in the Fitzroy
region, and as percentages of the total regional load and regional anthropogenic load.
TSS loads (kt.y-1)
Basin Name
Pre-
Development
Load
Total
Load
(2008)
Anthropogenic
load (2008)
Anthropogenic
load % of
Regional Total
Load
Ranking
Styx 28 68 40 2.1 2
Shoalwater 27 53 26 1.3 4
Water Park 27 32 5 0.3 6
Fitzroy 440 1740 1300 66.7 1
Calliope 16 44 28 1.4 3
Boyne 3 11 8 0.4 5
Regional total 542 1948 1407 72.2
DIN loads (t.y-1)
Basin Name Pre-
Development
Total
Load
(2008)
Anthropogenic
load (2008)
Anthropogenic
load % of
Regional Total
Load
Ranking
Styx 38 38 0 0.0 2
Shoalwater 45 45 0 0.0 2
Water Park 54 54 0 0.0 2
Fitzroy 1057 1106 48 3.8 1
Calliope 23 23 0 0.0 2
Boyne 6 6 0 0.0 2
Regional total 1223 1272 49 3.9
PSII toxic equivalent loads (kg.y-1)
Basin Name Pre-
Development
Total
Load
(2008)
Anthropogenic
load (2008)
Anthropogenic
load % of
Regional Total
Load
Ranking
Styx 0 0.0 0.0 0.0 3
Shoalwater 0 0.0 0.0 0.0 3
Water Park 0 0.0 0.0 0.0 3
Fitzroy 0 119.4 119.4 99.92 1
Calliope 0 0.0 0.0 0.0 3
Boyne 0 0.1 0.1 0.08 2
Regional total 0 119.5 119.5

34
Table 2.5. Total and anthropogenic loads for PN, DIP and PP loads from basins in the Fitzroy region,
and as percentages of the total regional load and regional anthropogenic load.
PN loads (t.y-1)
Basin Name Pre-
Development
Total
Load
(2008)
Anthropogenic
load (2008)
Anthropogenic
load % of Regional
Total Load
Ranking
Styx 25 60 35 3.0 2
Shoalwater 9 25 16 1.4 4
Water Park 8 18 10 0.8 5
Fitzroy 233 1035 802 67.9 1
Calliope 11 34 23 1.9 3
Boyne 2 10 8 0.7 6
Regional total 288 1181 893 75.6
DIP loads (t.y-1)
Basin Name Pre-
Development
Total
Load
(2008)
Anthropogenic
load (2008)
Anthropogenic
load % of Regional
Total Load
Ranking
Styx 7 8 0 0.0 2
Shoalwater 9 9 0 0.0 2
Water Park 10 10 0 0.0 2
Fitzroy 225 245 20 7.2 1
Calliope 4 4 0 0.0 2
Boyne 1 1 0 0.0 2
Regional total 257 278 21 7.6
PP loads (t.y-1)
Basin Name Pre-
Development
Total
Load
(2008)
Anthropogenic
load (2008)
Anthropogenic
load % of Regional
Total Load
Ranking
Styx 12 29 17 2.2 2
Shoalwater 3 10 7 0.9 4
Water Park 4 6 2 0.3 6 Fitzroy 145 687 542 71.4 1
Calliope 8 21 13 1.7 3
Boyne 1 4 4 0.5 5
Regional total 174 759 585 77.1

35
Urban land uses contribute a large range of pollutants including TSS, nutrients, pesticides and toxicants
such as heavy metals, hydrocarbons and pharmaceuticals. Overall, urban land uses contribute less than
10% of the total regional load for all constituents. In the Fitzroy region urban expansion is occurring
along the Capricorn Coast from Yeppoon to the south of Emu Park and around the main regional centres
of Rockhampton and Gladstone.
Sewage discharges can be relevant at a local scale. There are several sewage treatment plants (STP) in
the Fitzroy region that discharge into the GBRWHA or adjacent waterways. The loads for these
treatment plants are estimated in Table 2.6, and are based on an assessment by Dougall et al. (2014)
where it is estimated that ~79% of the Total Nitrogen and Total Phosphorus is in dissolved inorganic
form.
Table 2.6. Examples of major sewage treatment plants in the Fitzroy region.
Name of STP Discharge point
Catchment EP DIN (kg/yr)
DON (kg/yr)
DIP (kg/yr)
DOP (kg/yr)
Yeppoon Sewage Treatment Plant
Corduroy Creek
Water Park Creek
10,000-50,000
788 210
North Rockhampton Sewage Treatment Plant
Fitzroy River Fitzroy River 10,000-50,000
24,989 6,643 19,710 5,559
South Rockhampton Sewage Treatment Plant
Fitzroy River Fitzroy River 10,000-50,000
29,801 7,922 10,960 3,091
West Rockhampton Sewage Treatment Plant
Fitzroy River Fitzroy River 10,000-50,000
9,112 2,422 3,049 860
TOTAL 64,690 17,197 33,719 9,510
2.3.2 Priority basins for reducing pollutant run-off
The relative risk of degraded water quality among the basins in the Fitzroy region was determined by
combining information on the estimated ecological risk of water quality to coral reefs and seagrass
meadows in the region with end-of-catchment pollutant loads. The framework was based on that
developed for the GBR-wide relative risk assessment conducted by Brodie et al. (2013a) to inform Reef
Plan 2013 priorities and modified where necessary to reflect issues and data availability in the Fitzroy
region. There are also several improvements to the input data compared to the GBR-wide assessment,
described in Waterhouse et al. (2015), but including the definition of zones of influence for each basin in

36
an attempt to attribute marine risk back to individual basins, incorporation of the full suite of Reef Plan
pollutants, and revisions to the marine spatial assessments of pollutant conditions.
For assessment of the marine risk, a suite of water quality variables was chosen that represent the
pollutants of greatest concern with regards to land-sourced pollutants and potential impacts on coral
reef and seagrass ecosystems. These include exceedance of ecologically relevant thresholds for
concentrations of TSS from remote sensing data, chlorophyll a obtained from long-term in-situ
monitoring data, and the distribution of key pollutants including TSS, dissolved inorganic nitrogen (DIN),
particulate nitrogen (PN) and photosystem II-inhibiting herbicides (PSII herbicides) in the marine
environment during flood conditions (based on end-of-catchment loads and plume loading estimates). A
factor that represents the direct influence of COTS on coral reefs in the COTS Initiation Zone was
included in previous assessments but has been excluded here as it is not considered to be relevant to
the Fitzroy NRM region. Modelled end-of-catchment pollutant loads (generated from the Source
Catchments model framework for the Paddock to Reef Program) were obtained for each basin for key
pollutants (TSS, DIN, PSII herbicides, PN, Dissolved Inorganic Phosphorus and Particulate Phosphorus),
and only the anthropogenic portions of regional total pollutant loads were considered in relating the
relative risk to the basins. The anthropogenic load is calculated as the difference between the long-term
average annual load, and the estimated pre-European annual load. A factor representing the differential
influence of river discharges on the COTS Initiation Zone was also considered in other assessments but
not factored in here.
It should be noted that the previous GBR risk assessments also incorporated parameters to represent
assessment of the exceedance of ecologically relevant thresholds for concentrations of chlorophyll a
(Chl-a) and TSS. However, this data was obtained from remote sensing analysis and a recent study
undertaken as part of the improvements to the risk assessment method has indicated that there is low
confidence in the results in some locations (refer to Maynard et al. 2015 and Petus et al. 2015). More
detailed analysis of the relationship between Chl-a satellite results and in-situ data in the coastal zone
has revealed significant uncertainties in some locations. Until these aspects are resolved further, the
Chl-a data has been excluded from this analysis. Instead, results from in-situ chlorophyll monitoring
have been included as a measure of long-term water quality conditions (sourced from De’ath & Fabricius
2008). The TSS sourced from remote sensing analysis is still included as there was not the resources to
fully investigate the reliability of this dataset as well. However, additional qualitative assessment against
the photic depth data will be included for additional interpretation.
The information was then considered by technical experts to make conclusions about the relative risk of
degraded water quality to coral reefs and seagrass meadows among the basins in the Fitzroy region. The
marine assessment for each basin was constrained to the ‘zones of influence’ defined for the main rivers
in the Fitzroy region. The zones of influence were defined using a combination of river flow data, in situ
salinity data, and output from a highly resolved hydrodynamic model (eReefs) for the 2008–09, 2010–
11, 2011–12 and 2012–13 wet seasons (December to April inclusive) (note that the hydrodynamic model
is not available for 2009–2010). The Fitzroy River is the only river that is modelled in the region. River
plumes for each of the unmodelled rivers can only be generated where flow data is available, which
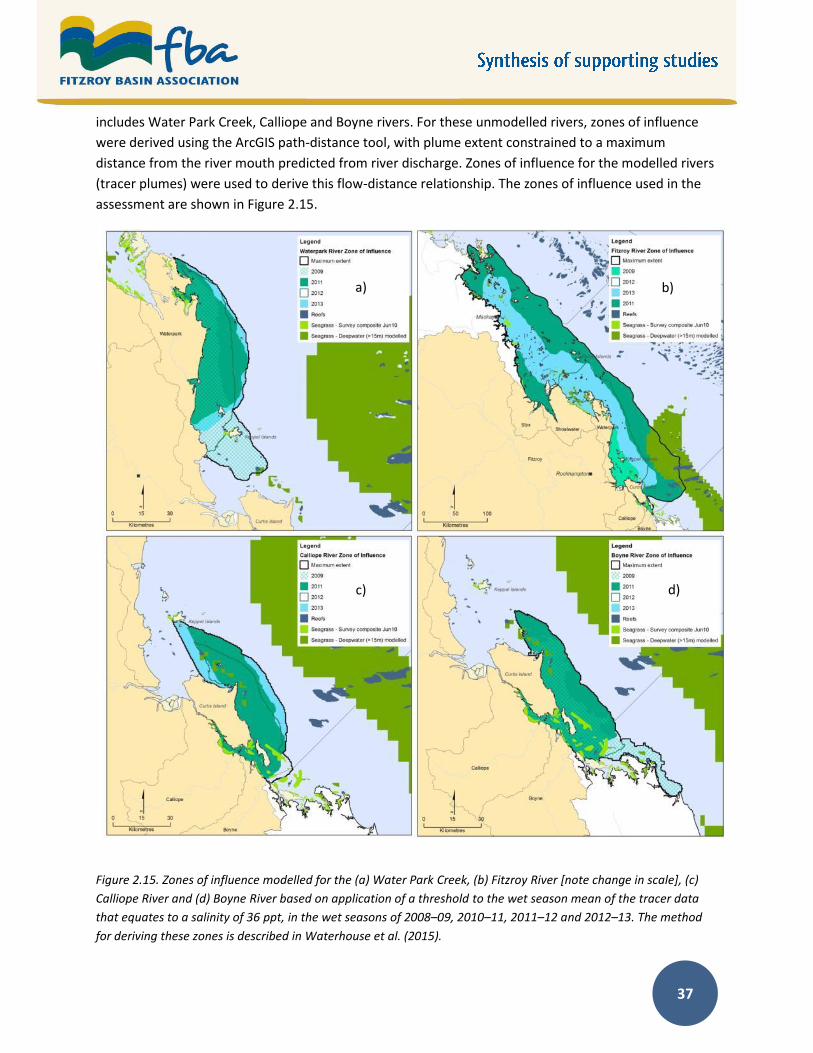
37
includes Water Park Creek, Calliope and Boyne rivers. For these unmodelled rivers, zones of influence
were derived using the ArcGIS path-distance tool, with plume extent constrained to a maximum
distance from the river mouth predicted from river discharge. Zones of influence for the modelled rivers
(tracer plumes) were used to derive this flow-distance relationship. The zones of influence used in the
assessment are shown in Figure 2.15.
Figure 2.15. Zones of influence modelled for the (a) Water Park Creek, (b) Fitzroy River [note change in scale], (c)
Calliope River and (d) Boyne River based on application of a threshold to the wet season mean of the tracer data
that equates to a salinity of 36 ppt, in the wet seasons of 2008–09, 2010–11, 2011–12 and 2012–13. The method
for deriving these zones is described in Waterhouse et al. (2015).
a)
c)
b)
d)

38
The zones represent the areas of an average distribution of wet season river plumes (described in
Waterhouse et al. 2014); however, the entire ‘zone’ is weighted equally and therefore does not factor in
a water quality gradient of distance from the river mouth. This gradient is, however, represented in the
actual water quality conditions that comprise the Marine Index described below.
The key results are summarised below (from Waterhouse et al. 2015a).
Marine risk
Figure 2.16 shows the results of the analysis for each marine variable, summarised in Table 2.7. The
water quality influence in the region is generally constrained to the inshore areas, with hotspot areas in
Shoalwater Bay and Keppel Bay for sediments, and Keppel Bay for nutrients. However, as noted above,
the sediment influence in Shoalwater is not believed to be linked to river discharge (Logan et al. 2014, in
press), and the area is naturally turbid due to shallow and large tidal variation. The influence of PSII
herbicides does not appear to extend in the marine environment to any significant extent, supported by
monitoring data where tebuthiuron was the only pesticide that exceeded the Water Quality Guidelines
at a North Keppel Island routine monitoring site in 2012–13 and was below the guidelines in 2013–14
(Gallen et al. 2014).
The combined assessment of the relative risk of marine water quality variables highlights that the areas
in the ‘Very High’ relative risk class were located in Keppel Bay, extending out to the Keppel Island
Group (Figure 2.17). Analysis of the zones of influence modelling indicates that the Fitzroy River has the
greatest influence on this area, appearing to occur annually. This modelling also suggests that Water
Park Creek and the Calliope River also influence the Keppel Island Group in larger flow events; however,
these rivers only contribute 1–2% of the relative combined anthropogenic loads of the Fitzroy Basin.
Nevertheless, when considering combined and cumulative impacts, it is still important to ensure that
the water quality from these basins does not decline and exert additional pressures on these receiving
environments.
The areas around Port Curtis and extending up to Curtis Island are in the High and Moderate relative risk
classes, and in this assessment, these areas were in the receiving areas of the zones of influence of the
Calliope and Boyne rivers each year. While the influence of these rivers is small in comparison to the
Fitzroy River in the context of the whole region, the Calliope and Boyne basins are important to consider
in terms of localised impacts on these receiving environments and as above, need to be managed to
prevent increasing pressure from these basins in the future.
The proportion of surveyed seagrass area in the ‘Very High’ and ‘High’ relative risk assessment classes
for each variable is greater than 66% and up to 100% for all sediment and nutrient variables. A large
proportion of this seagrass is located in Shoalwater Bay. The proportion of deepwater modelled seagrass
in the ‘Very High’ and ‘High’ assessment classes is less than 5% for all variables. While the areas of coral
reef within the highest assessment classes for individual variables and the Marine Risk Index are
relatively small, they often include highly valued tourism and recreation sites of the GBR. Examples
include the Keppel Island Group and Curtis Island.

39
Results for important habitat features in the ‘Very High’ to ‘Low’ relative risk areas of the Fitzroy region
are summarised in Table 2.8, showing the feature habitats, current condition, relative risk results and
likely rivers of influence on these habitats. The areas in the ‘Very Low’ relative areas are not considered
here. While the condition and risk categories are correlated in most cases, additional influences such as
a number of high category cyclones in recent years also has a significant impact on some habitats such
as the Capricorn Group (Johnson et al. 2015).

40
Table 2.7. Summary of the potential hotspot areas for highest relative risk for each variable in the Fitzroy NRM region.
Variable Hotspot areas
Sediment
TSS threshold exceedance 2mg/L (% valid observations)
Extends along the coastal areas, with concentrated areas in Broad Sound, Shoalwater Bay and then heading south from the Water Park Creek mouth to Curtis Island, including Keppel Bay, and south beyond the NRM region boundary. The exceedances in Broad Sound and Shoalwater Bay are likely to be naturally occurring rather than driven by river discharge (Logan et al. in press).
TSS Plume Loading (mg/L) (mean 2003–2013)
Relatively constrained and only the Low and Very Low assessment classes extend beyond the inshore area. The areas of greatest influence are in Shoalwater Bay and the coastal areas of Keppel Bay.
Nutrients
Chl long-term concentration (µg/L) (mean 1988–2006)
Within Shoalwater Bay and in a band approximately 30 km wide along the coast from Townshend Island to the southern end of the NRM region boundary. This incorporates Keppel Bay and the Keppel Island Group.
DIN Plume Loading (µg/L) (mean 2003–2013)
Relatively constrained and only the Low and Very Low assessment classes extend beyond the inshore area. Shoalwater Bay, Keppel Bay and the Keppel Island Group are in the High assessment class.
PN Plume Loading (µg/L) (mean 2003–2013)
Relatively constrained to the coast and only the Low assessment class extends beyond the inshore area. The majority of Keppel Bay, including the Keppel Island Group, is in the High assessment class.
Pesticides
PSII herbicide modelled concentration (µg/L) (2009–2011)
All of the marine areas in the Fitzroy region are in the Low, Very Low or No Risk assessment class. The areas within the Low assessment class extend from the Fitzroy River mouth into the southern areas of Keppel Bay, but only includes ~6km2 of coral reefs. A majority of the surveyed and deepwater modelled seagrass are in the No Risk assessment class.

41
Sediment Nutrient Particulate Nitrogen (top) and PSII herbicides (bottom)

42
Figure 2.16. Results of all variables presented for comparison and identification of the areas of highest relative risk from individual variables in the Fitzroy NRM region.

43
Figure 2.17. Combined assessment (1 km2 resolution) of the relative risk of water quality variables. The areas (in km2) of habitat types within each class are shown in Table 3.7. Reefs are shown in blue, surveyed seagrass (composite as at June 2010) shown in light green, deepwater modelled seagrass (>15m, 50% probability) shown in green hatch.
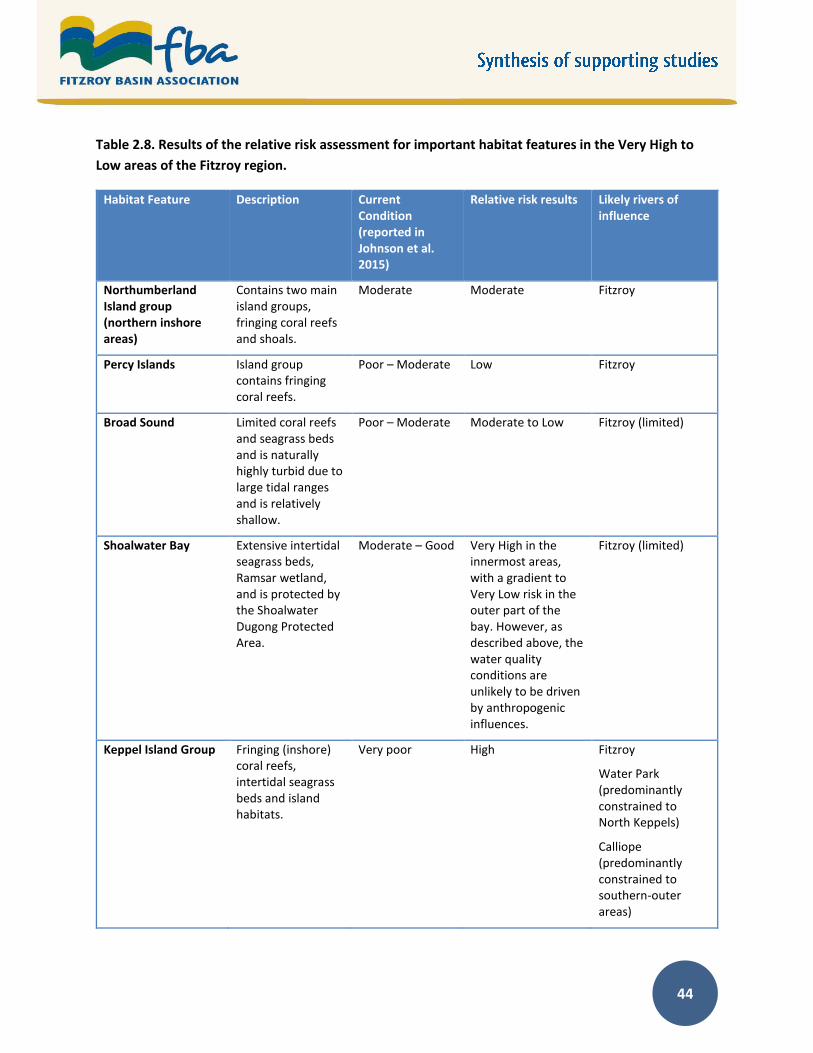
44
Table 2.8. Results of the relative risk assessment for important habitat features in the Very High to
Low areas of the Fitzroy region.
Habitat Feature Description Current Condition (reported in Johnson et al. 2015)
Relative risk results Likely rivers of influence
Northumberland Island group (northern inshore areas)
Contains two main island groups, fringing coral reefs and shoals.
Moderate Moderate Fitzroy
Percy Islands Island group contains fringing coral reefs.
Poor – Moderate Low Fitzroy
Broad Sound Limited coral reefs and seagrass beds and is naturally highly turbid due to large tidal ranges and is relatively shallow.
Poor – Moderate Moderate to Low Fitzroy (limited)
Shoalwater Bay Extensive intertidal seagrass beds, Ramsar wetland, and is protected by the Shoalwater Dugong Protected Area.
Moderate – Good Very High in the innermost areas, with a gradient to Very Low risk in the outer part of the bay. However, as described above, the water quality conditions are unlikely to be driven by anthropogenic influences.
Fitzroy (limited)
Keppel Island Group Fringing (inshore) coral reefs, intertidal seagrass beds and island habitats.
Very poor High Fitzroy
Water Park (predominantly constrained to North Keppels)
Calliope (predominantly constrained to southern-outer areas)
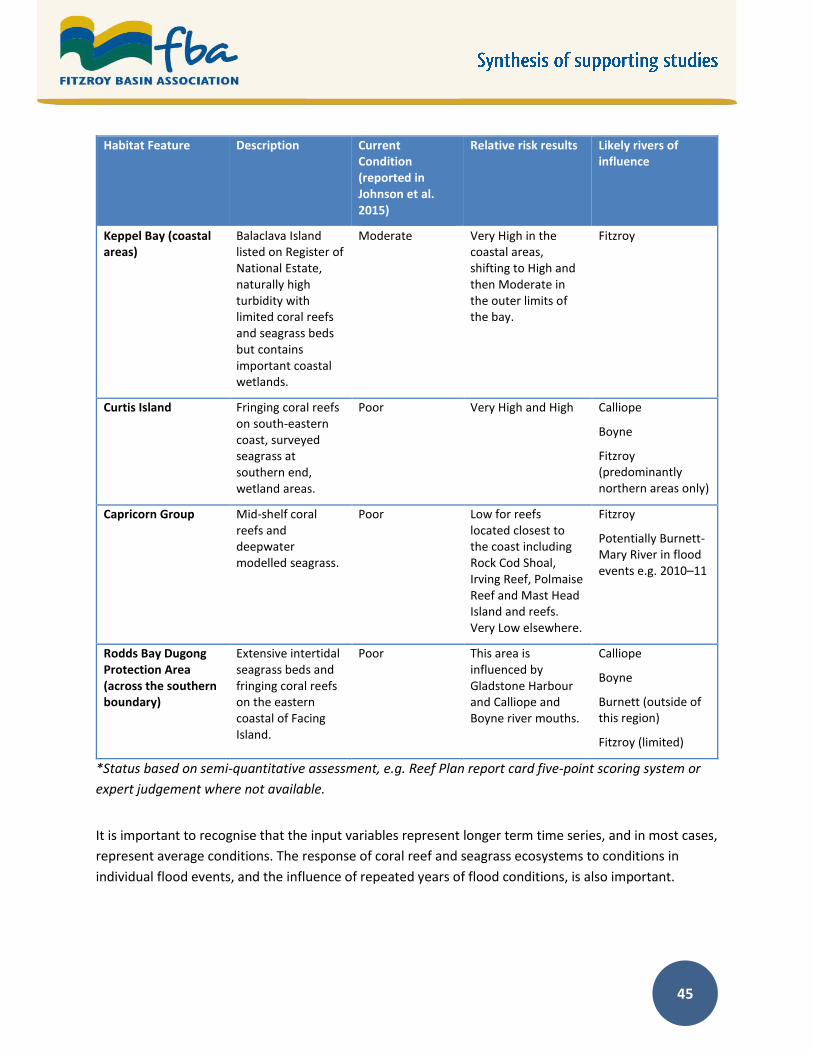
45
Habitat Feature Description Current Condition (reported in Johnson et al. 2015)
Relative risk results Likely rivers of influence
Keppel Bay (coastal areas)
Balaclava Island listed on Register of National Estate, naturally high turbidity with limited coral reefs and seagrass beds but contains important coastal wetlands.
Moderate Very High in the coastal areas, shifting to High and then Moderate in the outer limits of the bay.
Fitzroy
Curtis Island Fringing coral reefs on south-eastern coast, surveyed seagrass at southern end, wetland areas.
Poor Very High and High Calliope
Boyne
Fitzroy (predominantly northern areas only)
Capricorn Group Mid-shelf coral reefs and deepwater modelled seagrass.
Poor Low for reefs located closest to the coast including Rock Cod Shoal, Irving Reef, Polmaise Reef and Mast Head Island and reefs. Very Low elsewhere.
Fitzroy
Potentially Burnett-Mary River in flood events e.g. 2010–11
Rodds Bay Dugong Protection Area (across the southern boundary)
Extensive intertidal seagrass beds and fringing coral reefs on the eastern coastal of Facing Island.
Poor This area is influenced by Gladstone Harbour and Calliope and Boyne river mouths.
Calliope
Boyne
Burnett (outside of this region)
Fitzroy (limited)
*Status based on semi-quantitative assessment, e.g. Reef Plan report card five-point scoring system or
expert judgement where not available.
It is important to recognise that the input variables represent longer term time series, and in most cases,
represent average conditions. The response of coral reef and seagrass ecosystems to conditions in
individual flood events, and the influence of repeated years of flood conditions, is also important.

46
End-of-catchment loads
An assessment of end-of-catchment loads provides a link between the marine risk and land-based
pollutant delivery. The anthropogenic load was incorporated as a proportion of the total regional load,
as it is only the anthropogenic portion that is assumed to be the ‘manageable’ component of pollutant
loads. In the assessment of end-of-catchment pollutant loads (Section 3.4) the greatest relative
contributions of combined end-of-basin loads to the Fitzroy region is dominantly from the Fitzroy Basin,
contributing at least 87% of the total regional load for each constituent. Approximately 85% of the
Fitzroy Basin is used for grazing. Within the Fitzroy Basin, Dougall et al. (2014) identified that the
Dawson catchment generates the largest proportion of total sediment to the GBR, followed by the Isaac
and Lower Fitzroy catchments. The differences between the Styx, Shoalwater, Water Park, Calliope and
Boyne basins are relatively small. However, of these basins, the Styx Basin is the highest contributor of
all constituents (80% grazing land use). Grazing is the dominant land use across the region delivering
sediment loads to the GBR.
Combined assessment of the relative risk of degraded water quality in the Fitzroy region to
guide management priorities
Using the information obtained through the above analyses for the marine water quality variables and
end-of-basin pollutant loads, a quantitative combined assessment was completed to inform water
quality management priorities among the basins in the Fitzroy region. However, the value of this level of
assessment given the dominance of the Fitzroy River and the limitations of the data question the
relevance of this additional analysis. Accordingly, this information should only be used to guide
management decisions in conjunction with additional qualitative information (see Waterhouse et al.
2015a).
The results show that the Fitzroy River dominates the greatest risk to each habitat in terms of the
potential water quality impact from all of the assessment variables in the Fitzroy region and end-of-
catchment anthropogenic loads of TSS, DIN, PSII herbicides, PN, DIP and PP. Water Park Creek, and the
Boyne and Calliope rivers each pose less than 6% of the relative risk posed by the Fitzroy River. The
influence of the Styx and Shoalwater basins cannot be assessed as zones of influence are not available
for these basins.
From these findings, it can be concluded that the greatest risk posed to coral reefs and seagrass from
degraded water quality in the Fitzroy region is from the Fitzroy Basin. The areas that appear to be
exposed to the greatest land-based influence are Keppel Bay and the Keppel Island Group, and Port
Curtis. The Water Park Creek, Boyne and Calliope basins each pose less than 6% of the relative risk
posed by the Fitzroy River to coral reef and seagrass ecosystems in the region, and specific assessments
have not been conducted for Shoalwater or Styx basins. Nevertheless, when considering the combined
and cumulative impacts on receiving environments, it is still important to ensure that the water quality
from these basins does not decline and exert additional pressures on these receiving environments.
There are limited apparent differences between the coastal basins (excluding the Fitzroy), although
modelled results for the Styx River indicate a higher sediment load than the other coastal basins.

47
Given the dominance and large area of the Fitzroy Basin, further prioritisation between sub-catchments
within the basin is required. This has been undertaken by Star et al. (2015a) where the top 20
Neighbourhood Catchments identified as the highest risk sub-catchments for sediment management in
the region are presented under two prioritisation scenarios: for the most cost effective option and to
meet the ecologically relevant targets. This is discussed further in Section 4.
It is recognised that there are many uncertainties associated with the input datasets and method for
combining these indexes at a basin-scale at this time; further discussion is recommended prior to
making any management decisions based on these results.
Other factors
While this assessment has been limited to the influence of end-of-catchment pollutant loads on coral
reefs and seagrass, consideration of other influences including urban and port influences has also been
taken into account (these are described further by Flint et al. 2015). With the addition of these
influences, direct management of port development areas and associated activities become important
in the Calliope Basin. However, it is not within the scope of this study to compare the relative impact of
these activities with run-off from catchment land uses.
The high frequency of extreme events in the period 2008 to 2013 has also had a significant impact on
the condition and risks posed to ecosystems in the Fitzroy region. Scenarios that assess the possible
implications of these events continuing in the future are currently being assessed and are relevant to
planning in the Fitzroy region when available (likely to be late 2015; Wenger, in prep).
Table 2.9 identifies the priority pollutants for each industry in terms of relative risk to water quality.
Where pollutants are not listed it is because they are low priority and are not seen as a significant issue
in that industry’s farming system.
Table 2.9. Priority pollutants for each industry in terms of relative risk to water quality, in order of
importance.
Industry Priority Pollutants in order of importance
1. Grazing Sediment
2. Dryland cropping Sediment, Nutrients, PSII herbicides
3. Urban Sediment, Nutrients, Pesticides, Other Pollutants such as heavy metals
These results are summarised in Table 2.10 and have been used to derive basin management priorities
in terms of pollutant types and sources for the region. Smaller scale priorities are presented in Section 4.
It should be noted that the confidence in the results at this time is low to moderate due to limitations in
some of the input data related to river flows, pollutant loads and water quality concentrations for some
variables in the assessment. Accordingly, it is suggested that the results for these basins are likely to be

48
an underestimate of the relative risk of degraded water quality in the region; however, the results do
correlate with current status reported in Johnson et al. (2015). This first attempt of assigning relative risk
in the marine environment to individual basins by defining zones of influence for individual basins in the
region (where possible) demonstrates how this method could be applied for future assessments.
However, further refinement of the definition of these zones is recommended if more definitive results
are required to differentiate between the basins with greater confidence.
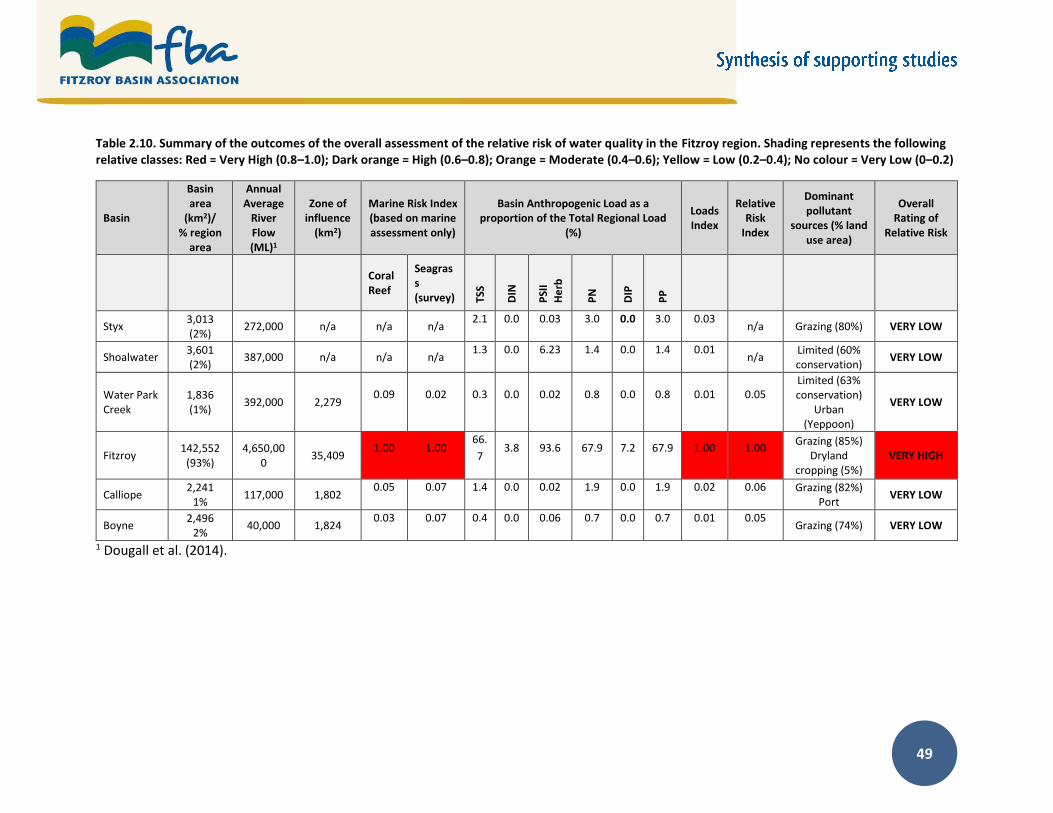
49
Table 2.10. Summary of the outcomes of the overall assessment of the relative risk of water quality in the Fitzroy region. Shading represents the following relative classes: Red = Very High (0.8–1.0); Dark orange = High (0.6–0.8); Orange = Moderate (0.4–0.6); Yellow = Low (0.2–0.4); No colour = Very Low (0–0.2)
Basin
Basin area
(km2)/ % region
area
Annual Average
River Flow (ML)1
Zone of influence
(km2)
Marine Risk Index (based on marine assessment only)
Basin Anthropogenic Load as a proportion of the Total Regional Load
(%)
Loads Index
Relative Risk
Index
Dominant pollutant
sources (% land use area)
Overall Rating of
Relative Risk
Coral Reef
Seagrass (survey) TS
S
DIN
PSI
I
He
rb
PN
DIP
PP
Styx 3,013 (2%)
272,000 n/a n/a n/a 2.1 0.0 0.03 3.0 0.0 3.0 0.03
n/a Grazing (80%) VERY LOW
Shoalwater 3,601 (2%)
387,000 n/a n/a n/a 1.3 0.0 6.23 1.4 0.0 1.4 0.01
n/a Limited (60% conservation)
VERY LOW
Water Park Creek
1,836 (1%)
392,000 2,279 0.09 0.02 0.3 0.0 0.02 0.8 0.0 0.8 0.01 0.05
Limited (63% conservation)
Urban (Yeppoon)
VERY LOW
Fitzroy 142,552
(93%) 4,650,00
0 35,409
1.00 1.00 66.
7 3.8 93.6 67.9 7.2 67.9 1.00 1.00
Grazing (85%) Dryland
cropping (5%) VERY HIGH
Calliope 2,241
1% 117,000 1,802
0.05 0.07 1.4 0.0 0.02 1.9 0.0 1.9 0.02 0.06 Grazing (82%) Port
VERY LOW
Boyne 2,496
2% 40,000 1,824
0.03 0.07 0.4 0.0 0.06 0.7 0.0 0.7 0.01 0.05 Grazing (74%) VERY LOW
1 Dougall et al. (2014).

50
3. Management Goals and Targets
3.1 Environmental Values and Water Quality Objectives
The WQIPs are prepared consistent with the Framework for Marine and Estuarine Water Quality
Protection (2002), and apply the framework described in the National Water Quality Management
Strategy (NWQMS 199216). In Queensland, this is linked through the Environmental Protection Act
1994, which is the main legislation for water quality in freshwater, estuarine and marine areas, and
includes the Environmental Protection Policy (Water) 2009 (EPP Water) and the Environmental
Protection Regulation 2008 (EPR 2008). The EPP (Water) provides targets for water quality
management through the development of environmental values, and water quality guidelines and
objectives under the framework provided by the National Water Quality Management Strategy
(NWQMS 1992) at a catchment scale. The Environmental Protection Regulation provides a
regulatory regime for Environmentally Relevant Activities that have the potential to impact on water
quality, including, but not limited to agriculture, aquaculture, mining, and waste disposal. The
Environmental Protection Act 1994 also sets monitoring requirements related to release of
wastewater at a regional and local scale. WQIPs and Healthy Waters Management Processes
(HWMP) are prepared to meet relevant requirements, including HWMP requirements specified in
section 24 of the EPP Water.
In the Fitzroy region, comprehensive consultation processes have been undertaken to establish
Environmental Values (EV) and Water Quality Objectives (WQO) for the region. These are
categorised in Table 3.1. The outcomes and process for defining these values are available online17.
EVs/WQOs were scheduled under EPP Water in 2011 for Fitzroy Basin fresh waters and some
estuarine waters18. These covered all catchments in the Fitzroy Basin (Comet, Callide, Nogoa, Fitzroy
etc.). EVs/WQOs for surrounding coastal waters including the Fitzroy Delta and Keppel Bay,
Shoalwater, Water Park Creek, Calliope and Boyne were scheduled in 2014 as part of the Capricorn-
Curtis coast region, and are available online19. .
These objectives represent refined targets based on the National and State water quality guidelines
and are to be used to help set development conditions, influence local government planning
schemes and objectively assess ecosystem health within monitoring programs. It is the role of the
WQIP to identify where these are most relevant for protecting or improving the water quality of the
region.
The Great Barrier Reef Water Quality Guidelines (2010) (GBRMPA 2010) provide the primary guidance for water quality conditions that are required to maintain ecosystem health in the GBR.
16 National Water Quality Management Strategy, Australian Government Department of the Environment. http://www.environment.gov.au/water/quality/national-water-quality-management-strategy. 17 http://www.ehp.qld.gov.au/water/policy/fitzroy-basin-environmental-values.html 18 (http://www.ehp.qld.gov.au/water/policy/schedule1/fitzroy_scheduled_evs_wqos.html 19 http://www.ehp.qld.gov.au/water/policy/schedule1/capricorn-curtis-scheduled-evs-wqos.html

51
Table 3.1. Environmental Values and Questions relevant to stakeholders in establishing values in the Fitzroy region.
Environmental Value Supporting Details Questions
HUMAN USES
Primary Industries
Irrigating crops such as sugar cane, mangoes, avocadoes, hay
Where is the water used for irrigation? What crops, etc. are irrigated?
Water for farm use such as in fruit packing, milking sheds, vehicle wash-down, piggeries, feedlots
Where is the water used around farms for washing down areas or fruit packing?
Stock watering Where is the water used for watering stock? What type of stock?
Water for aquaculture such as prawns, barramundi
Where is the water used in aquaculture operations and what species are cultivated?
Human consumption of stocked fish or crustaceans
Where is there consumption of wild or stocked fish or crustaceans
Recreation & Aesthetics
Primary recreation with direct contact with water e.g. swimming, snorkelling, wading
Are there any recreational activities where people are fully immersed in the water e.g. swimming, snorkelling? If so, where?
Secondary recreation with indirect contact with water e.g. sailing, canoeing, boating, rafting
Are there any recreational activities where people are possibly splashed with water e.g. fishing, boating, sailing? If so, where?
Visual appreciation no contact with water e.g. bushwalking, picnicking, sightseeing
What areas of waterways are regularly used by people who enjoy looking at and being near the waterway?
Drinking Water
Raw drinking water supplies Where do people or local governments take water from the river for water supplies?
Industrial uses
Water for industrial use e.g. power generation, manufacturing plants
What are the industries that take water from the river for their operations and where does it occur?
Cultural& Spiritual
Cultural and spiritual values What are the cultural and spiritual values associated with the waterways?
Aquatic ecosystems
Pristine or modified aquatic ecosystems
3.2 Pollutant load reduction targets
3.2.1 Reef Plan targets
End-of-system load targets for the major pollutants addressed in Reef Plan 2009 were set for the
entire GBR in Reef Plan 2009 (DPC 2009), and updated in 2013 (DPC 2013). Neither set of targets
were established on the basis of ecological realities for the GBR although attempts to design targets
of this type have been made (e.g. Brodie et al. 2009). There is no guarantee that the Reef Plan 2009
or Reef Plan 2013 targets will lead to the overall Reef Plan objective of “To ensure that by 2020 the
quality of water entering the reef from adjacent catchments has no detrimental impact on the health

52
and resilience of the Great Barrier Reef”. Reef Plan 2013 includes water quality targets and land and
catchment management targets to be achieved by 2018, summarised below.
Reef Plan Water quality targets (2018)
At least a 50% reduction in anthropogenic end-of-catchment dissolved inorganic nitrogen loads in priority areas.
At least a 20% reduction in anthropogenic end-of-catchment loads of sediment and particulate nutrients in priority areas.
At least a 60% reduction in end-of-catchment pesticide loads in priority areas. The PSII herbicides considered are hexazinone, ametryn, atrazine, diuron and tebuthiuron.
Reef Plan Land and catchment management targets (2018)
90% of sugar cane, horticulture, cropping and grazing lands are managed using best management practice systems (soil, nutrient and pesticides) in priority areas.
Minimum 70% late dry season ground cover on grazing lands.
The extent of riparian vegetation is increased.
There is no net loss of the extent, and an improvement in the ecological processes and environmental values, of natural wetlands.
Targets at a basin scale were not set during Reef Plan 2009 or Reef Plan 2013. Thus there are no
formal Reef Plan targets for the basins of the Fitzroy region.
3.2.2 Defining ecologically relevant targets
As part of the development of the WQIP, TropWATER has led the development of ecologically
relevant end-of-catchment load reduction targets for the Fitzroy basins (see Brodie et al. 2015).
Ecologically relevant targets (ERTs) attempt to define the pollutant load reductions that would be
required to meet the GBR Water Quality Guidelines (GBRMPA 2010), which are set at a standard
considered to be suitable to maintain ecosystem health. Thus ERTs are required to be met to achieve
the overall long-term Reef Plan goal “To ensure that by 2020 the quality of water entering the reef
from broadscale land use has no detrimental effect on the reef’s health and resilience”. However, it is
important to recognise that the guidelines are defined to maintain ecosystem health, and given that
the near- and in-shore areas are already quite degraded, recovery is the only option. Accordingly,
meeting the Water Quality Guidelines is unlikely to allow for significant restoration of ecosystem
health, and therefore the levels at which recovery will occur will be lower than those at which stress
on an ecosystem begins to occur to cause a detrimental impact.
Both Reef Plan Targets (RPTs) specific to the Fitzroy basins and ERTs have been set for all the basins
in the Fitzroy region where possible, for the main pollutants addressed in the Reef Plan 2013 targets.
Both sets of targets, Reef Plan 2013 targets for 2018 and ERTs, are shown in Table 3.2 and expressed
as a percentage reduction from the modelled 2008 baseline estimates. RPTs are set by adopting the
overall 2013 Reef Plan GBR targets to the Fitzroy region. The methods for deriving the ERTs vary
between the pollutants. These are summarised below, and described in detail in Brodie et al. (2015).
Based on current evidence, it is proposed that a feasible timeframe for achievement of the ERTs is
approximately 20 years from now, i.e. 2035 although an end-point of 2050, in line with the 2050 GBR

53
Long-Term Sustainability Plan, would also be suitable. Beyond 2035 the influence of water quality
improvement in the context of other drivers of GBR health such as climate change are difficult to
predict. It should also be noted that additional external factors such as agricultural expansion,
intensification of agricultural land uses, or increased pressure from coastal development have not
been factored into this timeframe.
The methods for deriving the ERTs vary between the pollutants. These are summarised below, and
described in detail in Brodie et al. (2015).
Table 3.2. Summary of pollutant load reduction targets for basins in the Fitzroy region. The table shows two sets of targets: Reef Plan Targets (RPT) and Ecologically Relevant Targets (ERT) for Total Suspended Solids (TSS), Dissolved Inorganic Nitrogen (DIN), Particulate Nitrogen (PN), Dissolved Inorganic Phosphorus (DIP), Particulate Phosphorus (PP) and PSII Herbicides (PSII).
River Styx Shoalwater Water Park Fitzroy Calliope Boyne
TSS RPT 20% 20% 20% 20% 20% 20%
TSS ERT1 Not calculable at present
Not calculable at present
Not calculable at present
50% reduction in fine
fraction (< 4 m) SS
Not calculable at present
Not calculable at present
DIN RPT 50% 50% 50% 50% 50% 50%
DIN ERT Not calculable at present
Not calculable at present
Not calculable at present
Not calculable at present
Not calculable at present
Not calculable at present
PN RPT 20% 20% 20% 20% 20% 20%
PN ERT Not calculable at present
Not calculable at present
Not calculable at present
50% Not calculable at present
Not calculable at present
PP RPT 20% 20% 20% 20% 20% 20%
PP ERT Not calculable at present
Not calculable at present
Not calculable at present
50% Not calculable at present
Not calculable at present
DIP RPT Not specified
Not specified
Not specified
Not specified Not specified
Not specified
DIP ERT Not calculable at present
Not calculable at present
Not calculable at present
Not calculable at present
Not calculable at present
Not calculable at present
PSII RPT 60% 60% 60% 60% 60% 60%
PSII ERT (diuron equivalent conc.)
<0.08 µg.L-1 <0.08 µg.L-1 <0.08 µg.L-1 <0.08 µg.L-1 <0.08 µg.L-1 <0.08 µg.L-1
1 Note that calculations of the TSS load reductions required based on actual particle size analysis from monitored
data are only available for the Fitzroy Basin and are presented in Brodie et al. (2015). It should be noted, however, that it is only possible to measure progress towards the 20% or 50% reduction in total SS using the Source Catchments model at this time, which is based on a particle size of < 20 μm not < 4 μm.
It is critically important to note that all RPTs are based on percentage reductions in anthropogenic
loads while ERTs for sediment and nutrients are based on percentage reductions in total loads.

54
Total suspended sediments and particulate nitrogen and phosphorus targets
Ecologically relevant targets for suspended sediments are derived from understanding the impacts
of sedimentation and turbidity on coral communities and seagrass meadows, and the relationships
between end-of-catchment loads and turbidity in the receiving environment. The suspended
sediment of most risk to the GBR is the fine fraction sometimes defined as that smaller than 15.7
μm, i.e. below the fine silt boundary and containing the clay and fine silt fractions (Bainbridge et al.;
Bainbridge et al. 2012; Bainbridge et al. 2014; Bainbridge et al., in review; Bartley et al. 2014;
Douglas et al. 2008) or of even more risk, just the clay fraction <4 μm. This is the component that
contains most of the nitrogen and phosphorus content (and other contaminants), travels widely in
flood plumes rather than all depositing near the river mouth (Lewis et al. 2014), is most effective at
attenuating light when in suspension (Storlazzi et al. 2015) and drives increased turbidity on the
inner-shelf of the GBR (Fabricius et al. 2013; Fabricius et al. 2014; Logan et al. 2014; Logan et al.,in
press). This increased fine sediment supply, and hence increased turbidity and sedimentation, can
have severe impacts on GBR organisms such as reef fish (e.g. Wenger et al. 2011) through effects on
juvenile recruitment and feeding; corals through sedimentation (e.g. Weber et al. 2012; Flores et al.
2012; Pollock et al. 2014); decreased light (Fabricius et al. 2013; Fabricius et al. 2014); and increasing
the competitive advantage of macro-algae and turf algae over corals (Gowan et al. 2014; Goatley &
Bellwood 2012; Goatley & Bellwood 2013); and seagrass (Collier et al. 2012; Petus et al. 2014).
Suspended sediment also interacts with other stressors to increase the overall impact of multiple
stressors on coral reefs (Ban et al. 2014; Risk 2014; Graham et al. 2015). Resuspension of sediment in
windy conditions or strong tidal currents in shallow waters (< 15 m) leads to conditions where
suspended sediment concentrations are above the GBR Water Quality Guidelines (De'ath & Fabricius
2008; GBRMPA 2010), and this threatens coral reefs and seagrass meadows through reduced light
for photosynthesis (Bartley et al. 2014; Collier 2013).
Using this knowledge of ecological relevance and factoring in the availability of data, suspended
sediment targets for reduction of the < 20 μm fraction has been set, which are considered to be the
same as for the < 15.7 μm fraction for the purposes of target setting. As 93.6% of the discharged
suspended sediment load at the Rockhampton end-of-system site is in the < 20 μm fraction we can
assume a 50% reduction in the TSS load will equate closely with a 50% reduction in the < 20 μm
fraction. The actual targets are derived from the analysis of the relationship between photic depth
and river discharges in the region (Fabricius et al. 2014; Logan et al. 2014; Logan et al., in press). The
analysis shows a linear relationship between reduced fine sediment proxied by water volume (and
also PN and PP loads) and increased Secchi depth (measured as photic depth), and indicates that a
50% reduction of the fine sediment fraction is predicted to be sufficient to meet the GBRMPA
Guidelines for Secchi depth (and thus TSS concentrations) for coastal waters.
No TSS ERTs have been set for the other basins in the region as there is either no theoretical
underpinning of sediment loads and coastal water clarity, or there is simply no data to base the
analysis on. This is explained in more detail in Brodie et al. (2015).

55
Dissolved inorganic nitrogen targets
The anthropogenic DIN load from the Fitzroy River is estimated to be 50 tonnes — the result of a
total DIN load of 1106 tonnes and a pre-development load of 1057 tonnes (Dougall et al. 2014). In
making this estimation it is assumed that no anthropogenic DIN is generated from grazing lands just
through the fact of having cattle present. This assumption needs further research as there are
certainly some indications that grazed savannah and woodland leaks more DIN than when in an
ungrazed (from cattle) state. Thus virtually all anthropogenic DIN in the Fitzroy is assumed to be
from grains and cotton cropping but the load is very small, approximately 50 tonnes. Thus the RPT
for DIN from the Fitzroy Basin is small i.e. about 25 tonnes reduction and it is highly likely that the
ERT will be similarly small. However, further effort is required to establish a biogeochemical model
for the Fitzroy marine region which would allow ERTs to be more reliably estimated for Chl-a.
PSII herbicides targets
The PSII herbicides are currently the main pesticides of concern in the GBR (and are thus the only
ones specifically addressed in Reef Plan) and concentrations have been detected in some parts of
the GBR that are likely to cause negative effects in the freshwater, estuarine and marine
environments (Lewis et al. 2013). The most common PSIIs used in the Fitzroy are atrazine
(predominantly cropping) and tebuthiuron (predominantly grazing). Losses of both are highly
dependent on the timing of the rainfall events following application, and the amount of ground
cover retained on the paddock as residues from previous crops or residual pasture (Shaw & Silburn
2014). As conservation tillage has increased and as improved management practices take place
(shifting from high risk to low risk management in relation to sediments) there is an increased
reliance on all herbicides for weed control. This results in a trade-off between tillage, which greatly
increases run-off and soil loss, and the increased use of herbicides, which results in increased
potential for loss into receiving waters (Shaw et al. 2013; Thorburn et al. 2013).
A new set of ecotoxicity threshold values have recently been proposed for pesticides in marine
environments (Rachael Smith pers. comm.), which have been developed to revise and update the
Australian and New Zealand Water Quality guidelines. These proposed marine threshold values are
available for the PSII herbicides diuron, atrazine, ametryn, hexazinone and tebuthiuron and have
been derived using the latest ecotoxicological data and statistical techniques. It is likely that these
guidelines will be adopted for the Great Barrier Reef Marine Park in place of the current GBRMPA
(2010) values (Carol Honchin pers. comm. ) and are thus used in setting ERTs for these PSII
herbicides for the Fitzroy NRM region. Furthermore, Smith et al. (pers. comm.) has developed ‘toxic
load factors’ in order to normalise the PSII herbicide loads/concentrations to a standard ‘additive’
concentration that can then be compared to a guideline value. Hence the new ecotoxicity threshold
values are applied and these toxic load factors at the end-of-river systems across the river basins of
the Fitzroy River NRM region as (1) the 99% level of protection is in accordance with the current
GBRMPA (2010) guideline’s recommendations; (2) the ‘additive’ toxic load factors have been
developed using the latest science and understanding; and (3) if the guideline is met at the end of
the river then this ensures that no part of the marine park is negatively affected by a particular
herbicide.

56
While the herbicide concentrations are of most importance to gauge their risk to receiving waters,
the Reef Plan targets revolve around annual load reductions. Furthermore, Reef Plan targets do not
consider the ‘toxic load’ (i.e. the herbicides are summed and reported as a ‘total PSII load’ and hence
are considered of equal toxicity, although this is known to be not the case). Hence to develop ERTs
the PSII herbicide loads are normalised to better reflect their toxic effects and then the reductions
required to ensure that herbicide concentrations will remain below these ecologically relevant
threshold concentrations are examined. As a preliminary approach, the Lewis et al. (2011) model
was updated with new monitored load data to produce the individual herbicide load estimations for
the Fitzroy basins. A PSII equivalent ‘toxic load’ was calculated using the toxic load factors proposed
by Smith et al. (pers. comm.). The predicted PSII normalised (to diuron) concentration and the
diuron ecotoxicity value (0.08 µg.L-1) were then used to examine the likely reduction required to the
end-of-basin loads so that the PSII herbicide concentrations would remain below these values. This
analysis suggests that all basins of the Fitzroy NRM region do not require any further reduction in
current PSII herbicide loads (i.e. diuron, atrazine, ametryn, hexazinone and tebuthiuron) to achieve
the guideline values. Therefore the recommendation is to prevent any increases of PSII herbicide
concentrations in waterways in the Fitzroy region by managing contributing land uses at best
management standards.
However, the increased detection of the herbicide metolachlor (a non-PSII used in broadacre
cropping) in the Fitzroy River is of concern as concentrations, at times, have exceeded current ‘best
estimated’ guideline values. Based on our current understanding (and lack of an ‘approved guideline
value’) it is suggested that reductions of metolachlor in the Fitzroy are likely in the order of 60 to
70% to achieve ERTs. However, further research is required to validate this finding and these
recommended reductions for metolachlor are considered to be too preliminary to include in the
current Fitzroy WQIP.
3.2.3 Reef 2050 Long-Term Sustainability Plan targets
In March 2015, the Reef 2050 Long-Term Sustainability Plan (LTSP)20 was released. The LTSP is a joint
initiative between the Australian and Queensland governments and provides an overarching
strategy for management of the GBR, and contains objectives, targets and actions across several
themes including: biodiversity, ecosystem health, heritage, water quality, community benefits and
governance. The plan builds on the Reef Plan targets (for 2018) as follows, with the extended LTSP
targets in bold:
at least a 50% reduction in anthropogenic end-of-catchment dissolved inorganic nitrogen
loads in priority areas, on the way to achieving up to an 80% reduction in nitrogen in
priority areas such as the Wet Tropics and Burdekin by 2025;
at least a 20% reduction in anthropogenic end-of-catchment loads of sediment in priority
areas, on the way to achieving up to a 50% reduction in priority areas such as the Wet
Tropics and Burdekin by 2025;
20 http://www.environment.gov.au/marine/gbr/publications/reef-2050-long-term-sustainability-plan

57
at least a 20% reduction in anthropogenic end-of-catchment loads of particulate nutrients in
priority areas; and
at least a 60% reduction in end-of-catchment pesticide loads in priority areas.
Note the priority areas mentioned in Reef Plan 2013 have never been clearly defined, although it is
commonly thought that they do apply in parts of the Fitzroy NRM region. In the case of the LTSP, the
Fitzroy is not specifically mentioned at all. The LTSP targets are comparable with the ERTs defined in
this WQIP; however, the timeframes are more ambitious and the wording of the LTSP targets
requires further interpretation to identify priority areas and the form of nitrogen under
consideration and the particle size of sediment under consideration.
3.2.4 Summary of targets for the Fitzroy Basin
The Fitzroy load targets (for Fitzroy Basin) — based on 2014 Source Catchments results are
summarised below.
Reef Plan Targets, by 2018/20
1. 20% reduction in anthropogenic fine sediment by 2018–2020. Baseline total load =
1,950,000 tonnes; Anthropogenic = 1,410,000 tonnes; pre-development = 540,000 tonnes.
Thus 20% reduction involves reduction of 280,000 tonnes leaving the new total load at
1,670,000 tonnes.
2. 50% reduction in anthropogenic DIN. Baseline total load = 1100 tonnes; Anthropogenic = 50
tonnes; pre-development = 1050 tonnes. Thus 50% reduction involves reduction of 25
tonnes leaving the new total load at 1075 tonnes.
3. 60% reduction in PSII herbicides. Baseline total load = 530 kg (all anthropogenic). Thus 60%
reduction involves a reduction of 320 kg leaving total load of 210 kg.
4. 20% reduction in PN and PP.
Ecologically relevant targets, by 2035
1. 50% reduction in total fine sediment load i.e. 50% of 1,950,000 tonnes = 970,000 tonnes
leaving total load of 970,000 tonnes. Progress towards the Reef Plan targets will obviously
take us some way towards the ERT.
2. A 50% reduction in fine sediment will encompass the required reductions in PN and PP.
3. No additional reduction needed in DIN but management of sources where possible to
ensure no increases.
4. No additional reduction needed in PSII herbicides but management of sources where
possible to ensure no increases. However, better consideration of risks to freshwater
systems will likely require significant management.

58
4. Management options and regional priorities
The primary management options for directly reducing pollutant loads in the Fitzroy region are
associated with improvement or maintenance of sustainable management practices that maximise
water quality benefits in agricultural and urban land uses. However, many of these options do not
result in immediate pollutant reductions at the end of catchments and are therefore required to be
part of a longer term implementation strategy for meeting water quality targets.
As described in Section 1, the Fitzroy NRM region is divided into a number of management units for
delivery of NRM programs. Currently the region has three sub-regional groups (Dawson Catchment
Coordinating Authority, Capricornia Catchments, and Central Highlands Regional Resource Use
Planning), which operate with field staff to engage and work with landholders. The field staff work in
smaller geographical parcels defined as ‘Neighbourhood Catchments’ (NC), which are based on 192
smaller scale sub-catchments and comprise a varying number of landholders (Figure 4.1). The
number of NC varies in each of the basins and catchments, with a maximum of 66 in the Dawson
catchment and a minimum of 28 in the Boyne Basin. This the scale used to guide management in the
Fitzroy WQIP.

59
Figure 4.1. Neighbourhood Catchments within the Fitzroy NRM region. Catchment and basin boundaries are
shown in red.
60
4.1 Agricultural land uses
4.1.1 Grazing lands
Management Practice Framework
The management practice framework for grazing management practices was developed as part of
the Reef Plan Paddock to Reef Integrated Monitoring, Modelling and Reporting program (P2R). It
provides a consistent description of the levels of management practice in terms of potential water
quality risk. There is a suite of specific management systems defined under the water quality risk
framework relevant to hillslope management, gully management or streambank management in
grazing systems (Shaw et al. 2013) (Appendix B). The framework is summarised in Table 4.1 below
and fully included in Appendix A. Specific performance indicators for grazing management are listed
below.
Hillslope erosion
1. Average stocking rates imposed on paddocks are consistent with district long-term carrying
capacity benchmarks for comparable land types, current land condition, and level of property
development.
2. Retention of adequate pasture and ground cover at the end of the dry season, informed by (1)
knowledge of ground cover needs and (2) by deliberate assessment of pasture availability in
relation to stocking rates in each paddock during the latter half of the growing season or early
dry season.
3. Strategies implemented to recover any land in poor or very poor condition (C or D condition).
4. The condition of selectively grazed land types is effectively managed.
Streambank erosion
5. Timing and intensity of grazing is managed in frontages of rivers and major streams (including
associated riparian areas) and wetland areas.
Gully erosion: All of the hillslope erosion performance indicators (1-4), plus
6. Strategies implemented to remediate gullied areas.
7. Linear features (roads, tracks, fences, firebreaks, pipelines and water points) located and
constructed to minimise their risk of initiating erosion.
Other
8. Use of agricultural chemicals.

61
Table 4.1. P2R classification of management practices in the grazing industry.
Water Quality Risk Low Moderate Moderate-High High
Resource condition objective
Practices highly likely to maintain land in good (A) condition and/or improve land in lesser condition
Practices are likely to maintain land in good or fair condition (A/B) and/or improve land in lesser condition
Practices are likely to degrade some land to poor (C) condition or very poor (D) condition
Practices are highly likely to degrade land to poor (C) or very poor (D) condition
Previous “ABCD” nomenclature
A B C D
Management practice effectiveness
Due to the large size of the Fitzroy Basin there are vast amounts of heterogeneity in land types, soil
types, elevation, slope, rainfall, industry uses and management practices (Karfs et al. 2009; Silburn et
al. 2011; Whish 2011). These factors impact significantly on soil erosion processes and suspended
sediments entering into the GBR. Soil erosion is both a natural and land use management
accelerated process (Shellberg & Brooks 2013). Management practices that contribute to soil
erosion include: excessive stocking rates, grazing on streams and riparian area and inappropriate
placement of roads and fence lines (McKergow et al. 2005; Bartley et al. 2010; Stavi et al. 2010;
Wilkinson & Bartley 2010; Shellberg & Brooks 2013).
There are three primary mechanisms through which sediment loss can occur: hillslope, gully and
streambank erosion (McKergow et al. 2005; Thorburn & Wilkinson 2013). Early spatial modelling
identified hillslope erosion as the dominant sediment source within the GBR catchments (McKergow
et al. 2005). However, recent evidence suggests that a much greater proportion of sediment losses
can be attributed to the subsoil erosion process (Bartley et al. 2010a; Thorburn & Wilkinson 2013;
Burton et al. 2014; Wilkinson et al. 2014) and that the majority of this is likely to be from gully
sources (Hughes et al. 2009). However, consideration of the solvability must also be factored into
attempts to ameliorate the erosion processes. Further detail of the effectiveness of grazing
management practices is summarised in Star et al. (2015a).
Management practice adoption
The proportion of graziers in each of the defined management practices for gully, streambank and
hillslope erosion is included in Table 4.2. This data is derived from the Paddock to Reef Water Quality
Risk frameworks, which is used to describe and categorise management practices according to
recognized management practices according to recognised water quality improvements at a
paddock scale. D practices are considered a high risk to water quality and are likely to degrade land;
through to A practices, which are low risk to water quality and are likely to maintain land in good
condition.

62
Table 4.2. Percentage of grazier classification of management practice across the different erosion
process in the Fitzroy (as at 2013).
Erosion process Management categories
A B C D
Hillslope 4% 14% 59% 23%
Streambank 20% 16% 15% 48%
Gully 6% 15% 55% 24%

63
4.1.2 Cropping systems
Management Practice Framework – ABCD for cropping land use
The management practice framework for cropping management practices was also developed as
part of the P2R Program. It provides a consistent description of the levels of management practice in
terms of potential water quality risk. The framework is summarised in Table 4.3 below and fully
included in Appendix B.
Table 4.3. P2R classification of management practices in the grains cropping industry.
Water Quality Risk Low Moderate Moderate-High High
Previous “ABCD” nomenclature
A B C/D
The most important management practices for minimising water quality risk are:
Sediments: Wheel traffic and erosion control.
Nutrients: Determining nitrogen requirements, influence of stored soil moisture on yield and
nitrogen fertiliser decisions and application timing to minimise potential losses and
maximise uptake of nitrogen fertiliser.
Pesticides: Targeting herbicide application and efficient herbicide application.
Management practice effectiveness
The use of nutrients and the reductions of DIN and PSII herbicides have been targeted to the
cropping industry due to the applied use for growth and management of crops. The Fitzroy has two
main areas of cropping: the Central Highlands and the Callide Valley. The development of cropping in
the Fitzroy involved clearing native vegetation on both hillslopes and floodplain areas. In the Fitzroy
Basin approximately 84% of the cropped soils are self-mulching, black, cracking clay vertisol soils
(Murphy et al. 2013).
A summary of management practice effectiveness in cropping lands is summarised in Star et al.
(2015a).
Management practice adoption
The proportion of farmers in each of the management practices defined for cropping is included in
Table 4.4. This data is derived from Paddock to Reef reporting (2013), which categorises
management practices across the three areas of run-off and soil loss, herbicide management and
nutrient management.
Table 4.4. Percentage of grains cropping management practices effectiveness on cropping land in
the Fitzroy region (as at 2013).
Water Quality Parameter Management categories
A B C D
Run-off & soil loss 14% 27% 58% 1%
Herbicide management 3% 65% 29% 3%
Nutrient management 1% 53% 39% 7%
64
4.1.3 Additional spatial and bio-physical knowledge to assist in management
prioritisation
In addition to the information presented above, there is further information based on spatial and
biophysical characteristics of the region that can be used to guide management prioritisation for
optimal water quality benefits. A review of the available information in regards to the origin,
transport and impacts of fine sediment and particulate nutrients from the Fitzroy River Basin to the
southern Great Barrier Reef (GBR) lagoon was undertaken (Lewis et al. 2015).
Increases in fine sediment delivery to coastal waters has increased water turbidity during flood
plumes and later via re-suspension due to wave action and swell (Logan et al. 2014; Logan et al., in
press). Increases in particulate nutrients such as nitrogen and phosphorus bound to fine sediments
also decrease photic depth via chronic eutrophication and biomass in the marine water column after
floods (Brodie et al. 2011). Decreased photic depth has negative effects on fringing coral reefs and
seagrass meadows in Keppel Bay and further afield during large flood events (Wenger et al. 2015). It
is the largest flood plumes that have the most widespread impact on reef and seagrass systems.
Fine-grained (<16 µm) suspended sediment delivered from the Fitzroy River during moderate to
large events likely travels the longest distance in the marine environment and impinges on coral
reefs and seagrass meadows in the southern GBR. We have moderate confidence that this material
in the flood plumes likely influences photic depth and turbidity along the southern GBR in both the
short (i.e. during the flood plume) and long term (i.e. months following the discharge event) and
should be the target for management efforts in the catchment.
Recent work by Dougall et al. (2008) has indicated that majority of the suspended sediment is likely
to be generated from less than 30% of the Fitzroy catchment. Sediment tracing and load monitoring
studies have found that basaltic lands used for cropping are a major source of fine sediment and
nutrients from a concentration (and per hectare yield) perspective compared to lands used for
grazing (Hughes et al. 2009; Packett et al. 2009). Broadscale cropping occurs on large areas in the
Theresa Creek, Nogoa and Comet rivers catchments and to a lesser degree (area wise) in the Callide
Creek and Dawson River catchments. Cropping also occurs on the floodplains of most streams where
black soil alluvium is found throughout the Fitzroy Basin. Continued and improved best management
practice is considered a high priority for these intensively cropped basalt areas to reduce fine
sediment and nutrient transport to the southern GBR lagoon. However, other monitoring and
modelling data suggest that the majority of the long-term annual fine sediment load from the Fitzroy
Basin to the GBR originates from high volume events from the Connors and (Upper and Lower)
Dawson catchments (Packett et al. 2009). These larger volumes allow the freshwater plume to travel
greater distances in the marine environment and reach the fringing reefs of the Keppel Islands and
further offshore. It would appear from current knowledge that, depending on the location and type
of rain event, both cropping and grazing lands can supply fine sediments to plumes that reach corals
in the GBR lagoon. There is a need to conduct field monitoring and tracing research on the
sediments that reach the Keppel Bay reefs in order to fill current knowledge gaps regarding Fitzroy
Basin sediment sources.

65
The Connors catchment contributes a high number of large floods on a long-term annual average
basis (Packett et al. 2009). This catchment also produces a reliable base flow of relatively high quality
water for downstream water users such as the centres of Rockhampton and the Capricorn Coast.
Maintaining or improving ground cover in the Connors catchment is considered a priority
management action in regards to future sediment and nutrient transport to Keppel Bay. Any
changes in land use that involve intensive agriculture such as cropping could result in an increase in
sediment and nutrient loads to the coast from this catchment.
Improved management of grazing lands to reduce sediment supply from gully and scald erosion is
considered a priority in the Fitzroy Basin. Sediment tracing studies in the Burdekin Basin have shown
that sub-soils appear to be the major component of fine sediment found in stream monitoring
studies (e.g. Wilkinson et al. 2015). Evidence of severe gullying and scalds can be found in the
grazing lands of the Fitzroy Basin and preliminary data from a study underway suggests that cattle
ramps cut into the banks of lower order streams may be contributing a larger volume of fine
sediment to waterways than previously thought (R. Packett, unpublished data). There is an urgent
need to quantify the contribution of fine sediment and particulate-bound nutrients from cattle-
induced riparian damage.
4.1.4 Management priorities in agricultural lands
Given the large area in the Fitzroy Basin that is affected by either gully, hillslope or streambank
erosion, a prioritisation of neighbourhood catchments within the basin needs to be undertaken to
determine the relative importance of areas based on different decision variables. This work has been
led by Megan Star (DAF) and is reported in Star et al. (2015a,b). Two different prioritisation scenarios
were considered in this study (Table 4.5).

66
Table 4.5. Prioritisation scenarios for managing sediment losses at a neighbourhood catchments
scale.
1) Cost effective outcomes for Reef Plan targets Contribution
The neighbourhood catchments were ranked based on:
tonnes of sediments per hectare for combined erosion processes on grazing and cropping land, respectively
residual cover
management practice effectiveness for each of the processes
costs for combined processes on grazing and cropping land, respectively
Prioritised to achieve the Reef Plan targets of a 20% reduction in sediment.
To understand in a functional form what catchments have the potential to be the most cost effective.
2) Meeting Ecologically Relevant Targets Contribution
The neighbourhood catchments were separated into coastal catchments and the Fitzroy and were ranked based on:
total sediment loads (grazing and cropping combined)
residual cover
total average management practice effectiveness (grazing and cropping combined)
costs (grazing and cropping combined)
sediment export ratio. Prioritised to achieve the ERTs of a 20% reduction of sediments in coastal catchments and 50% reduction in fine fraction <4 µm) suspended sediments expressed as a 30% reduction in bulk total suspended sediment.
The ranking follows the same process as scenario one; however, is separated into the Fitzroy and the coastal catchments.
Given that sediment is the key pollutant for reductions, the focus has been predominantly on
sediment. Particulate nutrients are highly correlated to sediment so it was assumed that where
sediment reductions occurred, particulate nutrient reductions also occurred. The first scenario
explored achieving the Reef Plan targets (20% reduction in sediment) through a cost effective
approach, from the exported pollutant across the neighbourhood catchment. The second scenario
assessed under which prioritisation decisions the Ecologically Relevant Targets (ERTs) of a 20%
reduction of sediments in coastal catchments and 50% reduction in fine fraction (<4 µm) of
suspended sediments expressed as a 30% reduction in bulk total suspended sediment could be
achieved (Table 4.6). The first scenario aims to prioritise the data using a cost effectiveness
approach, which also considers capacity to change. There are three parts in achieving this: first
understand the loads data, second what are the required adjustments in the landscape that can be
made and finally, what is the cost to achieve this? Given that the data is in different units to allow a
function to be developed the data was normalised. The data was then given a cost effective score
based on the function:
𝐶𝐸𝑔𝑟, 𝑐𝑟𝑝 = 𝑙𝑜𝑎𝑑𝑠 (𝑡/ℎ𝑎) (𝑁. 𝐶𝑜𝑣𝑒𝑟 × 𝑁. 𝑀𝑔𝑡)
𝑁. 𝐶𝑜𝑠𝑡𝑠

67
Where, the loads refer to the tonnes per hectare for the NC, N. Cover refers to the residual ground
cover data that was normalised (Section 3.2) and then multiplied by N.Mgt the level of adoption for
B management practice for grains cropping and grazing (Section 3.3). This was then divided by
N.Costs.
For the second scenario, a cumulative ranking approach was used to prioritise the neighbourhood
catchments for soil erosion management (Figure 4.2). This included the categorisation of the data for
all decision variables into quartiles. The following was assumed:
For sediments (t/ha), 25% of neighbourhood catchments that generate the highest sediment loads were split off (4th quartile).
For residual ground cover, the lowest 25% (1st quartile) of neighbourhood catchments across the basin were selected.
For management effectiveness practice, 25% of neighbourhood catchments that have previously shown the highest management practices effectiveness was selected (4th quartile).
For costs, the cheapest 25% (1st quartile) neighbourhood catchments were selected. Given that there is currently no scientific basis to weight (place greater importance) variables, all
were treated equally, apart from sediment load as this forms the basis of the reduction. All
neighbourhood catchments were categorised according to these criteria for the decision variables by
providing scores of either 1 or 0 if an area fell into the respective category. For example, if a
neighbourhood catchment had sediment that was in the top quartile it received a score of one, if it
also had low cover it received a score of one, a maximum score of five was achievable. If, however,
the neighbourhood catchment was not in the fourth quartile for sediment it received a 0, and even it
received a score for other parameters it still received a 0. Following that, the scores were added up
over all decision variables for each neighbourhood catchment. Neighbourhood catchments that
obtained the highest scores were selected as prioritised areas. This prioritisation process was
applied to the first three scenarios.
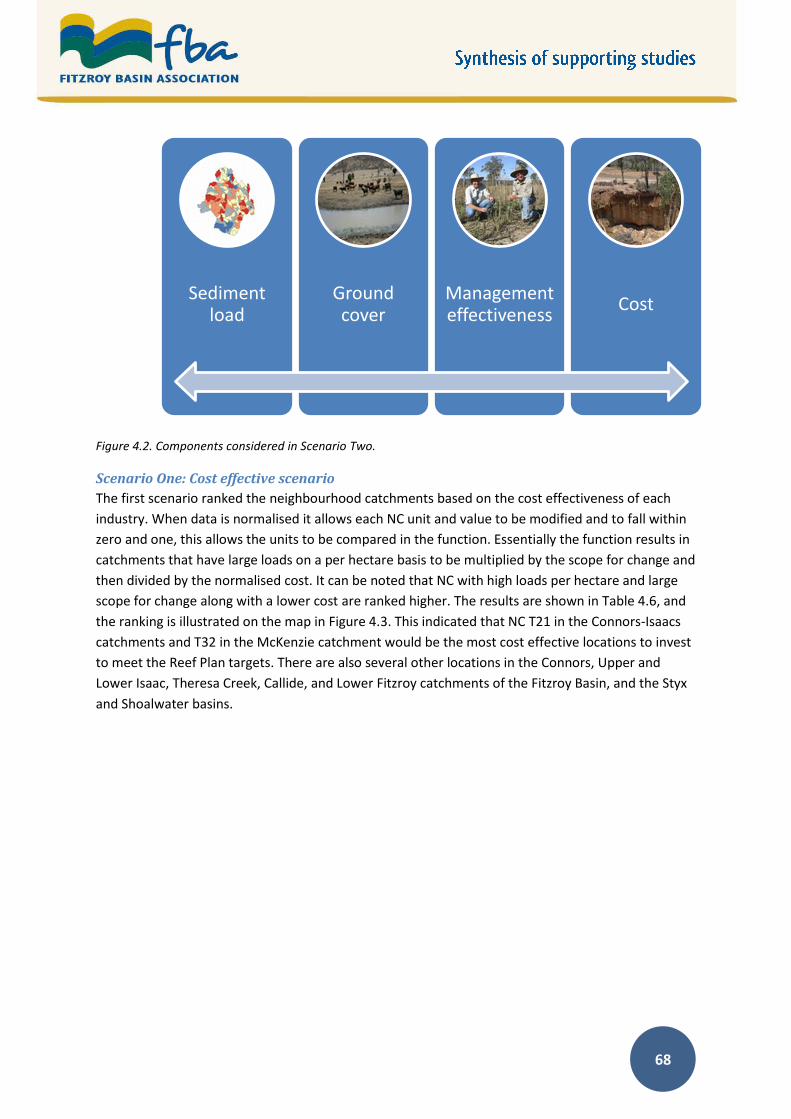
68
Figure 4.2. Components considered in Scenario Two.
Scenario One: Cost effective scenario
The first scenario ranked the neighbourhood catchments based on the cost effectiveness of each
industry. When data is normalised it allows each NC unit and value to be modified and to fall within
zero and one, this allows the units to be compared in the function. Essentially the function results in
catchments that have large loads on a per hectare basis to be multiplied by the scope for change and
then divided by the normalised cost. It can be noted that NC with high loads per hectare and large
scope for change along with a lower cost are ranked higher. The results are shown in Table 4.6, and
the ranking is illustrated on the map in Figure 4.3. This indicated that NC T21 in the Connors-Isaacs
catchments and T32 in the McKenzie catchment would be the most cost effective locations to invest
to meet the Reef Plan targets. There are also several other locations in the Connors, Upper and
Lower Isaac, Theresa Creek, Callide, and Lower Fitzroy catchments of the Fitzroy Basin, and the Styx
and Shoalwater basins.
Sediment load
Ground cover
Management effectiveness
Cost

69
Table 4.6. Parameters and ranking based on Scenario One — cost effective approach for meeting
Reef Plan sediment 20% reduction target — all land uses.
Neighbourhood catchment
Catchment Sediment loads t/ha
Normalised. cover x
normalised management effectiveness
Normalised costs
Function results Top 20 rank
T21 Connors Isaacs 4.3 0.197 0.020 42.98 1
T32 McKenzie 6.6 0.067 0.010 42.40 2
T19 Upper Isaac 2.1 0.256 0.019 27.91 3
T24 Lower Isaac 3.5 0.012 0.002 19.73 4
F15 Water Park 0.5 0.109 0.003 16.69 5
C6 Theresa Creek 1.6 0.183 0.018 16.19 6
T16 Connors 1.0 0.083 0.007 12.90 7
T3 Connors 1.1 0.101 0.010 11.04 8
T28 McKenzie 0.5 0.245 0.010 10.72 9
T39 McKenzie 0.6 0.135 0.007 10.57 10
D32 Lower Dawson 0.7 0.166 0.010 10.46 11
F17 Lower Fitzroy 0.5 0.178 0.010 9.90 12
F23 Lower Fitzroy 0.7 0.104 0.009 8.54 13
F2 Styx 0.3 0.237 0.011 7.70 14
D5 Callide 0.4 0.196 0.009 7.32 15
D40 Lower Dawson 0.8 0.088 0.011 6.32 16
F13 Lower Fitzroy 0.1 0.152 0.003 5.95 17
F7 Shoalwater 0.5 0.188 0.016 5.59 18
D10 Callide 0.4 0.133 0.010 5.11 19
F3 Styx 0.4 0.037 0.003 5.01 20

70
Figure 4.3 The top 20 Neighbourhood Catchment priorities based on a cost effectiveness for meeting the Reef
Plan sediment 20% reduction target — all land uses.

71
FBA have undertaken further analysis of the prioritisation results of Scenario One (Star et al. 2015a)
described above to distinguish priorities for grazing and cropping (farming) lands. These are shown
in Table 4.7and 4.8 respectively.
Table 4.7. Parameters and ranking based on Scenario One — cost effective approach for meeting
Reef Plan sediment 20% reduction target in grazing lands.
Neighbourhood catchment
Catchment Grazing lands – Sediment loads t/ha
Normalised cover
Normalised management effectiveness
Normalised costs
Combined score
(grazing)
Top 20
rank
C6 Theresa Creek 0.513 0.34 0.33 0.12 0.49 1
F17 Lower Fitzroy 0.386 0.48 0.36 0.36 0.18 2
T21 Connors Isaacs 0.342 0.54 0.63 0.65 0.18 3
F7 Shoalwater 0.132 0.47 0.33 0.12 0.17 4
D40 Lower Dawson 0.148 0.57 0.32 0.16 0.17 5
D32 Lower Dawson 0.238 0.44 0.31 0.23 0.14 6
T39 McKenzie 0.199 0.46 0.54 0.36 0.14 7
T16 Connors 0.337 0.48 0.39 0.64 0.10 8
D3 Lower Dawson 0.182 0.53 0.37 0.36 0.10 9
F23 Lower Fitzroy 0.163 0.47 0.36 0.29 0.09 10
D5 Callide 0.103 0.54 0.41 0.25 0.09 11
F11 Lower Fitzroy 0.193 0.29 0.40 0.25 0.09 12
C5 Theresa Creek 0.168 0.20 0.40 0.17 0.08 13
D41 Lower Dawson 0.195 0.34 0.19 0.16 0.08 14
T11 Connors 0.034 0.64 0.61 0.17 0.08 15
F18 Lower Fitzroy 0.450 0.28 0.31 0.51 0.08 16
F1 Styx 0.162 0.57 0.20 0.24 0.07 17
C23 Comet 0.124 0.48 0.40 0.33 0.07 18
C33 Comet 0.047 0.40 0.57 0.15 0.07 19
D13 Callide 0.119 0.54 0.43 0.42 0.07 20

72
Table 4.8. Parameters and ranking based on Scenario One — cost effective approach for meeting
Reef Plan sediment 20% reduction target in cropping lands.
Neighbourhood catchment
Catchment Cropping lands – Sediment loads t/ha
Normalised management effectiveness
Normalised costs
Combined score
(cropping)
Top 20 rank
T19 Upper Isaac 6.5 0.00 0.00 77.29 1
D16 Lower Dawson 0.4 0.62 0.01 40.79 2
T21 Connors Isaacs 12.7 0.00 0.00 24.03 3
T32 McKenzie 4.2 0.00 0.00 20.12 4
T28 McKenzie 1.0 0.03 0.00 12.77 5
D64 Upper Dawson 0.3 0.30 0.01 11.80 6
D39 Lower Dawson 0.2 0.39 0.01 10.32 7
F19 Lower Fitzroy 0.5 0.07 0.00 9.77 8
C23 Comet 0.1 1.00 0.01 9.65 9
D19 Lower Dawson 0.2 0.36 0.01 9.44 10
D57 Upper Dawson 0.4 0.12 0.01 8.05 11
T24 Lower Isaac 2.0 0.00 0.00 7.89 12
D15 Lower Dawson 0.5 0.07 0.00 6.64 13
D47 Upper Dawson 0.3 0.21 0.01 6.61 14
D58 Upper Dawson 0.5 0.06 0.00 5.70 15
D63 Upper Dawson 0.3 0.16 0.01 5.44 16
D66 Upper Dawson 0.2 0.19 0.01 5.32 17
D17 Lower Dawson 0.3 0.14 0.01 5.17 18
F13 Lower Fitzroy 0.6 0.02 0.00 4.96 19
C10 Theresa Creek 0.1 0.63 0.02 4.00 20
Scenario Two: Ecologically relevant targets
This scenario targeted a 30% reduction from the Fitzroy Basin and a 20% reduction from sediment in
the coastal catchments. The coastal catchments are the Boyne, Calliope, Water Park Creek,
Shoalwater and Styx basins.
For the loads per hectare, a number of catchments that are in close proximity to the coast or exhibit
significant gully networks are in the highest quartile for sediment loads exported to the reef (Figure
4.4). Similarly, there are a number of catchments in the northern part of the region that receive
higher rainfall, which also have higher rates of stream bank erosion. Neighbourhood catchments
that have loads that do not fall in the fourth quartile, however, have significant loads are, in some
cases, where mining companies have purchased properties yet still running them as a grazing
operation.

73
Grazing Cropping
Figure 4.4 Highest quartile for sediment loads (Dark Blue; lowest quartile in pale blue) with grazing on the left
and cropping on the right.
The difference in the results of selection of either residual cover or cost were very low, this
highlights the loads coming from high intensity rainfall areas and from streambank sources. This is a
key difference between the two scenarios and how the results are selected.
The results identify NC in the Fitzroy Basin that have a high ranking across the five parameters of
loads, residual cover, effectiveness, cost and delivery ratio. The priority NCs are spatially spread
across the catchments with some clear groupings. The results are shown in Table 4.9 and
represented in the map in Figure 4.5. The NC F11, in the Lower Fitzroy catchment, received the
highest score for all factors, and is the highest priority in the area for selecting areas that are most
beneficial to invest in to progress achievement of the ecologically relevant targets. Of course, the
effort would need to be considerably more extensive than this, and there are several NCs in the
Connors, Theresa Creek, Fitzroy and Lower Dawson catchments and in the areas closer to the coast
that also ranked highly including in the Styx, Shoalwater and Calliope basins.

74
Table 4.9. Parameters and ranking based on Scenario Two — meeting the Ecologically Relevant
Targets for sediment in the Fitzroy region.
Neighbourhood Catchment
Catchment Sediment T/ha
Residual cover
Management effectiveness
Cost per NC
Total score
F11 Lower Fitzroy 1 1 1 1 4
T3 Connors 1 0 1 1 3
F7 Lower Fitzroy 1 0 1 1 3
F1 Styx 1 0 1 1 3
D41 Comet 1 0 1 1 3
D40 Comet 1 0 1 1 3
D32 Lower Dawson 1 1 0 1 3
C6 Theresa Creek 1 0 1 1 3
C5 Theresa Creek 1 0 1 1 3
B4 Calliope 1 1 1 0 3
B3 Calliope 1 1 1 0 3
B13 Boyne 1 0 1 1 3
B10 Calliope 1 1 1 0 3
T9 Connors 1 0 1 0 2
T39 McKenzie 1 0 1 0 2
T33 McKenzie 1 0 1 0 2
T21 Connors Isaacs 1 1 0 0 2
T16 Connors 1 0 1 0 2
T10 Connors 1 0 1 0 2
F4 Styx 1 0 1 0 2
F27 Lower Fitzroy 1 0 1 0 2
F24 Lower Fitzroy 1 0 1 0 2
F20 Lower Fitzroy 1 0 1 0 2
F19 Lower Fitzroy 1 0 1 0 2
F12 Lower Fitzroy 1 0 1 0 2
D9 Lower Dawson 1 0 1 0 2
D56 Upper Dawson 1 0 1 0 2
D39 Lower Dawson 1 0 1 0 2
D31 Lower Dawson 1 1 0 0 2
D2 Lower Dawson 1 0 1 0 2
D19 Lower Dawson 1 0 1 0 2
D18 Lower Dawson 1 0 1 0 2
D16 Lower Dawson 1 0 1 0 2
D10 Callide Creek 1 1 0 0 2
C8 Theresa Creek 1 0 1 0 2
C7 Theresa Creek 1 0 1 0 2
C12 Theresa Creek 1 0 1 0 2
F5 Styx 1 0 0 0 1

75
F28 Lower Fitzroy 1 0 0 0 1
F25 Lower Fitzroy 1 0 0 0 1
F23 Lower Fitzroy 1 0 0 0 1
F22 Lower Fitzroy 1 0 0 0 1
F2 Styx 1 0 0 0 1
F18 Lower Fitzroy 1 0 0 0 1
F17 Lower Fitzroy 1 0 0 0 1
F16 Lower Fitzroy 1 0 0 0 1
D3 Lower Dawson 1 0 0 0 1
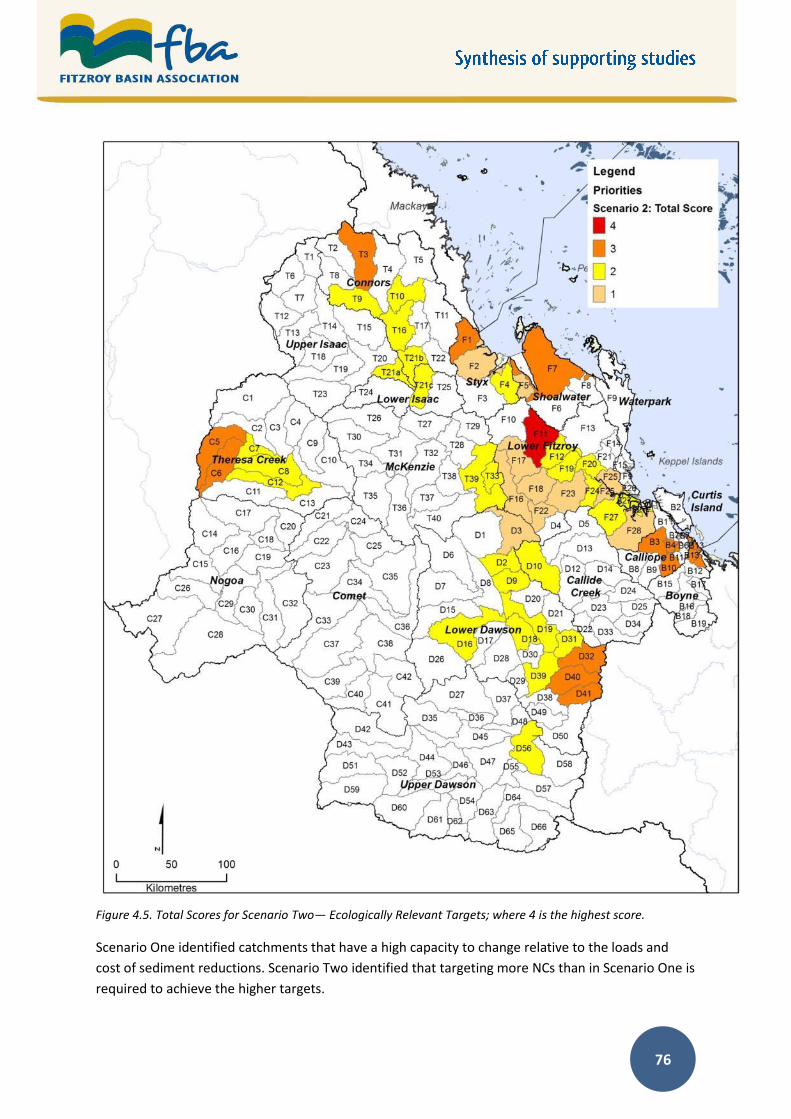
76
Figure 4.5. Total Scores for Scenario Two— Ecologically Relevant Targets; where 4 is the highest score.
Scenario One identified catchments that have a high capacity to change relative to the loads and
cost of sediment reductions. Scenario Two identified that targeting more NCs than in Scenario One is
required to achieve the higher targets.

77
A number of the selected NCs have large proportions of highly erosive soils. Given the state of
current El Niño weather patterns, ground cover needs to be taken into consideration with
landholders to develop strategies that minimise increasing bare ground. These NCs that contain
erosive soils and are relatively low deliverers of sediments, are prime candidates for this and
include: D7, D6, D8 (Lower Dawson); D43, D42 (Upper Dawson), T15 (Upper Isaac) and T16
(Connors). Results of previous LiDAR studies have identified that larger gullies may be driven by
episodic or event-based localised rainfall events and possibly exacerbated by low ground cover. This
highlights that maintaining good ground cover at the end of a drought or the break of a dry season is
important to avoid large sediment loss (Thorburn & Wilkinson 2013; Wilkinson et al. 2013).
Similarly, although mining only occupies only 1% of the catchment, mining companies have grazing
lease agreements in place for 4% of the catchment. Given that cattle enterprises are not their
primary business, there is the potential scope for engagement of mining companies to achieve
mutually beneficial outcomes. There are two NCs in the Mackenzie catchment (T31, T35) that have
substantial areas of mining lease agreements and considerable sediment losses. Given the large
areas involved there is potential for low risk engagement with mining companies to facilitate low
cost, large impact sediment reductions. Mining companies may be receptive to improved
environmental management without reliance upon incentives, and income from livestock is likely to
be relatively unimportant to their business.
Cropping areas have been identified with the potential to achieve sediment reductions with low cost
and high adoption rates of supporting management practices. The dominant cropping soils also have
very high fractions of particle size below 4 µm, which are increasingly understood to be extremely
important in terms of the damage caused to coral reefs (see Lewis et al. 2015). In a number of the
selected NCs there is the opportunity to work with growers to achieve sediment reductions and
achieve corresponding cumulative benefits through herbicide reductions and the applied DIN
reductions. There are a range of interventions that may have an impact but the most important will
be (See Appendix B):
the adoption of minimum tillage systems, which result in less soil disturbance and more
ground cover
the installation of professionally designed contour banks, which can greatly reduce
generation and transport of sediments from the farm
the implementation of controlled traffic farming systems, chiefly as an enabler of reduced
tillage. The other significant benefits associated with adoption of controlled traffic is that it
achieves nutrient and pesticide reductions due to the elimination of machine overlap.
In some NCs such as D12 and D13 (Callide catchment) these cropping areas are on a smaller scale
and therefore Best Management Practice (BMP) support and extension is likely to be required.
Advantages of investing in change in the grains cropping industry is that the actual impacts of the
change are realised virtually immediately, and the changes are relatively easy to verify. This may be
in contrast to interventions in the grazing industry where benefits are likely to be realised over long
time periods.

78
4.1.5 Costs to achieve the sediment targets
Star et al. (2015a) estimated the cost of achieving the targets using five key steps shown in Figure
4.6.
Figure 4.6. Key steps for determining the overall costs of achieving the sediment reduction targets.
The function used for the assessment was:
where I is for level of incentive on average given to encourage adoption of management practices
through capital infrastructure and works. O is for the change in production or opportunity cost for
the grazier, which in the context of this study is to de-stock the project area. T is for the timeframe
of 10 years of opportunity costs borne by the landholder and discounted at a rate (r) back into
present value dollar terms; A is the area of the project relative to the property size. This is then
multiplied by the number of properties in the catchment (P), which is a portion of those that have
adoption B level management practices.
The range of cost varied significantly from ($18.83 per tonne to $9,779 per tonne) (Figure 4.7) and
those that had been selected under Scenario Two were then selected for the overall sediment
reduction. It is estimated that achievement of the 20% Reef Plan sediment reduction target based on
the catchments prioritised under this process of 390,200 tonnes, would be $108 million over a 10-
year timeframe. Figure 4.8 indicates that it is more cost effective to address sediment losses in
cropping lands, at least in the shorter term.

79
Figure 4.7. Assessment of the range of cost per tonne of sediment reduction for the Fitzroy region to achieve
the 390,200 tonne reduction target.
Figure 4.8. Assessment of the cost per tonne of sediment reduction for grazing and grains cropping in the
Fitzroy region to achieve the 20% reduction target of 390,200 tonnes.
4.1.6 Options for delivery and implementation
The identification of priority NCs for sediment reduction in the Fitzroy Basin implies that funding
sources and appropriate interventions (e.g. ongoing maintenance of infrastructure and extension)
need to be revised. A mix of mechanisms that includes both financial incentives with direct
extension to support the infrastructure and management changes is required. Given that the
production margin from cattle grazing in the Fitzroy Basin will decline further with the likely

80
progression of an El Niño event, private funds for infrastructure and improved soil management are
limited. Higher levels of co-investment on a sliding scale may be required; this would result in
funding up to 75% of on-ground works in some instances. The impending reduction in incentives
funding associated with the closing of Reef Programme may be a serious impediment.
Star et al. (2015a) includes a comprehensive discussion of the potential private benefits of adopting
improved grazing and grains cropping soil management practices. Based on that information, a
matrix of the most suitable policy mechanisms in the cost of the relative private and public cost or
benefit is provided in Table 4.10.
Table 4.10. Potential mix of mechanisms to achieve more efficient sediment reductions in the
Fitzroy region.
Incentives Extension Ecosystem service payments
Reverse auctions Confidence
Grazing Hillslope erosion Land regeneration from D to C
All projects Gullies and streambank
High risk of project failure, particularly medium to low productivity land types
Grains cropping
Contour banks, gully remediation
All projects Streambank Shifting to minimum tillage and controlled traffic
High confidence in achieving outcomes
4.2 Ports
A separate supporting study synthesising the range of current information on water quality in ports
of the Fitzroy region was undertaken by CQUniversity (Flint et al. 2015). As an island nation, Australia
depends heavily on its port facilities for international trade. Two of Queensland’s 20 ports are
located in the Fitzroy Basin region. Port water quality is influenced by a wide variety of factors, some
of which are unique to shipping and port operations.
The two ports in the Fitzroy region are the Port of Gladstone (sometimes referred to as Port Curtis or
Gladstone Harbour) and the Port of Rockhampton (often referred to as Port Alma due to its location)
(Figure 4.9). The Port of Gladstone is one of Australia’s major port facilities — it is one of the largest
coal export ports in the country and the fifth largest coal export port in the world. It is heavily
industrialised and eight major industries are located close to the port. The Port of Rockhampton is a
three-berth shipping terminal located to the north of the Port of Gladstone; it currently exports
mostly ammonium nitrate, salt, bulk tallow and military equipment. It is the principal port for
handling Class 1 explosives for eastern Australia. The only port-side industries are evaporative salt
pans.
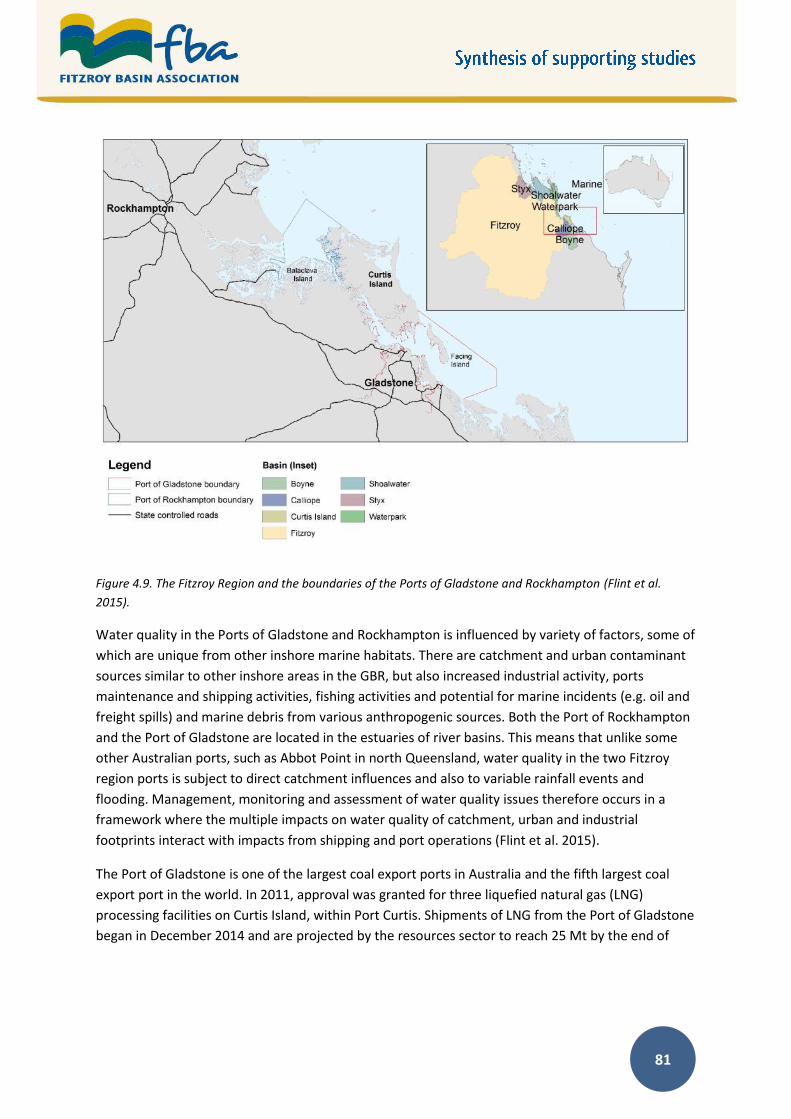
81
Figure 4.9. The Fitzroy Region and the boundaries of the Ports of Gladstone and Rockhampton (Flint et al.
2015).
Water quality in the Ports of Gladstone and Rockhampton is influenced by variety of factors, some of
which are unique from other inshore marine habitats. There are catchment and urban contaminant
sources similar to other inshore areas in the GBR, but also increased industrial activity, ports
maintenance and shipping activities, fishing activities and potential for marine incidents (e.g. oil and
freight spills) and marine debris from various anthropogenic sources. Both the Port of Rockhampton
and the Port of Gladstone are located in the estuaries of river basins. This means that unlike some
other Australian ports, such as Abbot Point in north Queensland, water quality in the two Fitzroy
region ports is subject to direct catchment influences and also to variable rainfall events and
flooding. Management, monitoring and assessment of water quality issues therefore occurs in a
framework where the multiple impacts on water quality of catchment, urban and industrial
footprints interact with impacts from shipping and port operations (Flint et al. 2015).
The Port of Gladstone is one of the largest coal export ports in Australia and the fifth largest coal
export port in the world. In 2011, approval was granted for three liquefied natural gas (LNG)
processing facilities on Curtis Island, within Port Curtis. Shipments of LNG from the Port of Gladstone
began in December 2014 and are projected by the resources sector to reach 25 Mt by the end of

82
201621, which could make Gladstone the largest port in Queensland. By comparison, Australia
shipped 23.9 Mt of LNG cargoes in 2012–13.
There are 20 operational wharves and six anchorages within the Port of Gladstone. All berths are
capable of handling vessels in excess of 180 m in length, with the berths at RG Tanna Coal Terminal,
Wiggins Island and Curtis LNG Wharves accommodating vessels of approximately 320 m. Major
exports through the Port of Gladstone are: coal (GPC activity), alumina, magnesia, grain, fly ash,
scrap metal, cement clinker, ammonium nitrate, limestone, and grains. The major imports arriving at
the Port of Gladstone are: bauxite, caustic soda, petroleum products, liquefied petroleum gas,
copper, bunker oil, liquified ammonia, sulfuric acid and magnetite.
In addition to bulk freight wharves, the Port of Gladstone also has a 320 berth marina handling boats
up to 27 m with a maximum draught of 4 m. The sheltered marina was created through a land
reclamation projected during the 1981–1982 dredging program. A number of major industries
depend on the port and are located within the adjacent coastal area (see section 4.5 below).
Various groups contribute to monitoring the health and condition of the Port of Gladstone; the most
significant monitoring program is conducted by the Port Curtis Integrated Monitoring Program Inc.
(PCIMP). Monitoring in the Port of Rockhampton is less comprehensive as it has been far less
developed than the Port of Gladstone.
The Port of Rockhampton has only three berths: two for general cargo and one dolphin berth for
handling bulk liquids. The port is targeted for the import and export of niche market products
including ammonium nitrate, salt, bulk tallow and equipment for military exercises held at
Shoalwater Bay, north of Yeppoon. It is the principal designated port for the handling of Class 1
explosives and ammonium nitrate cargoes for the east coast of Australia. Industries adjacent to the
Port of Rockhampton are limited, at present, to the CK Life Sciences evaporative salt pans.
Public reporting on marine environmental health is carried out in the proximity of both ports, by
Gladstone Healthy Harbour Partnership (GHHP) for the Port of Gladstone and by Fitzroy Partnership
for River Health (FPRH) for the Fitzroy estuary, and also more broadly by Reef Plan’s GBR-wide
reports. Both the Port of Gladstone and the Port of Rockhampton are managed by Gladstone Ports
Corporation Ltd (GPC) and water quality management in the ports is primarily the responsibility of
the Queensland Government. However, all three levels of government have some influence and
responsibility for aspects of water quality and factors influencing it, and Australia is signatory to
several international agreements relevant to water quality and the marine environment (Figure
4.10).
21 http://www.couriermail.com.au/business/gladstone-ports-corporation-expects-santos-gas-in-september-quarter-of-2015/story-fnihsps3-1227170411501 Accessed June 2015.

83
Figure 4.10. Some of the International agreements, Australian Government and Queensland Government
legislation relating to managing water quality, and managing matters that may be affected by water quality, in
the Ports of Gladstone and Rockhampton (Flint et al. 2015).
4.3 Urban
Approximately 280,000 people live in the Fitzroy region. The major centres include Rockhampton,
with a population of about 73,000 people; Gladstone, with a population of approximately 58,000;
Emerald, with about 13,000; and Yeppoon, also approximately 13,000 people. A review of urban
areas and management recommendations for the WQIP is still in preparation. At the time of this
report, only the information for Gladstone had been completed (Gunn 2015) and is summarised
below.
4.3.1 Gladstone
An urban water quality study was undertaken as part of the Fitzroy WQIP (Gunn 2015), which
focussed on the urban centre of Gladstone.

84
Gladstone City (198 km2), Calliope Shire (5,875 km2) and Miriam Vale Shire (3,800 km2) were
amalgamated in 2008 to form Gladstone Regional Council. Most of the GRC local government area
consists of rural land north, west and south of Gladstone City. Power generation and industries are
mostly co-located with the Port of Gladstone, and rural areas are primarily agricultural.
In recent years, Gladstone’s population has experienced booms and busts in line with industrial and construction activities. Increasing urban population growth affects water quality by:
1. increasing the volume of wastewater (treated) discharge with associated nitrogen and
phosphorus content
2. increasing urban land use area for residential, commercial and industrial purposes including
transport infrastructure with a resultant increase in impervious surfaces and subsequent
increase in nutrient, sediment, gross pollutants and heavy metals discharge
3. sediment discharge spikes during the development and construction phase of urban and
industrial land (Gunn 2015).
The increase in impervious area and changes to catchment hydrology caused by growth and
development are the primary water quality pressures associated with urban centres, resulting in
increases in stormwater run-off and pollutant concentrations in run-off (Gunn 2014). Urban
expansion impacts on local water quality, ecosystem health and stream function and has
disproportionate negative impacts on the health of downstream environments. In Gladstone,
Gladstone Regional Council (GRC) and the Gladstone Area Water Board (GAWB) are monitoring
water quality only in:
raw water distribution and potable water supply (GAWB); and
wastewater treatment and disposal (GRC) (Gunn 2015).
Far-field water quality monitoring in Gladstone Harbour is carried out by the Port Curtis Integrated
Monitoring Program Inc. (PCIMP), which is described in the Fitzroy WQIP supporting study on ports
(Flint et al. 2015).
4.4 Other land uses
4.4.1 Mining
A large proportion of the Fitzroy Basin lies above the Permian coal-rich Bowen Basin and mining
activity is dominated by coal (Flint et al. 2013). There were 48 operating coal mines in the Bowen
Basin in 2011, with another 38 coal projects and advanced coal projects in varying stages of planning
or preparation (DEEDI 2012a). Although coal mining is less than 1% of land use in the Fitzroy Basin,
the mining activity here represents approximately 70% of Queensland’s coal mines and contributes
an estimated $12.6 billion to the economy (67% of the gross regional product for the Fitzroy Region;
QRC 2015). However, in recent years falling coal prices have reduced profitability in the region,
which has caused many mines to scale back employment and a small number of mines to close.
Most of the Fitzroy Basin’s coal mines are located in the Upper Isaac, Mackenzie and Lower Dawson
catchments.

85
As well as coal mining, there is a magnesite mine at Kunwarara north of Rockhampton, small scale
gem mining (primarily sapphires) occurs west of Emerald on the Gemfields, and semi-precious
chrysoprase is mined near Marlborough (Christensen & Rogers 2004; Flint et al. 2013). There are
limestone and nickel mines operating in the Fitzroy Basin as well as several quarries (Christensen &
Rogers 2004).
The legacy of historical gold, copper and silver mining at Mount Morgan in the Callide catchment has
had significant and ongoing impacts on the ecology of the Dee River. The now abandoned Mount
Morgan Mine operated between 1882 and 1981, and mine tailings were still processed until 1990.
The Dee River is adjacent to the mine and is heavily impacted by acid mine drainage. Long stretches
of river downstream of the mine site have low pH and high metal concentrations, with impacts on
ecology of the river. The Queensland Government’s Mount Morgan Mine Rehabilitation Project aims
to reduce the contaminant load leaving the mine site and entering the Dee River (Department of
Mining and Safety 2012).
4.4.2 Coal seam gas extraction
Coal seam gas (CSG) is primarily methane, which is extracted by drilling wells into deep coal seams.
The drilling operation brings water from the coal seams to the surface (CSG water) to reduce
pressure in the seams and allow for the release of gas. CSG water varies in quality, but can often be
saline and sodic. For the Fitzroy region, most CSG extraction currently occurs in the Upper Isaac,
Upper Dawson and Lower Dawson catchments. Water extraction and release or re-use is regulated
by the Queensland Government.
In some areas, the CSG extraction process may involve the use of fraccing to improve gas recovery.
Fraccing is only carried out at wells with certain geological characteristics. According to the
Queensland Department of Environment and Heritage Protection, there are approximately 5,000
petroleum and gas wells in Queensland and around 400 of these have been fracced, although it is
estimated that as the industry expands a higher proportion of wells may be fracced22.
Since the construction of liquefied natural gas (LNG) plants on Curtis Island, gas is exported from the
Port of Gladstone. Shipments began in December 2014 and are projected by the resources sector to
reach 25 Mt by the end of 201623 (for further detail see Flint et al. 2015).
4.4.3 Industries and power generation
Aside from resource extraction industries in the western regions of the Fitzroy Basin, most of the
industrial activity in the region is situated around the Port of Gladstone (Figure 4.11). The following
are classified as port-side industries (Flint et al. 2015):
22 Department of Environment and Heritage Protection (2014) http://www.ehp.qld.gov.au/management/non-mining/fraccing.html#chemicals_and_compounds_used_in . Accessed September 2015. 23 http://www.couriermail.com.au/business/gladstone-ports-corporation-expects-santos-gas-in-september-quarter-of-2015/story-fnihsps3-1227170411501 Accessed June 2015.

86
Queensland Curtis Island Liquified Natural Gas project: three processing plants on Curtis
Island
Queensland Alumina Ltd: one of the world’s largest alumina refineries
Rio Tinto Alcan Yarwun: a newer alumina refinery, commencing operations in 2004
Boyne Smelters Ltd (BSL): the largest aluminium smelter in Australia
Cement Australia Gladstone: the largest cement plant in Australia
Orica Australia: chlor-alkali, ammonium nitrate (500,000 tonnes per year) and sodium
cyanide plants, and
NRG Gladstone Power Station: Queensland’s largest coal-fired power station.
Figure 4.11. Location and map of the Port of Gladstone, showing rail and road link and major industries (Flint et
al. 2015).
The NRG Gladstone Power Station is Queensland’s largest power station with a generating capacity
of 1,680 megawatts (MW). The coal-fired station was opened in 1976 and upgraded in 1988. A
second coal-fired power station is situated west of Rockhampton. Stanwell Power Station became
fully operational in 1996 and can generate 1,460 MW.
Other industries located in proximity to Rockhampton include the abovementioned Kunwarara
magnesite mine and a magnesia production facility at Parkhurst, both owned by Queensland
Magnesium (QMAG). QMAG produces deadburned magnesia, electrofused magnesia and caustic

87
calcined magnesia. There is a further magnesite deposit at Yaamba (adjoining the Kunwarara
deposit). The two deposits together comprise the world’s largest known accumulation of
cryptocrystalline magnesite.
There is also a meatworks at Gracemere near Rockhampton owned by JBS Australia. The facility has
a daily processing capacity of 696 cattle, drawing on the regional cattle herd of 6 million head.
Regulated emissions of all industries are recorded in the National Pollutants Inventory (NPI). The
inputs for the Gladstone and Rockhampton regions were summarised in the ports synthesis for the
Fitzroy WQIP (Flint et al. 2015). In the 2013–14 reporting period there were 23 NPI reporting
facilities in Gladstone and 29 in Rockhampton. Gladstone emissions were reported for five industrial
categories (basic non-ferrous metal manufacturing; basic chemical manufacturing; electricity
generation; mineral, metal and chemical wholesaling; and water transport services) in 2013–14, and
oil and gas extraction has also been reported in previous years. For Rockhampton, three industrial
categories contributed emissions during the same reporting period (electricity generation; water
supply, sewerage and drainage services; and meat and meat product manufacturing).
The greatest volume of inputs for 2013–14 in Gladstone was of fluoride compounds (160,940 kg/yr).
In Rockhampton, total nitrogen accounted for the greatest amount of discharge from two industrial
categories (water supply, sewerage and drainage services; and meat and meat product
manufacturing) during the 2013–14 reporting period (144,957 kg/yr). See Flint et al. 2015 for further
details.
4.5 System repair and landscape function
Intact coastal habitats (for example freshwater wetlands, floodplains and saltmarshes) are vital to a
healthy GBR. They are important in the lifecycle of species and also play a role in slowing overland
flow and trapping sediments and nutrients (GBRMPA Outlook Report 2014). In recognition of the
importance of coastal ecosystems in the region, and an overarching prioritisation for ‘system repair’
actions was completed to support the development of the Fitzroy WQIP (Baker 2015). This
prioritisation was supported by three specific studies:
1. a prioritisation of fish barriers in the region in terms of ecological importance (an update and
review of previous work undertaken in 2007–08) (Marsden 2015)
2. a prioritisation of Fitzroy Basin wetlands for NRM investment using the Wetland Decision
Support System (DSS) developed by HLA Envirosciences (HLAE 2007) (Jaensch et al. 2015)
3. the Great Barrier Reef Marine Park Authority developed the Eco-Calculator and Blue Maps to
quantify change in the delivery of ecosystem services from modified coastal ecosystem since
pre-European times, and to define the level of connectivity of coastal ecosystems with the
GBR.
Each of these tools was applied to the FBA region, and their outputs standardised and combined to
produce an overall score for each neighbourhood catchment within the region. The final
prioritisation identified NCs that contain multiple ranking wetlands and fish barriers, with high
connectivity to the Reef. The high-scoring NCs in this combined output represent areas with the

88
greatest potential for realising synergistic benefits from management actions, but should not be
considered as a final prioritisation without careful consideration of the underlying complexities and
issues with the individual tools, and those that arise from their combination into a single score
(Baker 2015). Accordingly, it is recommended that priorities for implementation should be based
more directly on each of the individual sub-tools, and allow users to drill down or move between the
outputs of each to fully consider interactions between different management options.
4.5.1 Wetland prioritisation
A Wetlands Decision Support System (DSS) was developed for the GBR in 2007 (HLAE 2007) to guide
the allocation and prioritisation of funds for wetland restoration and remediation in the coastal
areas of the GBR. The purpose of the Wetlands DSS is to support decision making by assembling and
presenting the complex of relevant information in a way that can be understood by decision makers,
and communicated to the broader community so that the process is transparent. It essentially
provides rationale to decisions that guide management and investment priorities, and therefore
requires clear statement and agreement of the management objectives — which may vary
depending on the application. In this case, the tool is used in conjunction with the Fish Barrier
Prioritisation and GBRMPA Blue Maps and Ecological Calculator to indicate sub-basins in the Fitzroy
region that contain high priority wetlands.
A full description of the tool and the assessment undertaken for the Fitzroy region is provided in
Jaensch et al. (2015), summarised in Baker (2015); key points are highlighted here. The desk
assessment involved multiple steps:
1. Identification of important or major wetland sites and aggregations in the FBA region (note
that these did not include Ramsar sites since these are already gaining project support for
managing values).
2. Selecting 20 of those sites as priorities for management action, guided by the DSS process
and local managers, experts and stakeholders.
3. Assigning scores to each wetland for 23 assessment criteria (Table 4.11) within three
categories: values, threats, and capacity (see Baker 2015). Further notes on the application
of the criteria are described in Jaensch et al. (2015).
4. Applying weightings to the criteria to reflect FBA’s water quality targets and circumstances.
Criteria considered likely to be influential to these goals were weighted more highly than
criteria with less influence (see Table 4.11). Careful consideration of the management
objectives is important in this step as criteria may effectively ‘cancel each other out’
depending on the desired outcome.
5. Running a computer application to generate a table of rankings of sites.
A short program of field checking of the scores was conducted, focussed on the top-ranked site from
running the DSS, as well as two low-ranked sites.

89
Table 4.11. Criteria applied in the Wetland DSS, and weightings applied to each criterion. Source:
Jaensch et al. (2015).
Criterion Weighting
VALUES Group weighting = 8
1 Recreational value 4
2 Indigenous value 10
3 Fisheries habitat 9
4 Assimilative capacity for nutrients and sediments 10
5 Populations of rare or threatened taxa 10
6 Vegetation representativeness 8
7 Wetland representativeness 8
8 Species richness / diversity 7
9 Size (km2) 2
10 Waterbird habitat value 8
11 Wetland condition 8
THREATS Group weighting = 10
12 Aquatic habitat connectivity restriction 8
13 Land-use intensity 7
14 Land-use intensification 7
15 Weed invasion 8
16 Water quality 10
17 Point-source pollution 10
18 Hydrological change 6
CAPACITY Group weighting = 10
19 Level of protection 2
20 Financial incentives 10
21 Industry land-use viability 2
22 Engagement capacity 10
23 Best management practice feasibility 8
The top ranking wetlands scored highly in each of the three broad categories, Values, Threats and
Capacity (Figure 4.12. Some of the lower ranked wetlands (in the top 20) scored highly in the Threat
category, but poorly in Values and Capacity indicating that while these wetlands may benefit
considerably from management interventions, the cost and capacity to effectively implement these
makes them a less attractive option than the higher ranked wetlands.
The assessment showed that Torilla Plain, Palm Tree and Robinson Creek Wetlands, and Twelve Mile
Creek were the top-ranked wetlands (Table 4.12; refer to Figure 4.12 for locations). Eight of the top
10 wetland sites were marine plain and/or estuarine systems; in all but one of these sites, threats —
especially the major modifications to hydrology (tide exclusion) — were a strong influence on the
outcome as were the naturally high values (especially fisheries, threatened species and waterbirds).
Only two of the top 10 were freshwater wetlands. Field checking at Torilla Plain verified criteria
scores for the site (with only minor adjustment), providing confidence that the DSS results for
assessed sites were meaningful. Several of the 20 assessed sites — mostly sites involving wetland
aggregations on inland floodplains — were data-poor and not well known to the authors or other

90
wetland experts. Field checking indicated that improved knowledge would likely have led to some
higher scores and rankings for some inland sites.
Table 4.12. Wetland rankings from running the DSS application; refer to map in Figure 4.12 for
location.
DSS rank Wetland code Wetland name Catchment
1 FBA05 Torilla Plain Shoalwater
2 FBA20 Palm Tree & Robinson Creek (Taroom) Upper Dawson
3 FBA12 Twelve Mile Creek (Bajool) Lower Fitzroy
4 FBA01 St.Lawrence Wetlands Styx
5 FBA11 Nankin Plain (Fitzroyvale, Broadmeadows) Lower Fitzroy
6 FBA02 Waverley Plains & Bar Plain Styx
7 FBA09 Iwasaki Wetlands Water Park Creek
8 FBA04 Glen Prairie Wetlands Shoalwater
9 FBA08 Lake Mary Complex Lower Fitzroy
10 FBA03 Wumalgi Peninsula (Broad Sound) Styx
11 FBA10 Joskeleigh & Long Beach Water Park Creek
12 FBA19 Perch & Mimosa Creeks Lower Dawson
13 FBA14 MacKenzie Perched Wetlands McKenzie
14 FBA06 Lower Herbert Creek Wetlands Shoalwater
15 FBA07 Green Lake Complex Lower Fitzroy
16 FBA16 Serpentine Creek (Fitzroy Delta) Lower Fitzroy
17 FBA15 South Yaamba Complex Lower Fitzroy
18 FBA17 Lower Dawson Floodplain Wetlands Lower Dawson
19 FBA13 Lower Isaac Floodplain Wetlands Upper Isaac
20 FBA18 Callide-Don Junction Wetlands Lower Dawson

91
Figure 4.12. Wetland prioritisation results from the application of the Secondary Wetlands DSS to 20 wetlands
in the FBA region.
0
2000
4000
6000
8000
10000
12000
We
igh
ted
Sco
re
Wetland Sites
Wetland Priority
Values Threats Capacity

92
Figure 4.13. Map of Fitzroy wetland prioritisation results from the application of the Secondary Wetlands DSS

93
to 20 wetlands in the FBA region.
Given the particular scope of the criteria in the DSS, coastal wetlands in the GBR catchments may
inevitably rank higher than inland wetlands. For example, many of the coastal wetland sites were
adjacent to the Great Barrier Reef World Heritage Area and other protected areas such as Fish
Habitat Areas, therefore scoring highly on one criterion, whereas inland sites lacked these protected
areas. Furthermore, connectivity between the sea and coastal wetlands is emphasised in the DSS.
Thus it may be useful to consider wetlands in the present/former tidal zone separately from
freshwater inland wetlands. In the results of this project, the top three coastal wetlands were Torilla
Plain, Twelve Mile Creek and St Lawrence Wetlands, and the top three inland wetlands were Palm
Tree and Robinson Creek Wetlands, Lake Mary complex and Perch Creek and Mimosa Creek
complex.
The study demonstrated that many of the wetlands in the FBA region scored highly (8 to 10) against
one or several criteria and therefore are well deserving of NRM investment to protect/enhance
values and reduce threats. Where sites were field-checked, these high scores generally were
validated. The project results thus provide guidance to FBA and others to prioritise future NRM
investment to enhance water quality in the Great Barrier Reef lagoon and to enhance conservation
of biodiversity values in wetlands of the Fitzroy Basin.
4.5.2 Ecological Process Calculator (Eco-Process Calculator)
The GBRMPA Blue Maps and Ecological Calculator are an important element of the system repair
prioritisation for the Fitzroy region, attempting to represent the hydrological connectivity and
ecological function of coastal ecosystems. This component has been coordinated by GBRMPA and
reported in Baker (2015).
Ecological processes provided by catchment coastal ecosystems are critical for the long-term health
and resilience of the GBR. Ecological processes include biological, biogeochemical and physical
processes. For example, coastal ecosystems such as wetlands trap water, allowing sediments to
settle and nutrients to be cycled provided that there are adequate retention times. Wetlands also
slow overland flows allowing greater groundwater recharge and more residual time for ecological
processes to occur. They are also important habitats and refugia with species connected to the Reef
(GBRMPA 201224).
The Ecological Processes Calculator (the Calculator) is a tool that can be used for assessing the
changes to ecological functions that provide services to catchment ecosystems that support the
health and resilience of the GBR. Using expert opinion, the Calculator compares the capacity of pre-
European (pre-clear) coastal ecosystem ecological processes to those of a present day (2009)
catchment made up of natural and modified ecosystems. The Calculator can also be used to estimate
the benefits of improved management practices (current best practice) on the ecological processes
at a catchment scale and applied when identifying priority areas for restoration.
24 Informing the Outlook for Great Barrier Reef Coastal Ecosystems (published in 2012)

94
The ecological services provided by coastal ecosystems are grouped into four functional categories:
recharge-discharge processes; physical processes (sediments); biogeochemical processes; and
biological processes. A detailed description of each of the individual processes/services and how
each was quantified and scored is provided in GBRMPA (2015). The Calculator uses expert
workshops to assign capacity scores for each of these functions, pre-clear and post-clear coastal
ecosystem extents and Australian Land Use Mapping Project (ALMUP) land use data (hectares) to
calculate a percentage change score for each ecological process. Percentage change scores are
calculated for other spatially defined areas such as the coastal zone or floodplain.
An integral part of the Calculator is the Blue Maps developed by GBRMPA. These maps identify the
areas of strongest hydrological connectivity within the catchment, and between the catchment and
the GBR. They essentially map the wetter areas of the catchment and identify those areas with the
greatest value for the delivery of ecological processes that benefit the GBR (Figure 4.14).
Figure 4.14. Example output of Blue Maps for part of the GBR catchment indicating the level of connectivity to
waters of the GBR (left). Orange lines indicate boundaries of river basins. The data layers and connectivity
frequencies used to define the regions in Blue Maps are shown to the right of the map.
4.5.3 Fish Barrier Prioritisation
Barriers to movement for fish species that rely on aquatic connectivity for part of their life cycle,
such as the iconic barramundi species, are an important consideration for coastal ecosystem health
and function in the Fitzroy region. Marsden (2015) has recently completed a review of the 2008
Fitzroy Basin Fish Barrier Prioritisation Project (FBFBPP) (Moore & Marsden 2008) that identified,
assessed, and prioritised all barriers to fish migration within the Fitzroy region. That project
identified 10,502 potential in-stream barriers to fish migration, and used a three-stage process to
prioritise the top 30 barriers for future remediation:
1. automated GIS process based on stream order, position along stream gradient; catchment
condition; area of habitat opened by remediation; downstream barriers

95
2. field validation confirming actual barriers and data collection on physical, biological and
logistical parameters relevant to remediation efforts, and manual refinements
3. final prioritisation based on scores for cost, available financial support, technical
viability/difficulty, productivity benefits, conservation significance, and remediation
effectiveness
Since the original assessment a number of barriers have been remediated within the basin. The 2015
re-assessment considered the 59 barriers identified at Stage 2 of the original process and essentially
removed 13 priority structures that had been remediated to various degrees since the 2008
assessment. However, it is recognised that the effectiveness of remediation efforts have not been
fully assessed and require further consideration. The remaining barriers are listed in order of relative
priority in Table 4.13 and shown in Figure 4.15.
Table 4.13. Prioritisation of the 46 fish passage barriers in the FBA region, re-assessed in the 2015
project. Source: Marsden (2015).
Priority Barrier ID Stream Name Barrier Name/Type Catchment
1 524 Fitzroy R Redbank Crossing Lower Fitzroy
2 1000 Boyne R Manns Weir Boyne
3 523 Fitzroy R Hanrahan's Crossing Lower Fitzroy
4 3951 Fitzroy R Glenroy Crossing Lower Fitzroy
5 3952 Fitzroy R Craiglee Crossing Lower Fitzroy
6 535 Amity Ck Wumalgi Rd/Pipes Styx
7 9001 Boyne R Awonga Dam Boyne
8 6169 Serpentine Lagoon Tidal interface bund wall Lower Fitzroy
9 9393 St.Lawrence Ck St Lawrence Weir Styx
10 8652 Calliope R Blackgate Rd/Pipes Calliope
11 8618 Calliope R Mt Alma Rd Crossing/Pipes Calliope
12 8677 Clairview Ck Clairview Weir Styx
13 2 Mackenzie R Tartrus Weir McKenzie
14 525 Mackenzie R Duaringa Apis Ck Rd McKenzie
15 3 Mackenzie R Bingegang Weir McKenzie
16 8354 Boyne R Pikes Crossing Boyne
17 8716 Amity Ck Old Highway/Pipes Styx
18 9718 Lake Callemondah Barrage Calliope
19 25 Raglan Ck Langmom Rd/Pipes Lower Fitzroy
20 4 Mackenzie R Bedford Weir McKenzie
21 534 Montrose Ck Weir/Town water supply Styx
22 22 Raglan Ck Upper Raglan/Pipes Lower Fitzroy
23 85 8 Mile Ck Bajool Weir Lower Fitzroy
24 9165 Black Swan Ck Flinders Rd-Rundle Ranges Calliope
25 3015 Mackenzie R Tartrus Road Crossing McKenzie
26 4152 Dawson R Boolburra/Pipes Lower Dawson
27 528 Stony Ck Byfield State Forest Water Park
28 82 12 Mile Ck 12 Mile Ck Rd/ Pipes Lower Fitzroy
29 8731 Stoodleigh Ck Barretts Rd/Pipes Styx
30 9629 Sandy Ck Next to railline/Pipes Calliope
31 530 Stony Ck Freemans Crossing Water Park

96
Priority Barrier ID Stream Name Barrier Name/Type Catchment
32 9000 Ewen Ck Stanage Bay Rd/Pipes Shoalwater
33 526 Lake Callemondah (Police Ck)
Creek Crossing Calliope
34 1032 Oakey Ck Archer Station/Pipe Lower Fitzroy
35 8784 Tooloombah Ck (Styx)
Rocky Crossing Styx
36 6348 Dawson R Nuns Crossing Lower Dawson
37 9550 Block Ck Stanage Bay Rd/Pipes Shoalwater
38 9192 Unnamed Wydham Rd-Gladstone/Pipes Calliope
39 69 12 Mile Ck 2nd Barrier u/stream Pipes Lower Fitzroy
40 9041 Coorooman Ck Coorooman Ck Rd/Culverts Water Park
41 6144 12 Mile Ck 3rd Barrier u/stream Pipes Lower Fitzroy
42 6198 Nankin Ck Thompsons Pt Rd/ Culverts Lower Fitzroy
43 8642 Unnamed Harvey St-Gladstone/Pipes Calliope
44 532 Moores Ck Musgrave St weir Lower Fitzroy
45 2664 Dawson R Kianga River Rd/Pipes Lower Dawson
46 8606 Calliope R Pipes Calliope

97
Figure 4.15. Location of the 2015 top 46 priority fish barriers in the Fitzroy region.
98
4.5.4 Integrated System Repair Prioritisation Tool
FBA have combined the outputs of the individual prioritisations described above to generate an
overall scoring system for each neighbourhood catchment within the Fitzroy region. This integrated
tool identifies the sub-basins where management actions can have the greatest impact for the
health of the GBR in terms of ecological function and connectivity. The aim is to address multiple
objectives at the targeted sites to ensure that investments gain the best economical outcomes in
conjunction with the most appropriate system repair actions. The outcomes are not intended as a
final ranking for action, but rather as identifying areas to be considered more closely for the
potential for synergistic benefits from any particular management action.
The methods for the overall prioritisation are described in Baker (2015). It essentially involved
normalising the scores from each of the assessments to provide a relative score for each input
(Figure 4.16), which were then summed for each neighbourhood catchment; however, only the NCs
with at least one ranked fish barrier or ‘priority wetland’ were considered further. The outputs are
likely to be updated and are therefore not reported here; preliminary results are presented in Baker
(2015).

99
a)
b)

100
Figure 4.16. Normalised scores for each of the system repair prioritisation tools: a) Wetlands DSS, b) Fish Barrier Prioritisation; c) GBRMPA Blue Maps.
c)

101
5. Conclusions and recommendations to support the
WQIP Implementation Plan
The information summarised in this report provides a solid basis to guide water quality management
in the Fitzroy NRM region. The region is characterised by significant aquatic ecosystems in
freshwater, coastal and marine environments including coral reefs, seagrass meadows, inland and
coastal wetlands, estuaries, continental and offshore islands and the species they support. Some of
these species are endemic to the Fitzroy region, some are listed as threatened or vulnerable, and
some have significant cultural values. These highly diverse marine and coastal ecosystems support
important industries, including tourism (mainly to the Keppel and Capricorn-Bunker islands and
reefs) and recreational beach activities worth $252 million in 2011–12 (Deloitte Access 2013; Rolfe &
Gregg 2012). Recreational and commercial fisheries are estimated to be worth $10 million and $35
million annually respectively, and target reef fish, mud crabs, and inshore species such as
barramundi and mangrove jack (GBRMPA 2013). The region also supports coastal aquaculture
ventures for finfish and red claw crayfish worth $300,000 annually (EHP 2013).
Assessment of the current status of key marine and coastal assets in the Fitzroy region has identified
a number of assets that are in poor or very poor condition. These include inshore coral reefs, inshore
and reef seagrass meadows, dugongs, turtles, dolphins, low-lying islands, and species of climate-
sensitive seabirds. Marine water quality, strongly influenced by river discharge, is the primary driver
of the health of many of these systems either through direct impacts on corals reefs and seagrass
meadows, or secondary impacts on species such as dugongs and turtles that rely on these areas for
food and habitat. In particular, there is now strong evidence that fine sediment particles pose the
greatest risk to the health of coastal and marine ecosystems, and accordingly, reducing sources of
fine sediments from the catchment should be targeted. These threats highlight the need to continue
to invest in water quality improvement from land management actions in the region.
The Fitzroy Basin is the dominant basin in the region in terms of size, river discharge volume and
pollutant loads, with the smaller coastal basins including the Styx, Water Park, Shoalwater, Calliope
and Boyne basins having a much smaller influence on GBR inshore water quality. The dominant land
uses in the region are grazing (~78%), conservation (~8%), forestry (~6%) and dryland cropping (5%).
Other land uses include coal mining, coal seam gas extraction, urban settlement, horticulture,
irrigated cropping and sugarcane, which are each less than 1% of the regional land use area.
Development of these land uses since the 1890s has led to significant changes in pollutant delivery
(nutrients, sediments and pesticides) from the catchment to the GBR, particularly suspended
sediment loads. The Fitzroy Basin is the highest contributor for all constituents (contributing at least
87% of the total regional load of sediments, nutrients and pesticides). The differences between the
Styx, Shoalwater, Water Park, Calliope and Boyne basins are relatively small.
Sediment loss occurs through hillslope, gully and streambank erosion with recent evidence
suggesting that a much greater proportion of sediment losses can be attributed to the subsoil
erosion process and that the majority of this is likely to be from gully sources. In grazing lands,

102
spatial variability in land type, slope, rainfall, ground cover and management practice all influence
the source and rate of erosion. Surface erosion can also be problematic in cropping lands.
The combined assessment of the relative risk of marine water quality variables highlights that the
marine areas in the highest relative risk class are located in Keppel Bay, extending out to the Keppel
Island Group. Analysis of the zones of influence modelling indicates that the Fitzroy Basin has the
greatest influence on this area, usually on an annual basis. This modelling also suggests that Water
Park Creek and the Calliope River also influence the Keppel Island group in larger flow events;
however, these rivers only contribute 1–2% of the relative combined anthropogenic loads of the
Fitzroy Basin. Nevertheless, when considering combined and cumulative impacts, it is still important
to ensure that the water quality from these basins does not decline, thereby exerting additional
pressures on these receiving environments.
The priority areas for managing TSS loads in the region have been identified at a neighbourhood
catchment (NC) scale. Analysis of the most cost effective locations for targeting sediment load
reduction in the region shows that T21 in the Connors catchment and T32 in the Mackenzie
catchment are the highest priorities. There are also several locations in the Upper and Lower Isaac,
Styx, Shoalwater, Lower Fitzroy, and Callide catchments of the Fitzroy Basin, and to a lesser extent
the Lower Dawson, within the top 20-ranked NCs.
Further analysis by FBA separated grazing and cropping land uses and identified C6 in Theresa Creek
catchment and F17 in the Lower Fitzroy catchment as the highest priorities for cost effective grazing
management. The highest ranking priority for cost effective sediment management in cropping lands
is in T19 in the Upper Isaac catchment. Some of these NCs have highly erosive soils, which provides
an additional focus for investment.
Examples of strategies to manage soil erosion in grazing lands include reducing grazing pressure,
retention of end-of-dry-season ground cover, rehabilitation of lands in poor and very poor condition,
limiting access to river frontage and major streams, and location and management of linear features
to minimise erosion risk.
Cropping areas have been identified with the potential to achieve sediment reductions with low
cost and high adoption rates of improved management practices. Examples of best management
practices include installation and maintenance of contour banks and wheel traffic control. The
advantages of investing in practice change in the grains cropping industry is that the actual impacts
of the change are realised almost immediately, and the changes are relatively easy to verify. This
contrasts with interventions in the grazing industry where benefits are likely to be realised over
longer time periods due to the types of management options, time lags in delivering improvements
and the influence of climate variability.
An assessment of targeting a 30% reduction of TSS from the Fitzroy Basin (the ecologically relevant
target) and a 20% reduction from sediment in the coastal basins (Boyne, Calliope, Water Park,
Shoalwater and Styx) showed that F11 in the Fitzroy catchment received the highest score (= highest
risk) for factors relating to sediment generation, residual cover, management effectiveness and cost.
In addition, there are several NCs in the Connors, Theresa Creek, Fitzroy and Lower Dawson
103
catchments and in areas closer to the coast that also ranked highly, including in the Styx, Shoalwater
and Calliope basins. This scenario identified that targeting more NCs than just those that are ranked
the highest in terms of cost effectiveness is required to achieve the 30% and 20% targets,
respectively.
It is estimated that the cost of achieving the Reef Plan sediment reduction target of 20% is $108
million over 10 years, and it is clear that it is more cost effective to address sediment losses in
cropping lands, at least in the shorter term. This level of investment is easily justified when
considering the value of tourism, recreational and commercial fisheries in the region, which is
estimated to be over $300 million per year (Thomas & Brodie 2015). A mix of delivery and policy
mechanisms will be required to achieve the management practice changes required to meet the
targets — including extension and education, incentives, ecosystem service payments and reverse
auctions — depending on what is being targeted.
The marine areas around Port Curtis and Curtis Island are in the high and moderate relative risk
classes from poor water quality, and were identified in this assessment as being in the receiving
areas of the zones of influence of the Calliope and Boyne rivers each year. While the influence of
these rivers is small in comparison to the Fitzroy River in the context of the whole region, the
Calliope and Boyne basins are important to consider in terms of localised impacts on these receiving
environments and as above, need to be managed to prevent increasing pressure from these basins
in the future. Key land uses in these areas include the Port of Gladstone and Port of Rockhampton,
port-side industries and urban areas.
Other relevant land uses in the region such as coal mining, coal seam gas extraction, and industrial
development are regulated (similar to ports and port-side industries) to comply with a range of
environmental conditions, including water quality guidelines.
The system repair prioritisation combines three tools for wetlands, fish barriers and coastal
ecosystem function, which can be used individually to assess specific management priorities. The
integrated ranking for system repair activities should only be used as guide for evaluating specific
management objectives in the region; however, the process has collated and integrated a complex
set of information that can be used as a starting point for further regional prioritisations taking into
account the individual caveats and limitations of each application. In particular, further work is
required to evaluate the water quality benefits and ecosystem health outcomes of remediation and
restoration actions, such as the installation of fishways and removal of fish barriers.
A summary of the management priorities identified in the supporting studies for progressing
achievement of the ecologically relevant pollutant reduction targets in the region is provided in
Table 5.1. A number of NCs can be identified as relative high priorities for meeting the Reef Plan TSS
reduction targets and system repair priorities, for example:
Styx Basin: F2
Shoalwater Basin: F5, F7
Water Park Basin: F15
Mackenzie catchment: T28

104
Upper Isaac catchment: T19
Lower Fitzroy catchment: F13
Further analysis of these results would be required by FBA before any conclusions regarding
combined priorities at an NC scale could be determined.

105
Table 5.1. Regional priorities for progressing achievement of pollutant reduction targets and system repair priorities in the Fitzroy NRM region. The
relative regional priority is derived from the marine relative risk assessment (Waterhouse et al. 2015a) in the major basins and is based on expert
opinion for the catchments within the Fitzroy Basin taking into account the priority NCs. The NCs highlighted in bold show examples of multiple
priorities in a Catchment. Note: 1 derived from Star et al. (2015a); 2 has been developed by FBA using Star et al. (2015a).
Basin / catchment
Neighbourhood catchments
Relative regional priority
Dominant land uses
Priority Neighbourhood Catchments (NCs) — Derived from top 20 rankings Reef Plan (RP) TSS targets – overall1
Priority NCs to meet RP TSS targets – grazing2
Priority NCs to meet RP TSS
targets – cropping2
Wetland prioritisation Fish barrier prioritisation
Styx F1, F2, F3, F4 Very Low Grazing (80%) F2, F3 F1 N/A (F2) St Lawrence Wetlands, Waverley Plains & Bar Plain, Wumualgi Peninsula (Broadsound)
F2 Wumalgi Rd/Pipes, St Lawrence Weir, Clairview Weir, Old Highway/Pipes
Shoalwater
F5, F6, F7, F8 Very Low Conservation (50%); inc Shoalwater Bay Training Area; grazing (47%)
F7 F7 N/A Torilla Plains (F7), Glen Prairie Wetlands (F5), Lower Herbert Ck Wetlands (F6)
F6 Stanage Road pipes & crossing
Water Park
F9, F15, F26 Very Low Conservation (63%), grazing (14%), urban
F15 None identified
N/A Iwasaki Wetlands (F15), Joskeleigh & Long Beach (F26)
F9 Byfield forest and Freemans crossing F15 Coorooman Creek culverts
Calliope B1, B3, B4, B6, B7, B8, B9, B10, B11
Very Low Grazing (84%), port, urban
None identified
None identified
N/A B8, B9 &B10 Blackgate Rd/Pipes, Mt Alma Rd Crossing/Pipes, Causeway
Boyne B12, B13, B15, B16, B17, B18, B19
Very Low Grazing (74%) None identified
None identified
N/A B12 & B13 Mann’s Weir, Awoonga Dam, Pikes Crossing
Fitzroy Very High

106
Basin / catchment
Neighbourhood catchments
Relative regional priority
Dominant land uses
Priority Neighbourhood Catchments (NCs) — Derived from top 20 rankings Reef Plan (RP) TSS targets – overall1
Priority NCs to meet RP TSS targets – grazing2
Priority NCs to meet RP TSS
targets – cropping2
Wetland prioritisation Fish barrier prioritisation
Connors T2, T3, T4, T5, T8, T9, T10, T11, T16, T17, T21b, T22
Moderate grazing Highly erosive soils: T16
Grazing (88%) T3, T16, T21
T11, T16, T21
T21
Upper Isaac
T1, T6, T7, T12, T13, T14, T15, T18, T19, T20, T21a, T23
Low Highly erosive soils: T15
Grazing (92%) T19, T21 T21 T19, T21 Lower Isaac Floodplain Wetlands (T19, T20)
Lower Isaac
T21c, T24, T25 Moderate Grazing (91%) T21, T24 T21 T24
Theresa Creek
C1, C2, C3, C4, C5, C6, C7, C8, C9, C10, C11, C12, C13
Moderate Grazing (72%), cropping (19%)
C6 C5, C6 C10
Mackenzie
T26, T27, T28, T29, T30, T31, T32, T33, T34, T35, T36, T37, T38, T39, T40
Low Grazing (88%) T28, T32, T39
T29 T28, T32 McKenzie Perched Wetlands (T28)
T28 Tartrus Weir, T39 Duaringa Apis Ck Rd, T31 Bingegang Weir, T36 Bedford Weir
Lower Fitzroy
D4, F10, F11, F12, F13, F14, F16, F17, F18, F19, F20, F21, F22, F23, F24, F25, F27, F28
Moderate Grazing (82%), cropping (1.5%)
F13, F17, F23
F11, F17, F18, F23
F19, F13 Twelve Mile Ck (F27), Nankin Plain (F25), Lake Mary Complex (F21), Green Lake Complex (F13), Serpentine Ck (F27), South Yaamba Complex (F12, F19)
F17 Redbank Crossing, Glenroy Crossing, Craiglee Crossing, F18 Hanrahans Crossing,

107
Basin / catchment
Neighbourhood catchments
Relative regional priority
Dominant land uses
Priority Neighbourhood Catchments (NCs) — Derived from top 20 rankings Reef Plan (RP) TSS targets – overall1
Priority NCs to meet RP TSS targets – grazing2
Priority NCs to meet RP TSS
targets – cropping2
Wetland prioritisation Fish barrier prioritisation
Callide D5, D10, D12, D13, D14, D22, D23, D24, D25, D33, D34
Low Grazing (79%), cropping (10%)
D5, D10 D5, D13 None identified
Nogoa C14, C15, C16, C17, C18, C19, C20, C26, C27, C28, C29, C30, C31, C32
Low Grazing (82%) None identified
None identified
None identified
Comet C21, C22, C23, 24, C25, C33, C34, C35, C36, C37, C38, C39, C40, C41, C42
Moderate grazing & cropping
Grazing (73%), cropping (12%)
C23, C33 C23
Lower Dawson
D1, D2, D3, D6, D7, D8, D9, D15, D16, D17, D18, D19, D20, D21, D26, D28, D29, D30, D31, D32, D38, D39, D40, D41, D49, D50
High Highly erosive soils: D6, D7, D8
Grazing (74%), cropping (8%)
D32, D40 D3, D32, D40, D41
D15, D16, D17, D39
Perch & Mimosa Cks (D6, D7, D8), Lower Dawson Floodplain Wetlands (D2, D3), Callide-Don Junction Wetlands (D5, D13)
D3 Boolburra/Pipes
Upper Dawson
D27, D35, D36, D37, D42, D43, D44, D45, D46, D47, D48, D51, D52, D53, D54, D55, D56, D57, D58, D59, D60, D61, D62, D63, D64, D65, D66
High for cropping Highly erosive soils: D42, D43
Grazing (77%), cropping (4%)
None identified
None identified
D47, D57, D58, D63, D64, D66
Palm Tree & Robinson Ck (Taroom) (D27, D36, D37, D45, D48)

108
6. Limitations and key knowledge gaps
This section includes a summary of the knowledge and information gaps identified within the studies
undertaken to support the WQIP (only those summarised in this report). Further detail is provided in
each report.
6.1 Marine water quality and ecosystem health
The following primary knowledge gaps have been identified for current understanding of the status
of coastal and marine ecosystems relevant to the Fitzroy WQIP.
A better understanding of the actual influence of poor water quality on marine ecosystem
condition relative to other threats, such as changing climate drivers and coastal
development, and in influencing recovery is needed. It is often difficult to tease out the
relative contribution of different pressures on declining habitat condition, and while the
De’ath et al. (2012) study made significant progress in this area, it did not explicitly consider
poor water quality as a driver of reef change. Without this information, any gains in
ecosystem condition as a result of water quality improvements cannot be accurately
measured.
A comparison of the various long-term monitoring data is needed. Currently different
methods are used by different groups to undertake reef monitoring, including by the AIMS
LTMP, Reef Rescue MMP, Reef Check Australia and the GBRMPA Eye on the Reef Program.
The data are collected using different methods — manta tow, video transects, point
sampling and rapid assessments — over different time periods and seasons, and at different
sites. It is not surprising therefore, that results do not provide a consistent message. In order
to determine the relative contribution of water quality and other drivers of change on
ecosystem condition, it is essential that the condition of the GBR ecosystem be consistently
monitored and reported.
The health of freshwater and estuarine ecosystems in catchments adjacent to the GBR
lagoon also need to be consistently monitored and understood. Improvements in knowledge
of the impaired functioning of these systems would help to direct effective on-ground
restoration work aimed at maximising improvements in the quality of water entering the
Reef. Similarly, it is important to better understand the relative contributions to the inshore
marine environment of the different sources of pollutants, to best direct management
actions and restoration activities. This issue is discussed further in the ports synthesis (Flint
et al. 2015).
Understanding the environmental conditions that compromise resilience and identifying
specific communities or habitats that are on the brink of crossing an ecological threshold are
critical for being able to successfully manage pressures on marine ecosystems, including
degraded water quality. When such an ecological threshold has been passed, the ecosystem
may no longer be able to return to a stable state and this can lead to rapid declines in
ecosystem health (Groffman et al. 2006). Identifying thresholds of response when marine

109
and coastal ecosystems decline irreversibly and no amount of water quality improvement
will result in ecological benefits will provide valuable information to catchment
management.
With regard to the influence of port activities specifically, priority gaps in knowledge include
the relative contributions of the various sources (and potential sources) of water quality
issues, making it difficult to predict the efficacy of proposed management actions aimed at
ameliorating water quality concerns. There is also a lack of pre-industrial baseline water
quality data for the Port of Gladstone; gaps in understanding of the impacts of sea and land
disposal of dredge spoil; and a need for better understanding of how the impacts of climate
change will affect resilience of marine ecosystems within and around the ports. Process gaps
exist in cooperative research and data sharing amongst interest groups, particularly in the
Port of Gladstone, which is of interest to a wide variety of agencies and organisations. Gaps
in port water quality knowledge are described in detail by Flint et al. (2015).
Table 6.1 summarises the key knowledge gaps in marine water quality influences in the Fitzroy
region.
Table 6.1. Knowledge gaps in marine water quality influences in the Fitzroy region (adapted from
Flint et al. 2015).
Category Issues Knowledge gap to be filled
Cumulative water quality impacts
Agricultural chemicals
Evaluation / assessment of impact
Impacts on non-coral species and non-reef habitats
Nutrients Source tracking Evaluation / assessment of relative contributions of all sources
Relationship between catchment inflows and nutrient concentrations
Sediments Source/sink tracking including anthropogenic and natural sources
Model validation Relationship between sediment inputs and metals/nutrients
Metals and metalloids
Source tracking Ecological relevance and bioavailability
Urban Development, litter and pollutants
Assessment of pollutant loads in stormwater
Hotspot management and effectiveness of litter reduction strategies
Habitat loss and degradation caused by urban development and expansion
Shipping Oil, litter, pollutants
Cumulative impacts on species / ecosystems and proportionate increase with increasing shipping activity
Impacts of freight transfer spills / emissions (e.g. loading coal onto ships) on reef water quality offshore
Availability / accessibility of ballast water data

110
Category Issues Knowledge gap to be filled
Sediment re-suspension
Potential for fine sediment re-suspension by ship movements and berthing
Incidents [relates to all boating activities]
Understanding impacts of incidents and ecosystem resilience; and how this differs between high numbers of minor incidents versus small numbers of major incidents
Proportion of incidents reported
Ports, construction and industrial
Water quality baselines and habitat loss
Effects on water quality of coastal habitat removal. Negative feedback loops.
Effects on water quality of remedial actions. Positive feedback loops.
Coral and sediment coring to establish environmental histories and local baselines
Cross harbour boating/ferries
Impact of increased boating movements during construction periods on pollutants (e.g. anti-foul, petrochemicals, marine debris)
Potential for fine sediment re-suspension by boat movements
Dredging Impacts of sea and land based maintenance spoil disposal (and relative contributions)
Spatial maps of erosion/ sedimentation and understanding of the drivers
Local impacts of sedimentation and sediment-bound pollutants, and understanding movement/fate of dredged material
Industrial pollutants
Hotspot management (discharge sites)
Effects of cumulative industrial impacts (and maximum allowable impacts) on ecosystems and species
Impacts on water quality of air-borne pollution
Management – industry
Review of individual industry environmental management activities/standards
Best management practices for industry
Reclamation of mangroves and wetlands
Extent of impact on habitats (some research through ERMP) and hydrology
Effects of acid sulfate soils

111
Category Issues Knowledge gap to be filled
Other impacts
Water quality impacts of tourism
Water quality impacts (garbage and toxicants) of non-fishing recreation
Invasive species / hull fouling from international vessels
Quantification (baseline research available) and assessing changes following introduction of cruise ships to Gladstone
Design of recreational facilities (eg boat ramps, jetties)
Redesigned for particular qualities (e.g. fish habitat) versus new installations
Hotspots for petrochemical and nutrient pollution from recreational and commercial vessels
Fisheries inputs (e.g. discarded catch, oil, litter, pollutants) and sediment disturbance
Water quality impacts of fishing activities
Potential for fine sediment re-suspension by boat movements
Re-suspension on trawl grounds from fishing activity
Marine debris (ocean sources)
Understanding the sources, and proportion of marine debris of various size classes that is collected/ recorded (as a sample of the total volume)
Climate change impacts on water quality
Increased flooding with resulting increase in catchment and urban inputs
Increased intensity and possibly increased frequency and intensity of tropical storms Increased frequency of storm surges and resulting issues for outlets
Reduction in ecosystem resilience to other cumulative pressures
6.2 Priority pollutants and material delivery
There are a number of limitations related to the transport, risk and fate of the sediment and
associated particulate constituents delivered from the Fitzroy River which, when better understood
will greatly improve catchment prioritisation. These include:
Better understanding of the processes and role of nutrients in sediment transported to the
GBR lagoon. Specifically, determining the key physical and biogeochemical mechanisms that

112
form sediment flocs e.g. is the fine ‘mineral sediment’ supported by particulate nutrients
(nitrogen or phosphorus) in forming the floc aggregates? Or are dissolved nutrients (nitrogen
or phosphorus?) the key drivers of floc aggregate formation? Further, what proportion of
the dissolved nutrients is being generated by the mineralisation of particulate nutrients
within the catchment and in the GBR lagoon?
Renewed tracing of sediment sources in the Fitzroy Basin. There are currently some
discrepancies between the geochemical tracing data and catchment sediment budgets
developed through monitoring and modelling. More refined tracing is required in the
catchment area to better characterise the different sediment sources.
Characterise and trace the sediment that directly contributes to reduced photic depth back
to a specific catchment source. To date no direct sampling or characterisation of sediment
in Fitzroy River flood plumes or re-suspension events in Keppel Bay has occurred to trace
sediment back to a specific catchment source (i.e. what catchment area/soil type from what
erosion processes).
Further examine and quantify the effectiveness of remediation on hillslopes, gullies and
stream banks. There is sufficient evidence to demonstrate the consequences of removing
vegetation and its effects on run-off and erosion; however, there is very little evidence
supporting the re-introduction or improvement of vegetation on these processes. New and
innovative approaches may be required.
Better quantification of erosion features to see how they are responding to land use
change. LiDAR data are now available in most coastal areas and could be used to help
identify at-risk erosion features as well as be used to evaluate the response of these features
to improved vegetation.
Gully activity and fine resolution mapping and monitoring of extent/severity rather than
presence/absence.
6.3 Relative risk assessment
There are several limitations associated with the relative risk assessment, primarily:
Limitations to the input datasets in terms of data collection, temporal and spatial resolution
influence the certainty of the risk assessment outcomes (see Waterhouse et al. 2015)
Further validation of remote sensing-based results is required for locations with naturally
high turbidity that confounds existing algorithms.
The risk classes for individual water quality variables are not equivalent in terms of
ecological impact, and are therefore not directly comparable without recognition and
quantification of these differences.
Only a limited sensitivity analysis has been conducted that tested weighting of variables. The
scope of the assessment is limited in terms of the coverage of social and economic issues.

113
Assessment of anthropogenic nutrient loads from grazing lands.
These limitations have been translated into priority information needs for future risk assessments of
water quality in the Fitzroy region:
1. Scoping of the availability of, and acquisition of, more consistent temporal and spatial data
for all water quality variables (including those not included in the most recent assessment
such as phosphorus and particulate nutrients) and their ecological impacts to enable
improved classification in terms of ecological risk and application of a formal risk assessment
framework (which includes assessments of likelihood and consequence).
2. Refinement of the approach to estimate the zones of influence for each seaward-draining
river.
3. Better understanding of the responses of key GBR ecosystem components to cumulative
impacts of repeat exposure to poor water quality, and the cumulative impacts of multiple
water quality pressures.
4. Validation of the remote sensing data for turbidity, particularly in areas that are known to be
naturally highly turbid or where existing validation data is limited, such as in Shoalwater Bay
and Broad Sound.
5. Better understanding of the prevalence and associated effects of other pollutants (e.g.
microplastics, endocrine-disrupting substances, oil and polycyclic aromatic hydrocarbons,
pharmaceuticals and metals and metalloids) on GBR ecosystems and species.
6. Improved measurement and understanding of the sources of anthropogenic nutrients in the
region, and the delivery and fate of particulate nutrients and importance for coastal and
marine ecosystems.
7. Extending the habitat assessments beyond coral reefs and seagrass to include coastal
ecosystems such as freshwater and coastal wetlands, mangroves and estuarine
environments, and non-reef bioregions.
6.4 Targets
In the course of estimating ecologically relevant targets (ERTs) for the Fitzroy region a number of
important information and research gaps constrained estimation of targets for some parameters.
These include:
1. Bioavailability of PN. The bioavailability of PON discharged from rivers to the GBR is not
accurately known. Although it is generally believed that most PON can become bioavailable
through bacterial mineralisation in its residence time period in the GBR lagoon (Brodie et al.
2012b; Brodie et al. 2015), no studies have examined this in detail. This is recognised as a
major research gap and currently active attempts are being made to seek funding to
research this issue.
2. Silt versus clay fractions in river discharge data. While the Queensland GBR River
Monitoring Program does measure particle size fractions in the rivers monitored (including

114
the Fitzroy River), analysis of silt-sized fractions (4–63 m) is only currently reported as total
silt (Turner et al. 2013) and not the sub-categories, e.g. fine silt (4–16 m). This is a relatively
minor issue that can be easily resolved with the Monitoring Team.
3. Role of DIP/phosphate. While management of DIP (phosphate, orthophosphate, FRP) was
missing from Reef Plan 2013, DIP is still an important parameter to consider when modelling
nitrification and eutrophication of the GBR (Brodie et al. 2011). Targets have not been
developed for DIP but that is a topic that needs further research as to its importance.
4. The other basins besides the Fitzroy. While the Fitzroy Region is dominated by the Fitzroy
Basin and indeed the Fitzroy catchment, the other basins are also important. Information on
the Styx, Water Park, Calliope, Boyne and Shoalwater basins is much more limited than for
the Fitzroy Basin and this severely constrains the ability to set regionally relevant targets for
these basins.
5. Nutrient modelling. The Fitzroy region does not have an operational version of the
ChloroSim model (Wooldridge et al. 2015). In addition, while there is a biogeochemical
model designed by Barbara Robson and others (Robson et al. 2006) it only covers the inner
part of Keppel Bay and is not suitable for analysing chlorophyll dynamics at the whole-of-
Fitzroy marine region scale. A new biogeochemical model is in development under the
eReefs program but is not available for use at this time.
6. Confidence in anthropogenic DIN estimates. Estimates of the anthropogenic load of DIN
from cropping lands in the Fitzroy (cotton and grains mainly but also some horticulture) is
not provided in Source Catchments in the version reported in the WQIP. In addition, an
understanding of anthropogenic DIN loads from grazing lands, while modelled, is not fully
understood with respect to the cause(s) of the load.
There is far less information available for all parameters used in setting ERTs for the other five basins
in the region compared to the Fitzroy Basin.
6.5 Management prioritisation for TSS
A separate report has been prepared that highlights the recommendations and gaps from this work
(Star et al. 2015b) and should be accessed for a full description of knowledge gaps. The key points are
summarised here, extracted from that report.
The data used to prioritise the scenarios used the Source Catchments Modelling for identification of
where and how much sediment, nutrient and herbicide was being exported to the GBR from the
different erosion processes and industries. Ground cover data was used to estimate the cover for the
past seven years and adjusted in the landscape relative to rainfall. Paddock to Reef management
practice survey data was used to estimate the effectiveness of investments following the rationale
that higher level management practices would be required to support infrastructure investments.
Economic cost data was used to estimate three cost components: the opportunity cost, the
infrastructure and maintenance cost, and extension costs. Finally, because of the time pressure to

115
achieve outcomes, the sediment delivery ratio (what is generated on the paddock compared to what
is exported to the GBR) was taken into consideration. The NCs that ranked highly across all of these
parameters were selected as priority NCs for future investment. Each of the input data layers is
highly complex and has associated limitations and caveats. However, the process does identify key
areas where improvements and focussed outcomes can be achieved.
Within each of these NCs, the different geography, biophysical characteristics, and prevalent
management regime, dictates that a range of investment is required. There is also the opportunity
to further customise program design to achieve improved outcomes and more efficient results. Key
recommendations include:
Future incentive programs: Focus funding on very high and high or large projects, tailoring
delivery options to specific situations, providing sufficient extension support to landholders
and implementing a high degree of monitoring and evaluation.
Integrating interventions: Using a mix of incentives and extension to achieve the most cost
efficient TSS reductions.
Opportunities in cropping: The cropping areas are typically located in the fine sediment soil
types, which are known to present the greatest risk to GBR ecosystems, and there are
proven and short-term gains to be achieved in minimising soil loss.
Collaboration with resource companies: Partnering with resource companies that are
managing grazing lands under mining leases may provide opportunities for stock exclusion
and larger scale remediation.
A number of knowledge gaps related to process understanding, assessing management effectiveness
and economic data and costs are also highlighted.
Biophysical processes
The understanding of cropping and its contribution to both sediment and nutrient loads is
limited. Increased awareness of the role of fine sediments <4 μm, and the link between soil
particle size and nutrients bound to it, have been highlighted (Bainbridge et al. 2012).
However, paddock-scale studies indicate a net nitrogen deficit rather than nitrogen surplus
and suggests that rates of nitrogen fertiliser application may not be the issue in the grains
industry. However, the inherent nitrogen existing in Brigalow soils may be critical, with soil
management potentially providing the most efficient approach to reductions. Further
research is required to fully understand these trade-offs.
The identification of current soil erosion hotspots is solely based on current scientific
information accounted for in Source Catchment Modelling. Past sediment tracing studies,
soil erosivity mapping and gully mapping have all occurred in the Burdekin; however, not in
the Fitzroy region to date. Therefore there are limiting data sets to update Source
Catchment Modelling. Furthermore, the biophysical processes of soil erosion remain poorly
understood, and there are only very limited trial or study sites established in the Fitzroy
Basin that aim to increase the knowledge base about local soil erosion processes. Hence,
there is a severe lack in the scientific understanding of how biophysical erosion processes
work on a small and large spatial scale in the Fitzroy region.

116
Higher resolution soil erosion mapping is required. This is a resource-intensive task (labour
and technical) that will require time and funding to produce a complete initial record of
erosion types for the Fitzroy region.
There is limited understanding of the effectiveness of treatments by varied approaches to
gully remediation. Streambank erosion, particularly in the areas of basalt soils where fine
sediments contribute, is poorly understood. Further research regarding streambank
remediation is required. Hillslope erosion is the key driver of streambank and gully erosion
processes and the importance of cover should still be a key focus across the catchment.
Management effectiveness
The direct link between management practice data and cover is complex due to time lags,
isolated rainfall events and the land type inherent resilience. Currently, ground cover
mapping is used extensively for assessing erosion and land condition; however, to ensure
the correct algorithms and metrics are used, continual development and progression is
required.
The management effectiveness data layer has not taken into consideration the impact of
grazing that has occurred in national parks under the previous government, nor has it
accounted for the grazing lease agreements that are potentially in place with mining
companies. These are areas where further research is required.
Economic data and costs
The costs of erosion management have not been estimated in the literature before. Hence,
the cost function presented in this study is novel and universally applicable to erosion
processes. However, assumptions made for the management costs of soil erosion are
comprehensive and need to be refined based on a range of local case studies. It should also
be mentioned the simplest management scenario that was chosen in this study for grazing
and cropping may not be appropriate for every site or neighborhood catchment.
The bioeconomic models are simplistic in assuming that each property reflects the
neighbourhood catchment’s condition level and average stocking rates (based on the
combination of land types in the NC). In addition, pasture utilisation rates are applied
uniformly across each property.
The analysis adopts an implicit assumption that reducing sediment emissions at the paddock
level will subsequently reduce emissions at the end of the catchment, leading to
improvements in water quality. The temporal lags between the load entering the river and
the load entering the GBR have been accounted for in the delivery ratio.
The bioeconomic modelling has not captured all biophysical factors, such as site-specific
effects, while the costs may not adequately reflect cumulative and threshold effects. It is
assumed that landholders are always maximising profit and have perfect knowledge.
The cost factor accounts for initial capital infrastructure cost of the most simplistic approach
and therefore only represents a cost comparison. The costs are adjusted up or down based
on the load as an indication of complexity; however, only by a factor adjustment, and
therefore it has not fully accounted for site-specific steps. The costs do, however, allow
comparable decisions to be made amongst NCs. Involvement of comprehensive economic

117
analysis in remediation projects over the long term would ensure that the trade-offs are
better accounted for in future assessments.
6.6 System repair prioritisation
Wetland prioritisation
Wetland prioritisation could have been significantly influenced by the scarcity of data on
inland floodplain wetlands — as shown by the field visits to two inland sites. With several
floodplain aggregations included in the assessment, a project that specifically collates
information on values, threats and capacity at floodplain wetlands would be worthwhile.
Many sites, including coastal areas, lacked some basic information, underlining the overall
need for gap-filling inventories and assessments at many of the basin’s wetlands.
Given the scope of the criteria in the decision support system, coastal wetlands in the GBR
catchments may inevitably rank higher than inland wetlands; users should consider the
benefits of conducting separate coastal and inland assessments for future assessments.
Fish barrier prioritisation
A review of the 2008 data has identified a number of barriers that were not identified in the
original prioritisation. It is recommended that updated higher resolution imagery is used to
identify and score these new barriers.
The emphasis on coastal systems has meant that some of the inland rivers, such as the
Dawson and Mackenzie rivers that support potadromous species (can maintain populations
either side of barriers), which still require free movement, are not ranked highly.
Wetland barriers were not considered in the assessment but information is available about
fish barriers in off-stream storage and should be included in future prioritisations.
Careful monitoring of barriers that have been remediated should be undertaken to ensure
that they operate efficiently and function as per the intended design; it was assumed that
barriers that received some sort of remediation effort were no longer part of the
assessment. The operation and maintenance of fishways is an ongoing challenge.
There is a need to develop an investment strategy for a fish migration barrier remediation
program targeting barriers in the top 46 barriers to fish passage identified in Marsden
(2015).
Ecological Calculator
A large proportion of the information used to populate the Ecological Calculator is based on expert
opinion, highlighting a significant data gap in our ability to quantify the water quality outcomes and
ecosystem functions associated with modification of ecological processes at different spatial and
temporal scales. Importantly, these estimates may apply differently to different ecosystems, in
different parts of the catchment and on different geologies. Scores can also vary based on the way
people think of a land use or coastal ecosystem.
Important limitations and gaps to the approach include:

118
Local application is more robust for smaller catchment scales. In large systems, like the
Fitzroy region, variability in rainfall and climate across the catchment can result in
differences in capacities for some systems and processes.
Scores are assigned based upon expert elucidation. There is a need for research to provide
metrics that can be used with this tool to improve resolution, especially for the more
important processes.
The capacity of an ecosystem to deliver a particular process may vary based on its location in
the landscape — for example in the Fitzroy region, remnant rainforests are sited in hills and
do very little to trap nutrients as there is very little nutrient input.
There is a tendency to score ecosystems based on the remaining extents, e.g. in the Fitzroy
region, workshop participants scored the rainforests based on their knowledge of remnant
hilltop rainforests and failed to consider pre-clear lowland rainforests. This can skew results
based on pre-clear extents of some ecosystems.
The calculations are based on extents and current best practice measurements are based on
numbers of farms. For the calculator to include best practice it needs the areas of the farms
within the target areas.
Some ecological processes that are in the tool may only be relevant to a specific area. For
example, management of potential acid sulfate soils primarily applies to the coastal zone.
Some processes can be interpreted differently in different areas. For example, capacity to
regulate salinity can be relevant to either tidal areas or groundwater salinity. Therefore, the
approach would benefit from reducing the list of processes to a set of key processes, as the
current list reflects the original workshop list of ecological processes.
Underlying geology could be used to refine mapping. For example, grass on highly erosive
soils might have a higher capacity score than those on alluvium soils, based on the nature of
the soil/geology.
Overall assessment
While the integrated ranking of the system repair tools provides a useful guide to regional priorities,
it is important to recognise the limitations in combining the outputs of the tools, which have quite
different objectives. These limitations and caveats are clearly identified in Westley (2015). It is stated
that the ideal final tool for prioritising work in the Fitzroy region will provide not only a single final
score for each NC, but will allow the user to drill down through layers that represent and capture the
complexities of each individual sub-tool, thereby allowing management decisions to be based on a
full appreciation of the complexity and connectivity among different parts of the basin.
7. Closure
This document was prepared by FBA in collaboration with our Program partners. If you have any
questions or require additional details, please contact FBA at [email protected].

119
8. References
AIMS [Australian Institute of Marine Science] 2013. Long-term Monitoring Program Report,
Australian Institute of Marine Science, Townsville.
Bainbridge, Z.T., Wolanski, E., Alvarez-Romero, J.G., Lewis, S.E., Brodie, J.E. 2012. Fine sediment and
nutrient dynamics related to particle size and floc formation in a Burdekin River flood plume,
Australia. Marine Pollution Bulletin 65, 236 – 248. doi: 10.1016/j.marpolbul.2012.01.043
Bainbridge, Z.T., Lewis, S.E., Smithers, S.G., Kuhnert, P.M., Henderson, B.L., Brodie, J.E. 2014.
Suspended sediment sources, transport and export from a large, seasonally-dry tropical catchment:
Burdekin River catchment, Queensland, Australia. Water Resources Research 50, 9067 – 9087.
Bainbridge, Z., Lewis, S., Smithers, S., Wilkinson, S., Douglas, G., Hillier, S., Brodie, J. In review. Clay
mineral source tracing and characterisation of Burdekin River and flood plume fine sediment. Journal
of Soils and Sediments.
Baker, R. 2015. Ecosystem Repair Prioritisation. Report to the Fitzroy Basin Association for the
Fitzroy Water Quality Improvement Plan, July 2015.
Ban, S.S., Pressey, R.L., Graham, N.A.J. 2015. Assessing the Effectiveness of Local Management of
Coral Reefs Using Expert Opinion and Spatial Bayesian Modeling. PLoS ONE 10(8): e0135465.
doi:10.1371/journal.pone.0135465
Bartley, R., Corfield, J. P., Abbott, B. N., Hawdon, A. A., Wilkinson, S. N., Nelson, B. 2010. Impacts of
improved grazing land management on sediment yields, Part 1: Hillslope processes. Journal of
Hydrology 389, 237-248.
Bartley, R., Bainbridge, Z.T., Lewis , S.E., Kroon, F.J., Wilkinson, S.N., Brodie J.E., Silburn, D.M. 2014.
Relating sediment impacts on coral reefs to watershed sources, processes and management: A
review. Science of the Total Environment 468-469, 1138-1153.
Berkelmans, R., De'ath, G., Kininmonth, S., Skirving, W.J. 2004. A comparison of the 1998 and 2002
coral bleaching events on the Great Barrier Reef: spatial correlation, patterns, and predictions. Coral
Reefs 23, 74-83.
Berkelmans, R., Jones, A.M., Schaffelke, B. 2012. Salinity thresholds of Acropora spp. on the Great
Barrier Reef. Coral Reefs, 31, 1103-1110.
Brodie, J., Mitchell, A. 1992. In: Byron, G.T. (ed.) Workshop on the Impacts of Flooding: Proceedings
of a Workshop held in Rockhampton, Australia, 27 September 1991. Queensland: Queensland
Department of Environment and Heritage and Great Barrier Reef Marine Park Authority.
Brodie, J., Lewis, S., Bainbridge, Z., Mitchell, A., Waterhouse, J., Kroon, F. 2009. Pollutant discharge
management target setting for rivers in the Great Barrier Reef Catchment Area. Marine and
Freshwater Research 60, 1141–1149.
120
Brodie, J., De’ath, G., Devlin, M., Furnas, M., Wright, M. 2007. Spatial and temporal patterns of near-
surface chlorophyll a in the Great Barrier Reef lagoon. Marine and Freshwater Research 58, 342–
353.
Brodie, J.E., Devlin, M., Haynes, D., Waterhouse, J. 2011. Assessment of the eutrophication status of
the Great Barrier Reef lagoon (Australia). Biogeochemistry 106, 281-302.
Brodie, J., Kroon, F., Schaffelke, B., Wolanski, E., Lewis, S., Devlin, M., Bainbridge, Z., Waterhouse, J.,
Davis, A. 2012. Terrestrial pollutant runoff to the Great Barrier Reef: current issues, priorities and
management responses. Marine Pollution Bulletin 65, 81–100.
Brodie, J., Waterhouse, J., Schaffelke, B., Furnas, M., Maynard, J., Collier, C., Lewis, S., Warne, M.,
Fabricius, K., Devlin, M., McKenzie, L., Yorkston, H., Randall, L., Bennett, J., Brando, V. 2013a.
Scientific Consensus Statement. Chapter 3: Relative risks to the Great Barrier Reef from degraded
water quality The State of Queensland. Published by the Reef Water Quality Protection Plan
Secretariat, July 2013. http://www.reefplan.qld.gov.au/about/scientific-consensus-
statement/water-quality-risks.aspx
Brodie, J., Lewis, S., Wooldridge, S., Bainbridge, Z., Waterhouse, J., Honchin, C. 2015. Ecologically
relevant targets for pollutant discharge from the drainage basins of the Fitzroy Region, Great Barrier
Reef. Report to Fitzroy Basin Association for the Fitzroy Water Quality Improvement Plan.
Bruno, J., Petes, L.E., Harvell, D., Hettinger, A. 2003. Nutrient enrichment can increase the severity of
coral diseases. Ecology Letters 6, 1056-1061.
Bruno, J.F., Selig, E.R., Casey, K.S., Page, C.A., Willis, B.L., Harvell, C.D.S., Melendy, A.M. 2007.
Thermal stress and coral cover as drivers of coral disease outbreaks. PLoS Biol 5 (e124), 1220-1227.
Burke, L. Reytar, K. Spalding, M. Perry, A. 2011. Reefs at risk revisited. World Resources Institute,
Washington, DC, p. 114. Available at www.wri.org.
Burton, J., Furuichi, T., Lewis, S., Olley, J., Wilkinson, S. 2014. Identifying Erosion Processes and
Sources in the Burdekin Dry Tropics Catchment - Synthesis Report. Department of Science,
Information Technology and Innovation, Brisbane.
Byron, G.T., O'Neill, J.P. 1992. Flood induced coral mortality on fringing reefs in Keppel Bay. In:
Byron, G.T. (ed.) Workshop Series No. 17 on the Impacts of Flooding: Proceedings of a Workshop
held in Rockhampton, Australia, 1991. Queensland Department of Environment and Heritage and
Great Barrier Reef Marine Park Authority, Townsville.
Carroll, C., Halpin, M., Burger, P., Bell, K., Sallaway, M.M., Yule, D.F. 1997. The effect of crop type,
crop rotation, and tillage practice on runoff and soil loss on a Vertisol in central Queensland.
Australian Journal of Soil Research 35, 925-939.
Carroll, C., Waters, D., Vardy, S., Silburn, D.M., Attard, S., Thorburn, P.J., Davis, A.M., Schmidt, M.,
Wilson, B., Clark, A. 2012. A paddock to reef monitoring and modelling framework for the Great
Barrier Reef: paddock and catchment component. Marine Pollution Bulletin 65, 136–149.

121
Christensen, S., Rogers, C. 2004. Central Queensland Strategy for Sustainability: 2004 and beyond.
Rockhampton, Queensland.
Climate Commission Secretariat 2013. The Critical Decade: Extreme Weather. Department of Climate
Change and Energy Efficiency, Australian Government, Canberra, 12 p.
Coates, M. 1992. Effects of the January 1991 Fitzroy Flood on Intertidal Invertebrate Communities of
Keppel Bay. Workshop Series No. 17 on the impacts of flooding. Townsville, Australia: Great Barrier
Reef Marine Park Authority.
Collier, C., Waycott, M., Ospina, A.G., 2012. Responses of four Indo-West Pacific seagrass species to
shading. Marine Pollution Bulletin 65, 342-354.
Collier, C., 2013. Chapter 7: Review of the risks to seagrasses of the Great Barrier Reef caused by
declining water quality. In: Assessment of the relative risk of water quality to ecosystems of the
Great Barrier Reef: Supporting Studies. A report to the Department of the Environment and Heritage
Protection, Queensland Government, Brisbane. TropWATER Report 13/30, Townsville, Australia.
Connell, D.W., Bycroft, B.M., Miller, G.J., Lather, P. 1981. Effects of a barrage on flushing and water
quality in the Fitzroy river estuary, Qld. Australian Journal of Marine and Freshwater Research 32,
57-63.
De’ath, G., Fabricius, K.E. 2008. Water Quality of the Great Barrier Reef: Distributions, Effects on
Reef Biota and Trigger Values for the Protection of Ecosystem Health, Research Publication No. 89.
Great Barrier Marine Park Authority, Townsville, 104pp.
De’ath, G., Fabricius, K.E. 2010. Water quality as a regional driver of coral biodiversity and
macroalgae on the Great Barrier Reef. Ecological Applications, 20, 840–850.
De'ath, G., Fabricius, K., Sweatman, H., Puotinen, M. 2012. The 27 year decline of coral cover on the
Great Barrier Reef and its causes. PNAS, 109, 44, 17995-17999.
Deloitte Access Economics 2013. Economic contribution of the Great Barrier Reef, Great Barrier Reef
Marine Park Authority, Townsville.
DEEDI [Department of Employment, Economic Development and Innovation] (2012a) Bowen Basin
coal mines and coal projects. Queensland Government Department of Employment, Economic
Development and Innovation. Brisbane, Queensland.
Department of Mining and Safety (2012) Mount Morgan Mine Rehabilitation Project. Queensland's
abandoned mines. Abandoned Mines Unit, Mine Safety and Health, Department of Natural
Resources and Mines. Rockhampton, Queensland.
Devlin, M.J., McKinna, L. I. W., Alvarez-Romero, J. G., Abott, B., Harkness, P., Brodie, J. 2012.
Mapping the pollutants in surface river plume waters in the Great Barrier Reef, Australia. Marine
Pollution Bulletin, 65, 224-235.

122
Devney, C.A., Caley, M.J., Congdon, B.C. 2010. Plasticity of noddy parents and offspring to sea-
surface temperature anomalies. PLoS ONE, 5(7): e11891. doi:10.1371/journal.pone.0011891.
Diaz-Pulido, G., McCook, L.J., Dove, S., Berkelmans, R., Roff, G., Kline, D.I., Weeks, S., Evans, R.D.,
Williamson, D.H., Hoegh-Guldberg, O. 2009. Doom and boom on a resilient reef: climate change,
algal overgrowth and coral recovery. PLoS One, 4 (4):e5239. doi:10. 1371/journal. pone. 0005239.
Dougall, C., Carrol, C., Herring, M., Trevithick, R., Neilson, S., Burger, P. 2008. Enhanced sediment
and nutrient modelling and target setting in the Fitzroy Basin. Queensland Department of Natural
Resources and Water.
Dougall, C., McCloskey, G.L., Ellis, R., Shaw, M., Waters, D., Carroll, C. 2014 Modelling reductions of
pollutant loads due to improved management practices in the Great Barrier Reef catchments –
Fitzroy NRM region, Technical Report, Volume 6, Queensland Department of Natural Resources and
Mines, Rockhampton, Queensland (ISBN: 978-0-7345-0444-9).
Douglas, G.B., Ford, P.W., Palmer, M.R., Noble, R.M., Packett, R.J. Krull, E.S. 2008. Fitzroy River Basin,
Queensland, Australia. IV. Identification of flood sediment sources in the Fitzroy River.
Environmental Chemistry 5, 243-257.
Fabricius, K.E. 2011. Factors determining the resilience of coral reefs to eutrophication: A review and
conceptual model. In: Z. Dubinsky and N. Stambler (Eds) Coral Reefs: An Ecosystem in Transition,
Springer Press, 493-506.
Fabricius, K. E., De’ath, G., Humphrey, C., Zagorskis, I., Schaffelke, B. 2013a. Intra-annual variation in
turbidity in response to terrestrial runoff on near-shore coral reefs of the Great Barrier Reef.
Estuarine, Coastal and Shelf Science 116, 57-65.
Fabricius, K.E., Cséke, S., Humphrey, C., De’ath, G. 2013b. Does Trophic Status Enhance or Reduce
the Thermal Tolerance of Scleractinian Corals? A Review, Experiment and Conceptual Framework.
PLoS ONE, 8, e54399.
Fabricius, K.E., Logan, M., Weeks, S., Brodie, J. 2014. The effects of river run-off on water clarity
across the central Great Barrier Reef, Marine Pollution Bulletin 84, 191-200.
doi.org/10.1016/j.marpolbul.2014.05.012.
Finlayson, C.M. 2000. Loss and degradation of Australian wetlands. Paper presented at LAW ASIA
Conference: Environmental law issues in the Asia-Pacific region. Environmental Research Institute of
the Supervising Scientist, Northern Territory.
Flint, N., Rolfe, J., Jones, C., Sellens, C., Rose, A., Fabbro, L. 2013. Technical Review for the
Development of an Ecosystem Health Index and Report Card for the Fitzroy Partnership for River
Health. Part A: Review of Ecosystem Health Indicators for the Fitzroy Basin. CQUniversity Centre for
Environmental Management, Rockhampton.
Flint, N., Kinnear, S., Tucker, G. 2014. Investigating management and use options for coastal
wetlands – Kinka case study. Report to Rockhampton Regional Council. CQUniversity, Rockhampton.

123
Flint, N., Jackson, E., Wilson, S., Verlis, K., Rolfe, J. 2015. Synthesis of water quality influences in ports
of the Fitzroy region, Queensland. A report to the Fitzroy Basin Association for the Fitzroy Water
Quality Improvement Plan. CQUniversity Australia, North Rockhampton, Queensland.
Flores, F., Hoogenboom, M.O., Smith, L.D., Cooper, T.F., Abrego, D., Negri, A.P. 2012. Chronic
exposure of corals to fine sediments: lethal and sub-lethal impacts. PLoS ONE 7: e37795.
Gallen, C., Devlin, M., Thompson, K., Paxman, C., Mueller, J. 2014. Pesticide monitoring in inshore
waters of the Great Barrier Reef using both time – integrated and event monitoring techniques
(2013 – 2014). The University of Queensland, The National Research Centre for Environmental
Toxicology (Entox).
GBRMPA [Great Barrier Reef Marine Park Authority] 2009. Great Barrier Reef Outlook Report 2009.
Great Barrier Reef Marine Park Authority, Townsville, 192pp.
GBRMPA [Great Barrier Reef Marine Park Authority] 2010 Water quality guidelines for the Great
Barrier Reef Marine Park [revised version]. Great Barrier Reef Marine Park Authority, Townsville.
GBRMPA [Great Barrier Reef Marine Park Authority] 2012. Informing the Outlook for Great Barrier
Reef Coastal Ecosystems.
GBRMPA [Great Barrier Reef Marine Park Authority] 2013. Fitzroy basin assessment: Fitzroy basin
Association Natural Regional Management. GBRMPA, Townsville.
GBRMPA [Great Barrier Reef Marine Park Authority] 2014. Great Barrier Reef Outlook Report 2014.
GBRMPA, Townsville.
GBRMPA [Great Barrier Reef Marine Park Authority] 2015. Ecological Calculator assessment for the
Fitzroy region. Draft report to the Fitzroy Basin Association.
Gowan, J. C., Tootell, J. S., Carpenter, R. C. 2014. The effects of water flow and sedimentation on
interactions between massive Porites and algal turf. Coral Reefs 33(3), 651-663.
Goatley, C. H., Bellwood, D.R. 2012. Sediment suppresses herbivory across a coral reef depth
gradient. Biology letters, 8(6), 1016-1018.
Goatley, C. H., Bellwood, D.R. 2013. Ecological consequences of sediment on high-energy coral reefs.
PloS one, 8(10), e77737.
Graham, N.A., Jennings, S., MacNeil, M.A., Mouillot, D., Wilson, S.K. 2015. Predicting climate-driven
regime shifts versus rebound potential in coral reefs. Nature, 518(7537), 94-97.
Groffman, P., Baron, J.S., Blett, T. et al. 2006. Ecological thresholds: the key to successful
environmental management or an important concept with no practical application? Ecosystems 9(1),
1–13.

124
Gunn, J. 2014. Urban Land Use in Great Barrier Reef Water Quality Improvement Plans: Background
Report and Considered Guidance, Reef Urban Stormwater Management Improvement Group
(RUSMIG), Water by Design and Creek to Coral, Townsville.
Gunn, J. 2015. Gladstone Urban Profile for the Fitzroy Basin Water Quality Improvement Plan, Fitzroy
Basin Association, Rockhampton.
Haapkyla, J., Unsworth, K.F., Flavell, M., Bourne, D.G., Schaffelke, B., Willis, B.L. 2011. Seasonal
Rainfall and Runoff Promote Coral Disease on an Inshore Reef. Plos One, 6(2): e16893.
Halford, A., Cheal, A.J., Ryan, D., Williams, D. 2004. Resilience to large-scale disturbance in coral and
fish assemblages on the Great Barrier Reef. Ecology, 85(7), 1892-1905.
Halliday, I.A., Robins, J.B., Mayer, D.G. Staunton Smith, J., Sellin, M.J. 2011. Freshwater flows affect
the year-class-strength of Barramundi (Lates calcarifer) in the Fitzroy River estuary, Central
Queensland. Proceedings of the Royal Society of Queensland 116, 1-11.
Hamann, M., Limpus, C.J., Read, M.A. 2007. Vulnerability of marine reptiles in the Great Barrier Reef
to climate change. In: Climate Change and the Great Barrier Reef, J.E. Johnson and P.A. Marshall
(Eds), Great Barrier Reef Marine Park Authority, Australian Government, 445-496 pp.
HLAE 2007. Wetland Decision Support System—Workshop Manual. Report by HLA-Envirosciences to
Department of Water Resources.
Hoegh-Guldberg, O., Mumby, P.J., Hooten, A.J., Steneck, R.S., Greenfield, P., Gomez, E., Harvell, C.D.,
Sale, P.F., Edwards, A.J., Caldeira, K., Knowlton, N., Eakin, C.M., Iglesias-Prieto, R., Muthiga, N.,
Bradbury, R.H., Dubi, A., Hatziolos, M.E. 2007. Coral reefs under rapid climate change and ocean
acidification. Science 318, 1737-1742.
Houston, W.A., Black, R.L., Elder, R.J. 2013. Distribution and habitat of the critically endangered
Capricorn Yellow Chat Epthianura crocea macgregori. Pacific Conservation Biology 19, 39-54.
Hughes, A.O., Olley, J.M., Croke, J.C., McKergow, L.A. 2009. Sediment source changes over the last
250 years in a dry-tropical catchment, central Queensland, Australia. Geomorphology 104, 262-275.
Jaensch, R., Westley, S., Smith, P. 2015. A prioritisation of Fitzroy Basin wetlands for NRM
investment. Report to Fitzroy Basin Association.
Johnson, J.E., Maynard, J.A., Devlin, M.J., Wilkinson, S., Anthony, K.R.N., Yorkston, H., Heron, S.F.,
Puotinen, M.L., van Hooidon, R. 2013. Chapter 2: Resilience of Great Barrier Reef marine ecosystems
and drivers of change. In: Synthesis of evidence to support the Reef Water Quality Scientific
Consensus Statement 2013. Department of the Premier and Cabinet, Queensland Government,
Brisbane, 35pp.Johnston, N., Peck, G., Ford, P., Dougall, C. and Carroll, C. (Eds) (2008) Fitzroy Basin
Water Quality Improvement Report. Fitzroy Basin Association, Rockhampton, 124pp.
Johnson, J., Brodie, B., Flint, N. 2015. Status of marine and coastal natural assets in the Fitzroy NRM
region. Report to Fitzroy Basin Association for the Fitzroy Water Quality Improvement Plan.

125
Johnston, N., Peck, G., Ford, P., Dougall, C., Carroll, C. 2008. Fitzroy Basin Water Quality
Improvement Report – December 2008. Fitzroy Basin Association, 2008.
Jones, A.M., Berkelmans, R., Houston, W. 2011. Species richness and community structure on a high
latitude reef: Implications for conservation and management. Diversity 3, 329–355. doi:
10.3390/d3030329
Jones, A.M., Berkelmans, R. 2014. Flood impacts in Keppel Bay, southern Great Barrier Reef in the
aftermath of cyclonic rainfall. http://www.plosone.org/article/info%
3Adoi%2F10.1371%2Fjournal.pone.0084739
Karfs, R.A., Abbott, B.N., Scarth, P.F., Wallace, J.F. 2009. Land condition monitoring information for
reef catchments: a new era. Rangeland Journal 31, 69-86.
Kroon, F.J., Kuhnert, P.M., Henderson, B.L., Wilkinson, S.N., Kinsey-Henderson, A., Brodie J.E., Turner
R.D.R. 2012. River loads of suspended solids, nitrogen, phosphorus and herbicides delivered to the
Great Barrier Reef lagoon. Marine Pollution Bulletin 65, 167-181.
Kroon, F., Turner, R., Smith, R. Warne, M., Hunter, H., Bartley, R., Wilkinson, S., Lewis, S., Waters, D.,
Carroll, C. 2013. Chapter 4: Sources of sediments, nutrients pesticides and other pollutants in the
Great Barrier Reef catchment. The State of Queensland 2013. Published by the Reef Water Quality
Protection Plan Secretariat, July 2013.
Lewis, S.E., Smith, R., Brodie, J.E., Bainbridge, Z.T., Davis, A.M., Turner, R. 2011. Using monitoring
data to model herbicides exported to the Great Barrier Reef, Australia. In Chan, F., Marinova, D. and
Anderssen, R.S. (eds) MODSIM2011, 19th International Congress on Modelling and Simulation.
Modelling and Simulation Society of Australia and New Zealand, December 2011, pp. 2051-2056.
ISBN: 978-0-9872143-1-7. www.mssanz.org.au/modsim2011/E5/lewis.pdf
Lewis, S., Smith, R., O’Brien, D., Warne, M.St.J., Negri, A., Petus, C., da Silva, E., Zeh, D. Turner,
R.D.R., Davis, A., Mueller, J., Brodie, J. 2013 Chapter 4: Assessing the risk of additive pesticide
exposure in Great Barrier Reef ecosystems. In: Assessment of the relative risk of water quality to
ecosystems of the Great Barrier Reef: Supporting Studies. A report to the Department of the
Environment and Heritage Protection, Queensland Government, Brisbane. TropWATER Report
13/30, Townsville, Australia.
Lewis, S. E., Olley, J., Furuichi, T., Sharma, A., Burton, J. 2014. Complex sediment deposition history
on a wide continental shelf: Implications for the calculation of accumulation rates on the Great
Barrier Reef. Earth and Planetary Science Letters 393, 146-158.
Lewis, S., Packett, R., Dougall, C., Brodie, J., Bartley, R., Silburn, M. 2015. Fitzroy sediment story.
Report to FBA WQIP.
Logan, M., Fabricius, K., Weeks, S., Rodriguez, A., Lewis, S., Brodie, J. 2014. NERP 4.1: Project 4.1:
Tracking coastal turbidity over time and demonstrating the effects of river discharge events on
regional turbidity in the GBR: Progress Report: Southern and Northern NRM Regions.

126
Logan, M., Fabricius, K., Weeks, S., Rodriguez, A., Lewis, S., Brodie, J. 2014. Tracking coastal turbidity
over time and demonstrating the effects of river discharge events on regional turbidity in the GBR:
Southern and Northern NRM Regions. Report to the National Environmental Research Program. Reef
and Rainforest Research Centre Limited, Cairns.
Logan, M., Weeks, S. Brodie, J., Lewis S., Fabricius, K.E. In press. Magnitude of changes in photic
depth related to river discharges on the Great Barrier Reef continental shelf: 2002-2013. Estuarine,
Coastal and Shelf Science.
Lough, J.M. 2007. Tropical river flow and rainfall reconstructions from coral luminescence: Great
Barrier Reef, Australia. Paleoceanography 22(2).
Lough, J.M. 2010. Measured coral luminescence as a freshwater proxy: comparison with visual
indices and a potential age artefact. Coral Reefs, pp. 1-14.
Lucas, R., Crerar, J., Hardie, R., Merritt, J., Kirsch, B. 2010. Isaac River cumulative impact assessment
of mining developments. Transactions of the Institution of Mining and Metallurgy, Section A: Mining
Technology 118(3-4), 142-151. DOI: 10.1179/174328610X12682159814902
Marsden, T. 2015. Fitzroy Basin Association: Fish Barrier Prioritisation Update 2015. Report to the
Fitzroy Basin Association. Australasian Fish Passage Services, 36pp.
Maynard, J., Heron, S., Tracey, D. 2015. Improved ocean colour variable outputs for use in Great
Barrier Reef Water Quality Improvement Plans and a future Great Barrier Reef-wide risk assessment.
Outcomes of a joint project for the Cape York, Burdekin and Fitzroy Water Quality Improvement
Plans, 2015 (funded by Cape York NRM, NQ Dry Tropics and the Fitzroy Basin Association).
McKenzie, L.J., Unsworth, R.K.F., Waycott, M. 2010. Reef Rescue Marine Monitoring Program:
Intertidal Seagrass, Annual Report for the Sampling Period 1 September 2009 – 31 May 2010.
Fisheries Queensland, Cairns, 136pp.
http://www.gbrmpa.gov.au/__data/assets/pdf_file/0009/7677/RRMMP_Seagrass_annual_report_2
009_10.pdf
McKenzie, L.J., Collier, C., Waycott, M. 2014. Reef Rescue Marine Monitoring Program – Inshore
Seagrass, Annual Report for the sampling period 1st July 2011 – 31st May 2012. TropWATER, James
Cook University, Cairns. 192pp.
McKergow, L. A., Prosser, I. P., Hughes, A. O., Brodie, J. 2005. Sources of sediment to the Great
Barrier Reef World Heritage Area. Marine Pollution Bulletin 51, 200-211.
Miller, I., Sweatman, H., Cheal, A., Emslie, M., Johns, K., Jonker, M., Osborne, K. 2015. Origins and
implications of a primary crown-of-thorns starfish outbreak in the 1 southern Great Barrier Reef.
Moore, M., Marsden, T.J. 2008. Fitzroy Basin Fish Barrier Prioritisation Project. Queensland
Department of Primary Industries, Fisheries. 51 pp.

127
Murphy, T., Dougall, C., Burger, P., Carroll C., 2013. Runoff water quality from dryland cropping on
Vertisols in Central Queensland, Australia. Agric. Ecosyst. Environ. 2012,
doi:10.1016/j.agee.2011.07.023.
National Water Quality Management Strategy, 1992. Australian Government Department of the
Environment. http://www.environment.gov.au/water/quality/national-water-quality-management-
strategy.
O’Neill, P. 2009. State of the Environment Report for Shoalwater Bay Training Area 2008.
Department of Defence. Canberra, Australia.
Packett, B. 2007. A mouthful of mud: the fate of contaminants from the Fitzroy River, Queensland,
Australia and implications for reef water policy. In: Wilson AL, Dehaan RL, Watts RJ, Page KJ, Bowmer
KH and Curtis A, editors. Proceedings of the 5th Australian Stream Management Conference.
Australian Rivers: Making a Difference Thurgoona, New South Wales, Australia: Charles Sturt
University. pp. 294–299.
Packett, B., Dougall, C., Rohde, K., Noble, R. 2009. Agricultural lands are hotspots for annual runoff
polluting the southern Great Barrier Reef lagoon. Mar Pollut Bull 58: 976–986. doi:
10.1016/j.marpolbul.2009.02.017
Pandolfi, J.M., Bradbury, R.H., Sala, E., Hughes, T.P., Bjorndal, K.A., Cooke, R.G., McArdle, D.,
McClenachan, L., Newman, M.J.H., Paredes, G., Warner, R.R., Jackson, J.B.C. 2003. Global trajectories
of the long-term decline of coral reef ecosystems. Science 301, 955–958.
Petus, C., Collier, C., Devlin, M., Rasheed, M., McKenna S. 2014. Using MODIS data for understanding
changes in seagrass meadow health: a case study in the Great Barrier Reef (Australia). Marine
Environmental Research 98, 68–85
Petus, C., Devlin, M., da Silva, E., Brodie, J. 2015. Mapping uncertainty in chlorophyll a assessments
from remote sensing in the Great Barrier Reef. Outcomes of a joint project for the Cape York,
Burdekin and Fitzroy Water Quality Improvement Plans, 2015 (funded by Cape York NRM, NQ Dry
Tropics and the Fitzroy Basin Association).
Pollock, F.J., Lamb, J.B., Field, S.N., Heron, S.F., Schaffelke, B., et al. 2014. Sediment and Turbidity
Associated with Offshore Dredging Increase Coral Disease Prevalence on Nearby Reefs. PLoS ONE
9(7): e102498. doi:10.1371/journal.pone.0102498
Queensland StrandNet Data 2015. State of Queensland. Department of Environment and Heritage
Protection. Accessed April 2015.
QRC [Queensland Resources Council] (2015). Economic Contribution for Fitzroy Region. Accessed
August 2015. Available at: https://www.qrc.org.au/01_cms/details.asp?ID=3466
Ralph, P.J. 1998. Photosynthetic response of laboratory-cultured Halophila ovalisto thermal stress.
Marine Ecology Progress Series 171, 123–130.

128
Risk, M.J. 2014. Assessing the effects of sediments and nutrients on coral reefs. Current Opinion in Environmental Sustainability 7, 108-117.
Robson, B.J., Webster, I., Margvelashvili, N., Herzfeld, M. 2006. Scenario modelling: simulating the
downstream effects of changes in catchment land use. CRC for Coastal Zone, Estuary & Waterway
Management. Technical Report 41. www.ozcoasts.org.au/search_data/crc_rpts.jsp#no41
Rodriguez-Ramirez, A. 2013. Past reef responses and disturbances in the southern Great Barrier
Reef. PhD Thesis, School of Earth Sciences, University of Queensland, 157 pp.
Rohde, K., Masters, B., Fries, N., Noble, R., Carroll, C. 2008. Fresh and Marine Water Quality in the
Mackay Whitsunday region 2004/05 to 2006/07, Queensland Department of Natural Resources and
Water for the Mackay Whitsunday Natural Resource Management Group, Australia.
Rolfe, J., Gregg, D. 2012. Valuing beach recreation across a regional area: The Great Barrier Reef in
Australia. Ocean and Coastal Management 69, 282-290.
Schaffelke, B. 1999. Short-term nutrient pulses as tools to assess responses of coral reef macroalgae
to enhanced nutrient availability. Marine Ecology Progress Series, 182, 305-310.
Selig, E.R., Harvell, C.D., Bruno, J.F., Willis, B.L., Page, C.A., Casey, K.S., Sweatman, H. 2006. Analyzing
the relationship between ocean temperature anomalies and coral disease outbreaks at broad spatial
scales. Coral reefs and climate change: Science and management. Washington (DC): American
Geophysical Union, 111-128.
Shaw, M., Silburn, D.M. 2014. Paddock to Reef Integrated Monitoring, Modelling and Reporting
Program, Paddock Scale Modelling Technical Report, Queensland Department of Natural Resources
and Mines, Brisbane.
Shaw, M., Silburn, M., Ellis, R., Searle, R., Biggs, J., Thorburn, P.J., Whish, G. 2013. Paddock scale
modelling to assess effectiveness of agricultural management practice in improving water qaulity in
the Great Barrier Reef Catchments In " International Congress on Modelling and Simulation",
Adelaide, Australia
Shellberg, J.G., Brooks, A.P. 2013. Alluvial Gully Prevention and Rehabilitation options for Reducing
Sediment Loads in the Normanby Catchment and Northern Australia. Griffith Univeristy, Australian
Rivers Institute.
Shields, P.G., Forster, B.A. 1992. Soils and agricultural use. In: Proceedings of Fitzroy Catchment
symposium, 12-13 November 1992. University of Central Queensland.
Silburn, D. M., Carroll, C., Ciesiolka, C.A.A., deVoil, R.C., and Burger, P. 2011. Hillslope runoff and
erosion on duplex soils in grazing lands in semi-arid central Queensland. I. Influences of cover, slope,
and soil. Soil Research 49, 105-117.

129
Star, M., Beutel, T., Scrobback, P., Rolfe, J., McCosker, K., Ellis, R. 2015a. Prioritisation of
neighbourhood catchments in the Fitzroy Basin. Report to Fitzroy Basin Association for the Fitzroy
Water Quality Improvement Plan.
Star, M., Beutel, T., Scrobback, P., Rolfe, J., McCosker, K., Ellis, R. 2015b. Prioritisation of
neighbourhood catchments: Recommendations, gaps and future research. Report to Fitzroy Basin
Association for the Fitzroy Water Quality Improvement Plan.
Stavi, I., Perevolotsky, A., Avni, Y. 2010. Effects of gully formation and headcut retreat on primary
production in an arid rangeland: Natural desertification in action. Journal of Arid Environments 74,
221-228.
Storlazzi, C.D., Norris, B.K., Rosenberger, K.J. 2015. The influence of grain size, grain color, and
suspended-sediment concentration on light attenuation: Why fine-grained terrestrial sediment is
bad for coral reef ecosystems. Coral Reefs 34, 967-975.
Sweatman, H., Cheal, A., Coleman, G., Emslie, M., Johns, K., Jonker, M., Miller, I., Osborne, K. 2008.
Long-term monitoring status report number 8. Australian Institute of Marine Science, Townsville.
Tan, J., Pratchett, M., Bay, L., Baird, A. 2012. Massive coral mortality following a large flood event.
Proc 12th Int Coral Reef Symp 1E:1
The State of Queensland 2013a. Reef Water Quality Protection Plan 2013. Securing the health and
resilience of the Great Barrier Reef World Heritage Area and adjacent catchments. Reef Water
Quality Protection Plan Secretariat, Department of the Premier and Cabinet, July 2013.
The State of Queensland 2014. Great Barrier Reef Report Card 2012 and 2013. Reef Water Quality
Protection Plan. Reef Water Quality Protection Plan Secretariat, Department of the Premier and
Cabinet, 2014. http://www.reefplan.qld.gov.au/measuring-success/ report-cards/assets/report-
card-2012-2013.pdf.
Thomas, C., Brodie, J. 2015. Environmental-economic values of marine and coastal natural assets:
Fitzroy NRM region. Report to Fitzroy Basin Association for the Fitzroy Water Quality Improvement
Plan.
Thompson, A., Schaffelke, B., Logan, M., Costello, P., Davidson, J., Doyle, J., Furnas, M., Gunn, K.,
Liddy, M., Skuza, M., Uthicke, S., Wright, M., Zagorkskis, I. 2013. Reef Rescue Marine Monitoirng
Program. Final Report of AIMS Activities 2012 to 2013 – Inshore water quality and coral reef
monitoring. Report for the Great Barrier Reef Marine Park Authority. Australian Institute of Marine
Science, Townsville. 178pp.
Thorburn, P.J., Wilkinson, S.N. 2013. Conceptual frameworks for estimating the water quality
benefits of improved land management practices in large catchments. Agriculture Ecosystems &
Environ. 180, 192-209: http://dx.doi.org/10.1016/j.agee.2011.12.021.

130
Thorburn, P.J., Wilkinson, S.N., Silburn, D.M. 2013. Water quality in agricultural lands draining to the
Great Barrier Reef: A review of causes, management and priorities. Agriculture, Ecosystems &
Environment 180, 4 - 20.
Turner, R., Huggins, R., Wallace, R., Smith, R., Vardy, S., Warne, M.St.J. 2013. Loads of sediment,
nutrients and pesticides discharged from high priority Queensland rivers in 2010-2011. Great Barrier
Reef Catchment Loads Monitoring Program, Department of Science, Information Technology,
Innovation and the Arts, Brisbane.
Vance, D.J., Haywood, M.D.E., Heales D.S., Kenyon R.A., Loneragan, N.R. 1998. Seasonal and annual
variation in abundance of postlarval and juvenile banana prawns Penaeus merguiensis and
environmental vairation in two estuaries in tropical northeastern Australia: a six year study. Marine
Ecology Progress Series 163, 21-36.
van Woesik, R., DeVantier, L.M., Glazebrook, J.S. 1995. Effects of Cyclone ‘Joy’ on nearshore coral
communities of the Great Barrier Reef. Mar Ecol Prog Ser 128: 261–270. doi: 10.3354/meps128261
Waters, D.K., Carroll, C., Ellis, R., Hateley, L., McCloskey, J., Packett, R., Dougall, C., Fentie, B. 2014.
Modelling reductions of pollutant loads due to improved management practices in the Great Barrier
Reef Catchments – Whole of GBR, Volume 1. Department of Natural Resources and Mines. Technical
Report (ISBN: 978-1-7423-0999).
Waterhouse, J. Tracey, D. Brodie, J. Lewis, S. da Silva, E. Devlin. M. Wenger, A. O’Brien, D. Johnson, J.
Maynard, J. Heron, S. Petus, C. 2015a. Assessment of the relative risk of water quality to ecosystems
of the Fitzroy NRM Region, Great Barrier Reef. Report to Fitzroy Basin Association for the Fitzroy
Water Quality Improvement Plan.
Waterhouse, J., Brodie, J., Petus, C., Devlin, M., da Silva, E., Maynard, J., Heron, S., Tracey, D. (2015b)
Recent findings of an assessment of remote sensing data for water quality measurement in the
Great Barrier Reef: Supporting information for the GBR Water Quality Improvement Plans.
TropWATER Report, Townsville, Australia.
Waycott, M., McKenzie, L., Mellors, J., Ellison, J., Sheaves, M., Collier, C., Schwarz, A.M., Webb, A.,
Johnson,J.E., Payri, C. 2011. Chapter 6: Vulnerability of mangrove, seagrass and intertidal sand and
mud flat habitats in the tropical Pacific to climate change. In: Vulnerability of tropical Pacific fisheries
and aquaculture to climate change, eds Bell J, Johnson JE and Hobday AJ. Secretariat of the Pacific
Community, Noumea, New Caledonia.
Weber, M., de Beer, D., Lott, C., Polerecky, L., Kohls, K., Abed, R.M.M., Ferdelman, T.G., Fabricius,
K.E. 2012. Mechanisms of damage to corals exposed to sedimentation. Proceedings of the National
Academy of Sciences of the United States of America, 109(24): E1558-E1567,
10.1073/pnas.1100715109.
Wenger, A., in prep. Analysis of future scenarios of increased frequency of more extreme weather
events in relation to the resistance of coral reefs to changing water quality in the Keppel Bay area,
Fitzroy region.

131
Wenger, A.S., Johansen, J.L., Jones, G.P. 2011. Suspended sediment impairs habitat choice and
chemosensory discrimination in two coral reef fishes. Coral Reefs 30, 879-887.
Wenger, A.S., Devlin, M., Da Silva, E., Petus, C. 2015. Assessment of water quality variability to
extreme weather conditions in the Great Barrier Reef. Estuarine Coastal Shelf Science.
Weston, N., Goosem, S. 2004. Sustaining the Fitzroy Basin: A Regional Plan for Natural Resource
Management, Volume 2A Condition Report: Biodiversity Conservation. Rainforest CRC and FNQ NRM
Ltd, Cairns, 211pp.
Whish, G. 2011. Fitzroy Region GLM Land types: Version 2.0. In "Prepared by the Grazing Land
Management Workshop Team". Department of Employment, Economic Development and
Innovation, Brisbane, QLD.
Wiedenmann, J., D'Angelo, C., Smith, E.G., Hunt, A.N., Legiret, F-E., Postle, A.D., Achterberg, E.P.
2012. Nutrient enrichment can increase the susceptibility of reef corals to bleaching. Nature Climate
Change 3, 160-164.
Wilkinson, S., Bartley, R. 2010. Sustainable grazing near the Great Barrier Reef. Vol. 2011. CSIRO,
Brisbane.
Wilkinson, S.N., Bastin, G., Stokes, C.J., Hawdon, A.A., Kinsey-Henderson, A.E., Nicholas, D.M.,
Chewings, V.H., Abbott, B.N., McKellar, K., Kemei, J. 2014. Improving grazing management practices
to enhance ground cover and reduce sediment loads. Reef Rescue R&D Program. Reef and
Rainforest Research Centre Limited, Cairns (85 pp.).
Wilkinson, S.N., Olley, J.M., Furuichi, T., Burton, J., Kinsey-Henderson, A.E. 2015. Sediment source
tracing with stratified sampling and weightings based on spatial gradients in soil erosion. Journal of
Soils and Sediments: In press. http://dx.doi.org/10.1007/s11368-015-1134-2.
Williamson, D.H., Ceccarelli, D.M., Evans, R.D., Jones, G.P., Russ, G.R. 2014. Habitat dynamics, marine
reserve status, and the decline and recovery of coral reef fish communities. Ecology and Evolution
4(4), 337–354.
Wilson, S.K., Dolman, A.M., Cheal, A.J., Emslie, M.J., Pratchett, M.S., Sweatman, H.P.A. 2009.
Maintenance of fish diversity on disturbed coral reefs. Coral Reefs 28, 3–14.
Wooldridge, S.A., Brodie, J.E., Kroon, F.J., Turner ,R.D.R. 2015. Ecologically based targets for
bioavailable (reactive) nitrogen discharge from the drainage basins of the Wet Tropics region, Great
Barrier Reef. Marine Pollution Bulletin 97(1-2), 262-272.
Yahya, S.A.S., Gullström, M., Öhman, M.C., Jiddawi, N.S., Andersson, M.H., Mgaya, Y.D., Lindahl, U.
2011. Coral bleaching and habitat effects on colonisation of reef fish assemblages: An experimental
study. Estuarine, Coastal and Shelf Science 94, 16-23.

132
Appendix A: Grazing management practice framework

Grazing management practice framework
Weighting Indicators & Associated Practices Question Weight Allocated score
Low Low-‐Mod Mod High N/A
Hillslop
e erosion
20%
Performance Indicator 1: Average stocking rates imposed on paddocks are consistent with district long-‐term carrying capacity benchmarks for comparable land types, current land condition, and level of property development
High-‐level actions
There are realistic expectations of the average stocking rate each paddock will likely carry over a number of years (long-‐term carrying capacity or LTCC). 11 10% 10 7 4 0
Supporting actions
Property mapping and inventory of natural resources enables objective assessment of long-‐term carrying capacity and stocking rate.
Land condition is assessed and taken into account when estimating LTCC and when planning grazing management. 10 10% 10 6 3 0
40%
Performance Indicator 2: Retention of adequate pasture and groundcover at the end of the dry season, informed by (1) knowledge of groundcover needs and (2) by deliberate assessment of pasture availability in relation to stocking rates in each paddock during the latter half of the growing season or early dry season.
High-‐level actions
Balance between stocking rate and pasture quantity in each paddock, and implications for groundcover, are objectively evaluated. 12 20% 20 12 6 0
Records and analysis of stock numbers allow planning and management of stocking rate.
9 10% 10 6 3 0
Supporting actions
Groundcover monitoring 8 5% 5 3 1.5 0 Groundcover thresholds inform paddock management 13 5% 5 3.5 2 0
25%
Performance Indicator 3: Strategies implemented to recover any land in poor or very poor condition (C or D condition).
High-‐level actions
Management is tailored to encourage recovery of land in declining or poor (C) condition. 22 7.5% 7.5 5 3.5 0 Management is tailored to encourage recovery of areas in very poor (D) condition.
23 10% 10 7 4 0
18 7.5% 7.5 5 2.5 0
15%
Performance Indicator 4: The condition of selectively-‐grazed land types is effectively managed
High-‐level actions
Where there has been, or is, strongly selective grazing of land types within a paddock, management actions are in place to maintain/recover land condition of those land types.
6 7.5% 7.5 3.5 0
14 7.5% 7.5 5 2.5 0

Weighting Indicators & Associated Practices
Question Weight Allocated score
Low Low-‐Mod Mod High N/A
Stream
bank
100%
Performance Indicator: 5. Timing and intensity of grazing is managed in frontages of rivers and major streams (including associated riparian areas) and wetland areas.
High-‐level actions
Grazing pressure on frontage country is able to be effectively managed (enabled by infrastructure).
7 100% 100 66 33 0
Grazing pressure on frontage country is managed carefully (where fencing allows control)
Gully
30% Performance indicators 1-‐4: Hillslope erosion assessment.
30%
Performance Indicator 6: Strategies implemented to remediate gullied areas.
High-‐level actions
Where possible, remedial actions are taken to facilitate recovery of gullied areas. 23 30% 30 20 10 0
40%
Performance Indicator 7: Linear features (roads, tracks, fences, firebreaks, pipelines and water points) located and constructed to minimise their risk of initiating erosion.
High-‐level actions
Planning. Managing risk of erosion associated with roads and tracks. 16 25% 25 16 8 0 Managing risk of erosion associated with fences. 17 15% 15 0
0%
Performance Indicator : 8. Use of agricultural chemicals
High-‐level Use of Tebuthiuron (where used) Application of fertilisers (where used on significant areas of perennial pasture) Application of phosphorus (P) fertiliser Application of nitrogen (N) fertiliser
From Shaw M, Silburn M, Ellis R, Searle R, Biggs J, Thorburn PJ, Whish G (2013) Paddock scale modelling to assess effectiveness of agricultural management practice in improving water qaulity in the Great Barrier Reef Catchments In ' International Congress on Modelling and Simulation. ' Adelaide, Australia.

134
Appendix B: Grains cropping management practice
framework

1
Grains cropping management practice framework
Management
(weighting)
Outdated Minimum Standard Best Practice Innovative, may not be economic in all situations Not Applicable
High Risk Moderate Risk Moderate -‐ Low Risk Lowest Risk
Runo
ff & Soil Loss
Use of Tillage
(40%)
Tillage is frequently used for weed control and/or managing stubble
Efforts are made to maintain stubble cover during fallows. Stubble usually needs to be cultivated to allow for planting and/or fertilising
Crops are planted into standing stubble from the previous crop/s. Tillage is only used when required to deal with severe compaction, nutrient stratification, or as part of a strategy to manage certain difficult weeds.
Strategy to control certain difficult to control weeds may involve occasional zonal tillage.
Wheel Traffic
(30%)
Farming equipment has different widths and wheel spacing.
All farm equipment except headers and mobile grain bins operates on the same wheel spacing and consistent implement width.
A controlled traffic system is in place with all tractors and implements, headers and mobile grain bins operating on the same set of wheel tracks. Spraying and planting occurs under machine guidance of at least 10cm pass to pass accuracy.
A controlled traffic system is in place with all tractors and implements, headers and mobile grain bins operating on the same set of wheel tracks. All machines operate under RTK guidance of at least 4cm pass to pass accuracy.
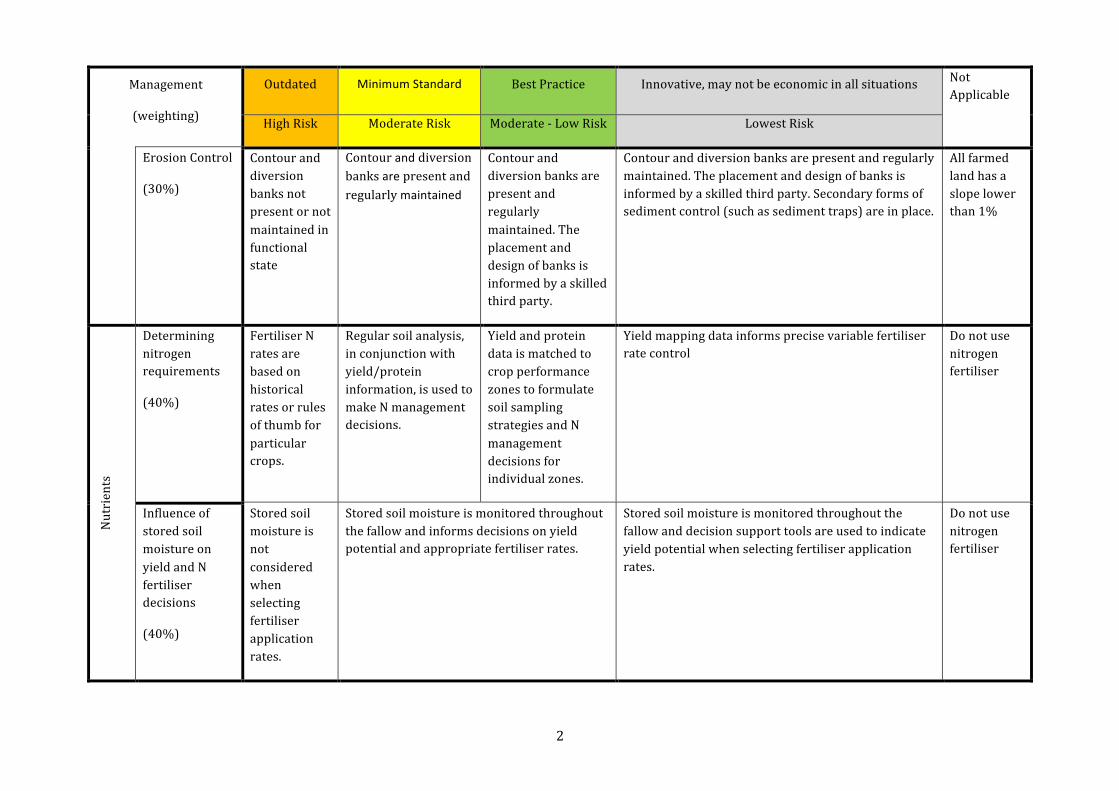
2
Management
(weighting)
Outdated Minimum Standard Best Practice Innovative, may not be economic in all situations Not Applicable
High Risk Moderate Risk Moderate -‐ Low Risk Lowest Risk
Erosion Control
(30%)
Contour and diversion banks not present or not maintained in functional state
Contour and diversion banks are present and regularly maintained
Contour and diversion banks are present and regularly maintained. The placement and design of banks is informed by a skilled third party.
Contour and diversion banks are present and regularly maintained. The placement and design of banks is informed by a skilled third party. Secondary forms of sediment control (such as sediment traps) are in place.
All farmed land has a slope lower than 1%
Nutrients
Determining nitrogen requirements
(40%)
Fertiliser N rates are based on historical rates or rules of thumb for particular crops.
Regular soil analysis, in conjunction with yield/protein information, is used to make N management decisions.
Yield and protein data is matched to crop performance zones to formulate soil sampling strategies and N management decisions for individual zones.
Yield mapping data informs precise variable fertiliser rate control
Do not use nitrogen fertiliser
Influence of stored soil moisture on yield and N fertiliser decisions
(40%)
Stored soil moisture is not considered when selecting fertiliser application rates.
Stored soil moisture is monitored throughout the fallow and informs decisions on yield potential and appropriate fertiliser rates.
Stored soil moisture is monitored throughout the fallow and decision support tools are used to indicate yield potential when selecting fertiliser application rates.
Do not use nitrogen fertiliser
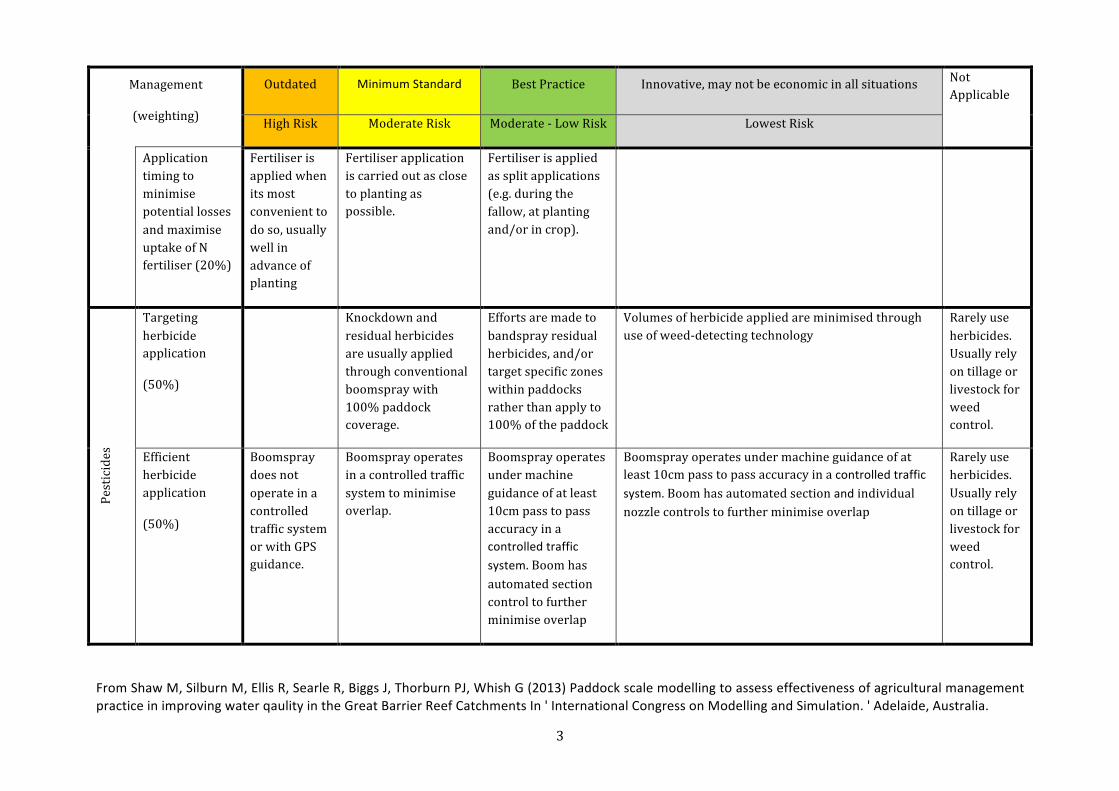
3
Management
(weighting)
Outdated Minimum Standard Best Practice Innovative, may not be economic in all situations Not Applicable
High Risk Moderate Risk Moderate -‐ Low Risk Lowest Risk
Application timing to minimise potential losses and maximise uptake of N fertiliser (20%)
Fertiliser is applied when its most convenient to do so, usually well in advance of planting
Fertiliser application is carried out as close to planting as possible.
Fertiliser is applied as split applications (e.g. during the fallow, at planting and/or in crop).
Pesticides
Targeting herbicide application
(50%)
Knockdown and residual herbicides are usually applied through conventional boomspray with 100% paddock coverage.
Efforts are made to bandspray residual herbicides, and/or target specific zones within paddocks rather than apply to 100% of the paddock
Volumes of herbicide applied are minimised through use of weed-‐detecting technology
Rarely use herbicides. Usually rely on tillage or livestock for weed control.
Efficient herbicide application
(50%)
Boomspray does not operate in a controlled traffic system or with GPS guidance.
Boomspray operates in a controlled traffic system to minimise overlap.
Boomspray operates under machine guidance of at least 10cm pass to pass accuracy in a controlled traffic system. Boom has automated section control to further minimise overlap
Boomspray operates under machine guidance of at least 10cm pass to pass accuracy in a controlled traffic system. Boom has automated section and individual nozzle controls to further minimise overlap
Rarely use herbicides. Usually rely on tillage or livestock for weed control.
From Shaw M, Silburn M, Ellis R, Searle R, Biggs J, Thorburn PJ, Whish G (2013) Paddock scale modelling to assess effectiveness of agricultural management practice in improving water qaulity in the Great Barrier Reef Catchments In ' International Congress on Modelling and Simulation. ' Adelaide, Australia.
