five-story wood-frame structure over podium slab. floor 2nd. floor roof d es i g n e x a m p l e...
TRANSCRIPT

1st. FLOOR
2nd. FLOOR
ROOF
D E S I G N E X A M P L E
Five-Story Wood-Frame Structure over Podium Slab
Developed for WoodWorks by
Douglas S. Thompson, PE, SE, SECB
STB Structural Engineers, Inc.
Lake Forest, CA
FRONT COVER
$FRA-593_Five-Over-One_TechDoc_Dec2017.indd 1 12/7/17 11:18 AM

INSIDE FRONT COVER
$FRA-593_Five-Over-One_TechDoc_Dec2017.indd 2 12/7/17 11:18 AM

Five reasons to choose wood for your next project:
Wood typically provides more value—in terms of its beauty, design flexibility and environmental attributes—for less cost than other major building materials, all while meeting fire, safety and other code requirements.
1. Wood costs less – In addition to lower material costs, wood building systems typically cost less to install than other materials. Wood construction is fast, and wood’s relative light weight reduces the need for foundation capacity and associated costs.
2. Wood structures meet code – The International Building Code recognizes wood’s safety and structural performance capabilities and allows its use in a wide range of building types, from multi-story condominiums and offices to schools, restaurants, malls and arenas.
3. Wood performs well in earthquakes and high winds – Because wood-frame buildings are lighter and have more repetition and ductility than structures built with other materials, they are very effective at resisting lateral and uplift forces.
4. Wood is versatile and adaptable – Wood’s design flexibility lends itself both to traditional and innovative uses. With the exception of major members that are made to spec off site, wood can be adapted in the field, allowing quick solutions if changes are required. Wood is also well suited to additions and retrofits, and wood systems can be dismantled with relative ease and the materials used elsewhere.
5. Using wood helps reduce your environmental impact – Wood grows naturally and is renewable. Life cycle assessment studies also show that wood buildings have less embodied energy than structures made from steel or concrete, are responsible for less air and water pollution, and have a lighter carbon footprint.
For more information, visit: woodworks.org
Free design and engineering support for non-residential and multi-family wood buildings
WoodWorks provides free
resources that allow engineers,
architects and others to design
and build non-residential and
multi-family structures out
of wood more easily and at
less cost. This includes free
one-on-one project assistance
as well as educational events
and online resources such as
CAD/REVIT details, case studies,
and Continuing Education Units.
For tools and resources
related to multi-story
wood buildings, visit
www.woodworks.org and
look under Building Types,
Multi-Residential/Mixed-Use.
$FRA-593_Five-Over-One_TechDoc_Dec2017.indd 3 12/7/17 11:18 AM

2 | Table of Contents
Table of Contents
PART I – Overview
Overview ............................................................................................................. 4 Codes and Reference Documents Used ................................................................ 5 Factors that Influence Design ............................................................................... 5 Species of Lumber ........................................................................................ 5 Grade of Lumber .......................................................................................... 5 Moisture Content and Wood Shrinkage ........................................................ 6 Condition of Seasoning ................................................................................ 6 Location of Shear Walls ................................................................................ 6 Support of Floor Joists .................................................................................. 7 Given Information ............................................................................................... 7
PART II – Structural and Non-structural
1. Seismic Height Limitation ............................................................................... 10
2. Fire and Life Safety ......................................................................................... 10 a. Height and Area Allowances ..................................................................... 10 b. Fire Resistance .......................................................................................... 11 c. Fire Retardant-Treated Wood .................................................................... 12
3. Vertical Displacement (Shrinkage) in Multi-Level Wood Framing ...................... 14 a. Comprehensive Shrinkage Estimation ....................................................... 15 b. Quick Shrinkage Estimation ...................................................................... 16
PART III – Seismic Design
4. Two-Stage Design for Seismic Lateral Analysis ................................................. 20 a. Stiffness Determinations ........................................................................... 20 b. Period Determinations .............................................................................. 21 c. Design of Flexible Upper Portion ............................................................... 23 d. Design of Rigid Lower Portion .................................................................. 23
5. Seismic Design of Flexible Upper Portion and Rigid Lower Portion ................... 24 a. Seismic Design of Flexible Upper Portion .................................................. 24 b. Assumption of Flexible Diaphragms .......................................................... 30 c. Flexible vs. Rigid Diaphragm Analysis ........................................................ 30 d. Flexible Upper Portion Redundancy Factor ................................................ 31 e. Seismic Design of Rigid Lower Portion ...................................................... 31
UPDATE NOTE – In September 2016, updates were made to the following sections: 4a. Stiffness Determinations, 4b. Period Determinations, and 6h. Determine Resisting Moments and Uplift Forces. In November 2017, additional
changes were made to 4a. Stiffness Determinations, and 4b. Period Determinations.
$FRA-593_Five-Over-One_TechDoc_Dec2017.indd 4 12/7/17 11:18 AM

3 | Table of Contents
6. Shear Wall Design Example .............................................................................. 31 a. Determination of Lateral Loads to Shear Wall ........................................... 31 b. Determination of Shear Wall Sheathing and Nailing .................................. 33 c. Shear Wall Cumulative Overturning Forces ................................................ 33 d. Load Combinations using 2012 IBC .......................................................... 34 e. Load Combinations using 2012 ASCE 7-10 ................................................ 34 f. Shear Wall Chord (Boundary) Members ..................................................... 35 g. Example Compression Member Capacity Determination ........................... 39 h. Determine Resisting Moments and Uplift Forces ....................................... 40 i. Shear Wall Tie-Down System Components ................................................ 41
7. Considerations with Continuous and Discontinuous Anchor Tie-Downs ........... 45
8. Shear Wall Deflection, Tie-Downs and Take-Up Devices................................... 46 a. Continuous Tie-Down Assembly Displacement ......................................... 46 b. Shear Wall Deflection ............................................................................... 51 c. Story Drift Determination .......................................................................... 54 d. Load Path for Rod Systems ....................................................................... 56 e. Proprietary Software for Continuous Tie-Down Systems ........................... 58
9. Discontinuous System Considerations and the Overstrength (Ω) Factor ............ 58 a. Anchor Forces to Podium Slab .................................................................. 58
PART IV – Wind vs. Seismic Design with Wind Controlling
10. Use of Gypsum Board for Lateral Resistance .................................................. 60
11. Use of Cooler Nails vs. Screws for Gypsum Board Fastening ........................... 61
12. Wind Loading Analysis – Main Wind-Force Resisting System .......................... 61 a. Determination of Design Coefficients for Transverse Direction .................. 62 b. Determination of Design Coefficients for Longitudinal Direction ............... 64
13. Seismic Loading Analysis ................................................................................ 66 a. Design Base Shear .................................................................................... 66
14. Wind and Seismic Forces to Typical Interior Transverse Wall ........................... 67 a. Determination of Shear Wall Fastening ..................................................... 68 b. Determination of Shear Wall Chord (Boundary) Forces and Members ....... 69 c. Determination of Shear Wall Uplift Forces ................................................. 71
15. Wind and Seismic Forces to Typical Interior Corridor Wall ............................... 72 a. Determination of Shear Wall Fastening ..................................................... 73 b. Determination of Shear Wall Chord (Boundary) Forces and Members ....... 74 c. Determination of Shear Wall Uplift Forces ................................................. 75
$FRA-593_Five-Over-One_TechDoc_Dec2017.indd 5 12/7/17 11:18 AM

4 | Overview
Part 1 – Overview This design example illustrates the seismic and wind design of a hotel that includes five stories of wood-frame construction over a one-story concrete podium slab and is assigned to Seismic Design Category D. The gravity load framing system consists of wood-frame bearing walls for the upper stories and concrete bearing walls for the lower story. The lateral load-resisting system consists of wood-frame shear walls for the upper stories and concrete shear walls for the lower story. Typical building elevation and floor plan of the structure are shown in Figures 2 and 3 respectively. A typical section showing the heights of the structure is shown in Figure 6. The wood roof is framed with pre-manufactured wood trusses. The floor is framed with prefabricated wood I-joists. The floors have a 1-1⁄2 inch lightweight concrete topping. The roofing is composition shingles.
This design example uses the term “podium slab” which, while not a term defined in the 2012 International Building Code (IBC) or 2013 California Building Code (CBC), is included in the commentary to §510.2 in the 2012 IBC (509.2 in the 2009 IBC). Also referred to as pedestal or platform buildings, this type of construction has a slab and beam system that is designed to support the entire weight of the wood superstructure. Section 510.2 of the 2012 IBC outlines the use of horizontal building separations, which allow a 3-hour fire resistance-rated assembly to be used to create separate buildings for the purposes of allowable height and area. This is similar to the concept used for fire walls.
When designing this type of mid-rise wood-frame structure, there are several unique design elements to consider. The following steps provide a detailed analysis of some of the important seismic requirements of the shear walls per the 2012 IBC and 2013 CBC.
This example is not a complete building design. Many aspects have not been included, specifically the gravity load framing system, and only certain steps of the seismic and wind design related to portions of a selected shear wall have been illustrated. The steps that have been illustrated may be more detailed than what is necessary for an actual building design but are presented in this manner to help the design engineer understand the process.
Disclaimer The information in this publication, including, without limitation, references to information contained in other publications or made available by other sources (collectively “information”) should not be used or relied upon for any application without competent professional examination and verification of its accuracy, suitability, code compliance and applicability by a licensed engineer, architect or other professional. Neither the Wood Products Council nor its employees, consultants, nor any other individuals or entities who contributed to the information make any warranty, representative or guarantee, expressed or implied, that the information is suitable for any general or particular use, that it is compliant with applicable law, codes or ordinances, or that it is free from infringement of any patent(s); nor do they assume any legal liability or responsibility for the use, application of and/or reference to the information. Anyone making use of the information in any manner assumes all liability arising from such use.
$FRA-593_Five-Over-One_TechDoc_Dec2017.indd 6 12/7/17 11:18 AM

5 | Codes and Reference Documents/Factors That Influence Design
Factors That Influence Design
Prior to starting the seismic design of a structure, the following must be considered:
Species of Lumber The species of lumber used in this design example is Douglas Fir-Larch (DF-L), which is common on the west coast. The author does not intend to imply that this species needs to be used in all areas or for all markets. Species that are both appropriate for this type of construction and locally available vary by region, and also commonly include (among others) Southern Yellow Pine (SYP) and Spruce-Pine-Fir (SPF).
Grade of Lumber The lower two stories of the wood-frame structure carry significantly higher gravity loads than the upper two stories. One approach is to use a higher grade of lumber for the lower two stories than the upper two stories. This approach can produce designs that yield a consistent wall construction over the height of the building. Another approach would be to choose one grade of lumber for all five wood-frame stories. This approach produces the need to change the size and/or spacing of the studs based on the loading requirements. Sill plate crushing may control stud sizing at lower stories. For simplicity, this design example illustrates the use of one lumber grade for all floor levels.
NOTES FOR FIGURE 1:
a. Certification Mark: Certifies grading agency
quality supervision
b. Mill Identification: Firm name, brand or assigned
mill number
c. Grade Designation: Grade name, number
or abbreviation
d. Species Identification: Indicates species by
individual species or species combination
e. Condition of Seasoning: Indicates condition
of seasoning at the time of surfacing
Figure 1. Typical Grade Stamp
(a)
(b)
(e)
(c)
(d)
Codes and Reference Documents Used 2012 International Building Code (IBC)
2012 National Design Specification® (NDS®) for Wood Construction – ASD/LRFD
2008 Special Design Provisions for Wind and Seismic (SDPWS-2008)
American Institute of Steel Construction Steel Construction Manual – Thirteenth Edition
2013 California Building Code (CBC)
This design example focuses on the IBC and NDS requirements. Where there is a difference between the IBC and CBC, a comment and reference is made.
$FRA-593_Five-Over-One_TechDoc_Dec2017.indd 7 12/7/17 11:18 AM

6 | Factors That Influence Design4
Moisture Content and Wood Shrinkage From a serviceability and performance perspective, the most significant issue related to multi-story wood-frame construction is wood shrinkage—which is impacted by the moisture content (MC) and, more specifically, whether the wood used is “green” or “kiln dried.”
The availability of both types is largely dependent on the region and associated market conditions. Typically, wood used in construction in the U.S. southwest is “green” (S-GRN) and kiln dried (KD) wood is relatively rare, while the opposite is true in other parts of the country. The engineer should consider the availability of kiln dried lumber in the area of the proposed construction. To help designers looking for this information, WoodWorks offers free one-on-one project support as well as a wide range of online resources. For assistance on a project, email [email protected] or visit the WoodWorks website at: http://www.woodworks.org/project-assistance-map/.
Condition of Seasoning There are three levels of wood seasoning (drying), which denotes the moisture content of the lumber at the time of surfacing. The identification “stamps” are as follows:
S-GRN = over 19% moisture content (unseasoned)
S-DRY, KD or KD-HT = 19% maximum moisture content (seasoned)
MC 15 or KD 15 = 15% maximum moisture content
These designations may be found in the grade stamp.
Unseasoned lumber (S-GRN) is manufactured oversized so that when the lumber reaches 19 percent moisture content it will be approximately the same size as the dry (seasoned) size.
Heat treated (HT) lumber is lumber that has been placed in a closed chamber and heated until it attains a minimum core temperature of 56°C for a minimum of 30 minutes.
The word “DRY” indicates that the lumber was either kiln or air dried to a maximum moisture content of 19 percent.
Kiln dried (KD) lumber is lumber that has been seasoned in a chamber to a pre-determined moisture content by applying heat.
Kiln dried heat treated (KD-HT) lumber has been placed in a closed chamber and heated until it achieves a minimum core temperature of 56°C for a minimum of 30 minutes.
Moisture content restrictions apply at time of shipment as well as time of dressing if dressed lumber is involved, and at time of delivery to the buyer unless shipped exposed to the weather.
Engineered wood I-joists were used in this design example; however, given the short span of the floor joists and roof joists, sawn lumber could have been used. In this case, the joist shrinkage perpendicular to grain would need to be included in the overall shrinkage calculation. Also, sawn lumber joists can be supported in joist hangers (see Figure 5) so as not to contribute to the overall building shrinkage. For this design example, sawn lumber is used for the stud-framed walls.
For further explanation of moisture content and wood shrinkage, see §3.
Location of Shear Walls The lateral force-resisting system in this design example uses both interior and exterior walls for shear walls (see Figure 3). The seismic force-resisting system for the transverse direction (north-south) utilizes the interior walls between the hotel guest rooms. A seismic design of a selected interior shear wall in the transverse direction is illustrated in this design example. The seismic force-resisting system for the longitudinal direction (east-west) utilizes the long interior corridor walls located at the center of the structure, with shear walls on both sides of the corridor in addition to shear walls on the exterior walls and shear walls at the bathroom walls.
$FRA-593_Five-Over-One_TechDoc_Dec2017.indd 8 12/7/17 11:18 AM

7 | Given Information5
Related to the lateral force-resisting system in the longitudinal direction for structures similar to this design example, it is recognized that some structural engineers may only utilize the interior corridor walls and not place shear walls on the exterior walls for similar building configurations. Engineers using such layouts have used rigid diaphragm analysis to distribute lateral forces to the shear walls and followed the requirements of SDPWS 2008 §4.2.5.1.1 for Open Front Structures. While the code does not explicitly prohibit the elimination of exterior shear walls for wood-frame structures, the Structural Engineers Association of California (SEAOC) in the 2012 IBC SEAOC Structural/Seismic Design Manual, Volume 2 has recommended that designers not remove all shear walls from an exterior wall line without careful consideration of the horizontal diaphragm deflections and overall building performance. In SDPWS 2015 §4.2.5.2, the provisions for open front diaphragms have been clarified to include some design considerations and reiterate that ASCE 7 story drift requirements for seismic design forces apply to all edges of the structure.
Support of Floor Joists This design example uses balloon framing. The floor joists are supported in joist hangers hung from the top plates (see Figure 5). The wall studs and posts have a simple span between the top of the sole plate and the bottom of the lower top plate.
For wood-frame structures built with regular platform construction, the floor joists are supported by direct bearing onto the top plate(s) (see Figure 5A).
Given Information Loading Assumptions:
ROOF WEIGHTS: FLOOR WEIGHTS:
Roofing + re-roof 5.0 psf Flooring 1.0 psf
Sheathing 3.0 Lt. wt. concrete 14.0
Trusses + blocking 2.0 Sheathing 2.5
Insulation + sprinklers 2.0 I-joist + blocking 4.0
Ceiling + misc. 15.0 Ceiling + misc. 7.0
Beams 1.0 Beams 1.5
Dead load 28.0 psf 30.0 psf
Live load 20.0 psf 40.0 psf
Interior and exterior wall weights have not been included in the above loads; they have been included in the diaphragm weights shown below. Typical interior and exterior partition weights can vary between 10 psf and 20 psf depending on room sizes, number of layers of gypsum board on walls, etc.
Weights of respective diaphragm levels, including tributary exterior and interior walls:
FLEXIBLE UPPER PORTION
Wroof = 587 k
W6th floor = 639 k
W5th floor = 647 k
W4th floor =647 k
W3rd floor = 647 k
W = 3,167 k
RIGID LOWER PORTION:
Wupper = 3,167 k
W2nd floor = 2,632 k
W = 5,799 k
$FRA-593_Five-Over-One_TechDoc_Dec2017.indd 9 12/7/17 11:18 AM
8 | Given Information6
Weights of roof diaphragms are typically determined by taking one half the height of the walls from the fifth floor to the roof. Weights of floor diaphragms are typically determined by taking one-half of the walls above and below for the fifth, fourth and third floor diaphragms. The weights of all walls, including interior non-bearing partitions, are included in the respective weights of the various levels. The weight of parapets (where they occur) has been included in the roof weight.
Structural Material Assumptions:
• The roof is 1⁄2-inch-thick DOC PS 1 or DOC PS 2-rated sheathing, 32⁄16 span rating with Exposure I glue.
• The floor is 23⁄32-inch-thick DOC PS 1 or DOC PS 2-rated Sturd I Floor 24 inches o.c. rating, 48⁄24 span rating with Exposure I glue.
• DOC PS 1 and DOC PS 2 are the U.S. Department of Commerce (DOC) Prescriptive and Performance- based standards for plywood and oriented strand board (OSB), respectively.
• Wall framing is a modified balloon framing where the joists hang from the walls in joist hangers (see Figure 5).
FRAMING LUMBER FOR STUDS AND POSTS ARE DOUGLAS FIR-LARCH NO. 1 GRADE: NDS Table 4A
Fb = 1,450 psi
Fc = 1,500 psi
Ft = 1,500 psi
E = 1,700,000 psi
Emin = 620,000 psi
Cm = 1.0
Ct = 1.0
Fastener Assumptions: Common wire nails are used for shear walls, diaphragms and straps. When specifying nails on a project, specification of the penny weight, type, diameter and length (example 10d common = 0.148-inch x 3-inch) is recommended.
The IBC, NDS and SDPWS-2008 list values for shear walls and diaphragms. For values using nail and sheathing thickness not listed in the IBC and NDS/SDPWS, the engineer can also consider using the values listed in International Code Council-Evaluation Service (ICC-ES) Report ESR-1539 from the International Staple, Nail and Tool Association (ISANTA). This report can be downloaded from ISANTA’s website at http://www.isanta.org or from the International ICC-ES website at http://www.icc-es.org.
Heights and Areas Code Study Assumptions:Using the special design provision from 2012 IBC 510.2, this design utilizes a 3-hour fire separation at the first level above grade. This horizontal separation creates two buildings for the purposes of of fire and life safety. The structure is also equipped throughout with an NFPA 13 sprinkler system which permits an additional story of construction.
LOWER STRUCTURE: IBC 510.2 & IBC Table 503
Building Type – IAOccupancies – S-2, B, E, A-2Table 503 allowable height and area – ULActual height – 12 feet
$FRA-593_Five-Over-One_TechDoc_Dec2017.indd 10 12/7/17 11:18 AM

9 | Given Information
Note for Figure 2:
See Figure 3 for building plan dimensions and Figure 6 for building height dimensions.
Figure 2. Building Elevation
Note for Figure 3:
In Figure 3, the prefabricated wood I-joists run east-west spanning to the wood-bearing walls separating
the hotel guest units running north-south at 13 feet o.c. The floor area is 12,000 square feet.
Figure 3. Typical Floor Plan
ROOF
2ND FLOOR
1ST FLOOR1st. FLOOR
2nd. FLOOR
ROOF
UPPER STRUCTURE: IBC Table 503
Building Type – IIIAOccupancy – R-2Table 503 allowable height – 65 feet and 4 storiesIncreased allowable height – 85 feet and 5 stories (see 2a below)Table 503 allowable area – 24,000 square feetActual area – 12,000 square feet/floor
$FRA-593_Five-Over-One_TechDoc_Dec2017.indd 11 12/7/17 11:18 AM

10 | Structural and Non-Structural
Part II – Structural and Non-Structural Code Reference
1. Seismic Height Limitation
The heights of the floors and roof are shown in Figure 6.
MAXIMUM HEIGHT OF STRUCTURE: ASCE 7-10 Table 12.2.1
Table 12.2.1 of ASCE 7-10 lists the maximum height of a structure, measured from its base, related to the seismic force-resisting system (SFRS) and the Seismic Design Category (SDC). Section 11.2 defines the base of the structure as “the level at which horizontal seismic ground motions are considered to be imparted on the structure.”
The height of the wood-frame building is measured from the top of the podium slab to the average roof sheathing elevation, as described in the ASCE 7-10 §11.2 definition for “Structural Height.” Due to the rigidity of the concrete podium, the podium slab can be used as the base for the light-framed walls sheathed with wood structural panels. Therefore:
The height limit in SDC D, E and F is 65 feet
The average (mean) height of the structure is 50 feet
65 > 50 Okay
2. Fire and Life Safety
2a. Height and Area Allowances
BUILDING HEIGHT: IBC 504
Increased height = 85 ft and 5 stories IBC 504.2
The portion of the building below the horizontal assembly is not limited in height or area because it is of Type I construction. The area above the podium is going to be 5 stories and a total of 62 feet above grade, but IBC Table 503 limits the number of stories to 4 and the total height to 65 feet. IBC 504.2 allows an increase of one story and 20 feet in height for most occupancies, R-2 included, when the building is equipped with an NFPA 13 sprinkler system throughout. Because the upper structure is a residential occupancy, an NFPA 13R system may have been considered, but the use of such a sprinkler system limits the overall height to 4 stories and 60 feet and would therefore not have been appropriate for this application.
MEZZANINE: IBC 505
An additional level can be added by designing a mezzanine into the project. IBC 505 indicates that a mezzanine can be up to one third of the floor area of the room or space above which it is located. It is not counted in the allowable building area; nor is it considered a story. However, it does need to be considered in the fire area outlined in Chapter 9 of the IBC.
BUILDING AREA: IBC 506 & CBC 506
Increased area = 24,000 ft2* per floor IBC 506.3
Maximum building area = 3x increased allowable area = 72,000 ft2 IBC 506.4
*No frontage increase per 506.2 is used in this example. CBC does not allow both height and area increases simultaneously for use of NFPA 13 sprinklers.
$FRA-593_Five-Over-One_TechDoc_Dec2017.indd 12 12/7/17 11:18 AM

11 | Structural and Non-Structural
The allowable floor area per Table 503 (24,000 square feet) is more than sufficient to accommodate this design with only 12,000 square feet of R-2 occupancy per floor. However, in many instances, an increase in allowable area is required. IBC 506 allows the areas set in Table 503 to be increased based on frontage area (allowing increased accessibly in a fire) and the use of sprinklers. An NFPA 13 sprinkler system can increase the allowable area for multi-story applications by up to three times per equation 5-1 and IBC 506.3. The IBC allows both a height and area increase simultaneously with the use of sprinklers; however, the CBC limits the allowable increase to height or area, but not both. In this example, no area increase was necessary, so this was not an issue. In projects where desired floor area exceeds these allowances, fire walls are used to partition the building. In podium construction, fire walls used in the upper portion of the structure need to be vertically continuous and can terminate at the 3-hour horizontal assembly.
IBC 506.4.1 also outlines a total building area maximum that needs to be considered in addition to the floor area maximum.
HORIZONTAL SEPARATION: 510.2 & 510.4
Using the special provision in IBC 510.2, the upper and lower “buildings” are required to be separated by a horizontal assembly with a fire resistance rating of not less than 3 hours. If the first story above grade only contains parking, then special provision IBC 510.4, which allows a heavy timber podium, may be an option where the fire resistance rating of the horizontal assembly must meet the requirements for occupancy separations in IBC 508.4, which is 2 hours for an R-2 occupancy above an S-2 occupancy as described in this special provision.
2b. Fire Resistance IBC Table 720.1(2)
There are several ways to achieve a fire rating for a floor or wall assembly. IBC/CBC §703 outlines various methods that include tested assemblies in accordance with ASTM E119, deemed to comply with tables in §721 of the 2012 IBC (§720 of the 2009 IBC), and the component additive method in §722 of the 2012 IBC (§721 of the 2009 IBC).
Fire-rated assemblies can be found in a number of sources including the IBC, the Underwriters Laboratories (UL) Fire Resistance-Rated Systems and Products, the UL Fire Resistance Directory, and the Gypsum Association’s Fire Resistance Design Manual.
Table 721.1(2) of the IBC lists prescriptive assemblies and includes fire ratings for various wall construction types. Footnote ‘m’ of the table requires that, for studs with a slenderness ratio, le/d, greater than 33, the design stress shall be reduced to 78 percent of allowable F'c. For studs with a slenderness ratio, le/d, not exceeding 33, the design stress shall be reduced to 78 percent of the adjusted stress F'c calculated for studs having a slenderness ratio le/d of 33.
The American Wood Council (AWC) has tested a number of wood-frame fire-rated assemblies, which have been added to Table 721.1(2). Footnote “m” does not apply to these assemblies because the walls were tested at 100% of full design load. The AWC publication DCA3 (which can be downloaded at www.awc.org) provides details on these assemblies that do not require the 78 percent reduction.
DETERMINATION OF Cp: NDS-12 3.3.3.2
When studs have gypsum sheathing or structural panel sheathing on both sides of the studs and posts, where the compressive edges are held in line, CL may be assumed to be 1.0.
le = lu = the clear height of the studs
This design example has sheathing on both sides, therefore CL = 1.0.
7
$FRA-593_Five-Over-One_TechDoc_Dec2017.indd 13 12/7/17 11:18 AM

12 | Structural and Non-Structural
However, when a sound wall is used and the studs are staggered where one edge of the stud does not have its compressive edge held in line, CL needs to be calculated. For this loading condition, the effective unbraced length le for the studs and posts is listed in NDS-12 Table 3.3.3 as follows:
For a 10-foot, 0-inch floor-to-floor height with a 2x4 sole plate with a 4x4 top plate:
lu =
114 in = 33 > 7
d 3.5 in
Therefore:
le = 1.631lu + 3d
Solving for le/d = 33 yields the following stud and post lengths for the footnote ‘m’ reduction in F’c:
For 4x studs and posts:
lu > 5-ft 4-in
For 6x studs and posts:
lu > 8-ft 5-in
Since most wall heights for new buildings are 9 to 10 feet, this reduction in F’c is basically applied to all bearing walls in a fire-rated wall.
It should be noted that this is an IBC requirement and not an NDS requirement.
2c. Fire Retardant-Treated Wood (FRTW) IBC §602.3
This wood-frame structure exceeds the limits for Type V construction. To have five stories of light wood-frame construction, the code requires that the building be Type III. Type III construction requires the exterior walls to be constructed with noncombustible materials. As an exception to using noncombustible construction, §602.3 of the IBC states that fire retardant-treated wood (FRTW) framing complying with IBC §2303.2 is permitted for exterior wall assemblies with ratings of two hours or less, basically allowing wood-frame construction for many structures where noncombustible materials would otherwise be required.
The FRTW must comply with conditions in IBC §2303.2 and 2304.9.5 as follows:
1) LABELING IBC §2303.2.4
Fire retardant-treated lumber and wood structural panels must be labeled and contain the following items:
A. Identification mark of the approved agency
B. Identification of the treating manufacturer
C. Name of the fire retardant treatment
D. Species of the wood treated
E. Flame spread and smoke-developed index
F. Method of drying after treatment
G. Conformance with appropriate standards
If exposed to weather, damp or wet conditions, it must also include the words “No increase in the listed classification when subjected to the Standard Rain Test.”
$FRA-593_Five-Over-One_TechDoc_Dec2017.indd 14 12/7/17 11:18 AM

13 | Structural and Non-Structural
Look for this information on all fire retardant treated wood stamps or labels
WESTERN WOOD PRESERVERS INSTITUTE • 7017 N.E. HIGHWAY 99 • VANCOUVER, WA 98665 • 1-800-729-WOODWEB: www.WWPInstitute.org • E-MAIL: [email protected]
KDAT KDAT
InteriorProductName
ProductSpecies
TreatingPlant
DryingMethod
TreatingStandard
Approved AgencyName & Logo
ASTM E-84 Reference
AGENCY NAME/MARK/ID
FLAME SPREAD 15
SMOKE DEVELOPED 50
DOUGLAS FIR
30 MINUTE TEST
Flame Spread
25 or less
FRTWBRAND
ABC TREATINGCOMPANY
ANYWHERE, USAPROCESS CONTROL
STANDARD DESIGNATIONOR CONFORMANCE WITH
APPROPRIATE IBC/IRC(ICC-ES REPORT)
FRTWBRAND
ABC TREATINGCOMPANY
ANYWHERE, USAPROCESS CONTROL
STANDARD DESIGNATIONOR CONFORMANCE WITH
APPROPRIATE IBC/IRC(ICC-ES REPORT)
AGENCY NAME/MARK/ID
FLAME SPREAD 15
SMOKE DEVELOPED 50
DOUGLAS FIR
30 MINUTE TEST
NO INCREASE IN THE LISTEDCLASSIFICATION WHEN SUBJECTED
TO THE STANDARD RAIN TESTKDAT KDAT
ExteriorProductName
ProductSpecies
TreatingPlant
TreatingStandard
Flame Spread
25 or less
Approved AgencyName & Logo
ASTM E-84Reference
ASTM D2898
DryingMethod
WWPI Fire Retardant Members’ Product Brands and Respective QC Monitoring Agencies:
*Exterior fire retardantsmay also be used ininterior applications.
Code compliant stamps must contain this information. Product coloration is not a substitute for a building code approved, third-party inspection agency label.
Exterior Fire Retardants*
Interior Fire Retardants
WWPI Fire Retardant Members’ Product Brands and Respective QC Monitoring Agencies:
2) STRENGTH ADJUSTMENTS IBC §2303.2.5
The IBC requires that lumber design values be adjusted for the treatment and take into account the anticipated temperatures and humidity. Each manufacturer must publish the adjustment factors for service temperatures (not less than 80°F) and for roof-framing members (elevated temperatures). The adjustment factors vary from manufacturer to manufacturer, and should be obtained from the product evaluation report. A sample of two manufacturers’ strength adjustments are shown in Table 1.
Note that an additional load factor for incising may also be necessary (Ci) that is not included in the manufacturer provided reduction factors. Incising is dependent on both species and size of the treated material, in addition to treatment formulation. For this example, the 2x and 3x Douglas Fir-Larch studs will not require incising and therefore the incising factor is not used.
Sample labels for solid sawn framing lumber and plywood are shown in Figure 4. It should be noted that FRTW sheathing is only available in plywood; the amount of resins and waxes in oriented strand board (OSB) is too high for the treatment process.
Some treated wood suppliers require the untreated wood to be shipped to their plant (from the framing contractor) for treatment, then shipped to the site.
Some suppliers stock most “sawn lumber” (2x, 3x and 4x) for immediate shipping.
Treatment adds about 50 percent to the cost of the material for interior and 80 percent for exterior applications.
Table 1. Sample Strength Reduction Factors for FRTW
Design Property
FRTW Brand A FRTW Brand B
Douglas Fir-Larch
Southern PineSpruce- Pine-Fir
Douglas Fir-Larch
Southern PineSpruce- Pine-Fir
Fb 0.97 0.91 0.88 0.90 0.89 0.89
Ft 0.95 0.88 0.83 0.87 0.92 0.87
Fc⎮⎮ 1.00 0.94 0.94 0.91 0.94 0.91
Fv 0.96 0.95 0.93 0.94 0.95 0.94
E 0.96 0.95 0.94 0.98 0.98 0.98
Fc⊥ 0.95 0.95 0.95
Fasteners 0.90 0.90 0.90 0.92 0.92 0.92
Figure 4. Sample Labels for FRTW
$FRA-593_Five-Over-One_TechDoc_Dec2017.indd 15 12/7/17 11:18 AM
14 | Structural and Non-Structural
3) EXPOSURE TO WEATHER IBC §2303.2.6
When FRTW is exposed to weather, damp or wet conditions, the identifying label needs to indicate “EXTERIOR.” For this example, all of the wood framing is within the building envelope; therefore, exterior-rated FRTW is not required.
4) FASTENERS IBC §2304.9.5.4
Fasteners (including nuts and washers) in fire retardant-treated wood used in interior locations shall be in accordance with the manufacturer's recommendations. Fasteners in contact with treated wood need to meet this requirement. Rods in the tie-down system pass through an oversized hole in the wood and do not need to meet this requirement.
5) CUTTING AND NOTCHING Treated lumber must not be ripped or milled as this will invalidate the flame spread. However, where FRTW joists or rafters are ripped for drainage conditions and FRTW plywood is placed on top of the ripped edge, this is considered acceptable.
End cuts and holes are usually not permitted; check the product evaluation report for requirements.
3. Vertical Displacement (Shrinkage) IBC §2303.7 in Multi-Level Wood Framing
Vertical displacement can be a challenge in multi-level wood framing unless special considerations are accounted for during design and construction. Vertical displacement may be caused by one or a combination of the following:
WOOD SHRINKAGE Both the IBC and NDS require that consideration be given to the effects of cross-grain dimensional changes (shrinkage) when lumber is fabricated in a green condition. In addition, IBC §2304.3.3 requires that wood walls and bearing partitions supporting more than two floors and a roof be analyzed for shrinkage of the wood framing, and that possible adverse effects on the structure be satisfactorily addressed and solutions be provided to the building official.
The total shrinkage in wood-frame buildings can be calculated by summing the estimated shrinkage of the horizontal lumber members in walls and floors (wall plates, sills and floor joists). Most of the shrinkage is cross grain. The amount of shrinkage parallel to grain (length of studs) is approximately 1⁄40 of the shrinkage perpendicular to grain (cross grain) and can be neglected.
Resources for calculating shrinkage:
• A free shrinkage calculator can be downloaded from the Western Wood Products Association website at: www2.wwpa.org.
• More information on shrinkage is available in the American Wood Council's ASD/LRFD Manual for Engineered Wood Construction, 2012 Edition, which is available at: http://www.awc.org/standards/nds/2012.php.
This case study illustrates two methods for determining the amount of wood shrinkage (as follows).
$FRA-593_Five-Over-One_TechDoc_Dec2017.indd 16 12/7/17 11:18 AM

15 | Structural and Non-Structural
3a. Comprehensive Shrinkage Estimation For a dimensional change with the moisture content limits of 6 to 14 percent, the formula is:
S = Di [CT(MF-Mi)]
Where:
S = shrinkage (in inches)
Di = initial dimension (in inches)
CT = dimension change coefficient, tangential direction
CT = 0.00319 for Douglas Fir-Larch
CT = 0.00323 for Hem-Fir
CT = 0.00263 for Spruce-Pine-Fir
MF = final moisture content (%)
Mi = initial moisture content (%)
The formulas are from the Wood Handbook: Wood as an Engineering Material and Dimensional Stability of Western Lumber Products.
For a dimension change with moisture content limits greater than 6 to 14 percent where one of the values is outside of those limits, the formula is:
S = Di ( MF - Mi )
30 (100) - 30 + Mi
ST
Where:
S = shrinkage (in inches)
Di = initial dimension (in inches)
ST = tangential shrinkage (%) from green to oven dry
ST = 7.775 for Douglas Fir-Larch
MF = final moisture content (%)
Mi = initial moisture content (%)
The final moisture content (MF) for a building is referred to as the equilibrium moisture content (EMC). The final EMC can be higher in coastal areas and lower in inland or desert areas. These ranges are normally from 6 to 15 percent (low to high). The WWPA has downloadable documents listing EMC for all major U.S. cities for each month of the year. At the web address after login, click “Shrinkage” followed by “EMC Charts” (free user login with password is required): www2.wwpa.org/Shrinkage/EMCUSLocations1997/tabid/888/Default.aspx
$FRA-593_Five-Over-One_TechDoc_Dec2017.indd 17 12/7/17 11:18 AM

16 | Structural and Non-Structural
The EMC can be calculated with this formula:
EMC = 1800 [ KH
+ (K1KH + 2K1K2K2H2) ] W 1-KH (1 + K1KH + K1K2K2H2)
Where:
W = 330 + (0.452)T + (0.00415)T2
K = 0.791 + (0.000463)T - (0.000000844)T2
H = relative humidity (%)
K1 = 6.34 + (0.000775)T - (0.0000935)T2
K2 = 1.09 + (0.0284)T - (0.0000904)T2
T = temperature (°F)
For this design example, a final moisture content MF (EMC) of 12.0 percent is used.
Project specifications call for all top plates and sill (sole) plates to be Douglas Fir-Larch “kiln dried” (KD) or “surfaced dried” (S-Dry). Kiln dried lumber or surfaced dried has a maximum moisture content of 19 percent and an average of 15 percent.
It might be more realistic to use a lower number than 19 percent in the calculation so as to not overestimate the shrinkage.
Typical floor framing has a 4x4 top plate and a 2x4 sole plate (see Figure 5).
Find the individual shrinkage of the two members:
DETERMINE SHRINKAGE OF 4X4 TOP PLATE: Since our initial MC (Mi) is 19 percent and the final MC (MF) is 12 percent, the equation is:
S = Di (MF - Mi) =
3.5 (12 - 19) = -0.065 in
30 (100) - 30 + Mi
30 (100) - 30 +19
ST 7.775
The final size of our 4x4 is: 3.5 - 0.065 = 3.435 in
3b. Quick Shrinkage Estimation A close approximation that is much more easily used to determine amount of shrinkage is:
S = CDi (MF - Mi)
Where:
S = shrinkage (inches)
C = average shrinkage constant
C = 0.002
MF = final moisture content (%)
Mi = initial moisture content (%)
$FRA-593_Five-Over-One_TechDoc_Dec2017.indd 18 12/7/17 11:18 AM

17 | Structural and Non-Structural
DETERMINE SHRINKAGE OF 4X4 TOP PLATE: Since our initial MC (Mi) is 19 percent and the final MC (MF) is 12 percent, the equation is:
S = CDi (MF - Mi) = 0.002 x 3.5 (12-19) = -0.049 in
The final size of our 4x4 is:
3.5 - 0.049 = 3.451 in
Note that this quick estimation is within 0.5 percent of the actual calculated dimension of 3.435 inches using the comprehensive formulas.
S = CDi (MF - Mi) = 0.002 x 1.5 (12-19) = -0.021 in
DETERMINE SHRINKAGE OF 2X4 SOLE PLATE: S= CDi (MF - Mi) = 0.002 x 1.5 (12 - 19) = -0.021 in
Figure 5. Typical Floor Framing at Wall
Notes for Figure 5:
1. Blocking above the sole plate is to provide a nailing surface for the finishes. An alternative detail
could use two sole plates, but this will increase shrinkage amounts for the building.
2. Web stiffeners at joist hangers may be required depending on joist size and manufacturer.
3. Hangers for the floor joist are installed over the sheathing (gypsum, plywood or OSB) and must
be rated/approved for this installation (e.g., Technical Bulletin from joist hanger manufacturer
listing reduced allowable hanger loads).
4. This detail uses a 4x4 top plate. Use of double 2x plates (not depicted) is also common.
Total shrinkage per floor level with the 4x4 top plate and 2x4 sole plate: S = 0.049 + 0.021 = 0.07 in
$FRA-593_Five-Over-One_TechDoc_Dec2017.indd 19 12/7/17 11:18 AM

18 | Structural and Non-Structural
Figure 5A. Typical Platform Floor Framing at Wall Using Sawn Joists
EXAMPLE CALCULATION
DETERMINE SHRINKAGE OF SAWN JOISTS WITH PLATFORM FRAMING (Figure 5A):
S = CDi (MF -Mi) = 0.002 x 11.25 (12-19) = -0.158 in
Total shrinkage per floor level with the 4x4 top plate, 2x12 sawn joists and 2x4 sole plate:
S = 0.049 + 0.021 + 0.158 = 0.228 in
SETTLEMENT UNDER CONSTRUCTION GAPS (Consolidation): Small gaps can occur between plates and studs, caused by (among other things) mis-cuts (short studs) and the lack of square-cut ends. These gaps can account for up to 1⁄ 8 inch per story, where “perfect” workmanship would be 0 inches and a more “sloppy” workmanship would be 1⁄ 8 inch. This design example factors in gaps of 1⁄ 10 inch per floor.
$FRA-593_Five-Over-One_TechDoc_Dec2017.indd 20 12/7/17 11:18 AM
19 | Structural and Non-Structural
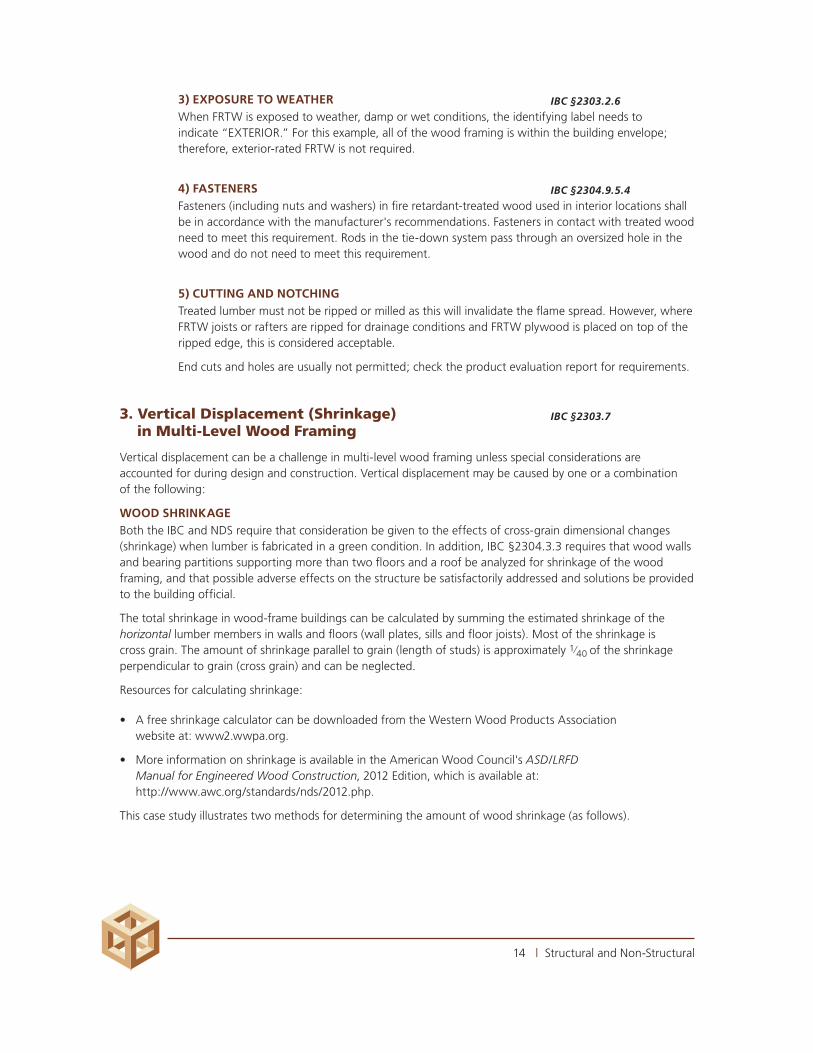
DEFORMATION UNDER SUSTAINED LOADING: Wood beams that support walls can creep from the sustained loading. The “rate” of creep is higher for beams that are loaded while at higher moisture contents. Where total deflection under long-term loading must be limited, NDS 3.5.2 recommends the use of a time dependent deformation (creep) factor of between 1.5 and 2.0.
Table 2. Vertical Displacements
LevelVertical Displacement Design Displacement
(in)Per Level Cumulative
Roof 0.170 0.85 7⁄ 8
6th Floor 0.170 0.68 3⁄ 4
5th Floor 0.170 0.51 5⁄ 8
4th Floor 0.170 0.34 3⁄ 8
3rd Floor 0.170 0.17 1⁄ 4
Where: Shrinkage of 0.07 inch + settlement of 0.10 inch = 0.170 inch
METHODS TO REDUCE VERTICAL DISPLACEMENT:
1. Use kiln-dried plates (MC < 19%) or even MC15 (MC < 15%) lumber or engineered lumber
for plates.
2. Consider a single top plate instead of double top plate.
3. Consider balloon framing or a modified balloon framing.
4. Place floor joists in metal hangers bearing on beams or top plates instead of bearing on the top plates.
5. Improper storage of the material stock on site can negate all design and planning. Lumber should be kept away from moisture sources and rain.
METHODS TO ACCOUNT FOR VERTICAL DISPLACEMENT:
1. Use continuous tie-down systems with shrinkage compensating devices in shear walls.
2. Architectural finish details near the floor lines need to account for vertical displacement.
3. Provide a 1⁄ 8-inch gap between window and door tops to the framing lumber.
$FRA-593_Five-Over-One_TechDoc_Dec2017.indd 21 12/7/17 11:18 AM

20 | Seismic Design
Part III – Seismic Design
4. Two-Stage Design for Lateral Analysis ASCE 7-10 §12.2.3.2
The seismic response coefficient R for the first floor special concrete shear walls and special reinforced masonry shear walls is 5.0. The seismic response coefficient R for the wood structural panel shear walls is 6.5. Section 12.2.3.1 of ASCE 7-10 requires the least value of R to be used for the building for the seismic design in that direction.
One approach that can be used for the seismic design would be to design the entire structure for the R value of 5.0. However, this would require the upper wood-frame portion of the stucture to be designed for 30 percent higher forces in addition to inverting more of the building’s mass (second floor) into the upper stories.
A more realistic approach (from both a seismic and economic perspective) would be to design the structure using the two-stage equivalent lateral force procedure prescribed in ASCE 7-10 §12.2.3.2. This procedure can be used where there is a flexible upper portion and a rigid lower portion. This structure type (flexible over rigid) is the structural opposite of the “soft story” structures that are not desirable.
The allowance of two-stage equivalent lateral force procedure for a flexible upper portion above a rigid lower portion has been in the building code since the 1988 Uniform Building Code with essentially the same variables. This procedure is permitted in ASCE 7-10 §12.2.3.2 when the structure complies with the following criteria:
A. The stiffness of the lower portion must be at least 10 times the upper portion.
B. The period of the entire structure shall not be greater than 1.1 times the period of the upper portion.
C. The flexible upper portion shall be designed as a separate structure using the equivalent lateral force or model response procedure and the appropriate values of R and ρ.
D. The rigid lower portion shall be designed as a separate structure using the equivalent lateral force procedure and the appropriate values of R and ρ of the lower structure with the reactions from the upper structure scaled as described in ASCE 7-10.
For the purpose of this design example, the upper flexible structure and lower rigid structure are each regular and qualify for the equivalent lateral force procedure to be used.
4a. Stiffness Determinations Stiffness of the lower portion must be at least 10 times the upper portion.
Wall rigidity (stiffness):
F = kδ
Or
k = F
δ
Where:
F = the applied force to the wall
k = the stiffness of the wall
δ = deflection of the wall
$FRA-593_Five-Over-One_TechDoc_Dec2017.indd 22 12/7/17 11:18 AM
21 | Seismic Design
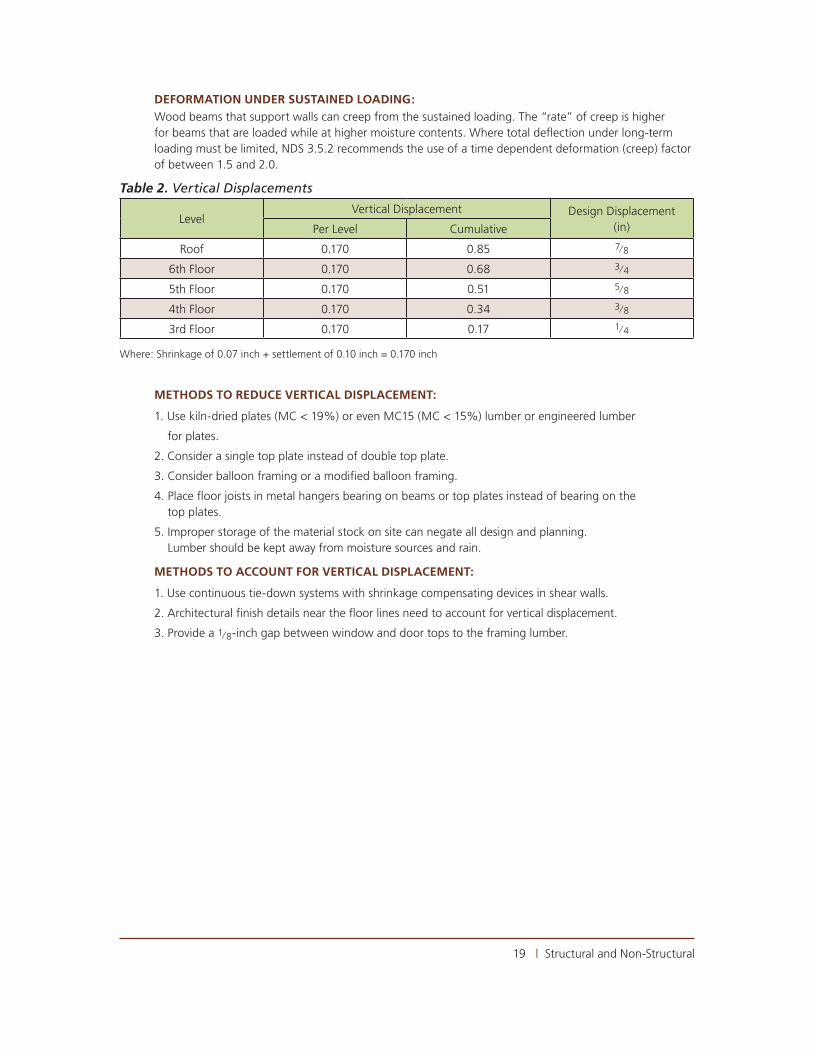
STIFFNESS OF FLEXIBLE UPPER PORTION: Determine stiffness of typical interior cross wall:
Table 3. Determine Stiffness of Typical Interior Wall
Level FDeflection
δxe k =
F
δ
(k) (in) (k/in)
Roof 12.989 0.38 34.18
6th Floor 24.300 0.49 49.59
5th Floor 32.890 0.42 78.31
4th Floor 38.617 0.45 85.82
3rd Floor 41.480 0.50 82.96
Where: F = the applied force to the wall as determined from Table 6
δ = the computed shear wall deflection from Table 17
STIFFNESS OF RIGID LOWER PORTION: Determine stiffness of typical interior cross wall:
From 3-D finite element analysis of the rigid lower portion, the average deflection of the first floor transverse shear wall at design seismic loading:
δwalls = 0.02 in
Fwall = 190 kips
k = 190k
= 9,500 k
0.02 in in
Ratio of rigid lower portion stiffness to flexible upper portion stiffness:
ratio = 9,500
= 114 > 10 ⇒ Okay
82.96
4b. Period Determinations Check for conformance to the requirement that the period of the entire structure must not be greater than 1.1 times the period of the upper portion.
First determine building periods (see Figure 6 for section through structure) using the approximate fundamental period equations of ASCE 7-10 as opposed to computer model calculations.
For the flexible upper portion:
Ta = Ct(hn)x = 0.020(50.0)3/4 = 0.38 sec ASCE 7-10 Eq. 12.8-7
For the entire structure:
Ta = Ct(hn)x = 0.020(62.0)3/4 = 0.44 sec ASCE 7-10 Eq. 12.8-7
Ratio of periods:
0.44 = 1.16 ≅ 1.1 ⇒ Criteria not met
0.38
$FRA-593_Five-Over-One_TechDoc_Dec2017.indd 23 12/7/17 11:18 AM

22 | Seismic Design
Using the ASCE 7-10 equation can produce period ratios > 1.1. This equation is problematic since the same coefficients are used for both wood and concrete shear walls to approximate the building periods.
ALTERNATE METHOD OF PERIOD DETERMINATION:
T = 2π √(∑n
i=1 wiδi
2) ÷ (g∑n
i=1 fiδi) FEMA 450 Eq. C5.2-1
The above equation, which produces a more accurate building period, is based on Rayleigh’s method and was the equation that appeared in the Uniform Building Code (Eq. 30-10 in the 1997 UBC).
Table 4. Determine Period of Flexible Upper Portion
Level w (k) f (k)Cumulative
δ (in)w(δ)2 f(δ)
Roof 587 184.5 2.24 2,945.3 413.3
6th Floor 639 160.6 1.86 2,210.7 298.7
5th Floor 647 122.0 1.37 1,214.4 167.1
4th Floor 647 81.3 0.95 583.9 77.2
3rd Floor 647 40.7 0.50 161.8 20.4
∑ 3,167.00 589.1 7,116.0 976.7
T = 2π
√
7,116.0
= 0.863 sec (32.2 x 12) 976.7
Table 4A. Determine Period of Entire Structure
Level w (k) f (k)Cumulative
δ (in)w(δ)2 f(δ)
Roof 587 184.5 2.26 2,998.2 417.0
6th Floor 639 160.6 1.88 2,258.5 301.9
5th Floor 647 122.0 1.39 1,250.1 169.6
4th Floor 647 81.3 0.97 608.8 78.9
3rd Floor 647 40.7 0.52 174.9 21.2
2nd Floor 2,632 489.5 0.02 1.1 9.8
∑ 5,799 1,078.6 7,291.5 998.3
T = 2π
√ 7,291.5
= 0.864 sec (32.2 x 12) 998.3
Ratio of periods:
0.864 = 1.001 < 1.1 ⇒ Okay
0.863
$FRA-593_Five-Over-One_TechDoc_Dec2017.indd 24 12/7/17 11:18 AM

23 | Seismic Design
4c. Design of Flexible Upper Portion Design coefficients for the seismic force-resisting system (SFRS) from ASCE 7-10 Table 12.2-1 are as follows:
Type A-13: Light-framed walls with wood sheathing
R = 6.5
Ω0 = 3.0
Cd = 4.0
Maximum building height:
No height limit for seismic design categories B & C
65 feet for seismic design categories D, E & F
The flexible upper portion will be designed using the seismic response coefficient R = 6.5 and the redundancy factor ρ for that portion.
4d. Design of Rigid Lower Portion Design coefficients for the SFRS:
Usually A1/A7:
For special reinforced concrete shear walls
R = 5.0
Ω0 = 2.5
Cd = 5.0
For special reinforced masonry shear walls
R = 5.0
Ω0 = 2.5
Cd = 3.5
The rigid lower portion will be designed using the seismic response coefficient R = 5.0 and the redundancy factor ρ for that portion.
$FRA-593_Five-Over-One_TechDoc_Dec2017.indd 25 12/7/17 11:18 AM

24 | Seismic Design
SEISMIC AND SITE DATA:Seismic Design Category D
For building frame systems with light-frame walls sheathed with wood structural panels
R = 6.5 ASCE 7-10 Table 12.2-1
Redundancy factor ρ = 1.0 ASCE 7-10 §12.3.4.2
(See §5d)
DESIGN BASE SHEAR:Design checklist:
1. Determine Risk Category and Importance Factor
2. Determine Ss, S1 and soil profi le from site location
3. Test for SDC E
4. Determine SDS and SD1
5. Determine T and test for short period exception on SDC Determine if equivalent lateral force analysis is allowed
6. Determine SDC (if not E)
7. Determine R and verify height
8. Test for Ss < 1.5 and calculate Cs base shear
9. Determine Cs
Figure 6. Typical Cross-Section through Building
5. Seismic Design of Flexible Upper Portion and Rigid Lower Portion
5a. Seismic Design of Flexible Upper Portion
$FRA-593_Five-Over-One_TechDoc_Dec2017.indd 26 12/7/17 11:18 AM

25 | Seismic Design
Determine Risk Category and Importance Factor:
Risk Category: II ASCE 7-10 T1.5-2
Importance Factor l = 1.0
Determine Ss, S1 and soil profile:
Site Class D (based upon geotechnical investigation)
Without a geotechnical investigation, Site Class D needs to be used as the default value.
Therefore, from U.S. Geological Survey (USGS) application:
Ss = 1.808g >> 0.15
Therefore, not SDC A
S1 = 0.692g >> 0.04
Therefore, not SDC A
S1 = 0.692g < 0.75
Therefore, not SDC E
S1 = 0.692g > 0.6
Therefore, EQ. 12.8-6 applies
Values for Ss and S1 can be determined from ASCE 7-10 maps or from the USGS website, which provides the values by either zip code or longitude and latitude coordinates. It is recommended that the longitude and latitude coordinates (which can be obtained from the street address) be used.
USGS website link: http://earthquake.usgs.gov/designmaps/us/application.php
Download the JAVA Ground Motion Parameter Calculator and enter the latitude and longitude.
Note: Using Zip Code Ss is overstated 3 percent
Test for SDC E:
From Tables 11.4-1 and 11.4-2 select Fa = 1.0 and Fv = 1.5
Therefore from Table 1613.3.5-1 and -2:
SDS = 2
SMS = 2
FaSS = ( 2 )1.0 x 1.808 = 1.206 > 0.5 3
3
3
Implies SDC D
SD1 = 2
SM1 = 2
FvS1 = ( 2 )1.5 x 0.692 = 0.692 > 0.2 3
3
3
Implies SDC D
$FRA-593_Five-Over-One_TechDoc_Dec2017.indd 27 12/7/17 11:18 AM

26 | Seismic Design
Determine period and test for short period exception on SDC:
Period using approximate fundamental period (see Figure 6 for section through structure)
Ta = Ct(hn)x 0.020(62)¾ = 0.44 sec ASCE 7-10 Eq 12.8-7
where hn is defined as the highest level of the structure. Since the highest level is not a level surface, the center of gravity (average height) of the diaphragm above the first floor will be used.
TS =
SD1 =
0.692 = 0.57 sec
SDS 1.206
80% TS = 0.46 > Ta = 0.44 sec
Therefore, the exception applies but doesn’t matter since SDC D occurs on both short and long period.
Therefore SDC = D
Check for permitted analytical procedure: ASCE 7-10 T12.6-1
Since Ta < 3.5 Ts and the structure is light-frame construction, equivalent lateral force analysis procedure is permitted.
Determine SDC:
Based upon above checks, SDC = D
Determine R and verify height:
For light-framed walls with wood structural panels that are both shear walls and bearing walls: ASCE 7-10 T12.2-1
R = 6.5
Maximum height permitted in SDC D is 65 feet ASCE 7-10 T12.2-1
Our building structure is less than 65 feet and is therefore permitted.
Test for Ss < 1.5:
Note: The building in this design example has a “Type II” weight (mass) irregularity between the second and third floors, which is a vertical irregularity. It is not clear whether a building that is designed using the two-stage analysis (ASCE 7-10 §12.2.3.2) should be exempted from this provision. Since each structure can be treated separately, it seems reasonable to conclude that the weight mass irregularity does not apply in the two-stage design approach. In addition, it is not clear whether the number of stories being limited to five or less applies to a two-stage podium slab type of design. For actual projects, building officials in the local jurisdiction should be contacted for their interpretation of the code.
$FRA-593_Five-Over-One_TechDoc_Dec2017.indd 28 12/7/17 11:18 AM
27 | Seismic Design
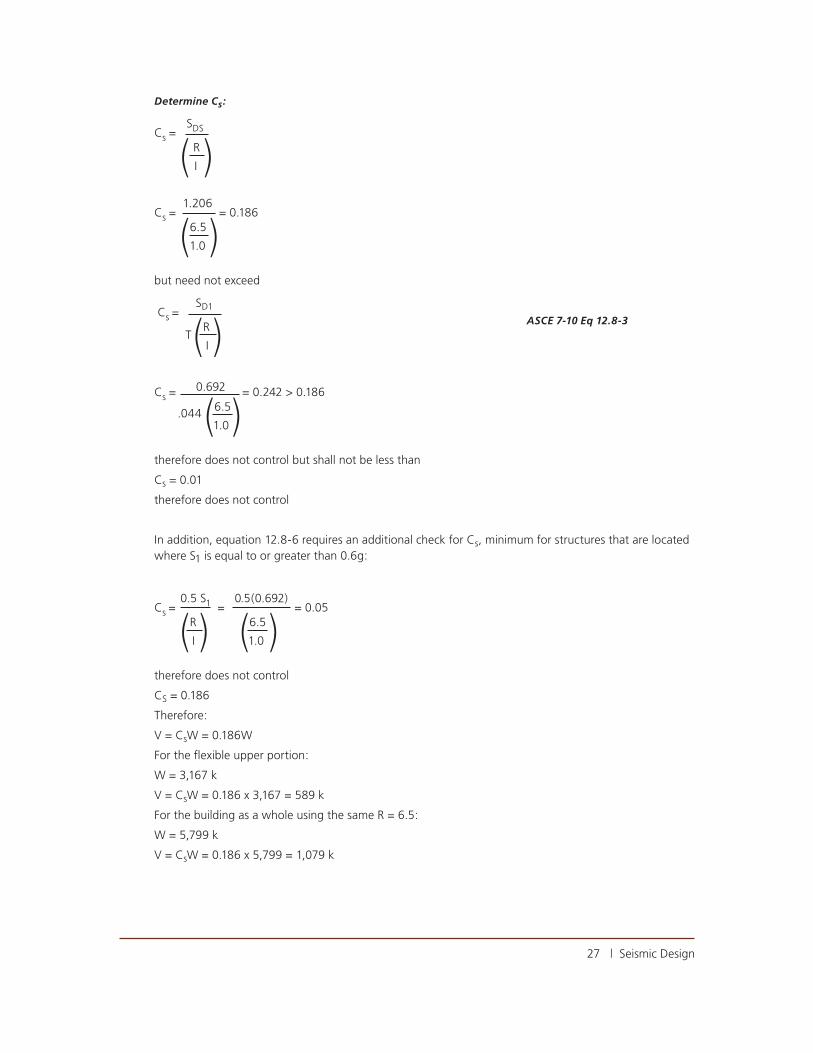
Determine Cs:
Cs = SDS
( R
)
I
Cs = 1.206
= 0.186
(6.5
)
1.0
but need not exceed
Cs =
SD1
(R ) ASCE 7-10 Eq 12.8-3
T
I
Cs = 0.692
= 0.242 > 0.186
.044 (6.5
)
1.0
therefore does not control but shall not be less than
Cs = 0.01
therefore does not control
In addition, equation 12.8-6 requires an additional check for Cs, minimum for structures that are located where S1 is equal to or greater than 0.6g:
Cs = 0.5 S1
= 0.5(0.692)
= 0.05
(R
) (6.5
)
I 1.0
therefore does not control
CS = 0.186
Therefore:
V = CsW = 0.186W
For the flexible upper portion:
W = 3,167 k
V = CsW = 0.186 x 3,167 = 589 k
For the building as a whole using the same R = 6.5:
W = 5,799 k
V = CsW = 0.186 x 5,799 = 1,079 k
$FRA-593_Five-Over-One_TechDoc_Dec2017.indd 29 12/7/17 11:18 AM

28 | Seismic Design
VERTICAL DISTRIBUTION OF FORCES ASCE 7-10 §12.8.3 The biggest advantage of using a two-stage design is that the base for the upper flexible portion is set on top of the podium slab. The heavy mass of the podium slab (second floor) is not inverted into the upper flexible portion of the structure. Hence, the base shear is based on the weight (W) of the structure that is above the podium slab.
The base shear must be distributed to each level. This is done as follows:
Fx = CVXV ASCE 7-10 Eq.12.8-11
Cvx = wxhx ASCE 7-10 Eq.12.8-12
∑n
i-1 wihi
k
Where hx is the average height at level i of the sheathed diaphragm in feet above the base, k is a distribution exponent related to the building period.
Since T = 0.38 second < 0.5 seconds, k = 1 Determination of Fx is shown in Table 5. ASCE 7-10 §12.8.3
Note that the vertical distribution of seismic forces using the base of the structure at the first floor (Table 5A) produces overly conservative results due to the tall first floor of 22 feet. For illustrative purposes, the vertical distribution of seismic forces including the second floor (without the two-stage analysis) and using the R coefficient of 6.5 for the wood sheathed walls is included in Table 5B. However, this design example uses the vertical distribution of seismic forces using the base of the structure at the second floor (Table 5) using the two-stage analysis.
Table 5. Vertical Distribution of Seismic Forces (with Base at Second Floor)
Level wx hx wxhx
wxhx
∑
wihi
Fx
Fx
wx
Ftot
Fx
A
(k) (ft) (k-ft) (%) (k) (k) (psf)
Roof 587 50 29,350 31.3 184.5 0.314 184.5 15.37
6th Floor 639 40 25,560 27.3 160.6 0.251 345.1 13.39
5th Floor 647 30 19,410 20.7 122.0 0.189 467.1 10.17
4th Floor 647 20 12,940 13.8 81.3 0.126 548.4 6.78
3rd Floor 647 10 6,470 6.9 40.7 0.063 589.1 3.39
∑ 3,167 93,730 100.0 589.1 589.1
Where: A = area of the floor plate which is 12,000 ft2
$FRA-593_Five-Over-One_TechDoc_Dec2017.indd 30 12/7/17 11:18 AM

29 | Seismic Design
Level wx hx wxhx
wxhx
∑
wihi
Fx
Fx
wx
Ftot
Fx
A
(k) (ft) (k-ft) (%) (k) (k) (psf)
Roof 587 62 36,394 27.6 162.7 0.277 162.7 13.56
6th Floor 639 52 33,228 25.2 148.6 0.233 311.3 12.38
5th Floor 647 42 27,174 20.6 121.5 0.188 432.8 10.13
4th Floor 647 32 20,704 15.7 92.6 0.143 525.4 7.72
3rd Floor 647 22 14,234 10.8 63.6 0.098 589.1 5.30
∑ 3,167 131,734 100.0 589.1 589.1
Table 5A. Vertical Distribution of Seismic Forces (with Base at First Floor) not including Second Floor in Distribution Not used in this design example – for illustrative purposes only
Table 5B. Vertical Distribution of Seismic Forces (with Base at First Floor) including Second Floor in Distribution Not used in this design example – for illustrative purposes only
Level wx hx wxhx
wxhx
∑
wihi
Fx
Fx
wx
Ftot
Fx
A
(k) (ft) (k-ft) (%) (k) (k) (psf)
Roof 587 62 36,394 22.3 240.4 0.409 240.4 20.03
6th Floor 639 52 33,228 20.3 219.5 0.343 459.8 18.29
5th Floor 647 42 27,174 16.6 179.5 0.277 639.3 14.96
4th Floor 647 32 20,704 12.7 136.7 0.211 776.0 11.39
3rd Floor 647 22 14,234 8.7 94.0 0.145 870.0 7.83
2nd Floor 2,632 12 31,584 19.3 208.6 0.079 1,078.6 17.38
∑ 5,799 163,318 100.0 1,078.6 1,078.6
$FRA-593_Five-Over-One_TechDoc_Dec2017.indd 31 12/7/17 11:18 AM
30 | Seismic Design
5b. Assumption of Flexible Diaphragms ASCE 7-10 §12.3.1.1
For structures with wood-framed shear walls, ASCE 7-10 §12.3.1.1 allows wood diaphragms to be idealized as flexible diaphragms when one of the following conditions exist:
1. The structure is a one- or two-family dwelling.
2. Toppings of concrete are nonstructural and are a maximum of 1-1⁄2 inches thick.
3. Each line of vertical elements of the lateral force-resisting system complies with the allowable story drift.
In this design example, the second condition is met since our structure does not exceed 1-1⁄2 inches of lightweight concrete.
Condition 3 is met since §8c of this design example for drift check of typical shear wall complies with the allowable story drift.
5c. Flexible vs. Rigid Diaphragm Analysis ASCE 7-10 §12.3.1 requires that, unless a diaphragm can be idealized as flexible, calculated as flexible or idealized as rigid, it be modeled as semi-rigid. The diaphragms in most wood structures can be idealized as flexible. However, in some cases, engineering judgment must be used to determine shear distributions to the shear walls. With the uniformity of shear wall lengths and spacing in the building’s transverse direction (north-south), flexible diaphragm assumptions are certainly justifiable from a code compliance perspective.
Current industry standard is to consider rigidities of the shear walls in determining the horizontal distribution of lateral forces, either from a rigid diaphragm assumption or an envelope method applying the highest load from a flexible diaphragm assumption and rigid diaphragm assumption to each shear wall. Some engineers designing structures similar to this design example will place shear walls at interior corridor walls (see Figure 3) and not place any lateral-resisting elements at the exterior walls. This approach, as a minimum, must utilize a semi-rigid or rigid diaphragm design. In such configurations careful consideration of the deflections of horizontal diaphragms and the effect of the deflections on building performance is recommended. SDPWS 2015 has added direction that the diaphragm deflection calculations include diaphragm shear and bending deformations and the story drift at the edge of the structure not exceed the ASCE 7 allowable story drift for seismic loads.
Engineers now have sophisticated design software available for designing structures of this type. With all that is available, many engineers still analyze “individual units.” Some engineers perform a rigid diaphragm analysis and a few perform envelope solutions. These varying designs all get permitted by local building officials and there is not a lot of continuity in the design process even within cities. For this design example, an “envelope” design was utilized.
$FRA-593_Five-Over-One_TechDoc_Dec2017.indd 32 12/7/17 11:18 AM

31 | Seismic Design
6. Shear Wall Design Example This design example features a five-story “segmented shear wall” with an out-to-out length of 29.0 feet and floor-to-floor heights of 10.0 feet. SDPWS-2008 §4.3.5.1 categorizes this wall type as having full-height wall segments with aspect ratio limitations of SDPWS-2008 §4.3.4 applying to each full height segment.
CHECK H/W RATIO FOR SHEAR WALL SEGMENTS:
Segment height = 10.0 ft
Segment width = 29.0 ft
h/w = 10.0
= 0.34 < 2.0 ⇒ Okay 29.0
6a. Determination of Lateral Loads to Shear Wall ASCE 7-10 12.3.1.1
The structure used in this design example has interior shear walls located at every other wall between hotel guest units. The walls are spaced at 13 feet o.c., with the depth of the building equal to 65 feet.
Based on an “envelope” design using flexible diaphragm assumptions and a rigid diaphragm analysis, the critical forces to the interior shear wall (Figure 7) are shown in Table 6.
5d. Flexible Upper Portion Redundancy Factor The redundancy factor (ρ) for the flexible upper portion is 1.0. Both conditions of ASCE 7-10 §12.3.4.2 have been met, though designers are only required to meet one of the two provisions.
5e. Seismic Design of Rigid Lower Portion Since the center of mass of the flexible upper structure coincides with the center of mass of the rigid lower portion, the entire structure mass can be joined together and applied at the center of the podium’s rigid diaphragm with the code-required eccentricities.
Whenever the R (and rho) value differs between the upper wood structure and lower podium structure, as would be the case with a light-frame wood shear wall system (R = 6.5) over a special concrete shear wall system (R = 5), then scaling of the seismic reactions at the bottom of the upper structure to apply to the lower structure is required. The seismic forces (e.g., shear and overturning) at the base of the upper portion are applied to the top of the lower portion and scaled up by the ratio of (R/ρ)upper to (R/ρ) lower. The scaling of gravity loads from the upper portion is not done in the same manner when applied to the lower portion. The lower portion, which now includes the seismic forces from the upper portion, may then be analyzed using the values of R, ⎮o, and Cd for the lower portion of the structure.
$FRA-593_Five-Over-One_TechDoc_Dec2017.indd 33 12/7/17 11:18 AM

32 | Seismic Design
Figure 7. Typical Interior Shear Wall Elevation
Table 6. Distribution of Seismic Forces for Both Shear Walls
Level DesignationFTotal
(lb)
Roof F5 12,989
6th Floor F4 24,300
5th Floor F3 32,890
4th Floor F2 38,617
3rd Floor F1 41,480
$FRA-593_Five-Over-One_TechDoc_Dec2017.indd 34 12/7/17 11:18 AM

33 | Seismic Design
6b. Determination of Shear Wall Sheathing and Nailing The shear wall to be designed will use 15⁄32-inch Structural I rated sheathing using 10d common nails with a minimum penetration of 1-1⁄2 inches into the framing members.
A 2x4 sole plate (sill plate) will be used at the base of the shear wall.
SDPWS-2008 §4.3.7.1, item 4c, states that:
3x nominal framing at abutting panel edges is required when the required nominal shear capacity exceeds 700 plf in Seismic Design Category (SDC) D, E or F. If panels do not abut at a sill or sole plate, 2x material is acceptable for shear wall capacities exceeding this threshold.
Table 7. Determination of Shear Wall Nailing
Designation FTotalWall Length
l
ASD Design
V = FTotal (0.7)
l
Wall Sheathed
1 or 2 sides
Allowable Sheara
Fastener Edge
Spacingb
(lb) (ft) (plf) (plf)
F5 12,989 29.0 314 1 340 6
F4 24,300 29.0 587 1 870 2c
F3 32,890 29.0 794 2 1,740 2c
F2 38,617 29.0 932 2 1,740 2c
F1 41,480 29.0 1,001 2 1,740 2c
Notes for Table 7: a. Allowable shear values are obtained by taking the nominal unit shear capacities in NDS-08 SDPWS-2008 Table 4.3A and dividing by the ASD reduction factor of 2.0.
b. A 2x4 sole plate (sill plate) will be used at the base of walls (see Figure 5). For 10d common nails spaced at 2 inches o.c., the nails are staggered. From a constructability standpoint (framer bent over to install nails) and for improved structural performance (larger edge distance), the use of a 3x sole plate is recommended.
c. Where fastener spacing is 2 inches o.c., some engineers may use sheathing on both sides of the wall with fasteners spaced at 4 inches o.c. for better performance and less drift.
6c. Shear Wall Cumulative Overturning Forces When designing overturning forces in multi-level structures, shear and the respective overturning forces due to seismic (or wind) must be carried down to the foundation, or in this design example the podium slab, by the boundary studs and continuous tie-down system. These forces are cumulative over the height of the building, and shear forces applied at the upper levels will generate much larger base overturning moments than if the same shear forces were applied at the lower story.
The overturning forces for the shear wall (Figure 7) can be obtained by summing forces about the base of the wall for the level being designed.
$FRA-593_Five-Over-One_TechDoc_Dec2017.indd 35 12/7/17 11:18 AM
34 | Seismic Design
Cumulative overturning force for the sixth floor level: Mot = F5 (H5)
Cumulative overturning force for the fifth floor level: Mot = F5 (H5 + H4) + F4(H4)
Cumulative overturning force for the fourth floor level: Mot = F5 (H5 + H4 + H3) + F4 (H4 + H3) + F3(H3)
Cumulative overturning force for the third floor level: Mot = F5 (H5 + H4 + H3 + H2) + F4 (H4 + H3 + H2) + F3 (H3 + H2) + F2(H2)
Cumulative overturning force for the second floor level: Mot = F5 (H5 + H4 + H3 + H2 + H1) + F4 (H4 + H3 + H2 + H1) + F3 (H3 + H2 + H1) + F2 (H2 + H1) + F1 (H1)
In shear walls with continuous tie-down systems, the overturning resistance in the shear wall is resisted by the posts and/or end studs resisting the compression forces and the tension rods resisting the tension forces.
In shear walls with conventional holdown systems, the overturning resistance in the shear wall is resisted by the posts and/or end studs resisting the compression forces and the tension forces.
6d. Load Combinations using 2012 IBC IBC §1605.3.2 has alternative basic load combinations to ASCE 7-10. For allowable stress design, the earthquake load combinations are:
D + L + S + E IBC Eq.16-21
1.4
Since S is not present, the simplified load combination is:
D + L + E
1.4
Where E = the horizontal seismic force (F):
0.9D + E IBC Eq.16-22
1.4
6e. Load Combinations using ASCE 7-10 §12.4.2.3
Per §12.4.2.3, the following load combinations shall be used for basic combinations for allowable stress design:
(1.0 + 0.14 SDS)D + 0.7ρQE ASCE 7-10 Eq. 5
(1.0 + 0.10 SDS)D + 0.525ρQE + 0.75L + 0.75 S ASCE 7-10 Eq. 6b
(0.6 - 0.14 SDS)D + 0.7ρQE ASCE 7-10 Eq. 8
Where the dead load D is increased (or decreased) for vertical accelerations by the SDS coefficient.
$FRA-593_Five-Over-One_TechDoc_Dec2017.indd 36 12/7/17 11:18 AM

35 | Seismic Design
Where QE = the horizontal seismic force F ASCE 7-10 §12.4.2.1
0.10 SDS = 0.10 (1.206) = 0.12
0.14 SDS = 0.14 (1.206) = 0.17
6f. Shear Wall Chord (Boundary) Members The vertical members at the end of the shear walls are the walls’ chords (boundary members). As in a diaphragm, the chords resist flexure and the sheathing (web) resists the shear. The overturning moment is resolved into a T-C couple creating axial tension and compression forces. When considering only the horizontal component of the seismic forces, the tension and compression forces are equal and opposite. The overturning compressive force is determined by dividing the overturning moment by the distance “d” between the center of the tension rod and the center of the compression posts (Figure 9). However, in most designs, the size and number of chords (boundary members) change from story to story as shown in Figures 10 and 11, which can necessitate iterations to derive the actual distance “d.” Many engineers will take a “conservative average” distance “d” and use the same value for all cases to minimize iterations.
Figure 9 illustrates multiple boundary members that are common to multi-level wood-frame shear walls.
The axial loads to the bearing wall and boundary members are determined from the following loads:
DEAD LOADS:
WRoof = (28.0 psf)(2.0 ft) = 56.0 plf
WFloor = (30.0 psf)(13.0 ft) = 390 plf
WWall = (10.0 psf)(10.0 ft) = 100.0 plf
LIVE LOADS:
WRoof = (20.0 psf)(2.0 ft) = 40.0 plf WFloor = (40.0 psf)(13.0 ft) = 520 plf
DEAD + LIVE LOADS:
WRoof = (28.0 psf + 20.0 pst)(2.0 ft) = 96.0 plf
WFloor = (30.0 psf + 40.0 psf)(13.0 ft) = 910 plf
WWall = 10.0 psf (10.0 ft) = 100.0 plf
(1.2 + 0.2 SDS) DEAD + LIVE LOADS:
Per §12.4.2.3 of ASCE 7-10, the load factor on L is permitted to be 0.5 since the live load is equal to or less than 100 psf and not of public assembly. The 0.5 factor will be used in the live load determinations below:
WRoof = ((1.4 x 28.0 psf) + (0.5 x 20.0 psf))(2.0 ft) = 98.5 plf
WFloor = ((1.4 x 30.0 psf) + (0.5 x 40.0 psf))(13.0 ft) = 806 plf
WWall = 1.4 x 10.0 psf(10.0 ft)= 140.0 plf
$FRA-593_Five-Over-One_TechDoc_Dec2017.indd 37 12/7/17 11:18 AM
36 | Seismic Design
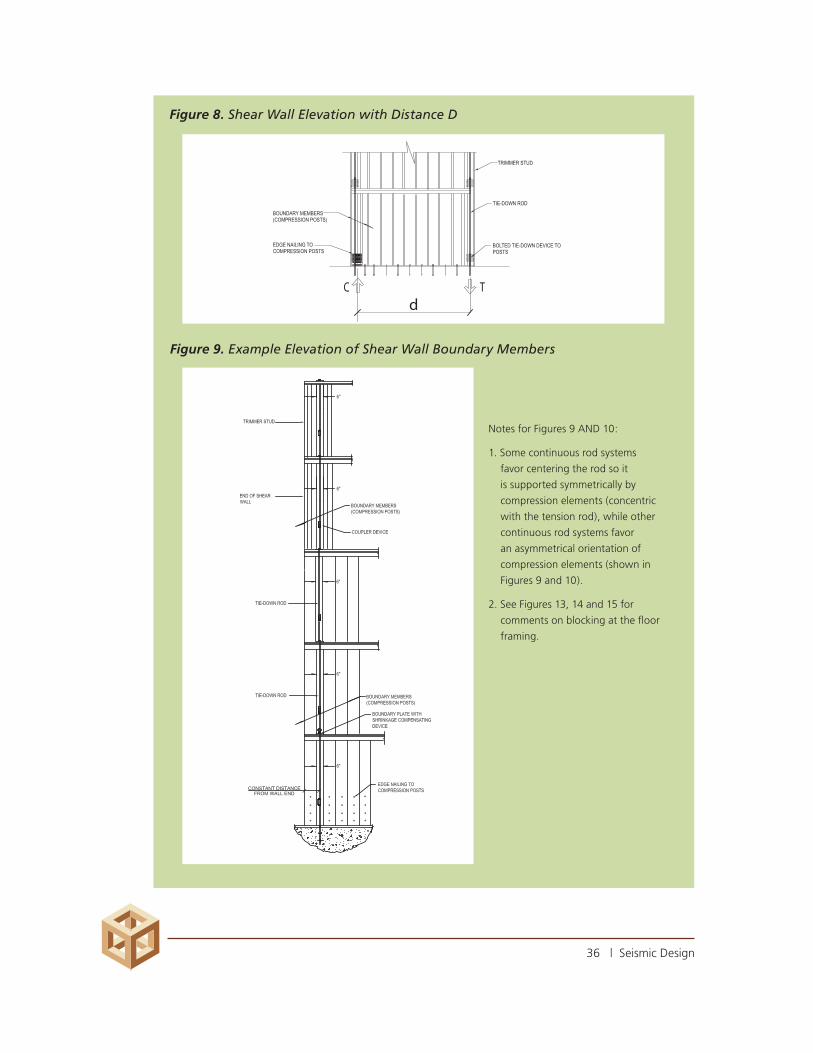
Figure 8. Shear Wall Elevation with Distance D
Figure 9. Example Elevation of Shear Wall Boundary Members
Notes for Figures 9 AND 10:
1. Some continuous rod systems
favor centering the rod so it
is supported symmetrically by
compression elements (concentric
with the tension rod), while other
continuous rod systems favor
an asymmetrical orientation of
compression elements (shown in
Figures 9 and 10).
2. See Figures 13, 14 and 15 for
comments on blocking at the floor
framing.
$FRA-593_Five-Over-One_TechDoc_Dec2017.indd 38 12/7/17 11:18 AM

37 | Seismic Design
Figure 10. Example Plan Section at Boundary Members
For ASD compression on the chord members, the alternate basic load combination is used.
D + L + E IBC Eq. 16-21
1.4
For strength compression on the chord members, the ASCE 7-10 seismic load combination will be used. The strength compression loads are used later in this example to determine the shear wall deflection at strength loads (sill plate crushing). Per ASCE 7-10 §12.8.6 and §12.12.1, strength level forces are required for the determination of shear wall deflections.
(1.2 + 0.2SDS)D + ρQE + L + 0.2S
Where: ρQE = E
Since S is not present, the simplified load combination is: (1.2 + 0.2SDS)D + L + E
Where: ASCE 7-10 §12.4.2.3 (1.2 + 0.2SDS) = (1.2 + 0.2 x 1.206) = 1.4
E = MOT
d
$FRA-593_Five-Over-One_TechDoc_Dec2017.indd 39 12/7/17 11:18 AM

38 | Seismic Design
Table 8. Determination of Shear Wall Chord Member Forces
Level MOTASD PD + L
d’ d
ASD Demand Compression
Strength Demand Compression
C =
MOT + PD+L
1.4d
MOT + (1.2 + 0.2SDS)D + L
d
(ft-k) (k) (ft) (ft) (k) (k)
Roof 129.89 0.380 0.98 27.04 3.81 5.27
6th Floor 372.89 2.36 0.98 27.04 12.21 16.11
5th Floor 701.79 7.00 1.71 26.31 26.05 33.40
4th Floor 1,087.95 10.19 1.71 26.31 39.72 51.07
3rd Floor 1,502.75 13.39 2.04 25.98 54.69 70.54
Where: PD+L = w(d')2
FOR ASD DEMAND (see §6f):
PD+L Roof = (96 plf + 100 plf)(0.98 x 2) = 0.384 k
PD+L 6thFloor = (910 plf + 100 plf)(0.98 x 2) + PRoof = 2.36 k
PD+L 5thFloor = ((910 plf + 100 plf)2 + (96 + 100))(1.58 x 2) = 7.00 k
PD+L 4thFloor = ((910 plf + 100 plf)3 + (96 + 100))(1.58 x 2) = 10.19 k
PD+L 3rdFloor = ((910 plf + 100 plf)4 + (96 + 100))(1.58 x 2) = 13.39 k
FOR STRENGTH DEMAND (see §6f):
(1.2 + 0.02 SDS)D + L = 1.4D + L
PD+L Roof = (98.5 plf + 140 plf)(0.98 x 2) = 0.467 k
PD+L 6thFloor = (806 plf + 140 plf)(0.98 x 2) + PRoof = 2.32 k
PD+L 5thFloor = ((806 plf + 140 plf)2 + (98.5 + 140))(1.58 x 2) = 6.73 k
PD+L 4thFloor = ((806 plf + 140 plf)3 + (98.5 + 140))(1.58 x 2) = 9.72 k
PD+L 3rdFloor = ((806 plf + 140 plf)4 + (98.5 + 140))(1.58 x 2) = 12.71 k
Table 9. Determination of Shear Wall Chord Members
LevelChord Posts
Total Area
le Cf CpBearing
Cap.ASD
DemandStability Capacity
D/C Ratio
(ft) (kips) (kips) (kips)
Roof 4-3x4 35.0 9.625 1.15 0.163 21.88 3.81 15.75 0.24
6th Floor 4-3x4 35.0 9.625 1.15 0.163 21.88 12.21 15.75 0.78
5th Floor 4-4x8 101.5 9.625 1.05 0.182 63.44 26.05 46.48 0.56
4th Floor 4-4x8 101.5 9.625 1.05 0.182 63.44 39.72 46.48 0.85
3rd Floor 5-4x8 126.9 9.625 1.05 0.182 79.30 54.69 58.09 0.94
$FRA-593_Five-Over-One_TechDoc_Dec2017.indd 40 12/7/17 11:18 AM

39 | Seismic Design
Notes for Table 9:
1. Cd = 1.6
2. Bearing capacity (on sole plate) = F’c⊥ ACb
3. Column bearing factor Cb = 1.0
4. Column stability factor Cp =
1 + (FcE/ Fc*)
- [1 + (FcE/ F*c ) ]2
- FcE/ F*c
2c 2c c
5. Column stability capacity = FCCDCFCP A Example for four 4x8 posts: 4x 11.62 = 46.48 kips
6. The typical interior stud wall is framed with 4-inch nominal framing studs.
7. Interior bearing walls for this design example are non-rated and, as such, would not require the reduction in allowable loads.
6g. Example Compression Member Capacity Determination
4X8 POST – DOUGLAS FIR-LARCH NO. 1:
Where:
A = 25.375 in2
CD = 1.6
Emin = 620,000 psi
d1= 3.5 in
The following coefficients for Cm and Ct are not referenced in the NDS formulas (for simplicity).
Cm = 1.0
Ct = 1.0
Ke 1= 1.0
The members’ span between the top of the 2x4 sill plate and the underside of the 4x4 top plate (see Figure 4).
l = 9.52 ft
le1 = 9.52 x 12 =114 in
le1/ d1 = 114/ 3.5 = 32.64
Slenderness is controlled by the minor axis and is thus used in the FcE calculation.
Compression parallel to grain:
F’c=F’cCDCFCP
Fc*=FcCDCF=1,500 x 1.6 x 1.05 = 2,520 psi
Cp = 1 + (FcE/ F*c )
- [1 + (FcE/ F*c ) ]2
– FcE/ F*c
= 0.1817 NDS Eq. 3.7-1 2c 2c c
√
√
$FRA-593_Five-Over-One_TechDoc_Dec2017.indd 41 12/7/17 11:18 AM
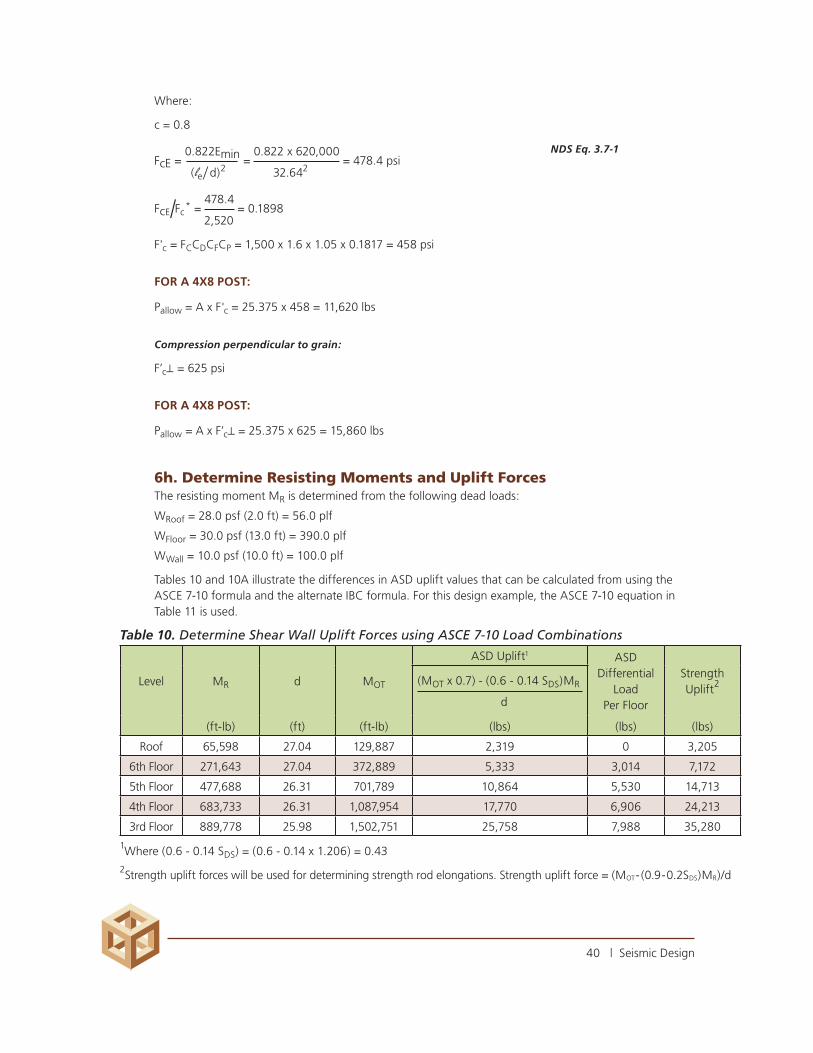
40 | Seismic Design
Where:
c = 0.8
FcE = 0.822Emin
= 0.822 x 620,000
= 478.4 psi NDS Eq. 3.7-1
(le/ d)2 32.642
FcE/Fc* =
478.4 = 0.1898
2,520
F'c = FCCDCFCP = 1,500 x 1.6 x 1.05 x 0.1817 = 458 psi
FOR A 4X8 POST:
Pallow = A x F'c = 25.375 x 458 = 11,620 lbs
Compression perpendicular to grain:
F’c⊥ = 625 psi
FOR A 4X8 POST:
Pallow = A x F’c⊥ = 25.375 x 625 = 15,860 lbs
6h. Determine Resisting Moments and Uplift Forces The resisting moment MR is determined from the following dead loads:
WRoof = 28.0 psf (2.0 ft) = 56.0 plf
WFloor = 30.0 psf (13.0 ft) = 390.0 plf
WWall = 10.0 psf (10.0 ft) = 100.0 plf
Tables 10 and 10A illustrate the differences in ASD uplift values that can be calculated from using the ASCE 7-10 formula and the alternate IBC formula. For this design example, the ASCE 7-10 equation in Table 11 is used.
Table 10. Determine Shear Wall Uplift Forces using ASCE 7-10 Load Combinations
Level MR d MOT
ASD Uplift1 ASD Differential
Load Per Floor
Strength Uplift2(MOT x 0.7) - (0.6 - 0.14 SDS)MR
d
(ft-lb) (ft) (ft-lb) (lbs) (lbs) (lbs)
Roof 65,598 27.04 129,887 2,319 0 3,205
6th Floor 271,643 27.04 372,889 5,333 3,014 7,172
5th Floor 477,688 26.31 701,789 10,864 5,530 14,713
4th Floor 683,733 26.31 1,087,954 17,770 6,906 24,213
3rd Floor 889,778 25.98 1,502,751 25,758 7,988 35,280
1Where (0.6 - 0.14 SDS) = (0.6 - 0.14 x 1.206) = 0.43
2Strength uplift forces will be used for determining strength rod elongations. Strength uplift force = (MOT- (0.9-0.2SDS)MR)/d
$FRA-593_Five-Over-One_TechDoc_Dec2017.indd 42 12/7/17 11:18 AM

41 | Seismic Design
Table 10A. Determine Shear Wall Uplift Forces using IBC Alternate Load Combinations
Level MR d
Strength ASD Uplift
Differential Load
Per Floor MOT ( MOT ) - 0.9 MR
1.4
d
(ft-lb) (ft) (ft-lb) (lbs) (lbs)
Roof 65,598 27.04 129,887 1,248 0
6th Floor 271,643 27.04 372,889 809 -439
5th Floor 477,688 26.31 701,789 2,712 1,903
4th Floor 683,733 26.31 1,087,954 6,147 3,435
3rd Floor 889,778 25.98 1,502,751 10,491 4,343
Note for Table 10A: A “negative” differential load is a result of a higher resisting moment and occurs at a lower level than above.
6i. Shear Wall Tie-Down System Components
TIE-DOWN RODS Smaller diameter tie-down rods are usually made from A36/A307 steel. This is called standard rod strength. Unless marked, rods should be considered standard rod strength. High-strength rods are A449 or A193-B7 and are usually marked on the end with an embossed stamp, though some rod manufacturers stamp the rod grade on the side. If the rod is stamped at the end and is cut, it needs to be re-marked. High-strength rods should have special inspection to confirm the rod type since the ends of these rods may be embedded into a coupler where the marks cannot be seen after installation. It should be noted that high-strength rods are not weldable. Proprietary systems have special rod colors and markings on the sides. The rods and tie-down systems are not proprietary, but the manufactured components are.
TIE-DOWN ELONGATION Tie-down rod elongation is computed between bearing plates (restraints). This design example has bearing plates located at each floor. Table 11 computes the rod capacities and elongations (per floor) between the bearing plates.
$FRA-593_Five-Over-One_TechDoc_Dec2017.indd 43 12/7/17 11:18 AM

42 | Seismic Design
Table 11. Determine Rod Sizes, Capacities and Elongations
LevelPlate
HeightTension Demand
Rod Dia.
d
Eff. Dia. de
Ag Ae Fu Fy
Allow Rod
Capacity Rod Elong.
.75*Fu *Ag/2
(ft) (kips) (in) (in) (in2) (in2) (ksi) (ksi) (kips) (in)
Roof 10.0 2.32 0.625 0.527 0.307 0.226 58 36 6.68 0.042
6th Floor 10.0 5.33 0.625 0.527 0.307 0.226 58 36 6.68 0.098
5th Floor 10.0 10.86 0.625 0.527 0.307 0.226 120 105 13.82 0.199
4th Floor 10.0 17.77 0.875 0.755 0.601 0.462 120 105 27.05 0.159
3rd Floor 10.0 25.76 1.000 0.865 0.785 0.606 120 105 35.33 0.170
Notes for Table 11: 1. Tension demand (ASD uplift) values are computed in Table 10.
2. Rod area: A
g =
3.14d2
4
3. Net tensile area Ae is from AISC Table 7-17. Ae = 0.7854 (db-0.9743/n)2 where n = the number of threads per inch.
4. Standard rod is ASTM A36 rod with minimum Fu = 58 ksi, Fy = 36 ksi. High-strength rod is ASTM A193 rod with minimum Fu = 125 ksi, Fy = 105 ksi for rods up to 2-1⁄2 inches in diameter and A449 rod with minimum Fu = 120 ksi, Fy = 105 ksi for rods up to 1 inch in diameter then drops to Fy = 105 ksi for larger rods. Fy = 81 ksi (per ASTM A449) for rods from 1 to 1-½ inches in diameter and drops to Fu = 90 ksi, Fy = 58 ksi (per ASTM A449) for rods from 1-¾ to 3 inches in diameter.
5. Allowable rod capacity for the AISC Steel Construction Manual Thirteenth Edition is:
0.75FuAb
2
6. Rod elongation: Δ =
PL
AeE
Where:
Δ = the elongation of the rod in inches
P = the accumulated uplift tension force on the rod in kips (tension demand)
L = length of rod in inches from bearing restraint to bearing restraint, with the bearing restraint being where the load is transferred to the rod
E = 29,000 ksi
Ae = the effective area of the rod in square inches When smooth rods are used, the area is equal to the gross area (Ag). When threaded (all-thread) rods are used, the area is equal to the tension area (Ae) of the threaded rod. Since many of the proprietary systems that have smooth rods have long portions threaded at the ends, it is recommended that Ae be used when calculating rod elongation.
$FRA-593_Five-Over-One_TechDoc_Dec2017.indd 44 12/7/17 11:18 AM

43 | Seismic Design
7. Rod elongation is based on using the effective area (Ae) and the following lengths:
a. For the first level, the anchor bolt is projecting 4 inches above the foundation (height of coupler nut to anchor bolt at podium slab). b. For the framed floors, the rod from below is projecting 6 inches above the sole plate.
8. Rod diameters may need to be larger than what is required to meet the tension demands, with rod diameters increased to reduce rod elongations and shear wall deflections. Having a spreadsheet that is linked to the different tables allows the engineer to make rod diameter adjustments quickly without having to redo numerous calculations.
ROD COUPLERS Couplers are used to connect the rods. Couplers can either be straight or reducing and can be supplied in different strengths or grades. Couplers for high-strength rods need to be of high-strength steel and are marked with notches or marks on the coupler. For a rod to develop its full strength, the rod must be a set amount (usually the depth of a standard nut). It is recommended that, when couplers are used, they have “pilot” or “witness” holes in the side so the threads of the rods can be witnessed in the holes to ensure proper embedment.
Reducing couplers are used when the rod size is changed. In reducing couplers, the size of the threading changes at the middle of the coupler device. It is intended that the rods be embedded until they bottom out at the center of the coupler. If the rods are installed in this fashon, “witness” holes will not be necessary; however, it is recommended that couplers with witness holes be used so that proper installation can be confirmed by an inspector. Reducing couplers should have the same notches and identifying marks as straight couplers when used with high-strength rods.
BEARING PLATES Bearing plates transfer the tension load from the structure, the sole plate or the top plates into the rod (see Figure 14). Premanufatured bearing plates are usually identified by paint color or by a number marked on the plate. However, paint colors or unpainted plates vary among different rod system manufacturers. Table 12. Determine Bearing Plate Sizes and Capacities
Level
Bearing PlateBearing Factor
Cb
Bearing Load
(kips)
Allowable Capacity
(kips)
Width
(in)
Length
(in)
Thickness
(in)
Hole Area
(in2)
ABrg
(in2)
Roof 3.0 5.5 0.625 0.5185 15.982 1.07 2.319 10.669
6th Floor 3.0 3.5 0.375 0.5185 9.982 1.11 3.014 6.907
5th Floor 3.0 5.5 0.625 0.5185 15.982 1.07 5.530 10.669
4th Floor 3.0 5.5 0.625 0.8866 15.613 1.07 6.906 10.424
3rd Floor 3.0 5.5 0.625 1.1075 15.392 1.07 7.988 10.276
Notes for Table 12:
1. Bearing plate is based on ASTM A36 steel with Fy = 36 ksi.
2. Bearing area factor for lb < 6 in: Cb =
(lb + 0.375)
lb Bearing area factor for lb ≥ 6 in: Cb = 1.0
$FRA-593_Five-Over-One_TechDoc_Dec2017.indd 45 12/7/17 11:18 AM

44 | Seismic Design
3. Bearing plate thicknesses shall be checked for bending using lengths governed by the area satisfaction check and the associated hole in the plate.
Example bending check of bearing plate at third floor:
Bearing plate size = 3.0 inches x 5.5 inches x 0.6 inches thick
Bearing load = 7,988 lbs (Table 12)
Bearing area for wood: subtracting for 3⁄16-inch oversized hole in wood plate
(16.5 - 1.1075) = 15.392 in2
fc⊥ = 7,988
= 519 psi 15.392
F'c⊥ = Fc⊥Cb = 625 x 1.07 = 669 psi > 519 psi Okay
Steel plate bending check:
( 5.5 )2
(519 x 3.0) x
2 = 5,887 in/lb
2
Zplate = bd
2 =
(3.0 - 0.9375) x 0.62
= 0.1856 in3
4 4
M =
5,887 = 31.7 ksi Okay
Z 0.1856
4. Allowable capacity: F'c⊥ABrgCb
Where: F'c⊥ = 0.669 ksi
5. The bearing area is based upon the sill plate hole diameter being 3⁄16-inch larger than the rod diameter.
6. Bearing load = differential load from Table 10.
BOLTED TIE-DOWN DEVICE ELEMENTS Another type of tie-down device, illustrated in Figure 15, utilizes bolts instead of bearing plates to transfer the overturning forces to the continuous rods. In this system, posts need to transfer tension forces. Although this type of system is still available, most framing contractors prefer the bearing plate devices due to quicker/easier installation in the field.
TAKE-UP DEVICES Most continuous rod systems have methods of compensating for shrinkage with proprietary expanding or contracting devices.
The purpose of these devices is to minimize the clearance created between the holdown, tension tie connector, or plate washer and the anchor bolt/nut due to building settlement or wood shrinkage. They keep rotating the nut down (or use a compression spring) on the rod so the holdown, tension tie or bearing plate remains tight to the wood surface.
$FRA-593_Five-Over-One_TechDoc_Dec2017.indd 46 12/7/17 11:18 AM

45 | Seismic Design
ICC Evaluation Service has acceptance criteria (AC 316) for shrinkage compensating (take-up) devices. The design engineer should check to see that the proprietary devices conform to these criteria.
The use of take-up devices is highly desirable in multi-level wood-frame construction. Since the total shrinkage of the building has to be accounted for in the tie-down displacement (Δa), it is very difficult to meet the code drift requirements for most shear walls without take-up devices, especially for short-length shear walls.
Take-up devices deflect under load just like the conventional holdown. Most manufacturers publish this information either in their brochures or Evaluation Service reports. The deformation or initial slack of these devices needs to be considered in the overall tie-down displacement (Δa).
Take-up devices have moving parts and may jam if not properly installed. Jamming typically occurs as a result of excessive continuous tie rod angle (out-of-plumb). See the manufacturer’s instructions for proper installation.
7. Considerations with Continuous and Discontinuous Anchor Tie-Downs Continuous tie-downs have several advantages over conventional tie-downs—such as ease of installation and higher uplift capacities. Most conventional tie-downs (hold downs) do not offer the capacities needed for multi-level construction, or the shrinkage compensating devices that are available in continuous tie-down systems.
SKIPPING OF FLOORS FOR BEARING RESTRAINTS To reduce costs, some manufacturers “skip” floors with the bearing restraint devices. In this design example, bearing devices may be omitted at the third and fifth floors with restraints at the fourth floor and roof locations. When floors are skipped, the magnitude of tie-down assembly displacement is accumulative between the bearing restraints and hence significantly increases the shear wall deflection(s). Skipping floors is not recommended.
BEARING ZONE THROUGH FRAMING Compression loads to the boundary members (posts) are achieved by nailing the shear wall sheathing to each boundary member, thus transferring the overturning (compression) forces, and are accumulative to the stories below. As the shear wall transfers the overturning (tension) forces to the boundary members, these forces collect at each level (between restraint devices) and transfer the differential loads (see Table 10) to the bearing plates at the level above (see Figure 14). The engineer should consider how the differential uplift forces are transferred from the boundary members to the bearing plate. As a general rule, when the differential uplift forces can be transferred within a bearing area located within a 45 degree plane from the bearing plate, no further investigation is necessary (see Figure 14A). When the transfer of forces requires an area larger than the 45 degree plane, some sort of further investigation is necessary (e.g., bending and shear checks of top plates etc.).
Example bearing check (See Figure 14A):
Differential load at third floor = 7,988 lb (from Table 10)
Bearing plate width = 5.5 in (from Table 12)
Bearing width at bottom of 4x4 top plate = (5.5 + 5.7 + 5.7) = 16.9 in
Net bearing area = (16.9 – 6.0) x 3.5 = 38.1 in2
Bearing stress = 7,988/38.1 = 210 psi < 625 psi Okay
Posts at plate = 7,988/(2 x 3.5 x 7.25) = 157 psi < 625 psi Okay
$FRA-593_Five-Over-One_TechDoc_Dec2017.indd 47 12/7/17 11:18 AM

46 | Seismic Design
8. Shear Wall Deflection, Tie-Downs and Take-Up Devices
8a. Continuous Tie-Down Assembly Displacement The continuous tie-down assembly displacement (Δa) is a collective accumulation of the deformation of tie-down elements. Each of these elements deforms, elongates and/or shrinks.
SDPWS-2008 now has a revised definition of Δa stated as follows:
“Total vertical elongation of wall anchorage system (including fastener slip, device elongation, rod elongation, etc.) at the induced unit shear in the wall.”
The net effect of the tie-down assembly displacement is a rotation of the shear wall, as a rigid body, with the displacement at the top of the wall (Δ) equal to the aspect ratio times the tie-down assembly displacement (Δa).
Figure 11. Effect of Δa on Drift
Notes for Figure 11:
Where: h = floor-to-floor height
b = the out-to-out dimension
of the shear wall
tie-down displacement
ROD ELONGATION Some jurisdictions have limits on the amount of rod elongation that can occur between restraints, and some require that the “allowable stress area” (Ae vs. Ag) be used in rod elongation calculations. As such, local building department requirements should always be checked. This design example uses Ae for rod elongation and Ag or An for rod capacity. Many manufactures will vary the yield strength of the tension rods. It should be noted that the use of a higher strength rod can actually increase the drift of the shear wall, due to increased elongation from higher loads that can be placed on the same size rod diameters and the modulus of elasticity of the steel, which does not change.
For further discussion on rod elongation see §6i.
$FRA-593_Five-Over-One_TechDoc_Dec2017.indd 48 12/7/17 11:18 AM

47 | Seismic Design
SILL PLATE CRUSHING Per NDS-12 §4.2.6, when compression perpendicular to grain fc⊥ is less than 0.73 F’c⊥, crushing will be approximately 0.02 inch. When fc⊥ = F’c⊥, crushing is approximately 0.04 inch. The effect of sill plate crushing is the downward effect at the opposite end of the wall (resulting from the boundary chords) and has the same rotational effect as the tie-down displacement (Δa). Short walls that have no (net) uplift forces will still have a crushing effect at wall boundaries and contribute to rotation of the wall.
The crushing effect on wood is not linear; a graph of load versus deformation is shown in Figure 12. The values of 0.02 inch and 0.04 inch are based upon a metal plate bearing on wood perpendicular to grain under standard test conditions of ASTM D143. These values are limit state values and not adjustable for duration of load (CD).
NDS Commentary §C4.2.6 states that when a joint is made of two wood members and both are loaded perpendicular to grain, the amount of deformation will be approximately 2-½ times that of a metal plate bearing joint. Table 13 lists the deformation adjustment factors for different bearing conditions. Excepting post caps and bases, most connections in wood construction do not have metal plates for bearing. In the case of our shear wall in the design example, the only metal plates in the wall construction are the bearing plates at the continuous tie-down rods. Accordingly, the crushing values of sill plates under boundary posts should be increased by the deformation adjustment factor shown in Table 13.
Table 13. Deformation Adjustment Factor for Bearing Condition
Bearing Condition Deformation Adjustment Factor
1. Wood-to-wood (both perpendicular to grain) 2.5
2. Wood-to-wood (one parallel to grain and one perpendicular to grain)
1.75
3. Metal-to-wood (wood loaded perpendicular to grain) 1.0
For the three different regions of the load versus deformation curve shown in Figure 12, equations for determining compression perpendicular to grain deformation (Δ) may be calculated as follows:
Where: fc⊥ ≤ Fc⊥0.02 in
Δ = 0.02 x (
fc⊥ ) Eq. 1.0 Fc⊥0.02 in
Where: Fc⊥0.02 in < fc⊥ < Fc⊥0.04 in
( fc⊥
) 1- Fc⊥0.04 in
Δ = 0.04 - 0.02 x 0.27 in
Eq. 2.0
Where: fc⊥ > Fc⊥0.04 in
Δ = 0.04 x (
fc⊥ )3
Eq. 3.0 Fc⊥0.04 inWhere:
Δ = deformation, in
fc⊥ = induced stress, psi
Fc⊥0.04 in = Fc⊥ = reference design value at 0.04 in deformation, psi (Fc⊥)
Fc⊥0.02 in = reference design value at 0.02 in deformation, psi (0.73 Fc⊥)
$FRA-593_Five-Over-One_TechDoc_Dec2017.indd 49 12/7/17 11:18 AM

48 | Seismic Design
In the case of our shear wall in the design example (Figure 13, detail B), the boundary posts bear on the sill plate (bearing condition 2), the floor sheathing and the boundary posts bear on the underside of the top plate (bearing condition 2), and the “crushing effect” is coming from two directions at the same time, thus doubling the amount of deformation. In addition, there is the crushing effect of the floor sheathing. For “wood-to-wood” bearing condition 2 (Table 13), the deformation adjustment factor is 1.75. NDS does not have a “crushing value” for the wood structural panel floor sheathing and it is assumed to be higher than for sawn lumber. As a way of accounting for this, a deformation adjustment factor of 2.5 will be used in lieu of the 1.75 factor, producing a compounding effect of 2 x 2.5 = 5.0 times the values computed in Eq. 1.0, Eq. 2.0 or Eq. 3.0.
CRUSHING EFFECTS OF “UPLIFT” BOUNDARY MEMBERS Differential strength uplift forces for the boundary chords transfer the story uplift forces to the metal bearing plate at the floor above (Figures 14 and 14A and §7); however, these differential uplift forces are less than the cumulative strength compression downward forces. Since the crushing effects have already been considered for the higher downward forces, there is no need to consider the lesser crushing effects of the uplift forces.
BUCKLING PERPENDICULAR TO GRAIN POTENTIAL In addition to the wood-to-wood crushing effects described above, when a rim board is placed between the top plate(s) and the floor sheathing and there is a larger compressive load from boundary post(s), there is the potential for buckling of the rim board. This buckling effect can significantly increase the crushing effect and thus significantly increase the total displacement (Δa). In order to eliminate this buckling potential, it is recommended that a doubled rim board or squash blocks (Figure 13, detail A) be added. This design example utilizes modified balloon framing which eliminates this effect (Figure 13, detail B).
Figure 12. Fc⊥ Load Deformation Curve (Eq. 3.0 Derived from Bendtsen-Galligan, 1979)
1.8
1.6
1.4
1.2
1.0
0.8
0.6
0.4
0.2
0
0.00
Load Deformation Curve
Deformation,
Eq.1.0
Eq.2.0
Eq.3.0
0.02 0.04 0.06 0.08 0.10 0.12 0.14 0.16
$FRA-593_Five-Over-One_TechDoc_Dec2017.indd 50 12/7/17 11:18 AM

49 | Seismic Design
Table 14. Determine Sill Plate Crushing
LevelChord Posts
ASD Demand
Strength Demand
Total Area fc⊥ 0.73F’c⊥Crush
Δ
(kips) (kips) (in2) (ksi) (ksi) (in)
Roof 4-3x4 3.81 5.27 35.0 0.151 0.487 0.031
6th Floor 4-3x4 12.21 16.11 35.0 0.460 0.505 0.091
5th Floor 4-4x8 26.05 33.40 101.5 0.329 0.487 0.068
4th Floor 4-4x8 39.72 51.07 101.5 0.503 0.487 0.108
3rd Floor 5-4x8 54.69 70.54 126.9 0.556 0.487 0.137
Where: 1. ASD demand and strength demand values are obtained from Table 8.
Table 15. Determine Bearing Plate Crushing
LevelASD
Bearing LoadStrength
Bearing LoadBearing Plate
Abrgfc⊥ 0.73F’c⊥
Crush Δ
(kips) (kips) (in2) (ksi) (ksi) (in)
Roof 2.319 3.313 15.98 0.207 0.487 0.009
6th Floor 3.014 4.306 9.98 0.431 0.505 0.017
5th Floor 5.530 7.901 15.98 0.494 0.487 0.021
4th Floor 6.906 9.866 15.61 0.632 0.487 0.036
3rd Floor 7.988 11.412 15.39 0.741 0.487 0.054
Where:
1. ASD bearing load values are obtained from the differential loads of Table 10. 2. Strength bearing loads are obtained by dividing ASD bearing loads by the conversion factor of 0.7. 3. Note that the “allowable” Fc⊥ has been exceeded at the fourth floor; however, this design example uses “strength” (LRFD) loads where the bearing resistance is:
F'c⊥ = λφcKFFc⊥Cb = 1.0 x 0.9 (1.875) 625 x 1.11 = 1,300 psi > 741 psi Okay
0.9
Also see ASD bearing plate capacities and bearing factors from Table 12.
$FRA-593_Five-Over-One_TechDoc_Dec2017.indd 51 12/7/17 11:18 AM

50 | Seismic Design
Table 16. Determine Tie-Down Assembly Displacement (with Shrinkage Compensators)
LevelRod
Elong.
Shrinkage (Vertical
Displacement)
Chord Crushing
Bearing Plate
Crushing
Take-Up Deflection Elongation
Total Displacement
Δa
(in) (in) (in) (in) (in) (in)
Roof 0.069 0.03 0.031 0.009 0.030 0.17
6th Floor 0.173 0.03 0.091 0.017 0.030 0.343
5th Floor 0.345 0.03 0.068 0.021 0.030 0.495
4th Floor 0.270 0.03 0.108 0.036 0.030 0.476
3rd Floor 0.285 0.03 0.137 0.054 0.030 0.538
Table 16A. Determine Tie-Down Assembly Displacement (without Shrinkage Compensators)
LevelRod
Elong.
Shrinkage (Vertical
Displacement)
Chord Crushing
Bearing Plate
Crushing
Total Displacement
Δa
Accumulative Displacement
Δa
(in) (in) (in) (in) (in) (in)
Roof 0.069 0.17 0.031 0.009 0.278 2.564
6th Floor 0.173 0.17 0.091 0.017 0.452 2.286
5th Floor 0.345 0.17 0.068 0.021 0.604 1.835
4th Floor 0.270 0.17 0.108 0.036 0.584 1.231
3rd Floor 0.285 0.17 0.137 0.054 0.647 0.647
Notes for Tables 16 and 16A:
Where:
1. Rod elongation is based on strength uplift forces from Table 10 and the rod lengths and Ae from Table 11.
2. Shrinkage values (vertical displacement) are obtained from Table 2; where shrinkage compensating devices are used, a value of 1⁄32 inch is used, recognizing that most devices have to travel a distance before they get to the next “groove” in the device to re-adjust.
3. Chord crushing (crush) values are obtained from Table 14.
4. Bearing plate (crush) values are obtained from Table 15.
5. Take-up deflection elongation in Table 16 is from the manufacturer. Take-up deflection in Table 16A is 0.00 inches because the device has been omitted.
6. Without shrinkage compensators (Table 16A), the tie-down assembly displacements are accumulative from floor-to-floor level.
$FRA-593_Five-Over-One_TechDoc_Dec2017.indd 52 12/7/17 11:18 AM

51 | Seismic Design
8b. Shear Wall Deflection
A considerable amount of monotonic and cyclic testing has been done on wood structural panel shear walls in the last two decades, most notably as part of the CUREE-Caltech Woodframe Project. Test results and testing protocols used in this project can be found in the references listed in the Commentary § C4.3 of the SDPWS-2008.
A well-known expression for shear wall deflection using the four sources of deflection has been found in IBC §2305.3. However, the 2012 IBC now only allows the equation for stapled shear walls; for determining the deflection for a nailed shear wall, the SDPWS-2008 must be used. The equation for calculating shear wall deflection is shown below.
δsw
= 8vh
3
+ vh +
h Δa
(SDPWS-2008 Eq. 4.3-1)
EAb 1,000G
a b
Where:
v = induced unit shear in the wall in pounds per linear foot, plf
h = height from the bottom of the sill plate to the underside of the framing at diaphragm level above (top plates), ft
E = modulus of elasticity of the boundary posts, psi
E = 1,700,000 psi
A = area of the boundary element in square inches (3x4 or 4x8 posts in this design example)
At the roof, the boundary elements consist of four 3x4s
At the floor, the boundary elements consist of four 4x8s
b = the shear wall length in ft
Ga = apparent shear wall stiffness from nail slip and panel deformation (kips/in) from column A, Tables 4.3A, 4.3B, 4.3C or 4.3D. When 4-ply or 5-ply plywood panels or composite panels are used, Ga values may be increased by 1.2.
Δa = total vertical displacement of the anchorage system due to anchorage details (including fastener slip, device elongation, rod elongation etc.) at the induced unit shear in the wall, in.
The above equation is actually a simplified equation from a more complex four-term equation. This four-term equation adds the effects of the four sources contributing to the deflection: the cantilever bending of the boundary members, the shear deformation of the wood structural panels, the bending and slip of the fasteners and the deflection due to the anchorage (tie-down) deformation. The original more complex four-term shear wall deflection formula is shown below.
δsw
= 8vh3
+ vh
+ 0.75hen + h
Δa
(SDPWS-2008 Eq. C4.3.2-1)
EAb GvG
t b
$FRA-593_Five-Over-One_TechDoc_Dec2017.indd 53 12/7/17 11:18 AM
52 | Seismic Design
Where:
GvG
t = shear stiffness (lbs/in) of panel depth Tables C4.2.2A and C4.2.2B
en = nail deformation (fastener slip)
Using the fastener slip equations from SDPWS-2008, Table C4.2.2D for 10d common nails, there are two basic equations.
When the nails are driven into green lumber
en = (Vn/977)1.894
When the nails are driven into dry lumber
en = (Vn/769)3.276
Where:
Vn is the fastener load in pounds per fastener
The simplified expression using three terms (Eq. 4.3-1) combines the second and third terms of the four-term equation into one term. Computed deflections by using either the four-term equation or the three-term equation produce nearly identical results at the critical strength level (1.4 times the allowable shear values for seismic). Thus either equation may be used for computing the deflection of a shear wall.
Although equation 4.3-1 is easier to use, the deflections computed will be slightly larger than the actual since the apparent shear wall stiffness (Ga) listed in Tables 4.3A, 4.3B, 4.3C or 4.3D are based upon the shear in the wall being at its capacity for the given nailing. For more accurate estimates of deflection at load levels less than the unit shear capacity of the shear wall, the four-term equation can be used with the the calculated en values based on the unit shear capacity of interest. Alternatively, the four-term equation can be used with the calculated en values. Both equations need to be adjusted to site conditions (moisture content of lumber, OSB panels vs. plywood panels, number of plies in the panels, etc.).
$FRA-593_Five-Over-One_TechDoc_Dec2017.indd 54 12/7/17 11:18 AM
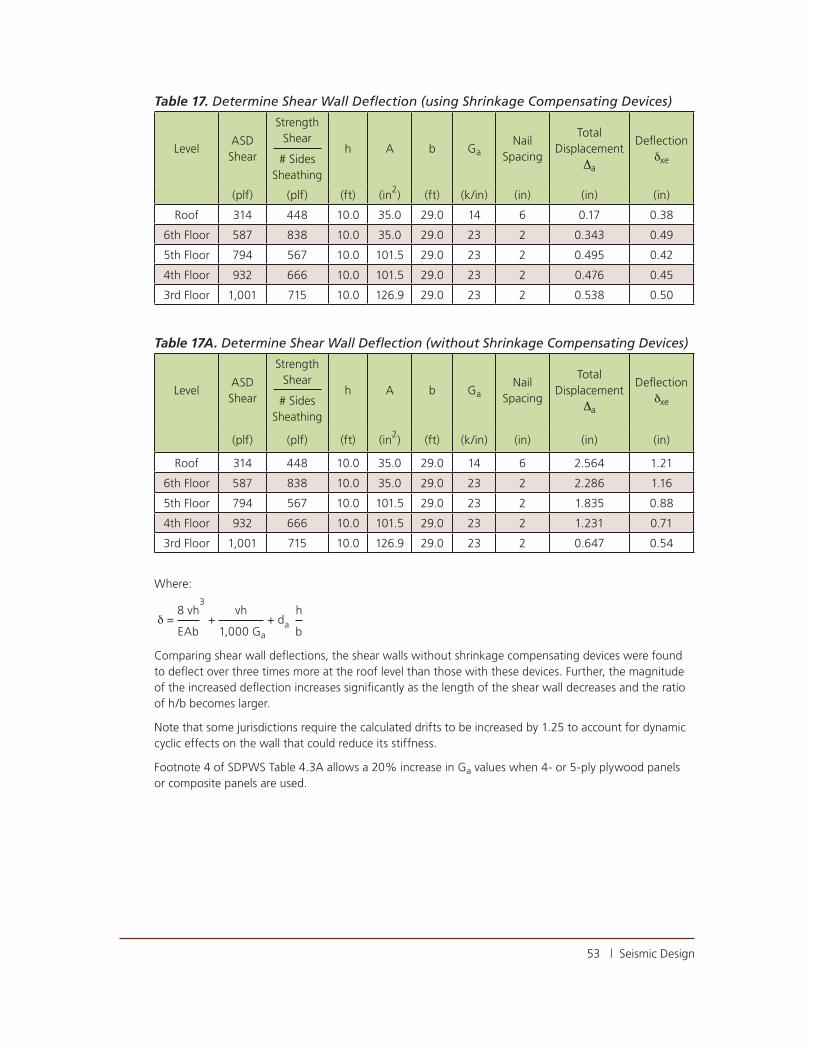
53 | Seismic Design
Table 17. Determine Shear Wall Deflection (using Shrinkage Compensating Devices)
LevelASD Shear
Strength Shear
# Sides Sheathing
h A b GaNail
Spacing
Total Displacement
Δa
Deflection δxe
(plf) (plf) (ft) (in2) (ft) (k/in) (in) (in) (in)
Roof 314 448 10.0 35.0 29.0 14 6 0.17 0.38
6th Floor 587 838 10.0 35.0 29.0 23 2 0.343 0.49
5th Floor 794 567 10.0 101.5 29.0 23 2 0.495 0.42
4th Floor 932 666 10.0 101.5 29.0 23 2 0.476 0.45
3rd Floor 1,001 715 10.0 126.9 29.0 23 2 0.538 0.50
Table 17A. Determine Shear Wall Deflection (without Shrinkage Compensating Devices)
LevelASD Shear
Strength Shear
# Sides Sheathing
h A b GaNail
Spacing
Total Displacement
Δa
Deflection δxe
(plf) (plf) (ft) (in2) (ft) (k/in) (in) (in) (in)
Roof 314 448 10.0 35.0 29.0 14 6 2.564 1.21
6th Floor 587 838 10.0 35.0 29.0 23 2 2.286 1.16
5th Floor 794 567 10.0 101.5 29.0 23 2 1.835 0.88
4th Floor 932 666 10.0 101.5 29.0 23 2 1.231 0.71
3rd Floor 1,001 715 10.0 126.9 29.0 23 2 0.647 0.54
Where:
δ = 8 vh
3 +
vh + da
h
EAb 1,000 Ga b
Comparing shear wall deflections, the shear walls without shrinkage compensating devices were found to deflect over three times more at the roof level than those with these devices. Further, the magnitude of the increased deflection increases significantly as the length of the shear wall decreases and the ratio of h/b becomes larger.
Note that some jurisdictions require the calculated drifts to be increased by 1.25 to account for dynamic cyclic effects on the wall that could reduce its stiffness.
Footnote 4 of SDPWS Table 4.3A allows a 20% increase in Ga values when 4- or 5-ply plywood panels or composite panels are used.
$FRA-593_Five-Over-One_TechDoc_Dec2017.indd 55 12/7/17 11:18 AM
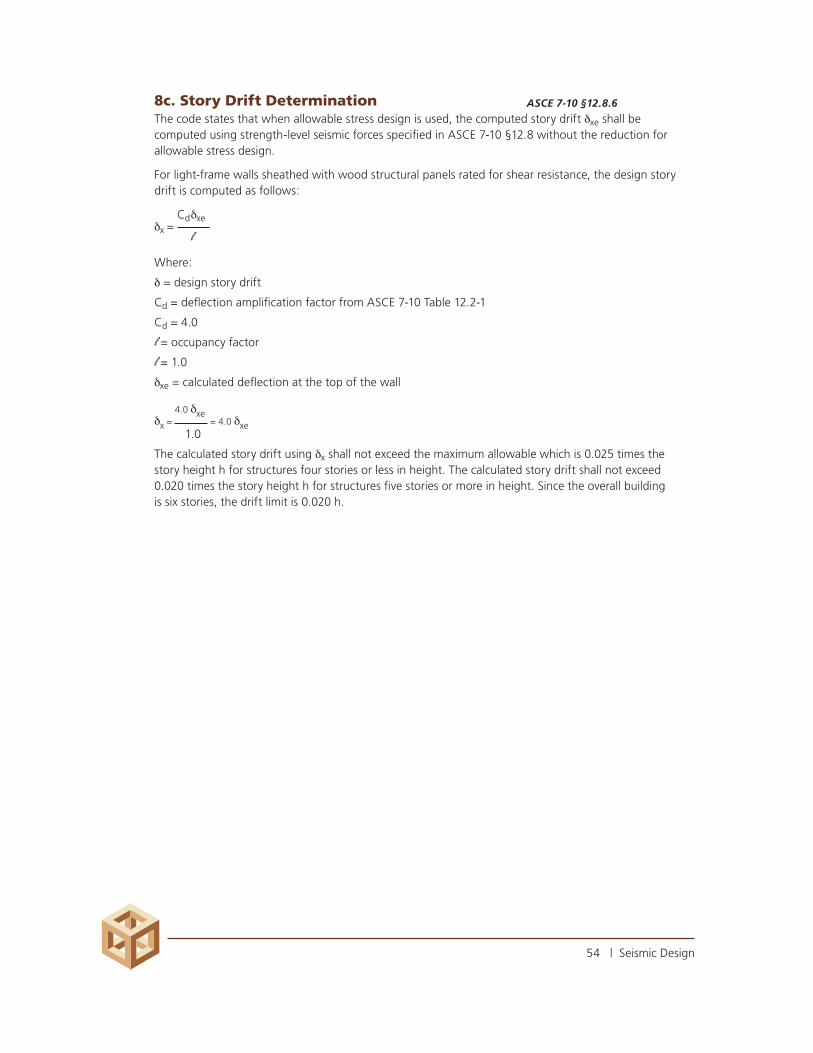
54 | Seismic Design
8c. Story Drift Determination ASCE 7-10 §12.8.6
The code states that when allowable stress design is used, the computed story drift δxe shall be computed using strength-level seismic forces specified in ASCE 7-10 §12.8 without the reduction for allowable stress design.
For light-frame walls sheathed with wood structural panels rated for shear resistance, the design story drift is computed as follows:
δx = Cdδxe
Where:
δ = design story drift
Cd = deflection amplification factor from ASCE 7-10 Table 12.2-1
Cd = 4.0
l = occupancy factor
l = 1.0
δxe = calculated deflection at the top of the wall
δx =
4.0 δxe
= 4.0 δxe 1.0
The calculated story drift using δx shall not exceed the maximum allowable which is 0.025 times the story height h for structures four stories or less in height. The calculated story drift shall not exceed 0.020 times the story height h for structures five stories or more in height. Since the overall building is six stories, the drift limit is 0.020 h.
l
$FRA-593_Five-Over-One_TechDoc_Dec2017.indd 56 12/7/17 11:18 AM

55 | Seismic Design
DETERMINATION OF MAXIMUM DRIFTS ASCE 7-10 Table 12.12-1
Table 18. Determine Shear Wall Drift vs. Allowable Drifts (with Shrinkage Compensators)
LevelDeflection
δxeh
Story Design Drift
4.0δxe
Code Max. Allowable
(in) (ft) (in) (in)
Roof 0.38 10.0 1.52 2.40
6th Floor 0.49 10.0 1.95 2.40
5th Floor 0.42 10.0 1.67 2.40
4th Floor 0.45 10.0 1.82 2.40
3rd Floor 0.50 10.0 1.99 2.40 Table 18A. Determine Shear Wall Drift vs. Allowable Drifts (without Shrinkage Compensators)
LevelDeflection
δxeh
Story Design Drift
4.0δxe
Code Max. Allowable
(in) (ft) (in) (in)
Roof 1.21 10.0 4.83 2.40
6th Floor 1.16 10.0 4.63 2.40
5th Floor 0.88 10.0 3.52 2.40
4th Floor 0.71 10.0 2.86 2.40
3rd Floor 0.54 10.0 2.14 2.40
Notes for Tables 18 and 18A: Shear wall drifts do not include the diaphragm deflections between the shear walls but are considered negligible for this design example.
For the 29-foot-long wall used in this design study, the shear wall with the shrinkage compensating devices meets the drift requirements but the shear wall without the shrinkage compensating devices exceeds the drift requirements at all levels except the third floor.
Story design drifts initially exceeded the code maximum allowable and required increasing the rod diameters (Table 11) to reduce rod elongations and shear wall deflections.
$FRA-593_Five-Over-One_TechDoc_Dec2017.indd 57 12/7/17 11:18 AM

56 | Seismic Design
8d. Load Path for Rod Systems
COMPRESSION MEMBERS When the shear wall end is in compression, the end chord members create a compression bearing path from the posts through blocking at the floor levels and then to the next set of posts below (Figure 13).
TENSION RODS When the shear wall end is in tension, the end chord members lift up and bear in compression on the floor (or roof) above. The bearing plate (load transfer device) resists the individual story overturning by restraining the posts below from uplifting (Figure 14). The bearing plates transfer the uplifting forces from the posts to the tension rod.
Figure 13. Load Transfer from Compression Posts to Compression Posts
Notes for Figure 13:
Detail A (at platform framed) may have a single block with a drilled hole for the tie-down rod
(see Figure 15).
$FRA-593_Five-Over-One_TechDoc_Dec2017.indd 58 12/7/17 11:18 AM

57 | Seismic Design
Figure 14. Load Transfer from Uplifting Posts to Bearing Device
Notes for Figure 14:
Detail A (at platform framed) may have a single block with a drilled hole for the tie-down rod
(see Figure 15).
Figure 14A. Bearing Zone Through Framing from Uplifting Posts to Bearing Device
BEARING PLATE (RESTRAINT)
EDGE NAILING TO COMPRESSION POSTS
BLOCKING AS NECESSARY FOR LOAD PATH
TOP PLATE(OR PLATES)
TIE-DOWNROD
T T
TOP PLATE(OR PLATES)
PLATFORM FRAMEDA BALLOON FRAMEDB
$FRA-593_Five-Over-One_TechDoc_Dec2017.indd 59 12/7/17 11:18 AM

58 | Seismic Design
Figure 15. Load Transfer from Uplifting Posts to Bolted Device
8e. Proprietary Software for Continuous Tie-Down Systems Several continuous tie-down system manufacturers offer design software to aid the design engineer in the proper selection of their products as well as the proper selection of the compression chord members. The use of these software programs can be a big time saver for the engineer.
9. Discontinuous System Considerations and the Overstrength (Ω) Factor
9a. Anchor Forces to Podium Slab For over 20 years, the building codes have had requirements to use amplified seismic forces in the design of elements supporting discontinuous systems. Earlier editions of the codes used the term 3Rw/8, while current codes use the term ⎮o. ASCE 7-10 §12.3.3.3 requires amplification of seismic loads in the design of structural elements supporting discontinuous walls. Previous editions of the IBC and the 1997 Uniform Building Code exempted concrete slabs supporting light-frame construction from these requirements. However, ASCE 7-10 does not have this exception thus adding “slabs” to the list of elements needing the design strength to resist the maximum axial force that can be delivered per the load combinations with the overstrength factor (⎮) in ASCE 7-10 §12.4.3.2.
This means that the shear wall boundary overturning forces (axial uplift and axial compression) need to have the ⎮ factor of 3.0 applied to the supporting slab design. Footnote g of ASCE 7-10 Table 12.2-1 states that, for structures with flexible diaphragms, this value may be 2.5. It should be noted that the overstrength factor does not need to be applied to the shear wall’s connections. ASCE 7-10 §12.3.3.3 states that the connections of the discontinuous wall to the supporting element need only be adequate to resist the forces for which the discontinuous wall was designed. The expanded commentary (3rd printing of ASCE 7-10) of §12.3.3.3 provides further explanation:
$FRA-593_Five-Over-One_TechDoc_Dec2017.indd 60 12/7/17 11:18 AM
59 | Seismic Design
“For wood light-frame shear wall construction, the final sentence of §12.3.3.3 results in the shear and overturning connections at the base of a discontinued shear wall (i.e., shear fasteners and tie-downs) being designed using the load combinations of §2.3 or 2.4 rather than the load combinations with overstrength factor of §12.4.3.”
However, Appendix D of ACI 318, Building Code Requirements for Structural Concrete, does apply a factor similar to an overstrength factor to brittle concrete breakout failure modes if they govern the anchorage design. It is common to have anchorage to the podium slab not fall within the scope of ACI 318 Appendix D because of edge distances or available embedment lengths. Other means of bolt anchorage commonly used include “through bolting” or “sleeves” for post-installed through bolts, embed plates with welded studs, bearing plate washers at the bolt nut, or special steel reinforcing bars used in conjunction with the anchor bolts/bearing plates.
As discussed in ASCE 7-10 §12.4.3.1, one possible route to reduce the calculated overstrength load occurs when it can be shown that yielding of other elements (anchor, shear wall, diaphragm, collector, etc.) will occur below the overstrength-level forces. When this is the case, the seismic load effects including overstrength can be reduced to a lower value. ASCE 7-10’s commentary on §12.4.3 provides further explanation:
“The standard permits the seismic load effects, including overstrength factor, to be taken as less than the amount computed by applying ⎮o to the design seismic forces where it can be determined that yielding of other elements in the structure limits the amount of load that can be delivered to the element and, therefore, the amount of force that can develop in the element.”
$FRA-593_Five-Over-One_TechDoc_Dec2017.indd 61 12/7/17 11:18 AM

60 | Wind vs. Seismic Design with Wind Controlling
Part IV – Wind vs. Seismic Design with Wind Controlling
10. Use of Gypsum Board for Lateral Resistance
Allowable shear values (ASD) for wind and seismic forces for gypsum board shear walls can be found in IBC Table 2306.3(3). The SDPWS includes nominal shear values for wind and seismic in Table 4.3C and must be converted to ASD by dividing by an ASD reduction factor of safety of 2.0 or converted to LRFD by multiplying by a resistance factor of 0.8.
Per code, gypsum board may be used to resist lateral wind forces; however, allowable shear values for wind loads range from 60 to 250 pounds per lineal foot.
Using gypsum board for lateral resistance from seismic forces has limitations. The first is that the shear walls are subject to the limitations of ASCE 7-10 §12.2.1. Section 12.2.1 requires that the lateral force-resisting system be assigned the response modification coefficient R and the height limitations and permitted usages from Table 12.2-1. This table assigns significantly lower R-factors for shear panels with “other materials” than it assigns for walls with wood structural panel sheathing. The “other materials” include gypsum board, plaster and plaster over gypsum lath. These other materials are much less ductile than the wood structural panel shear walls. Table 12.2-1 assigns the response modification coefficient R of 2 for “bearing walls” with other materials and an R of 2.5 for non-bearing “building frame” systems. Both gypsum board and plaster have shown brittle failure in testing. Brittle failure is usually the complete separation of the board or plaster from the framing studs, making the wall unable to resist any lateral loads at all. Comparing the R-factor for wood structural panel sheathing, the values are 6.5 and 7 respectively. This means that, for bearing walls using other materials, the particular wall must be designed for a seismic force that is 225 percent higher than if the same wall had wood structural panel sheathing.
The second limitation is the fact that buildings in SDC D using shear walls with other materials are limited in height to 35 feet. The third is that using shear walls with other materials is not permitted in SDC E or F.
Depending on the SDC and the basic wind speed for a given building, it may be necessary to design the building’s seismic resistance using wood structural panels and then its wind resistance using a combination of the wood structural panels and additional shear walls using gypsum wallboard. For instance, a building in SDC B or C using gypsum wallboard shear walls with an R-factor of 2 would make seismic “control” the design and the higher design force would produce a design that did not have enough wall lengths to use gypsum wallboard, thus necessitating the use of wood structural panels. If the same design first used an R-factor of 6.5, the design seismic forces would only be 30 percent of the forces for using the R-factor of 2. For the shear walls with wood structural panels in the transverse direction in this design example, shear walls may only be required in every fourth party wall (52 feet on center); for wind design, gypsum wallboard shear walls may be required at every party wall (13 feet on center). See Figures 1 and 2.
The following wind design example illustrates a building using gypsum wallboard shear walls throughout except where required on the lower levels. The building is located adjacent to open terrain consisting of grass field and trees less than 30 feet tall; this terrain falls within the Surface Roughness C category in ASCE 7-10 §26.7. Additionally, the building is located in SDC A.
$FRA-593_Five-Over-One_TechDoc_Dec2017.indd 62 12/7/17 11:18 AM

61 | Wind vs. Seismic Design with Wind Controlling
11. Use of Cooler Nails vs. Screws for Gypsum Board Fastening
Traditionally, gypsum wallboard has been fastened by cooler nails which are hand nailed using a hammer. Lately, the trade has evolved to using drywall screws and installing the screws with a drywall screw gun. The wallboard panels are typically hung by first “tacking” them in place with cooler nails, then when all the panels have been hung, installing the remainder of the fasteners with drywall screws using a screw gun. These screw guns are high speed and have sensors that automatically terminate the driving at a specific depth. This allows the contractor to “set and forget,” making screw installation consistent and quick. Some of the screw guns also have auto feed devices, making installation even quicker. Overall this installation method is quicker than the “hand nailed” method. However, from a lateral force-resisting perspective, the allowable (and nominal) values are significantly lower for screw fastened walls as compared with nail fastened walls. The reason for the reduction in allowable shear loads reflected in the tables is that, when the wall deflects under lateral loading, the fastener bends with the wall movement and the threads of the screw tend to “cut” a hole in the drywall material much larger than would be the case with cooler nails. It could be extremely problematic if the design engineer used the values for “nail fastened” walls and the contractors instead used “screws.” The design engineer may not even be aware of what fasteners were used, since the walls are often “taped and mudded” shortly after the fastener installation is complete. For this reason, it is recommended that the design engineer use the values for screw fastened wallboard. It should also be noted that typical gypsum wallboard is attached with “floating” corners and edges (i.e., builders don't attach the gypsum wallboard to the plates, but rather float the corners together with tape and joint compound. These walls do not have the shear capacity for a gypsum wallboard shear wall more like 30-60 plf for ASD.
12. Wind Loading Analysis – Main Wind Force-Resisting System
Design per ASCE 7-10 Code for Enclosed or Partially Enclosed Buildings
DESIGN CHECKLIST:
1. Determine appropriate wind method (Directional Procedure or Envelope Procedure)
2. Determine design coefficients
3. Determine parapet wind pressure
4. Determine leeward wall wind pressure
5. Determine windward wall wind pressure
6. Determine wind pressure on building
$FRA-593_Five-Over-One_TechDoc_Dec2017.indd 63 12/7/17 11:18 AM

62 | Wind vs. Seismic Design with Wind Controlling
MAIN WIND FORCE-RESISTING SYSTEM
This design example uses Part 1 of the Directional Procedure to determine the wind loads for the main wind force-resisting system (MWFRS) per ASCE 7-10 §27.2. This method can be used for structures that are not considered low-rise when the building is regular in shape and has no special wind effects.
12a. Determination of Design Coefficients for Transverse Direction
Wind Exposure C ASCE 7-10 §26.7
Wind Velocity V = 115 mph ASCE 7-10 Figure 26.5-1A
Risk Category II ASCE 7-10 Table 1.5-1
Topographic Factor Kzt = 1.0 ASCE 7-10 §26.8.2
Wind Directionality Factor Kd = 0.85 ASCE 7-10 Table 26.6-1
Gust Effect Factor (Rigid Structures) G = 0.85 ASCE 7-10 §26.9.1
Table 19. Determination of Wind Pressures on Building for the Transverse Direction
Level x
Windward Pressure Leeward Pressure Total
hx Kz qz p-C1 p-C2 hx Kz qz p-C1 p-C2 p
(ft) (psf) (psf) (psf) (ft) (psf) (psf) (psf) (psf)
Parapet 65.0 1.156 33.264 49.896 65.0 1.156 33.264 -33.264 83.16
Roof 62.0 1.144 32.934 28.324 16.467 62.0 1.144 32.934 -1.789 -13.645 30.11
6 52.0 1.103 31.737 27.510 15.653 62.0 1.144 32.934 -1.789 -13.645 29.30
5 42.0 1.054 30.342 26.561 14.704 62.0 1.144 32.934 -1.789 -13.645 28.35
4 32.0 0.996 28.654 25.413 13.556 62.0 1.144 32.934 -1.789 -13.645 27.20
3 22.0 0.920 26.480 23.935 12.078 62.0 1.144 32.934 -1.789 -13.645 25.72
2 12.0 0.849 24.429 22.540 10.683 62.0 1.144 32.934 -1.789 -13.645 24.33
Base 0.0 0.849 24.429 22.540 10.683 62.0 1.144 32.934 -1.789 -13.645 24.33 C1 = Case 1; C2 = Case 2
$FRA-593_Five-Over-One_TechDoc_Dec2017.indd 64 12/7/17 11:18 AM

63 | Wind vs. Seismic Design with Wind Controlling
Where:
PARAPET WIND PRESSURE:
Velocity Pressure Exposure Coefficient Kz = 1.156 ASCE 7-10 §27.3.1, Table 27.3-1, Case 2
Velocity Pressure qz = 0.00256 Kz Kzt Kd V2 ASCE 7-10 Eq. 27.3-1
Combined net pressure coefficients GCpn = +1.50 windward
GCpn = -1.0 leeward
Combined net pressure on parapet ASCE 7-10 Eq. 27.4-4 pp = qpGCpn
LEEWARD WALL WIND PRESSURE:
h = 62.0 ft (mean roof height)
L = 189 ft B = 76 ft L/B = 2.49
Velocity Pressure Exposure Coefficient ASCE 7-10 §27.3.1, Table 27.3-1, Case 2
Kh = 1.144
Velocity Pressure ASCE 7-10 Eq. 27.3-1
q = qh = qi = 0.00256 Kh Kzt Kd V2
qh = 17.99 psf
External Pressure Coefficient
Cp = -0.276 leeward from interpolation ASCE 7-10 Figure 27.4-1
GCpi = -0.18 ASCE 7-10 Table 26.11-1
Design Wind Pressure ASCE 7-10 Eq. 27.4-1 p = qhGCp - qi(GCpi)
Case 1: Internal pressure inward: ASCE 7-10 Table 26.11-1,
p - C1 = -0.977 psf Case 2 per note 3
Case 2: Internal pressure outward: ASCE 7-10 Table 26.11-1,
p - C2 = -7.45 psf Case 2 per note 3
WINDWARD WALL WIND PRESSURE:
Velocity Pressure Exposure Coefficient ASCE 7-10 §27.3.1, Table 27.3-1
Kz = (see Table 19)
Velocity Pressure ASCE 7-10 Eq. 27.3-1
q = qz = 0.00256 Kz Kzt Kd V2
External Pressure Coefficient ASCE 7-10 Figure 27.4-1
Cp = 0.80 windward
Design Wind Pressure ASCE 7-10 Eq. 27.4-1
p = qzGCp - qi(GCpi)
$FRA-593_Five-Over-One_TechDoc_Dec2017.indd 65 12/7/17 11:18 AM
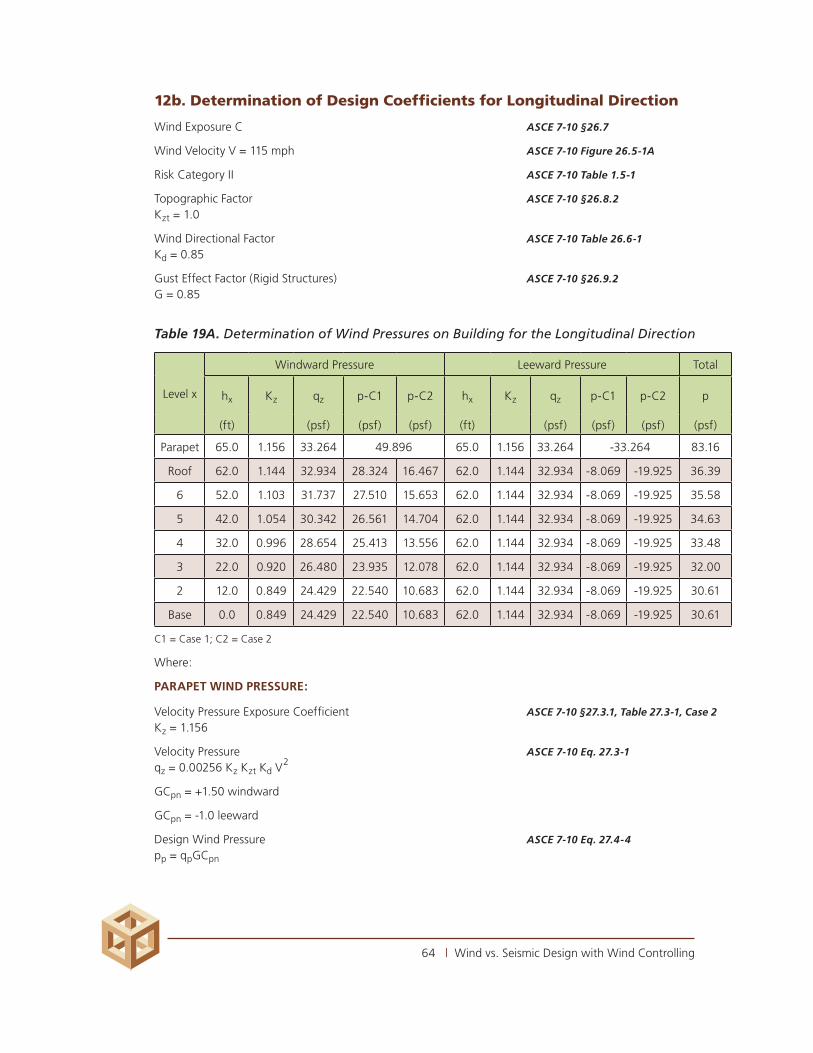
64 | Wind vs. Seismic Design with Wind Controlling
12b. Determination of Design Coefficients for Longitudinal Direction
Wind Exposure C ASCE 7-10 §26.7
Wind Velocity V = 115 mph ASCE 7-10 Figure 26.5-1A
Risk Category II ASCE 7-10 Table 1.5-1
Topographic Factor ASCE 7-10 §26.8.2
Kzt = 1.0
Wind Directional Factor ASCE 7-10 Table 26.6-1
Kd = 0.85
Gust Effect Factor (Rigid Structures) ASCE 7-10 §26.9.2
G = 0.85
Table 19A. Determination of Wind Pressures on Building for the Longitudinal Direction
Level x
Windward Pressure Leeward Pressure Total
hx Kz qz p-C1 p-C2 hx Kz qz p-C1 p-C2 p
(ft) (psf) (psf) (psf) (ft) (psf) (psf) (psf) (psf)
Parapet 65.0 1.156 33.264 49.896 65.0 1.156 33.264 -33.264 83.16
Roof 62.0 1.144 32.934 28.324 16.467 62.0 1.144 32.934 -8.069 -19.925 36.39
6 52.0 1.103 31.737 27.510 15.653 62.0 1.144 32.934 -8.069 -19.925 35.58
5 42.0 1.054 30.342 26.561 14.704 62.0 1.144 32.934 -8.069 -19.925 34.63
4 32.0 0.996 28.654 25.413 13.556 62.0 1.144 32.934 -8.069 -19.925 33.48
3 22.0 0.920 26.480 23.935 12.078 62.0 1.144 32.934 -8.069 -19.925 32.00
2 12.0 0.849 24.429 22.540 10.683 62.0 1.144 32.934 -8.069 -19.925 30.61
Base 0.0 0.849 24.429 22.540 10.683 62.0 1.144 32.934 -8.069 -19.925 30.61
C1 = Case 1; C2 = Case 2
Where:
PARAPET WIND PRESSURE:
Velocity Pressure Exposure Coefficient ASCE 7-10 §27.3.1, Table 27.3-1, Case 2
Kz = 1.156
Velocity Pressure ASCE 7-10 Eq. 27.3-1 qz = 0.00256 Kz Kzt Kd V2
GCpn = +1.50 windward
GCpn = -1.0 leeward
Design Wind Pressure ASCE 7-10 Eq. 27.4-4 pp = qpGCpn
$FRA-593_Five-Over-One_TechDoc_Dec2017.indd 66 12/7/17 11:18 AM
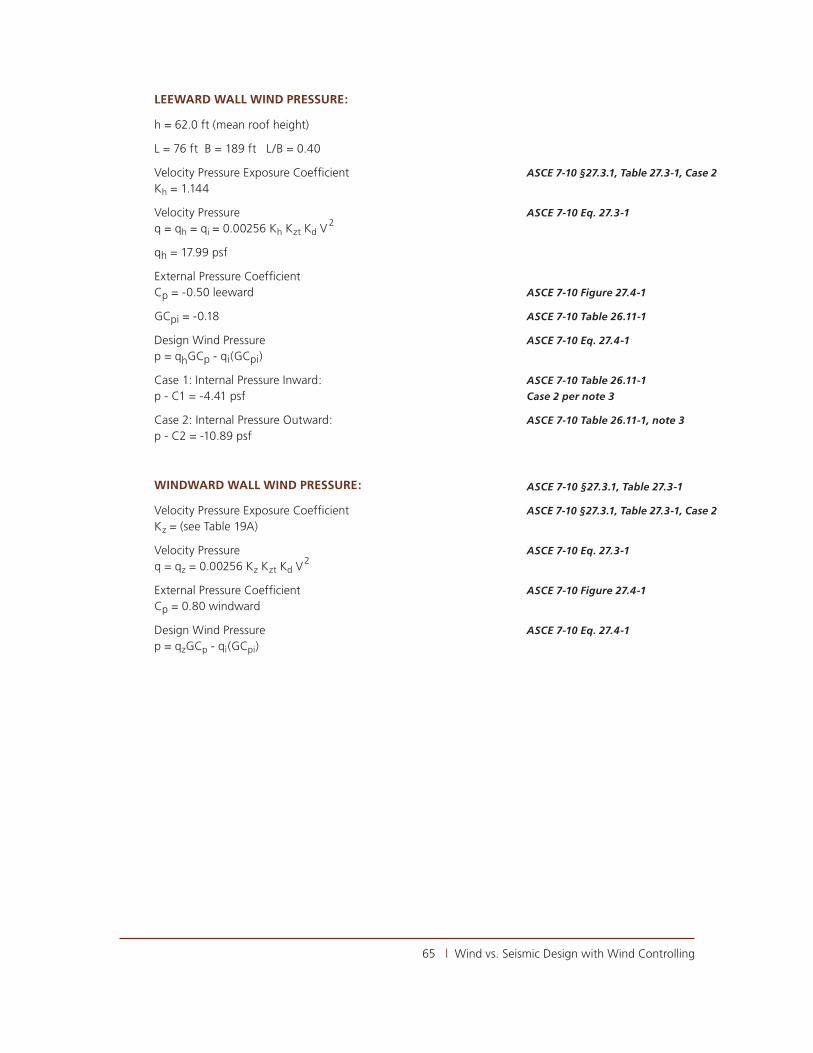
65 | Wind vs. Seismic Design with Wind Controlling
LEEWARD WALL WIND PRESSURE:
h = 62.0 ft (mean roof height)
L = 76 ft B = 189 ft L/B = 0.40
Velocity Pressure Exposure Coefficient ASCE 7-10 §27.3.1, Table 27.3-1, Case 2
Kh = 1.144
Velocity Pressure ASCE 7-10 Eq. 27.3-1
q = qh = qi = 0.00256 Kh Kzt Kd V 2
qh = 17.99 psf
External Pressure Coefficient Cp = -0.50 leeward ASCE 7-10 Figure 27.4-1
GCpi = -0.18 ASCE 7-10 Table 26.11-1
Design Wind Pressure ASCE 7-10 Eq. 27.4-1
p = qhGCp - qi(GCpi)
Case 1: Internal Pressure Inward: ASCE 7-10 Table 26.11-1
p - C1 = -4.41 psf Case 2 per note 3
Case 2: Internal Pressure Outward: ASCE 7-10 Table 26.11-1, note 3
p - C2 = -10.89 psf
WINDWARD WALL WIND PRESSURE: ASCE 7-10 §27.3.1, Table 27.3-1
Velocity Pressure Exposure Coefficient ASCE 7-10 §27.3.1, Table 27.3-1, Case 2
Kz = (see Table 19A)
Velocity Pressure ASCE 7-10 Eq. 27.3-1
q = qz = 0.00256 Kz Kzt Kd V2
External Pressure Coefficient ASCE 7-10 Figure 27.4-1
Cp = 0.80 windward
Design Wind Pressure ASCE 7-10 Eq. 27.4-1
p = qzGCp - qi(GCpi)
$FRA-593_Five-Over-One_TechDoc_Dec2017.indd 67 12/7/17 11:18 AM

66 | Wind vs. Seismic Design with Wind Controlling
13. Seismic Loading Analysis
13a. Design Base Shear
DESIGN CHECKLIST:
1. Determine Risk Category and Importance Factor
2. Determine Ss, S1 and soil profile from site location
3. Determine SDS and SD1
4. Determine SDC
5. Determine Fx
Determine Risk Category and Importance Factor:
Risk Category: II ASCE 7-10 Table 1.5-1
Importance Factor I = 1.0
Determine Ss, S1 and soil profile:
Site Class D (based on geotechnical investigation)
Without a geotechnical investigation, Site Class D needs to be used as the default value.
Values for Ss and S1 can be determined from ASCE 7-10 maps or from the U.S. Geological Survey (USGS) website, which provides the values by either zip code or longitude and latitude coordinates. It is recommended that the longitude and latitude coordinates (which can be obtained from the street address) be used.
USGS website link: http://earthquake.usgs.gov/designmaps/us/application.php
Download the JAVA Ground Motion Parameter Calculator and enter the latitude and longitude.
Note: Using Zip Code Ss is overstated 3 percent
Location: Comstock Park, MI 49321
Therefore from USGS application:
Ss = 0.069 (Site Class B)
S1 = 0.043 (Site Class B)
Fa = 1.6 ASCE 7-10 Table 11.4-1
Fv = 2.4 ASCE 7-10 Table 11.4-2
SMS = FaSS = 1.6(0.069) = 0.1104 ASCE 7-10 Eq. 11.4-1
SM1 = FvS1 = 2.4(0.043) = 0.098 ASCE 7-10 Eq. 11.4-2
SDS
= 2
SMS =
2 (0.1104) = 0.074 ASCE 7-10 Eq. 11.4-3
3 3
SD1
= 2
SM1 =
2 (0.098) = 0.065 ASCE 7-10 Eq. 11.4-4
3 3
$FRA-593_Five-Over-One_TechDoc_Dec2017.indd 68 12/7/17 11:18 AM

67 | Wind vs. Seismic Design with Wind Controlling
Determine SDC:
SDS = 0.074g < 0.167
Therefore, SDC A
SD1 = 0.065g < 0.067
Therefore, SDC A
Fx = 0.01 Wx ASCE 7-10 §11.7, Eq. 1.4-1
For the building as a whole
W = 5,799 k
14. Wind and Seismic Forces to Typical Interior Transverse Wall
Table 20 compares seismic and wind force for the shear walls in the transverse direction. The lateral loads are determined from ASCE 7-10 which sets forth strength design seismic loads and allowable stress design wind loads.
Table 20. Wind and Seismic Forces to Typical Interior Transverse Wall
Level
ASD Seismic ASD Wind
ControlTrib Area4 wx Fx
1 FTotalTrib
Area3 p F FTotal
(ft.2) (k) (lb) (lb) (ft.2) (k) (lb) (lb)
Parapet 39 83.16 3,243 Wind
Roof 3,380 587 1,653 1,653 65 30.11 1,957 5,200 Wind
6th 3,380 639 1,800 3,453 130 29.30 3,809 9,009 Wind
5th 3,380 647 1,822 5,276 130 28.35 3,686 12,695 Wind
4th 3,380 647 1,822 7,098 130 27.20 3,536 16,231 Wind
3rd 3,380 647 1,822 8,920 130 25.72 3,344 19,574 Wind
Notes for Table 20:
1.
Fx = 0.01x ( Trib Area ) x wx
Total Area
Since this design example is located in SDC A, vertical distribution of forces per ASCE 7-10 §12.8.3 is not necessary. Since the vertical distribution of forces is not necessary, the need to use a two-stage design for the seismic lateral analysis is also not necessary.
2. Total area = 12,000 ft2
3. Tributary area for wind in transverse direction is the story height × wall spacing, where the shear walls are spaced at every wall at 13.0 feet on center. Tributary area for the roof level is one-half the story height × wall spacing plus the parapet × wall spacing.
4. Tributary area for seismic in transverse direction is the building depth (65.0 ft) × wall spacing, where the shear walls are spaced at every fourth wall at 52.0 feet on center.
$FRA-593_Five-Over-One_TechDoc_Dec2017.indd 69 12/7/17 11:18 AM

68 | Wind vs. Seismic Design with Wind Controlling
14a. Determination of Shear Wall Fastening
Table 21. Determination of Shear Wall Fastening
Level
ASD Design
FTotal5
Wall
Length
(l )4
Panels
Used6 V=
FTotal
(No sides)
Wall
Sheathed
1 or 2
sides
Allowable
Shear1
Fastener
Edge
Spacing2,3Blocking
(lb) (ft) (plf) (plf) (in)
Roof 3,120 58.0
5⁄8-in Gypsum Board
27 2 70 8⁄12 Unblocked
6th Floor
5,406 58.0
5⁄8-in Gypsum Board
47 2 70 8⁄12 Unblocked
5th Floor
7,617 58.0
5⁄8-in Gypsum Board
66 2 70 8⁄12 Unblocked
4th Floor
9,739 58.0
5⁄8-in Gypsum Board
84 2 90 8⁄12 Blocked
3rd Floor
11,745 58.0
3⁄8-in Wood
Structural Panel
202 1 203 6⁄12 Blocked
Notes for Table 21:
1. Allowable shear values for gypsum board panels are obtained by taking the nominal unit shear capacities in SDPWS-2008 Table 4.3C and dividing by the ASD safety factor of 2.0. Allowable shear values for wood structural panels are obtained by taking the nominal unit shear capacities in SDPWS-08 Table 4.3A Wind vw values and dividing by the ASD safety factor of 2.0.
2. Fasteners for gypsum board are No. 6-1¼-inch long drywall screws (Type W or S). Where the “W” stands for course Wood threads and the “S” stands for fine Steel threads. Both screw types may be used, but the course wood threads are easier to install in wood studs as compared with the fine threads.
Fasteners for wood structural panels are 8d common nails with 1 3⁄8-inch minimum penetration into the framing member.
3. The first number is the fastener spacing at the panel edges and the second number is the fastener spacing along intermediate (field) members.
4. The wall length in the transverse direction has two 29.0-foot-long walls in the same line for a total of 58.0 feet.
5. Values for FTotal are taken as the controlling forces from Table 20 multiplied by ASD conversion factor of 0.6 to obtain ASD loads.
6. 3⁄8-inch wood structural panels are used between the 2nd and 3rd floors because the shear values exceed the values for using drywall screws on the gypsum board. The shear values are within the allowable range for using cooler nails. See discussion on the use of cooler nails vs. screws for gypsum board fastening.
l
$FRA-593_Five-Over-One_TechDoc_Dec2017.indd 70 12/7/17 11:18 AM

69 | Wind vs. Seismic Design with Wind Controlling
14b. Determination of Shear Wall Chord (Boundary) Forces and Members
Table 22. Determination of Shear Wall Chord Member Forces for Typical 29-Foot Party Wall
Level
ASD Demand Compression
0.6 MOT2 ASD
PD+L4 d‘1 d3 C =
MOT +PD+L d
(ft-k) (k) (ft) (ft) (k)
Roof 15.60 0.13 0.33 28.33 0.68
6th Floor 42.63 0.81 0.33 28.33 2.31
5th Floor 80.71 1.48 0.33 28.33 4.33
4th Floor 129.41 3.63 0.56 27.88 8.27
3rd Floor 188.13 4.77 0.56 27.88 11.51
Notes for Table 22:
1. d‘ = distance from wall end to the center of the boundary members (see Figure 10). See Table 23 for size and number of the boundary members.
2. MOT is the shear wall cumulative shear wall force (see §6c). Lateral forces use values from Table 20 multiplied by ASD conversion factor of 0.6 to obtain ASD forces.
3. d is the distance between boundary members (see §6f).
4. PD+L = w(d‘)2
5. Determine service loads on typical interior transverse wall: when d‘ × 2 is less than one half of the stud bay (16-inch stud bay), 8 inches will be used for tributary loads to wall end.
For ASD demand (see §6f):
PD+L Roof = (96 plf + 100 plf)(0.67 x 2) = 0.130k
PD+L 6thFloor = (910 plf + 100 plf)(0.67 x 2) + PRoof = 0.810k
PD+L 5thFloor = ((910 plf + 100 plf)2 + (96 + 100))(0.67 x 2) = 1.48k
PD+L 4thFloor = ((910 plf + 100 plf)3 + (96 + 100))(0.67 x 2) = 3.63k
PD+L 3rdFloor = ((910 plf + 100 plf)4 + (96 + 100))(0.67 x 2) = 4.77k
$FRA-593_Five-Over-One_TechDoc_Dec2017.indd 71 12/7/17 11:18 AM

70 | Wind vs. Seismic Design with Wind Controlling
Table 23. Determination of Shear Wall Chord Members
Level
Chord
Posts
Total
Area le Cf Cp
Bearing
Cap.2ASD
Demand
Stability
Capacity5D/C Ratio
(ft) (kips) (kips) (kips)
Roof 2-3x4 17.5 9.625 1.15 0.1632 10.94 0.68 7.88 0.09
6th Floor
2-3x4 17.5 9.625 1.15 0.1632 10.94 2.31 7.88 0.29
5th Floor
2-3x4 17.5 9.625 1.15 0.1632 10.94 4.33 7.88 0.55
4th Floor
3-4x4 36.8 9.625 1.15 0.1632 22.97 8.27 16.55 0.50
3rd Floor
3-4x4 36.8 9.625 1.15 0.1632 22.97 11.51 16.55 0.70
Notes for Table 23:
1. Cd = 1.6
2. Bearing capacity (on sole plate) = F’c⊥ACb
3. Column bearing factor Cb = 1.0
4. Column stability factor C
p = 1 + (FcE/ F*
c ) - [1 + (FcE/ F*
c ) ]2
- FcE/ F*
c
2c 2c c
5. Column stability capacity = FCCDCFCP A
Example for three 4x4 posts: 3 x 5.394 = 16.55 kips
6. The typical interior stud wall is framed with 4-inch nominal framing studs
√
$FRA-593_Five-Over-One_TechDoc_Dec2017.indd 72 12/7/17 11:18 AM

71 | Wind vs. Seismic Design with Wind Controlling
14c. Determination of Shear Wall Uplift Forces
Table 24. Determination of Shear Wall Uplift Forces using ASCE 7-10 Load Combinations
ASD Wind Uplift
LevelMR d 0.6 MOT
4 0.6MOT – 0.6MR
d
(ft-lb) (ft) (ft-lb) (lb)
Roof 65,598 28.33 15,601 0
6th Floor 271,643 28.33 42,629 0
5th Floor 477,688 28.33 80,714 0
4th Floor 683,733 27.88 129,407 0
3rd Floor 889,778 27.88 188,130 0
Notes for Table 24:
1. Basic load combination used to determine uplift force for wind loading is ASCE 7-10 Eq. 2.4.1.7.
2. Since resisting forces are greater than the overturning forces, there aren’t any uplift forces.
3. Since the building in this design example is located in SDC A, ASCE 7-10 §11.7.1 states that load combinations for seismic forces need only comply with equations in §2.3 or 2.4 and need not comply with equations in §12.4. In other words Eq. 2.4.1.7 is used for ASD and the SDS coefficient need not be subtracted from the 0.6 × MR. If the building were located in SDC B or C, Eq. 12.4.2.3 would need to be used and, even if wind forces controlled, it may be possible to have higher overturning forces from seismic forces because of inclusion of the negative vertical accelerations.
4. MOT is the shear wall cumulative shear wall force (see §6c). Lateral forces use values from Table 20 multiplied by the ASD conversion factor of 0.6 to obtain ASD forces.
$FRA-593_Five-Over-One_TechDoc_Dec2017.indd 73 12/7/17 11:18 AM

72 | Wind vs. Seismic Design with Wind Controlling
15. Wind and Seismic Forces to Typical Interior Corridor Wall
Table 25. Wind and Seismic Forces to Typical Interior Longitudinal Corridor Wall
Level
ASD Seismic ASD Wind
ControlTrib Area4 wx Fx
1 FTotalTrib
Area3 p F FTotal
(ft2) (k) (lb) (lb) (ft2) (lb) (lb) (lb)
Parapet 84 83.16
Roof 6,000 587 2,935 2,935 140 36.39 7,248 7,248 Wind
6th 6,000 639 3,195 6,130 280 35.58 5,977 13,225 Wind
5th 6,000 647 3,235 9,365 280 34.63 5,818 19,043 Wind
4th 6,000 647 3,235 12,600 280 33.48 5,625 24,668 Wind
3rd 6,000 647 3,235 15,835 280 32.00 5,376 30,044 Wind
Notes for Table 25:
1. Fx = 0.01x ( Trib Area ) x wx
Total Area
Since this design example is located in SDC A, vertical distribution of forces per ASCE 7-10 §12.8.3 is not necessary. Since the vertical distribution of forces is not necessary, the need to use a two-stage design for the seismic lateral analysis is also not necessary.
2. Total area = 12,000 ft2
3. Tributary area for wind in transverse direction is the story height × wall spacing, where the tributary width to the corridor walls at the building ends is 16.0 feet. Tributary Area for the Roof Level is one-half the story height × wall spacing plus the parapet × wall spacing. Because of the stepping effect of the units in plan, the two corridor walls resist less than 50 percent of the total wind force in the longitudinal direction.
4. With the corridor walls running down the center of the building, the two corridor walls resist 50 percent of the seismic force in the longitudinal direction.
5. Lateral force, F, uses values from Table 19A for pressure ρ multiplied by the ASD conversion factor of 0.6 to obtain ASD values.
$FRA-593_Five-Over-One_TechDoc_Dec2017.indd 74 12/7/17 11:18 AM

73 | Wind vs. Seismic Design with Wind Controlling
15a. Determination of Shear Wall Fastening
Table 26. Determination of Shear Wall Fastening
Level
ASD Design
FTotal5
Wall
Length
(l )4
Panels
Used5 V =
FTotal
l (No. sides)
Wall Sheathed
1 or 2 sides
Allowable
Shear1
Fastener Edge
Spacing2,3Blocking
(lb) (ft) (plf)
Roof 7,248 194
5⁄8-in Gypsum Board
37 1 70 8⁄12 Unblocked
6th Floor
13,225 194
5⁄8-in Gypsum Board
68 1 70 8⁄12 Unblocked
5th Floor
19,043 194
3⁄8-in Wood
Structural Panel
98 1 203 6 Blocked
4th Floor
24,668 194
3⁄8-in Wood
Structural Panel
127 1 203 6 Blocked
3rd Floor
30,044 194
3⁄8-in Wood
Structural Panel
155 1 203 6 Blocked
Notes for Table 26:
1. Allowable shear values for gypsum board panels are obtained by taking the nominal unit shear capacities in SDPWS-2008 Table 4.3C and dividing by the ASD safety factor of 2.0. Allowable shear values for wood structural panels are obtained by taking the nominal unit shear capacities in SDPWS-2008 Table 4.3A Wind vw values and dividing by the ASD safety factor of 2.0.
2. Fasteners for gypsum board are No. 6-1¼-inch-long drywall screws (Type W or S), where the “W” stands for course Wood threads and the “S” stands for fine Steel threads (metal studs). Both screw types may be used but the course wood threads are easier to install in wood studs as compared with the fine threads.
Fasteners for wood structural panels are 8d common nails with 1 3⁄8-inch minimum penetration into the framing member.
3. The first number is the fastener spacing at the panel edges and the second number is the fastener spacing along intermediate (field) members.
4. Wall length for the corridor walls is the total wall length for the corridor walls on both sides of the corridor, where only the longer walls are considered. The corridor walls are considered as one line of resistance. The gypsum board shear wall at the corridors only uses the corridor side for shear resistance and not the unit side, since there are shower tubs and toilet fixtures on that side.
5. 3⁄8-inch wood structural panels are used between the 2nd and 5th floors because the shear values exceed the values for using drywall screws on the gypsum board. The shear values are within the allowable range for using cooler nails. See discussion on use of cooler nails vs. screws for gypsum board fastening.
$FRA-593_Five-Over-One_TechDoc_Dec2017.indd 75 12/7/17 11:18 AM
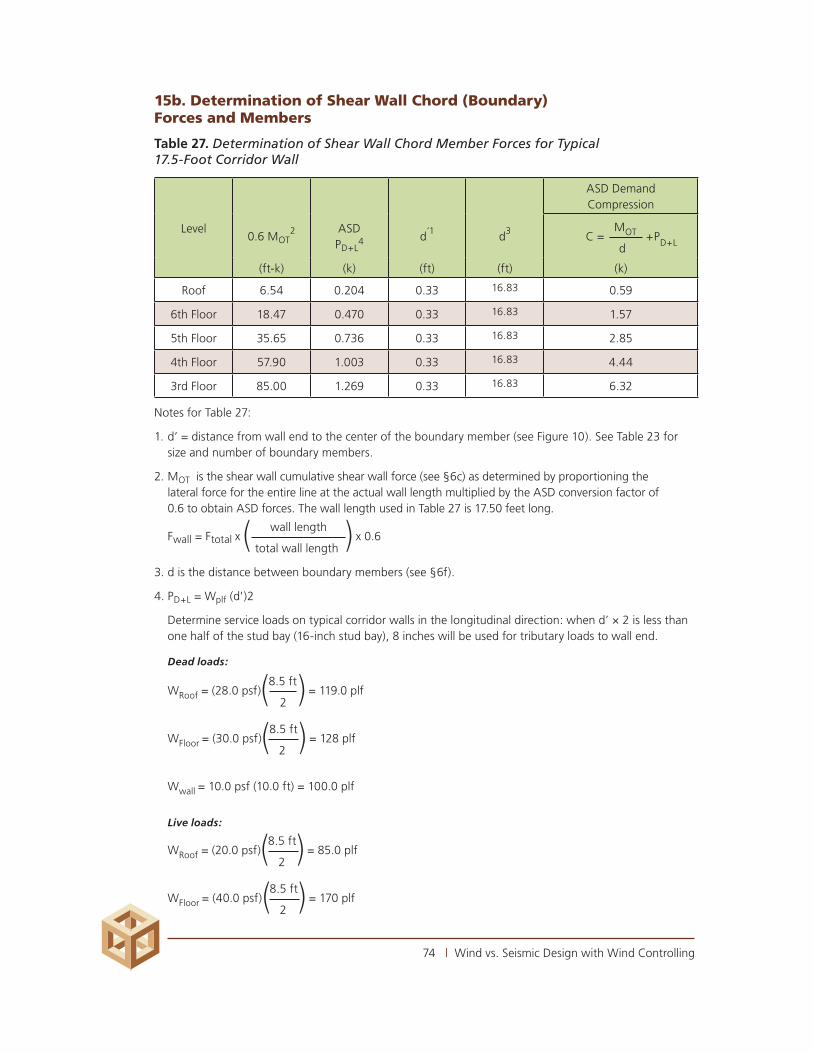
74 | Wind vs. Seismic Design with Wind Controlling
15b. Determination of Shear Wall Chord (Boundary) Forces and Members
Table 27. Determination of Shear Wall Chord Member Forces for Typical 17.5-Foot Corridor Wall
Level
ASD Demand Compression
0.6 MOT2 ASD
PD+L4 d‘1 d3 C =
MOT +PD+L d
(ft-k) (k) (ft) (ft) (k)
Roof 6.54 0.204 0.33 16.83 0.59
6th Floor 18.47 0.470 0.33 16.83 1.57
5th Floor 35.65 0.736 0.33 16.83 2.85
4th Floor 57.90 1.003 0.33 16.83 4.44
3rd Floor 85.00 1.269 0.33 16.83 6.32
Notes for Table 27:
1. d’ = distance from wall end to the center of the boundary member (see Figure 10). See Table 23 for size and number of boundary members.
2. MOT is the shear wall cumulative shear wall force (see §6c) as determined by proportioning the lateral force for the entire line at the actual wall length multiplied by the ASD conversion factor of 0.6 to obtain ASD forces. The wall length used in Table 27 is 17.50 feet long.
Fwall = Ftotal x ( wall length ) x 0.6
total wall length
3. d is the distance between boundary members (see §6f).
4. PD+L = Wplf (d')2
Determine service loads on typical corridor walls in the longitudinal direction: when d’ × 2 is less than one half of the stud bay (16-inch stud bay), 8 inches will be used for tributary loads to wall end.
Dead loads:
WRoof = (28.0 psf)(8.5 ft ) = 119.0 plf
2
WFloor = (30.0 psf)(8.5 ft ) = 128 plf
2
Wwall = 10.0 psf (10.0 ft) = 100.0 plf
Live loads:
WRoof = (20.0 psf)(8.5 ft )
= 85.0 plf
2
WFloor = (40.0 psf)(8.5 ft ) = 170 plf
2
$FRA-593_Five-Over-One_TechDoc_Dec2017.indd 76 12/7/17 11:18 AM

75 | Wind vs. Seismic Design with Wind Controlling
Dead + live loads:
WRoof = (28.0 psf + 20.0 psf)(8.5 ft )
= 204.0 plf
2
WFloor = (30.0 psf + 40.0 psf)(8.5 ft ) = 297.5 plf
2
Wwall = 10.0 psf (10.0 ft) = 100.0 plf
Table 28. Determination of Shear Wall Chord Members
Level
Chord Posts
Total Area
le Cf CpBearing
Cap.ASD
DemandStability Capacity
D/C Ratio
(ft) (kips) (kips) (kips)
Roof 2-3x4 17.5 9.625 1.15 0.1632 10.94 0.59 7.88 0.08
6th Floor 2-3x4 17.5 9.625 1.15 0.1632 10.94 1.57 7.88 0.20
5th Floor 2-3x4 17.5 9.625 1.15 0.1632 10.94 2.85 7.88 0.36
4th Floor 2-3x4 17.5 9.625 1.15 0.1632 10.94 4.44 7.88 0.56
3rd Floor 2-3x4 17.5 9.625 1.15 0.1632 10.94 6.32 7.88 0.80
Notes: See Table 23 for notes
15c. Determination of Shear Wall Uplift Forces
Table 29. Determination of Shear Wall Uplift Forces using ASCE 7-10 Load Combinations
ASD Wind Uplift
LevelMR d 0.6 MOT
4 MOT - 0.6MR
d
(ft-lb) (ft) (ft-lb) (lb)
Roof 46,550 16.83 6,538 0
6th Floor 107,417 16.83 18,468 0
5th Floor 168,284 16.83 35,647 0
4th Floor 229,152 16.83 57,899 0
3rd Floor 290,019 16.83 85,000 0
Notes for Table 29:
1. Basic load combination used to determine uplift force for wind loading is ASCE 7-10 Eq. 2.4.1.7.
2. Since resisting forces are greater than the overturning forces, there aren’t any uplift forces.
3. Since the building in this design example is located in SDC A, ASCE 7-10 §11.7.1 states that load combinations for seismic forces need only comply with equations in §2.3 or 2.4 and need not comply with equations in §12.4. In other words, Eq. 2.4.1.7 is used for ASD and the SDS coefficient need not be subtracted from the 0.6 × MR. If the building were located in SDC B or C, Eq. 12.4.2.3 would need to be used and, even if wind forces controlled, it may be possible to have higher overturning forces from seismic forces because of inclusion of the negative vertical accelerations.
4. MOT is the shear wall cumulative shear wall force (see §6c). Lateral forces use values from Table 25 multiplied by the ASD conversion factor of 0.6 to obtain ASD forces.
$FRA-593_Five-Over-One_TechDoc_Dec2017.indd 77 12/7/17 11:18 AM

References American Wood Council, Design for Code Acceptance: Fire-Rated Wood-Frame and Floor/Ceiling Assemblies, 2008, Washington, DC
American Wood Council, National Design Specification® (NDS®) for Wood Construction, 2012, Washington, DC
APA – The Engineered Wood Association, Design/Construction Guide – Diaphragms and Shear Walls, Report 105, 1997, Tacoma, WA
APA – The Engineered Wood Association, Diaphragms and Shear Walls, 2007, Tacoma, WA
Bendsten, B.A. and W.L. Galligan, 1979, Mean and Tolerance Limit Stresses and Stress Modeling for Compression Perpendicular to Grain in Hardwood and Softwood Species, Research Paper FPL 337, US Department of Agriculture Forest Service, Forest Products Laboratory, Madison, WI
Bendsten, B.A. and W.L. Galligan, Modeling and Stress-Compression Relationships in Wood in Compression Perpendicular to Grain, Vol. 29, No. 2: Pg 42-48, 1979, US Department of Agriculture, Forest Products Research Society (Forest Products Society) Forest Products Journal, Madison, WI
Breyer, Donald E., Kenneth J. Fridley, David G. Pollack, Jr. and Kelly E. Cobeen, Design of Wood Structures ASD/LRFD, 2007, McGraw-Hill Book Co., New York, NY
Building Seismic Safety Council, NEHRP Recommended Provisions for Seismic Regulations for New Buildings and Other Structures (FEMA 450), 2003, Washington, DC
Churchill, J.E., Nonstructural Provisions for Multi-Story Wood-Framed Buildings – 2010 California Building Code (CBC), 2011, Wood Products Council Workshop
Commins, Alfred D., Rod Tie-Down Systems, Part 5-Inspection, Structure Magazine, August 2008, National Council of Structural Engineers Associations (NCSEA)
Faherty, Keith F. and Thomas G. Williamson, Wood Engineering Construction Handbook, 1995, McGraw-Hill, Washington, DC
Forest Products Society, Wood Handbook – Wood as an Engineering Material, 1999, Madison, WI
Ghosh, Avik, Steve Pryor and Ricardo Arevalo, Multi-Story Light-Frame Construction: Understanding Tiedown Systems, Structure Magazine, June 2006, NCSEA
Haygreen, J.G. and Bowyer, J.L., Forest Products and Wood Science – An Introduction, 1989, University of Iowa Press, Ames, IA
International Code Council, International Building Code, 2012, Falls Church, VA
Knight, Brian, High Rise Wood Frame Construction, Structure Magazine, June 2006, NCSEA
Matteri, Dominic, 5-over-1 High-Rise Podium Structures, 2009, Wood Solutions Fair Presentation
Nelson, Ronald F, Design Guidelines for Continuous Tie-Down Systems for Wood Panel Shear Walls in Multi Story Structures, 2011 (Draft)
Nelson, Ronald F. and Patel, Sharad T., Continuous Tie-Down Systems for Wood Panel Shear Walls in Multi Story Structures, Structure Magazine, March 2003, NCSEA
Kerr, Stephen, John P. Kiland, John W. Lawson, Douglas S. Thompson, Structural/Seismic Design Manual, Vol 2, 2006, Structural Engineers Association of California. Sacramento, CA
Schmid, Ben L., Three-Story Wood Apartment Building – 1994 Northridge Earthquake Buildings Case Studies Project, 1996, Seismic Safety Commission, State of California, Sacramento, CA
SEAOC Seismology Committee, Anchor Bolts in Light-Frame Construction at Small Edge Distances, The SEAOC Blue Book: Seismic Design Recommendations, 2009, Structural Engineers Association of California, Sacramento, CA
SEAOC Seismology Committee, Light-Frame Wall Hold-downs, The SEAOC Blue Book: Seismic Design Recommendations, 2008, Structural Engineers Association of California, Sacramento, CA
SEAOC Seismology Committee (2007), Wood Framed Shear Walls with Openings, May 2007, The SEAOC Blue Book: Seismic Design Recommendations, Structural Engineers Association of California, Sacramento, CA
Shiotani, S., D. Hohbach, J. Roberts, Lateral System for Multi-Unit Construction, 2011, Wood Products Council Workshops
Simpson, William T., Equilibrium Moisture Content of Wood in Outdoor Locations in the United States and Worldwide, Res. Note FPL-RN-0268, 1998, Forest Products Laboratory, Madison, WI
Western Wood Products Association (WWPA), Tech Notes Report No. 10-Shrinkage Calculations for Multi-Story Wood Frame Construction, 2002, Portland, OR
WWPA, Dimensional Stability of Western Lumber, 1990, Portland, OR
$FRA-593_Five-Over-One_TechDoc_Dec2017.indd 78 12/7/17 11:18 AM

Acknowledgements The author would like to thank the following individuals, who are both from private practice and the wood industry, for providing the reviews and comments that helped make this publication possible:
Ricardo Arevalo, SE; Kevin Cheung, PhD, PE; Ed Chin, PE; James Churchill, PE;
Michael Cochran, SE; Brad Douglas, PE; Rick Fine, SE; Doug Hohbach, SE;
Michelle Kam-Biron, SE; Phil Line, PE; Emory Montague, SE; Bill Nelson, SE;
Rawn Nelson, SE; Ben Schmid, SE; Tom VanDorpe, SE; and Tom Williamson, PE
Suggestions for Improvement Comments and suggestions for improvement are welcome and should be e-mailed to WoodWorks at [email protected].
INSIDE BACK COVER
$FRA-593_Five-Over-One_TechDoc_Dec2017.indd 79 12/7/17 11:18 AM

78 | Calculations and Discussion
BACK COVER
About WoodWorks Free design and engineering support for wood buildings
WoodWorks provides free resources related to the code-compliant design, engineering and construction of non-residential and multi-family wood buildings. For project assistance, visit woodworks.org or email [email protected].
WoodWorks Design Example WW-005 (Updated), Five-Story Wood-Frame Structure over Podium Slab, © 2017 WoodWorks
$FRA-593_Five-Over-One_TechDoc_Dec2017.indd 80 12/7/17 11:18 AM