five year forecast financial report
TRANSCRIPT

WEST CLERMONT SCHOOL DISTRICT
Five Year Forecast Financial Report
November, 2019
Kelly Sininger, Treasurer/CFO
AMELIA
TIGERS C L O U G H
WI LLOWVI U..E. WARRIOIUi
I Forecasts Analytics ReportWriter Software 2019 ©
COUGARS
WEST CLERMONT
MIRWIN mustangs
K:\Kelly\PFR\Forecast\11-11-19\Dashboard ReportWriter

Table of Contents
Table of Contents
Forecast Summary
Revenue Sources and Forecast Year-Over-Year Projected Overview 1.010 - General Property Tax (Real Estate) 1.020 - Public Utility Personal Property 1.030 - Income Tax 1.035 - Unrestricted Grants-in-Aid 1.040 & 1.045 - Restricted Grants-in-Aid 1.050 - Property Tax Allocation 1.060 - All Other Operating Revenues 2.070 - Total Other Financing Sources
Expenditures Overview 3.010 - Personnel Services 3.020 - Employee Benefits 3.030 - Purchased Services 3.040 - Supplies and Materials 3.050 - Capital Outlay 3.060 - 4.060 - Intergovernmental & Debt 4.300 - Other Objects 5.040 - Total Other Financing Uses
Five Year Forecast
Forecast Purpose/Objectives
Ohio Department of Education's purposes/objectives for the five-year forecast are:
West Clermont Local Schools
2
3
4 5 6 7
8
9 10 11 12
13 14 15 16 17 18 19 20 21
22
1. To engage the local board of education and the community in the long range planning and discussions of financial issues facing the school district.
2. To serve as a basis for determining the school district's ability to sign the certificate required by O.R.C. §5705.412, commonly known as the "412 certificate."
3. To provide a method for the Department of Education and Auditor of State to identify school districts with potential financial problems.
Forecast Methodology - This forecast is prepared based upon historical trends and current factors. This information is then extrapolated into estimates for subsequent years. The forecast variables can change multiple times throughout the fiscal year and while cash flow monitoring helps to identify unexpected variances no process is guaranteed. The intent is to provide the district's financial trend over time and a roadmap for decisions aimed at encouraging financial sustainability and stability.
Forecasts Analytics ReportWriter Software 2019 © K:\Kelly\PFR\Forecast\11-11-19\Dashboard ReportWriter

November, 2019
$120,000,000
$100,000,000
$80,000,000
$60,000,000
$40,000,000
$20,000,000
$0
-$20,000,000
-$40,000,000
Forecast Summary West Clermont Local Schools
Financial Forecast - Revenue, Expenditures, Levies, and Cash Balance
($28,640,690)
2019Actual 2020Proj. 2021Proj . 2022Proj. 2023Proj. 2024Proj.
- Total Revenue - New Levies - Total Expenditures
West Clermont Local Schools
Financial Forecast
Beginning Balance
+ Revenue + Proposed Renew /Replacement Levies + Proposed New Levies - Expenditures
= Revenue Surplus or Deficit
Ending Balance with renewal levies Note: Not Reduced for Encumbrances
Anal sis Without Renewal Levies Included: Revenue Surplus or Deficit w/o Levies Endin Balance w o Levies
Fiscal Year 2020
14,381,780
76,946,152 --
[83,046,485)
(6,100,333)
8,281,447
(6,100,333) 8,281,447
Fiscal Year 2021
8,281,447
77,692,847 --
[85,261,365)
(7,568,518)
712,930
(7,568,518) 712,930
Cash Balance
Fiscal Year 2022
712,930
79,969,399 --
[88,677,2781
(8,707,879)
(7,994,950)
(8,707,879) 7,994,950
Fiscal Year 2023
(7,994,950)
81,452,828 --
[91,315,5671
(9,862,739)
(17,857,689)
(9,862,739) 17,857,689
Fiscal Year 2024
(17,857,689)
83,273,652 --
(94,056,653)
(10,783,001)
(28,640,690)
(10,783,001) 28,640,690
This five-year forecast represents the District's operating budget which is accounted for within the District's General Fund.
In FY 2020 a revenue shortfall is expected. This means that expenditures are expected to be greater than revenue by $6,100,033 in FY 2020. By the last year of the forecast, FY 2024, the district is expected to have a revenue shortfall where expenditures are projected to be greater than revenue by $10,783,001. Without additional revenue, the District will need to cut expenditures in order to balance the budget.
The District's cash balance is positive at year-end in FY 2020 and is projected to worsen by FY 2024. A worsening cash balance can erode the District's financial stability over time.
The Board of Education is currently taking the necessary steps to place an operating levy on the March 2020 ballot.
3
Forecasts Analytics ReportWriter Software 2019 © K:\Kelly\PFR\Forecast\11-11-19\Dashboard ReportWriter
West Clermont Local Schools
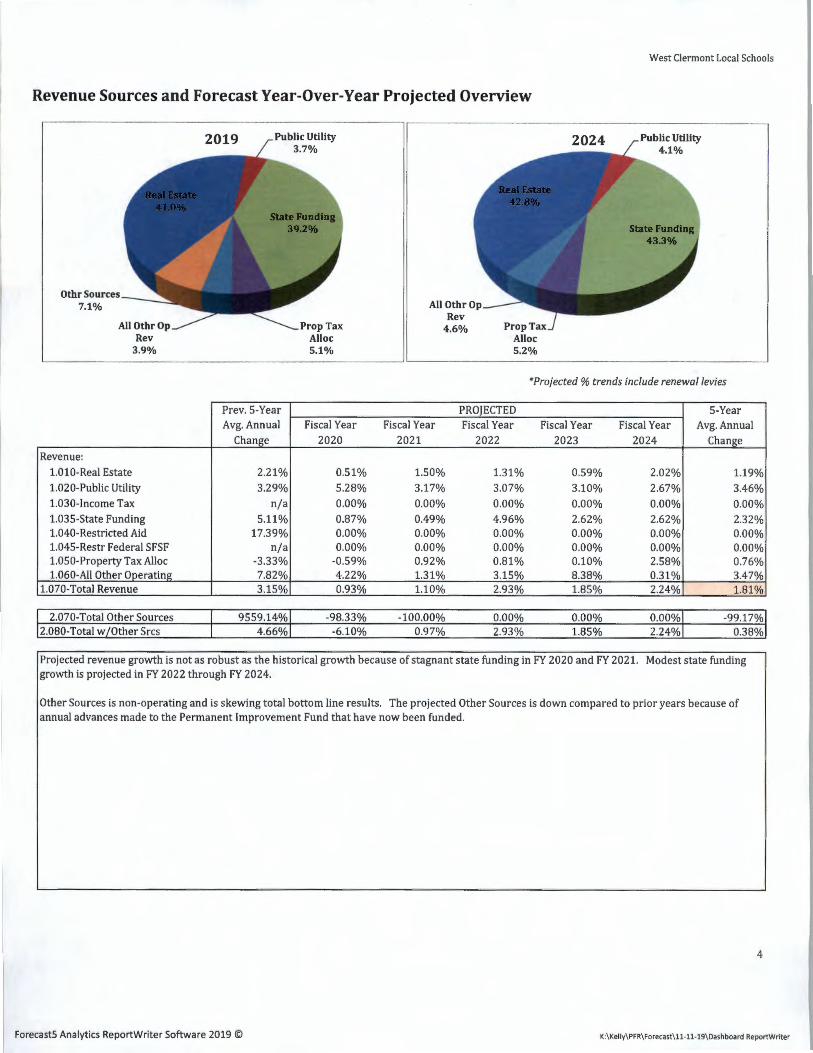
Revenue Sources and Forecast Year-Over-Year Projected Overview
Othr Sources 7.1%
Revenue: 1.010-Real Estate 1.020-Public Utility 1.030-Income Tax 1.035-State Funding 1.040-Restricted Aid 1.045-Restr Federal SFSF LOSO-Property Tax Alloc 1.060-All Other Operating
1.070-Total Revenue
2.070-Total Other Sources 2.080-Total w Other Srcs
5.1%
Prev.5-Year Avg.Annual Fiscal Year
Change 2020
2.21% 0.51% 3.29% 5.28%
n/a 0.00% 5.11% 0.87%
17.39% 0.00% n/a 0.00%
-3.33% -0.59% 7.82% 4.22% 3.15% 0.93%
9559.14% -98.33% 4.66% -6.10%
5.2%
*Projected % trends include renewal levies
PROJECTED 5-Year Fiscal Year Fiscal Year Fiscal Year Fiscal Year Avg.Annual
2021 2022 2023 2024 Change
1.50% 1.31% 0.59% 2.02% 1.19% 3.17% 3.07% 3.10% 2.67% 3.46% 0.00% 0.00% 0.00% 0.00% 0.00% 0.49% 4.96% 2.62% 2.62% 2.32% 0.00% 0.00% 0.00% 0.00% 0.00% 0.00% 0.00% 0.00% 0.00% 0.00% 0.92% 0.81% 0.10% 2.58% 0.76% 1.31% 3.15% 8.38% 0.31% 3.47% 1.10% 2.93% 1.85% 2.24% 1.81%
-100.00% 0.00% 0.00% 0.00% -99.17% 0.97% 2.93% 1.85% 2.24% 0.38%
Projected revenue growth is not as robust as the historical growth because of stagnant state funding in FY 2020 and FY 2021. Modest state funding growth is projected in FY 2022 through FY 2024.
Other Sources is non-operating and is skewing total bottom line results. The projected Other Sources is down compared to prior years because of annual advances made to the Permanent Improvement Fund that have now been funded.
4
Forecasts Analytics ReportWriter Software 2019 © K:\Kelly\PFR\Forecast\11-11-19\Dashboard ReportWriter

West Clermont Local Schools
1.010 - General Property Tax (Real Estate) Revenue collected from taxes levied by a school district by the assessed valuation of real property using effective tax rates for class I (residential/agricultural) and class II (business).
Actual Projected $40,000,000
$35,000,000
$30,000,000
$25,000,000
$20,000,000
$15,000,000
$10,000,000
$5,000,000
$0
■ ■ ■ ■ ■ ■ ■ ■ ■ ■ ■ ■ ■ ■ ■ ■ ■ ■ ■ ■ ■ ■ ■ ■ ■ ■ ■ ■ ■ ■ ■ ■ ■ ■ ■ ■ ■ ■ ··-·----■ ■ ■ ■ ■
2017 2018 2019 2020 2021 2022 2023
FORE CASTED 2019 2020 2021 2022 2023
2024
2024 Total With Renewal Levies 33,585,382 33,756,498 34,264,096 34,714,459 34,917,889 35,624,473 YOY$ Change 242,024 171,116 507,598 450,363 203,430 706,584 YOY% Change 0.7% 0.5% 1.5% 1.3% 0.6% 2.0%
I Percentage of Total Revenue 41.0% 43.9% 44.1% 43.4% 42.9% 42.8%
Values, Tax Rates and Gross Collections Gross Collection Rate Tax Yr Valuation Value Change Class I Rate Change Class II Rate Change Including Delinquencies
---~Q!_!:!__ 1,380_&1-_6~,8_2_0 __ 19,019,500 _ ------------ 26.77 ,. , __________ 10.17:.1 ------------ 29.03_ _ ___________ 10,281 ---- 100.6% ---~Q!9-__ 1,391,046,820 10,400,000 26.81 0.04 29.03 ~ ---- 1,438,021,820 _____ 46,975,000 _ ------------ 26.64 .. :_ , __________ 10,171 ------------ 28.26
____________ 10.011 _________ .?..?.:8% -------____________ 10. 771 -----------------99.8% ________________ _
2021 ____ _!,447,471,820_ ------ 9,450,000 _____________ 26.65 ,. ·----------- 0.00 _____________ 28.21_ ____________ 10.011 -----------------9_9_. 7_% ____ -1
2022 ____ _!,456,621,820 ------ 9,150,000 _ -------------~~.:?..~- ,. , __________ 10.021 28.16 ____________ 10,061 -----------------99. 7% ________________ _ 2023 1,534,096,820 77,475,000 26.33 f0.301 27.31 (0.85) 99.7%
Real estate property tax revenue is projected at 43.9% of the District's total revenue for FY 2020. Property values experienced a triennial update by the county auditor in tax year 2017 resulting in residential (inflationary) growth of 12.6%. Ohio HB 920 causes fixed rate levies to be reduced in response to inflation and in 2017 the residential tax rate declined by 2.93 mills in response to the triennial update. The reduction factor applied to the tax rates (HB 920) is what prevents inflationary growth on the majority of the District's tax levies (rates). However once a school district reaches a 20.0 mill tax rate which is referred to as the minimum or floor then the tax rates cannot be lowered further.
The county will conduct a physical reappraisal of values in 2020 which is currently modeled at 2.9%. Since the District's millage will already be at the floor, the 2020 valuation change above has mimimal impact on the District's tax rates and some inflationary growth of property tax revenue will occur as evidenced by greater YOY growth in FY 2021 and FY 2022 above. If the reappraisal is higher or lower than the 2.9% estimated, then revenue will react accordingly.
The 2018 values increased mostly due to new construction. In 2018 there was $6,960,050 (0.7%) residential and $6,503,950 (1.9%) business class new construction. New construction is projected to provide between $206,000 and $238,000 in annual revenue growth in addition to the revenue growth from property valuation inflation.
5
Forecasts Analytics ReportWriter Software 2019 © K:\Kelly\PFR\Forecast\11-11-19\Dashboard ReportWriter

West Clermont Local Schools
1.020 - Public· Utility Personal Property Revenue generated from public utility personal property valuations multiplied by the district's full voted tax rate.
$4,000,000
$3,500,000
$3,000,000
$2,500,000
$2,000,000
$1,500,000
$1,000,000
$500,000
$0 2017
Total With Renewal Levies YOY$ Change YOY% Change
I Percentage of Total Revenue
Actual
• • • • • • • • • • • • • • • • • • • • • • . . -• .. 2018 2019 2020 2021
Projected
• • • • • • • • • • • • 2022 2023
■ 2017 ■ 2018 ■ 2019 ■ 2020 ■ 2021 ■ 2022 ■ 2023 ■ 2024
FORECASTED 2019 2020 2021 2022 2023 2,862,869 3,014,113 3,109,737 3,205,210 3,304,683
134,213 151,244 95,624 95,473 99,473 4.9% 5.3% 3.2% 3.1% 3.1%
3.5% 3.9% 4.0% 4.0% 4.1%
Values and Tax Rates Gross Collection Rate Tax Year Valuation Value Change Full Voted Rate Change Including Delinquencies
_____ 2018 -- _____ 59,012,320 _ _______ 4,351,940_ 50.12 ___________(0.12) _ ________________ 100.0% -----------------------------------------2019 -- _____ 61,012,320 _ _______ 2,000,000 _
I •-------- 50,16 - 0.04 -------------- 100.0% -----------------------------------2020 ---- 63,012,320 _ - 2,00Q,_Q9_Q_ 49.99 ___________(0.17) _________________ 100.0% ------------------------------ ---------------------
-----2021 -- ---- 65,012,320 _ _______ 2,000,000_ I •-------- 50,00 _ 0.00 -------------- 100.0°/o ----------------------------------
2022 ---- 67,012,320 _ _______ 2,000,000_ 49.98 ___________( 0. 0 2) _________________ 100.0% ------------------------------ ---------------------2023 69,012,320 2,000,000 49.68 [0.30) 100.0%
2024
2024 3,392,889
88,206
2.7%
4.1%
Public Utility Personal Property revenue is projected to grow in line with historical trends. The category is projected at 3.9% of District total revenue for SFY 2020 and is mostly comprised of infrastructure maintained by utility companies. The tax is collected at the full voted tax rate.
*Projected % trends include renewal levies
6
Forecasts Analytics ReportWriter Software 2019 © K:\Kelly\PFR\Forecast\11-11-19\Dashboard ReportWriter

West Clermont Local Schools
1.030 - Income Tax- Not Applicable to West Clermont Revenue collected from income tax earmarked specifically to support schools with a voter approved tax by residents of the school district; separate from federal, state and municipal income taxes.
$1
$1
$1
$1
$1
$1
$0
$0
$0
$0 ~
$0 2015
Total YOY$ Change YOY% Change
I Percentage of Total Revenue
Actual
~
2016
~
2017 2018
■ Projected Revenue
2019 -
-0.0%
0.0%
The District does not have an income tax.
2019
2020 --
0.0%
0.0%
Projected
2020 2021 2022 2023 2024
■ Renewal Levy Revenue
FORE CASTED 2021 2022 2023 2024
- - - -- - - -
0.0% 0.0% 0.0% 0.0%
0.0% 0.0% 0.0% 0.0%
*Projected % trends include renewal levies
7
Forecasts Analytics ReportWriter Software 2019 © K:\Kelly\PFR\Forecast\11-11-19\Dashboard ReportWriter
West Clermont Local Schools
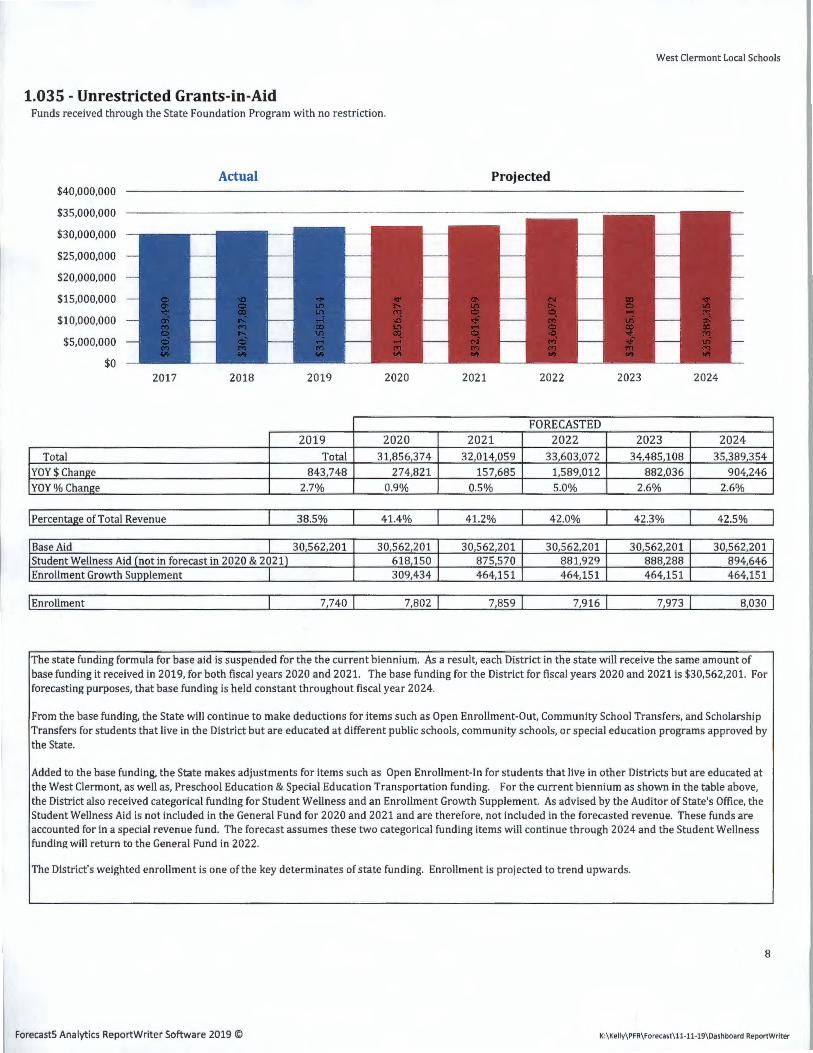
1.035 - Unrestricted Grants-in-Aid Funds received through the State Foundation Program with no restriction.
Actual Projected $40,000,000
$35,000,000
$30,000,000
$25,000,000
$20,000,000
$15,000,000
$10,000,000
$5,000,000
$0
■ ■ ■ ■ ■ ■ ■ ■ ■ ■ ■ ■
■ ■ ■ ■ ■ ■ ■ ■ ■ ■ ■ ■ ■ ■ ■ ■ ■ ■ ■ ■ ■ ■ ■ ■ ■ ■ ■ ■ ■ ■
2017 2018 2019 2020 2021 2022 2023 2024
FORECASTED 2019 2020 2021 2022 2023 2024
Total Total 31,856,374 32,014,059 33,603,072 34,485,108 35,389,354
YOY$ Change 843,748 274,821 157,685 1,589,012 882,036 904,246 YOY% Change 2.7% 0.9% 0.5% 5.0% 2.6% 2.6%
I Percentage of Total Revenue 38.5% 41.4% 41.2% 42.0% 42.3% 42.5%
Base Aid I 30,562,201 30,562,201 30,562,201 30,562,201 30,562,201 30,562,201 Student Wellness Aid (not in forecast in 2020 & 2021) 618,150 875,570 881,929 888,288 894,646 Enrollment Growth Supplement I 309,434 464,151 464,151 464,151 464,151
I Enrollment 1,140 1 7,802 1,ss9 1 1,916 1 7,973 s,o3o 1
The state funding formula for base aid is suspended for the the current biennium. As a result, each District in the state will receive the same amount of base funding it received in 2019, for both fiscal years 2020 and 2021. The base funding for the District for fiscal years 2020 and 2021 is $30,562,201. For forecasting purposes, that base funding is held constant throughout fiscal year 2024.
From the base funding, the State will continue to make deductions for items such as Open Enrollment-Out, Community School Transfers, and Scholarship Transfers for students that live in the District but are educated at different public schools, community schools, or special education programs approved by the State.
Added to the base funding, the State makes adjustments for items such as Open Enrollment-In for students that live in other Districts but are educated at the West Clermont, as well as, Preschool Education & Special Education Transportation funding. For the current biennium as shown in the table above, the District also received categorical funding for Student Wellness and an Enrollment Growth Supplement. As advised by the Auditor of State's Office, the Student Wellness Aid is not included in the General Fund for 2020 and 2021 and are therefore, not included in the forecasted revenue. These funds are accounted for in a special revenue fund. The forecast assumes these two categorical funding items will continue through 2024 and the Student Wellness funding will return to the General Fund in 2022.
The District's weighted enrollment is one of the key determinates of state funding. Enrollment is projected to trend upwards.
8
Forecasts Analytics ReportWriter Software 2019 © K:\Kelly\PFR\Forecast\11-11-19\Dashboard ReportWriter

West Clermont Local Schools
1.040 ,& 1.045 - Restricted Grants-in-Aid Funds received through the State Foundation Program or other allocations that are restricted for specific purposes.
$800,000
$700,000
$600,000
$500,000
$400,000
$300,000
$200,000
$100,000
$0 2017
Total YOY$ Change YOY% Change
I Percentage of Total Revenue
Actual
■ ■ ■
■ ■ ■ ■ ■ ■ ■ • -- ■ 2018 2019
2019 677,728 324,852
92.1%
0.8%
2020
2020 677,728
0 0.0%
0.9%
Projected
■ ■ ■ ■ ■ ■ ■ ■ ■ ■ ■ ■ ■ ■ ■ ■ ■ ■ ■ ■ ■ ■ ■ ■
2021 2022 2023 2024
FORECASTED 2021 2022 2023 2024
677,728 677,728 677,728 677,728
- - - -0.0% 0.0% 0.0% 0.0%
0.9% 0.8% 0.8% 0.8%
Restricted is less than 1.0% of total funding and is a small amount of state funding that must be classified as "restricted" for accounting and tracking purposes.
9
Forecasts Analytics ReportWriter Software 2019 © K:\Kelly\PFR\Forecast\11-11-19\Dashboard ReportWriter
West Clermont Local Schools
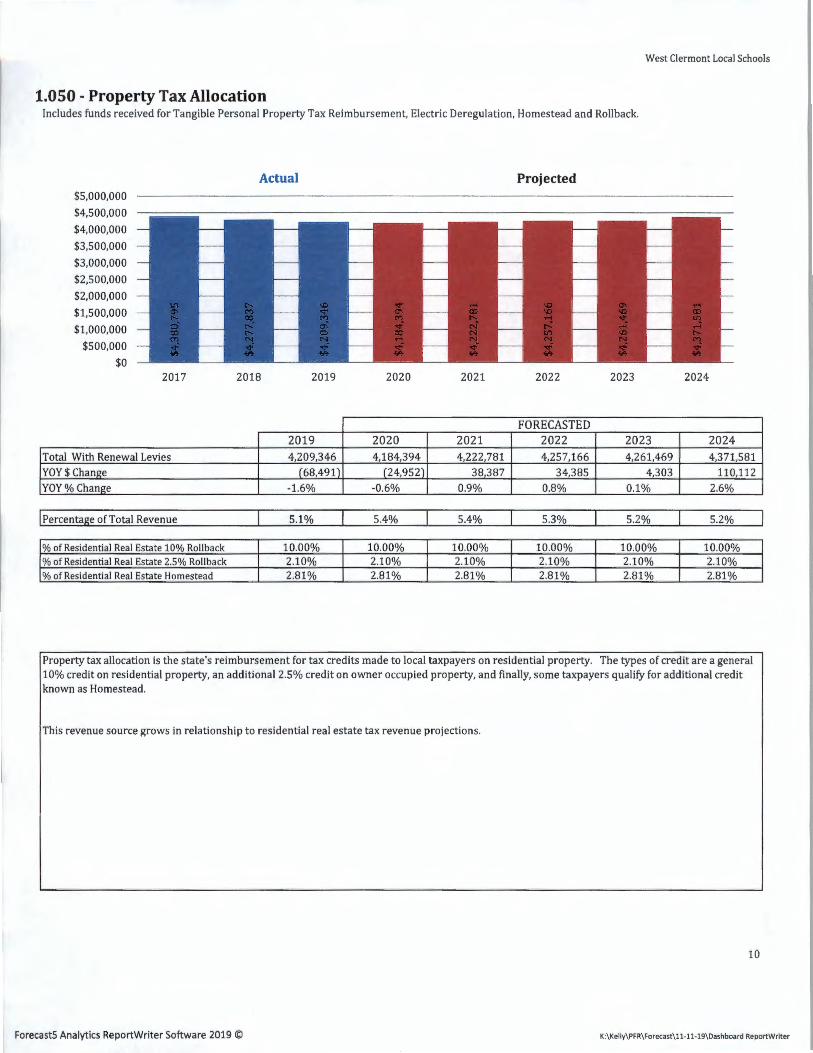
1.050 - Property Tax Allocation Includes funds received for Tangible Personal Property Tax Reimbursement, Electric Deregulation, Homestead and Rollback.
Actual Projected $5,000,000
$4,500,000
$4,000,000
$3,500,000
$3,000,000
$2,500,000
$2,000,000
$1,500,000
$1,000,000
$500,000
$0
----------------
----------------
----------------
--------2017 2018 2019 2020 2021 2022 2023 2024
FORECASTED 2019 2020 2021 2022 2023 2024
Total With Renewal Levies 4,209,346 4,184,394 4,222,781 4,257,166 4,261,469 4,371,581 YOY$ Change (68,491) (24,952) 38,387 34,385 4,303 110,112 YOY% Change -1.6% -0.6% 0.9% 0.8% 0.1% 2.6%
I Percentage of Total Revenue 5.1% 5.4% 5.4% 5.3% 5.2% 5.2%
% of Residential Real Estate 10% Rollback 10.00% 10.00% 10.00% 10.00% 10.00% 10.00% % of Residential Real Estate 2.5% Rollback 2.10% 2.10% 2.10% 2.10% 2.10% 2.10% % of Residential Real Estate Homestead 2.81% 2.81% 2.81% 2.81% 2.81% 2.81%
Property tax allocation is the state's reimbursement for tax credits made to local taxpayers on residential property. The types of credit are a general 10% credit on residential property, an additional 2.5% credit on owner occupied property, and finally, some taxpayers qualify for additional credit known as Homestead.
This revenue source grows in relationship to residential real estate tax revenue projections.
10
I Forecasts Analytics ReportWriter Software 2019 © K:\Kelly\PFR\Forecast\11-11-19\Dashboard ReportWriter
West Clermont Local Schools
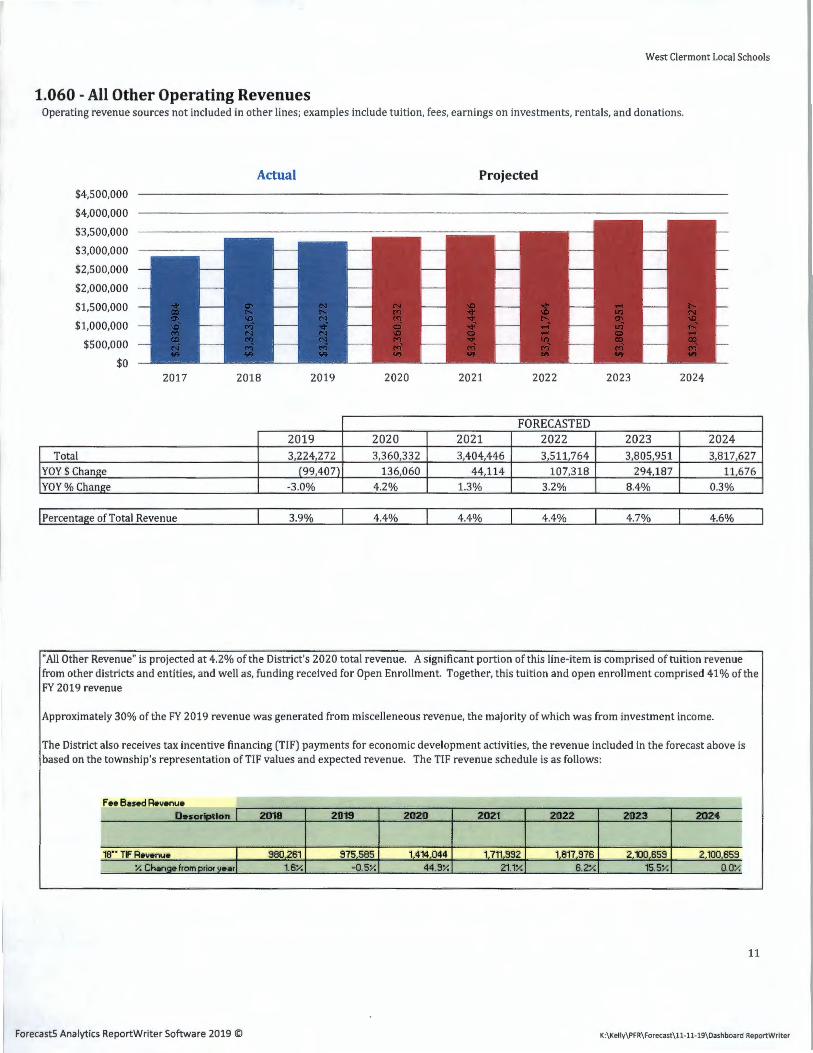
1.060 - All Other Operating Revenues Operating revenue sources not included in other lines; examples include tuition, fees, earnings on investments, rentals, and donations.
$4,500,000
$4,000,000
$3,500,000
$3,000,000
$2,500,000
$2,000,000
$1,500,000
$1,000,000
$500,000
$0 2017
• • • • •
Actual
2018
• • • • • • 2019
2019
Projected
• • • • • • • • • • • • • • • • • • • • • • • • • • • • • • • • 2020 2021 2022 2023 2024
FORE CASTED 2020 2021 2022 2023 2024
Total 3,224,272 3,360,332 3,404,446 3,511,764 3,805,951 3,817,627 YOY$ Change [99,407) 136,060 44,114 107,318 294,187 11,676 YOY% Change -3.0% 4.2% 1.3% 3.2% 8.4% 0.3%
I Percentage of Total Revenue 3.9% 4.4% 4.4% 4.4% 4.7% 4.6%
"All Other Revenue" is projected at 4.2% of the District's 2020 total revenue. A significant portion of this line-item is comprised of tuition revenue from other districts and entities, and well as, funding received for Open Enrollment. Together, this tuition and open enrollment comprised 41 % of the FY 2019 revenue
Approximately 30% of the FY 2019 revenue was generated from miscelleneous revenue, the majority of which was from investment income.
The District also receives tax incentive financing (TIF) payments for economic development activities, the revenue included in the forecast above is based on the township's representation ofTIF values and expected revenue. The TIF revenue schedule is as follows:
F • • B~s•d R•v•nu• 7 D•sorlotlon I 2018 2019 2020 2021 2022 2023 2024 I
I I
18°0
TIF R• v•nu• I 980,261 975,585 1,414,044 1,711,992 1,817,976 2,100,659 2,100,659 X Ch~ a• from prior 1i1•ar l 1.6X -0.SX 44.9¾ 21.,x 6.2X 15.SX a.ox
11
Forecasts Analytics ReportWriter Software 2019 © K:\Kelly\PFR\Forecast\11-11-19\Dashboard ReportWriter

West Clermont Local Schools
2.070 - Total Other Financing Sources Includes proceeds from sale of notes, state emergency loans and advancements, operating transfers-in, and all other financing sources like sale and loss of assets, and refund of prior year expenditures.
Actual Projected $7,000,000
$6,000,000
$5,000,000
$4,000,000
$3,000,000
$2,000,000
$1,000,000 0 0 0 0 ~ ~ ~ ~
$0 2017 2018 2019 2020 2021 2022 2023 2024
FORE CASTED 2019 2020 2021 2022 2023 2024
Total 5,803,445 96,713 - - - -YOY$ Change 758,009 (5,706,732) (96,713) - - -YOY% Change 15.0% -98.3% -100.0% 0.0% 0.0% 0.0%
I Percentage of Total Revenue 7.1% 0.1% 0.0% 0.0% 0.0% 0.0%
Transfers In Advances In 5,797,920 96,713
The General Fund made advances to the Permanent Improvement Fund of $4,988,069 and to State and Federal Grant Funds of $809,851 in FY 2018 that was returned in FY 2019. At the end of FY 2019, the General Fund made an advance of $96,713 to State and Federal Grant funds. These grants revenues are received on a reimbursement basis and therefore, once the revenue was received it was returned to the General Fund in August 2019 (SFY 2020).
12
I Forecasts Analytics ReportWriter Software 2019 © K:\Kelly\PFR\Forecast\11-11-19\Dashboard ReportWriter

West Clermont Local Schools
Expenditure Categories and Forecast Year-Over-Year Projected Overview
OthrUses 6.6% Othr Objects ___ _
1.0%
Expenditures: 3.010-Salaries 3.020-Benefits 3.030-Purchased Services 3.040-Supplies & Materials 3.050-Capital Outlay 3.060-lntergov 4.010-4.060-Debt 4.300-Other Objects 4.500-Total Expenditures
5.040-Total Other Uses 5.050-Total w Other Uses
2019
Prev.5-Year Avg.Annual
Change
4.43% 3.25% 5.44%
13.74% 574.20%
n/a n/a
-1.25% 4.72%
630.94% 6.22%
Fiscal Year 2020
5.55% 6.54% 5.11%
37.45% -5.00%
n/a n/a
4.02% 5.84%
-92.39% -0.62%
Othr Uses 0.5%
Fiscal Year 2021
2.50% 6.27% 1.04% 3.76%
-12.72% n/a n/a
3.98% 2.67%
2.00% 2.67%
PROJECTED Fiscal Year
2022
3.34% 6.30% 3.70% 3.77% 0.00%
n/a n/a
3.98% 4.02%
2.00% 4.01%
2024
Fiscal Year 2023
2.50% 5.17% 2.18% 3.77% 0.00%
n/a n/a
3.98% 2.98%
2.00% 2.98%
Fiscal Year 2024
2.50% 5.22% 2.19% 3.78% 0.00%
n/a n/a
3.98% 3.01%
2.00% 3.00%
5-Year Avg.Annual
Change
3.28% 5.90% 2.84%
10.51% -3.54%
n/a n/a
3.99% 3.70%
-16.88% 2.41%
The District's operational expenditures grew 4.72% annually on average in the five year period preceding FY 2020. The forecast projects average annual growth of operational expenditures at 3. 70%.
13
I Forecasts Analytics ReportWriter Software 2019 © K:\Kelly\PFR\Forecast\11-11-19\Dashboard ReportWriter

West Clermont Local Schools
3.010 - Personnel Services Employee salaries and wages, including extended time, severance pay, supplemental contracts, etc.
Actual Projected $50,000,000
$45,000,000
$40,000,000
$35,000,000
$30,000,000
$25,000,000
$20,000,000
$15,000,000
$10,000,000
$5,000,000
$0
- -- - -- - -- - -- - -- - -- - -- - -- - -- - -- - -- - -- - -- - -- - -
--------2017 2018 2019 2020 2021 2022 2023 2024
FORECASTED 2019 2020 2021 2022 2023 2024
Total 38,193,893 40,315,459 41,323,345 42,703,906 43,771,504 44,865,792 YOY$ Change 1,900,374 2,121,566 1,007,886 1,380,561 1,067,598 1,094,288 YOY% Change 5.2% 5.6% 2.5% 3.3% 2.5% 2.5%
I Percentage of Total Budget 45.7% 48.5% 48.5% 48.2% 47.9% 47.7%
90% of the District's salaries are accounted for within the General Fund. Within the General Fund (this forecast), salaries are projected to represent 48.5% of the FY 2020 budget.
Salaries increased 4.43% on average per year in the prior five year period preceding FY 2020. The forecast reflects an average annual increase of 3.28% for fiscal years 2020 through 2024. The 2020 salaries are based upon current negotiated agreements. The 2022 amount also reflects the return of salaries to the General Fund that are being funded by Student Wellness funding in fiscal years 2020 and 2021, which is accounted for in a special revenue fund. This is also discussed in the Unrestricted Grants-in-Aid note.
14
Forecasts Analytics ReportWriter Software 2019 © K:\Kelly\PFR\Forecast\11-11-19\Dashboard ReportWriter

West Clermont Local Schools
3.020 - Employees' Benefits Retirement for all employees, Workers Compensation, early retirement incentives, Medicare, unemployment, pickup on pickup, and all health-related insurances. '
$25,000,000
$20,000,000
$15,000,000
$10,000,000
$5,000,000
$0 2017
Actual Projected
I I I I I I I I I I I I I I I I I I I
2018 2019 2020 2021 2022 2023
FORE CASTED 2019 2020 2021 2022 2023
2024
2024 Total 15,345,012 16,348,182 17,373,821 18,467,613 19,421,681 20,435,112
YOY$ Change 1,518,287 1,003,170 1,025,639 1,093,792 954,068 1,013,431 YOY% Change 11.0% 6.5% 6.3% 6.3% 5.2% 5.2%
I Percentage of Total Budget 18.4% 19.7% 20.4% 20.8% 21.3% 21.7%
90% of the District's fringe benefits are accounted for within the General Fund. Within the General Fund, fringe benefits are projected to comprise 19.7% of the FY 2020 budget.
Health insurance for fiscal years 2020 and 2021 reflect increases of 9.25% and 9.00%, respectively based upon rates that are effective January 1, 2020. The FY 2021 level of health insurance is projected to increase about 7.0% per year in FY 2022 through FY 2024.
Other benefits such as retirement, workers compensation and medicare are salary-driven and reflect increases that are consistent with salaries as shown in the forecast.
15
Forecasts Analytics ReportWriter Software 2019 © K:\Kelly\PFR\Forecast\11-11-19\Dashboard ReportWriter
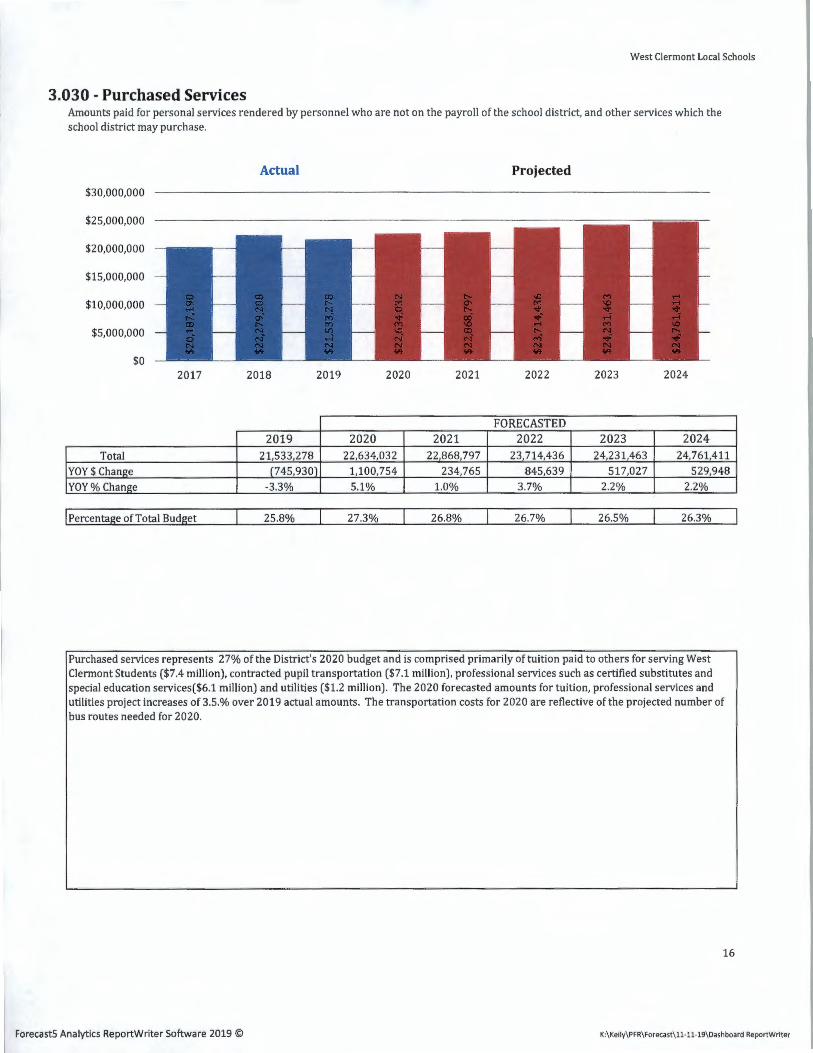
West Clermont Local Schools
3.030 - Purchased Services Amounts paid for personal services rendered by personnel who are not on the payroll of the school district, and other services which the school district may purchase.
$30,000,000
$25,000,000
$20,000,000
$15,000,000
$10,000,000
$5,000,000
$0 2017
Total YOY$ Change YOY% Change
I Percentage of Total Budget
Actual Projected
• I I I I I I I • • • • • • • • • • • • • 2018 2019 2020 2021 2022 2023
FORECASTED 2019 2020 2021 2022 2023
21,533,278 22,634,032 22,868,797 23,714,436 24,231,463 (745,930) 1,100,754 234,765 845,639 517,027
-3.3% 5.1% 1.0% 3.7% 2.2%
25.8% 27.3% 26.8% 26.7% 26.5%
2024
2024 24,761,411
529,948 2.2%
26.3%
Purchased services represents 27% of the District's 2020 budget and is comprised primarily of tuition paid to others for serving West Clermont Students ($7.4 million), contracted pupil transportation ($7.1 million), professional services such as certified substitutes and special education services($6.1 million) and utilities ($1.2 million). The 2020 forecasted amounts for tuition, professional services and utilities project increases of 3.5.% over 2019 actual amounts. The transportation costs for 2020 are reflective of the projected number of bus routes needed for 2020.
16
Forecasts Analytics ReportWriter Software 2019 © K:\Kelly\PFR\Forecast\11-11-19\Dashboard ReportWriter

West Clermont Local Schools
3.040 - Supplies & Materials Expenditures for general supplies, instructional materials including textbooks and media material, bus fuel and tires, and all other maintenance supplies.
Actual Projected $1,800,000
$1,600,000
$1,400,000
$1,200,000
$1,000,000
$800,000
$600,000
$400,000
$200,000
$0
• • • • • • • • • • - . . . . • • • • • • • • • • • • • • • 2017 2018 2019 2020 2021 2022 2023 2024
FORECASTED 2019 2020 2021 2022 2023 2024
Total 959,826 1,319,296 1,368,852 1,420,393 1,474,004 1,529,773 YOY$ Change [286,8801 359,470 49,556 51,541 53,611 55,769
YOY% Change -23.0% 37.5% 3.8% 3.8% 3.8% 3.8%
I Percentage of Total Budget 1.1% 1.6% 1.6% 1.6% 1.6% 1.6%
Supplies represent 1.6% of the budget in FY 2020 and are comprised of instructional supplies, textbooks, general supplies, transportation supplies. Transportation supplies were nearly 45% of the total category in FY 2019 followed by custodial at about 38% of the category total.
17
Forecasts Analytics ReportWriter Software 2019 © K:\Kelly\PFR\Forecast\11-11-19\Dashboard ReportWriter

West Clermont Local Schools
3.050 - Capital Outlay This line includes expenditures for items having at least a five-year life expectancy, such as land, buildings, improvements of grounds, equipment, computers/technology, furnishings, and buses.
Actual Projected
$2,500,000
$2,000,000
$1,500,000
$1,000,000
$500,000
$0 2017 2018 2019 2020 2021 2022 2023 2024
FORECASTED 2019 2020 2021 2022 2023 2024
Total 1,206,077 1,145,800 1,000,000 1,000,000 1,000,000 1,000,000 YOY$ Change (853,8711 (60,2771 (145,8001 - - -
YOY% Change -41.5% -5.0% -12.7% 0.0% 0.0% 0.0%
I Percentage of Total Budget 1.4% 1.4% 1.2% 1.1% 1.1% 1.1%
Capital outlay (equipment, building improvements) is expected to be just 1.4% of the District's budget in FY 2020. The increase in FY 2018 was due to building services as the District's Permanent Improvement Fund does not have the capacity to address all building issues.
The forecast assumes a base capital investment level of $1 million for equipment and building needs for FYs 2021 through 2024.
18
Forecasts Analytics ReportWriter Software 2019 © K:\Kelly\PFR\Forecast\11-11-19\Dashboard ReportWriter

West Clermont Local Schools
3.060-4.060 - Intergovernmental & Debt - Not Applicable to West Clermont These lines account for pass through payments, as well as monies received by a district on behalf of another governmental entity, plus principal and interest payments for general fund borrowing.
Actual Projected $1
$1
$1
$1
$1
$1
$0
$0
$0
$0 ~ ~ ~ ~ ~ ~ ~ ~ ~ ~
$0 2015 2016 2017 2018 2019 2020 2021 2022 2023 2024
FORE CASTED 2019 2020 2021 2022 2023 2024
Total - - - - -YOY$ Chanize - - - - -
YOY% Chanize 0.0% 0.0% 0.0% 0.0% 0.0% 0.0%
I Percentage of Total Budget 0.0% 0.0% 0.0% 0.0% 0.0% 0.0%
There is no General Fund debt.
--
19
Forecasts Analytics ReportWriter Software 2019 © K:\Kelly\PFR\Forecast\11-11-19\Dashboard ReportWriter

West Clermont Local Schools
4.300 - Other Objects Primary components for this expenditure line are membership dues and fees, ESC contract deductions, County Auditor /Treasurer fees, audit expenses, and election expenses.
$1,200,000
$1,000,000
$800,000
$600,000
$400,000
$200,000
$0 2017
Actual Projected
■ ■ ■ ■ ■ ■ ■ ■ ■ ■ ■ ■ ■ ■ ■ ■ ■ ■ ■ ■ ■ ■ ■ ■ ■ ■ ■ ■
2018 2019 2020 2021 2022 2023 2024
FORE CASTED 2019 2020 2021 2022 2023 2024
Total 832,075 865,516 899,986 935,835 973,118 1,011,892 YOY$ Change (99,483) 33,441 34,470 35,849 37,283 38,774 YOY% Change -10.7% 4.0% 4.0% 4.0% 4.0% 4.0%
I Percentage of Total Budget 1.0% 1.0% 1.1% 1.1% 1.1% 1.1%
Other objects are expected to be 1 % of FY 2020's spending. The largest component is for County Auditor & Treasurer fees. These fees amounted to $543,000 in SFY 2019
20
Forecasts Analytics ReportWriter Software 2019 © K:\Kelly\PFR\Forecast\11-11-19\0ashboard ReportWriter

West Clermont Local Schools
5.040 -Total Other Financing Uses Operating transfers-out, advances out to other funds, and all other general fund financing uses.
Actual Projected
$7,000,000
$6,000,000
$5,000,000
$4,000,000
$3,000,000
$2,000,000
$1,000,000
$0
■ ■ ■ ■ ■ ■ ~ - --
■ ■ - . - .
■ ■ : r . .
2017 2018 2019 2020 2021 2022 2023 2024
FORE CASTED
2019 2020 2021 2022 2023 2024
Total 5,491,890 418,200 426,564 435,095 443,797 452,673
YOY$ Change (713,2241 (5,073,6901 8,364 8,531 8,702 8,876
YOY% Change -11.5% -92.4% 2.0% 2.0% 2.0% 2.0%
I Percentage of Total Budget 6.6% 0.5% 0.5% 0.5% 0.5% 0.5%
Transfers Out 5,395,177 418,200 426,564 435,095 443,797 452,673 Advances Out 96,713
The largest part of "Other Financing Uses" in FY 2019 was a transfer to the Permanent Improvement Fund in the amount of $4,988,069 in order to maintain a positive cash balance in the Permanent Improvement Fund. The remainder of the transfers posted in 2019 was a $407,108 transfer to the District Managed Activites Fund 300. Going forward, the forecast reflects an annual transfer to District Managed Activites Fund 300 that averages $435,000 annually for FYs 2020-2024.
21
I Forecasts Analytics ReportWriter Software 2019 © K:\Kelly\PFR\Forecast\11-11-19\Dashboard ReportWriter

I
West Clermont Local Schools Schedule Of Revenue, Expenditures and Changes In Fund Balances
Actual and Forecasted Operating Fund
I ACTUAL FORECASTED Fiscal Year Fiscal Year Fiscal Year Fiscal Year Fiscal Year Fiscal Year Fiscal Year Fiscal Year
2017 2018 2019 2020 2021 2022 2023 2024 Revenue:
1.010 - General Property Tax (Real Estate) 33,004,368 33,343,358 33,585,382 33,756,498 34,264,096 34,714,459 34,917,889 35,624,473 1.020 - Public Utility Personal Property 2,678,752 2,728,656 2,862,869 3,014,113 3,109,737 3,205,210 3,304,683 3,392,889 1.030 - Income Tax 1.035 - Unrestricted Grants-in-Aid 30,039,490 30,737,806 31,581,554 31,856,374 32,014,059 33,603,072 34,485,108 35,389,354 1.040 - Restricted Grants-in-Aid 688,430 352,876 677,728 677,728 677,728 677,728 677,728 677,728 1.045 - Restricted Federal Grants-in-Aid - SFSF 1.050 - Property Tax Allocation 4,380,795 4,277,837 4,209,346 4,184,394 4,222,781 4,257,166 4,261,469 4,371,581 1.060 - All Other Operating Revenues 2,836,984 3,323,679 3,224,272 3,360,332 3,404,446 3,511,764 3,805,951 3,817,627
1.070 - Total Revenue 73,628,819 74,764,212 76,141,151 76,849,439 77,692,847 79,969,399 81,452,828 83,273,652
Other Financing Sources: 2.010 - Proceeds from Sale of Notes 2.020 - State Emergency Loans and Advancements 2.040 - Operating Transfers-In 2.050 - Advances-In 30,205 5,045,436 5,797,920 96,713 2.060 - All Other Financing Sources 5,526 2.070 - Total Other Financing Sources 30,205 5,045,436 5,803,445 96,713
2.080 - Total Revenues and Other Financln11 Sources 73,659,024 79,809,648 81,944,597 76,946,152 77,692,847 79,969,399 81,452,828 83,273,652
Expenditures: 3.010 - Personnel Services 33,225,033 36,293,519 38,193,893 40,315,459 41,323,345 42,703,906 43,771,504 44,865,792 3.020 - Employees' Retirement/Insurance Benefits 13,034,857 13,826,725 15,345,012 16,348,182 17,373,821 18,467,613 19,421,681 20,435,112 3.030 - Purchased Services 20,187,190 22,279,208 21,533,278 22,634,032 22,868,797 23,714,436 24,231,463 24,761,411 3.040 - Supplies and Materials 914,542 1,246,706 959,826 1,319,296 1,368,852 1,420,393 1,474,004 1,529,773 3.050 - Capital Outlay 1,529,070 2,059,948 1,206,077 1,145,800 1,000,000 1,000,000 1,000,000 1,000,000 3.060 - Intergovernmental
Debt Service: 4.010 - Principal-All Years 4.020 - Principal - Notes 4.030 - Principal - State Loans 4.040 - Principal - State Advances 4.050 - Principal - HB264 Loan 4.055 - Principal - Other 4.060 - Interest and Fiscal Charges 4.300 - Other Objects 884,655 931,558 832,075 865,516 899,986 935,835 973,118 1,011,892
4.500 - Total Expenditures 69,775,347 76,637,664 78,070,160 82,628,285 84,834,801 88,242,183 90,871,770 93,603,980
Other Financing Uses 5.010 - Operating Transfers-Out 442,142 407,194 5,395,177 418,200 426,564 435,095 443,797 452,673 5.020 - Advances-Out 5,045,436 5,797,920 96,713 5.030 - All Other Financing Uses 5.040 - Total Other Financinl! Uses 5,487,578 6,205,114 5,491,890 418,200 426,564 435,095 443,797 452,673
5.050 - Total Exoenditures and Other Financimz Uses 75,262,925 82,842,778 83,562,050 83,046,485 85,261,365 88,677,278 91,315,567 94,056,653
Excess of Rev & Other Financing Uses Over (Under) 6.010 - Expenditures and Other Financln11 Uses (1,603,901) (3,033,1301 fl,617,453) (6,100,333) (7,568,518) (8,707,879) (9,862,739) (10,783,001)
Cash Balance July 1 - Excluding Proposed Renewal/ 7.010 - Replacement and New Levies 20,636,264 19,032,363 15,999,233 14,381,780 8,281,447 712,930 (7,994,950) (17,857,689)
7.020 - Cash Balance lune 30 19,032,363 15,999,233 14,381,780 8,281,447 712,930 (7,994,950) (17,857,689) (28,640,690)
8.010 - Estimated Encumbrances June 30 846,593 892,118
Reservations of Fund Balance: 9.010 - Textbooks and Instructional Materials 9.020 - Capital Improvements 9.030 - Budget Reserve 9.040 - DPIA 9.050 - Debt Service 9.060 - Property Tax Advances 9.070 - Bus Purchases 9.080 - Subtotal
Fund Balance June 30 for Certification 10.010 - of Appropriations 18,185,770 15,107,115 14,381,780 8,281,447 712,930 (7,994,9501 (17,857,689) (28,640,690)
Rev from Replacement/Renewal Levies 11.010 - Income Tax - Renewal 11.020 - Property Tax - Renewal or Replacement 11.030 - Cumulative Balance of Replacement/Renewal L1
Fund Balance June 30 for Certification 12.010 - of Contracts, Salary and Other Obli11atlons 18,185,770 15,107,115 14,381,780 8,281,447 712,930 (7,994,9501 fl 7,857,689) (28,640,690)
Revenue from New Levies 13.010 - Income Tax - New 13.020 - Property Tax - New 13.030- Cumulative Balance of New Levies
14.010 - Revenue from Future State Advancements
15.010 - Unreserved Fund Balance June 30 18,185,770 15,107,115 14,381,780 8,281,447 712,930 (7,994,950) fl 7,857,689) (28,640,6901
K:\Kelly\PFR\FOfecaat\11 -11-19\FOfecast 22