five year network assessment - amazon web services quality/monitor...minor barnette , director ......
TRANSCRIPT
2015
Forsyth County Office of Environmental Assistance and Protection Minor Barnette, Director Jason R. Bodenhamer, Program Manager May 1, 2015
FIVE YEAR NETWORK ASSESSMENT In 2006 EPA amended the ambient air monitoring regulations. As part of this amendment, EPA is requiring monitoring agencies to conduct a network assessment once every five years. The purpose is to optimize U.S. air monitoring networks to achieve, with limited resources, the best possible scientific value and protection of public and environmental health and welfare.
Page | 2
Background
The U.S. Environmental Protection Agency (EPA) finalized an amendment to the ambient air
monitoring regulations on October 17, 2006. As part of this amendment, the EPA added the
following requirement for state, or, where applicable, local monitoring agencies to conduct a
network assessments once every five years [40 CFR 58.10(d)].
“(d) The State, or where applicable local, agency shall perform and submit to the EPA Regional
Administrator an assessment of the air quality surveillance system every 5 years to determine, at
a minimum, if the network meets the monitoring objectives defined in appendix D to this part,
whether new sites are needed, whether existing sites are no longer needed and can be
terminated, and whether new technologies are appropriate for incorporation into the ambient air
monitoring network. The network assessment must consider the ability of existing and proposed
sites to support air quality characterization for areas with relatively high populations of
susceptible individuals (e.g., children with asthma), and, for any sites that are being proposed for
discontinuance, the effect on data users other than the agency itself, such as nearby States and
Tribes or health effects studies. For PM2.5, the assessment also must identify needed changes to
population-oriented sites. The State, or where applicable local, agency must submit a copy of this
5-year assessment, along with a revised annual network plan, to the Regional Administrator. The
first assessment is due July 1, 2010.”
This requirement is an outcome of implementing the National Ambient Air Monitoring Strategy
(NAAMS, the most recent version is dated December 2005, U.S. Environmental Protection
Agency, 2005). The purpose of the NAAMS is to optimize U.S. air monitoring networks to
achieve, with limited resources, the best possible scientific value and protection of public and
environmental health and welfare. A network assessment includes (1) re-evaluation of the
objectives and budget for air monitoring, (2) evaluation of a network’s effectiveness and
efficiency relative to its objectives and costs, and (3) development of recommendations for
network reconfigurations and improvements. EPA expects that a multi-level network
assessment will be conducted every five years (U.S. Environmental Protection Agency, 2005).
Initial network assessments for the NAAMS were led by EPA and its 10 regional offices in 2001
through 2004 (U.S. Environmental Protection Agency, 2003b). This initial assessment, as well as
peer reviews of the NAAMS by subcommittees of the EPA Clean Air Scientific Advisory
Committee (Hopke, 2003), (Henderson, 2005), produced the recommendation that guidance for
regional scale network assessments be established. The NAAMS (U.S. Environmental Protection
Agency, 2005), (U.S. Environmental Protection Agency, 2005), (Clean Air Scientific Advisory
Committee and National Ambient Air Monitoring Strategy Subcommittee, 2003) and
documentation of the initial national- and regional scale network assessments provide a
valuable context and a summary of the key technical issues for network assessment guidelines.
This document builds on the lessons learned in the NAAMS and focuses on providing guidance
on analytical techniques that can be used for multiple-scale assessments.
Page | 3
Contents
Background ......................................................................................................................................2 List of Tables ...................................................................................................................................4 List of Figures ..................................................................................................................................4 Geography ........................................................................................................................................5 Demographics ..................................................................................................................................5
Permitting and Inspection Programs ................................................................................................6 Transportation ..................................................................................................................................7 Meteorology .....................................................................................................................................8
Current Air Monitoring Network .....................................................................................................9 Introduction ................................................................................................................................. 9 Site Description Background Information and Definitions ...................................................... 10
Air Monitoring Station Descriptions .................................................................................... 19 Statistical Analysis .........................................................................................................................36
Trends ....................................................................................................................................... 36
Site correlations ........................................................................................................................ 39 Comparison to NAAQS ............................................................................................................ 40
Situational Analysis .......................................................................................................................41 Risk of future NAAQS exceedances ......................................................................................... 41 Demographic shifts ................................................................................................................... 41
SIP requirements ....................................................................................................................... 42
Density of existing network ...................................................................................................... 42 Scientific research or public health needs ................................................................................. 43 Political factors ......................................................................................................................... 43
Proposed Changes ..................................................................................................................... 43 Public Input ............................................................................................................................... 44
References ......................................................................................................................................44
Page | 4
List of Tables
Table 1 - Siting Objectives and Scales ................................................................................................................... 15
Table 2 - Forsyth County Monitoring Sites ........................................................................................................... 16
Table 3 - Forsyth County Monitoring Methods .................................................................................................... 18
Table 4 - Clemmons Middle School Monitoring Station Summary........................................................................ 19
Table 5 - Hattie Avenue "A" Monitoring Station Summary .................................................................................. 22
Table 6 - Hattie Avenue "B" Monitoring Station Summary................................................................................... 25
Table 7 - Peter's Creek Monitoring Station Summary ........................................................................................... 28
Table 8 - Shiloh Church Monitoring Station Summary .......................................................................................... 31
Table 9 - Union Cross Monitoring Station Summary ............................................................................................. 33
Table 10 - Proposed Network Changes ................................................................................................................. 44
List of Figures
Figure 1- Black\African-American Population Density ........................................................................................... 5
Figure 2 - Hispanic Population Density ................................................................................................................... 5
Figure 3 - White Population Density ...................................................................................................................... 6
Figure 4 - Employment Sector Trend - 2008-2012................................................................................................... 6
Figure 5 - Forsyth County Permitted Stationary Sources ........................................................................................ 6
Figure 6 - Forsyth County Growth Management Plan ............................................................................................ 7
Figure 7 - Wind Rose for Forsyth County - 2014 ..................................................................................................... 8
Figure 8 - National Ambient Air Quality Standards (NAAQS) .................................................................................. 9
Figure 9 - SO2 and NO2 Emission Trends 2008 - 2011 ........................................................................................... 36
Figure 10 - Daily and Annual Particle Pollution Trends ......................................................................................... 37
Figure 11 - Carbon Monoxide Trend 2010-2014 ................................................................................................... 37
Figure 12 - Ozone Daily Maximums > 0.075 ppm ................................................................................................. 38
Figure 13- Particle Pollution Correlation .............................................................................................................. 39
Figure 14 - Ozone Pollution Correlations .............................................................................................................. 39
Figure 15 - Ozone comparison to NAAQS - 2012 - 2014 ........................................................................................ 40
Figure 16 - Population and Trends ....................................................................................................................... 41
Figure 17 - Forsyth County Neighborhoods and Monitors .................................................................................... 42
Page | 5
Geography
The Forsyth County Office of Environmental Assistance and Protection (FCEAP) operates the air program and air monitoring network for the Forsyth County, NC area. FCEAP’s local program is certified by the US Environmental Protection Agency and operates under an approved Quality Assurance Project Plan (QAPP) and Quality Management Program (QMP).
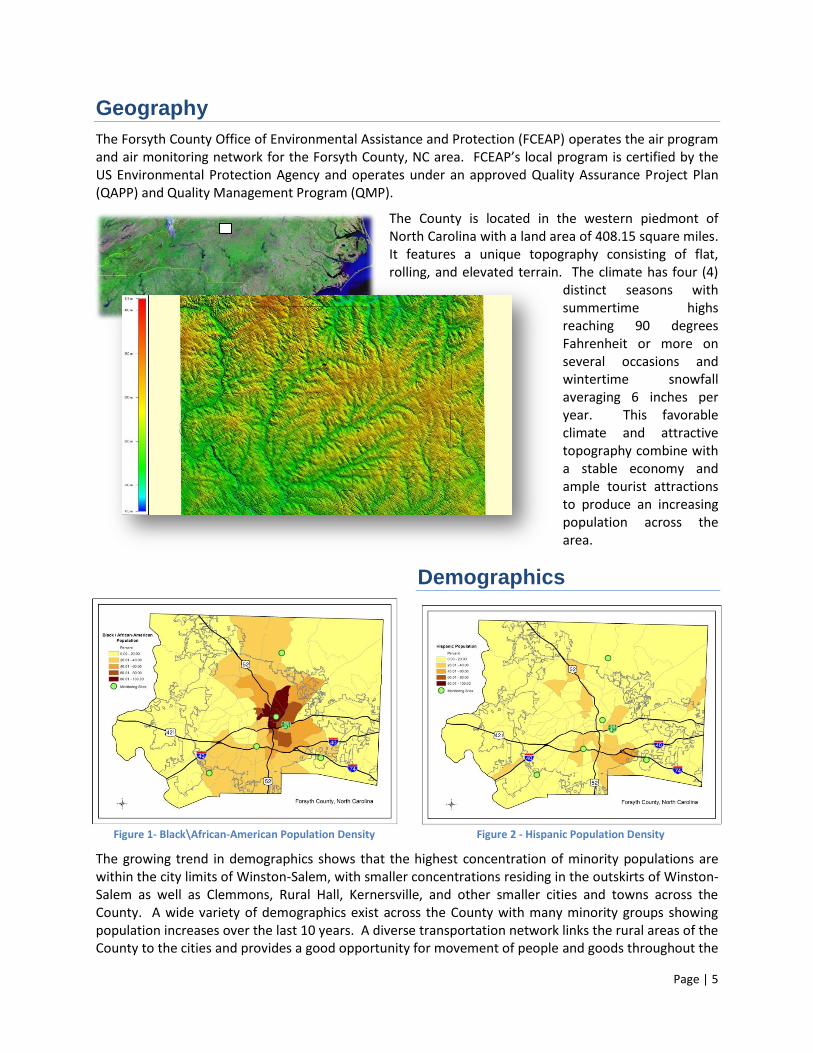
The County is located in the western piedmont of North Carolina with a land area of 408.15 square miles. It features a unique topography consisting of flat, rolling, and elevated terrain. The climate has four (4)
distinct seasons with summertime highs reaching 90 degrees Fahrenheit or more on several occasions and wintertime snowfall averaging 6 inches per year. This favorable climate and attractive topography combine with a stable economy and ample tourist attractions to produce an increasing population across the area.
Demographics
The growing trend in demographics shows that the highest concentration of minority populations are within the city limits of Winston-Salem, with smaller concentrations residing in the outskirts of Winston-Salem as well as Clemmons, Rural Hall, Kernersville, and other smaller cities and towns across the County. A wide variety of demographics exist across the County with many minority groups showing population increases over the last 10 years. A diverse transportation network links the rural areas of the County to the cities and provides a good opportunity for movement of people and goods throughout the
Figure 1- Black\African-American Population Density Figure 2 - Hispanic Population Density
Page | 6
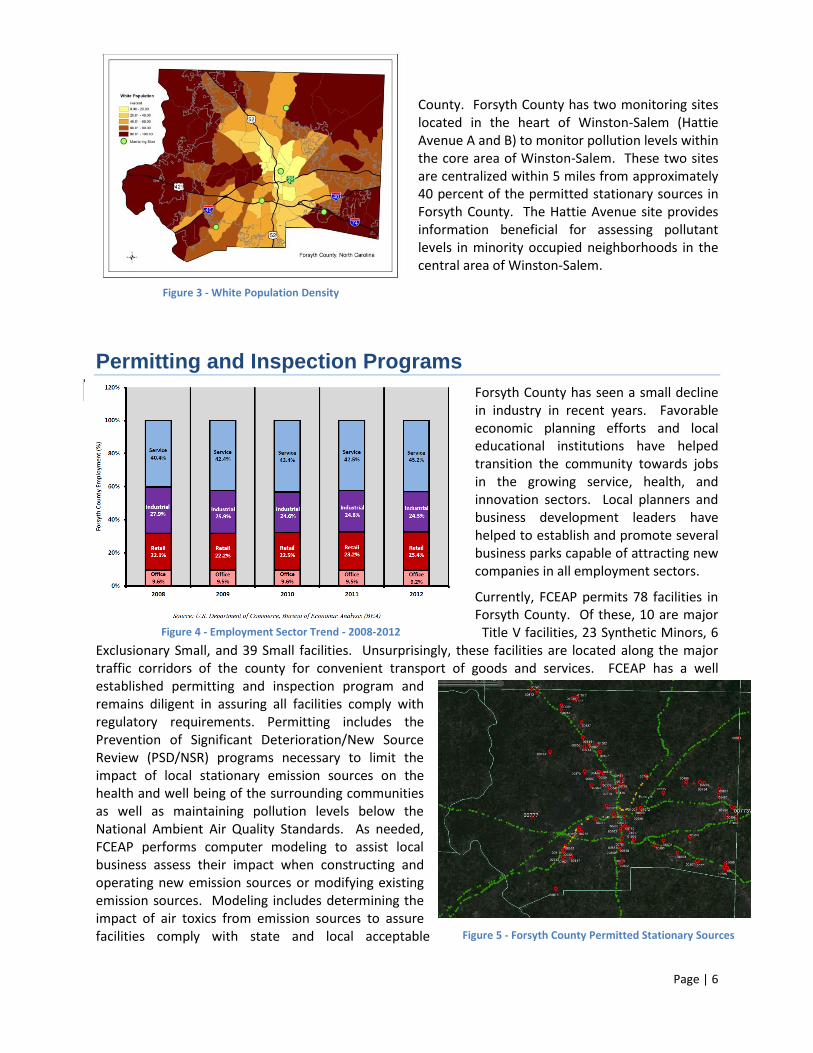
County. Forsyth County has two monitoring sites located in the heart of Winston-Salem (Hattie Avenue A and B) to monitor pollution levels within the core area of Winston-Salem. These two sites are centralized within 5 miles from approximately 40 percent of the permitted stationary sources in Forsyth County. The Hattie Avenue site provides information beneficial for assessing pollutant levels in minority occupied neighborhoods in the central area of Winston-Salem.
Permitting and Inspection Programs
Forsyth County has seen a small decline in industry in recent years. Favorable economic planning efforts and local educational institutions have helped transition the community towards jobs in the growing service, health, and innovation sectors. Local planners and business development leaders have helped to establish and promote several business parks capable of attracting new companies in all employment sectors.
Currently, FCEAP permits 78 facilities in Forsyth County. Of these, 10 are major
Title V facilities, 23 Synthetic Minors, 6 Exclusionary Small, and 39 Small facilities. Unsurprisingly, these facilities are located along the major traffic corridors of the county for convenient transport of goods and services. FCEAP has a well established permitting and inspection program and remains diligent in assuring all facilities comply with regulatory requirements. Permitting includes the Prevention of Significant Deterioration/New Source Review (PSD/NSR) programs necessary to limit the impact of local stationary emission sources on the health and well being of the surrounding communities as well as maintaining pollution levels below the National Ambient Air Quality Standards. As needed, FCEAP performs computer modeling to assist local business assess their impact when constructing and operating new emission sources or modifying existing emission sources. Modeling includes determining the impact of air toxics from emission sources to assure facilities comply with state and local acceptable
Figure 3 - White Population Density
Figure 4 - Employment Sector Trend - 2008-2012
Figure 5 - Forsyth County Permitted Stationary Sources
Page | 7
emission standards for toxic air pollutants.
In addition to permitting, FCEAP registers and annually inspects 202 gasoline dispensing facilities utilizing Stage 1 Vapor Recovery and 19 dry cleaning facilities using Perchloroethylene. FCEAP believes that regular, periodic inspection of these facilities further limits the impact of toxic pollutants on the community and reduces VOC emissions (especially from gasoline dispensing facilities),
The permitting and inspection programs performed by FCEAP contribute to the continued decline of ambient concentration of criteria pollutants emitted by stationary sources. Additionally, with assistance and guidance from FCEAP, many local industries are implementing strategies to reduce emissions and are engaging in pollution prevention work practices that enhance their financial success. These pollution prevention practices, along with the benefits that business and institutions find in reducing energy costs, compliment an effective regulatory program.
Transportation
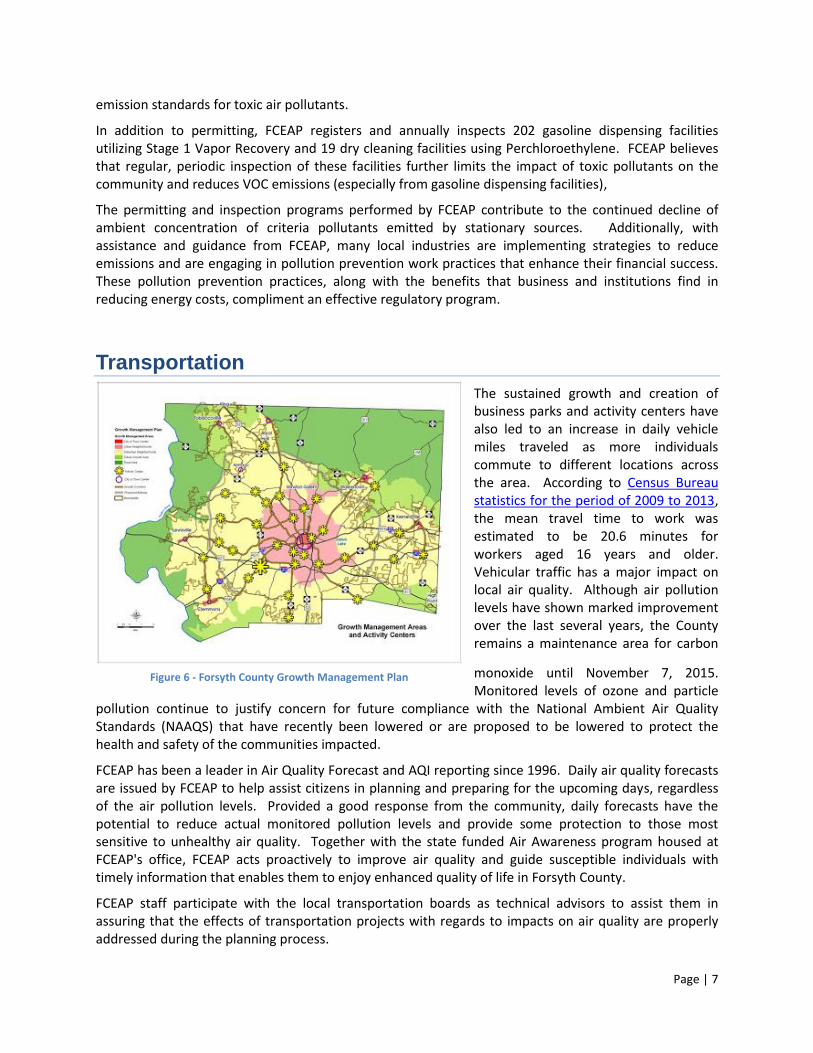
The sustained growth and creation of business parks and activity centers have also led to an increase in daily vehicle miles traveled as more individuals commute to different locations across the area. According to Census Bureau statistics for the period of 2009 to 2013, the mean travel time to work was estimated to be 20.6 minutes for workers aged 16 years and older. Vehicular traffic has a major impact on local air quality. Although air pollution levels have shown marked improvement over the last several years, the County remains a maintenance area for carbon
monoxide until November 7, 2015. Monitored levels of ozone and particle
pollution continue to justify concern for future compliance with the National Ambient Air Quality Standards (NAAQS) that have recently been lowered or are proposed to be lowered to protect the health and safety of the communities impacted.
FCEAP has been a leader in Air Quality Forecast and AQI reporting since 1996. Daily air quality forecasts are issued by FCEAP to help assist citizens in planning and preparing for the upcoming days, regardless of the air pollution levels. Provided a good response from the community, daily forecasts have the potential to reduce actual monitored pollution levels and provide some protection to those most sensitive to unhealthy air quality. Together with the state funded Air Awareness program housed at FCEAP's office, FCEAP acts proactively to improve air quality and guide susceptible individuals with timely information that enables them to enjoy enhanced quality of life in Forsyth County.
FCEAP staff participate with the local transportation boards as technical advisors to assist them in assuring that the effects of transportation projects with regards to impacts on air quality are properly addressed during the planning process.
Figure 6 - Forsyth County Growth Management Plan
Page | 8
Meteorology
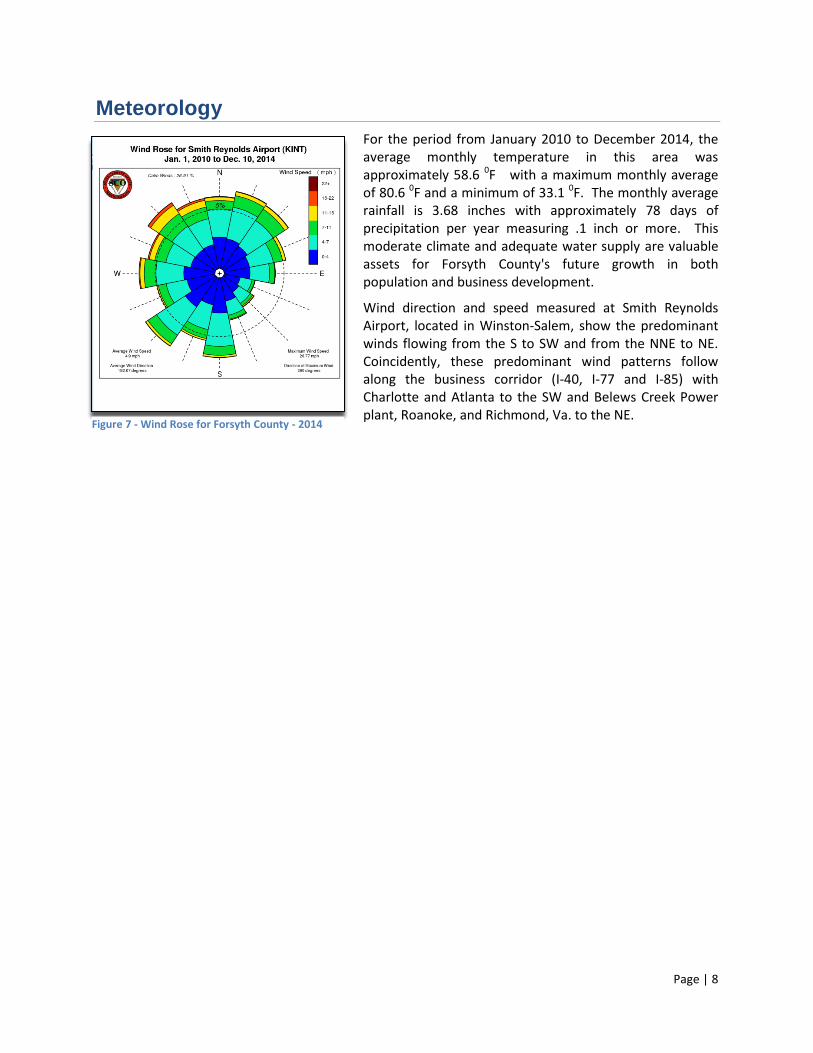
For the period from January 2010 to December 2014, the average monthly temperature in this area was approximately 58.6 0F with a maximum monthly average of 80.6 0F and a minimum of 33.1 0F. The monthly average rainfall is 3.68 inches with approximately 78 days of precipitation per year measuring .1 inch or more. This moderate climate and adequate water supply are valuable assets for Forsyth County's future growth in both population and business development.
Wind direction and speed measured at Smith Reynolds Airport, located in Winston-Salem, show the predominant winds flowing from the S to SW and from the NNE to NE. Coincidently, these predominant wind patterns follow along the business corridor (I-40, I-77 and I-85) with Charlotte and Atlanta to the SW and Belews Creek Power plant, Roanoke, and Richmond, Va. to the NE.
Figure 7 - Wind Rose for Forsyth County - 2014
Page | 9
Current Air Monitoring Network
Introduction
FCEAP’s monitoring program
provides air quality monitoring
services for Forsyth County,
NC. FCEAP is a state “certified
local air pollution program”
whose purpose is to improve
and maintain ambient air
quality and reduce exposure to
unhealthful air pollutants.
FCEAP has operated an air
quality monitoring program
since the early 1970’s. The air
monitoring services are
provided to measure
concentrations of criteria air
pollutants [Carbon Monoxide
(CO), Nitrogen Dioxide (NO2),
Sulfur Dioxide (SO2), Particulate
Pollution (PM2.5 and PM10) and
Ozone (O3)] in accordance
with US EPA regulatory requirements. The requirement for monitoring lead is source specific and
requires monitoring in the vicinity of facilities emitting .5 tons or more of lead per year. At this time,
Forsyth County does not have a facility with lead emissions approaching this threshold. Urban Air Toxics
are monitored at the Hattie Avenue site by the NC Division of Air Quality (DAQ). FCEAP services the DAQ
sampling equipment and sends the samples to their lab for analysis. Measurements at FCEAP's
monitoring sites are used to:
Evaluate compliance with the NAAQS,
Serve as baseline data so that changes in air quality can be tracked,
Document current dynamic concentration of monitored pollutants,
Support daily forecasting efforts including the activation of emergency control procedures to prevent or alleviate air pollution episodes and provide information to citizens, enablingthem to limit their exposure to pollutants of concern,
Provide data upon which long term control strategies can be reliably developed locally and utilized to inform regional planning efforts,
Observe trends in the area, and
Provide a database for research and analytical purposes.
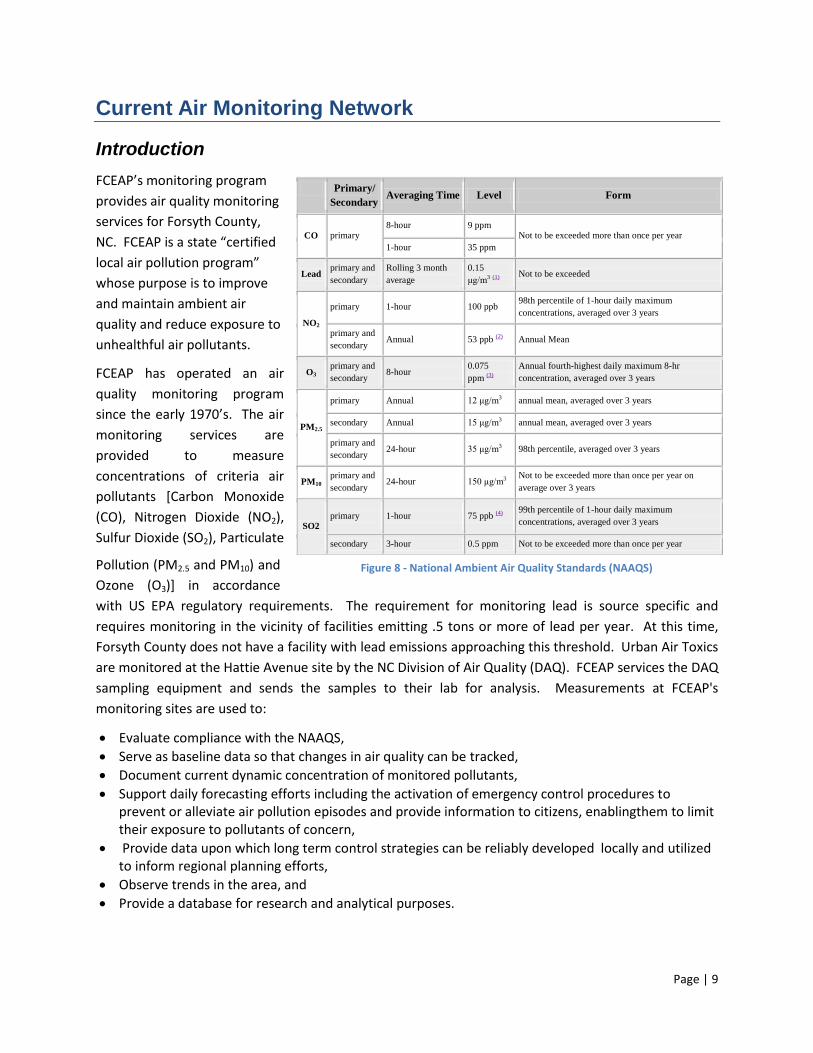
Primary/
Secondary Averaging Time Level Form
CO primary 8-hour 9 ppm
Not to be exceeded more than once per year
1-hour 35 ppm
Lead primary and
secondary
Rolling 3 month
average
0.15
μg/m3 (1) Not to be exceeded
NO2
primary 1-hour 100 ppb 98th percentile of 1-hour daily maximum
concentrations, averaged over 3 years
primary and
secondary Annual 53 ppb (2) Annual Mean
O3 primary and
secondary 8-hour
0.075
ppm (3)
Annual fourth-highest daily maximum 8-hr
concentration, averaged over 3 years
PM2.5
primary Annual 12 μg/m3 annual mean, averaged over 3 years
secondary Annual 15 μg/m3 annual mean, averaged over 3 years
primary and
secondary 24-hour 35 μg/m3 98th percentile, averaged over 3 years
PM10 primary and
secondary 24-hour 150 μg/m3
Not to be exceeded more than once per year on
average over 3 years
SO2 primary 1-hour 75 ppb (4)
99th percentile of 1-hour daily maximum
concentrations, averaged over 3 years
secondary 3-hour 0.5 ppm Not to be exceeded more than once per year
Figure 8 - National Ambient Air Quality Standards (NAAQS)
Page | 10
The FCEAP air monitoring network includes six state and local air monitoring stations (SLAMS) in Forsyth
County. The current network configuration consists of six monitoring stations that measure
concentrations of criteria air pollutants. In addition to the SLAMS network the county network also
includes monitoring for meteorological parameters (co-located at Union Cross monitoring station) and
visibility conditions (via a webcam on Sauratown Mountain).
The annual monitoring network plan, as provided for in 40 CFR Part 58.10, Annual Monitoring Network
Plan and Periodic Network Assessment, must contain the following information for each monitoring
station in the network:
1. The Air Quality System (AQS) site identification number for existing stations.
2. The location, including the street address and geographical coordinates, for each monitoring
station.
3. The sampling and analysis method used for each measured parameter.
4. The operating schedule for each monitor.
5. Any proposal to remove or relocate a monitoring station within a period of eighteen months
following the plan submittal.
6. The monitoring objective and spatial scale of representativeness for each monitor.
7. The identification of any sites that are suitable and sites that are not suitable for comparison
against the annual PM2.5 NAAQS.
8. The Metropolitan Statistical Area (MSA), Core Based Statistical Area (CBSA), combined Statistical
Area (CSA) or other area represented by the monitor.
The following information replicates the Forsyth County Air Quality ambient air monitoring network plan
and continues in the sections outlined below:
I. Site Description Background Information and Definitions: An outline of the designations,
parameters, monitoring methods, and the basis for site selection.
II. Network Summary: This section presents an overview of the total number of sites and monitors
in Forsyth County. Also included is a listing of all proposed changes to the current network.
III. Air Monitoring Station Description: Each air monitoring station is described in detail as per the
outline in (II.) above. Modification to the network as determined by an annual review process will
be made each year to maintain a current up-to-date network description document.
Site Description Background Information and Definitions
1. Site Description
Specific information is provided to show the following: location of the monitoring equipment at the
site, if the site is located in a CSA/MSA, the AQS identification number, the GPS coordinates, and
evidence that monitors and monitor probes conform to the siting criteria.
Page | 11
2. Date Established
The date when each existing monitoring station was established is specified in the description. For
any stations which are proposed, a date is provided for the anticipated commencement of
operation.
3. Site Approval Status
Each monitoring station in the existing network has been reviewed for the purpose of
determining whether it meets all design and siting criteria for inclusion in the SLAMS
network. Stations that do not meet the criteria will either be relocated in a nearby area or,
when possible, modified at the present location.
4. Monitoring Objectives
Per 40 CFR 58 Appendix D, Section 1.1:
“The ambient air monitoring networks must be designed to meet three basic monitoring
objectives. These basic objectives are listed below. The appearance of any one objective
in the order of this list is not based upon a prioritized scheme. Each objective is
important and must be considered individually.”
The objectives are summarized as follows:
(a) Provide air pollution data to the general public in a timely manner.
(b) Support compliance with ambient air quality standards and emissions strategy
development. Data from FRM (Federal Reference Method), FEM (Federal Equivalent
Method), and ARM (Approved Regional Method) monitors for NAAQS pollutants will
be used for comparing an area’s air pollution levels against the NAAQS.
(c) Support for air pollution research studies.
5. Monitoring Stations’ Designations
Most stations described in the air quality surveillance network are designated as State and
Local Air Monitoring Stations (SLAMS). In addition, some of these stations fulfill other
requirements, which must be identified. In this description of the network, designations are
also made for National Air Monitoring Stations (NAMS), Special Purpose Monitors (SPM),
and National Core (community oriented) stations (NCore). The following criteria are used
for each of these designations:
SLAMS
Requirements for air quality surveillance systems provide for the establishment of a
network of monitoring stations designated as State and Local Air Monitoring Stations
(SLAMS) that measure ambient air concentrations of those pollutants for which standards
have been established. These stations must meet requirements that relate to four major
Page | 12
areas: quality assurance, monitoring methodology, sampling interval and siting of
instruments and instrument probes.
NAMS Within the SLAMS network certain monitors are selected to provide the USEPA with timely
data for use in national trends analysis. These NAMS monitors are identified in the summary
of network stations.
SPM
Not all monitors and monitoring stations in the air quality surveillance network are included
in the SLAMS network. In order to allow the capability of providing monitoring for various
reasons such as: special studies, modeling verification and compliance status, and other
objectives; certain monitors are designated as Special Purpose Monitors (SPM). These
monitors are not committed to any one location or for any specified time period. They may
be located as separate monitoring stations or be included at SLAMS locations. Monitoring
data may be reported, provided that the monitors and stations conform to all requirements
of the SLAMS network.
NCORE
National Core (community-oriented) multi-pollutant monitoring station data will be used to
evaluate the regional air quality models used in developing emission strategies and to track
trends in air pollution abatement control measures’ impact on improving air quality.
6. Monitoring Methods
Sampling and analytical procedures for criteria air pollutant monitoring performed in the
FCEAP ambient air monitoring network are conducted in accordance with applicable USEPA
Designated Federal Reference (FRM) or Equivalent (FEM) Methods unless otherwise noted.
Analytical techniques for non-criteria air pollutant monitoring (methods employed that are
not USEPA Designated Federal Reference (FRM) or Equivalent (FEM) Methods) are
documented in the applicable FCEAP Quality Assurance Project Plans (QAPP), FCEAP
Standard Operating Procedures (SOP), or the appropriate North Carolina Division of Air
Quality (NCDAQ) QAPP or SOP. Methods used by FCEAP for criteria pollutant monitoring
are listed below:
Particulate Matter 10 microns in size (PM10)
All PM10 samplers operated by FCEAP are operated as federal reference method
(FRM) or equivalent samplers and are operated according to the requirements set
forth in 40 CFR 50 and 40 CFR 53. Listed below is the USEPA Designated Reference
or Equivalent Method used in the FCEAP monitoring network:
Method Designation Number Method Code
R&P TEOM Series 1400ab EQPM-1090-079 079
Page | 13
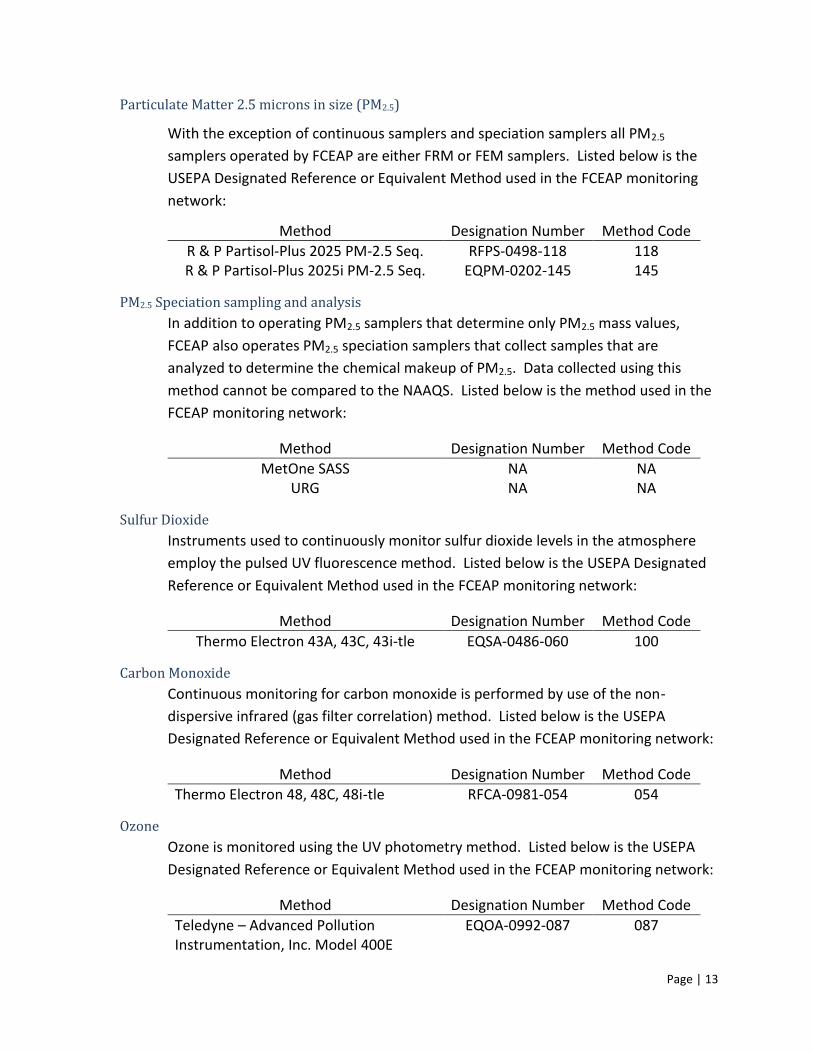
Particulate Matter 2.5 microns in size (PM2.5)
With the exception of continuous samplers and speciation samplers all PM2.5
samplers operated by FCEAP are either FRM or FEM samplers. Listed below is the
USEPA Designated Reference or Equivalent Method used in the FCEAP monitoring
network:
Method Designation Number Method Code
R & P Partisol-Plus 2025 PM-2.5 Seq. R & P Partisol-Plus 2025i PM-2.5 Seq.
RFPS-0498-118 EQPM-0202-145
118 145
PM2.5 Speciation sampling and analysis
In addition to operating PM2.5 samplers that determine only PM2.5 mass values,
FCEAP also operates PM2.5 speciation samplers that collect samples that are
analyzed to determine the chemical makeup of PM2.5. Data collected using this
method cannot be compared to the NAAQS. Listed below is the method used in the
FCEAP monitoring network:
Method Designation Number Method Code
MetOne SASS URG
NA NA
NA NA
Sulfur Dioxide
Instruments used to continuously monitor sulfur dioxide levels in the atmosphere
employ the pulsed UV fluorescence method. Listed below is the USEPA Designated
Reference or Equivalent Method used in the FCEAP monitoring network:
Method Designation Number Method Code
Thermo Electron 43A, 43C, 43i-tle EQSA-0486-060 100
Carbon Monoxide
Continuous monitoring for carbon monoxide is performed by use of the non-
dispersive infrared (gas filter correlation) method. Listed below is the USEPA
Designated Reference or Equivalent Method used in the FCEAP monitoring network:
Method Designation Number Method Code
Thermo Electron 48, 48C, 48i-tle RFCA-0981-054 054
Ozone
Ozone is monitored using the UV photometry method. Listed below is the USEPA
Designated Reference or Equivalent Method used in the FCEAP monitoring network:
Method Designation Number Method Code
Teledyne – Advanced Pollution Instrumentation, Inc. Model 400E
EQOA-0992-087 087
Page | 14
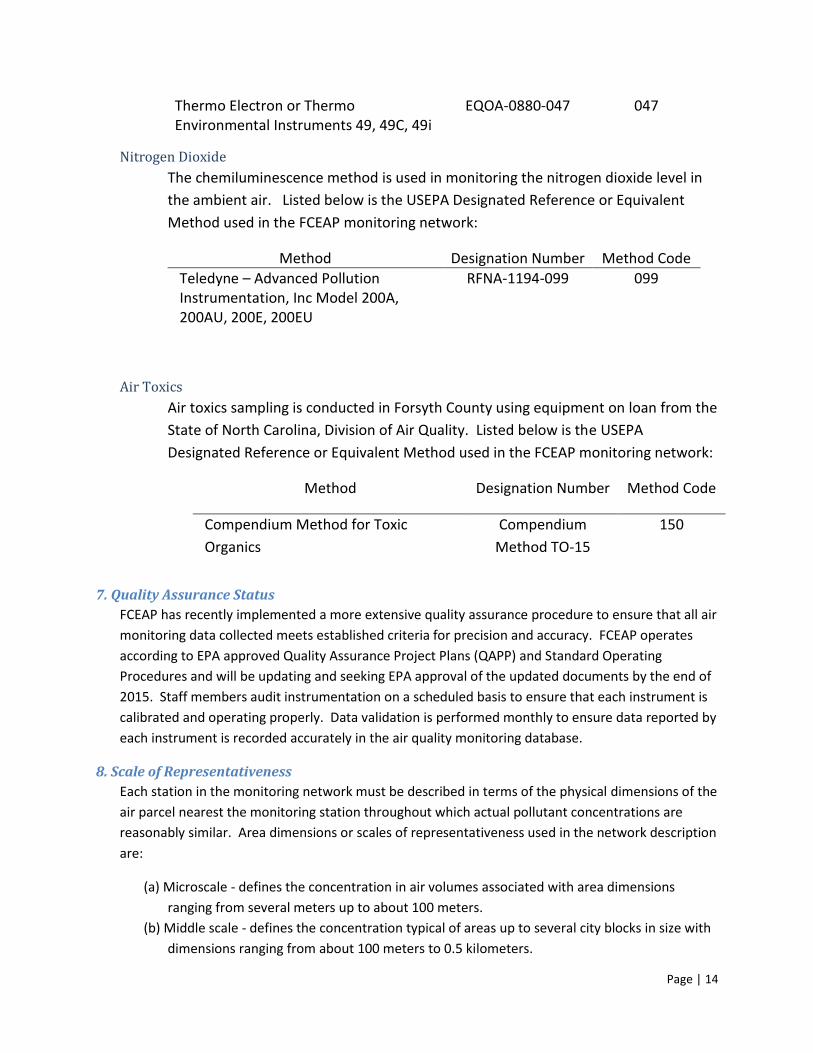
Thermo Electron or Thermo
Environmental Instruments 49, 49C, 49i EQOA-0880-047 047
Nitrogen Dioxide
The chemiluminescence method is used in monitoring the nitrogen dioxide level in
the ambient air. Listed below is the USEPA Designated Reference or Equivalent
Method used in the FCEAP monitoring network:
Method Designation Number Method Code
Teledyne – Advanced Pollution Instrumentation, Inc Model 200A, 200AU, 200E, 200EU
RFNA-1194-099 099
Air Toxics
Air toxics sampling is conducted in Forsyth County using equipment on loan from the
State of North Carolina, Division of Air Quality. Listed below is the USEPA
Designated Reference or Equivalent Method used in the FCEAP monitoring network:
Method Designation Number Method Code
Compendium Method for Toxic
Organics
Compendium
Method TO-15
150
7. Quality Assurance Status
FCEAP has recently implemented a more extensive quality assurance procedure to ensure that all air
monitoring data collected meets established criteria for precision and accuracy. FCEAP operates
according to EPA approved Quality Assurance Project Plans (QAPP) and Standard Operating
Procedures and will be updating and seeking EPA approval of the updated documents by the end of
2015. Staff members audit instrumentation on a scheduled basis to ensure that each instrument is
calibrated and operating properly. Data validation is performed monthly to ensure data reported by
each instrument is recorded accurately in the air quality monitoring database.
8. Scale of Representativeness
Each station in the monitoring network must be described in terms of the physical dimensions of the
air parcel nearest the monitoring station throughout which actual pollutant concentrations are
reasonably similar. Area dimensions or scales of representativeness used in the network description
are:
(a) Microscale - defines the concentration in air volumes associated with area dimensions
ranging from several meters up to about 100 meters.
(b) Middle scale - defines the concentration typical of areas up to several city blocks in size with
dimensions ranging from about 100 meters to 0.5 kilometers.
Page | 15
(c) Neighborhood scale – defines concentrations within an extended area of a city that has
relatively uniform land use with dimensions ranging from about 0.5 to 4.0 kilometers.
(d) Urban scale - defines an overall citywide condition with dimensions on the order of 4 to 50
kilometers.
(e) Regional Scale - defines air quality levels over areas having dimensions of 50 to hundreds of
kilometers.
Closely associated with the area around the monitoring station where pollutant concentrations are
reasonably similar are the basic monitoring exposures of the station. There are six basic exposures:
(a) Sites located to determine the highest concentrations expected to occur in the area covered
by the network.
(b) Sites located to determine representative concentrations in areas of high population density.
(c) Sites located to determine the impact on ambient pollution levels of significant sources or
source categories.
(d) Sites located to determine general background concentration levels.
(e) Sites located to determine the extent of regional pollutant transport among populated areas;
and in support of secondary standards.
(f) Sites located to measure air pollution impacts on visibility, vegetation damage, or other
welfare-based impacts.
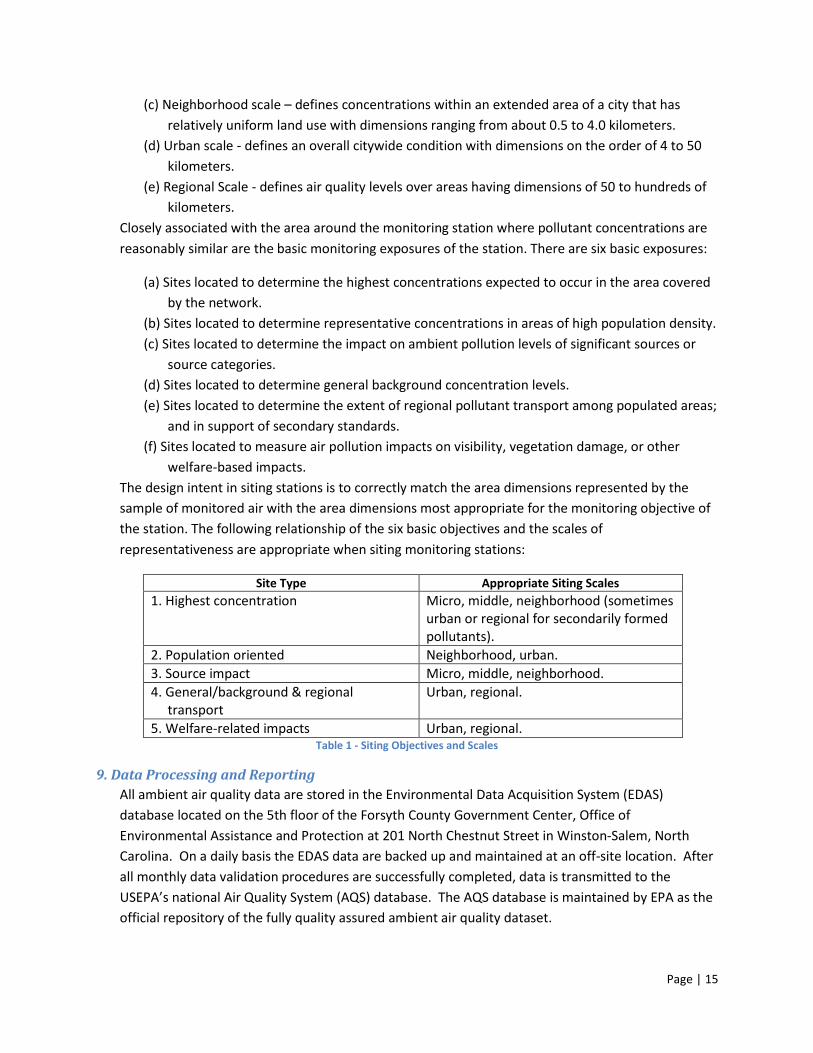
The design intent in siting stations is to correctly match the area dimensions represented by the
sample of monitored air with the area dimensions most appropriate for the monitoring objective of
the station. The following relationship of the six basic objectives and the scales of
representativeness are appropriate when siting monitoring stations:
Site Type Appropriate Siting Scales
1. Highest concentration Micro, middle, neighborhood (sometimes urban or regional for secondarily formed pollutants).
2. Population oriented Neighborhood, urban.
3. Source impact Micro, middle, neighborhood.
4. General/background & regional transport
Urban, regional.
5. Welfare-related impacts Urban, regional. Table 1 - Siting Objectives and Scales
9. Data Processing and Reporting
All ambient air quality data are stored in the Environmental Data Acquisition System (EDAS)
database located on the 5th floor of the Forsyth County Government Center, Office of
Environmental Assistance and Protection at 201 North Chestnut Street in Winston-Salem, North
Carolina. On a daily basis the EDAS data are backed up and maintained at an off-site location. After
all monthly data validation procedures are successfully completed, data is transmitted to the
USEPA’s national Air Quality System (AQS) database. The AQS database is maintained by EPA as the
official repository of the fully quality assured ambient air quality dataset.
Page | 16
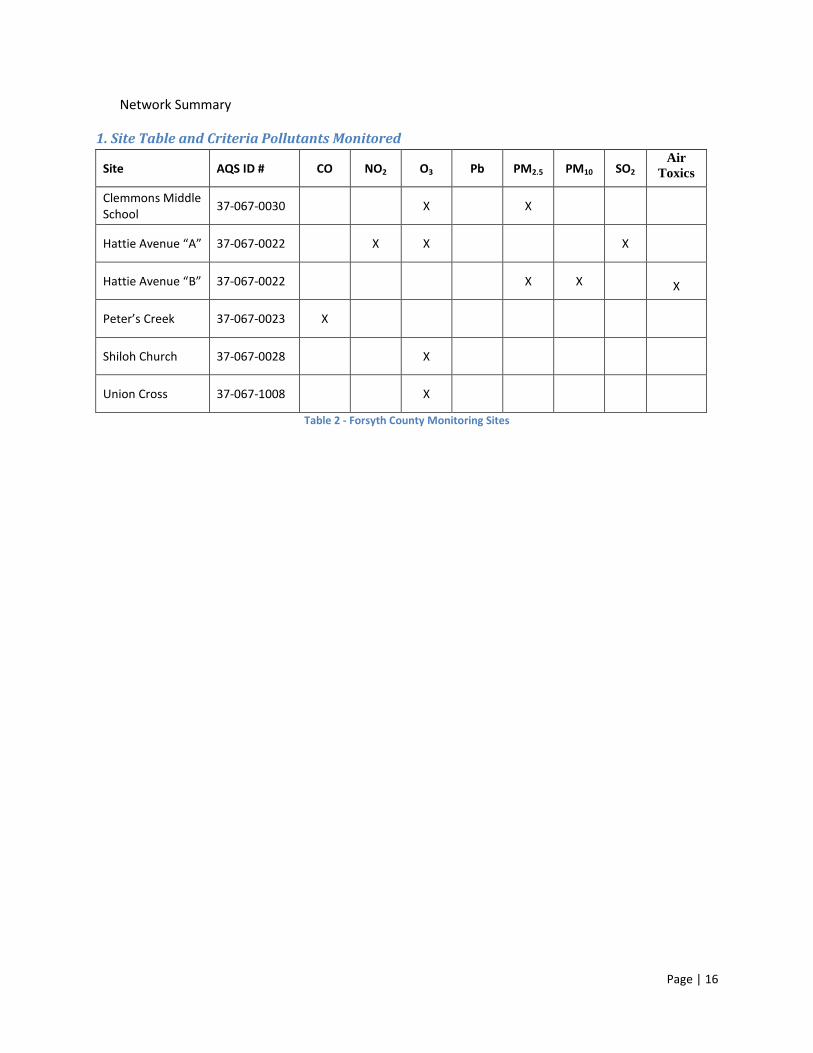
Network Summary
1. Site Table and Criteria Pollutants Monitored
Site AQS ID # CO NO2 O3 Pb PM2.5 PM10 SO2 Air
Toxics
Clemmons Middle School
37-067-0030 X X
Hattie Avenue “A” 37-067-0022 X X X
Hattie Avenue “B” 37-067-0022 X X
X
Peter’s Creek 37-067-0023 X
Shiloh Church 37-067-0028 X
Union Cross 37-067-1008 X
Table 2 - Forsyth County Monitoring Sites
Page | 17
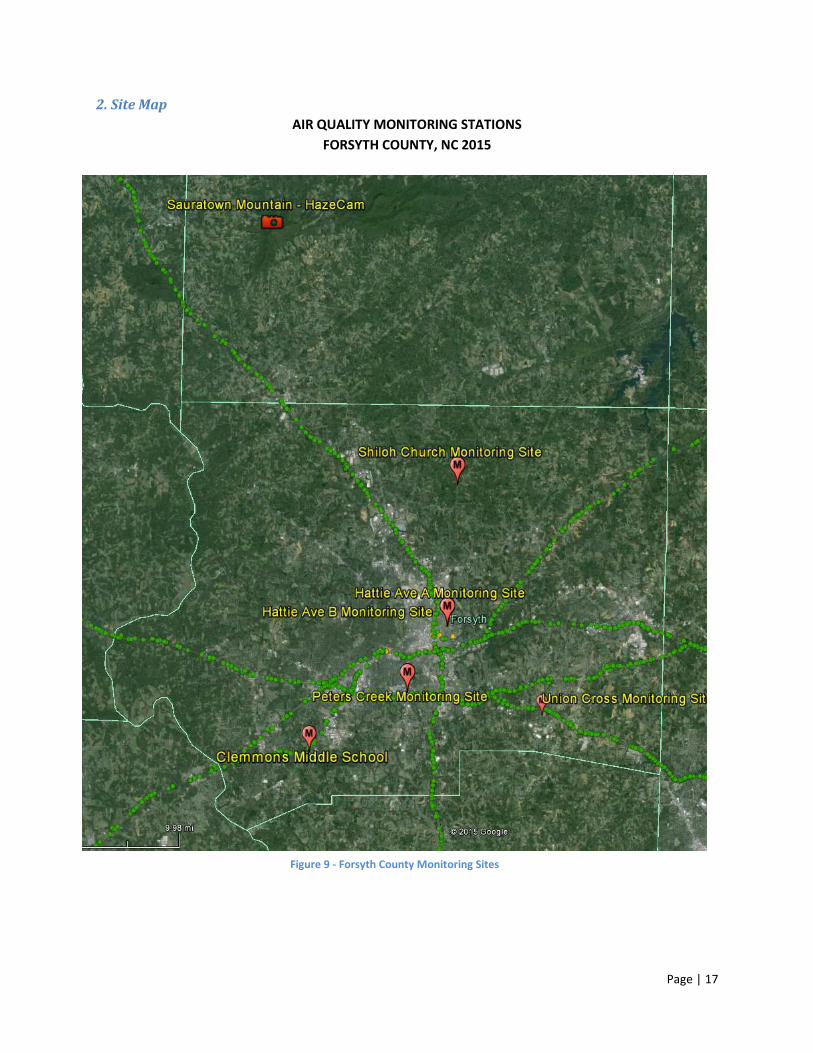
2. Site Map
AIR QUALITY MONITORING STATIONS
FORSYTH COUNTY, NC 2015
Figure 9 - Forsyth County Monitoring Sites
Page | 18
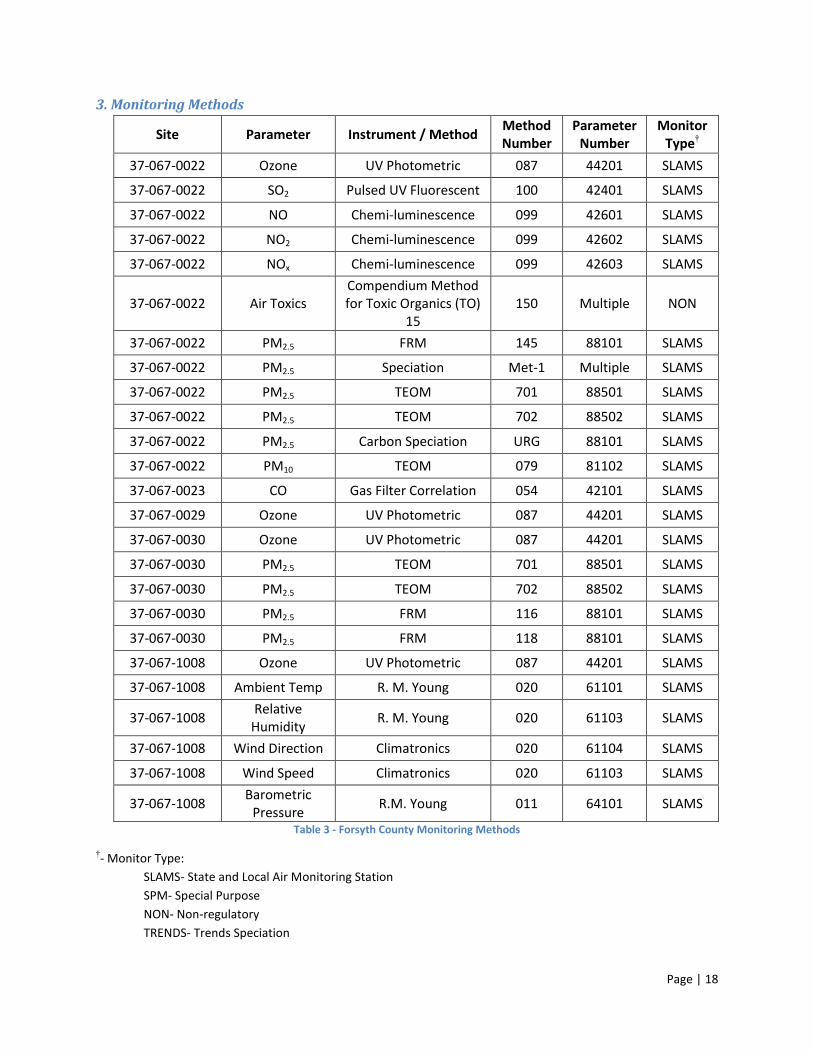
3. Monitoring Methods
Site Parameter Instrument / Method Method Number
Parameter Number
Monitor Type†
37-067-0022 Ozone UV Photometric 087 44201 SLAMS
37-067-0022 SO2 Pulsed UV Fluorescent 100 42401 SLAMS
37-067-0022 NO Chemi-luminescence 099 42601 SLAMS
37-067-0022 NO2 Chemi-luminescence 099 42602 SLAMS
37-067-0022 NOx Chemi-luminescence 099 42603 SLAMS
37-067-0022 Air Toxics Compendium Method for Toxic Organics (TO)
15 150 Multiple NON
37-067-0022 PM2.5 FRM 145 88101 SLAMS
37-067-0022 PM2.5 Speciation Met-1 Multiple SLAMS
37-067-0022 PM2.5 TEOM 701 88501 SLAMS
37-067-0022 PM2.5 TEOM 702 88502 SLAMS
37-067-0022 PM2.5 Carbon Speciation URG 88101 SLAMS
37-067-0022 PM10 TEOM 079 81102 SLAMS
37-067-0023 CO Gas Filter Correlation 054 42101 SLAMS
37-067-0029 Ozone UV Photometric 087 44201 SLAMS
37-067-0030 Ozone UV Photometric 087 44201 SLAMS
37-067-0030 PM2.5 TEOM 701 88501 SLAMS
37-067-0030 PM2.5 TEOM 702 88502 SLAMS
37-067-0030 PM2.5 FRM 116 88101 SLAMS
37-067-0030 PM2.5 FRM 118 88101 SLAMS
37-067-1008 Ozone UV Photometric 087 44201 SLAMS
37-067-1008 Ambient Temp R. M. Young 020 61101 SLAMS
37-067-1008 Relative
Humidity R. M. Young 020 61103 SLAMS
37-067-1008 Wind Direction Climatronics 020 61104 SLAMS
37-067-1008 Wind Speed Climatronics 020 61103 SLAMS
37-067-1008 Barometric
Pressure R.M. Young 011 64101 SLAMS
Table 3 - Forsyth County Monitoring Methods
†- Monitor Type:
SLAMS- State and Local Air Monitoring Station
SPM- Special Purpose
NON- Non-regulatory
TRENDS- Trends Speciation
Page | 19
Air Monitoring Station Descriptions
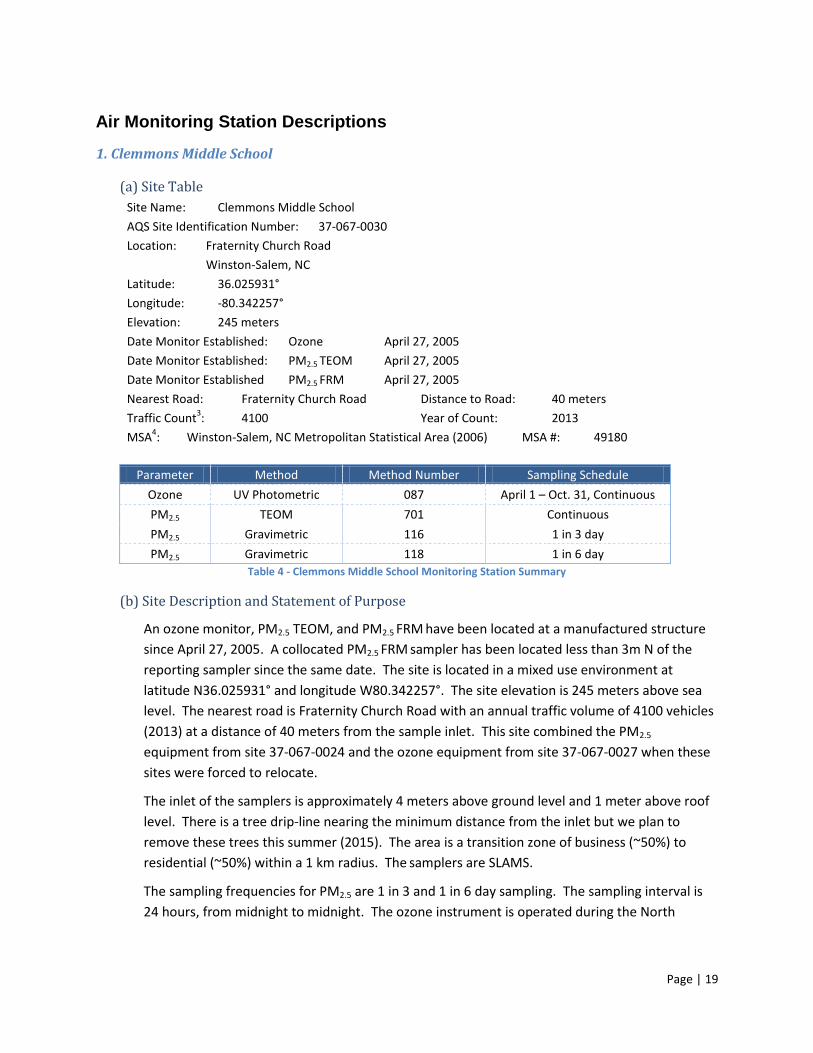
1. Clemmons Middle School
(a) Site Table
Site Name: Clemmons Middle School
AQS Site Identification Number: 37-067-0030
Location: Fraternity Church Road
Winston-Salem, NC
Latitude: 36.025931°
Longitude: -80.342257°
Elevation: 245 meters
Date Monitor Established: Ozone April 27, 2005
Date Monitor Established: PM2.5 TEOM April 27, 2005
Date Monitor Established PM2.5 FRM April 27, 2005
Nearest Road: Fraternity Church Road Distance to Road: 40 meters
Traffic Count3: 4100 Year of Count: 2013
MSA4: Winston-Salem, NC Metropolitan Statistical Area (2006) MSA #: 49180
Parameter Method Method Number Sampling Schedule
Ozone UV Photometric 087 April 1 – Oct. 31, Continuous
PM2.5 TEOM 701 Continuous
PM2.5 Gravimetric 116 1 in 3 day
PM2.5 Gravimetric 118 1 in 6 day
Table 4 - Clemmons Middle School Monitoring Station Summary
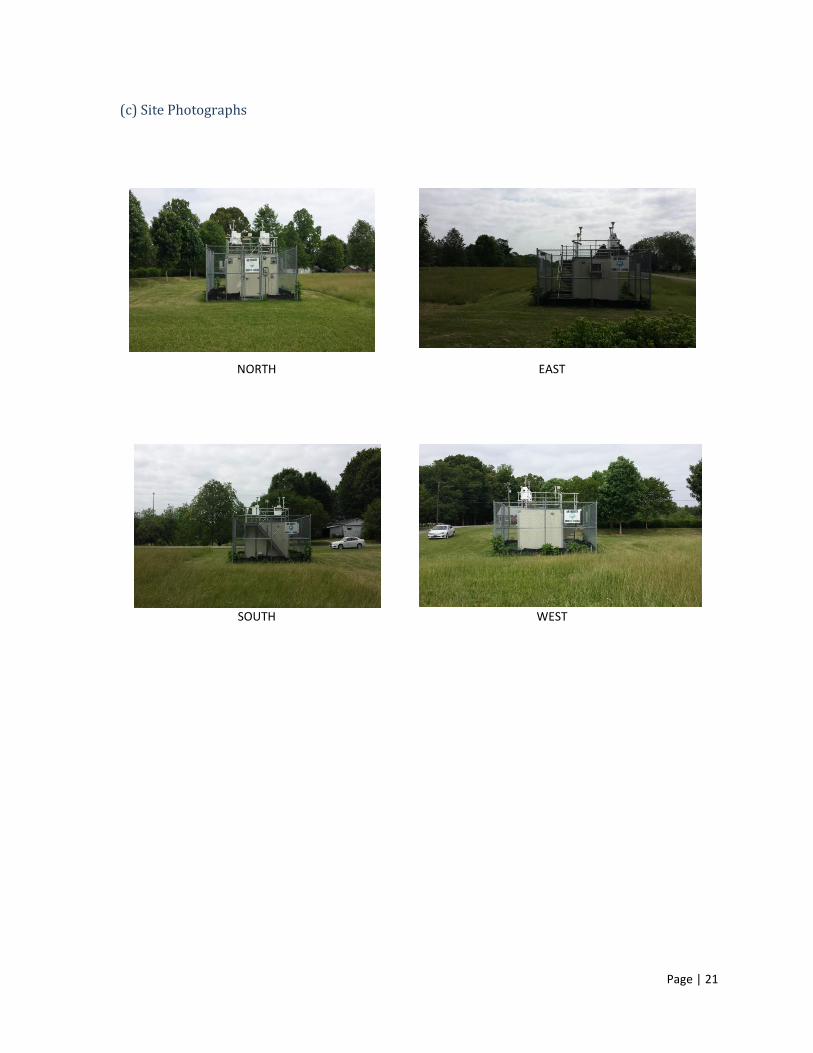
(b) Site Description and Statement of Purpose
An ozone monitor, PM2.5 TEOM, and PM2.5 FRM have been located at a manufactured structure
since April 27, 2005. A collocated PM2.5 FRM sampler has been located less than 3m N of the
reporting sampler since the same date. The site is located in a mixed use environment at
latitude N36.025931° and longitude W80.342257°. The site elevation is 245 meters above sea
level. The nearest road is Fraternity Church Road with an annual traffic volume of 4100 vehicles
(2013) at a distance of 40 meters from the sample inlet. This site combined the PM2.5
equipment from site 37-067-0024 and the ozone equipment from site 37-067-0027 when these
sites were forced to relocate.
The inlet of the samplers is approximately 4 meters above ground level and 1 meter above roof
level. There is a tree drip-line nearing the minimum distance from the inlet but we plan to
remove these trees this summer (2015). The area is a transition zone of business (~50%) to
residential (~50%) within a 1 km radius. The samplers are SLAMS.
The sampling frequencies for PM2.5 are 1 in 3 and 1 in 6 day sampling. The sampling interval is
24 hours, from midnight to midnight. The ozone instrument is operated during the North
Page | 20
Carolina ozone monitoring season which begins April 1 and ends October 31 (beginning 2016,
March 1- October 31). The ozone instrument operates continuously during this period.
The site complies with the siting requirements of 40CFR58 for criteria air pollutants but based
on historical data for the FRM 2.5, both 3 and 6 day samplers, and lab staffing limitations at the
state of NC, our agency would like to cease operation of both samplers on December 31, 2015.
The co-location requirement of 40CFR58 would then have to be satisfied by adding a co-located
6 day sampler at the Hattie Ave. location.
OBJECTIVE AND SPATIAL SCALE
The monitoring objectives of the instruments are to measure: 1) upwind background
ambient concentrations and 2) population exposure.
The site is a neighborhood spatial scale for ozone and PM2.5. Data from this site is used to
assess compliance with the NAAQS for ozone and PM2.5.
The site is located in the Winston-Salem, NC Metropolitan Statistical Area4. The principal cities and counties in the MSA are Winston-Salem, Davidson County, Davie County, Forsyth County, Stokes County, and Yadkin County, NC.
Page | 21
(c) Site Photographs
NORTH EAST
SOUTH WEST
Page | 22
2. Hattie Avenue “A”
(a) Site Table
Site Name: Hattie Avenue “A”
AQS Site Identification Number: 37-067-0022
Location: 1300 Hattie Avenue
Winston-Salem, NC
Latitude: 36.110941°
Longitude: -80.224423°
Elevation: 284 meters
Date Monitor Established: Ozone May 21, 1993
Date Monitor Established: NO2 January 1, 1984
Date Monitor Established SO2 January 1, 1983
Nearest Road: Hattie Avenue Distance to Road: 27 meters
Traffic Count3: 6000 Year of Count: 2013
MSA4: Winston-Salem, NC Metropolitan Statistical Area (2006) MSA #: 49180
Parameter Method Method Number Sampling Schedule
Ozone UV Photometric 087 Continuous
NO2 Chemiluminescence 099 Continuous
SO2 UV Pulsed Fluorescence 100 Continuous
Table 5 - Hattie Avenue "A" Monitoring Station Summary
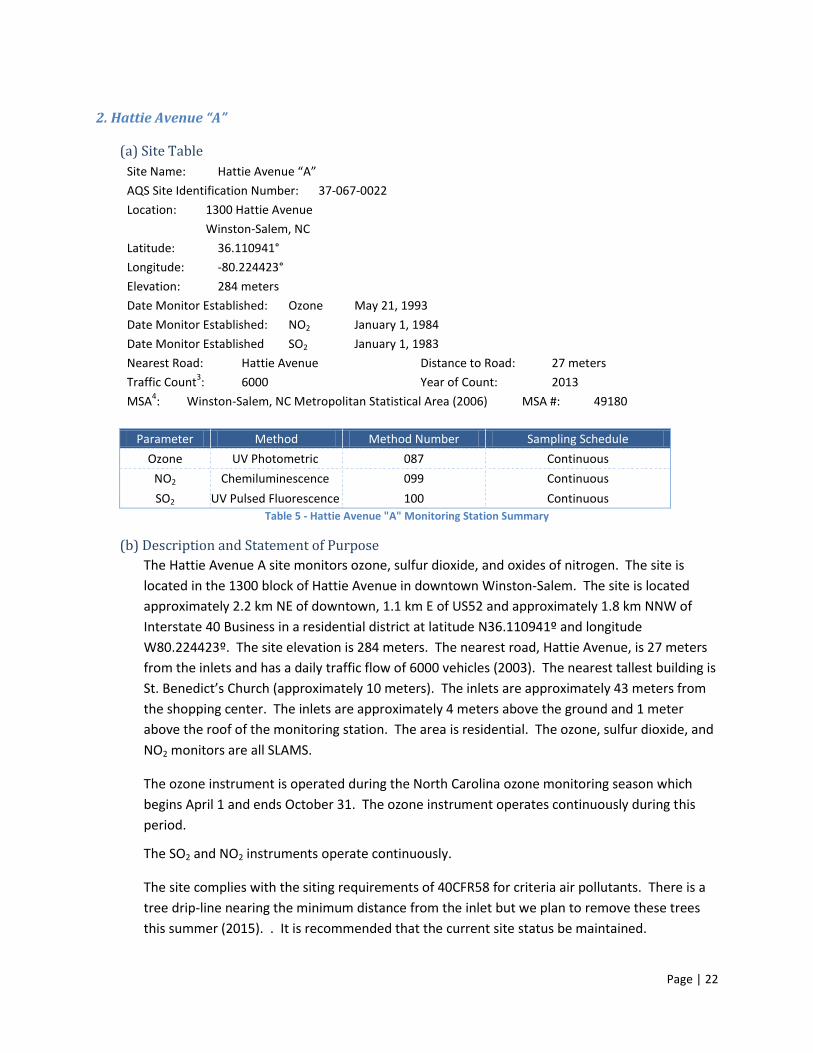
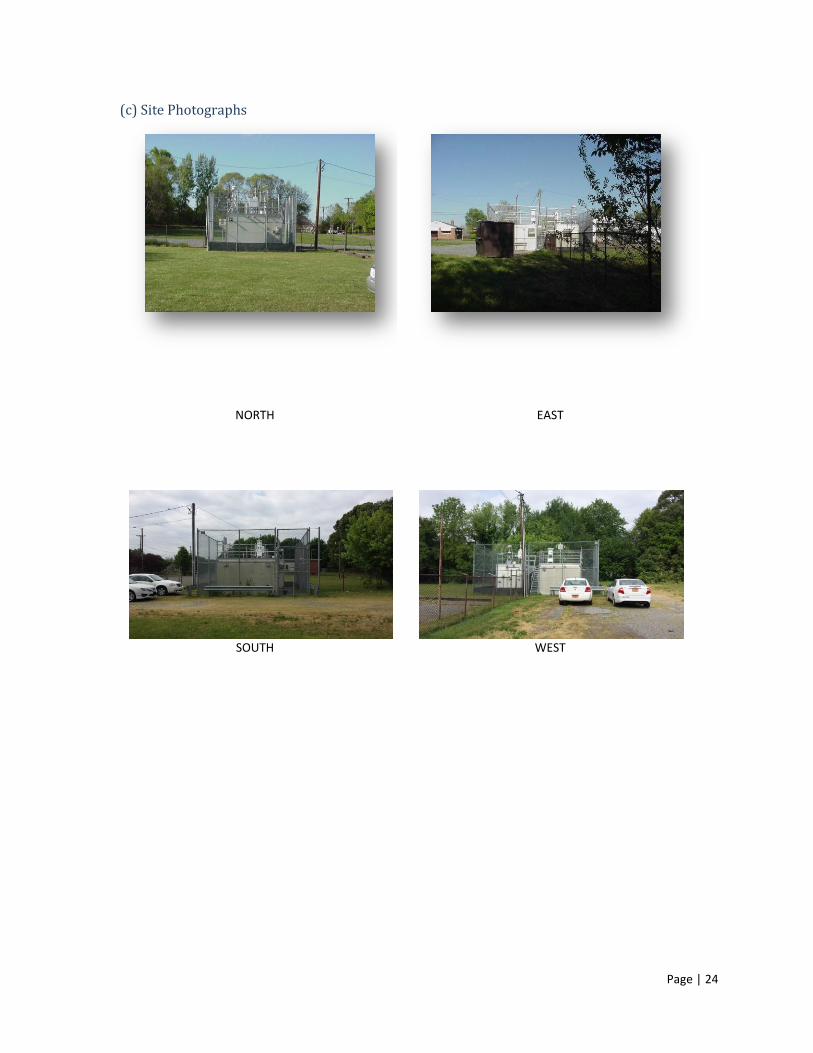
(b) Description and Statement of Purpose
The Hattie Avenue A site monitors ozone, sulfur dioxide, and oxides of nitrogen. The site is
located in the 1300 block of Hattie Avenue in downtown Winston-Salem. The site is located
approximately 2.2 km NE of downtown, 1.1 km E of US52 and approximately 1.8 km NNW of
Interstate 40 Business in a residential district at latitude N36.110941º and longitude
W80.224423º. The site elevation is 284 meters. The nearest road, Hattie Avenue, is 27 meters
from the inlets and has a daily traffic flow of 6000 vehicles (2003). The nearest tallest building is
St. Benedict’s Church (approximately 10 meters). The inlets are approximately 43 meters from
the shopping center. The inlets are approximately 4 meters above the ground and 1 meter
above the roof of the monitoring station. The area is residential. The ozone, sulfur dioxide, and
NO2 monitors are all SLAMS.
The ozone instrument is operated during the North Carolina ozone monitoring season which
begins April 1 and ends October 31. The ozone instrument operates continuously during this
period.
The SO2 and NO2 instruments operate continuously.
The site complies with the siting requirements of 40CFR58 for criteria air pollutants. There is a
tree drip-line nearing the minimum distance from the inlet but we plan to remove these trees
this summer (2015). . It is recommended that the current site status be maintained.
Page | 23
OBJECTIVE AND SPATIAL SCALE
The monitoring objectives of the instruments are to measure: 1) background ambient
concentrations and 2) population exposure.
The site is a neighborhood spatial scale. Data from this site is used to assess compliance with
the NAAQS for ozone, sulfur dioxide, and nitrogen dioxide.
The site is located in the Winston-Salem, NC Metropolitan Statistical Area4. The principal cities and counties in the MSA are Winston-Salem, Davidson County, Davie County, Forsyth County, Stokes County, and Yadkin County, NC.
Page | 24
(c) Site Photographs
NORTH EAST
SOUTH WEST
Page | 25
3. Hattie Avenue “B”
(a) Site Table
Site Name: Hattie Avenue “B”
AQS Site Identification Number: 37-067-0022
Location: 1300 Hattie Avenue
Winston-Salem, NC
Latitude: 36.110892°
Longitude: -80.224432°
Elevation: 284 meters
Date Monitor Established: PM2.5 - FRM January 1, 1999
Date Monitor Established: PM2.5 - Speciation January 1, 1999
Date Monitor Established PM2.5 - TEOM June 16, 1999
Date Monitor Established PM10 - TEOM October 18, 1999
Nearest Road: Hattie Avenue Distance to Road: 27 meters
Traffic Count3: 6000 Year of Count: 2013
MSA4: Winston-Salem, NC Metropolitan Statistical Area (2006) MSA #: 49180
Parameter Method Method Number Sampling Schedule
PM2.5 FRM Gravimetric 118 1 in 1 day
PM2.5 MetOne, Speciation 701 1 in 6 day
PM2.5 TEOM, Continuous 701, 702 Continuous
PM10 TEOM, Continuous 079 Continuous
Air Toxics Compendium Method for
Toxic Organics (TO) 15 150 1 in 6 day
Table 6 - Hattie Avenue "B" Monitoring Station Summary
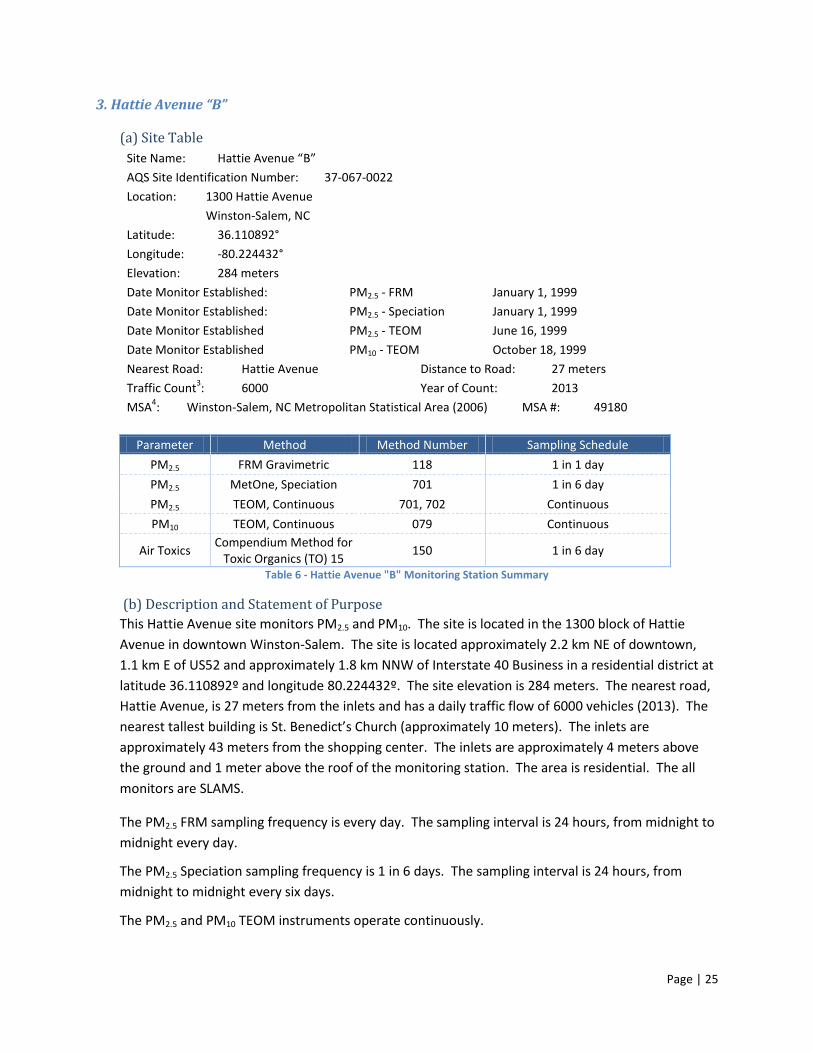
(b) Description and Statement of Purpose
This Hattie Avenue site monitors PM2.5 and PM10. The site is located in the 1300 block of Hattie
Avenue in downtown Winston-Salem. The site is located approximately 2.2 km NE of downtown,
1.1 km E of US52 and approximately 1.8 km NNW of Interstate 40 Business in a residential district at
latitude 36.110892º and longitude 80.224432º. The site elevation is 284 meters. The nearest road,
Hattie Avenue, is 27 meters from the inlets and has a daily traffic flow of 6000 vehicles (2013). The
nearest tallest building is St. Benedict’s Church (approximately 10 meters). The inlets are
approximately 43 meters from the shopping center. The inlets are approximately 4 meters above
the ground and 1 meter above the roof of the monitoring station. The area is residential. The all
monitors are SLAMS.
The PM2.5 FRM sampling frequency is every day. The sampling interval is 24 hours, from midnight to
midnight every day.
The PM2.5 Speciation sampling frequency is 1 in 6 days. The sampling interval is 24 hours, from
midnight to midnight every six days.
The PM2.5 and PM10 TEOM instruments operate continuously.
Page | 26
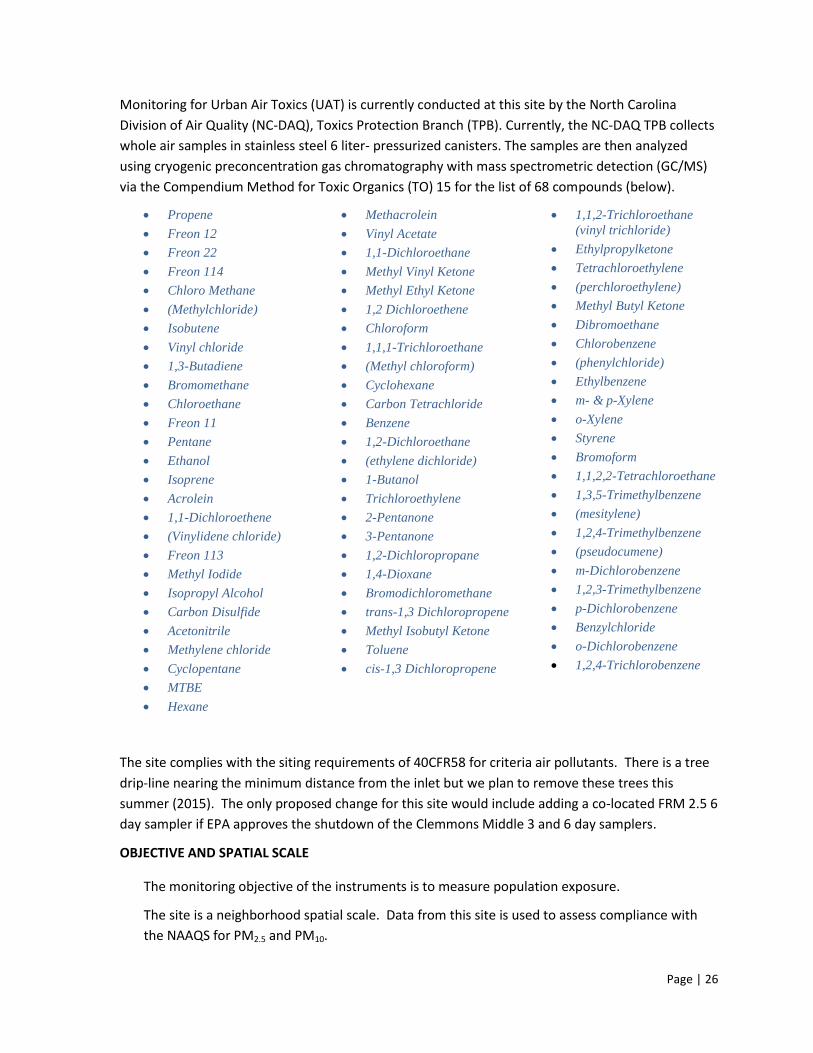
Monitoring for Urban Air Toxics (UAT) is currently conducted at this site by the North Carolina
Division of Air Quality (NC-DAQ), Toxics Protection Branch (TPB). Currently, the NC-DAQ TPB collects
whole air samples in stainless steel 6 liter- pressurized canisters. The samples are then analyzed
using cryogenic preconcentration gas chromatography with mass spectrometric detection (GC/MS)
via the Compendium Method for Toxic Organics (TO) 15 for the list of 68 compounds (below).
Propene
Freon 12
Freon 22
Freon 114
Chloro Methane
(Methylchloride)
Isobutene
Vinyl chloride
1,3-Butadiene
Bromomethane
Chloroethane
Freon 11
Pentane
Ethanol
Isoprene
Acrolein
1,1-Dichloroethene
(Vinylidene chloride)
Freon 113
Methyl Iodide
Isopropyl Alcohol
Carbon Disulfide
Acetonitrile
Methylene chloride
Cyclopentane
MTBE
Hexane
Methacrolein
Vinyl Acetate
1,1-Dichloroethane
Methyl Vinyl Ketone
Methyl Ethyl Ketone
1,2 Dichloroethene
Chloroform
1,1,1-Trichloroethane
(Methyl chloroform)
Cyclohexane
Carbon Tetrachloride
Benzene
1,2-Dichloroethane
(ethylene dichloride)
1-Butanol
Trichloroethylene
2-Pentanone
3-Pentanone
1,2-Dichloropropane
1,4-Dioxane
Bromodichloromethane
trans-1,3 Dichloropropene
Methyl Isobutyl Ketone
Toluene
cis-1,3 Dichloropropene
1,1,2-Trichloroethane
(vinyl trichloride)
Ethylpropylketone
Tetrachloroethylene
(perchloroethylene)
Methyl Butyl Ketone
Dibromoethane
Chlorobenzene
(phenylchloride)
Ethylbenzene
m- & p-Xylene
o-Xylene
Styrene
Bromoform
1,1,2,2-Tetrachloroethane
1,3,5-Trimethylbenzene
(mesitylene)
1,2,4-Trimethylbenzene
(pseudocumene)
m-Dichlorobenzene
1,2,3-Trimethylbenzene
p-Dichlorobenzene
Benzylchloride
o-Dichlorobenzene
1,2,4-Trichlorobenzene
The site complies with the siting requirements of 40CFR58 for criteria air pollutants. There is a tree
drip-line nearing the minimum distance from the inlet but we plan to remove these trees this
summer (2015). The only proposed change for this site would include adding a co-located FRM 2.5 6
day sampler if EPA approves the shutdown of the Clemmons Middle 3 and 6 day samplers.
OBJECTIVE AND SPATIAL SCALE
The monitoring objective of the instruments is to measure population exposure.
The site is a neighborhood spatial scale. Data from this site is used to assess compliance with
the NAAQS for PM2.5 and PM10.
Page | 27
The site is located in the Winston-Salem, NC Metropolitan Statistical Area4. The principal cities
and counties in the MSA are Winston-Salem, Davidson County, Davie County, Forsyth County,
Stokes County, and Yadkin County, NC.
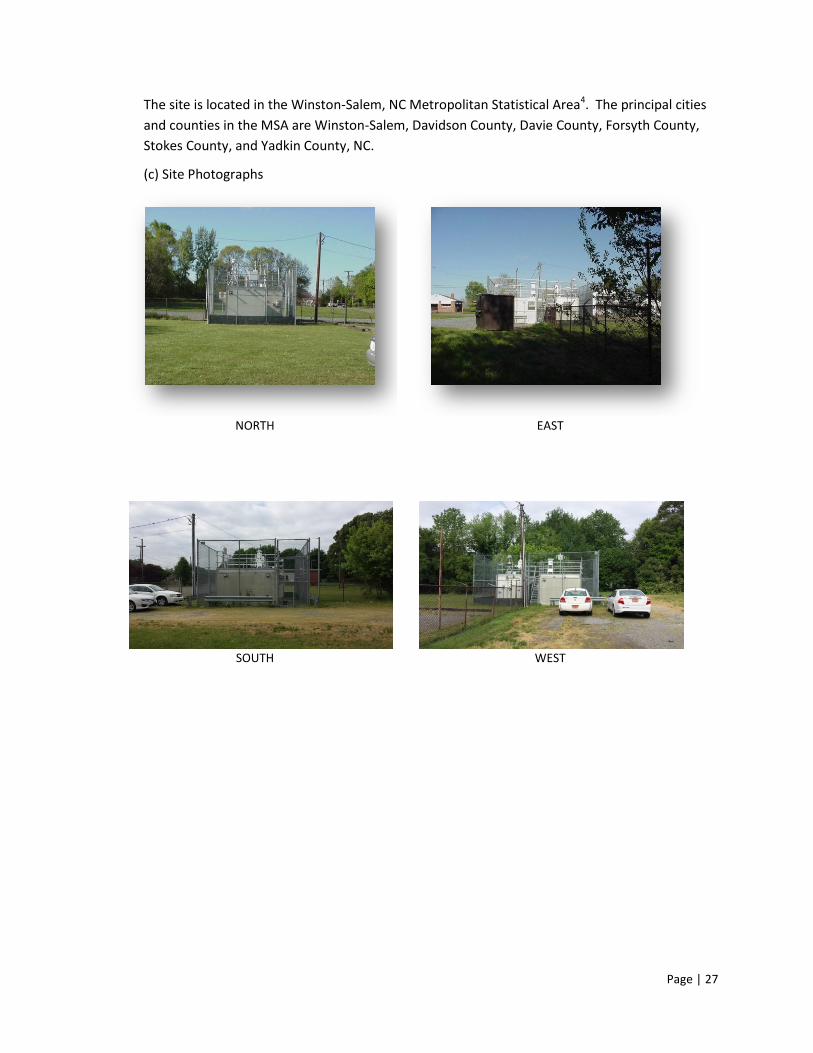
(c) Site Photographs
NORTH EAST
SOUTH WEST
Page | 28
4. Peter’s Creek
(a) Site Table
Site Name: Peter’s Creek
AQS Site Identification Number: 37-067-0023
Location: 1401 Corporation Parkway
Winston-Salem, NC
Latitude: 36.066479°
Longitude: -80.258455°
Elevation: 233 meters
Date Monitor Established: CO November 14, 1988
Nearest Road: Peter’s Creek Parkway Distance to Road: 6 meters
Traffic Count3: 25000 Year of Count: 2013
MSA4: Winston-Salem, NC Metropolitan Statistical Area (2006) MSA #: 49180
Parameter Method Method Number Sampling Schedule
CO Gas Filter Correlation 554 Continuous
Table 7 - Peter's Creek Monitoring Station Summary
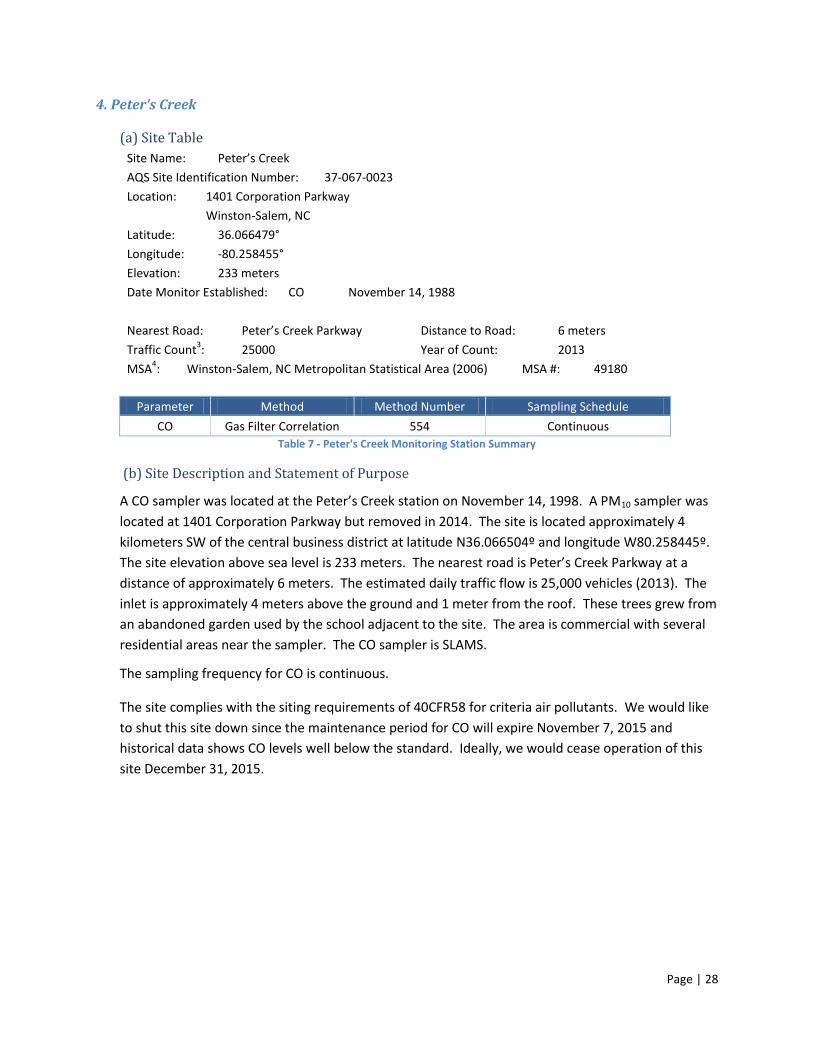
(b) Site Description and Statement of Purpose
A CO sampler was located at the Peter’s Creek station on November 14, 1998. A PM10 sampler was
located at 1401 Corporation Parkway but removed in 2014. The site is located approximately 4
kilometers SW of the central business district at latitude N36.066504º and longitude W80.258445º.
The site elevation above sea level is 233 meters. The nearest road is Peter’s Creek Parkway at a
distance of approximately 6 meters. The estimated daily traffic flow is 25,000 vehicles (2013). The
inlet is approximately 4 meters above the ground and 1 meter from the roof. These trees grew from
an abandoned garden used by the school adjacent to the site. The area is commercial with several
residential areas near the sampler. The CO sampler is SLAMS.
The sampling frequency for CO is continuous.
The site complies with the siting requirements of 40CFR58 for criteria air pollutants. We would like
to shut this site down since the maintenance period for CO will expire November 7, 2015 and
historical data shows CO levels well below the standard. Ideally, we would cease operation of this
site December 31, 2015.

Page | 29
OBJECTIVE AND SPATIAL SCALE
The monitoring objective of the Peter’s Creek site is population exposure. The site is a micro
spatial scale. Data is used to assess trends and compliance to the NAAQS.
The site is located in the Winston-Salem, NC Metropolitan Statistical Area4. The principal cities and counties in the MSA are Winston-Salem, Davidson County, Davie County, Forsyth County, Stokes County, and Yadkin County, NC.
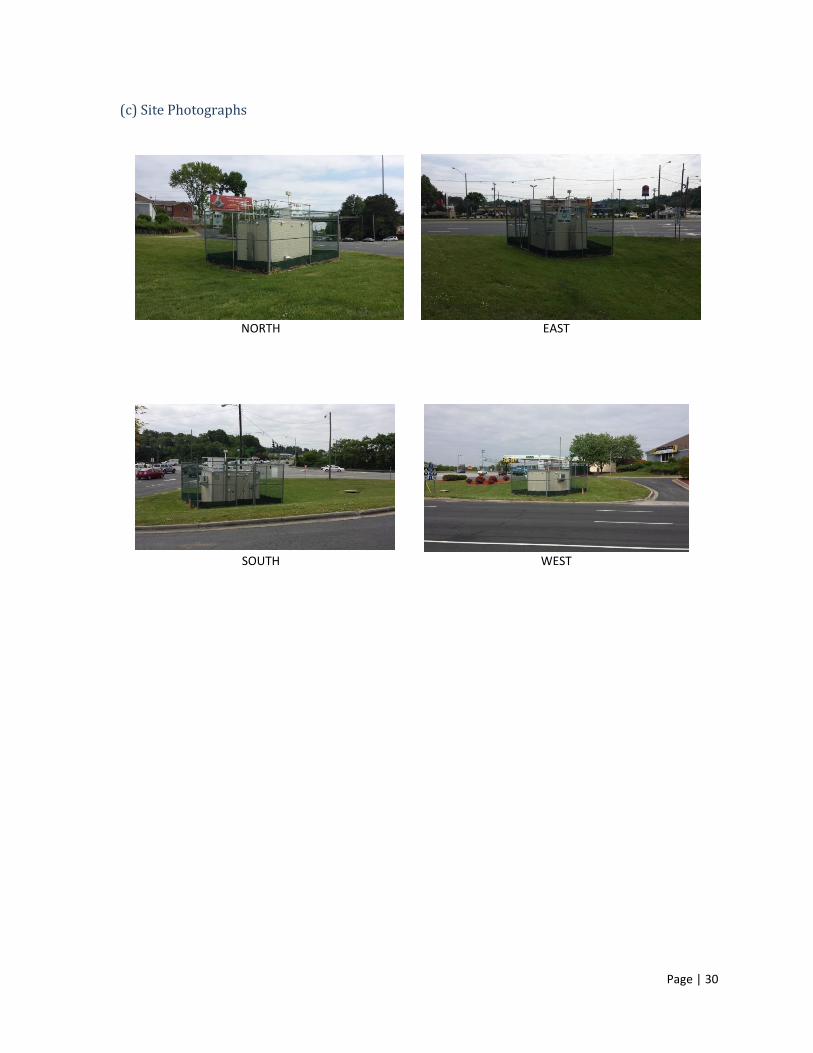
Page | 30
(c) Site Photographs
NORTH EAST
SOUTH WEST
Page | 31
5. Shiloh Church
(a) Site Table
Site Name: Shiloh Church
AQS Site Identification Number: 37-067-0028
Location: 6496 Baux Mountain Road
Winston-Salem, NC
Latitude: 36.205789°
Longitude: -80.215774°
Elevation: 294 meters
Date Monitor Established: Ozone April 1, 1996
Nearest Road: Baux Mountain Rd Distance to Road: 20 meters
Traffic Count3: 2600 Year of Count: 2013
MSA4: Winston-Salem, NC Metropolitan Statistical Area (2006) MSA #: 49180
Parameter Method Method Number Sampling Schedule
Ozone UV Photometry 087 Continuous
Table 8 - Shiloh Church Monitoring Station Summary
(b) Site Description and Statement of Purpose
An ozone monitor has been located at this site since April 1, 1996. The site is located approximately
12 km NNE of the central business district at latitude 36.205789°and longitude -80.215774°. The
site elevation is 294 meters above sea level. The nearest road is Baux Mountain Road with an
annual traffic volume of 2600 vehicles (2013) at a distance of 20 meters from the sample inlet.
The inlet is approximately 4 meters above the ground and 1 meter from the roof. The area is
residential. The ozone sampler is SLAMS.
The ozone instrument is operated during the North Carolina ozone monitoring season which begins
April 1 and ends October 31. The ozone instrument operates continuously during this period.
The site complies with the siting requirements of 40CFR58 for criteria air pollutants. We are
planning on shutting down this site at the end of the ozone season (October 31, 2015). There is no
reason for us to be running four ozone sites within our county and this site’s design value has
consistently been several ppb less than the other three sites.
OBJECTIVE AND SPATIAL SCALE
The monitoring objective of the instrument is to measure population exposure.
The site is a neighborhood spatial scale for ozone. Data from this site is used to assess
compliance with the NAAQS for ozone.
The site is located in the Winston-Salem, NC Metropolitan Statistical Area4. The principal cities and counties in the MSA are Winston-Salem, Davidson County, Davie County, Forsyth County, Stokes County, and Yadkin County, NC.
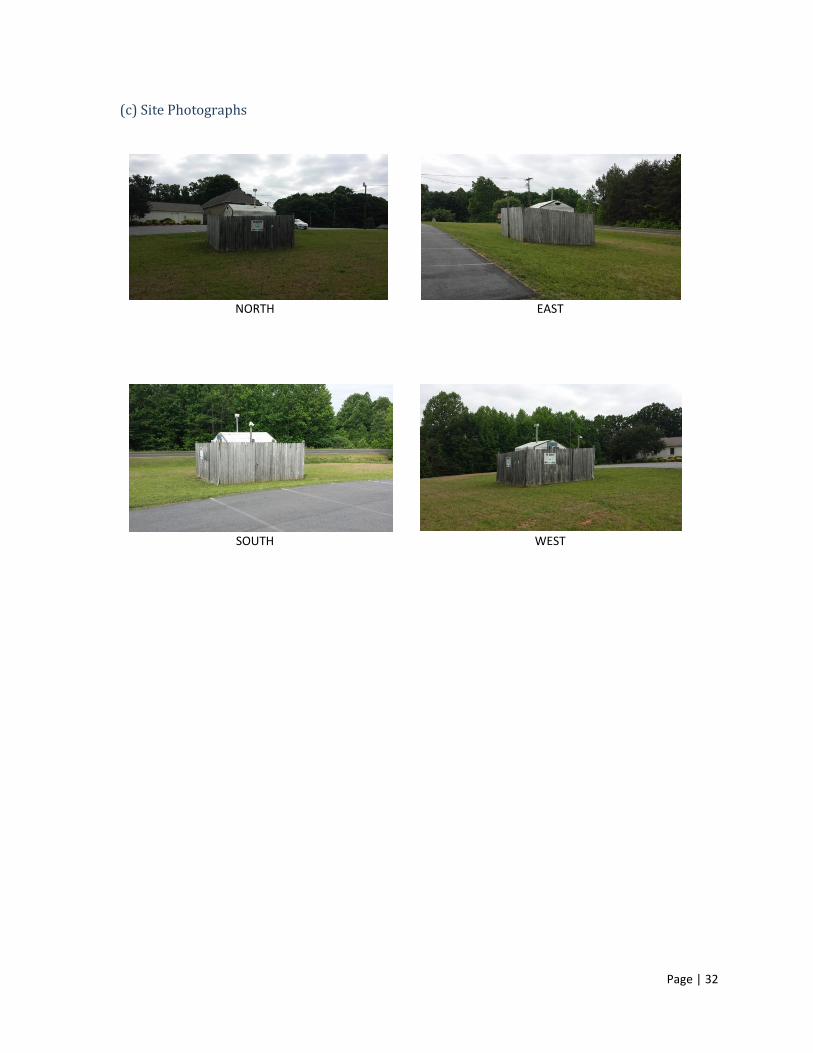
Page | 32
(c) Site Photographs
NORTH EAST
SOUTH WEST
Page | 33
6. Union Cross
(a) Site Table
Site Name: Union Cross
AQS Site Identification Number: 37-067-1008
Location: 3656 Piedmont Memorial Drive
Winston-Salem, NC
Latitude: 36.050746°
Longitude: -80.143826°
Elevation: 285 meters
Date Monitor Established: Ozone April 1, 1998
Nearest Road: Piedmont Memorial Dr. Distance to Road: 55 meters
Traffic Count3: 650 Year of Count: 2011
MSA4: Winston-Salem, NC Metropolitan Statistical Area (2006) MSA #: 49180
Parameter Method Method Number Sampling Schedule
Ozone UV Photometry 087 Continuous
Wind Speed Climatronics 020 Continuous
Wind Direction Climatronics 020 Continuous
Pressure R. M. Young 011 Continuous
Outdoor Temperature R. M. Young 020 Continuous
Relative Humidity R. M. Young 020 Continuous
Table 9 - Union Cross Monitoring Station Summary
(b) Site Description and Statement of Purpose
An ozone monitor has been located at this site since April 1, 1998 along with a meteorological tower
since 1997. The site is located approximately 10 km SE of the central business district at latitude
36.050746° and longitude -80.143826°. The site elevation is 285 meters above sea level. The
nearest road is Piedmont Memorial Drive with an annual traffic volume of 650 vehicles (2011) at a
distance of 55 meters from the sample inlet.
The inlet is approximately 4 meters above the ground and 1 meter from the roof. There is a tree
drip-line nearing the minimum distance from the inlet but we plan to remove these trees this
summer (2015). The area is residential. The ozone sampler is SLAMS.
The ozone instrument is operated during the North Carolina ozone monitoring season which begins
April 1 and ends October 31. The ozone instrument operates continuously during this period.
The site complies with the siting requirements of 40CFR58 for criteria air pollutants. There are no
proposed changes for this site. It is recommended that the current site status be maintained.
Page | 34
OBJECTIVE AND SPATIAL SCALE
The monitoring objective of the instrument is to measure population exposure.
The site is a neighborhood spatial scale for ozone. Data from this site is used to assess
compliance with the NAAQS for ozone.
The site is located in the Winston-Salem, NC Metropolitan Statistical Area4. The principal cities and counties in the MSA are Winston-Salem, Davidson County, Davie County, Forsyth County, Stokes County, and Yadkin County, NC.
Page | 35
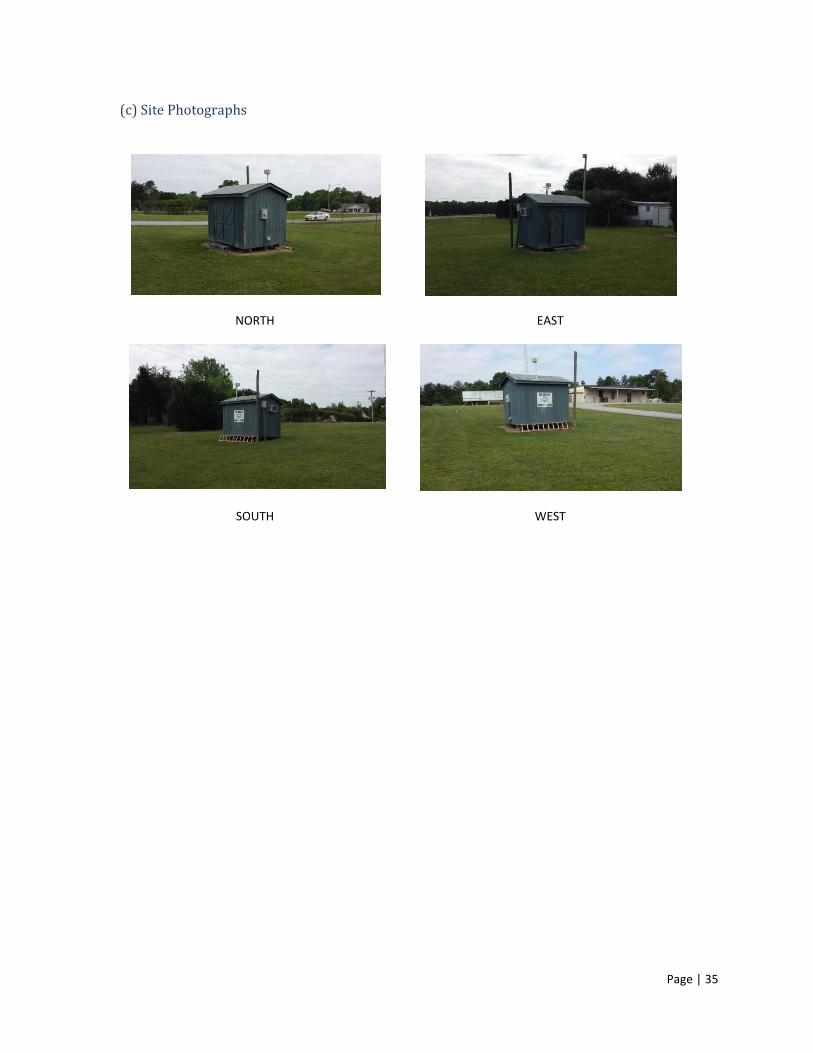
(c) Site Photographs
NORTH
EAST
SOUTH WEST
Page | 36
Statistical Analysis
Trends Air quality trends across Forsyth County have shown improvement over the last several years. This has
been accomplished using local regulations, state mandates, and Federal programs to improve air quality
while balancing economic growth in the County. Businesses have contributed to this improvement as
they build in efficiencies in their operations and implement pollution prevention measures such as
recycling, reformulation, more efficient work practices, and transitioning their energy usage to utilize
cleaner fuels. Although levels of ozone and particle pollution continue to be potential issues in the area,
other pollutants have dropped well below the EPA standards. For example, recorded concentrations of
lead and carbon monoxide have fallen so far below the National Standards that monitoring for these
pollutants is no longer justifiable. Other monitoring sites have been combined with existing sites to help
maximize use of staff and resources while maintaining an adequate network for AQI forecasting and
public awareness.
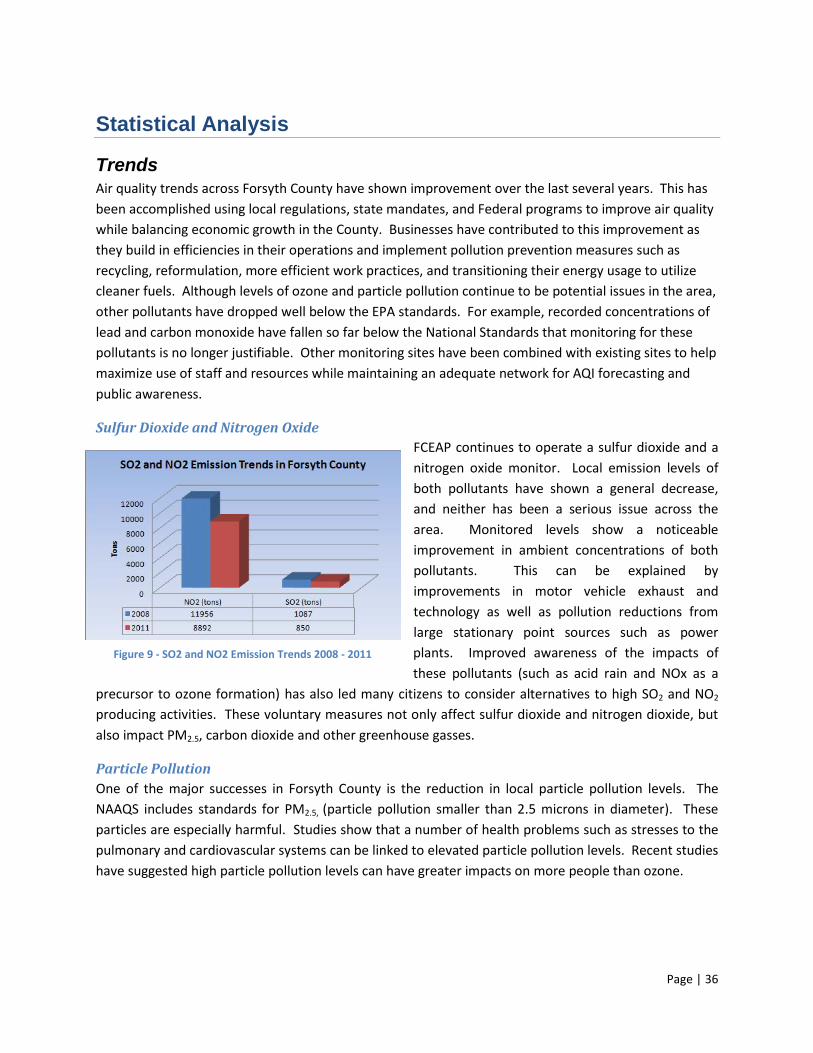
Sulfur Dioxide and Nitrogen Oxide
FCEAP continues to operate a sulfur dioxide and a
nitrogen oxide monitor. Local emission levels of
both pollutants have shown a general decrease,
and neither has been a serious issue across the
area. Monitored levels show a noticeable
improvement in ambient concentrations of both
pollutants. This can be explained by
improvements in motor vehicle exhaust and
technology as well as pollution reductions from
large stationary point sources such as power
plants. Improved awareness of the impacts of
these pollutants (such as acid rain and NOx as a
precursor to ozone formation) has also led many citizens to consider alternatives to high SO2 and NO2
producing activities. These voluntary measures not only affect sulfur dioxide and nitrogen dioxide, but
also impact PM2.5, carbon dioxide and other greenhouse gasses.
Particle Pollution
One of the major successes in Forsyth County is the reduction in local particle pollution levels. The
NAAQS includes standards for PM2.5, (particle pollution smaller than 2.5 microns in diameter). These
particles are especially harmful. Studies show that a number of health problems such as stresses to the
pulmonary and cardiovascular systems can be linked to elevated particle pollution levels. Recent studies
have suggested high particle pollution levels can have greater impacts on more people than ozone.
Figure 9 - SO2 and NO2 Emission Trends 2008 - 2011
Page | 37
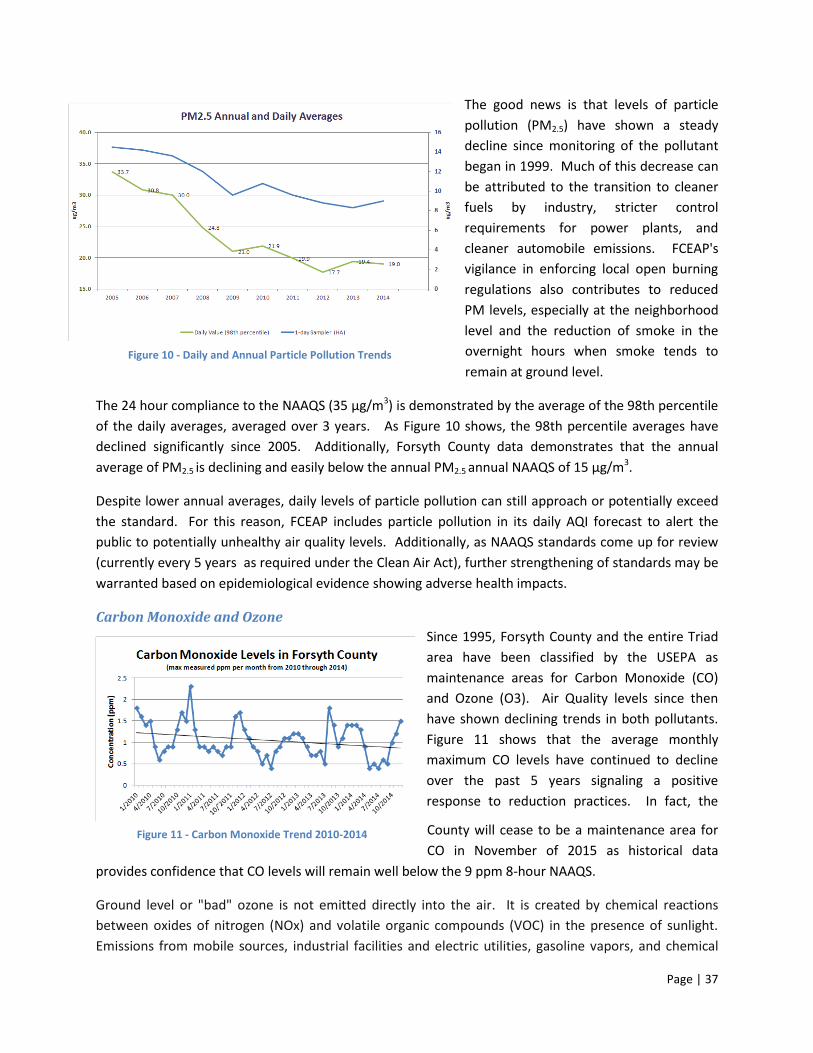
The good news is that levels of particle
pollution (PM2.5) have shown a steady
decline since monitoring of the pollutant
began in 1999. Much of this decrease can
be attributed to the transition to cleaner
fuels by industry, stricter control
requirements for power plants, and
cleaner automobile emissions. FCEAP's
vigilance in enforcing local open burning
regulations also contributes to reduced
PM levels, especially at the neighborhood
level and the reduction of smoke in the
overnight hours when smoke tends to
remain at ground level.
The 24 hour compliance to the NAAQS (35 µg/m3) is demonstrated by the average of the 98th percentile
of the daily averages, averaged over 3 years. As Figure 10 shows, the 98th percentile averages have
declined significantly since 2005. Additionally, Forsyth County data demonstrates that the annual
average of PM2.5 is declining and easily below the annual PM2.5 annual NAAQS of 15 µg/m3.
Despite lower annual averages, daily levels of particle pollution can still approach or potentially exceed
the standard. For this reason, FCEAP includes particle pollution in its daily AQI forecast to alert the
public to potentially unhealthy air quality levels. Additionally, as NAAQS standards come up for review
(currently every 5 years as required under the Clean Air Act), further strengthening of standards may be
warranted based on epidemiological evidence showing adverse health impacts.
Carbon Monoxide and Ozone
Since 1995, Forsyth County and the entire Triad
area have been classified by the USEPA as
maintenance areas for Carbon Monoxide (CO)
and Ozone (O3). Air Quality levels since then
have shown declining trends in both pollutants.
Figure 11 shows that the average monthly
maximum CO levels have continued to decline
over the past 5 years signaling a positive
response to reduction practices. In fact, the
County will cease to be a maintenance area for
CO in November of 2015 as historical data
provides confidence that CO levels will remain well below the 9 ppm 8-hour NAAQS.
Ground level or "bad" ozone is not emitted directly into the air. It is created by chemical reactions
between oxides of nitrogen (NOx) and volatile organic compounds (VOC) in the presence of sunlight.
Emissions from mobile sources, industrial facilities and electric utilities, gasoline vapors, and chemical
Figure 10 - Daily and Annual Particle Pollution Trends
Figure 11 - Carbon Monoxide Trend 2010-2014
Page | 38
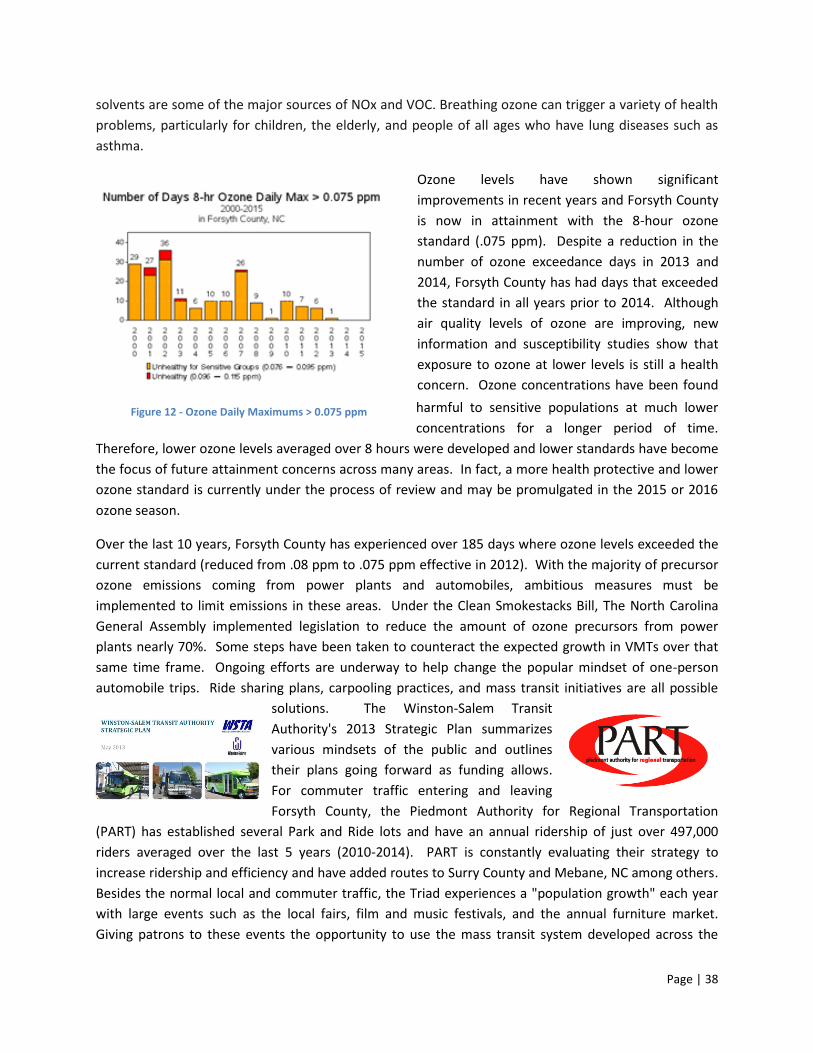
solvents are some of the major sources of NOx and VOC. Breathing ozone can trigger a variety of health
problems, particularly for children, the elderly, and people of all ages who have lung diseases such as
asthma.
Ozone levels have shown significant
improvements in recent years and Forsyth County
is now in attainment with the 8-hour ozone
standard (.075 ppm). Despite a reduction in the
number of ozone exceedance days in 2013 and
2014, Forsyth County has had days that exceeded
the standard in all years prior to 2014. Although
air quality levels of ozone are improving, new
information and susceptibility studies show that
exposure to ozone at lower levels is still a health
concern. Ozone concentrations have been found
harmful to sensitive populations at much lower
concentrations for a longer period of time.
Therefore, lower ozone levels averaged over 8 hours were developed and lower standards have become
the focus of future attainment concerns across many areas. In fact, a more health protective and lower
ozone standard is currently under the process of review and may be promulgated in the 2015 or 2016
ozone season.
Over the last 10 years, Forsyth County has experienced over 185 days where ozone levels exceeded the
current standard (reduced from .08 ppm to .075 ppm effective in 2012). With the majority of precursor
ozone emissions coming from power plants and automobiles, ambitious measures must be
implemented to limit emissions in these areas. Under the Clean Smokestacks Bill, The North Carolina
General Assembly implemented legislation to reduce the amount of ozone precursors from power
plants nearly 70%. Some steps have been taken to counteract the expected growth in VMTs over that
same time frame. Ongoing efforts are underway to help change the popular mindset of one-person
automobile trips. Ride sharing plans, carpooling practices, and mass transit initiatives are all possible
solutions. The Winston-Salem Transit
Authority's 2013 Strategic Plan summarizes
various mindsets of the public and outlines
their plans going forward as funding allows.
For commuter traffic entering and leaving
Forsyth County, the Piedmont Authority for Regional Transportation
(PART) has established several Park and Ride lots and have an annual ridership of just over 497,000
riders averaged over the last 5 years (2010-2014). PART is constantly evaluating their strategy to
increase ridership and efficiency and have added routes to Surry County and Mebane, NC among others.
Besides the normal local and commuter traffic, the Triad experiences a "population growth" each year
with large events such as the local fairs, film and music festivals, and the annual furniture market.
Giving patrons to these events the opportunity to use the mass transit system developed across the
Figure 12 - Ozone Daily Maximums > 0.075 ppm
Page | 39
region would significantly reduce the amount of ozone precursors and hopefully limit the amount of
traffic congestion on the already taxed roadways. As the Triad continues to grow, we must make
attempts to reduce single occupant vehicles or the declining trend in air pollution will make a noticeable
reversal that could result in widespread populations being affected by the worsening air quality.
PM10
Except during exceptional events (e.g. impact from wild fires, etc.), PM10 levels (particles less than 10
microns in diameter) have never reached a level of serious concern in Forsyth County. Filter based
sampling began in the 1980s and continued through 1998. Consistently low levels of PM10 led to a
reduction in the number of monitoring locations across the County. In addition, new technology and
improved equipment led FCEAP to eliminate all filter based sampling monitors and implement
continuous PM10 monitors at two (2) locations until recently. With the approval of U.S. EPA, FCEAP
eliminated its PM10 monitor at the Peters Creek location due to the equipment being in poor repair
coupled with historically low readings that did not warrant the expense for new equipment. FCEAP now
operates one PM10 monitoring at Hattie Ave, where it is co-located with existing PM2.5 monitors. The co-
location of PM2.5 and PM10 monitors at one location (Hattie Ave B) is useful to validate particle pollution
levels during unexpected or elevated events. This strategy ensures the network is operating efficiently
while minimizing staff responsibilities.
Site correlations
Particle Pollution
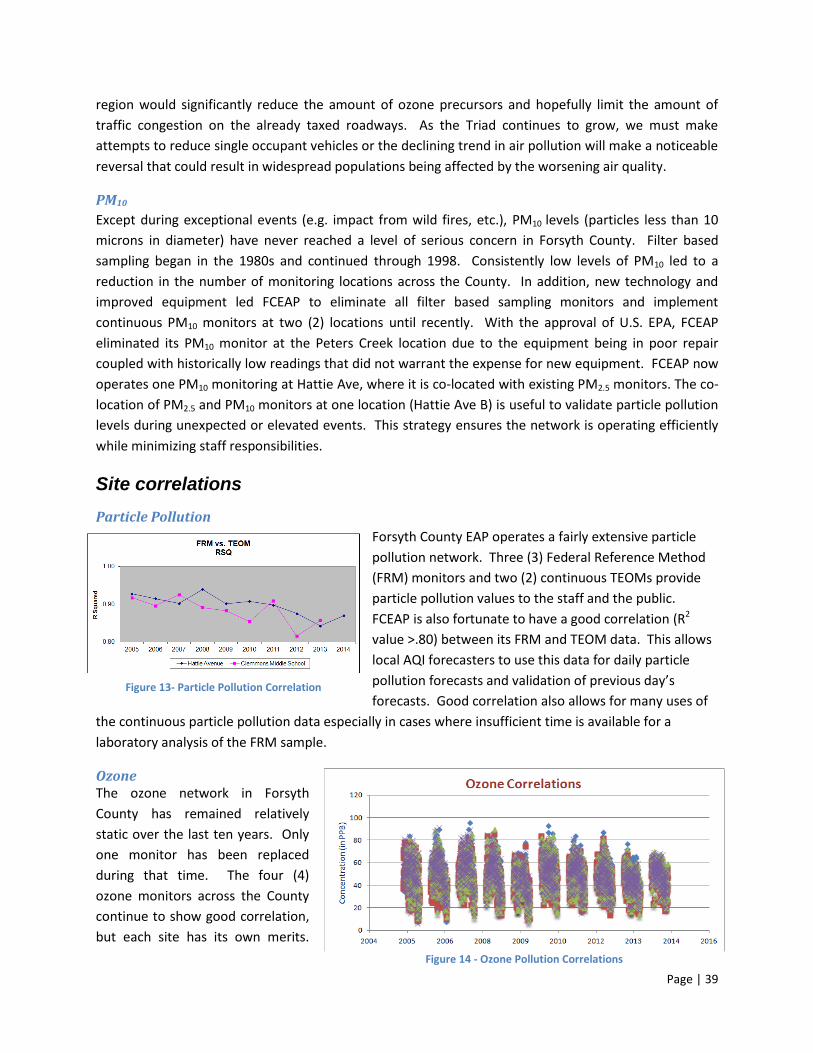
Forsyth County EAP operates a fairly extensive particle
pollution network. Three (3) Federal Reference Method
(FRM) monitors and two (2) continuous TEOMs provide
particle pollution values to the staff and the public.
FCEAP is also fortunate to have a good correlation (R2
value >.80) between its FRM and TEOM data. This allows
local AQI forecasters to use this data for daily particle
pollution forecasts and validation of previous day’s
forecasts. Good correlation also allows for many uses of
the continuous particle pollution data especially in cases where insufficient time is available for a
laboratory analysis of the FRM sample.
Ozone The ozone network in Forsyth
County has remained relatively
static over the last ten years. Only
one monitor has been replaced
during that time. The four (4)
ozone monitors across the County
continue to show good correlation,
but each site has its own merits.
Figure 13- Particle Pollution Correlation
Figure 14 - Ozone Pollution Correlations
Page | 40
Three (3) ozone monitors, Shiloh Church (SC), Clemmons Middle School (CM), and Union Cross (UC) are
located in more rural settings and are sited in locations to provide a quick look at ozone conditions
across the county. Hattie Avenue (HA) is in an urban area surrounded by largely minority owned
properties and is an ideal location for monitoring urban ozone concentrations possibly impacted by
higher temperatures and more static conditions due to its urban setting. The observed readings at each
site are essential to the mission of FCEAP as well as its County leaders. Routine maintenance and
scheduled repairs also help in attaining the consistent correlation that is observed.
Comparison to NAAQS
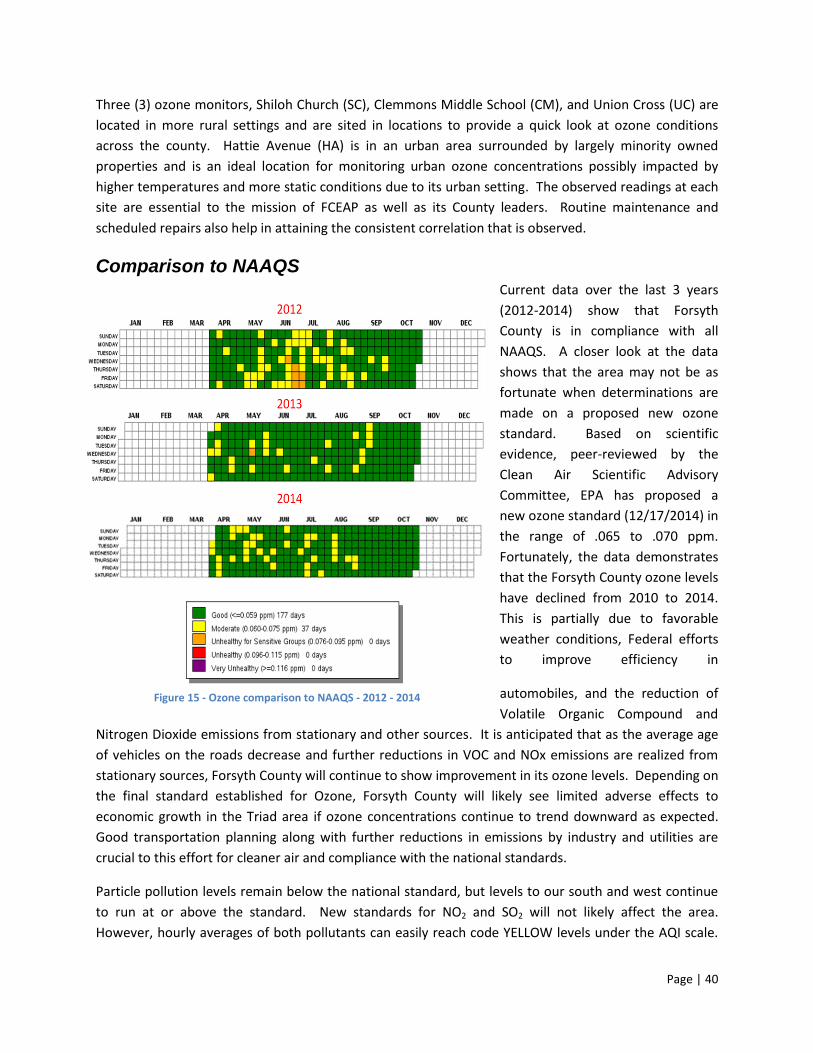
Current data over the last 3 years
(2012-2014) show that Forsyth
County is in compliance with all
NAAQS. A closer look at the data
shows that the area may not be as
fortunate when determinations are
made on a proposed new ozone
standard. Based on scientific
evidence, peer-reviewed by the
Clean Air Scientific Advisory
Committee, EPA has proposed a
new ozone standard (12/17/2014) in
the range of .065 to .070 ppm.
Fortunately, the data demonstrates
that the Forsyth County ozone levels
have declined from 2010 to 2014.
This is partially due to favorable
weather conditions, Federal efforts
to improve efficiency in
automobiles, and the reduction of
Volatile Organic Compound and
Nitrogen Dioxide emissions from stationary and other sources. It is anticipated that as the average age
of vehicles on the roads decrease and further reductions in VOC and NOx emissions are realized from
stationary sources, Forsyth County will continue to show improvement in its ozone levels. Depending on
the final standard established for Ozone, Forsyth County will likely see limited adverse effects to
economic growth in the Triad area if ozone concentrations continue to trend downward as expected.
Good transportation planning along with further reductions in emissions by industry and utilities are
crucial to this effort for cleaner air and compliance with the national standards.
Particle pollution levels remain below the national standard, but levels to our south and west continue
to run at or above the standard. New standards for NO2 and SO2 will not likely affect the area.
However, hourly averages of both pollutants can easily reach code YELLOW levels under the AQI scale.
Figure 15 - Ozone comparison to NAAQS - 2012 - 2014
Page | 41
In 2011, EPA proposed to retain the existing Carbon Monoxide (CO) standard and reduced the concern
that Forsyth County will exceed this standard. Carbon Monoxide levels have continued to decline since
the last Network assessment and monitoring for CO has become less essential.
Situational Analysis
Risk of future NAAQS exceedances Ozone and particle pollution remain the main focus of concern for NAAQS violations across Forsyth
County. Improvements to various industries, better controls for motor vehicle emissions, increased
public transportation options, and improved air quality awareness contribute to the decreases in ozone
exceedances in the past several years. However, with a change to the national ozone standard on the
horizon, particle pollution still a concern, and a lower NO2 standard in place, the area is far from taking a
relaxed approach to monitoring. It remains imperative that FCEAP continue operating the current
monitoring network and continue outreach activities to protect the health of citizens of the County.
Historically, the Office has shown that it can meet the challenges set by USEPA to attain the NAAQS. By
maintaining the current network, FCEAP has the means to meet these challenges and strive for cleaner
air for everyone.
Demographic shifts Population across Forsyth County has steadily increased over the last several years. Despite the loss of
many furniture andother manufacturing facilities, people continue to move to the region for its
favorable climate, hospitality, and attractive amenities. Technology based jobs are on the rise as well
which helps attract younger populations and stabilize the population. As described earlier, minority
populations tend to reside more closely to inner city locations where minority owned businesses are
more prevalent. A smaller percentage of minorities live in the suburban and rural areas of the County.
Statistics demonstrate this trend to be relatively stable.
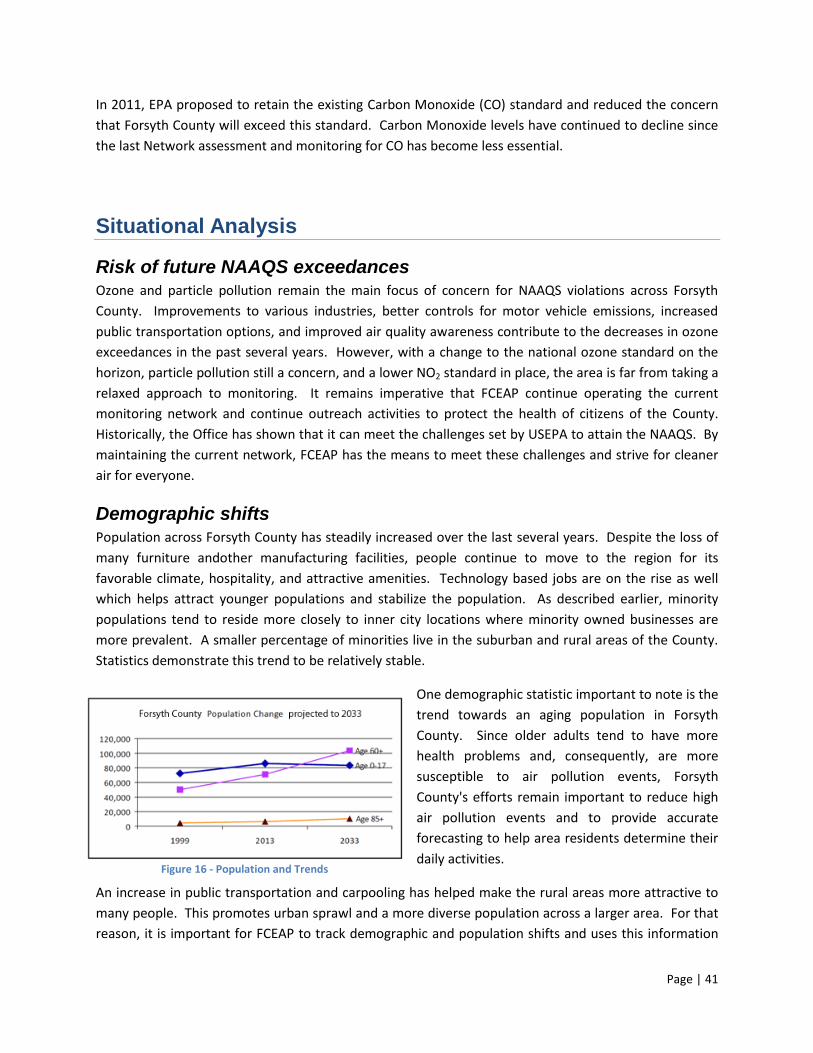
One demographic statistic important to note is the
trend towards an aging population in Forsyth
County. Since older adults tend to have more
health problems and, consequently, are more
susceptible to air pollution events, Forsyth
County's efforts remain important to reduce high
air pollution events and to provide accurate
forecasting to help area residents determine their
daily activities.
An increase in public transportation and carpooling has helped make the rural areas more attractive to
many people. This promotes urban sprawl and a more diverse population across a larger area. For that
reason, it is important for FCEAP to track demographic and population shifts and uses this information
Figure 16 - Population and Trends
Page | 42
when a new monitoring site (or the relocation of an existing one) is warranted. While targeting the
areas of highest concentrations of pollutants is a primary rationale for locating monitoring equipment,
ensuring adequate coverage of the entire population is equally important. For this reason, population
data is frequently used when assessing monitoring site locations.
SIP requirements
Currently none of Forsyth County’s monitoring network is sited based on SIP requirements.
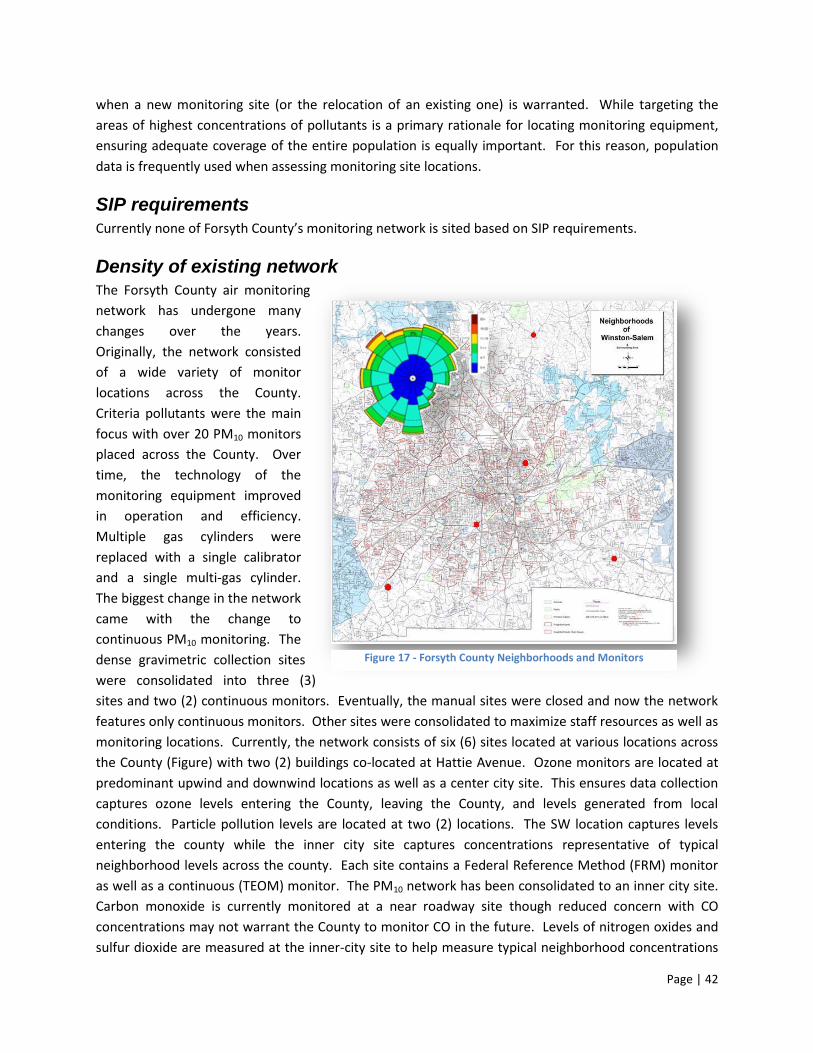
Density of existing network
The Forsyth County air monitoring
network has undergone many
changes over the years.
Originally, the network consisted
of a wide variety of monitor
locations across the County.
Criteria pollutants were the main
focus with over 20 PM10 monitors
placed across the County. Over
time, the technology of the
monitoring equipment improved
in operation and efficiency.
Multiple gas cylinders were
replaced with a single calibrator
and a single multi-gas cylinder.
The biggest change in the network
came with the change to
continuous PM10 monitoring. The
dense gravimetric collection sites
were consolidated into three (3)
sites and two (2) continuous monitors. Eventually, the manual sites were closed and now the network
features only continuous monitors. Other sites were consolidated to maximize staff resources as well as
monitoring locations. Currently, the network consists of six (6) sites located at various locations across
the County (Figure) with two (2) buildings co-located at Hattie Avenue. Ozone monitors are located at
predominant upwind and downwind locations as well as a center city site. This ensures data collection
captures ozone levels entering the County, leaving the County, and levels generated from local
conditions. Particle pollution levels are located at two (2) locations. The SW location captures levels
entering the county while the inner city site captures concentrations representative of typical
neighborhood levels across the county. Each site contains a Federal Reference Method (FRM) monitor
as well as a continuous (TEOM) monitor. The PM10 network has been consolidated to an inner city site.
Carbon monoxide is currently monitored at a near roadway site though reduced concern with CO
concentrations may not warrant the County to monitor CO in the future. Levels of nitrogen oxides and
sulfur dioxide are measured at the inner-city site to help measure typical neighborhood concentrations
Figure 17 - Forsyth County Neighborhoods and Monitors
Page | 43
near a variety of pollution sources. Air toxics and particle pollution speciation are measured at the same
inner-city site. This network has proven to be efficient and effective in monitoring air pollution levels
across the county while still balancing staff resources.
Scientific research or public health needs
From 2005 through 2009, FCEAP participated in a health based study with the University of Washington.
The Multi-Ethnic Study of Atherosclerosis and Air Pollution (MESA
Air) is designed to examine the relationship between air
pollution exposures and the progression of cardiovascular
disease over time. The United States Environmental Protection
Agency funds the ten-year study, which involves thousands of
participants, representing diverse areas of the United States. The
MESA Air Pollution study is headquartered at the University of
Washington, but many other institutions are also involved.
This air pollution study builds upon the foundation created by
another study, the MESA study. A different branch of the federal government, the National of the
National Institutes of Health, funds the population-based MESA study. The original MESA study began in
2000, and recruited subjects for the study of cardiovascular disease in six states – New York, Maryland,
North Carolina, Minnesota, Illinois, and California.
Using our existing resources, FCEAP was able to co-locate monitoring equipment with the MESA-Air
team and acquire additional data. In addition, the immediate availability of current and historical
particle pollution data helped the study organizers implement their project locally without delay or gaps
in data.
Political factors
Active participation by local city council members, town aldermen and county commissioners reflect
local air quality concerns. Local politicians are kept informed of changing conditions and Forsyth
County’s air quality status to help them formulate educated opinions about air quality monitoring
activities. The current monitoring network has been adopted over time to meet not only the air quality
scope and objectives set forth by EPA, but also includes input from local political leaders. This
methodology ensures not only air quality concerns are addressed, but also the various populations that
are affected by pollution across the County.
Proposed Changes
Listed below are the proposed changes for the FCEAP monitoring network. Site Location Pollutant Objective Equipment Recommendation(s)
CM SW Forsyth County
Ozone 1. Background 2. Population Exposure
API 400E API 703E
Keep existing site at present location
PM2.5 1. Background 2. Population Exposure
R&P TEOM 1400a R&P 2025 (1 in 3) R&P 2025 (1 in 6)
Keep existing site at present location
Proposing
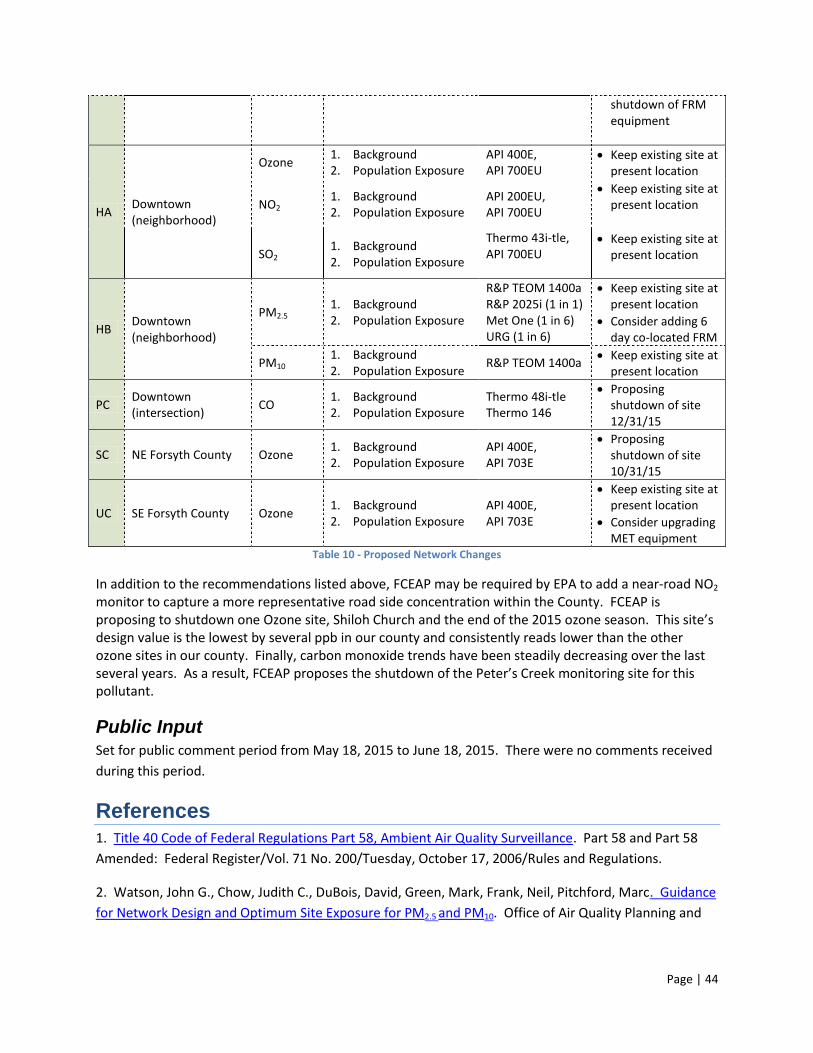
Page | 44
shutdown of FRM equipment
HA Downtown (neighborhood)
Ozone 1. Background 2. Population Exposure
API 400E, API 700EU
Keep existing site at present location
NO2 1. Background 2. Population Exposure
API 200EU, API 700EU
Keep existing site at present location
SO2 1. Background 2. Population Exposure
Thermo 43i-tle, API 700EU
Keep existing site at present location
HB Downtown (neighborhood)
PM2.5 1. Background 2. Population Exposure
R&P TEOM 1400a R&P 2025i (1 in 1) Met One (1 in 6) URG (1 in 6)
Keep existing site at present location
Consider adding 6 day co-located FRM
PM10 1. Background 2. Population Exposure
R&P TEOM 1400a Keep existing site at
present location
PC Downtown (intersection)
CO 1. Background 2. Population Exposure
Thermo 48i-tle Thermo 146
Proposing shutdown of site 12/31/15
SC NE Forsyth County Ozone 1. Background 2. Population Exposure
API 400E, API 703E
Proposing shutdown of site 10/31/15
UC SE Forsyth County Ozone 1. Background 2. Population Exposure
API 400E, API 703E
Keep existing site at present location
Consider upgrading MET equipment
Table 10 - Proposed Network Changes
In addition to the recommendations listed above, FCEAP may be required by EPA to add a near-road NO2 monitor to capture a more representative road side concentration within the County. FCEAP is proposing to shutdown one Ozone site, Shiloh Church and the end of the 2015 ozone season. This site’s design value is the lowest by several ppb in our county and consistently reads lower than the other ozone sites in our county. Finally, carbon monoxide trends have been steadily decreasing over the last several years. As a result, FCEAP proposes the shutdown of the Peter’s Creek monitoring site for this pollutant.
Public Input Set for public comment period from May 18, 2015 to June 18, 2015. There were no comments received
during this period.
References 1. Title 40 Code of Federal Regulations Part 58, Ambient Air Quality Surveillance. Part 58 and Part 58
Amended: Federal Register/Vol. 71 No. 200/Tuesday, October 17, 2006/Rules and Regulations.
2. Watson, John G., Chow, Judith C., DuBois, David, Green, Mark, Frank, Neil, Pitchford, Marc. Guidance
for Network Design and Optimum Site Exposure for PM2.5 and PM10. Office of Air Quality Planning and
Page | 45
Standards, U. S. Environmental Protection Agency, Research Triangle Park, NC 27711. December 15,
1997.
3. Winston-Salem Department of Transportation. Current Traffic Counts
Note: Traffic Count taken from nearest road providing most impact to site
4. US Census Bureau. Current Lists of Metropolitan and Micropolitan Statistical Areas and Definitions. http://www.census.gov/population/metro/data/metrodef.html
Acknowledgements
Lynn Ruscher - Principal Planner - Winston-Salem/Forsyth County Planning Department