fixed income in a rising rate environment - morningstar,...
TRANSCRIPT
Fixed Income in a Rising Rate Environment
NOT FDIC INSURED NO BANK GUARANTEE MAY LOSE VALUE
With interest rates at historically low levels, fixed income investors have become increas-ingly concerned about rising rates and how their portfolios might be affected. However, rising rates do not necessarily mean negative total returns for fixed-income investments. While rising interest rates adversely impact bond prices, various asset classes respond differently to rising rates, and active portfolio management can also help mitigate the impact rising rates have on returns. This paper examines the factors that can affect interest rates, as well as how fixed-income investments can respond as rates rise.
THE SPECTER OF RISING RATES
With short-term rates at record lows, investors are seeking yield. However, many are cautious in choosing fixed-income investments given the potential for rates to rise as the economy continues to expand. Many investors ask, “How can I best position my portfolio in a rising rate environment?” The answer starts with understanding the relationship between interest rates and fixed-income returns.
Why Do Interest Rates Rise?
Interest rates reflect the cost of borrowing over time. Many factors impact interest rates, including the real cost of funds; inflation expectations; preference for shorter-term, more liquid securities; investor risk appetite and supply/demand balance. One of the most visible market indicators of interest rates for many investors is the monetary policy decisions of the Federal Reserve. The Federal Funds rate, which anchors short-term rates in the market, is a key tool in implementing these policy decisions. Typically, the Federal Funds rate is raised to temper inflation as the economy expands. So now that we have experienced some improvement in the overall economy and increasing commodity prices, many investors worry about rising rates.
MAY 2011
Tony RodriguezManaging Director, Co-Head Fixed Income
Chris Neuharth, CFAManaging Director, Portfolio Manager
Kari Stanway, CFAVice President, Client Portfolio Manager
Nuveen Asset Management, LLC

NUVEEN ASSET MANAGEMENT FIXED INCOME IN A RISING RATE ENVIRONMENT MAY 2011
02
Longer-term interest rates, on the other hand, are fundamentally driven by inflation expectations. Some believe that increases in the Federal Funds rate automatically mean rates go up along the yield curve spectrum, but this is not typically the case. Usually, as short-term rates rise, the yield curve also reshapes itself. A yield curve is a line that plots the interest rates, at a set point in time, of bonds having equal credit quality, but differing maturity dates.Since the current yield curve is historically steep, Nuveen Asset Management (Nuveen) believes that a rise in short-term rates caused by Federal Reserve tightening will result in a flattening of the yield curve, with short-term rates rising more than long-term rates.
Impact of Rising Rates on Fixed-Income Returns
Traditional financial theory portends that bond prices fall when interest rates rise. Yet, a bond’s total return comprises not just price changes, but also income. This is important because, as rates rise, the income on a bond can help offset falling prices, cushioning the overall total return.For investors, the relevant questions are:
• How much will the price fall?
• Is there enough income to offset the price decline?
Role of Specific Market Conditions
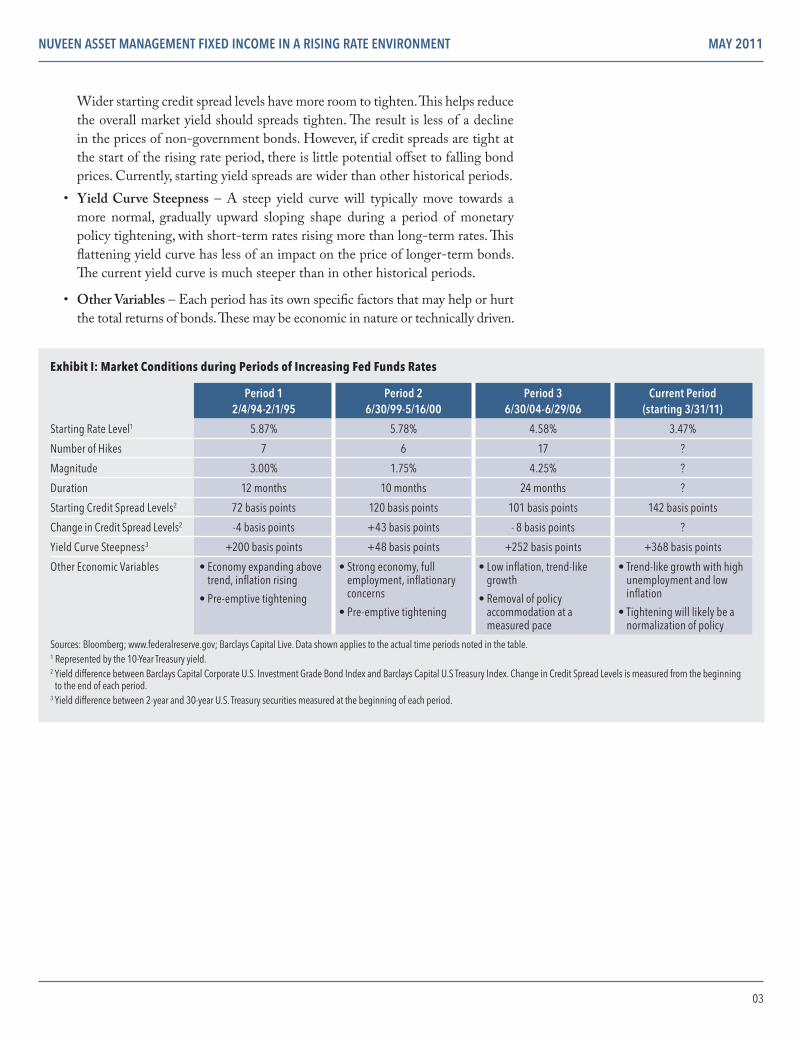
Historical analysis is an objective way to understand how fixed-income investments typically respond to rising rates. To simplify the analysis, a rising rate period is when the Federal Reserve is tightening. This means that short-term rates are rising, but other factors may be impacting the intermediate and long ends of the yield curve. Since 1994, there have been three periods of increasing Federal Funds rates. However, each of these periods has had unique factors that impacted the way fixed-income investments responded, as shown in Exhibit I. Let’s consider a few of these factors:
• Starting Rate Level – The absolute rate level is important because the bond’s income helps to cushion its total return from price erosion. Higher starting income levels provide more cushion. Currently, starting rates are lower than other historical periods.
• Number, Magnitude and Duration of Federal Funds Hikes – The speed with which the Federal Reserve (Fed) acts is also important. If they raise rates grad-ually over a longer period of time, the income on the investment can offset the decline in price. More dramatic increases over shorter time frames make it more difficult for income to compensate for price declines. Nuveen believes that the Fed will take a gradual approach to unwinding accommodation.
• Starting Credit Spread Levels – Credit spreads are the difference between the yield of a riskless Treasury bond and a security with credit risk, such as corpo-rate bond. At their essence, credit spreads are a risk premium. During periods of economic expansion that cause rates to rise, market risk premiums typically decline. When times are good, investors demand less of a risk premium because they are more confident they will get their money back.
NUVEEN ASSET MANAGEMENT FIXED INCOME IN A RISING RATE ENVIRONMENT MAY 2011
03
Wider starting credit spread levels have more room to tighten. This helps reduce the overall market yield should spreads tighten. The result is less of a decline in the prices of non-government bonds. However, if credit spreads are tight at the start of the rising rate period, there is little potential offset to falling bond prices. Currently, starting yield spreads are wider than other historical periods.
• Yield Curve Steepness – A steep yield curve will typically move towards a more normal, gradually upward sloping shape during a period of monetary policy tightening, with short-term rates rising more than long-term rates. This flattening yield curve has less of an impact on the price of longer-term bonds. The current yield curve is much steeper than in other historical periods.
• Other Variables – Each period has its own specific factors that may help or hurt the total returns of bonds. These may be economic in nature or technically driven.
Exhibit I: Market Conditions during Periods of Increasing Fed Funds Rates
Period 12/4/94-2/1/95
Period 2 6/30/99-5/16/00
Period 3 6/30/04-6/29/06
Current Period(starting 3/31/11)
Starting Rate Level1 5.87% 5.78% 4.58% 3.47%
Number of Hikes 7 6 17 ?
Magnitude 3.00% 1.75% 4.25% ?
Duration 12 months 10 months 24 months ?
Starting Credit Spread Levels2 72 basis points 120 basis points 101 basis points 142 basis points
Change in Credit Spread Levels2 -4 basis points +43 basis points - 8 basis points ?
Yield Curve Steepness3 +200 basis points +48 basis points +252 basis points +368 basis points
Other Economic Variables • Economy expanding above trend, inflation rising
• Pre-emptive tightening
• Strong economy, full employment, inflationary concerns
• Pre-emptive tightening
• Low inflation, trend-like growth
• Removal of policy accommodation at a measured pace
• Trend-like growth with high unemployment and low inflation
• Tightening will likely be a normalization of policy
Sources: Bloomberg; www.federalreserve.gov; Barclays Capital Live. Data shown applies to the actual time periods noted in the table.1 Represented by the 10-Year Treasury yield.2 Yield difference between Barclays Capital Corporate U.S. Investment Grade Bond Index and Barclays Capital U.S Treasury Index. Change in Credit Spread Levels is measured from the beginning
to the end of each period.3 Yield difference between 2-year and 30-year U.S. Treasury securities measured at the beginning of each period.
NUVEEN ASSET MANAGEMENT FIXED INCOME IN A RISING RATE ENVIRONMENT MAY 2011
04
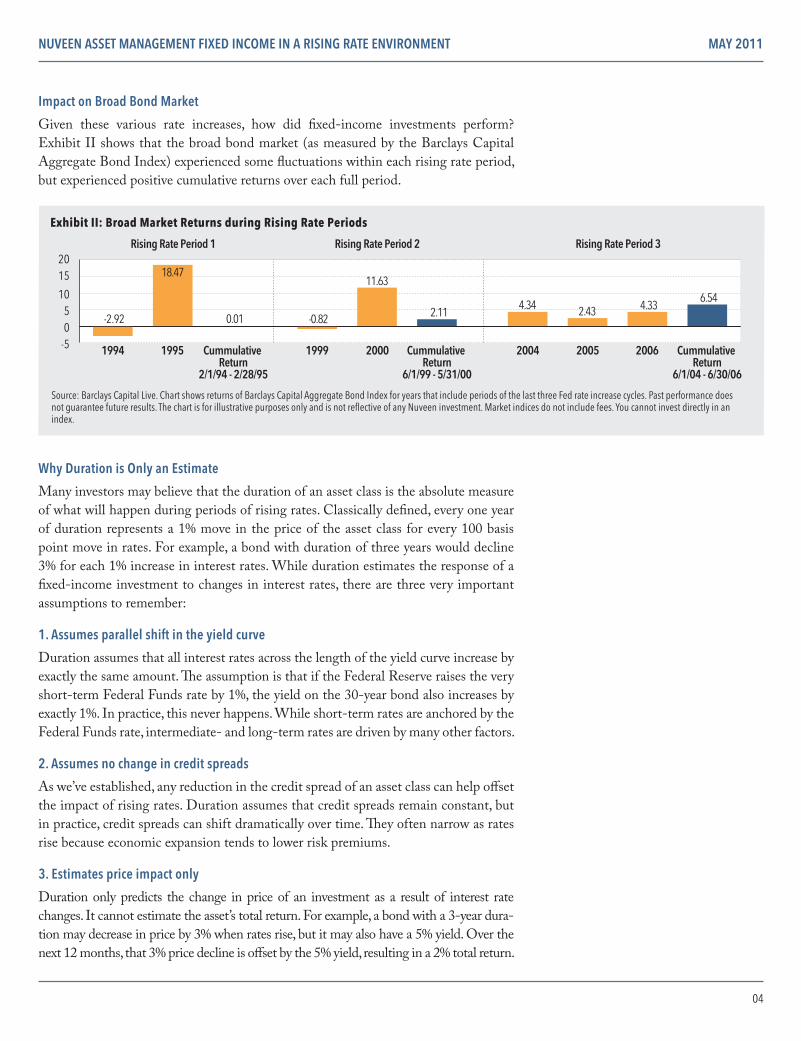
Impact on Broad Bond Market
Given these various rate increases, how did fixed-income investments perform? Exhibit II shows that the broad bond market (as measured by the Barclays Capital Aggregate Bond Index) experienced some fluctuations within each rising rate period, but experienced positive cumulative returns over each full period.
Why Duration is Only an Estimate
Many investors may believe that the duration of an asset class is the absolute measure of what will happen during periods of rising rates. Classically defined, every one year of duration represents a 1% move in the price of the asset class for every 100 basis point move in rates. For example, a bond with duration of three years would decline 3% for each 1% increase in interest rates. While duration estimates the response of a fixed-income investment to changes in interest rates, there are three very important assumptions to remember:
1. Assumes parallel shift in the yield curve
Duration assumes that all interest rates across the length of the yield curve increase by exactly the same amount. The assumption is that if the Federal Reserve raises the very short-term Federal Funds rate by 1%, the yield on the 30-year bond also increases by exactly 1%. In practice, this never happens. While short-term rates are anchored by the Federal Funds rate, intermediate- and long-term rates are driven by many other factors.
2. Assumes no change in credit spreads
As we’ve established, any reduction in the credit spread of an asset class can help offset the impact of rising rates. Duration assumes that credit spreads remain constant, but in practice, credit spreads can shift dramatically over time. They often narrow as rates rise because economic expansion tends to lower risk premiums.
3. Estimates price impact only
Duration only predicts the change in price of an investment as a result of interest rate changes. It cannot estimate the asset’s total return. For example, a bond with a 3-year dura-tion may decrease in price by 3% when rates rise, but it may also have a 5% yield. Over the next 12 months, that 3% price decline is offset by the 5% yield, resulting in a 2% total return.
-505
10
1520
1994 1995
Rising Rate Period 1 Rising Rate Period 2 Rising Rate Period 3
Cummulative Return
2/1/94 - 2/28/95
1999 2000 2004 2005 2006Cummulative Return
6/1/99 - 5/31/00
Cummulative Return
6/1/04 - 6/30/06
Exhibit II: Broad Market Returns during Rising Rate Periods
Source: Barclays Capital Live. Chart shows returns of Barclays Capital Aggregate Bond Index for years that include periods of the last three Fed rate increase cycles. Past performance does not guarantee future results. The chart is for illustrative purposes only and is not reflective of any Nuveen investment. Market indices do not include fees. You cannot invest directly in an index.
-2.92
18.47
0.01 -0.82
11.63
2.11 4.34 2.43 4.33
6.54
NUVEEN ASSET MANAGEMENT FIXED INCOME IN A RISING RATE ENVIRONMENT MAY 2011
05
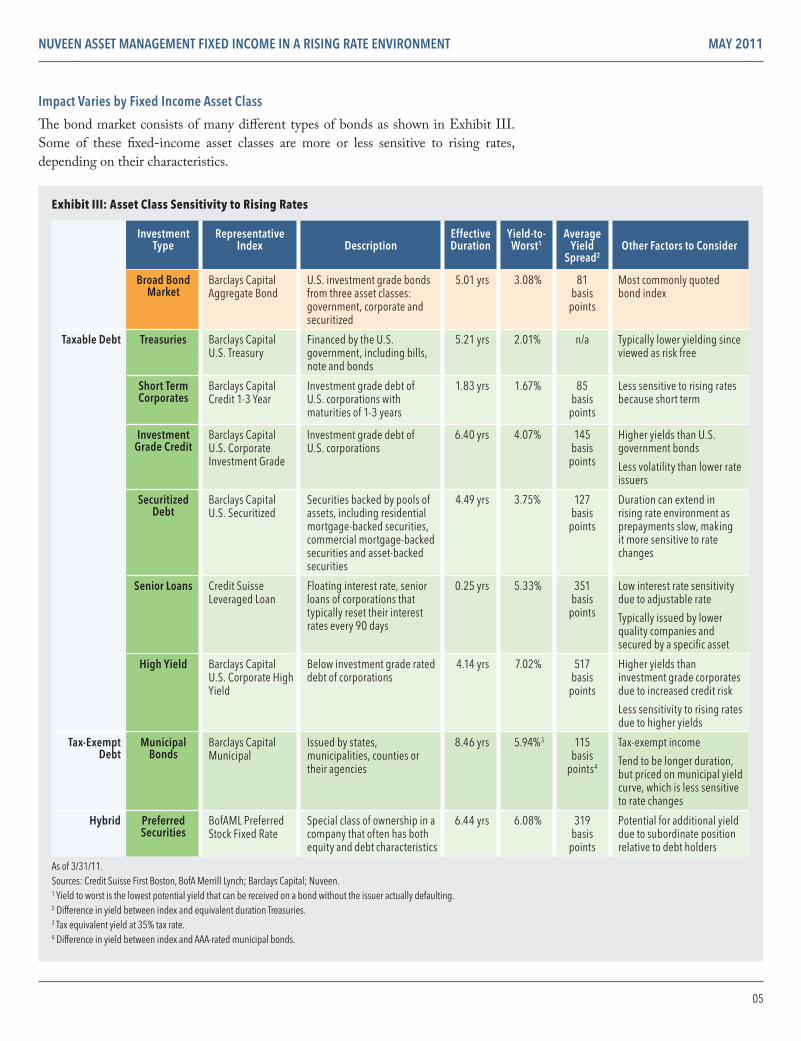
Impact Varies by Fixed Income Asset Class
The bond market consists of many different types of bonds as shown in Exhibit III. Some of these fixed-income asset classes are more or less sensitive to rising rates, depending on their characteristics.
Exhibit III: Asset Class Sensitivity to Rising Rates
Investment Type
Representative Index
Description
Effective Duration
Yield-to-Worst1
Average Yield
Spread2
Other Factors to Consider
Broad Bond Market
Barclays Capital Aggregate Bond
U.S. investment grade bonds from three asset classes: government, corporate and securitized
5.01 yrs 3.08% 81 basis
points
Most commonly quoted bond index
Taxable Debt Treasuries Barclays Capital U.S. Treasury
Financed by the U.S. government, including bills, note and bonds
5.21 yrs 2.01% n/a Typically lower yielding since viewed as risk free
Short Term Corporates
Barclays Capital Credit 1-3 Year
Investment grade debt of U.S. corporations with maturities of 1-3 years
1.83 yrs 1.67% 85 basis
points
Less sensitive to rising rates because short term
Investment Grade Credit
Barclays Capital U.S. Corporate Investment Grade
Investment grade debt of U.S. corporations
6.40 yrs 4.07% 145 basis
points
Higher yields than U.S. government bonds
Less volatility than lower rate issuers
Securitized Debt
Barclays Capital U.S. Securitized
Securities backed by pools of assets, including residential mortgage-backed securities, commercial mortgage-backed securities and asset-backed securities
4.49 yrs 3.75% 127 basis
points
Duration can extend in rising rate environment as prepayments slow, making it more sensitive to rate changes
Senior Loans Credit Suisse Leveraged Loan
Floating interest rate, senior loans of corporations that typically reset their interest rates every 90 days
0.25 yrs 5.33% 351 basis
points
Low interest rate sensitivity due to adjustable rate
Typically issued by lower quality companies and secured by a specific asset
High Yield Barclays Capital U.S. Corporate High Yield
Below investment grade rated debt of corporations
4.14 yrs 7.02% 517 basis
points
Higher yields than investment grade corporates due to increased credit risk
Less sensitivity to rising rates due to higher yields
Tax-Exempt Debt
Municipal Bonds
Barclays Capital Municipal
Issued by states, municipalities, counties or their agencies
8.46 yrs 5.94%3 115 basis
points4
Tax-exempt income
Tend to be longer duration, but priced on municipal yield curve, which is less sensitive to rate changes
Hybrid Preferred Securities
BofAML Preferred Stock Fixed Rate
Special class of ownership in a company that often has both equity and debt characteristics
6.44 yrs 6.08% 319 basis
points
Potential for additional yield due to subordinate position relative to debt holders
As of 3/31/11.Sources: Credit Suisse First Boston, BofA Merrill Lynch; Barclays Capital; Nuveen.1 Yield to worst is the lowest potential yield that can be received on a bond without the issuer actually defaulting. 2 Difference in yield between index and equivalent duration Treasuries.3 Tax equivalent yield at 35% tax rate.4 Difference in yield between index and AAA-rated municipal bonds.
NUVEEN ASSET MANAGEMENT FIXED INCOME IN A RISING RATE ENVIRONMENT MAY 2011
06
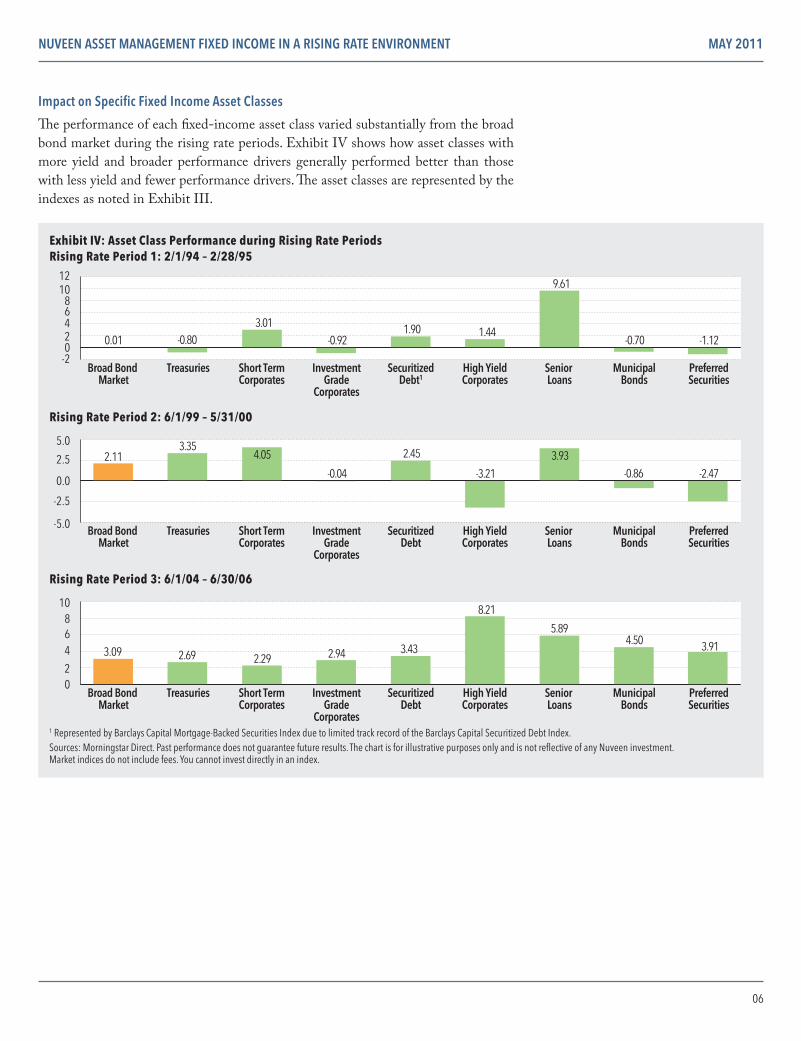
Impact on Specific Fixed Income Asset Classes
The performance of each fixed-income asset class varied substantially from the broad bond market during the rising rate periods. Exhibit IV shows how asset classes with more yield and broader performance drivers generally performed better than those with less yield and fewer performance drivers. The asset classes are represented by the indexes as noted in Exhibit III.
-202468
1012
-5.0
-2.5
0.0
2.5
5.0
02468
10
Broad Bond Market
Treasuries Short TermCorporates
InvestmentGrade
Corporates
SecuritizedDebt1
High YieldCorporates
Senior Loans
MunicipalBonds
PreferredSecurities
Exhibit IV: Asset Class Performance during Rising Rate PeriodsRising Rate Period 1: 2/1/94 – 2/28/95
Rising Rate Period 2: 6/1/99 – 5/31/00
Broad Bond Market
Treasuries Short TermCorporates
InvestmentGrade
Corporates
SecuritizedDebt
High YieldCorporates
Senior Loans
MunicipalBonds
PreferredSecurities
Broad Bond Market
Treasuries Short TermCorporates
InvestmentGrade
Corporates
SecuritizedDebt
High YieldCorporates
Senior Loans
MunicipalBonds
PreferredSecurities
Rising Rate Period 3: 6/1/04 – 6/30/06
0.01 -0.80 3.01
-0.92 1.90 1.44
9.61
-0.70 -1.12
2.113.35
4.05
-0.04
2.45
-3.21 3.93
-0.86 -2.47
3.09 2.69 2.29 2.94 3.43
8.21
5.89 4.50 3.91
1 Represented by Barclays Capital Mortgage-Backed Securities Index due to limited track record of the Barclays Capital Securitized Debt Index.Sources: Morningstar Direct. Past performance does not guarantee future results. The chart is for illustrative purposes only and is not reflective of any Nuveen investment. Market indices do not include fees. You cannot invest directly in an index.
NUVEEN ASSET MANAGEMENT FIXED INCOME IN A RISING RATE ENVIRONMENT MAY 2011
07
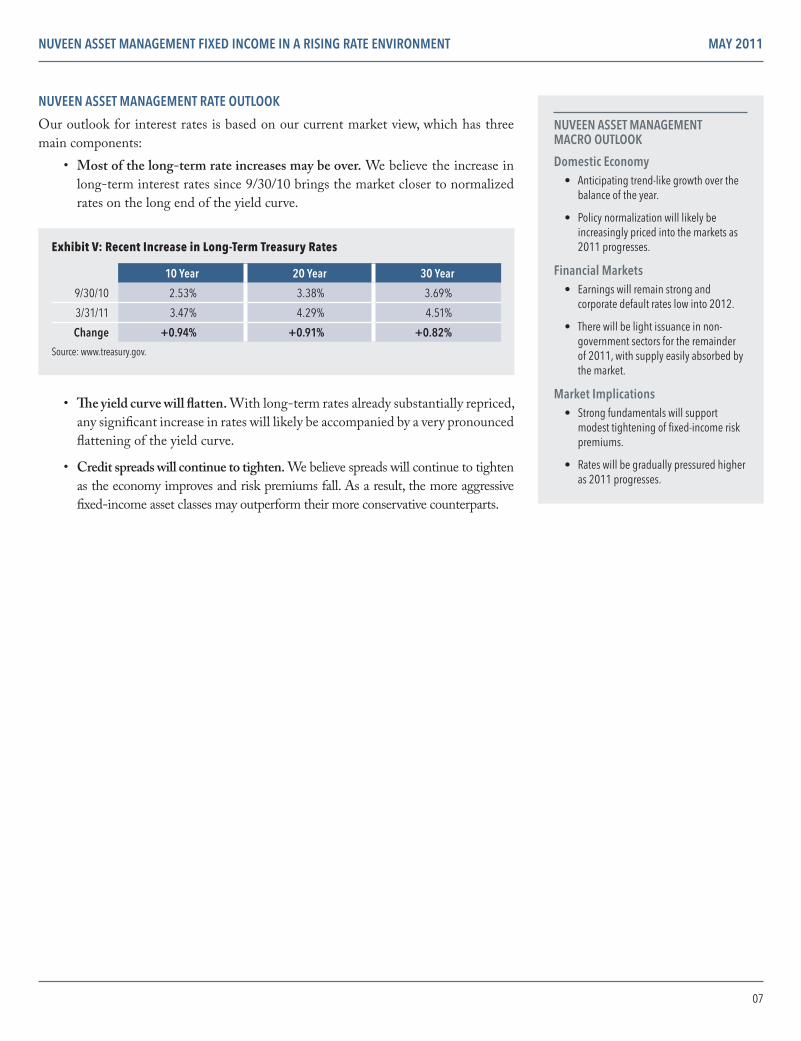
NUVEEN ASSET MANAGEMENT RATE OUTLOOK
Our outlook for interest rates is based on our current market view, which has three main components:
• Most of the long-term rate increases may be over. We believe the increase in long-term interest rates since 9/30/10 brings the market closer to normalized rates on the long end of the yield curve.
Exhibit V: Recent Increase in Long-Term Treasury Rates
10 Year 20 Year 30 Year
9/30/10 2.53% 3.38% 3.69%
3/31/11 3.47% 4.29% 4.51%
Change +0.94% +0.91% +0.82%
Source: www.treasury.gov.
• The yield curve will flatten. With long-term rates already substantially repriced, any significant increase in rates will likely be accompanied by a very pronounced flattening of the yield curve.
• Credit spreads will continue to tighten. We believe spreads will continue to tighten as the economy improves and risk premiums fall. As a result, the more aggressive fixed-income asset classes may outperform their more conservative counterparts.
NUVEEN ASSET MANAGEMENT MACRO OUTLOOK
Domestic Economy• Anticipating trend-like growth over the
balance of the year.
• Policy normalization will likely be increasingly priced into the markets as 2011 progresses.
Financial Markets• Earnings will remain strong and
corporate default rates low into 2012.
• There will be light issuance in non-government sectors for the remainder of 2011, with supply easily absorbed by the market.
Market Implications• Strong fundamentals will support
modest tightening of fixed-income risk premiums.
• Rates will be gradually pressured higher as 2011 progresses.
NUVEEN ASSET MANAGEMENT FIXED INCOME IN A RISING RATE ENVIRONMENT MAY 2011
08
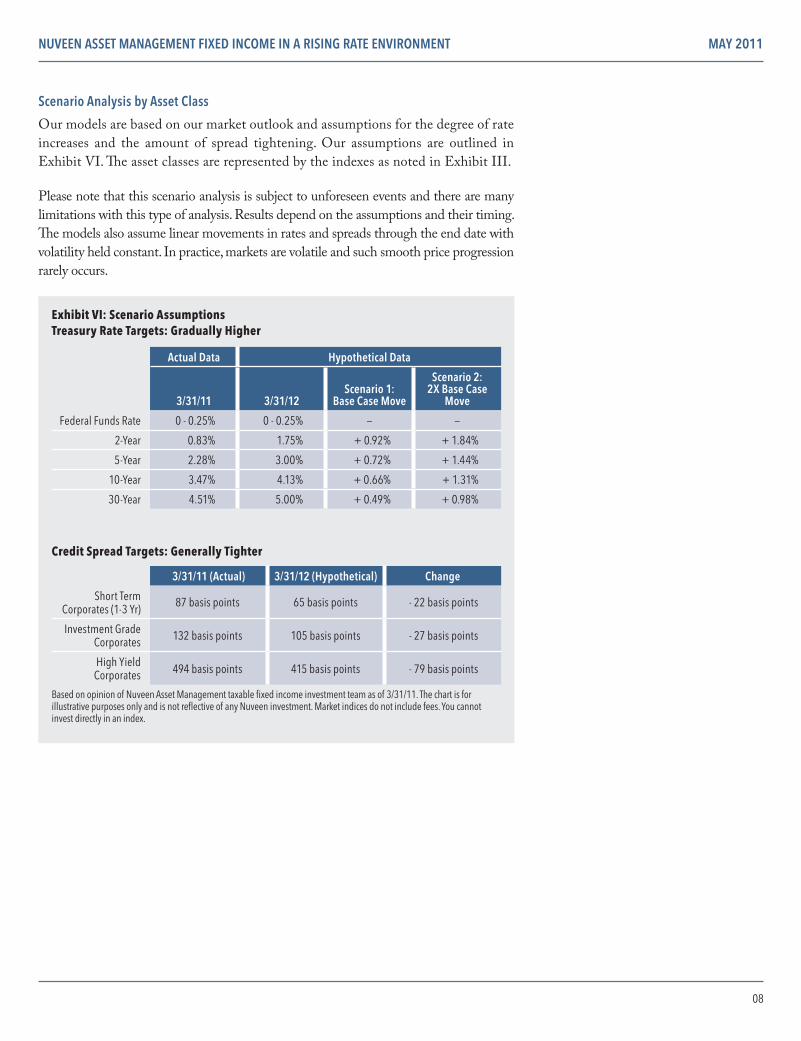
Scenario Analysis by Asset Class
Our models are based on our market outlook and assumptions for the degree of rate increases and the amount of spread tightening. Our assumptions are outlined in Exhibit VI. The asset classes are represented by the indexes as noted in Exhibit III.
Please note that this scenario analysis is subject to unforeseen events and there are many limitations with this type of analysis. Results depend on the assumptions and their timing. The models also assume linear movements in rates and spreads through the end date with volatility held constant. In practice, markets are volatile and such smooth price progression rarely occurs.
Exhibit VI: Scenario AssumptionsTreasury Rate Targets: Gradually Higher
Actual Data Hypothetical Data
3/31/11 3/31/12Scenario 1:
Base Case Move
Scenario 2: 2X Base Case
Move
Federal Funds Rate 0 - 0.25% 0 - 0.25% — —
2-Year 0.83% 1.75% + 0.92% + 1.84%
5-Year 2.28% 3.00% + 0.72% + 1.44%
10-Year 3.47% 4.13% + 0.66% + 1.31%
30-Year 4.51% 5.00% + 0.49% + 0.98%
Credit Spread Targets: Generally Tighter
3/31/11 (Actual) 3/31/12 (Hypothetical) Change
Short Term Corporates (1-3 Yr) 87 basis points 65 basis points - 22 basis points
Investment Grade Corporates 132 basis points 105 basis points - 27 basis points
High Yield Corporates 494 basis points 415 basis points - 79 basis points
Based on opinion of Nuveen Asset Management taxable fixed income investment team as of 3/31/11. The chart is for illustrative purposes only and is not reflective of any Nuveen investment. Market indices do not include fees. You cannot invest directly in an index.
NUVEEN ASSET MANAGEMENT FIXED INCOME IN A RISING RATE ENVIRONMENT MAY 2011
09
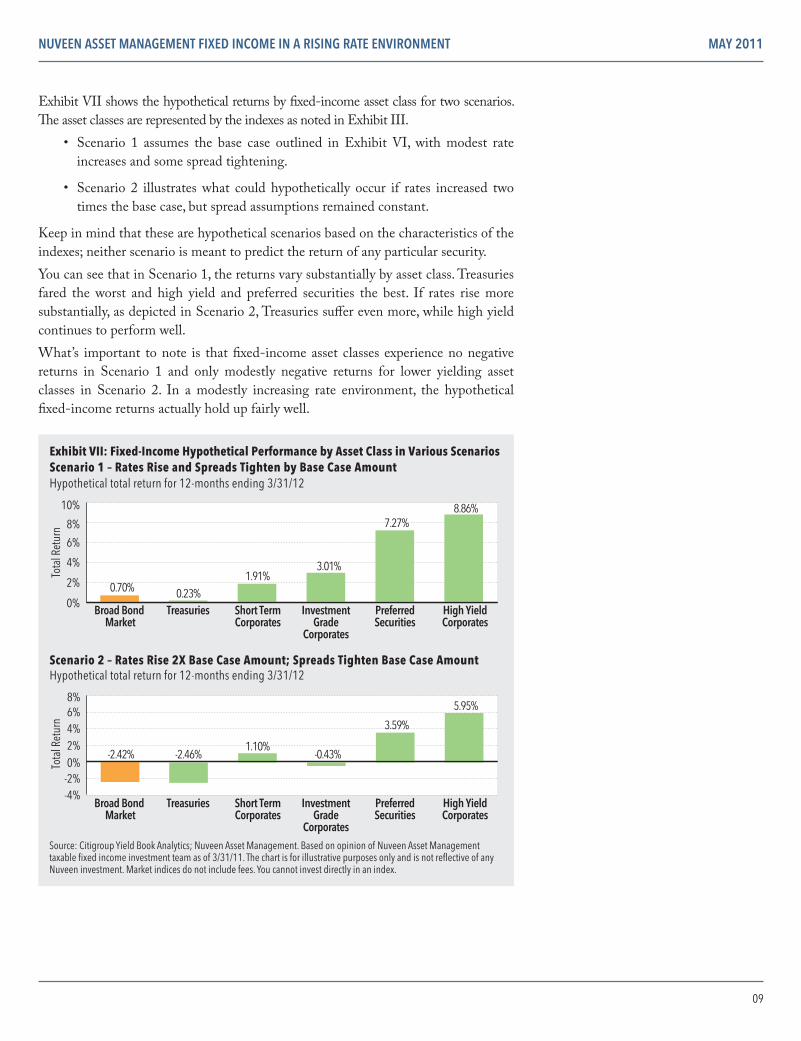
Exhibit VII shows the hypothetical returns by fixed-income asset class for two scenarios. The asset classes are represented by the indexes as noted in Exhibit III.
• Scenario 1 assumes the base case outlined in Exhibit VI, with modest rate increases and some spread tightening.
• Scenario 2 illustrates what could hypothetically occur if rates increased two times the base case, but spread assumptions remained constant.
Keep in mind that these are hypothetical scenarios based on the characteristics of the indexes; neither scenario is meant to predict the return of any particular security.You can see that in Scenario 1, the returns vary substantially by asset class. Treasuries fared the worst and high yield and preferred securities the best. If rates rise more substantially, as depicted in Scenario 2, Treasuries suffer even more, while high yield continues to perform well.What’s important to note is that fixed-income asset classes experience no negative returns in Scenario 1 and only modestly negative returns for lower yielding asset classes in Scenario 2. In a modestly increasing rate environment, the hypothetical fixed-income returns actually hold up fairly well.
0%
2%
4%
6%
8%
10%
-4%-2%0%2%4%6%8%
Broad Bond Market
Short TermCorporates
Treasuries InvestmentGrade
Corporates
PreferredSecurities
High YieldCorporates
Broad Bond Market
Short TermCorporates
Treasuries InvestmentGrade
Corporates
PreferredSecurities
High YieldCorporates
Scenario 2 – Rates Rise 2X Base Case Amount; Spreads Tighten Base Case AmountHypothetical total return for 12-months ending 3/31/12
0.70% 0.23%1.91%
3.01%
7.27% 8.86%
-2.42% -2.46%
Tota
l Ret
urn
Tota
l Ret
urn
1.10% -0.43%
3.59%
5.95%
Exhibit VII: Fixed-Income Hypothetical Performance by Asset Class in Various ScenariosScenario 1 – Rates Rise and Spreads Tighten by Base Case Amount Hypothetical total return for 12-months ending 3/31/12
Source: Citigroup Yield Book Analytics; Nuveen Asset Management. Based on opinion of Nuveen Asset Management taxable fixed income investment team as of 3/31/11. The chart is for illustrative purposes only and is not reflective of any Nuveen investment. Market indices do not include fees. You cannot invest directly in an index.

NUVEEN ASSET MANAGEMENT FIXED INCOME IN A RISING RATE ENVIRONMENT MAY 2011
10
POSITIONING A PORTFOLIO FOR RISING RATES
In addition to considering the impact of rising rates, it is important to take into account the value that active management can bring to investors.
Importance of Active Management
Active managers can help reduce a portfolio’s sensitivity to rising interest rates. At Nuveen, we use three main tools to position our fixed-income portfolios for a rising rate environment:
• Shorten portfolio duration
• Adjust yield curve positioning
• Emphasize asset classes with less sensitivity to rising rates
Shorten portfolio duration: We can shorten the overall duration of our portfolio to make it less sensitive to rising rates. As rates rise, a portfolio with a shorter duration will generally experience a smaller price decline than one with a longer duration.Adjust yield curve positioning: We can adjust the portfolio’s yield curve positioning to give it less exposure to areas where we believe rates will rise more. For example, we believe that the yield curve may flatten in the future, with short-term rates rising more than long-term rates. Accordingly, we can reshape our portfolios to a barbelled structure that combines longer-term maturity bonds with cash and very short-term instruments. A longer-term bond overweight is less impacted by rising rates and the short-term overweight will adjust rapidly. This may lead to better total returns than if portfolio duration was fully exposed to the intermediate portion of the yield curve.Emphasize asset classes with less sensitivity to rising rates: Finally, we can overweight fixed-income asset classes with less sensitivity to rising rates. For example, this strategy might include adding investment grade corporate bonds and de-emphasizing sectors with more interest rate sensitivity, such as Treasury bonds. The rationale for this strategy is two-fold; the non-government asset classes:
(1) Have more income
(2) Generally enjoy a tightening of risk premiums (credit spreads) amid improving fundamentals normally experienced during a period of rising rates
In addition, some asset classes tend to respond more to other factors beside interest rate changes. For example, high yield corporate bonds tend to be more sensitive to changes in a company’s financial outlook, making them less sensitive to rate changes. Foreign bonds respond to the interest rate cycles of their respective countries, which can diversify a bond fund’s portfolio and help to protect against rising U.S. interest rates. Incorporating these less-correlated sectors into our portfolios (where permitted by client guidelines) may help further guard against rising rates.

NUVEEN ASSET MANAGEMENT FIXED INCOME IN A RISING RATE ENVIRONMENT MAY 2011
11
Common Investor Questions
Should I invest in short-term securities?A common investor reaction to rising rates is to sell intermediate-term bond portfo-lios and buy short-term bond portfolios, or even money funds. However, this may not be a prudent way to position for rising rates, depending on how fast rates rise. In periods when interest rates rose substantially, like Rising Rate Period 1 (2/1/94-2/28/95) shown in Exhibit IV, short-term bonds did outperform intermediate maturities. However, during periods of slowly increasing rates, such as Rising Rate Period 3 (6/1/04-6/30/06), intermediate-term bonds outperformed short-term bonds. This is due to their higher income offsetting price declines and their intermediate maturity lessening the impact of a flattening yield curve. Nuveen currently believes that the next Federal Funds rate increase cycle will be more similar to the 2004-2006 cycle than the 1994-1995 cycle, with a series of gradual rate hikes. Within this context, our hypothetical models show many asset classes, such as investment grade corporates and high yield bonds, may hypothetically outperform short-term asset classes.
Should I reposition my fixed income portfolio to emphasize high yield bonds?High yield bonds offer returns typically less sensitive to the impact of rising rates, but they are one of the more volatile fixed income asset classes. The total portfolio allocation to high yield bonds should always first be consistent with the investor’s risk tolerance. In most cases, this allocation will be 30% or less of the total portfolio. Using a professionally managed portfolio that can tactically allocate to high yield bonds is another way to incorporate this higher yielding, yet more potentially volatile asset class into a portfolio.
Should I sell all my bonds and invest in stocks or cash?While it may be tempting to try to time the markets, moving between broad asset classes is very difficult to time correctly. At Nuveen, we recommend creating a strategic asset allocation model and sticking with it over time with only modest adjustments. Investors should bear in mind that adding more equities to a portfolio increases its risk profile, while cash tends to dilute yield. We believe investors are better served by adjusting their fixed income allocations and taking advantage of active management rather than attempting tactical asset allocation.
NUVEEN ASSET MANAGEMENT FIXED INCOME IN A RISING RATE ENVIRONMENT MAY 2011
12
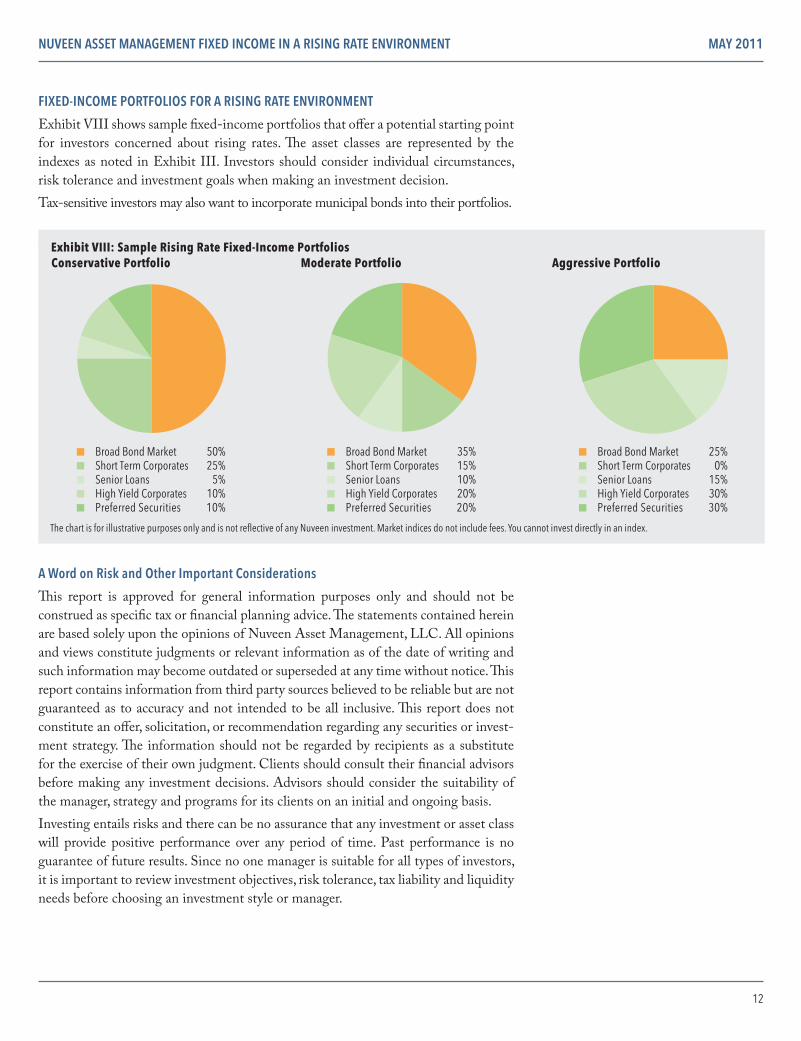
Conservative Portfolio Moderate Portfolio Aggressive Portfolio
■ Broad Bond Market 50%■ Short Term Corporates 25%■ Senior Loans 5%■ High Yield Corporates 10%■ Preferred Securities 10%
Exhibit VIII: Sample Rising Rate Fixed-Income Portfolios
■ Broad Bond Market 35%■ Short Term Corporates 15%■ Senior Loans 10%■ High Yield Corporates 20%■ Preferred Securities 20%
■ Broad Bond Market 25%■ Short Term Corporates 0%■ Senior Loans 15%■ High Yield Corporates 30%■ Preferred Securities 30%
The chart is for illustrative purposes only and is not reflective of any Nuveen investment. Market indices do not include fees. You cannot invest directly in an index.
FIXED-INCOME PORTFOLIOS FOR A RISING RATE ENVIRONMENT
Exhibit VIII shows sample fixed-income portfolios that offer a potential starting point for investors concerned about rising rates. The asset classes are represented by the indexes as noted in Exhibit III. Investors should consider individual circumstances, risk tolerance and investment goals when making an investment decision. Tax-sensitive investors may also want to incorporate municipal bonds into their portfolios.
A Word on Risk and Other Important Considerations
This report is approved for general information purposes only and should not be construed as specific tax or financial planning advice. The statements contained herein are based solely upon the opinions of Nuveen Asset Management, LLC. All opinions and views constitute judgments or relevant information as of the date of writing and such information may become outdated or superseded at any time without notice. This report contains information from third party sources believed to be reliable but are not guaranteed as to accuracy and not intended to be all inclusive. This report does not constitute an offer, solicitation, or recommendation regarding any securities or invest-ment strategy. The information should not be regarded by recipients as a substitute for the exercise of their own judgment. Clients should consult their financial advisors before making any investment decisions. Advisors should consider the suitability of the manager, strategy and programs for its clients on an initial and ongoing basis.Investing entails risks and there can be no assurance that any investment or asset class will provide positive performance over any period of time. Past performance is no guarantee of future results. Since no one manager is suitable for all types of investors, it is important to review investment objectives, risk tolerance, tax liability and liquidity needs before choosing an investment style or manager.

NUVEEN ASSET MANAGEMENT FIXED INCOME IN A RISING RATE ENVIRONMENT MAY 2011
13
Investing involves risk; principal loss is possible. Debt or fixed income securities are subject to credit risk and interest rate risk. The value of, and income generated by, debt securities will decrease or increase based on changes in market interest rates. Credit risk refers to an issuer’s ability to make interest and principal payments when due. High yield or lower rated bonds carry heightened credit risk and potential for default. Asset-backed and mortgage-backed securities are subject to additional risks such as prepayment risk, liquidity risk, default risk and adverse economic developments. The potential use of derivative instruments involves a high degree of financial risk, including the risk that the loss on a derivative may be greater than the principal amount invested. Equity investments are subject to market risk. Foreign investments involve additional risks, including currency fluctuation, political and economic instability, lack of liquidity, and differing legal and accounting standards. These risks are magnified in emerging markets. Concentration in specific sectors or securities may involve greater risk and volatility than more diversified investments, including potentially adverse economic conditions and regulatory changes.
IMPORTANT DISCLAIMERS
This analysis indicates past performance of market benchmarks over the time periods specified and in no way should be considered representative of the past performance of any actual invest product or predictive of future investment expectations and perfor-mance for these benchmarks or any actual investment products. Different benchmarks, methods and economic periods will produce different results. The results for individual portfolios may vary depending on market conditions and the composition of the port-folio. These index returns include reinvestment of income but do not reflect inflations, fees, taxes or transaction costs that would reduce performance in an actual account. All indices are unmanaged and unavailable for direct investment. The analysis contained herein is based on numerous assumptions. Different assumptions could result in mate-rially different outcomes. This report is provided for informational and educational purposes only and contains no investment advice or recommendations to buy or sell any specific securities. The statements contained herein are based upon the opinions of Nuveen Asset Manage-ment, LLC and the data available at the time of publication. All opinions and views constitute our judgments as of the date of writing and are subject to change at any time without notice. Hypothetical examples are shown for illustrative and educational purposes only. Certain information was obtained from third party sources, which we believe is reliable, but not guaranteed for accuracy or completenessIf used in connection with the offering of a mutual fund, this report must be preceded or accompanied by a prospectus.
NUVEEN ASSET MANAGEMENT FIXED INCOME IN A RISING RATE ENVIRONMENT MAY 2011
14
Descriptions Of Indices and Asset Classes
Broad Bond Market: Barclays Capital U.S. Aggregate Index represents securities that are SEC-registered, taxable and dollar denominated. The index covers the U.S. investment grade fixed rate bond market, with index components for government and corporate securities, mortgage pass-through securities, and asset-backed securities.Treasuries: Barclays Capital U.S. Treasury Index includes public obligations of the U.S. Treasury. Treasury bills are excluded by the maturity constraint but are part of a sepa-rate Short Treasury Index. In addition, certain special issues, such as state and local government series bonds (SLGs), as well as U.S. Treasury TIPS, are excluded. STRIPS are excluded from the index because their inclusion would result in double-counting. Short Term Corporate Bonds: Barclays Capital Credit 1-3 Yr Index Index is a broad-based benchmark that measures the return of bonds with 1-3 year maturities.Investment Grade Corporate Bonds: Barclays Capital U.S. Corporate Index is a broad-based benchmark that measures the investment grade, fixed-rate, taxable corporate bond market.Securitized Debt: Barclays Capital U.S. Securitized Index is a composite of asset-backed securities, collateralized mortgage-backed securities (ERISA-eligible) and fixed rate mortgage-backed securities. For Rising Rate Period 1 in Exhbit IV, Securitized Debt is represented by Barclays Capital Mortgage-backed Securities Index, which is an unmanaged index of collateralized mortgage backed securities (ERISA-eligible) securities.Senior Loans: Credit Suisse Leveraged Loan Index is designed to mirror the investible universe of the U.S. dollar-denominated leveraged loan market. Loans are added to the index if they qualify according to the following criteria: The highest Moody’s/S&P ratings are Ba1/BBB+, only funded term loans are included, and the term must be at least one year. High Yield Corporate Bonds: Barclays Capital U.S. Corporate High Yield Index measures the market of USD-denominated, non-investment grade, fixed-rate, taxable corporate bonds. Securities are classified as high yield if they fall within the middle rating of Moody’s, Fitch, and S&P is Ba1/BB+/BB+ or below. The index excludes emerging market debt.Investment Grade Municipal Bonds: Barclay’s Capital Municipal Index covers the USD-denominated long-term tax-exempt bond market. The index has four main sectors: state and local general obligation bonds, revenue bonds, insured bonds, and pre-refunded bonds. Preferred Securities: BofA Merrill Lynch Preferred Stock Fixed Rate Index is designed to replicate the total return of a diversified group of investment-grade preferred securities.
GLOSSARY
Effective duration (sometimes called option-adjusted duration) is a more refined calculation than the basic “modified duration,” which is often used. This calculation recognizes that the probability that a bond will be called or stay outstanding until maturity will vary if market interest rates change. Effective duration requires the use of a model for pricing bonds that reflects changes in the value of the bond’s “embedded options” (e.g., the right of the issuer to call the bond prior to maturity, or a sinking fund schedule) based on the probability that the option will be exercised.
Standard deviation is a measure of the vari-ance of actual returns compared to average returns over a certain period. It is a common measure of volatility and risk.
For more information, visit www.nuveen.com.
GPE-
NRIS
E-05
11D