fixed income investors presentation · numerous factors, including those reflected in the form...
TRANSCRIPT

FIXED INCOME INVESTORS PRESENTATIONHere to help you prosper
Q1 2018

2
Important information
In addition to the financial information prepared under International Financial Reporting Standards (“IFRS”), this presentation includes certain alternative performance measures (“APMs”) as
defined in the Guidelines on Alternative Performance Measures issued by the European Securities and Markets Authority on 5 October 2015 (ESMA/2015/1415es) as well as non-IFRS measures
(“Non-IFRS Measures”). The APMs and Non-IFRS Measures are performance measures that have been calculated using the financial information from the Santander Group but that are not
defined or detailed in the applicable financial information framework and therefore have neither been audited nor are capable of being completely audited. These APMs and Non-IFRS Measures
are been used to allow for a better understanding of the financial performance of the Santander Group but should be considered only as additional information and in no case as a replacement of
the financial information prepared under IFRS. Moreover, the way the Santander Group defines and calculates these APMs and Non-IFRS Measures may differ to the way these are calculated by
other companies that use similar measures, and therefore they may not be comparable. For further details of the APMs and Non-IFRS Measures used, including its definition or a reconciliation
between any applicable management indicators and the financial data presented in the consolidated financial statements prepared under IFRS, please see 2018 1Q Financial Report, published as
Relevant Fact on 24 April 2018, Section 26 of the Documento de Registro de Acciones for Banco Santander, S.A. (“Santander”) filed with the Spanish Securities Exchange Commission (the
“CNMV”) on July 4, 2017 (the “Share Registration Document”) and Item 3A of the Annual Report on Form 20-F filed with the U.S. Securities and Exchange Commission of the United States of
America (the “SEC”) on March 31, 2018 (the “Form 20-F”). These documents are available on Santander’s website (www.bancosantander.com).
The businesses included in each of our geographic segments and the accounting principles under which their results are presented here may differ from the included businesses and local
applicable accounting principles of our public subsidiaries in such geographies. Accordingly, the results of operations and trends shown for our geographic segments may differ materially from
those of such subsidiaries.
Santander cautions that this presentation contains statements that constitute “forward-looking statements” within the meaning of the U.S. Private Securities Litigation Reform Act of 1995. Forward-
looking statements may be identified by words such as “expect”, “project”, “anticipate”, “should”, “intend”, “probability”, “risk”, “VaR”, “RRAC”, “RoRWA”, “TNAV”, “target”, “goal”, “objective”,
“estimate”, “future” and similar expressions. These forward-looking statements are found in various places throughout this presentation and include, without limitation, statements concerning our
future business development and economic performance and our shareholder remuneration policy. While these forward-looking statements represent our judgment and future expectations
concerning the development of our business, a number of risks, uncertainties and other important factors could cause actual developments and results to differ materially from our expectations.
These factors include, but are not limited to: (1) general market, macro-economic, industry, governmental and regulatory trends; (2) movements in lo¬cal and international securities markets,
currency exchange rates and interest rates; (3) competitive pressures; (4) technological developments; and (5) changes in the financial position or credit worthiness of our customers, obligors and
counterparties. Numerous factors, including those reflected in the Form 20-F– under “Key Information-Risk Factors”- and in the Share Registration Document–under “Factores de Riesgo”- could
affect the future results of Santander and could result in other results deviating materially from those anticipated in the forward-looking statements. Other unknown or unpredictable factors could
cause actual results to differ materially from those in the forward-looking statements.
Forward-looking statements speak only as of the date of this presentation and are based on the knowledge, information available and views taken on such date; such knowledge, information and
views may change at any time. Santander does not undertake any obligation to update or revise any forward-looking statement, whether as a result of new information, future events or otherwise.

3
Important information
The information contained in this presentation is subject to, and must be read in conjunction with, all other publicly available information, including, where relevant any fuller
disclosure document published by Santander. Any person at any time acquiring securities must do so only on the basis of such person’s own judgment as to the merits or the
suitability of the securities for its purpose and only on such information as is contained in such public information having taken all such professional or other advice as it
considers necessary or appropriate in the circumstances and not in reliance on the information contained in this presentation. No investment activity should be undertaken on
the basis of the information contained in this presentation. In making this presentation available Santander gives no advice and makes no recommendation to buy, sell or
otherwise deal in shares in Santander or in any other securities or investments whatsoever.
Neither this presentation nor any of the information contained therein constitutes an offer to sell or the solicitation of an offer to buy any securities. No offering of securities
shall be made in the United States except pursuant to registration under the U.S. Securities Act of 1933, as amended, or an exemption therefrom. Nothing contained in this
presentation is intended to constitute an invitation or inducement to engage in investment activity for the purposes of the prohibition on financial promotion in the U.K.
Financial Services and Markets Act 2000.
Note: Statements as to historical performance or financial accretion are not intended to mean that future performance, share price or future earnings (including earnings per
share) for any period will necessarily match or exceed those of any prior year. Nothing in this presentation should be construed as a profit forecast.

4
1. Markets and Macroeconomic Environment
2. Santander Business Model & Strategy
3. Capital
4. Asset Quality
5. TLAC Requirements, Liquidity and Funding
6. Concluding Remarks
7. Appendix
UK loan portfolio: Mortgage and Corporate RE
8. Glossary
CONTENT
Markets and
Macroeconomic
Environment
01

6
Markets and Macroeconomic Environment
A favourable macroeconomic and financial environment expected in 2018
World Output 3.9%
Euro Area 2.4%
UK 1.6%
United States 2.9%
Latin America 2.0%
Mexico 2.3%
Brazil 2.3%
(1) World Economic Outlook, April 2018
IMF 2018 GDP Outlook1
Growth in developing and mature markets
Better fundamentals should lead to more resilient and
stable growth cycles
Contained inflation
Interest rate rises will be gradual (2018/2019)
Lower regulatory uncertainty
MATURE MARKETSCyclical macro acceleration
(53% attributable profit)
DEVELOPING MARKETSStructural growth remains strong
(47% attributable profit)
Santander is well-positioned for growth due to its balanced geographic diversification

7
Markets and Macroeconomic Environment
The expansionary cycle in the Spanish economy is expected to continue, backed by employment creation, higher consumption and real estate & investment recovery
Source: Santander Research Department, Bank of Spain
19.617.2
15.514.2
12.6
2016 2017 2018 (e) 2019 (e) 2020 (e)
Annual GDP Growth
Housing pricesUnemployment rate
1.4
3.4 3.33.1
2.9
2.42.1
1.4
2.01.8
2.5 2.42.0
1.7
2014 2015 2016 2017 2018 (e) 2019 (e) 2020 (e)
Spain
Eurozone
Real, %
%
50
60
70
80
90
100
110
Q4'01 Q4'03 Q4'05 Q4'07 Q4'09 Q4'11 Q4'13 Q4'15
Base 100: Q3’07 “peak”
Price index per m2 in real terms
8
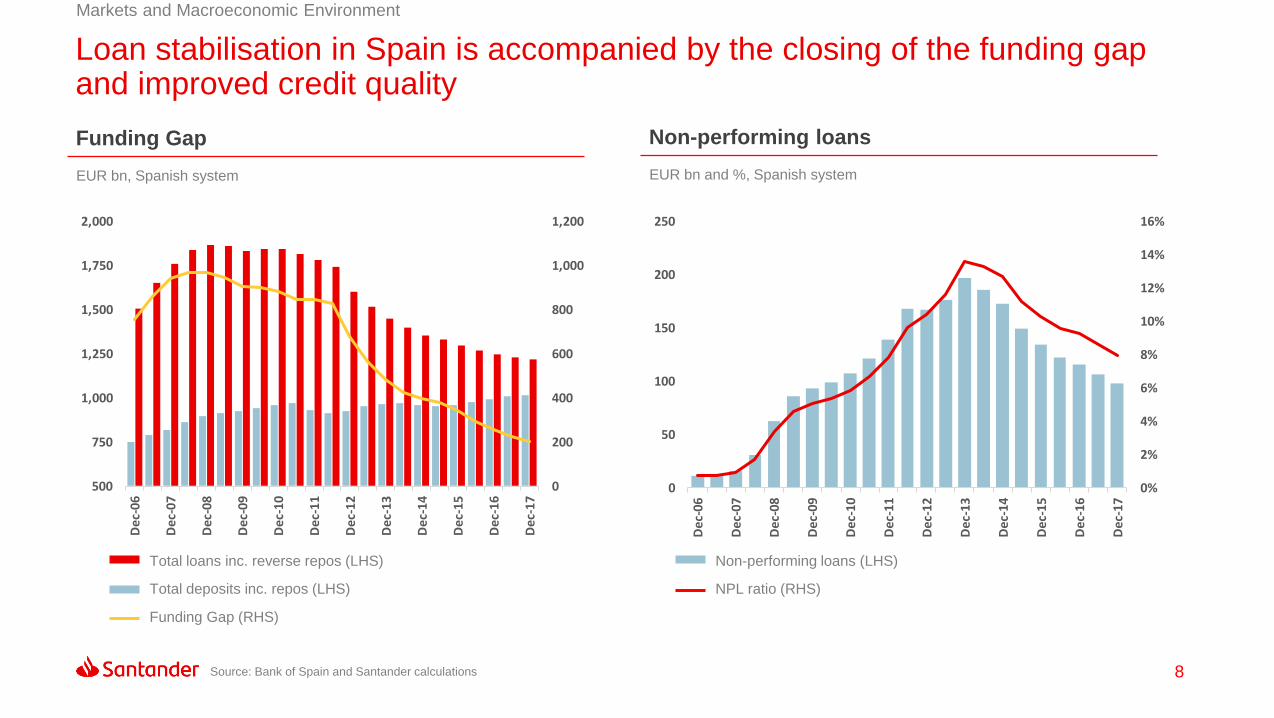
Markets and Macroeconomic Environment
Loan stabilisation in Spain is accompanied by the closing of the funding gap and improved credit quality
Non-performing loans
EUR bn and %, Spanish system
Funding Gap
EUR bn, Spanish system
0
200
400
600
800
1,000
1,200
500
750
1,000
1,250
1,500
1,750
2,000
De
c-0
6
De
c-0
7
De
c-0
8
De
c-0
9
De
c-1
0
De
c-1
1
De
c-1
2
De
c-1
3
De
c-1
4
De
c-1
5
De
c-1
6
De
c-1
7
0%
2%
4%
6%
8%
10%
12%
14%
16%
0
50
100
150
200
250
Dec
-06
Dec
-07
Dec
-08
Dec
-09
Dec
-10
Dec
-11
Dec
-12
Dec
-13
Dec
-14
Dec
-15
Dec
-16
Dec
-17
Total loans inc. reverse repos (LHS)
Total deposits inc. repos (LHS)
Funding Gap (RHS)
Source: Bank of Spain and Santander calculations
Non-performing loans (LHS)
NPL ratio (RHS)

Santander
Business Model &
Strategy
02

10
Our business model has unique competitive advantages
Santander Business Model & Strategy
Customers distributed across geographiesA differential business model
1
2
3
Serving 139 million customers with in-market
SCALE in our core markets drives profitable
growth
Our geographic diversification generates
PREDICTABLE GROWTH in profits,
resulting in lower capital needs
The subsidiary model, with a strong culture of
INNOVATION and collaboration, drives
efficiency and service excellence
Spain 12%
SCF 14%
Poland 3%
Portugal 4%
UK 18%
Brazil 28%
Mexico 11%
Chile 3%
Argentina 2%USA 4%Others 1%
139Million customers
Mar-18
11
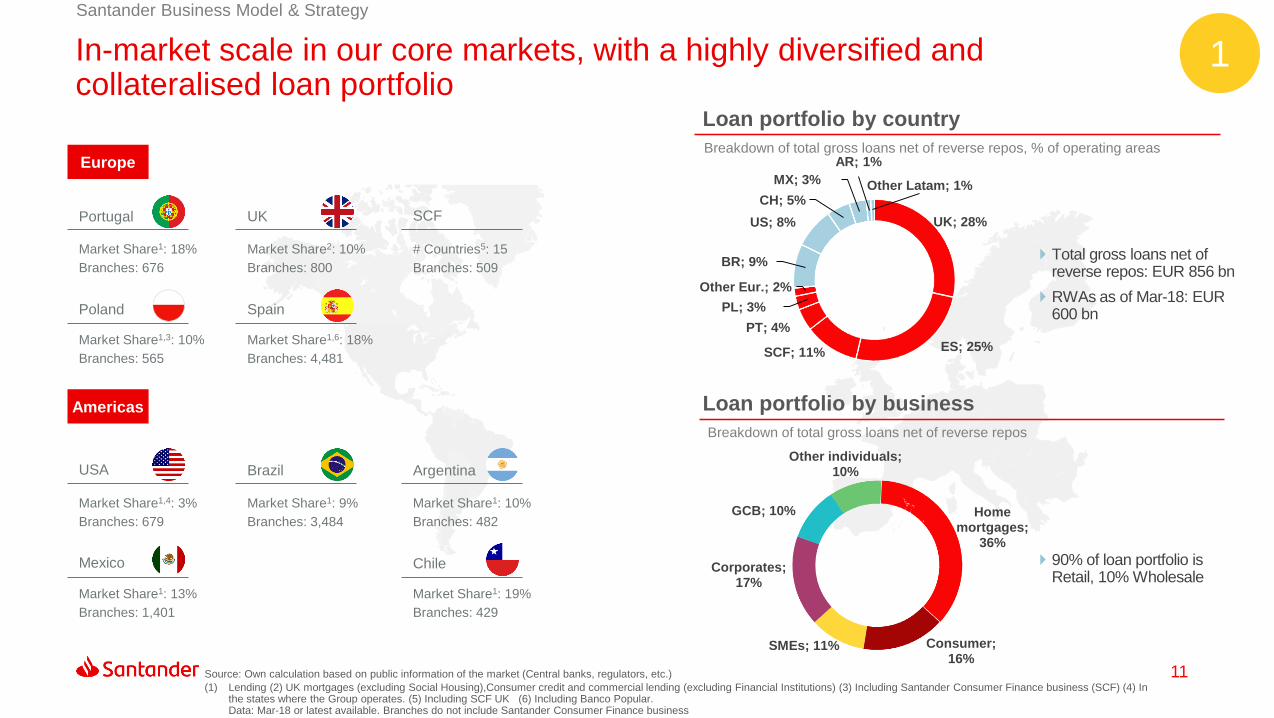
Other individuals; 10%
Home mortgages;
36%
Consumer; 16%
SMEs; 11%
Corporates; 17%
GCB; 10%
In-market scale in our core markets, with a highly diversified and collateralised loan portfolio
Source: Own calculation based on public information of the market (Central banks, regulators, etc.)
(1) Lending (2) UK mortgages (excluding Social Housing),Consumer credit and commercial lending (excluding Financial Institutions) (3) Including Santander Consumer Finance business (SCF) (4) In the states where the Group operates. (5) Including SCF UK (6) Including Banco Popular. Data: Mar-18 or latest available. Branches do not include Santander Consumer Finance business
Santander Business Model & Strategy
1
USA
Market Share1,4: 3%
Branches: 679
Argentina
Market Share1: 10%
Branches: 482
Brazil
Market Share1: 9%
Branches: 3,484
Market Share1: 19%
Branches: 429
Chile
Market Share1: 13%
Branches: 1,401
Mexico
Americas
Market Share1: 18%
Branches: 676
Portugal UK
Market Share2: 10%
Branches: 800
Market Share1,6: 18%
Branches: 4,481
Spain
Market Share1,3: 10%
Branches: 565
Poland
# Countries5: 15
Branches: 509
SCF
Europe
Loan portfolio by country
UK; 28%
ES; 25%SCF; 11%
PT; 4%
PL; 3%
Other Eur.; 2%
BR; 9%
US; 8%
CH; 5%
MX; 3%
AR; 1%
Other Latam; 1%
Breakdown of total gross loans net of reverse repos, % of operating areas
Total gross loans net of reverse repos: EUR 856 bn
RWAs as of Mar-18: EUR 600 bn
Loan portfolio by business
Breakdown of total gross loans net of reverse repos
90% of loan portfolio is Retail, 10% Wholesale

12
High and recurring pre-provision profit leads to resilient growth through the economic cycle…
PPP/Loans well above most European peers1Resilient profit generation throughout the cycle
Group attributable profit, EUR bn
1. European peers include: Barclays, BBVA, BNP, Deutsche, HSBC, ING, Intesa Sanpaolo, Lloyds, RBS, Société Générale, Standard Chartered, UBS and Unicredit
%, Q1’18, Santander calculations
2006 2007 2008 2009 2010 2011 2012 2013 2014 2015 2016 2017
7.6
9.1 8.9 8.9
8.2
5.3
2.3
4.2
5.8 6.0 6.26.6
Santander Business Model & Strategy
2
0.0
0.5
1.2
1.4
1.5
1.6
1.8
1.8
1.9
2.1
2.5
2.5
3.0
3.4

13
… and to stable and predictable growth
Predictable results with the lowest volatility among peers coupled with growth in earnings
1. Source: Bloomberg, with GAAP Criteria. Note: Standard deviation of the quarterly EPS starting from the first available data since Jan’99.
Quarterly reported EPS volatility1
4x10x1x3x4x3x6x-1x-1x3x-2x
Net income increase 1999-2017
717% 335%
128%
112%
91%
79%
51%45%
9%
44%
33%
Santander Business Model & Strategy
2

1499%
93%
76%
75%
74%
68%
65%
64%
61%
60%
60%
58%
58%
54%
53%
49%
48%
47%
UK
EU
EU
EU
EU
UK
US
UK
UK
EU
US
US
US
EU
UK
EU
EU
Operational excellence: allowing us to improve both customer satisfaction and efficiency
…with better cost-to-income than peers1Improving customer satisfaction…
Cost-to-income, Mar-18# of countries in Top 3 for customer satisfaction, Dec-17
5
7
2015 2017
>75% of PBT among
Top 3 in customer
satisfaction
18pp
better than
peer avg.
Source: Company data and Bloomberg
(1) Note: Peers included are Bank of America, Barclays, BBVA, BNP Paribas, Citibank, Deutsche, HSBC, ING, Intesa Sanpaolo, JP Morgan, Lloyds, RBS, Société Générale,
Standard Chartered, UBS, Unicredit and Wells Fargo
Santander Business Model & Strategy
3

15
The 2018 strategy is based around several different pillars
Santander Business Model & Strategy
2018Improve key
metrics
Improve
quality of
results
Strengthen
franchises
Grow
sustainably
Meet Group
objectives
Continue
commercial and
digital
transformation

16
Our commercial and digital transformation is supported by new business models, products and branches…
Santander Business Model & Strategy
Commercial
and digital
transformation
Launch of
Digital On-boarding
and new
Workcafés
First fully digital
bank
FX transfers using
Blockchain
Superdigital
Banking without a
bank
Leader in mobile
payments
Image Credit: Cymon Taylor / RM Sotheby’s
Supertankers
Speedboats
Our Supertankers are being
transformed into digital banks
Profitable growth
Independent Global Platforms.
Led by independent CEOs but
sponsored by Country Heads
Start-up model + Group support
17
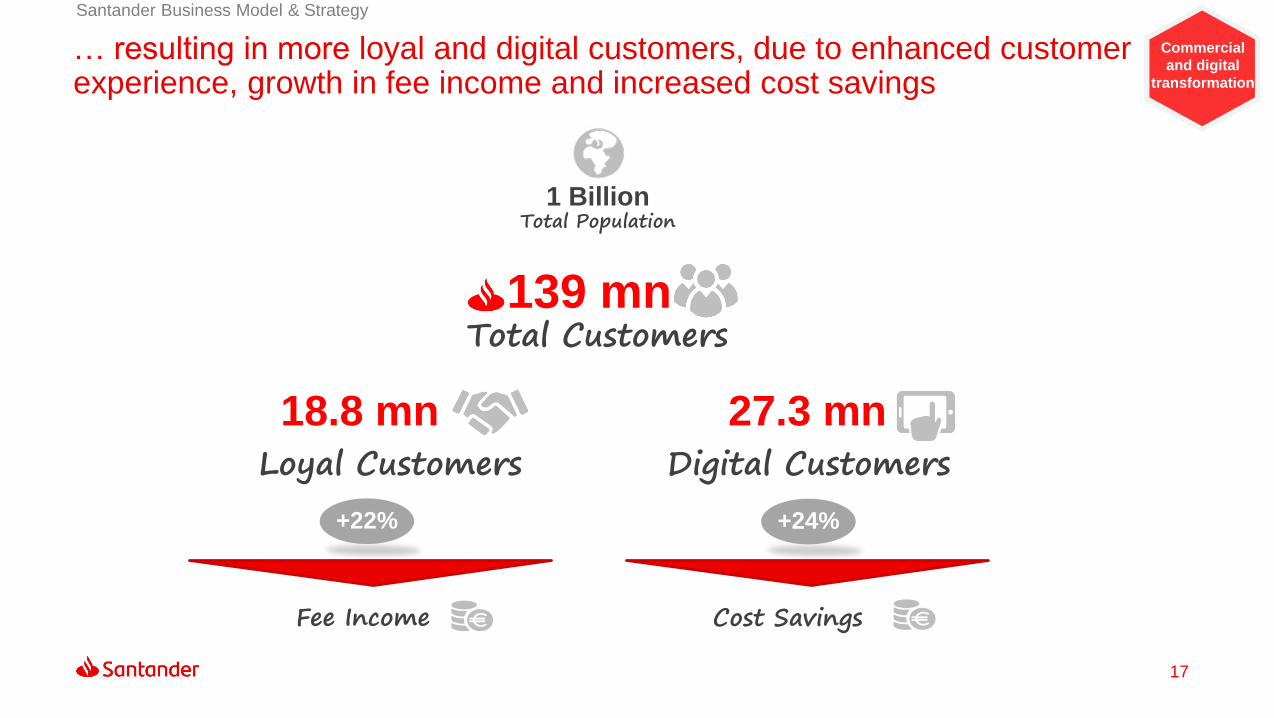
… resulting in more loyal and digital customers, due to enhanced customer experience, growth in fee income and increased cost savings
Santander Business Model & Strategy
Commercial
and digital
transformation
1 BillionTotal Population
Fee Income
+22% +24%
139 mnTotal Customers
18.8 mn 27.3 mn
Cost Savings
Loyal Customers Digital Customers

18
Santander Business Model & Strategy
Meet
Group
objectives2018 Targets2017
Loyal customers (mn) 18.617.3
Digital customers (mn) 3025.4
Fee income1 ~10% CAGR 2015-18
13%
Cost of credit risk 1.2% 2015-18 average
1.07%
Cost-to-income 45-47%47.4%
EPS (EUR) Double digit growth0.40
DPS (EUR)2 Yearly increase0.22
FL CET1 >11%10.84%
RoTE >11.5%
(1) % change in constant euros
(2) Total dividends charged to 2018 earnings are subject to the Board and AGM approval
(3) Underlying RoTE: 11.8%
We are on track to meet our 2018 targets
Q1’18
18.8
27.3
14%
1.04%
47.4%
0.120(Q1’18)
0.23
11.00%
12.4%
Positive trends makes us confident to deliver solid results in 2018
10.4%3
19
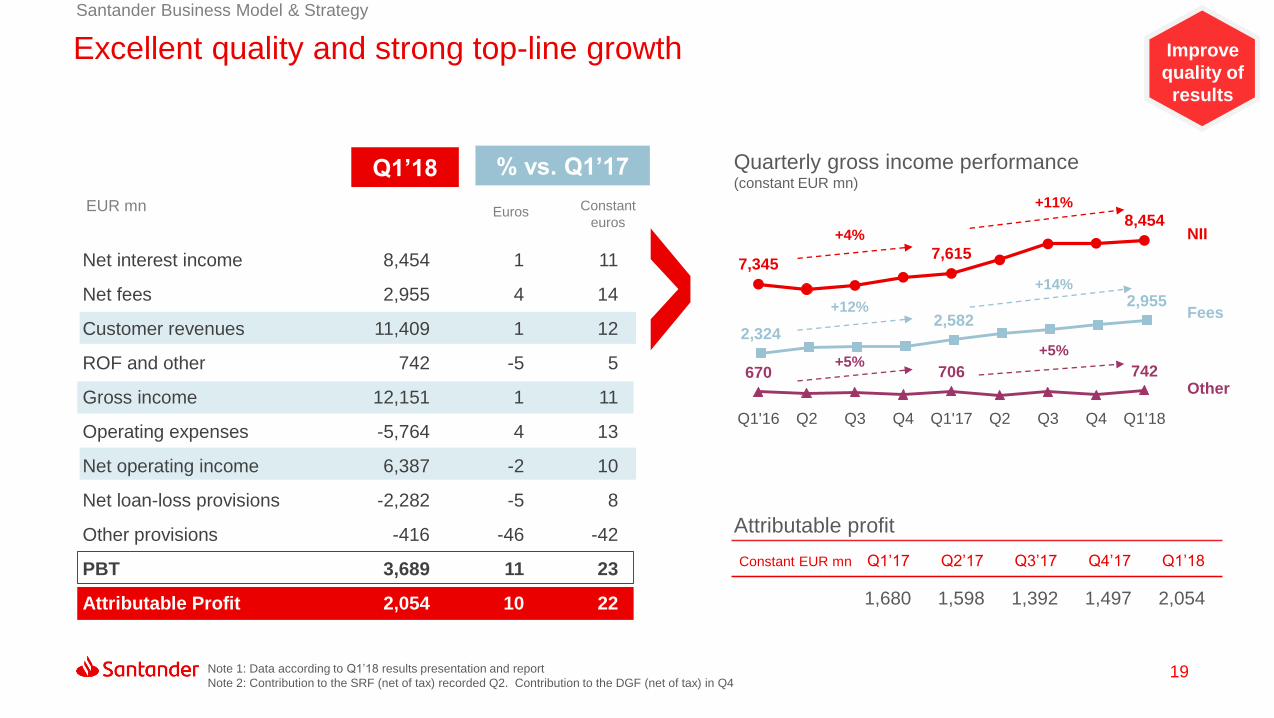
2,3242,582
2,955
7,3457,615
8,454
670 706 742
Q1'16 Q2 Q3 Q4 Q1'17 Q2 Q3 Q4 Q1'18
Excellent quality and strong top-line growth
NII
Fees
Other
Quarterly gross income performance (constant EUR mn)
Note 1: Data according to Q1’18 results presentation and report
Note 2: Contribution to the SRF (net of tax) recorded Q2. Contribution to the DGF (net of tax) in Q4
Net interest income 8,454 1 11
Net fees 2,955 4 14
Customer revenues 11,409 1 12
ROF and other 742 -5 5
Gross income 12,151 1 11
Operating expenses -5,764 4 13
Net operating income 6,387 -2 10
Net loan-loss provisions -2,282 -5 8
Other provisions -416 -46 -42
PBT 3,689 11 23
Attributable Profit 2,054 10 22
EUR mn Constant
eurosEuros
Q1’18 % vs. Q1’17
1,680 1,598 1,392 1,497 2,054
Attributable profit
Santander Business Model & Strategy
Constant EUR mn Q1’17 Q2’17 Q3’17 Q4’17 Q1’18
Improve
quality of
results
+4%
+11%
+12%
+14%
+5%+5%

20
Attributable profit growth is driven by most of our markets
Santander Business Model & Strategy
Grow
sustainably
Attributable profit by geography
EUR mn and % change vs Q1’17 in constant euros
+27%
-21%
+14%
+8%
+1%
+52%
-11%
+3%
+26%
+4%
677
455
323
320
175
151
127
125
66
63
Attributable profit1
(1) Excluding Corporate Centre and Real Estate Activity Spain
51%
UK; 13%
Spain; 18%
SCF; 13%
Portugal; 5%Poland;
2%
USA; 5%
Mexico; 7%
Brazil; 27%
Chile; 6%
Argentina; 3%Other Latam; 1%
EuropeAmericas
49%
Q1’18

21
Better than peer results across key metrics accompanied by improved asset quality
Santander Business Model & Strategy
Improve
key metrics
RoTE
Santander Mar-18, Peers Dec-17
12.4%
9%
Global Peers
47.4%
66%
Global Peers
(1) Banco Popular integration (2) IFRS 9 application
Group’s Asset QualityEfficiency Ratio
Mar-18
Coverage ratio
75
6866 65
70
NPL ratio
3.74
5.37
4.24 4.08 4.02
Mar-17 Jun-17 Sep-17 Dec-17 Mar-18
1.17%
1.04%
Q1'17 Q1'18
Cost of Credit
%
1 2

22
Main opportunities to strengthen growth in our franchises
Popular acquisition: positive delivery on a transformational
deal
SCF: Consolidate our leadership while increasing penetration
in personal loans via digital transformation
UK: Well positioned as the only full-service scale challenger
despite uncertain economic environment
USA: Efficiently relaunching our commercial banking while
improving the risk-return-profile of SCUSA
GCB: Expanding international / trade business &
collaboration revenues
Wealth Management: Strengthen our Asset Management &
Private Banking Unit
Poland: Most profitable bank among peers. Reinforce
presence with Deutsche Bank acquisition
Brazil: We have built a great and improving bank with
sustainable profit and solid organic growth
Argentina: Potential to grow & consolidate market
leadership
Mexico: High potential growth in a stable and largely
untapped market
Chile: Leaders in a stable growth and profitable market
SCF
GCB
WM
Diversification between developed and
emerging markets provides stability as
well as growth opportunities
Santander Business Model & Strategy
Strengthen
franchises
Capital
03

24
11.00%10.91%
10.05%
10.55%
10.84%
Consistent progress on reaching our target of FL CET1 >11% in 2018
Capital
+16 bps
+9 bps +8 bps
-1 bp
Fully loaded CET11
%
(1) 2018 data calculated using IFRS 9 transitory arrangements. Fully loaded IFRS 9 impact would be -23 bps (2) Blackstone (+10 bps); Metrovacesa (-2 bps)
(3) AFS and regulatory impacts (4) Capital destroyed in adverse scenario in bps, EBA stress test 2016
2 3
FL Total capital ratio: 14.66%
FL Leverage ratio: 5.1%
RoRWA : 1.59%
Q1 20181
14.10%
5.0%
1.48%
Q1 2017
0.56%
0.1%
0.11%
Diff.
RoTE : 12.4%12.1% 0.3%
FL CET1 ratio: 11.00%10.66% 0.34%Santander has a high RoTE with strong capital quality:
• The least capital destruction4 among European
peers (-199 bps vs -345 bps)
• Higher density (42% vs 33% in Mar-18)
• Better leverage (5.1 vs 5.0 fully loaded in Mar-18)
+5 bps+9 bps
-18 bps-5 bps
Pro forma ratios with
estimated impacts

25
9.70%
Group Phased-in ratiosMar-18
Regulatory requirement for2018
11.19%
4.50%
1.68%
1.50%
1.79%
1.875%
0.75%
1.50%
2.00%
Group regulatory capital and current distance to MDA
Capital
Current distance to MDA
CET1 CCoB
Pilar II requirement
Minimum Pilar I
AT1
G-SIB buffer
14.66%
T2
8.656%2
required
T2
12.156% Total capitalAT1
2.504%1
CCyB (0.031%)
Comfortable management buffer to MDA of >100 bps in regulatory transitional total capital and CET1 ratios, in line with Santander’s
business model and predictable results
As of Mar-18, the distance to the MDA for 2018 amounts is 2.504%
Significant payment capacity from distributable items: As of Mar-18, ADIs at Santander S.A.
EUR 57.2 bn, ~100x times 2018 full AT1 cost
Regulatory ratios Dec-18Target
Assumed regulatoryrequirement 1 Jan 19 CET1
>11.00%
4.50%
1.50%
2.00%
1.50%
2.50%
1.00%0.20%
CET1
CCoB
Pilar II requirement
Minimum Pilar I
G-SIB buffer
AT1
T2
~130bps4 CCyB
>14.5%
Targeted distance to MDA 1 January 20193
(1) MDA trigger= Group CET1 (11.19%) + AT1 (1.68%) + T2 (1.79%) vs. Regulatory Total Capital (12.166%) = 2.504%. 3.28% 1 year ago.
(2) 8.656% is the MDA threshold which reflects the minimum CET1 to be maintained by the Santander Group as communicated by the ECB on its decision regarding prudential minimum capital
requirements for 2018 following the results of the Supervisory Review and Evaluation Process (SREP) (3) Assuming stability in the minimum requirements.
(4) Assuming the fulfillment of AT1 and T2 during 2018

26
11.00%
1.49%
1.94%
Santander is committed to fulfil the AT1&T2 buckets through the transitional period
Capital
TIER2
TIER1
TIER2
TIER1
>11%
1.5%
2.0%
CET1 Generation2
AT1 issuances to target
T2 issuances to target
~6bps
~1 bp
~10-20
bps
Note: Assuming constant RWAs (1) Total capital ratio fully-loaded IFRS 9 phased-in (2) Net of pro forma estimated impact + organic generation.
All amounts except Mar-18 are targets
14.43%>14.5%
Group FL Total Capital
ratio Mar-181
Group FL Total Capital
ratio 2018E
AT1 issuance to target 1.5% of RWAs is
close to zero assuming constant RWAs.
T2 issuance to target 2% of RWAs
~EUR 0.4 bn

27
FX hedging policy on capital ratio and P&L…
Capital
Group
FL CET1
11.00%
Hedged
Exposure
Dynamic P&L hedging policy
Mitigate impact of FX volatility
Corporate Centre assumes all hedging costs
Manages FX volatility in our FL CET1 ratio
Based on Group regulatory capital and
RWAs
Stable capital ratio hedge Our P&L Policy
28
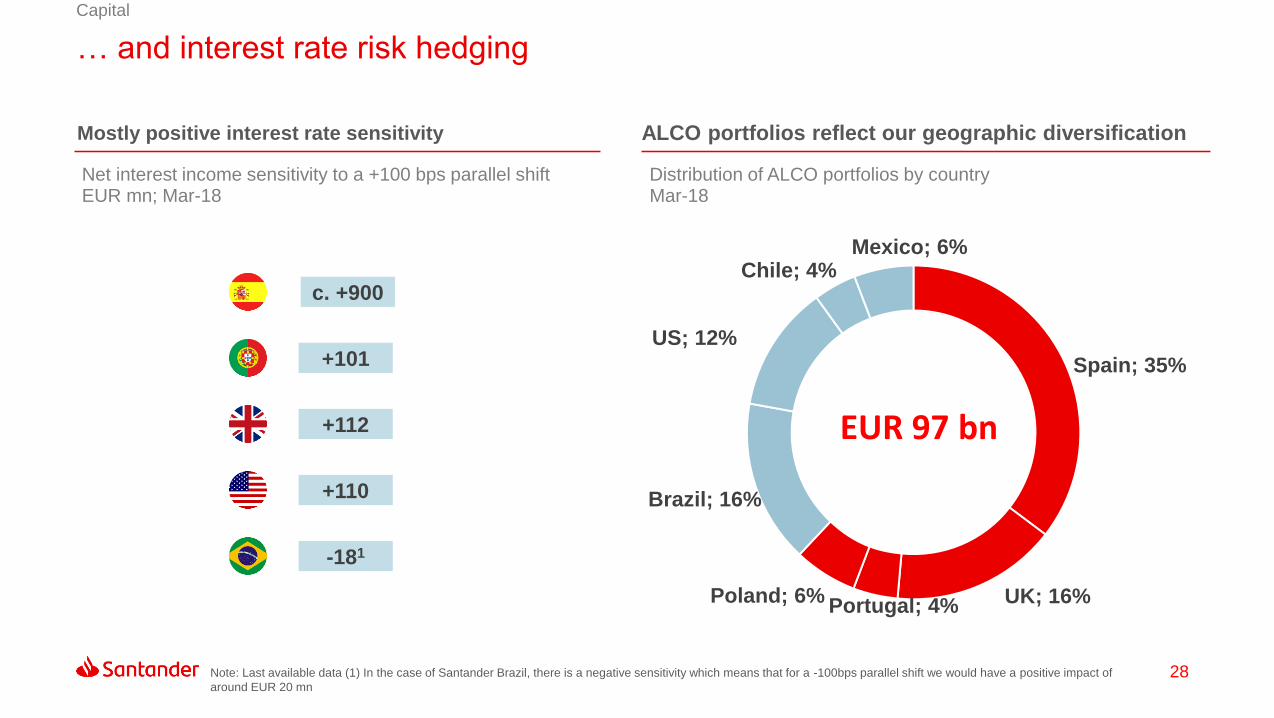
… and interest rate risk hedging
Capital
Spain; 35%
UK; 16%Portugal; 4%Poland; 6%
Brazil; 16%
US; 12%
Chile; 4%Mexico; 6%
EUR 97 bn
Note: Last available data (1) In the case of Santander Brazil, there is a negative sensitivity which means that for a -100bps parallel shift we would have a positive impact of
around EUR 20 mn
ALCO portfolios reflect our geographic diversificationMostly positive interest rate sensitivity
Net interest income sensitivity to a +100 bps parallel shiftEUR mn; Mar-18
Distribution of ALCO portfolios by country Mar-18
+101
+112
+110
-181
c. +900

Asset Quality
04

30
All asset quality ratios improved with cost of credit achieving the Investor Day goals
Asset Quality
Credit quality ratios NPL ratios by country
%
NPL ratio4.36
3.934.08 4.02
2015 2016 2017 Q1 2018
Cost of credit1.25
1.18
1.071.04
2015 2016 2017 Q1 2018
Q4 2017 Q1 2018
Spain 6.32 6.27
SCF 2.50 2.48
Poland 4.57 4.77
Portugal 7.51 8.29
United Kingdom 1.33 1.17
Brazil 5.29 5.26
Mexico 2.69 2.68
Chile 4.96 5.00
Argentina 2.50 2.54
USA 2.79 2.86
Cost of credit ratios by country
% Q4 2017 Q1 2018
Spain 0.30 0.29
SCF 0.30 0.36
Poland 0.62 0.69
Portugal 0.04 0.08
United Kingdom 0.08 0.10
Brazil 4.36 4.35
Mexico 3.08 2.95
Chile 1.21 1.22
Argentina 1.85 2.06
USA 3.42 3.29
%

31
Coverage ratio well situated among European peers with higher collateralisation
Asset Quality
Coverage ratio Coverage vs European Peers
%, Santander Mar-18, Peers1 latest available data
73 74
65
70
2015 2016 2017 Q1 2018
%
34
43
45
50
57
60
63
63
63
66
70
73
78
EU
UK
UK
UK
EU
EU
EU
UK
UK
EU
San
EU
EU
1. European peers include: Barclays, BBVA, BNP, Deutsche, HSBC, ING, Intesa Sanpaolo, Lloyds, RBS, Société Générale, Standard Chartered and Unicredit.
Note: Data taken from banks’ published accounts and definitions may not be homogeneous

32
Continuing the reduction of real estate exposure
Asset Quality
41.1
5.2
30.7
5.2
(1) Spain Real Estate activity
Following the acquisition of Banco Popular, we announced our
intention to reduce Grupo Santander’s NPE
Agreement with Blackstone was completed in March 2018
according to plan:
No material impact on results
Positive impact of 10 bps on the CET1 capital ratio
As a result of this operation the Spain Real Estate unit has an
exposure of EUR 5.2 billion
Gross
value
Jun-17
Blackstone
transaction
and other
Provisions
EUR bn
Real estate exposure1
Net
value
Mar-18
Mar-18EUR bn
Net value
Real estate assets 4.0
Foreclosed assets 2.8
Rental assets 1.2
RE non-performing loans (NPLs) 1.2
RE assets + RE non-performing loans 5.2
We will continue reducing this exposure
in the coming quarters
TLAC Requirements,
Liquidity and
Funding
05

34
TLAC requirements are manageable and an optimisation exercise for Santander
TLAC Requirements, Liquidity and Funding
The TLAC requirements regulation is a “work in progress”. On 23
November 2016, the European Commission published the proposals to
amend the CRD IV and CRR
On the same date, the European Commission also published a proposal
for the amendment of the BRRD regarding the ranking of unsecured debt
instruments in the creditor insolvency hierarchy
(the ‘Senior Ranking Harmonisation Directive’)1
The amendments include measures that will implement the TLAC
requirement into EU and national law
Implementation of the TLAC requirement is expected to phase-in from
1 January 2019: 16% from 1 January 2019 (18% from 2022)
plus applicable capital buffers
Santander has a resolution strategy approach of multiple point of entry
(MPE). The TLAC requirement is expected to be requested at each
resolution entity
Using the Group requirements as a proxy for the aggregate TLAC
requirement
TLAC phase-in requirements
4.5%
14.5%
> 2.5%
1.5%
2.5%
2.0%
8.0%
2.5%
1.0%
Indicative
amount of
Senior Non-
Preferred
subject to
significant
issues still
under
discussion
19.5%Eligible
Senior
2018 Total
Capital
Target
CET1
AT1
T2
TLAC
CCoB3
G-SIB2
Jan 2019 TLAC
phased-in requirements
CRD IV: Capital requirement directive. CRR: capital requirement regulation. BRRD: Bank recovery and resolution directive.
(1) According to proposal of Senior Ranking Harmonisation Directive, Royal Decree-law 11/2017 of 23 June on urgent actions on financial matters was approved
by the Spanish Government, creating the new category of senior non-preferred debt under Spanish Law
(2) G-SIB buffer. (3) Capital Conservation Buffer

35
The Group’s business model combines local knowledge with global best practices through legally, financially and operationally autonomous subsidiaries…
Banco Santander S.A.
Banco
Santander
Totta.
Bank
Zachodni
WBK
Santander
UK Group
Holdings
Santander
Holdings
USA Banco
Santander
BrasilGrupo
Financiero
Mexico Banco
Santander
Chile Banco
Santander
Río
100
%99% 70% 100
%
100
%
89% 75% 67% 99%
Santander
Consumer
Finance
Banco
Popular
100
%
Legal autonomy structure
Dec-17
Legal autonomy: There are no legal commitments that imply financial support.
Financial autonomy: Financial interconnections are limited and at market prices.
Operational autonomy: Shared services are limited and carried out through autonomous factories. Access to FMIs through other
Group entities is very limited.
TLAC Requirements, Liquidity and Funding

36
13
… divided into different resolution groups that can be resolved separately though multiple entry points
MPE resolution strategy
Dec-17, EUR bn
We have defined the Resolution Groups (RGs) mirroring the model of autonomous financial groups so that all entities have
been assigned to one RG
Each RG comprises the entity identified as the entry point in resolution and the entities that belong to it
PE Point of Entry
Resolution Group
Spain (Parent) United Kingdom
Brazil USA
ChileMexicoPoland
Argentina
Size of Resolution Groups (Total assets by geography)
651 361
162 114
58 5032
Portugal
48
SpainPE
PortugalPE
Banking Union
UKPE
PolandPE
European Union 3rd Countries
BrazilPE
MexicoPE
ArgentinaPE
ChilePE
USAPE
TLAC Requirements, Liquidity and Funding

37
Santander’s MPE approach follows its autonomous capital and liquidity model, though there are still issues under discussion with regards to TLAC application
Significant issues still under discussion
Mexico
USA UK
Poland
Chile
Brazil
SantanderS.A.
Argentina
16.64
18.26
19.92
11.19
12.44
15.71
11.11
13.84
13.98
13.20
14.24
15.27
9.73
9.73
12.01
15.30
18.07
18.36
15.31
15.31
16.67
12.53
15.30
17.83
19.39
21.82
24.12
CET1
T1
Total
Portugal
Local figures as of Mar-18 in percent (phased-in)
Final TLAC transposition to EU and
relevant jurisdictions
TLAC level and perimeter of resolution
groups
Eligible Senior debt final treatment
Internal TLAC requirement
Deductions and mitigants final treatment
TLAC Requirements, Liquidity and Funding

38
Santander’s liquidity management is based on the following principles:
Decentralised liquidity model
Needs derived from medium- and long-term activity must be financed by medium- and long-term instruments
High contribution from customer deposits, due to the retail nature of the balance sheet
Diversification of wholesale funding sources by instruments/investors, markets/currencies and maturities
Limited recourse to wholesale short-term funding
Availability of sufficient liquidity reserves, including the discount window / standing facility in central banks to be
used in adverse situations
Compliance with regulatory liquidity requirements both at Group and subsidiary level, as a new conditioning
management factor
TLAC Requirements, Liquidity and Funding

39
Conservative and decentralised liquidity and funding model
Very manageable maturity profileEUR 12 bn1 issued during Q1 2018
EUR bn, Mar-18
US
0
Portugal
0
UK
4.6
SCF
0.7
Chile
0.5
SantanderS.A.
4.7
Argentina
0.3
Poland
0
Brazil
1.3
Mexico
0
2018 2019 2020 2021 2022 2022+
(1) Data include issuances from all units and the following product types covered bonds, senior, senior non-preferred (“Senior TLAC”), preferred stock, subordinated, with period-average exchange rates
EUR bn
Santander
S.A.1.3 1.9 4.2 2.3
6.9
35.3
2018 2019 2020 2021 2022 2022+
UK 2.86.8
10.97.1
3.1
17.5
2018 2019 2020 2021 2022 2022+
SCF 3.0 4.1 3.9 1.6 2.7 0.8
2018 2019 2020 2021 2022 2022+
Brazil 3.0 1.8 2.7 0.0 0.0 0.1
2018 2019 2020 2021 2022 2022+
TLAC Requirements, Liquidity and Funding

40
Santander S.A.’s Funding Plan is focused on TLAC-eligible instruments, following our decentralised liquidity and funding model
Santander S.A. issuances YTDSantander S.A. Funding Plan 2018
(1) Data include issuances from all units and the following product types covered bonds, senior, senior non-preferred (“Senior TLAC”), preferred stock, subordinated, with
period-average exchange rates (2) Excluding securitisations
EUR mn
PUBLIC Product Nom. EUR Maturity Coupon Spread 6M
January SNP 1,250 7 1.13% MS+60bps
February Sub 1,250 10 2.13% MS+110bps
March AT1 1,500 Perp 4.75% MS+409bps
SNP 405 5 US3M+1.12% MS+66bps
SNP 1,014 5 3.85% MS+66bps
SNP 1,014 10 4.38% MS+99bps
Total YTD 6,433
April
PRIVATE Currency Nominal Maturity Reoffer
Q1 2018 EUR 691 7 MS+54bps
1.50 1.00
7-10
1.50 1.25
4.40
AT1 T2 SNP
Funding Plan Issued YTD
EUR bn, Apr-18
TLAC Requirements, Liquidity and Funding

41
Well-funded, prudent and highly liquid balance sheet with high contribution from customer deposits and diversified wholesale instruments
179
24
88
131
857
157
45
767
Assets Liabilities
ST Funding
Securitisations
Equity and other
Net loans to
customers
Financial assets
Fixed assets & other
Deposits
M/LT Funding
Liquidity Coverage Ratio (LCR)
Note: Liquidity balance sheet for management purposes (net of trading derivatives and interbank balances) (1) Provisional data, includes Banco Popular (2) Parent bank
1,124 1,124
Liquidity Balance Sheet
EUR bn, Mar-18
132%
145%2
119%
146%1
Group
Net Stable Funding Ratio (NSFR)
121%
105%2
109%
111%1
Mar-18 Dec-17
TLAC Requirements, Liquidity and Funding

42
The main metrics show the strength and stability the Group’s liquidity position…
Evolution of key liquidity metrics1
(1).- Balance sheet for liquidity management purposes.Note: in 2013 customer deposits include retail commercial paper in Spain (excluding short-term wholesale funding). The 2013 ratios include SC USA by global integration.
Note: all figures as of 2017 include Popular
2013 2014 2015 2016 2017 Q1'18
Net loans / net assets 74% 74% 75% 75% 75% 76%
Net loan-to-deposit ratio (LTD) 112% 113% 116% 114% 109% 112%
Customer deposits and medium-
and long-term funding / net loans118% 116% 114% 114% 115% 113%
Short-term wholesale funding /
net liabilities2% 2% 2% 3% 2% 2%
Structural liquidity surplus / net
liabilities16% 15% 14% 14% 15% 14%
Encumbrance 26% 26% 25% 28% -
LTD and MLT funding metrics by geography
Mar-18
LTD Ratio
(Deposits + M/LT
funding) / Net lending
Spain 88% 142%
Portugal 102% 111%
SCF 243% 66%
Poland 89% 114%
UK 114% 110%
Brazil 101% 122%
Mexico 88% 122%
Chile 143% 95%
Argentina 78% 134%
USA 136% 112%
Group total 112% 113%
TLAC Requirements, Liquidity and Funding

43
… backed by a strong liquidity buffer in every subsidiary
Note: all figures as of 2017 include Popular
Liquidity buffer by subsidiary
Dec-17, EUR bn
54.8
9.86.3
9.06.2
52.6
17.013.2
9.6
5.0 3.91.4
Total Buffer: EUR 188.8 bn
TLAC Requirements, Liquidity and Funding
44
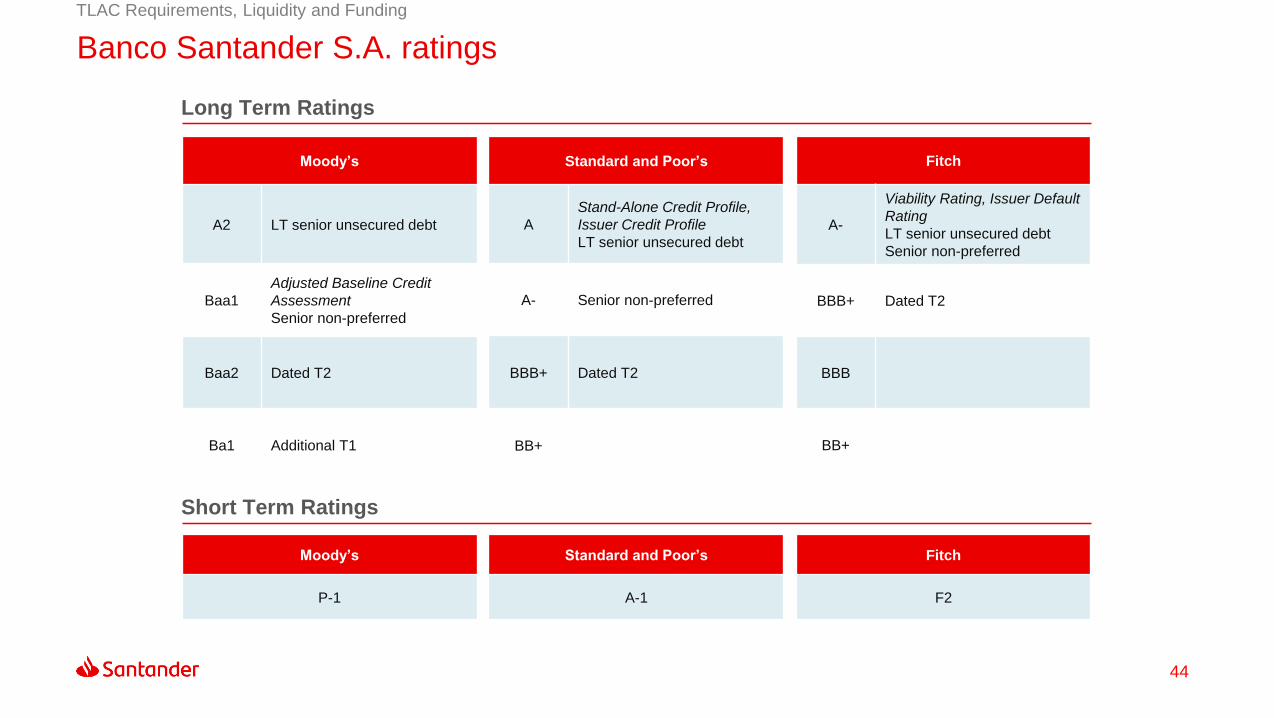
Banco Santander S.A. ratings
Long Term Ratings
Fitch
A-
Viability Rating, Issuer Default
Rating
LT senior unsecured debt
Senior non-preferred
BBB+ Dated T2
BBB
BB+
Standard and Poor’s
A
Stand-Alone Credit Profile,
Issuer Credit Profile
LT senior unsecured debt
A- Senior non-preferred
BBB+ Dated T2
BB+
Moody’s
A2 LT senior unsecured debt
Baa1
Adjusted Baseline Credit
Assessment
Senior non-preferred
Baa2 Dated T2
Ba1 Additional T1
Short Term Ratings
Moody’s
P-1
Standard and Poor’s
A-1
Fitch
F2
TLAC Requirements, Liquidity and Funding

Concluding
Remarks
06

46
Concluding Remarks
The Group’s stable capital generation is supported by strong pre-provision profits providing Santander with a high
capacity to absorb provisions and underpins the Group's capacity to generate future earnings
Strong capital levels in line with Santander’s business model based on geographic diversification, solid market
positions in areas where it operates and independent subsidiary model in terms of capital and liquidity
The Group is well above the regulatory capital requirement with significant payment capacity from distributable
items, while maintaining comfortable margins to conversion and MDA triggers
The Group continues with its objective to organically generate 40bps of fully loaded CET1 per year, maintaining
business growth and dividend payment
TLAC/MREL requirements are manageable and remain a key focus in 2018 and represent an optimisation exercise
for Santander
Comfortable liquidity position: Compliance with regulatory liquidity requirements established at Group and
subsidiary levels ahead of schedule, with high availability of liquidity reserves
Concluding Remarks
Appendix:
UK loan portfolio: Mortgage
and Corporate Real Estate
07

48
Robust retail banking credit performance
Appendix: UK loan portfolio: Mortgage and Corporate RE
Retail Banking NPLs Retail Banking loss allowances and write-offs
2,5202,340
2,105 2,129
Dec-15 Dec-16 Dec-17 Mar-18
1.51%
1.39%
1.25% 1.25%
823
583491
617
Dec-15 Dec-16 Dec-17 Mar-18
Loan loss allowance
Write-offs during the period
NPL ratio
248210 195
47
FY 15 FY 16 FY 17 3M 18
GBP mn GBP mn
Balance of Retail Banking loans (GBP bn)
168.6167.0 169.0 170.6

49
Well diversified CRE portfolio
Credit performance Sector analysis
Stock %, Dec-17
(1) Consists of smaller value transactions, mainly commercial mortgages (2) Excludes standardised portfolio
27
1714 14
12
8
42 2
Office Retail Industrial Mixed use Residential Standardisedportfolio
Hotels andleisure
Student acc Other
NPL ratio 2.00% 0.85%
NPL coverage ratio 32% 78%
Up to 70% LTV 88% 88%
70% to 100% LTV 2% -
> 100% LTV 1% 1%
Standardised portfolio1 7% 8%
Total committed exposure £9.0bn £8.1bn
98% 97%
Development loans 2% 3%
100% 100%
Total with collateral
Dec-16 Dec-17
Dec-16 Dec-17
No new business written above 70% LTV (Dec-16: 0%)
91% written at or below 60% LTV (Dec-16: 95%)
Weighted average LTV on exposures Dec-17: 48% (Dec-16:
50%)2
Average loan size of £4.8 mn at Dec-17 (Dec-16: £4.8 mn)
NPL ratio decreased primarily due to the sale of collateral to
repay two impaired loans, as well as other redemptions and
write-offs of older vintage loans
Appendix: UK loan portfolio: Mortgage and Corporate RE

50
154.9 156.8
7.6 7.7
(5.7)
Dec-17 New business Redemptions& repayments
Internaltransfer
Mar-18
Prime residential mortgage book of GBP 154.9 bn
Mortgage borrower profile Mortgage lending
GBP bnStock %, Dec-17
Fixed rate; 66%Variable Rate; 19%
Standard Variable Rate (SVR); 15%
24
111314
24
32
Northern IrelandScotlandSouth West,Wales and Other
Midlands andEast Anglia
NorthLondonSouth East
Mortgage product profile Geographic distribution
Stock %, Dec-17Stock %, Dec-17
(1) Variable rate includes tracker and base rate linked products (2) Full interest only loans and the element of part-and-part attribution to interest only balances,
excluding BTL mortgages (3) Refer to glossary at www.santander.co.uk/uk/about-santander-uk/investor-relations-glossary for a full definition
c. 77% of maturing mortgages retained3
1
Home movers; 44%
Remortgages; 33%
First time buyers; 19%
Buy to Let; 4%
29% interest only mortgages (Dec-16: 31%)2
Appendix: UK loan portfolio: Mortgage and Corporate RE

51
Consistently prudent mortgage lending criteria
Mortgage loan distribution Loan-to-Value (LTV)
Less than £0.25mn 71.6% 69.1%
£0.25m - £0.5mn 21.3% 23.3%
£0.5m - £1mn 6.3% 6.8%
£1m - £2mn 0.7% 0.7%
Loan size distribution (stock)
0.1% 0.1%
100% 100%
Over £2mn
Dec-16 Dec-17
Average loan size distribution (new business)
London and South East £264k £260k
Rest of UK £144k £146k
All UK £198k £196k
3.16 3.16Loan-to-income multiple1
(1) Average earnings multiple of new business at inception in the periods (2) Unweighted average loan-to-value of all accounts
New lending 65% 62%
Stock 43% 42%
Simple average LTV2
Dec-16 Dec-17
> 85% - 100% 4% 4%
> 100% 1% 1%
Indexed LTV distribution (stock)
New lending % with LTV >85% 17% 19%
24,000 first-time buyers (£4.0bn gross lending)
7,500 BTL mortgages (average LTV of 61%)
Appendix: UK loan portfolio: Mortgage and Corporate RE

Glossary
08
53
Glossary and Acronyms
Glossary
ADIs: Available distributable items
AFS: Available for sale
bn: Billion
Bps: Basis points
CCoB: Capital Conservation Buffer
CCyB: Countercyclical buffer
CET1: Common equity tier 1
DGF: Deposit Guarantee Fund
DPS: Dividend per share
EPS: Earning per share
FL: Fully loaded
G-SIBs: Global Systemically Important Banks
K: thousands
LTV: Loan to Value
LLPs: Loan-loss provisions
MDA: Maximum distributable amount
M/LT: Medium / long term
mn: Million
MXN: Mexican Pesos
NII: Net interest income
NPL: Non-performing loans
n.m.: Non meaningful
PBT: Profit before tax
P&L: Profit and loss
RoRWA: Return on risk-weighted assets
RWA: Risk-weighted assets
RoTE: Return on tangible equity
SCF: Santander Consumer Finance
GCB: Global Corporate Banking
SMEs: Small and Medium Enterprises
SRF: Single Resolution Fund
ST: Short term
SVR: Standard variable rate
TLAC: Total Loss-Absorbing Capacity
TNAV: Tangible net asset value
YoY: Year-on-Year
UK: United Kingdom
US: United States

Thank you.
Our purpose is to help people
and business prosper.
Our culture is based on believing
that everything we do should be