fl wiz training manual 9-08… · cra/fl wiz file but allows a user to change and/or add new...
TRANSCRIPT

Fair Lending Wiz®
Training Guide
Date: 9/2008
© Wolters Kluwer Financial ServicesWiz is registered in the U.S. Patent and Trademark Office.


Fair Lending Wiz Training Guide Table of Contents
Chapter 1 – Importing ...................................................................................................................... 7 Overview ........................................................................................................................................ 8 Exercise 1: Importing a File Into FL Wiz ................................................................................. 9 Exercise 2: Updating an Existing File ......................................................................................21 Chapter 2 – Editing Data for Fair Lending .............................................................................29 Overview .....................................................................................................................................30 Exercise 1: Reviewing Data .......................................................................................................31 Exercise 2: Replacing Zeroes with “Nulls” .............................................................................41 Exercise 3: Using Modify Codes to Allow User Defined Fields to be Used......................45 Chapter 3 – Custom Tables ..........................................................................................................51 Overview ......................................................................................................................................52 Exercise 1: Obtaining a Distribution by Loan Product.........................................................53 Exercise 2: Calculating the Average APR by Loan Product .................................................61 Chapter 4 – File Management ....................................................................................................69 Overview ......................................................................................................................................70 Exercise 1: Copying a File..........................................................................................................71 Exercise 2: Copy with Filter ......................................................................................................73 Exercise 3: Modifying a File’s Structure...................................................................................78 Exercise 4: Adding Values to a New Field ..............................................................................81 Exercise 5: Adding/Modifying New Codes ............................................................................86 Exercise 6: Transferring/Installing a File ................................................................................89 Chapter 5 – Introduction to Statistics........................................................................................93 Overview ......................................................................................................................................94 Chapter 6 – Fair Lending Examination Procedures .............................................................99 Examination Scope Guidelines ...............................................................................................101 Understanding Credit Operations....................................................................................102 Evaluating the Potential for Discriminatory Conduct ..................................................104 Compliance Program Discrimination Risk Factors.......................................................106 Identify Residential Lending Risk Factors.............................................................................107 Overt Risk Factors .............................................................................................................109 Underwriting Risk Factors ................................................................................................109 Pricing Risk Factors ...........................................................................................................109 Steering Risk Factors..........................................................................................................110 Redlining Risk Factors .......................................................................................................110 Marketing Risk Factors......................................................................................................112

Table of Contents
Copyright Wolters Kluwer Financial Services 2008 TOC-2 Rev. 09-08
Identify Consumer Lending Risk Factors..............................................................................113 Identify Commercial Lending Risk Factors...........................................................................114 Chapter 7 – Data Integrity and Scoping .................................................................................117 Overview ....................................................................................................................................118 Exercise 1: Generating Reports with Filters..........................................................................119 Summary Report – Action Taken and Standard Summary Report without Filters..120 Summary Reports with Filters ..........................................................................................125 Exercise 2: Generating Data Quality Reports.......................................................................127 Understanding Data Quality Reports ..............................................................................130 Applying a Filter to Data Quality Reports......................................................................132 Exercise 3: Generating and Understanding Difference of Means Reports ......................138 Analyzing the APR.............................................................................................................143 Analyzing the Credit Score................................................................................................146 Analyzing Denied Credits using the Difference of Means Reports............................147 Exercise 4: Generating Risk Factor Reports .........................................................................149 Disparities in Denial Rates (Underwriting).....................................................................153 Disparities in Processing Times (Underwriting) ............................................................156 Credit Score Overrides (Underwriting) ...........................................................................159 Proportion of FHA versus Conventional Mortgages (Steering) .................................164 Redlining Reports ...............................................................................................................166 Exercise 5: HMDA Scoping Reports .....................................................................................168 Differences in Average Rate Spread ................................................................................171 Pricing Disparity Summary ...............................................................................................173 Risk Score by Geography ..................................................................................................175 Chapter 8 – Introduction to Decisioning Regression .........................................................179 Overview of Logistic Regression ...........................................................................................180 Specific Examples of Logistic Regression .............................................................................181 Chapter 9 – Decisioning Regression .......................................................................................183 Overview – Factors to Use in Regression Models ...............................................................184 Exercise 1: Creating a Decisioning Regression Model ........................................................185 Exercise 2: Analyzing Decisioning Regression Results .......................................................191 Advanced Statistics.............................................................................................................195 Race ......................................................................................................................................196 Denied and Review – Details ...........................................................................................197 Reviewing the Applicant Detail Record..........................................................................199 Visual Analysis ....................................................................................................................201 Exercise 3: Changing the % Cutoff ........................................................................................208 Exercise 4: Exporting and Printing Lists of Applicants ......................................................211 Chapter 10 – Hands-On Exercise Decisioning Regression ..............................................219
Table of Contents
Copyright Wolters Kluwer Financial Services 2008 TOC-3 Rev. 09-08
Chapter 11 – Introduction to Pricing Regression.................................................................223 Overview of Linear Regression...............................................................................................224 Chapter 12 – Mortgage Pricing Regression ...........................................................................225 Overview ....................................................................................................................................226 Exercise 1: Creating a Pricing Regression Model for a Mortgage File ..............................227 Exercise 2: Analyzing the Mortgage Pricing Regression Results........................................233 Result of “Above Predicted” ............................................................................................236 Analyzing the Results Using Visual Analysis..................................................................240 Chapter 13 – Hands-On Exercise – Pricing Regression ....................................................245 Chapter 14 – Best Practices for Regression ...........................................................................249 Chapter 15 – Introduction to Comparative File Review.....................................................255 Overview ....................................................................................................................................256 Decisioning Comparison Classifications ...............................................................................258 Chapter 16 – Decisioning Comparison by Race/Ethnicity ..............................................259 Exercise 1: Creating a Comparative File Review Model......................................................260 Match Factors versus Tolerance Factors ........................................................................262 Exercise 2: Analyzing the File Comparison Results.............................................................268 Using the Results of the Decisioning Regression Model .............................................269 Visual Analysis ....................................................................................................................274 Exercise 3: Exporting the Side-by-Side Comparison to Excel ...........................................278 Preparing the Spreadsheet ................................................................................................280 Sorting Left to Right in Excel...........................................................................................283 Chapter 17 – Hands-On Exercise Decisioning Comparison............................................285 Chapter 18 – Pricing Comparison.............................................................................................289 Exercise 1: Creating a Pricing Comparison Model...............................................................290 Exercise 2: Setting the Model to be a “Race” Model...........................................................297 Exercise 3: Analyzing the File Comparison Results.............................................................301 Chapter 19 – Hands-On Exercise Pricing Comparison .....................................................309 Chapter 20 – Best Practices for Comparative File Review ................................................313 Chapter 21 – Focal Point Report ...............................................................................................319 Overview ....................................................................................................................................320 Exercise 1: Creating the Focal Point Report for the Overall LAR....................................321 Exercise 2: Interpreting the Focal Point Report...................................................................329

Table of Contents
Copyright Wolters Kluwer Financial Services 2008 TOC-4 Rev. 09-08
Blank Page

Importing
Chapter 1
Importing
Upon completion of this lesson you will be able to:
Import a loan file.
Add records from one file into an existing file using the Update feature.
7

Fair Lending Wiz Training Guide
Overview
In order to have the most robust Fair Lending analysis, having access to relevant fields contained in your LOS (loan origination system) will enable you to perform a comprehensive analysis. But some-times those fields are not captured in your LOS. How can you include them in your file once you’ve received an extract containing the basic fields?
The following exercise will take you through the steps which will enable you to add, or update, data into an existing CRA/FL Wiz file. But before we can add information to an existing file, we must first import a file that has been generated from your LOS. When reviewing the extract, you notice that you will need to include fair lending fields to perform an in-depth fair lending analysis, fields such as Credit Score, LTV, and Back End Ratio, to name a few.
Your MIS group has provided you with an extract containing the standard HMDA fields, and has also provided you with another file that includes various fair lending fields. You need to import the extract file, then add the additional fields to your extract file.
8

Importing
Exercise 1: Importing a File Into FL Wiz
There are three ways to import a file: (1) Importing a New File, (2) Updating an Existing File, and (3) Appending to an Existing File. Importing a New File brings new information into CRA/FL Wiz. Importing using the Update a File feature makes use of an existing CRA/FL Wiz file but allows a user to change and/or add new informa-tion into that file. Importing data using the Append a File feature allows the user to only add new information into an existing CRA/FL Wiz file.
Before you can add data into an existing file, you must first import a new file. When you bring in this file you will need to create ‘place holders’, or empty fields that will accept the information that needs to be added to your extract. To import a file, follow these steps:
1. Select the Main tab and click the Import Wizard button.
9

Fair Lending Wiz Training Guide
2. Select New Format. Hit the Next button found at the bottom of the screen.
3. Select Text as the Source Data Type.
4. To locate the file to import, click the ellipsis button to navigate to the folder and then the source file (FL Mortgage File.csv). Click Next.
5. The Source File Format Selection screen allows you to set how your file is struc-tured.
10

Importing
6. Click the Row Delimiter drop-down button and select Carriage Return.
7. Click the Text Qualifier drop-down button. Select None.
8. Check the box next to First Row Has Column Names. By using this feature, the software will automatically match or “map” the fields found in your LOS to the fields found in CRA/FL Wiz. Click Next.
9. The software displays the Text File Column Delim-iter Selection screen when the source file is a delim-ited text file. You use this screen to select the type of delimiter used to separate fields in the source file. Select Comma. Click Next.
11

Fair Lending Wiz Training Guide
10. The Target File Selection screen provides you with the different file types, along with the ability to name your file. From the drop-down box, select Mortgage 2004.
Note: Use Mortgage 2004 for files created in 2004 and beyond. This file type incorporates changes made to the Regulations starting with 2004 submission files.
11. Under the New File option, type Mortgage YTD. Click Next.
Note:Which of these 3 options to use depends on your source file. “New file” would be used for the first month, or quarter, or an entire year. “Update” would be used to update an existing file. “Append” would be used to ADD a new quarter onto the pre-vious quarter’s data. KNOW your file’s contents.
12. You use the Census Year Selection screen to indi-cate whether you want to import a file with 1990 or 2000 census boundaries. Import a loan file using 2000 census tract bound-aries for action dates >=2003. Click Next.
12

Importing
13. Select the File Will be Geocoded in Wiz Sys-tem check box if you want to geocode the file in CRA/FL Wiz. Click Next.
Note: File must contain values in the files MSA, State, County, and Censustrac if you are NOT using the Wiz geocoder.
To be geocoded within the Wiz, the file must contain Address, City, State_abrv, and Zip.
14. Click the Auto-Map Remaining Source Columns link. This link automatically maps the fields in your Source col-umn and lists the fields in the Target column only if the source field matches the CRA/FL Wiz field name. If the software could not match a field, the corresponding source field displays <none>. You would then have to manually map the source field.
Look at the Data Preview for the Loan Amount field. The Loan Amount is displayed in whole dollars. However, the format for submission (and the software) requires the loan amount to be displayed in thousands.
You can add a replace command -- a command that will change the value in a specific field in the source file -- while you are importing records into CRA/FL Wiz. This is helpful to manip-
13

Fair Lending Wiz Training Guide
ulate data into a format required for submission and analysis purposes.
Example:
You will add a replace command to the import format so Loan Amount will be automatically divided by 1,000 while the records are being imported.
To add a replace command to divide the values in the Loan Amount field by 1,000, follow these steps:15. Under Source, click the
LoanAmount cell. Then click the ellipsis button.
16. From the Functions win-dow double-click Numeric and double-click the RoundTo1000( ) expression.
Source File (Source ÷ 1000)
Loan Amount 130000 130
14

Importing
17. Single click INSIDE the parentheses ( ) in the Expression Creating win-dow. In the column win-dow use the scroll bar to locate and double-click on LoanAmount. Click the Validate button.
Note:If the expression does not validate, make sure the field name was placed inside the parentheses correctly.
18. Click OK, then Apply.
15

Fair Lending Wiz Training Guide
19. Verify that Loan Amount is now displayed in thou-sands.
Now that you have rounded the loan amount to the nearest thousand during the import process, you also want to set placeholders (empty fields) to accept fair lending values when you import another file using update into the file just imported.
To set empty fields in your import format, follow these steps:
20. You want to make use of fields that are included in CRA/FL Wiz whenever possible. For example to include the Beacon Score, select the cell under the Source column called Bea-con. Click under the Source column to activate the drop-down menu. Select <Empty>.
16

Importing
21. A valid Beacon Score should always come in as a 3-character number. Therefore, there is no need to accept the default values of Numeric, with 9 positions to the left of the decimal, and 3 posi-tions to the right. Open the drop-down list under data type, and select INTEGER.
22. Follow the same process as above making LTV and BERatio active. Set both fields to be Numeric 9,15,2.
By performing this task during the import process, your file will be ready to accept these fields when you combine, or Update, another file with additional data. Once this step is completed, you will not have to per-form this step during another import as long as you continue to use this format. Hit Next.
There is one more thing that must be done to this file prior to perform-ing the actual import. There was one field (BRANCH_ID) where the field name provided in the .CSV (comma separated value) file did not match the FL Wiz field name (BRANCHNUMB).
17

Fair Lending Wiz Training Guide
23. Scroll up slightly (about mid-way between Beacon and Zip) until you find Branchnumb, which is cur-rently grayed out. In the source column for Branch-numb, click on <None>. Open the drop-down list, and click on Branch_ID as the field you wish to “map” to.
24. The Branchnumb field is only a single digit indica-tor. Set the Data type to CHAR, and the Size to 1.
25. Because you will be importing all records in the source file, you do not need to create a filter. Move to the next screen by clicking the Next but-ton.
18

Importing
26. You are now brought to the Thank You screen. To save the import format, check the box next to Save the Defined Import Format and name your format in the open box. Call your for-mat Mortgage with FL Fields.
27. Select Import Now. You also want to make sure you have the appropriate year selected. The year should represent the Action Year of your file (in this case - 2006). If it is not correct, select the drop-down menu and choose the correct year. Click Finish.
28. The software will now import the records from the source file into the tar-get file you have created.
19

Fair Lending Wiz Training Guide
29. Select Yes to view the summary. Print a copy of the summary to have as documentation of the pro-cess. Once you have printed the summary, select File>Exit.
20

Importing
Exercise 2: Updating an Existing File
Now that you have imported the file, you can add fair lending data from an additional file. This file must contain some type of unique identifier so the fields can be associated with the appropriate record. Application Number, or Applnumb, is a good field to use because it is a unique field, meaning each record should have a distinct application number.
Your system might not use the Application Number, however. Use what-ever field, or combination of fields, that will provide the ability to “match up” records between two files received from different systems.
To import a file using the Update feature, follow these steps:
1. Select Import Wizard.
2. Leave the default, New For-mat, selected. Hit Next.
21

Fair Lending Wiz Training Guide
3. On the Source File Selection screen, click the Source Data Type drop-down menu. Select Text.
4. Navigate outside of CRA/FL Wiz to select your source file. Click the Source Access File ellipsis button.
5. Select the file to be imported (Additional Fair Lending Fields.csv). Click Next.
6. In the File Format Selection screen, leave Delimited selected.
22

Importing
7. You need to set the Row Delimiter. Click the drop-down menu and select Car-riage Return.
8. Leave Text Qualifier set as None.
9. Click the box next to First Row Has Column Names. Click Next.
10. The Text File Column Delimiter Selection screen provides various types of delimiters. Leave the default, Comma, selected. Click Next.
23
Fair Lending Wiz Training Guide
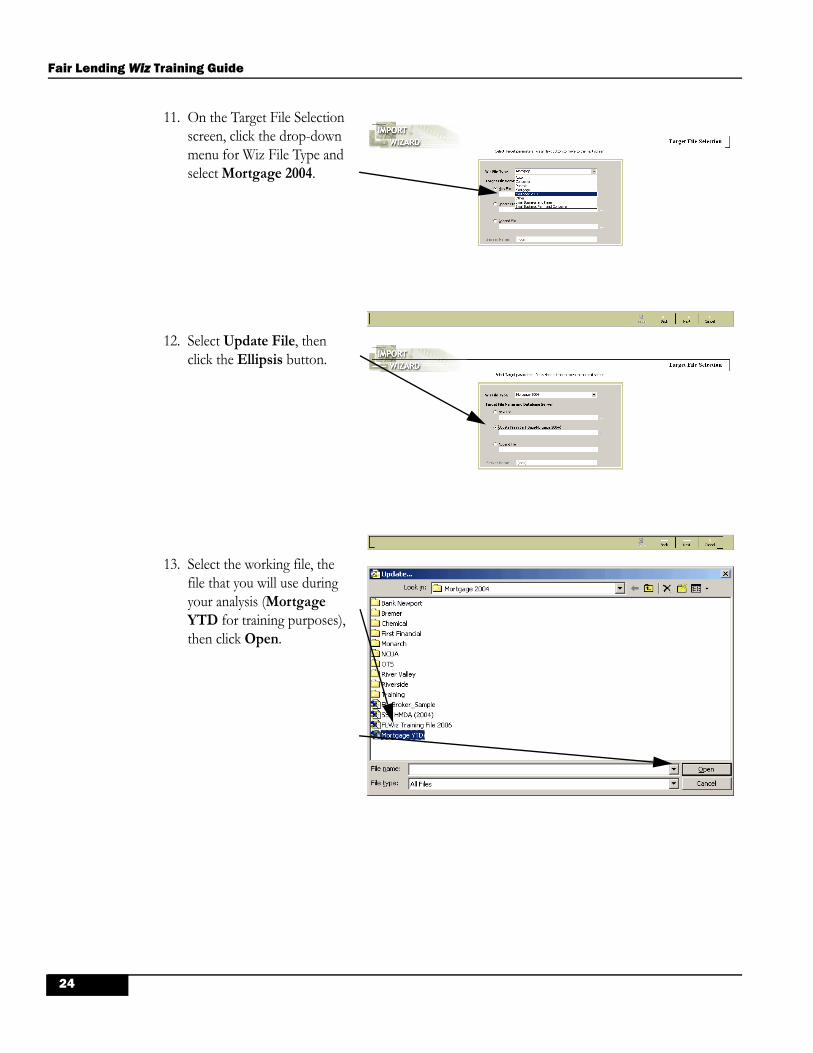
11. On the Target File Selection screen, click the drop-down menu for Wiz File Type and select Mortgage 2004.
12. Select Update File, then click the Ellipsis button.
13. Select the working file, the file that you will use during your analysis (Mortgage YTD for training purposes), then click Open.
24

Importing
14. Your file should be listed under Update File in Bank Data. Click Next.
15. Click Auto-Map Remain-ing Source Columns. This function will match, or “map”, columns found in your source file to your target file, IF they matched the FL Wiz field name. Scroll down, and you will see only Applnumb, Beacon, and LTV. What happened to the BERatio field?
16. Locate the “grayed out” field called BERatio. In that row, click on the word <None> under Source. Open the drop-down list, and select BER. Set the Scale to 2, then click the Next button.
25

Fair Lending Wiz Training Guide
17. The Matching Column Selec-tion screen allows you to select the field to base the matches on. Application Number, or Applnumb, makes the most sense to use because it is unique. Click Next.
18. On the Update Options screen, deselect all options. You do not want the system to Append Unmatched Records to the Updated File, because each “Unmatched Record” would only have 4 fields (applnumb, beacon, beratio, and LTV). Quality errors COULD be checked, but you are not replacing any values that would affect quality edits, so it best not to. Click Next.
19. Because you are importing all records, you do not need to create a filter. Click Next.
26

Importing
20. The system has now brought you to the Thank You screen. Save the import format as Fair Lending Fields. Click the Import Now box, mak-ing sure the Select Action Year is set to 2006. Click Fin-ish. The software processes the file through the import function and provides you with a summary screen. Click No when asked to view the summary.
27

Fair Lending Wiz Training Guide
28

Editing Data for Fair Lending
Chapter 2
Editing Data for Fair Lending
Upon completion of this lesson you will be able to:
Edit data for Fair Lending Analysis purposes
Use Replace commands to correct erroneous information in the Fair Lending Data
Use Modify Codes to make user-defined fields available in the Fair Lending models
29

Fair Lending Wiz Training Guide
Overview
A Fair Lending Analysis is no better than the data that you have available in your electronic file. For example, an excessively high (incorrect) value in the LTV field for an originated loan could very well set the threshold for acceptable values. For example, assume that you have an originated loan for a 49-year old male, white non-Hispanic borrower showing a loan-to-value ratio of 192%. Assume fur-ther that this is a middle-income individual who lives in a non-minority tract (< 10% minorities), and the tract is also a middle-income tract. The value of 192% becomes the threshold for acceptance for every fair lending comparison that can be done!
Before you start any kind of fair lending analysis, you must review the data at your disposal, and determine if there are individual or systemic problems that could interfere with the analysis. Keep notes as you do these reviews, as you will use the data for two purposes:
To know what filters need to be applied before some fair lending analyses are run
To help your institution determine where the errors are coming from, and whether they are part of a larger issue that needs to be corrected
30

Editing Data for Fair Lending
Exercise 1: Reviewing Data
From this point on, you will be using a file called FL Wiz Training File 2006 Revised. It contains over 19,000 records, and has fields in it for the applicants’ credit scores, back-end ratios (total debt-to-income ratios), LTVs, CLTVs, Length of Employment, and Length of Residence. The file also contains a field called “Loanprog”, which is a 10-character description of the specific loan program that the applicant was applying for.
To review the Fair Lending fields, follow these steps:
1. Click on the Main button in the View Bar, then click on File Management.
2. Click on the Mortgage 2004 folder. Right-click in the white area to the right of the file list in the right panel, then select Install/Restore from the contextual menu.
31

Fair Lending Wiz Training Guide
3. Navigate to the location of the FLW Files, then double-click on FLW Training File 2007.dat.
4. The software will Install the file, adding it to the list of Mortgage 2004 files, and pro-vide a message explaining that you should “Run Update Calculated Fields”. Click OK.
5. Right-click on the newly-installed file, and select Update Calculated Fields from the contextual menu. Click Yes when the mes-sage regarding Locked Records appears, and OK when the completion message appears.
32

Editing Data for Fair Lending
6. Right-click on the file again, and select Edit from the contextual menu.
7. When the file opens, it will most likely open to the Cur-rent Record screen. Click on the Browse tab.
8. It is always a good idea to check the overall quality of the file before starting your analysis. Click on the word EDIT in the menu, then select Govt Exception Summary Report (All).
9. The exception report shows all errors - Validity, Syntacti-cal, and Quality. This report shows ONLY Quality errors. This means that the file is properly geocoded, and that all required fields are filled in properly. Close the report when finished reviewing it.
33

Fair Lending Wiz Training Guide
10. .Right-click anywhere in the data, and click on Select Columns to View from the contextual menu.
11. Click on the blue link at the top that says Unselect All.
34

Editing Data for Fair Lending
12. Starting at the top of the window, select the following fields (use the scroll bar as neces-sary):
12.1 Action 12.2 Lien Status12.3 Loan Term12.4 Rate_Lock_Date12.5 APR12.6 Age12.7 Cust_Credt12.8 LTV12.9 BERatio12.10 Noterate12.11 LenEmploy12.12 LenResid12.13 LoanProg12.14 CLTV12.15 Raw_Rate_Spread12.16 Click the X to close the Manage Columns to
Browse dialog.
TipIf after clicking “Unselect All” you either click outside the dialog box, or close it with the “X”, click the Options dropdown menu, and select “Select Columns to View” to restore the window.
13. Since the APR is the first major field, start the analy-sis by reviewing the values contained within that field. How many are missing? How many zeroes are included for originated loans? What is the highest value for an originated loan? Click the Sort button to get started.
35

Fair Lending Wiz Training Guide
14. Double-click on the Other Information folder (or click on the + sign) to open the folder.
15. Double-click on APR, moving it to the right-hand side of the Sort Col-umns dialog screen, then click Apply.
16. How many zeroes are contained in the APR field? Scroll down until the see the last “0”, and click in that row. To see how many there are, look at the bottom left of the screen.
Note: Zeroes should not be included in any of the fair lending fields. A “0” is a real value, and will affect averages and other calculations. In these fields, it is best to change any zero to a “null” value, which will automatically be “thrown out” by the program.
36

Editing Data for Fair Lending
17. You should also take note of the fact that there are other “suspicious” values in the APR field. Is there a chance that an originated loan (see Action = “1”) had an APR of .25? Or 1.86%? This would be an issue that you would want to check on if this was your institution’s data.
18. To sort the APR in descending order, click on the Sort button in the Tool Bar again, and dou-ble-click on APR (or you can right-click on the APR, and select Descending from the contextual menu). Click Apply.
19. You will often see this message (...Would you like to save changes?). The answer depends upon what you have done. So far, no changes have been made in this file, so click on No.
20. The top of the list shows that the maximum APR was 16%. Was it an originated loan? The action code was “3”, so it was denied. The highest APR for an originated loan was 14.5%. Note that the lien status was a “3”. To find out what that means, click on the 3, and use the drop down list to review the codes.
37

Fair Lending Wiz Training Guide
21. Click on the Sort button. Right-click on APR, and select Remove from the contextual menu.
22. Double-click on the User Defined Variables folder.
23. Whenever you want to search an open list of variables, start typing the name you are looking for. In this case, you want to search the list of User Defined Variables for Noterate. Start typing Noterate until it is found.
38

Editing Data for Fair Lending
24. Double-click on Noter-ate, placing it on the right side as an ascending sort. Click Apply. Click No on the message “Would you like to save changes...”.
25. How many records have missing Entries? How many are zeroes? Any other “suspicious” val-ues at the low end of the scale?
26. Click on the Sort button again. Right-click on Noterate, and select Descending order. Click Apply.
39

Fair Lending Wiz Training Guide
27. What is your maximum value? Does it appear rea-sonable? Was it for an originated loan?
Test Your Knowledge
The primary variables that you will be using in the Fair Lending analysis are Cust_Credt (credit score), BERatio (back-end ratio, or total debt ratio), LTV (loan-to-value), and possibly CLTV (combined LTV with first and second liens).
Take each of these variables individually, and sort them in both ascend-ing and descending orders. Look for values that are outside the “normal” range. Be sure to check to see if the “erroneous” values are for origi-nated loans.
Notes on data quality:
Extra Credit:
How many originated loans were there with a Back-End Ratio greater than 100? ______________
How many originated loans were there with a loan-to-value greater than 100? __________________
Missing (Null) Zeroes? Lowest Value Highest Value?
Was the high-est for an originated loan? If not, what was the highest value for an origi-nated loan?
For BE Ratio and LTV, how many were over 100?
For BE Ratio, how many over 200?
Cust_CredtBE RatioLTVCLTV
40

Editing Data for Fair Lending
Exercise 2: Replacing Zeroes with “Nulls”
The presence of zeroes in your fair lending data fields can cause prob-lems. There are certain reports that calculate averages, and zero values bring down those averages. In addition, there are several places where the program will ignore records with “null” values in certain fields, but zeroes are allowed in.
Bottom line? You should always replace the zeroes with “null” values in your non-HMDA (or non-required) fair lending fields.
Note: You can also replace zeroes with NULL values during the import process. To do this, you would click the ellipsis for the source field you wanted to modify. For example, if the APR had zeroes, you would click the ellipsis for the APR source field, and in the expression window, enter ‘ IIF(APR=0,””,APR) ‘. Call Technical Support for assistance setting this up the first time.
Based on what you have found in this file, you know there are zero val-ues in the APR and NoteRate fields. To correct these, follow these steps:
1. In the Tool Bar, click the Replace button. If asked to Save Changes, click No.
41

Fair Lending Wiz Training Guide
2. Step 1: For the Scope, click on All Records. Step 2: Click in the checkbox on the left side of the first column.
3. Step 3: Click on the drop-down list button, and select APR from the list.
4. Step 4: Under the Replace With column, click on <None>, then click the Ellipsis button.
42

Editing Data for Fair Lending
5. Step 5: IMPORTANT! For the NULL replacement to work, you MUST click on T-Sql on the top of the screen.
Note:The NULL statement does not work in VBScript. If you forget to choose TSql, you will receive an error message.
6. In the Expression Creating Window (the lower part), type the word “NULL”. No quotes are necessary, and caps are optional as well. Click Apply when done.
43

Fair Lending Wiz Training Guide
7. Click the word <None> under the Replace For col-umn, then click the Ellipsis. In the Expression Window, type “APR=0”. Again, no quotes are necessary. Click Apply. THIS STEP IS NEC-ESSARY, OR YOU WOULD REPLACE ALL APR VALUES WITH NULLS!
8. Following the same steps as above, do the same thing for Noterate. The finished expression should look like this. Click Execute.
Note: If you wanted to save these replace commands for future use, you would have typed in a name into the Replace Command text box, and clicked on the diskette.
9. Verify the message showing how many replaces were done.
44

Editing Data for Fair Lending
Exercise 3: Using Modify Codes to Allow User-Defined Fields to be Used
Both CRA Wiz and Fair Lending Wiz depend on “codes” to simplify the process. For example, the field called “Action” is coded with a “1” for Originated, a “2” for Approved Not Accepted”, “3” for Denied, etc.
User-Defined Fields (UDFs) do not automatically have codes defined for them. Without codes, the program does not know that a particular field exists, or how you want to use it in your fair lending analysis. Therefore, any field that is truly “user-defined”, and that you want to use in any of the regression or comparative models, must have codes defined.
For this file, there are three fields that are UDFs that you might want to use in the Fair Lending Models: (1) CLTV, (2) Fix_ARM (F=Fixed Rate, A=ARM), and (3) AU (for Automated Underwriting System; DO=Desk-top Originator, DU=Desktop Underwriter, LP = Loan Prospector, etc.)
To perform the Modify Codes procedure, follow these steps:
1. First, you need to be able to see these UDF fields in your “view”. Right-click any-where in the data, and click on Select Columns to View from the menu.
45

Fair Lending Wiz Training Guide
2. Scroll down about 80% of the way down the list (you should see a majority of the fields that you already have selected). Search for Fix_Arm, and AU, then click their respective checkboxes. Since CLTV is already selected, click on the “X” in the upper-right corner to close the dialog box.
3. Right-click in the data, and click on Locate Field.
4. Open the drop-down list, and start typing the field name “Fix-Arm”. In this case, just the “F” is sufficient to find the field you want. Click on Fix_Arm. When finished, close the Find Field dialog box by clicking on the “X” in the upper right corner.
46

Editing Data for Fair Lending
5. Right-click in the Fix_Arm field, and select Modify Codes from the menu.
6. You are now in the Modify Codes dialog box. This field contains two values -(1) F, and (2) A. In a text field, the easiest way to obtain these values is to click on the Retrieve Unique Values button.
7. For text fields, the Modify Codes Table only has two columns. The first is the description (used in Custom Tables), and the second is the code associated with that description. This step essentially told the software that a user-defined field called Fix_Arm exists, and that is has two pri-mary values - F, and A. Click Apply, and then click OK to the message telling you the code was modi-fied successfully.
47

Fair Lending Wiz Training Guide
8. Right-click in the AU field, and select Modify Codes from the menu. Because this is another text field, click on Retrieve Unique Values. Review the codes, then click Apply.
The final field is CLTV, and it is not a text field, but holds numeric val-ues instead. You have to decide ahead of time what distribution you want. In other words, if you wanted to calculate the average APR based on differing values of CLTV, what would you like to see? Typically, for pricing and for decisioning, it doesn’t make any difference when the CLTV is 80% or below. There MIGHT be a price increase at 85%, and another at 90%, 95%, and again at 97%.
9. Right-click in the CLTV field, and select Modify Codes. Click on Add New Code.
10. When New Code 1 is blue, type in “Missing or 0”, and press the Tab key. In the From column, type 0, <Tab>, To 0. <Tab>, Description = “1 to 80.00”, <Tab>, From 1, <Tab> To 80.00, <Tab>, Description = “80.01 to 85.00”, <Tab> From 80.01, <Tab> To 85.00, <Tab> Description = “85.01 to 90.00”, <Tab> From 85.01, <Tab> To 90.00. Continue until all rows as shown are completed, then Apply.
Warning: Once you have completed these lines, DO NOT tab again (leaving a blank line with no values in the “From” and “To” columns. If you acciden-tally do this, click the DELETE button, then APPLY.
48

Editing Data for Fair Lending
Review:
Data Quality:
Each field that you will use for Fair Lending analysis should contain val-ues that are valid. Zeroes can interfere with some of the calculations, and should be replaced with “null” values.
From the review, you know that this institution had some “bad” values in the fields you will need to use in the Fair Lending Analysis.
The back-end ratio had a high value for an originated loan of 50,060.
There were 213 records where the back-end ratio was over 100, with 69 of those originated.
The LTV had a high value for an originated loan of 188.
There were 79 records with an LTV over 100, and 4 of those were originated.
Leaving these erroneous values in some of the analysis models would impact your analysis in a negative manner. Therefore, you will see this fil-ter being placed in some of the models:
BERatio <= 100 and LTV <= 100
In addition, if this was your institution, you would want to find out how and why these values are getting into the database, and what could be done to remove them in the future.
Null Values:
You replaced the zeroes contained in the APR and Noterate fields with “null” values, which do not affect averages.
Modify Codes:
You performed the step called “Modify Codes” for three fields - CLTV, Fix_Arm, and AU.
49

Fair Lending Wiz Training Guide
50

Custom Tables
Chapter 3
Custom Tables
Upon completion of this lesson you will be able to:
Create Custom Tables Using User-Defined Fields
Use Excel Pivot Tables to further Manipulate and Understand Data
Use a Custom Table to Calculate Average APRs by Race and Product
Create a Save Custom Table for Later Use
51

Fair Lending Wiz Training Guide
Overview
Fair Lending Wiz provides you with numerous standard reports. However, there will be times when you will want to analyze data contained within User Defined Fields, or to provide Management with a report that is not otherwise available within the Wiz.
Custom Tables can be used to produce a printed report, or an Excel Spreadsheet, that will allow you to manipulate and understand your data in ways you can’t even begin to imagine.
This chapter will take you through three examples of custom tables.
52

Custom Tables
Exercise 1: Obtaining a Distribution by Loan Product
Management has asked you for a detailed report showing the volume, and actions taken, for every mortgage loan product offered by your insti-tution.
To create this table in Excel, follow these steps:
1. From this point forward, you will be using the file called FL Wiz Training 2007 for Analysis Pur-poses
2. Click on the Main button in the View Bar, then click on File Management.
3. Click on the Mortgage 2004 folder. Right-click in the white area to the right of the file list in the right panel, then select Install/Restore from the contextual menu.
53

Fair Lending Wiz Training Guide
4. Navigate to the location of the FLW Files, then double-click on FLW Training File 2007 for Analysis Purposes.dat.
5. The software will Install the file, adding it to the list of Mortgage 2004 files, and pro-vide a message explaining that you should “Run Update Calculated Fields”. Click OK.
6. Right-click on the newly-installed file, and select Update Calculated Fields from the contextual menu. Click Yes when the mes-sage regarding Locked Records appears, and OK when the completion message appears.
54
Custom Tables
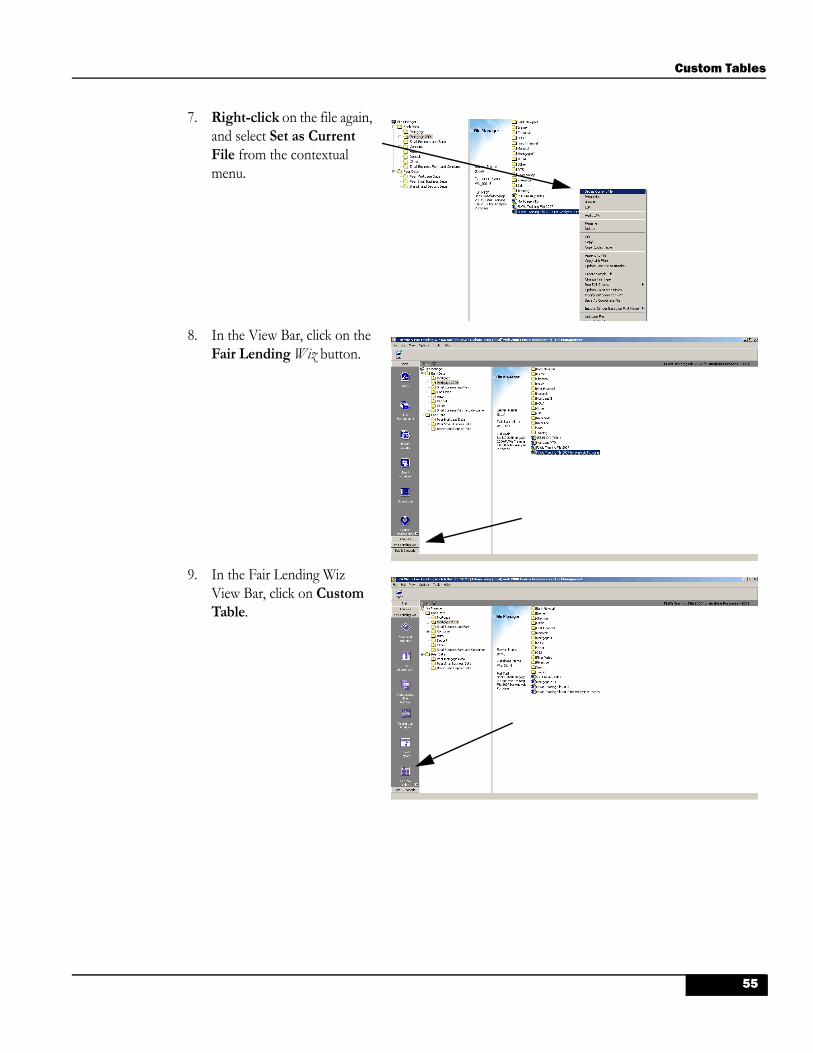
7. Right-click on the file again, and select Set as Current File from the contextual menu.
8. In the View Bar, click on the Fair Lending Wiz button.
9. In the Fair Lending Wiz View Bar, click on Custom Table.
55

Fair Lending Wiz Training Guide
10. For Custom Tables, the field folders are on the right. For this table, you are going to make the Column based on Action, and the Row based on the User Defined Field called Loanprog. Double-click on the Product Infor-mation folder.
11. .Right-click on Action, and select Send to Column.
12. Double-click on the User Defined folder, then right-click on Loanprog, and select Send to Row.
56

Custom Tables
13. You want to know the per-centage of each product by Action taken, so you need to add the % of Row Total cal-culation. Click on the Dis-play Subtotals checkbox, open the drop-down list, and select %Row Total.
14. In the Tool Bar, click on To Excel.
15. When Excel opens, you are in a Pivot Table. The Pivot Table field list needs to be closed, and Excel maximized to fill the whole screen. Click on the X to close the dialog box, and click on the Maxi-mize button to open the table in the full window.
57

Fair Lending Wiz Training Guide
16. To make the table easier to analyze, click on the Select All button, then select Format > Column > Autofit Selection.
17. Look through the data, looking at the number of originated, denied, and the the totals. You now want to sort the table in descending order by total applications received, but the percentages will inter-fere with that action. Right-click in the data, and select Pivot Table Wizard from the contextual menu.
18. There are two things to watch for here: (1) be sure the top bar shows “Step 3 of 3”. If not, click Cancel and right-click INSIDE the data. (2) The checkbox for Existing Spreadsheet should be checked. Click on the Layout button.
58

Custom Tables
19. In order to remove the percentages from the table, click on %Row of Count, and drag it off to the right. Click OK when done.
20. Click Finish to complete the action. Re-close the Pivot table field list.
21. To sort this table in descending order by product, click into the first cell in the Grand Total column (Cell I8). Click on the menu Data > Sort > Descending.
59

Fair Lending Wiz Training Guide
22. Regression analysis is discussed at length in an upcoming chapter. For now, you need to know that a regression model needs at least 250 records to be successful. For an Approval/Denial model, that would mean 250 Originated and Denied mixed. For a pricing model, that would mean 250 Originated. You can see that only a few prod-ucts meet that criteria.
23. Close and don’t save the spreadsheet (at your institution, you would most probably save your work).
24. Upon returning to your Cus-tom Table, double-click on the Custom Table name. Name the table Loanprog by Action, and click the Save button (the diskette).
60

Custom Tables
Exercise 2: Calculating the Average APR by Loan Product
When performing a Fair Lending Analysis, it is necessary to know where your risks are. For example, if there is an indication of pricing issues, what products are your highest priced products? What products produce the largest differences between white applicants and minority applicants? These questions can be answered by creating another Custom Table.
1. Right-click on Action (in the column heading), and select Delete from the con-textual menu.
2. Double-click to open the Applicants Informa-tion folder. Right-click on Race1, and select Send to Column.
61

Fair Lending Wiz Training Guide
3. Double-click on Race1 (in the column heading), and uncheck Not Pro-vided and Not Applica-ble. Click Apply.
4. Click to open the Select Data Content drop-down list, and select APR.
5. Uncheck the Display Subtotals checkbox.
62

Custom Tables
6. Under Select Data Con-tent, uncheck Sum, and check Count, Average, and Greatest Value. In the Tool Bar, click on the To Excel button.
7. When the table opens in Excel, close the Pivot Table field list, and Maximize Excel.
8. The “Custom Report 1” spreadsheet becomes your “Master” table, which can be renamed as such if desired. You will copy this table before you start massaging your data, creating formulas, etc.
9. Right-click on the Work-sheet called Custom Report 1, and select Move or Copy from the contextual menu.
10. In the Move or Copy dialog box, click on Sheet1, then click on Create a Copy, then click OK.
63

Fair Lending Wiz Training Guide
11. Right-click in the data, and select PivotTable Wizard.
11.1 In the Pivot Table Wizard dialog, click on Layout.
12. Drag Count off to the right.
12.1,Drag Max of Apr off to the right.
12.2 Click OK.
12.3 Click Finish.
13. Close the Pivot Table Field List dialog box again, then click into Cell D8.
64

Custom Tables
14. Click on the menu item Data, and select Sort. Change the Sort By ($D$8) to Descending, then click OK.
15. Your table now shows all products applied for by Blacks/African Americans, in descending order by the highest average APR for those applicants. This table is useful, but is not the end of the analy-sis by any means. Were Blacks and Whites charged the same average APR on these products? To calculate the DIFFERENCE between the minority and the control group (white), you would need to enter a formula. This can be done within a Pivot Table, but it is more dif-ficult. Follow the next steps to create a column showing the differ-ence between the two groups.
16. Press CTRL-A, then CTRL-A to select ALL of the table, then CTRL-C to Copy the table (you should see “Marching Ants” around the data).
65

Fair Lending Wiz Training Guide
17. Click on Edit, then Paste Special.
17.1 Select Values from the Paste Special dialog box, then click OK.
17.2 Press the Esc(ape) key to remove the “march-ing ants”.
18. In Cell H7, type “Differ-ence”
18.1 In Cell H8, type “=IF(F8>0,D8-F8,0)” (this formula calculates the difference IF there is an average for the White).
18.2 Copy this formula down to cover all Blacks by moving the cursor to the lower right corner of Cell H8 (the cursor should turn to a + sign), and dragging it down through Cell H66
19. Your table now shows the difference between the aver-age APR for blacks versus whites. To finish this task, you will use an Auto-Filter to sort the table.
66

Custom Tables
20. Place your cursor in Cell H7.Click on the menu item called Data.
20.1 Select Filter
20.2 Select Autofilter
21. Open the Autofilter drop-down list, and scroll up until you see Sort Descending, then select that option.
22. Here is your table, sorted in descending order by the products with the largest dif-ference between blacks and whites.
23. Close the Excel spreadsheet. Save it if you wish.
23.1 Save the Custom Table in the Wiz as “Distribution by Prod-uct and Race - Avg APR”.
Note: Ideally, you would have multiple worksheets, one for American Indian (sorted in descending order by product average), one for the difference between American Indians and Whites, two similar worksheets for Asians, two for Blacks, and two for Native Hawaiians.
67

Fair Lending Wiz Training Guide
Test Your Knowledge
Create a Custom Table that calculates the Average Note Rate for each Loan Product by Ethnicity (or Sex). Be sure to de-select Not Provided and Not Applicable from the column in the custom table.
Once you have the Master Table (Custom Report 1), create three copies:
Copy 1 - take out all but the average Note Rate
Copy 2 - sort by descending Note Rate for Hispanic applicants
Copy 3 - create and sort by descending Difference between Hispanics and non-Hispanics.
IF TIME PERMITS - Experiment! Add Application Number as a Row under Loanprog. Try different options.
Remember, you are limited to the number of Rows and Columns that Excel can hold (65,536 Rows by 256 Columns).
Review:
You created, and saved, two custom tables. The first table provided a list of the Loan Products by Action taken. You sorted the table in descend-ing order by product volume.
The second table replaced Action with Race1, and produced a Custom Report1 containing the Count, Average APR, and Maximum APR. You then copied the Worksheet and removed Count and Maximum APR. You sorted the table in descending order by average APR for Blacks, then calculated the difference between blacks and whites.
68

File Management
Chapter 4
File Management
Upon completion of this lesson, you will obtain the skills necessary to:
Copying an Entire File
Copying a File with a Filter Applied
Modifying a File’s Structure
Adding Values to a New Field Using Replace
Add Fields to a Codes Table (Modify Codes)
Transferring/Installing a File
69

Fair Lending Wiz Training Guide
Overview
File Management screen offers numerous options that allow you to work with your files.
Set as Current File - makes this file the one all work will be performed onProperties - Six tabs. Statistics shows how many recordsBrowse - opens table for browsing, but does not allow changesEdit - shortcut method for opening the file in the EditorAudit LAR - call Tech Support for proper use of this toolRename - allows the changing of the database nameDelete - deletes the file. You can not delete the current fileCut - select Cut, then Paste into a different folderCopy - copy entire file. COVERED IN THIS CHAPTER.Copy Codes Table - if your file has User Defined Fields with Codes, you can then paste the codes onto another file (if that file has the same fields)Append to File - appends the selected file onto another fileCopy with Filter - copies the file, but applies a filter in the process. COVERED IN THIS CHAPTER.Update One File to Another - if you have matching records in both files, this option allows you to specify which fields from the current file you want to update in another, existing fileCreate Sample File - specify number of records you wish in a random sample, and the program will create a separate file with that number of recordsChange File Type - call Tech Support for proper use of this toolRun Edit Checks - reruns all government and user-defined edit checksUpdate Calculated Fields - updates fields such as Rate Spread, Raw_Rate_Spread, Income as Percent of MSA Median, etc.Modify Zip Codes for RPO - compares the zip codes in your file against a database supplied by the post office. Removes Zip codes that do not exist for mail delivery purposes. Save as Coordinate File - used with Mapping in CRA-Wiz to map exact locations of your branches, loans, deposits, etc. The file MUST be geocoded in the WizImpute Gender Based on First Name - for Consumer or other files without codes for Sex. If you have FirstName, and CFirstName in your file, copy your original file, add SEX and COASEX, both of Data Type Char 1. After these fields are added, only those records with a code 1 (Male) or code 2 (Female) would be included in your analysisUnlocate File - call Tech Support for proper use of this toolTransfer/Backup - the best way to backup your file. This option will compress your file in .dat format and copy to a location of your choice. Excellent method for sharing files with others.Modify Structure - add or remove non-required fields from your file. COVERED IN THIS CHAPTER.Export File - export fields of your choice in 5 different formats
70

File Management
Exercise 1: Copying a File
In this exercise you will learn how to create a working copy of a file -- a feature that will become very useful as you start to manipulate your data.
1. Click the File Management button located in the main screen.
2. In the File Manager tree view, right-click on FL Wiz Training File 2007.
2.1 Select Copy from the contextual menu
3. Right-click in the “white area” to the right of the file list. From the new contextual menu, select Paste.
71

Fair Lending Wiz Training Guide
4. Your file copy is called by the same name as the original file, with an added (001).
72

File Management
Exercise 2: Copy with Filter
Copy with Filter is an excellent method for “permanently” removing unwanted records, or for making the file smaller for analysis purposes. For example, in an institution with hundreds of thousands of records, the software would perform each analysis much faster if a smaller group of “like” loans was in a copied file.
For this example, you will copy the FL Wiz Training File 2007 and create a file with just Conventional Home Purchase loans contained in it.
1. In the File Management tree view, right-click on FL Wiz Training File 2007.
1.1 Select Copy with Filter from the contextual menu
2. To enter the Target File’s name and path information, click on the Ellipsis (the three dots).
73

Fair Lending Wiz Training Guide
3. In the File Name text area, enter FL Wiz Training 2007 Conv HP Loans. Click Save.
4. Click the Next button to continue.
5. In the Select Columns to be Copied window, click on the blue link at the bottom of the screen that says Auto Map Remaining Columns.
Note: To copy only specific columns, individually select each column by clicking on the word “None” under the source column and select the appropriate field from the drop-down list.
74

File Management
6. When all columns are selected, click on the Next button at the bottom of the screen.
7. In the Filter File to be Cop-ied window.
7.1 Double-click Loan Information folder
7.2 Double-click Product Information folder
8. Double-click the Loan Type folder, and select Conventional.
75

Fair Lending Wiz Training Guide
9. Double-click the Purpose folder, and select Home Purchase.
10. IMPORTANT - Click Apply or the filter will not work. Click the Next button at the bottom of the screen.
11. Check all settings at the fin-ish window, then click on Finish.
76

File Management
12. The software displays a mes-sage telling you that the copy with filter was successful. In this case, the number of records copied was 7,622.
77
Fair Lending Wiz Training Guide
Exercise 3: Modifying a File’s Structure
You may find it necessary to add fields to a file that has already been imported. For example, you find out from your IT department AFTER the import is done that LTV was available after all. That field was not provided initially. They provide you with an excel file that contains only two fields - the application number (applnumb) and LTV. Before you can “update” the existing file, you need to add LTV to the list of fields using the Modify Structure procedure.
In this case, you learn from the price sheet that this institution has a “tiered” pricing system. If the credit score is 700 or higher, the customer gets the best price. From 675 to 699 is next best, from 650 to 674 is third, and the highest price is reserved for those with credit scores below 650. You will create a new field called CREDT_TIER with a 1 for the best credit scores, 2 for the next level, 3 for the next lowest level, and 4 if the score is below 650.
You are also going to add a new field called “Comments”, which would be available for any comments you want to enter as you work through the Fair Lending process.
Note: Each User Defined Field name should be 10 characters or less.
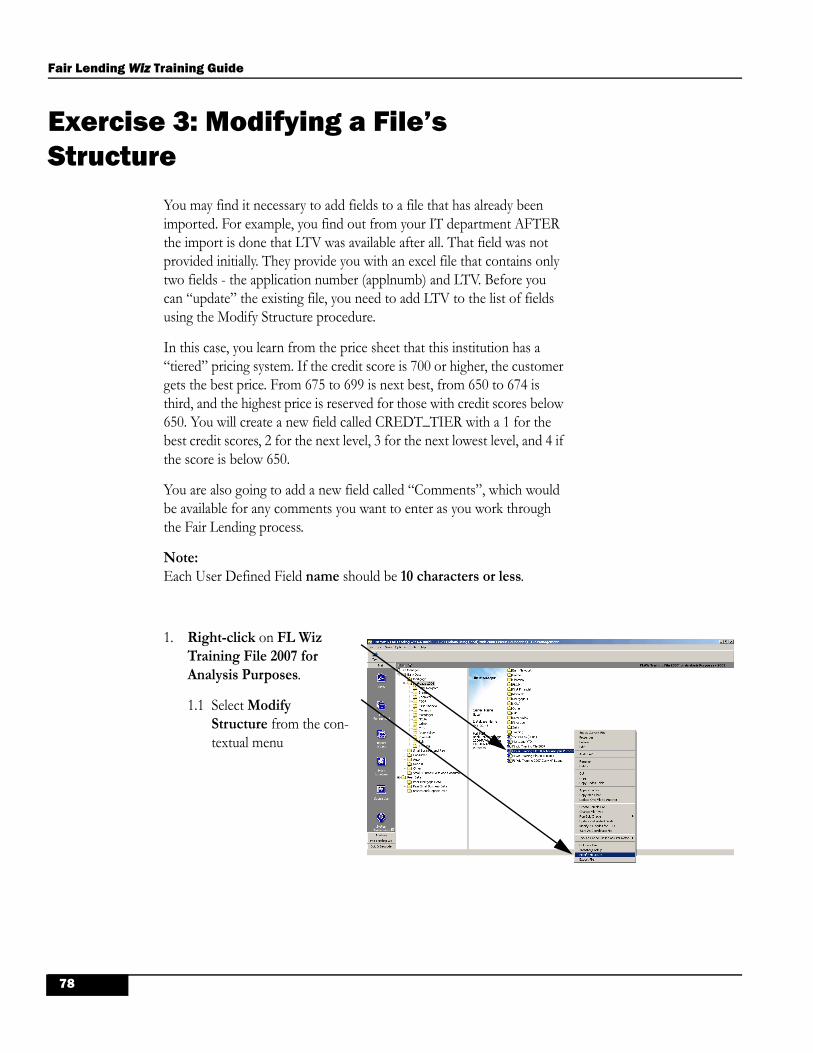
1. Right-click on FL Wiz Training File 2007 for Analysis Purposes.
1.1 Select Modify Structure from the con-textual menu
78

File Management
2. Click on the Optional Col-umns tab (you can not mod-ify the Required Columns).
3. Scroll down to the bottom of the list.
3.1 Click on Add New Column
4. When COLUMN00 is high-lighted in blue, type CREDT_TIER.
4.1 Click in the Data Type column
4.2 Open the drop-down list
4.3 Select Int (Integer).
5. Click on Add New Column once again.
79

Fair Lending Wiz Training Guide
6. Replace COLUMN00 with COMMENTS,
6.1 Set the Data Type to VarChar
6.2 Set the length to 50.
7. Click on the Apply button. Scroll down to the bottom of the field list to see the changes.
7.1 Click OK to finish the process.
80
File Management
Exercise 4: Adding Values to a New Field
You created a new field called “CREDT_TIER” in the last exercise. You need to populate this field with values based on the credit scores stored in the CUST_CREDT field.
You will use the Replace Wizard to fill the new field. There are at least two ways of doing this:
Create a separate Replace line for each “tier”
Replace CREDT_TIER with 1 FOR CUST_CREDT >= 700
Replace CREDT_TIER with 2 FOR CUST_CREDT >= 675 and CUST_CREDT < 700
Replace CREDT_TIER with 3 FOR CUST_CREDT >= 650 and CUST_CREDT < 675
Replace CREDT_TIER with 4 FOR CUST_CREDT <650
Create ONE replace statement that will take care of all four possibilities, using an Intelligent IF statement to perform the logic necessary. As in Excel, the IF statement considers the logic statement, and if true, applies the first option. If false, it goes to the second option.
Replace CREDT_TIER with
IIF(cust_credt >= 700,1,
IIF(cust_credt >= 675 and cust_credt < 700,2,
IIF(cust_credt >= 650 and cust_credt < 675,3,
IIF(cust_credt < 650,4,5))))
FOR cust_credt > 0
You will be using the first method shown above.
81

Fair Lending Wiz Training Guide
1. Right-click on FL Wiz Training File 2007 for Analysis Purposes.
1.1 Select Edit from the contextual menu.
2. In the Tool Bar, click on the Replace button.
3. To start, follow these direc-tions:
3.1 Click All Records3.2 Click the Checkbox for
the first row of replace commands
3.3 Open the drop-down list, and type CREDT, then select CREDT_TIER from the list.
82

File Management
4. Click into the Replace With box.
4.1 Click on the Ellipsis on the right side
5. In the lower part of the screen (the Expression Win-dow), type “1” without quotes, the click on Apply.
6. Click into the Replace For box, then click the Ellipsis.
7. Once in the Expression Builder, single-click on any field to activate that portion of the Expression Builder.
7.1 Start typing CUST_CREDT until that field is found.
7.2 Double-click on CUST_CREDT.
83

Fair Lending Wiz Training Guide
8. In the Expression Window, click after CUST_CREDT, and type in >= 700. Click Apply.
Note: Spaces are OPTIONAL between the field name and the >= symbols. However, if you were to stack two com-mands together (this AND that), the word AND must be separated by spaces.
9. For the second line in the replace set:
9.1 Click the Checkbox for a second line
9.2 Open the Target drop-down list and select Credt_Tier
9.3 Click the Ellipsis in the Replace With area
9.4 Type 2.9.5 Click Apply.9.6 Click the Ellipsis in the
Replace For area9.7 Type in the Expres-
sion “cust_credt >= 675 and cust_credt < 700”
9.8 Click Apply.
84

File Management
10. Complete the remainder of Lines 3 and 4:
10.1 Line 3, replace with “3”
Note: Click the drop-down list and select an expression to copy, then click the Ellipsis to modify it.
10.2 Line 3, replace for cust_credt >= 650 and cust_credt < 675
10.3 Line 4, replace with “4”10.4 Line 4, replace for
cust_credt < 650
11. Get in the habit of saving expressions that you may use again. Click into the Replace Command text box until the cursor flashes within the box.
11.1 Type Replace Credt_Tier from Cust_Credt.
11.2 Click the Save button.
11.3 Click OK.
12. Click on Execute. The mes-sage should reflect success and show the changes reflected to the right.
85

Fair Lending Wiz Training Guide
Exercise 5: Adding / Modifying New Code(s)
Adding a new field to your file is only effective for your analyses if you also add the field to the FL Wiz codes table -- essentially registering the field with FL Wiz. THIS STEP ALLOWS THESE FIELDS TO BE USED IN YOUR FAIR LENDING MODELS.
1. On the File Management screen, right-click on FL Wiz Training File 2007 for Analysis Purposes.
1.1 Select Edit from the contextual menu.
2. Right-click anywhere in the data, and select Locate Field from the contextual menu.
86

File Management
3. Open the drop-down list of fields, and start typing CREDT_TIER until it is located. Select Credt_Tier.
3.1 Close the Find Field dialog box
4. Right-click in the Credt_Tier column.
4.1 Select Modify Codes from the contextual menu.
5. Click the Add New Code button.
6. Follow these steps to input the codes:
6.1 Description: 700+ Press <TAB> key after each entry.
6.1 Code 1 From: 1 To 16.2 Press the <TAB> key to move to the next line6.3 Description: 675 to 6996.4 Code 2 From 2 To 2 6.5 Press the <TAB> key for another line6.6 Description: 650 to 674 6.7 Code 3 From 3 To 3 6.8 Press <TAB> once more6.9 Description: <6506.10Code 4 From 4 To 4 DO NOT PRESS <TAB> AGAIN!
Warning:If you do press Tab too many times, leaving a line with blanks in it, DO NOT click Apply. Instead, click the Delete button, and remove the line with the blanks.
87

Fair Lending Wiz Training Guide
7. Before clicking the Apply button, check your Codes against those on the right. When you are sure all codes are Ok, and that you do NOT have an extra line, click Apply.
Note: When you perform the MODIFY CODES on a text field (the one you just did was numeric), you simply click on the Retrieve Unique Values button to obtain the list of codes.
88

File Management
Exercise 6: Transferring / Installing a File
Fair Lending Wiz clients using a stand-alone work station from a CRA Wiz client within the same institution can install a data file (having a .dat extension) that has been imported, geocoded and edited in CRA Wiz. By using this feature, the Fair Lending Wiz client can immediately use a file for analysis as soon as it’s transferred into their system.
The following exercise will bring you through the steps to install a file.
1. In the View Bar, click on Main, then on File Management to return to the primary file manage-ment screen.
2. Right-click on FL Wiz Training File 2007 for Analysis Purposes.
2.1 Select Transfer/Backup from the contextual menu
89

Fair Lending Wiz Training Guide
3. The Transfer process takes you to a Windows dialog box. Click on the Desktop button in the View Bar, and allow the transferred file to be placed on the desktop. Click Save.
4. To Install the file (in the same folder), right-click within the open area to the right of the folder list.
4.1 Select Install/Restore
5. CRA/FL Wiz will bring you into your Windows Explorer. Navigate to the Desktop, and select the file that you recently backed up.
5.1 When warned about the fact that the same file already exists, click Yes to give the file a new name.
5.2 Name it Install Trial File
5.3 Click OK.
90

File Management
6. Once the process is finished, hit OK. The data file is now in File Manage-ment and can be accessed immediately for analysis.
91

Fair Lending Wiz Training Guide
92

Introduction to Statistics
Chapter 5
Introduction to Statistics
Upon completion of this chapter you will:
Understand basic statistical terms and definitions.
Understand what a T-Statistic is, and how it is used.
Understand the Normal Distribution.
Understand Standard Deviation.
Understand the concept of statistical significance.
93

Fair Lending Wiz Training Guide
Overview
We use Statistics to investigate data. We can use it to generalize, to identify trends or summarize large amounts of information with a few key metrics. Additionally, we use it to identify particular points of interest amongst all the noise, “outliers”, or data that is inconsistent with its peers - an operation that would take a tremendous amount of time and effort to do manually, and perhaps impossible to accom-plish by hand. We created Fair Lending Wiz to be an expert guide to aid you in your search for even a hint of discriminatory practice. But to use Fair Lending Wiz effectively, you will need an understanding of some basic statistical principals, which will be laid out here.
Consider this list of average monthly temperatures for the city of Boston over 13 months:
The mean (or average) temperature is calculated by adding up all the temperatures and then dividing by the total number (13, in this case):
(29 + 34 + 39 + 48 + 58 + 68 + 74 + 72 + 65 + 55 + 45 + 34 + 31) / 13 = 50.2
So the mean temperature for Boston between January ‘06 and January ‘07 was 50.2 degrees.
The median is the middle number when the list is sorted from lowest to highest, like so:
29, 31, 34, 34, 39, 45, 48, 55, 58, 65, 68, 72, 74
The median for this list is 48. (For an even number of data points where there is no single middle value, the median is the average of the middle TWO values.)
The mode is the single value that appears more than any other. In our example there is only one number, 34, that appears more than once therefore, 34 is the mode.
Month Avg Temp
January ‘06 29February ‘06 34March ‘06 39April ‘06 48May ‘06 58June ‘06 68July ‘06 74August ‘06 72September ‘06 65October ‘06 55November ‘06 45December ‘06 34January ‘06 31
94

Introduction to Statistics
Next, we can calculate the standard deviation. Standard deviation is a measure of the average distance between all the data points and the mean. You can tell by looking at the range of values in the table (from a low of 29 to a high of 74) that the standard deviation is going to be relatively high. Our mean, as stated above, is 50.2, so to find the standard deviation we calculate (or, even better, have the computer calculate) the difference between each point and 50.2. The equation to calculate standard deviation is as follows:
Where n is the number of data points in the sample (13 in our case), y is the mean (50.2), and yi is the ith value in the dataset (so 29, 34, 39, etc.).
Carrying out the calculation gives 15.9 as the standard deviation. At this point we should define normal distribution, which will give us some insight into understanding standard deviation.
You’ve probably seen graphs of a normal distribution before. It is more commonly known as a bell curve.
The curve describes the spread of observed values in a hypothetical, “perfectly distributed’ sample set. It describes some phenomenon- such as the spread of interest rates granted to borrowers- where we expect most of the values to be close to the center “hump” of the curve, and fewer and fewer values as you move away from the center. The middle value - the top of the curve - is the mean.
The models in Fair Lending Wiz assume that your loan data should roughly follow this kind of distribution. To understand why this makes intuitive sense, imagine that the curve above is a graph of all the interest rates attached to the a particular type of loan sold by your company in a year (on the x-axis) versus the number of people who took out loans at each rate (on the y-axis). Say the top of the curve represents the number of people who received loans at 7% - the most common rate. Many of the values around 7%, such as 6.8% or 7.3%, are also quite com-mon, as evidenced by the height of the curve at those values. However, we’d also expect that a few loans will fall away from the mean. One of the purposes of Fair Lending Wiz is to help you explain loans in the “tails” of the graph, to the far left (the very low rates) and, more importantly, the values to the far right (the high rates).
1
)(1
2
−
−∑=
n
yyn
ii
95

Fair Lending Wiz Training Guide
The standard deviation tells us how spread out the values are - the higher the standard deviation, the longer and more rounded the curve. Likewise, a small standard deviation means the curve will be tall and skinny - meaning a greater percentage of values are close to the mean.
In a perfect normal distribution, all the values that lie within one standard deviation in each direction from the mean comprise 68% of the data set:
Two standard deviations (actually, a standard deviation of 1.96, to be precise) in each direction includes 95% of the data set:
.
96

Introduction to Statistics
In our Fair Lending analysis, we look at loans that fall outside 95% of the graph contained inside two standard deviations. Of course, we expect to find 5% of all our loans in this outside region. However, there is the possibility that the exceptionally high (or low) rates weren’t determined by “chance” but more deliberate factors. And it is these loans that get lenders into trouble. In fact, by the way the normal distribution is defined, if we find a value that is more than two standard deviations from the mean, we call it statistically significant, since the likelihood that the discrepancy is due to “chance” is only 5%.
One final bit of terminology: A t-stat is simply the number of standard deviations a value lies from the mean. If the t-stat is greater than 1.96, that value is marked as statistically significant (and it can be posi-tive or negative - a negative t-stat means it lies to the left, and a positive t-stat means that value lies to the right).
97

Fair Lending Wiz Training Guide
98

Fair Lending Examination Procedures
Chapter 6
Fair Lending Examination Procedures
Upon completion of this lesson you will:
Understand, at least to some degree, the Interagency Fair Lending Examination Procedures
Know the primary sections of the exam procedures
Know what “Focal Points” and Risk Factors are
99

Fair Lending Wiz Training Guide
Overview
Prior to conducting any type of analysis, it is important to discern where the potential fair lending risks are in your file. With this information you can focus your analysis on a specific product or market. This process not only saves time but also helps you to determine if the data that you are working with is of high quality. This process is also recommended by the Fair Lending Examination Procedures.
To help you determine the scope, focal points, and intensity of your analysis, PCi recommends becoming thoroughly familiar with the “Inter-agency Fair Lending Examination Procedures”. By understanding what process your regulator will use to determine your potential fair lending risks, you can perform the same steps ahead of time and resolve any issues that you may find.
100
Fair Lending Examination Procedures
Interagency Fair Lending Examination Procedures
Part I - Examination Scope Guidelines
The scope of an examination encompasses the loan product(s), mar-ket(s), decision center(s), timeframe, and prohibited basis and control group(s) to be analyzed during the examination. These procedures refer to each potential combination of those elements as a “Focal Point”. Setting the scope of an examination involves first, identifying all of the potential focal points that appear worthwhile to examine. Then from among those, examiners select the focal point(s) that will form the scope of the examination based on risk factors, priorities established in these procedures or by their respective agencies, the record from past exami-nations, and other relevant guidance. This phase includes obtaining an overview of an institutions compliance management system as it relates to fair lending.
Scoping may disclose the existence of circumstances, such as the use of credit scoring or the amount of residential lending which, under an agency’s policy, call for the use of regression analysis or other statistical methods of identifying potential discrimination with respect to one or more loan products. Where that is the case, the agency’s specialized pro-cedures should be employed for such loan products rather than the pro-cedures set forth below.
Setting the intensity of an examination means determining the breadth and depth of the analysis that will be conducted on the selected loan product(s). This process entails a more involved consideration of com-pliance management quality, particularly as it relates to selected products, to reach an informed decision regarding how large a sample of files to review in any transactional analyses performed and whether certain aspects of the credit process deserve heightened scrutiny.
The scoping process can be performed either off-site, onsite, or both, depending on whatever is determined most feasible. In the interest of minimizing burdens on both the examination team and the lender, requests for information from the institution should be carefully thought out so as to include only the information that will clearly be useful in the examination process. Finally, any off-site information requests should be made sufficiently in advance of the on-site schedule to permit institu-tions adequate time to assemble necessary information and provide it to the examination team in a timely fashion.
101

Fair Lending Wiz Training Guide
Examiners should focus the examination based on:
An understanding of the credit operations of the institution
The risk that discriminatory conduct may occur in each area of those operations
The feasibility of developing a factually reliable record of an institution’s performance and fair lending compliance in each area of those operations.
UnderstandingCredit Operations
Before evaluating the potential for discriminatory conduct, the examiner should review sufficient information about the institution and its market to understand the credit operations of the institution and the representation of prohibited basis group residents within the markets where the institution does business. The level of detail to be obtained at this stage should be sufficient to identify whether any of the risk factors in the Steps below are present. Relevant background information includes:
The types and terms of credit products offered, differentiating among residential, consumer and other categories of credit
The volume of, or growth in, lending for each of the credit products offered
The demographics (i.e., race, national origin, etc.) of the credit markets in which the institution is doing business
The institution’s organization of its credit decision-making process, including identification of the delegation of separate lending authorities and the extent to which discretion in pricing or setting credit terms and conditions is delegated to various levels of managers, employees or independent brokers or dealers
The types of relevant documentation/data that are available for various loan products and what is the relative quantity, quality and accessibility of such information. I.e., for which loan product(s) will the information available be most likely to support a sound and reliable fair lending analysis
The extent to which information requests can be readily organized and coordinated with other compliance examination components to reduce undue burden on the institution. (Do not request more information than the exam team can be expected to utilize during the anticipated course of the examination.)
102

Fair Lending Examination Procedures
In thinking about an institution’s credit markets, the examiner should recognize that these markets may or may not coincide with an institu-tions CRA assessment area(s). Where appropriate, the examiner should review the demographics for a broader geographic area than the assess-ment area.
Where an institution has multiple underwriting or loan processing cen-ters or subsidiaries, each with fully independent credit-granting authority, consider evaluating each center and/or subsidiary separately, provided a sufficient number of loans exist to support a meaningful analysis. In determining the scope of the examination for such institutions, examin-ers should consider whether:
Subsidiaries should be examined. The agencies will hold a financial institution responsible for violations by its direct subsidiaries, but not typically for those by its affiliates (unless the affiliate has acted as the agent for the institution or the violation by the affiliate was known or should have been known to the institution before it became involved in the transaction or purchased the affiliate’s loans). When seeking to determine an institution’s relationship with affiliates that are not supervised financial institutions, limit the inquiry to what can be learned in the institution and do not contact the affiliate.
The underwriting standards and procedures used in the entity being reviewed are used in related entities not scheduled for the planned examination. This will help examiners to recognize the potential scope of policy-based violations.
The portfolio consists of applications from a purchased institution. If so, for scoping purposes, examiners should consider the applications as if they were made to the purchasing institution. (For comparison purposes, applications evaluated under the purchased institution’s standards should not be compared to applications evaluated under the purchasing institution’s standards.)
The portfolio includes purchased loans. If so, examiners should look for indications that the institution specified loans to purchase based on a prohibited factor or caused a prohibited factor to influence the origination process.
A complete decision can be made at one of the several underwriting or loan processing centers, each with independent authority. In such a situation, it is best to conduct onsite a separate comparative analysis at each underwriting center. If covering multiple centers is not feasible during the planned examination, examiners should review one during the planned examination and others in later examinations.
103

Fair Lending Wiz Training Guide
Decision-making responsibility for a single transaction may involve more than one underwriting center. For example, an institution may have authority to decline mortgage applicants, but only the mortgage company subsidiary may approve them. In such a situation, examiners should learn which standards are applied in each entity and the location of records needed for the planned comparisons.
Any third parties, such as brokers or contractors, are involved in the credit decision and how responsibility is allocated among them and the institution. The institution’s familiarity with third party actions may be important, for a bank may be in violation if it participates in transactions in which it knew or reasonably ought to have known other parties were discriminating.
If the institution is large and geographically diverse, examiners should select only as many markets or underwriting centers as can be reviewed readily in depth, rather than selecting proportionally to cover every mar-ket. As needed, examiners should narrow the focus to the MSA or underwriting center that is determined to present the highest discrimina-tion risk. Examiners should use LAR data organized by underwriting center, if available. After calculating denial rates between the control group and minorities for the underwriting centers, examiners should select the centers with the highest disparities. If underwriting centers have fewer than five black, Hispanic, or Native American denials, exam-iners should not examine for racial discrimination. Instead, they should shift the focus to other loan products or prohibited bases.
Evaluating thePotential for
DiscriminatoryConduct
Step One: Develop an Overview
Based on his or her understanding of the credit operations and product offerings of an institution, an examiner should determine the nature and amount of information required for the scoping process and should obtain and organize that information. No single examination can reason-ably be expected to evaluate compliance performance as to every prohib-ited basis, in every product, or in every underwriting center or subsidiary of an institution. In addition to information gained in the process of Understanding Credit Operations, above, the examiner should keep in mind the following factors when selecting products for the scoping review:
Which products and prohibited bases were reviewed during the most recent prior examination(s) and, conversely, which products and prohibited bases have not recently been reviewed?
Which prohibited basis groups make up a significant portion of the institution’s market for the different credit products offered?
Based on consideration of the foregoing factors, the examiner should request information for all residential and other loan products consid-ered appropriate for scoping in the current examination cycle. In addi-tion, wherever feasible, examiners should conduct preliminary interviews
104

Fair Lending Examination Procedures
with the lender’s key underwriting personnel. Using the accumulated information, the examiner should evaluate the following, as applicable:
Underwriting guidelines, policies, and standards
Descriptions of credit scoring systems, including a list of factors scored, cutoff scores, extent of validation, and any guidance for handling overrides and exceptions. (Refer to Part A of the Credit Scoring Analysis section of the Appendix for guidance)
Applicable pricing policies and guidance for exercising discretion over loan terms and conditions
The institution’s corporate relationships with any finance companies, subprime mortgage or consumer lending entities, or similar institutions
Loan application forms
HMDA/LAR or loan registers and lists of declined applications
Description(s) of databases maintained for loan product(s) to be reviewed, especially any record of exceptions to underwriting guidelines
Copies of any consumer complaints alleging discrimination and loan files related thereto
Descriptions of any compensation system that is based on loan production or pricing
Compliance program materials (particularly fair lending policies), training manuals, organization charts, as well as record keeping and any monitoring protocols
Copies of any available marketing materials or descriptions of current or previous marketing plans or programs.
105

Fair Lending Wiz Training Guide
Step Two: Identify Compliance Program Discrimination Risk Fac-tors
Review information from agency examination work papers, institutional records and any available discussions with management representatives in sufficient detail to understand the organization, staffing, training, record keeping, auditing and policies of the institutions fair lending com-pliance systems. Review these systems and note the following risk fac-tors:
C1. Overall institution compliance record is weak.
C2. Prohibited basis monitoring information is incomplete.
C3. Data and/or record keeping problems compromised reliability of previous examination reviews.
C4. Fair lending problems were previously found in one or more bank products.
C5. The size, scope, and quality of the compliance management pro-gram, including senior management’s involvement, is materially infe-rior to programs customarily found in institutions of similar size, market demographics and credit complexity.
C6. The institution has not updated compliance guidance to reflect changes in law or in agency policy.
Consider these risk factors and their impact on particular lending prod-ucts and practices as you conduct the product specific risk review during the scoping steps that follow. Where this review identifies fair lending compliance system deficiencies, give them appropriate consideration as part of the Compliance Management Review in Part II of these proce-dures.
Step Three: Review Residential Loan Products
Although home mortgages may not be the ultimate subject of every fair lending examination, this product line must at least be considered in the course of scoping every institution that is engaged in the residential lend-ing market.
106

Fair Lending Examination Procedures
Divide home mortgage loans into the following groupings: home pur-chase, home improvements, and refinancings. Subdivide those three groups further if an institution does a significant number of any of the following types or forms of residential lending, and consider them sepa-rately:
Government-insured loans
Mobile home or factory housing loans
Wholesale, indirect and brokered loans
Portfolio lending (including portfolios of Fannie Mae/Freddie Mac rejections)
In addition, determine whether the lender offers any conventional affordable housing loan programs and whether their terms and condi-tions make them incompatible with regular conventional loans for com-parative purposes. If so, consider them separately.
If previous examinations have demonstrated the following, then an examiner may limit the focus of the current examination to alternative underwriting or processing centers or to other residential products that have received less scrutiny in the past:
A strong fair lending compliance program
No record of discriminatory transactions at particular decision centers or in particular residential products
No indication of a significant change in personnel, operations or underwriting standards at those centers or in those residential products
No unresolved fair lending complaints, administrative proceedings, litigation or similar factors.
Step Four: Identify Residential Lending Discrimination Risk Fac-tors
Review the lending policies, marketing plans, underwriting, appraisal and pricing guidelines, broker/agent agreements and loan application forms for each residential loan product that represents an appreciable volume of, or displays noticeable growth in, the institution’s residential lending.
Review also any available data regarding the geographic distribution of the institution’s loan originations with respect to the race and national origin percentages of the census tracts within its assessment area or, if different, its residential loan product lending area(s).
Conduct interviews of loan officers and other employees or agents in the residential lending process concerning adherence to and understanding of the above policies and guidelines as well as any relevant operating practices.
107

Fair Lending Wiz Training Guide
In the course of conducting the foregoing inquiries, look for the following risk factors (factors are numbered alphanumerically to coincide with the type of factor, e.g., "O" for "overt"; "P" for "pricing", etc.):
Overt indicators of discrimination such as:
O1. Including explicit prohibited basis identifiers in underwriting criteria or pricing standards
O2. Collecting information, conducting inquiries or imposing condi-tions contrary to express requirements of Regulation B
O3. Including variables in a credit scoring system that constitute a basis or factor prohibited by Regulation B or, for residential loan scoring systems, the FH Act. (If a credit scoring system scores age, refer to Part E of the Credit Scoring Analysis section of the Appendix.)
O4. Statements made by the institutions officers, employees or agents which constitute an express or implicit indication that one or more such persons have engaged or do engage in discrimination on a prohibited basis in any aspect of a credit transaction
O5. Employee or institutional statements that evidence attitudes based on prohibited basis prejudices or stereotypes.
Note:For risk factors below that are marked with an asterisk, examiners need not attempt to calculate the indicated ratios for racial or national origin characteristics when the institution in not a HMDA reporter. However, consideration should be given in such cases to whether or not such cal-culations should be made based on gender or racial-ethnic surrogates.
Indicators of potential disparate treatment in Underwriting such as:
U1. Substantial disparities among the approval/denial rates for applicants by monitored prohibited basis characteristic (especially within income categories)
U2. Substantial disparities among the application processing times for applicants by monitored prohibited basis characteristic (espe-cially within denial reason groups)
U3. Substantially higher proportion of withdrawn/incomplete appli-cations from prohibited basis group applicants than from other applicants
U4. Vague or unduly subjective underwriting criteria
108

Fair Lending Examination Procedures
U5. Lack of clear guidance on making exceptions to underwriting criteria, including credit scoring overrides
U6. Lack of clear loan file documentation regarding reasons for any exceptions to normal underwriting standards, including credit scor-ing overrides
U7. Relatively high percentages of either exceptions to underwriting criteria or overrides of credit score cutoffs
U8. Loan officer or broker compensation based on loan volume (especially loans approved per period of time)
U9. Consumer complaints alleging discrimination in loan processing or in approving/denying residential loans.
Indicators of potential disparate treatment in Pricing (interest rates, fees, or points) such as:
P1. Relationship between loan pricing and compensation of loan officers or brokers
P2. Presence of broad discretion in pricing or other transaction costs
P3. Use of a system of risk-based pricing that is not empirically based and statistically sound
P4. Substantial disparities among prices being quoted or charged to applicants who differ as to their monitored prohibited basis charac-teristics
P5. Consumer complaints alleging discrimination in residential loan pricing.
Indicators of potential disparate treatment by Steering such as:
S1. For an institution that has one or more sub-prime mortgage sub-sidiaries or affiliates, any significant differences, by loan product, in the percentage of prohibited basis applicants of the institution com-pared with the percentage of prohibited basis applicants of the sub-sidiaries) or affiliate(s)
109

Fair Lending Wiz Training Guide
S2. Lack of clear, objective standards for (i) referring applicants to subsidiaries or affiliates, (ii) classifying applicants as “prime” or “subprime” borrowers, or (iii) deciding what kinds of alternative loan products should be offered or recommended to applicants
S3. For an institution that makes both conventional and FHA mort-gages, any significant differences in the percentages of prohibited basis group applicants in each of these two loan products, particu-larly with respect to loan amounts of $100,000 or more
S4. For an institution that makes both prime and sub-prime loans for the same purpose, any significant differences in percentages of prohibited basis group borrowers in each of the alternative loan product categories
S5. Consumer complaints alleging discrimination in residential loan pricing
S6. A lender with a sub-prime mortgage company subsidiary or affil-iate integrates loan application processing for both entities, such that steering between the prime and subprime products can occur almost seamlessly; i.e., a single loan processor could simultaneously attempt to qualify any applicant, whether to the bank or the mortgage com-pany, under either the bank’s prime criteria or the mortgage com-pany’s sub-prime criteria
S7. Loan officers have broad discretion regarding whether to pro-mote conventional or FHA loans, or both, to applicants and the lender has not issued guidelines regarding the exercise of this discre-tion
S8. A lender has most of its branches in predominantly white neigh-borhoods. The lender's subprime mortgage subsidiary has branches which are located primarily in predominantly minority neighbor-hoods.
Indicators of potential discriminatory Redlining such as:
R1. Significant differences, as revealed in HMDA data, in the num-ber of loans originated in those areas in the lender’s market that have relatively high concentrations of minority group residents compared with areas with relatively low concentrations of minority residents.
R2. Significant differences between approval/denial rates for all applicants (minority and non minority) in areas with relatively high concentrations of minority group residents compared with areas with relatively low concentrations of minority residents.
R3. Significant differences between denial rates based on insuffi-cient collateral for applicants from areas with relatively high concen-
110

Fair Lending Examination Procedures
trations of minority residents and those areas with relatively low concentrations of minority residents.
R4. Other patterns of lending identified during the most recent CRA examination that differ by the concentration of minority resi-dents.
R5. Explicit demarcation of credit product markets that excludes MSAs, political subdivisions, census tracts, or other geographic areas within the institution’s lending market and having relatively high concentrations of minority residents.
R6. Policies on receipt and processing of applications, pricing, con-ditions, or appraisals and valuation, or on any other aspect of pro-viding residential credit that vary between areas with relatively high concentrations of minority residents and those areas with relatively low concentrations of minority residents.
R7. Employee statements that reflect an aversion to doing business in areas with relatively high concentrations of minority residents.
R8. Complaints or other allegations by consumers or community representatives that the lender excludes or restricts access to credit for areas with relatively high concentrations of minority residents. Examiners should review complaints against the lender filed with their agency; the CRA public comment file; community contact forms; and the responses to questions about redlining, discrimina-tion, and discouragement of applications, and about meeting the needs of racial or national origin minorities, asked as part of “obtain-ing local perspectives on the performance of financial lenders” dur-ing prior CRA examinations.
Note:Broad allegations or complaints are not, by themselves, sufficient justifi-cation to shift the focus of an examination from routine comparative review of applications to redlining analysis. Such a shift should be based on complaints or allegations of specific practices or incidents that are consistent with redlining, along with the existence of other risk factors.
R9. A lender that has most of its branches in predominantly white neighborhoods at the same time that the lender's subprime mortgage subsidiary has branches which are located primarily in predomi-nantly minority neighborhoods.
111

Fair Lending Wiz Training Guide
Indicators of potential disparate treatment in Marketing of residential products, such as:
M1. Advertising patterns or practices that a reasonable person would believe indicate prohibited basis customers are less desirable.
M2. Advertising only in media serving non minority areas of the market.
M3. Marketing through brokers or other agents that the lender knows (or has reason to know) would serve only one racial or ethnic group in the market.
M4. Use of marketing programs or procedures for residential loan products that exclude one or more regions or geographies within the lenders assessment or marketing area that have significantly higher percentages of minority group residents than does the remainder of the assessment or marketing area.
M5. Using mailing or other distribution lists or other marketing techniques for pre screened or other offerings of residential loan products that:
Explicitly exclude groups of prospective borrowers on a prohibited basis; or
Exclude geographies (e.g., census tracts, ZIP codes, etc.) within the institution’s marketing area that have significantly higher percentages of minority group residents than does the remainder of the marketing area.
Note:Pre-screened solicitation of potential applicants on a prohibited basis does not violate ECOA. Such solicitations are, however, covered by the FH Act. Consequently, analysis of this form of potential marketing dis-crimination should be limited to residential loan products subject to cov-erage under the FH Act.
M6. Proportion of monitored prohibited basis applicants is signifi-cantly lower than that group’s representation in the total population of the market area.
M7. Consumer complaints alleging discrimination in advertising or marketing loans.
112

Fair Lending Examination Procedures
Step Five: Organize and Focus Residential Risk Analysis
Review the risk factors identified in Step 4 and, for each loan product that displays risk factors, articulate the possible discriminatory effects encountered and organize the examination of those loan products in accordance with the following guidance:
Where overt evidence of discrimination, as described in factors O1-O5, has been found in connection with a product, document those findings as described in Part III, A, besides completing the remainder of the planned examination analysis.
Where any of the risk factors U1-U9 are present, consider conducting an underwriting comparative file analysis as described in Part III, B.
Where any of the risk factors P1-P5 are present, consider conducting a pricing comparative file analysis as described in Part III, C.
Where any of the risk factors S1-S8 are present, consider conducting a steering analysis as described in Part III, D.
Where any of the risk factors R1-R9 are present, consult agency managers about conducting an analysis for redlining as described in Part III, F.
Where any of the risk factors M1-M7 are present, consult agency managers about conducting a marketing analysis as described in Part III, G.
Where an institution uses age in any credit scoring system, consider conducting an examination analysis of that credit scoring system’s compliance with the requirements of Regulation B as described in Part III, H.
Step Six: Identify Consumer Lending Discrimination Risk Factors
For credit card, motor vehicle, home equity and other consumer loan products selected in Step One for risk analysis in the current examination cycle, conduct a risk factor review similar to that conducted for residen-tial lending products in Steps Three through Five, above. Consult with agency managers regarding the potential use of surrogates to identify possible prohibited basis group individuals.
113

Fair Lending Wiz Training Guide
Note: The term surrogate in this context refers to any factor related to a loan applicant that potentially identifies that applicants race, color or other prohibited basis characteristic in instances where no direct evidence of that characteristic is available. Thus, in consumer lending, where moni-toring data is generally unavailable, an outwardly Hispanic or Asian sur-name could constitute a surrogate for an applicants race or national origin because then examiner can assume that the lender (who can rebut the presumption) perceived the person to be Hispanic. Similarly, an applicant’s given name could serve as a surrogate for his or her gender. A surrogate for a prohibited basis characteristic may be used as to set up a comparative analysis with non minority applicants or borrowers.
Using decision rules in Steps 3 - 5, above, for residential lending prod-ucts, articulate the possible discriminatory patterns encountered and consider examining those products determined to have sufficient risk of discriminatory conduct.
Step Seven: Analyze Commercial Lending Discrimination Risk
Where an institution does a substantial amount of lending in the com-mercial lending market, most notably small business loans (and the prod-uct has not recently been examined or the underwriting standards have changed since the last examination of the product), the examiner should consider conducting a risk factor review similar to that performed for residential lending products, as feasible, given the limited information available. Such an analysis should generally be limited to determining risk potential based on risk factors U4-U8; P1-P3; R4-R7; and M1-M3.
If the institution makes commercial loans insured by the Small Business Administration (SBA), determine from agency supervisory staff whether SBA loan data (which codes race and other factors) are available for the institution and evaluate those data pursuant to instructions accompany-ing them.
For large institutions reporting small business loans for CRA purposes and where the institution also voluntarily geocodes loan denials, look for material discrepancies in ratios of approval-to denial rates for applica-tions in areas with relatively high concentrations of minority residents compared with areas with relatively low concentrations.
Articulate the possible discriminatory patterns identified and consider further examining those products determined to have sufficient risk of discriminatory conduct in accordance with the procedures for commer-cial lending described in Part III, F.
114

Fair Lending Examination Procedures
Step 8: Complete the Scoping Process
To complete the scoping process, the examiner should review the results of the preceding steps and select those focal points that warrant exami-nation, based on the relative risk levels identified above. In order to remain within the agencies resource allowances, the examiner may need to choose a smaller number of Focal Points from among all those selected on the basis of risk. In such instances, set the scope by first, pri-oritizing focal points on the basis of (i) high number and/or relative severity of risk factors; (ii) high data quality and other factors affecting the likelihood of obtaining reliable examination results; (iii) high loan volume and the likelihood of widespread risk to applicants and borrow-ers; and (iv) low quality of any compliance program and, second, select-ing for examination review as many focal points as resources permit.
Where the judgment process among competing Focal Points is a close call, information learned in the phase of conducting the compliance management review can be used to further refine the examiner’s choices.
115

Fair Lending Wiz Training Guide
116

Data Integrity and Scoping
Chapter 7
Data Integrity and Scoping
Upon completion of this lesson you will be able to:
Apply filters and run standard reports.
Export data out of Fair Lending Wiz to create additional reports.
Determine data integrity for any variable.
Determine if any protected class was treated differently in the application of any particular variable.
Determine the geographic and product markets where your institution has the greatest potential risk.
Identify risk factors within the data.
117

Fair Lending Wiz Training Guide
Overview
Prior to conducting any type of analysis, it is important to discern where the potential fair lending risks are in your file. With this information you can focus your analysis on a specific product or market. This process not only saves time but also helps you to determine if the data that you are working with is of high quality. This process is also recommended by the Fair Lending Examination Procedures.
Data Integrity ia a key element to ensuring quality analysis. If the data that you are using is missing or contains incorrect values it can seriously skew your results. Fair Lending Wiz will run a variety of reports but the results are only as good as the data that has been brought into the soft-ware.
118

Data Integrity and Scoping
Exercise 1: Generating Reports with Filters
Introduction
Filters, which are available for all reports, allow you to constrain the data used in analysis by a multitude of fields, i.e. loan type, race, census tract, etc.
A variety of Standard Reports have been included in Fair Lending Wiz. These reports can provide answers to some of the questions you have about your data such as “What is the approval or denial rate by gender?” or “Were certain denial reasons used more with black applicants than with white applicants?” In addition to this, a variety of display and print-ing options are available to allow flexible viewing of the reports in many different ways.
Scenario
You want to get an overall feel for your lending distribution. This includes all applications, by race, ethnicity, gender, applicant income level, tract income level, and tract minority level.
There are two reports that PCi recommends at the outset of your fair lending review:
Summary Report - Action Taken
Standard Summary Report
Ideally, you would run these reports with no filters first in order to get an idea of the overall distribution, then you would apply filters, if applicable, for Conventional Home Purchase, Government Home Purchase, Home Improvement, Conventional Refinance Loans, and finally Government Refinance Loans. Additional filters could be run for your major loan pro-grams, cost centers, underwriting centers, etc.
119

Fair Lending Wiz Training Guide
Activity 1
To generate the Summary Report - Action Taken without a filter, follow these steps:
1. Confirm that the FLW Training File 2007 for Analysis Purposes is the current file. Click the Fair Lending Wiz button in the View bar.
2. Click on the Standard Reports button in the View bar, then double-click on the Fair Lending Reports folder (or the + sign next to the folder).
3. Place a checkmark next to the Summary Report - Action Taken, then the Standard Summary Report.
120

Data Integrity and Scoping
4. In the Tool bar, click the Generate button.
121

Fair Lending Wiz Training Guide
.S
um
mar
yR
epo
rts
-A
ctio
nT
aken
FLW
izT
rain
ing
File
2007
for
An
alys
isP
urp
oses
Act
ive
Filt
ers
To
tal
Ap
pli
ca
tio
nLo
an
Ori
gin
ate
d(a
,b)
Ap
pli
ca
tio
nD
en
ied
Ap
pli
ca
tio
nW
ith
dra
wn
Pe
rcen
tP
erc
en
tP
erc
en
tP
erc
en
t
Co
un
tC
olu
mn
Po
rtf.
Co
un
tIn
dex
Ro
wC
olu
mn
Po
rtf.
Co
un
tIn
dex
Ro
wC
olu
mn
Po
rtf.
Co
un
tIn
dex
Ro
wC
olu
mn
Po
rtf.
Ap
pli
ca
nt
Ra
ce
Am
erican
India
n/A
lask
aN
ative
79
0.4
0100.0
039
64
49.3
70.2
7100.0
029
369
36.7
11.3
5100.0
03
193
3.8
00.7
0100.0
0
Asia
n406
2.0
4100.0
0248
79
61.0
81.6
9100.0
088
218
21.6
74.0
9100.0
013
163
3.2
03.0
4100.0
0
Bla
ck
or
Afr
ican
Am
erican
843
4.2
3100.0
0525
81
62.2
83.5
7100.0
0175
209
20.7
68.1
4100.0
020
120
2.3
74.6
8100.0
0
Haw
aiian
/Paci
fic
Isla
nder
78
0.3
9100.0
051
85
65.3
80.3
5100.0
017
219
21.7
90.7
9100.0
02
130
2.5
60.4
7100.0
0
White
15,6
94
78.7
9100.0
012,1
18
100
77.2
182.5
0100.0
01,5
61
100
9.9
572.6
4100.0
0309
100
1.9
772.3
7100.0
0
2or
More
Min
ority
Race
s12
0.0
6100.0
04
43
33.3
30.0
3100.0
04
335
33.3
30.1
9100.0
00
00.0
00.0
0100.0
0
Join
tR
ace
(White/M
inority
)235
1.1
8100.0
0181
100
77.0
21.2
3100.0
021
90
8.9
40.9
8100.0
04
86
1.7
00.9
4100.0
0
Race
Not
Availa
ble
2,5
72
12.9
1100.0
01,5
23
77
59.2
110.3
7100.0
0254
99
9.8
811.8
2100.0
076
150
2.9
517.8
0100.0
0
Eth
nic
ity
His
panic
or
Latino
994
4.9
9100.0
0597
78
60.0
64.0
6100.0
0230
228
23.1
410.7
0100.0
026
130
2.6
26.0
9100.0
0
Not
His
panic
or
Latino
16,0
03
80.3
4100.0
012,3
19
100
76.9
883.8
7100.0
01,6
27
100
10.1
775.7
1100.0
0321
100
2.0
175.1
8100.0
0
Join
t(H
isp/L
at
/N
ot
His
p/L
at)
233
1.1
7100.0
0171
95
73.3
91.1
6100.0
028
118
12.0
21.3
0100.0
03
64
1.2
90.7
0100.0
0
Eth
nic
ity
Not
Available
2,6
89
13.5
0100.0
01,6
02
77
59.5
810.9
1100.0
0264
97
9.8
212.2
8100.0
077
143
2.8
618.0
3100.0
0
Min
ori
tyS
tatu
s
White
Non-H
ispanic
14,4
62
72.6
0100.0
011,3
26
100
78.3
277.1
1100.0
01,3
34
100
9.2
262.0
8100.0
0284
100
1.9
666.5
1100.0
0
Oth
ers
,In
clu
din
gH
ispanic
2,7
55
13.8
3100.0
01,7
49
81
63.4
811.9
1100.0
0550
216
19.9
625.5
9100.0
067
124
2.4
315.6
9100.0
0
Tra
ct
In
co
me
Le
ve
l
Low
(0-4
9%
ofM
edia
n)
713
3.5
8100.0
0525
99
73.6
33.5
7100.0
084
105
11.7
83.9
1100.0
014
95
1.9
63.2
8100.0
0
Modera
te(5
0-7
9%
ofM
edia
n)
3,3
74
16.9
4100.0
02,5
36
102
75.1
617.2
6100.0
0337
89
9.9
915.6
8100.0
078
112
2.3
118.2
7100.0
0
Mid
dle
(80-1
19%
of
Media
n)
8,9
50
44.9
3100.0
06,6
27
100
74.0
445.1
2100.0
0970
97
10.8
445.1
4100.0
0195
105
2.1
845.6
7100.0
0
Upper
(>=
120%
of
Media
n)
6,7
12
33.7
0100.0
04,9
70
100
74.0
533.8
3100.0
0753
100
11.2
235.0
4100.0
0139
100
2.0
732.5
5100.0
0
NA
170
0.8
5100.0
031
25
18.2
40.2
1100.0
05
26
2.9
40.2
3100.0
01
28
0.5
90.2
3100.0
0
Ap
pli
ca
nt
In
co
me
Le
ve
l
Low
(0-4
9%
ofM
edia
n)
1,4
20
7.1
3100.0
0914
81
64.3
76.2
2100.0
0331
323
23.3
115.4
0100.0
031
98
2.1
87.2
6100.0
0
Modera
te(5
0-7
9%
ofM
edia
n)
3,9
42
19.7
9100.0
02,9
03
93
73.6
419.7
6100.0
0527
185
13.3
724.5
2100.0
080
91
2.0
318.7
4100.0
0
Mid
dle
(80-1
19%
of
Media
n)
5,0
33
25.2
7100.0
03,9
59
100
78.6
626.9
5100.0
0505
139
10.0
323.5
0100.0
085
75
1.6
919.9
1100.0
0
Upper
(>=
120%
of
Media
n)
7,4
15
37.2
3100.0
05,8
59
100
79.0
239.8
9100.0
0535
100
7.2
224.9
0100.0
0166
100
2.2
438.8
8100.0
0
NA
2,1
09
10.5
9100.0
01,0
54
63
49.9
87.1
8100.0
0251
165
11.9
011.6
8100.0
065
138
3.0
815.2
2100.0
0
Min
ori
tyC
on
ce
ntr
ati
on
Non-M
inority
(<20%
)10,5
66
53.0
4100.0
07,8
00
100
73.8
253.1
0100.0
01,1
69
100
11.0
654.4
0100.0
0231
100
2.1
954.1
0100.0
0
Mix
ed
(20-4
9%
)5,7
70
28.9
7100.0
04,2
78
100
74.1
429.1
2100.0
0616
96
10.6
828.6
6100.0
0127
101
2.2
029.7
4100.0
0
Subst
. M
inority
(>=
50%
)3,4
55
17.3
5100.0
02,6
08
102
75.4
817.7
5100.0
0364
95
10.5
416.9
4100.0
069
91
2.0
016.1
6100.0
0
Lo
an
Pu
rpo
se
an
dty
pe
Purc
hase
-Convnt'l
7,6
22
38.2
6100.0
05,5
55
NA
72.8
837.8
2100.0
0638
NA
8.3
729.6
9100.0
0212
NA
2.7
849.6
5100.0
0
Hom
eIm
pro
vem
ent
-Convnt'l
2,3
53
11.8
1100.0
01,7
07
NA
72.5
511.6
2100.0
0380
NA
16.1
517.6
8100.0
030
NA
1.2
77.0
3100.0
0
Refinanci
ng
-Convnt'l
7,8
31
39.3
1100.0
05,8
95
NA
75.2
840.1
3100.0
0878
NA
11.2
140.8
6100.0
0142
NA
1.8
133.2
6100.0
0
Govern
ment
2,1
13
10.6
1100.0
01,5
32
NA
72.5
010.4
3100.0
0253
NA
11.9
711.7
7100.0
043
NA
2.0
410.0
7100.0
0
Pro
pe
rty
Typ
eO
ne-
to F
our-
Fam
ily19,6
17
98.4
8100.0
014,5
06
NA
73.9
598.7
5100.0
02,0
70
NA
10.5
596.3
2100.0
0425
NA
2.1
799.5
3100.0
0
Manufa
cture
dH
ousi
ng
298
1.5
0100.0
0183
NA
61.4
11.2
5100.0
075
NA
25.1
73.4
9100.0
02
NA
0.6
70.4
7100.0
0
Multifam
ily4
0.0
2100.0
00
NA
0.0
00.0
0100.0
04
NA
100.0
00.1
9100.0
00
NA
0.0
00.0
0100.0
0
(a)
Index
for
Race
iscalc
ula
ted
as
% r
ow
for
any
race/%
row
for
white.
Index
for
Min
ority
Sta
tus
iscalc
ula
ted
as
%ro
wfo
rO
thers
,In
cludin
gH
ispanic
/ %
row
for
White
Non-H
ispanic
.
Index
for
Tra
ct
Inco
me
Levelis
calc
ula
ted
as
%ro
wfo
rany
tract
type/%
row
for
upper
incom
e
Index
for
Min
ority
Conce
ntr
ation is
calc
ula
ted
as
% r
ow
for
any
min
ority
concentr
ation/%
row
for
non-m
inority
tract
s.
Data
Sourc
e:
2000 U
SCensu
sSF1/S
F3
Index
for
Eth
nic
ity is
calc
ula
ted
as
% r
ow
for
any E
thnic
ity/%
row
for
Not
His
panic
or
Latino.
©PCiCorp
ora
tion
CRA
Wiz
Tel:
800-2
61-3
111
Index
for
Applic
ant
Incom
eLevel is
calc
ula
ted
as
% r
ow
for
any
tract
type/%
row
for
upper
inco
me
applica
nts
.
(b)
The
Port
folio
colu
mn
iscalc
ula
ted
as
applic
ations
inth
ese
lecte
dare
a/a
llapplic
ations
inth
efile
.
Ifno
Saved
Are
aor
Geogra
phic
Info
rmation
filter
issele
cted,
the
Port
folio
colu
mn,by
definitio
n,
is100%
.
Ifa
Saved
Are
aor
Geogra
phic
Info
rmation
filter
isse
lecte
d,th
ePort
folio
colu
mn,
by
definitio
nw
illbe
100%
if
no loan
applic
ations
outs
ide
of
the
fite
rfit
the
sam
ecr
iteria.
Standard Summary - Action Taken
122

Data Integrity and Scoping
5. Items for discussion based on Summary Report - Action Taken:
5.1 DISTRIBUTION of Applications and Originations by Race, Ethnicity, Income Level
5.2 ORIGINATED INDEX - these numbers are generated by tak-ing the minority origination rate divided by the control group origination rate. Example: American Indian origination rate 49.37%/White origination rate 77.21% = 63.94, or 64. For Originations, an index below 100 means a lower origination rate, and an index below 50 means an origination rate at less than half the rate for the control group.
5.3 DENIED INDEX - minority denial rate divided by control denial rate. Example: American Indian denial rate 36.71%/White denial rate 9.95% = 3.69, or 369 Index. For Denials, a denial rate above 200 (2 to 1) is worthy of attention.
6. To select the Standard Summary Report, move your cursor over the Selected Analysis button in the Anal-ysis bar.
6.1 Select Standard Summary Report from the reports listed.
6.2 Click the GO button to generate the report.
123

Fair Lending Wiz Training Guide
Sta
nd
ard
Su
mm
ary
Rep
ort
FLW
izT
rain
ing
File
2007
for
An
alys
isP
urp
oses
Act
ive
Filt
ers
Tot
alA
ppl
icat
ions
(1)
Ori
gina
ted
(2)
App
rove
dN
otA
ccep
ted
Den
ied
(3)
Wit
hdr
awn
/In
com
plet
eP
reap
prov
alD
enie
dP
reap
prov
edN
otA
ccep
ted
Cou
nt
%C
oun
t%
Cou
nt
%C
oun
t%
Cou
nt
%C
oun
t%
Cou
nt
%
Lo
an
Pu
rpo
se
an
dT
yp
e
Purc
hase
-Conventional
7,6
22
38.2
65,5
55
37.8
2709
42.2
5638
8.3
7381
44.9
856
45.1
60
0.0
0
Purc
hase
-G
overn
ment
1,3
27
6.6
6948
6.4
592
5.4
8151
11.3
844
5.1
968
54.8
40
0.0
0
Hom
eIm
pro
vem
ent
2,3
69
11.8
91,7
16
11.6
8158
9.4
2384
16.2
1109
12.8
70
0.0
00
0.0
0
Refinanci
ng
8,6
01
43.1
86,4
70
44.0
5719
42.8
5976
11.3
5313
36.9
50
0.0
00
0.0
0
Ap
pli
ca
nt
Ra
ce
Am
erican
India
n/A
lask
aN
ative
79
0.4
039
0.2
75
0.3
029
36.7
15
0.5
91
0.8
10
0.0
0
Asia
n406
2.0
4248
1.6
940
2.3
888
21.6
729
3.4
21
0.8
10
0.0
0
Bla
ck
or
Afr
ican
Am
erican
843
4.2
3525
3.5
781
4.8
3175
20.7
650
5.9
012
9.6
80
0.0
0
Haw
aiian
/Paci
fic
Isla
nder
78
0.3
951
0.3
56
0.3
617
21.7
94
0.4
70
0.0
00
0.0
0
White
15,6
94
78.7
912,1
18
82.5
01,3
10
78.0
71,5
61
9.9
5611
72.1
494
75.8
10
0.0
0
2or
More
Min
ority
Race
s12
0.0
64
0.0
33
0.1
84
33.3
31
0.1
20
0.0
00
0.0
0
Join
tR
ace
(White/M
inority
)235
1.1
8181
1.2
324
1.4
321
8.9
46
0.7
13
2.4
20
0.0
0
Race
Not
Availa
ble
2,5
72
12.9
11,5
23
10.3
7209
12.4
6254
9.8
8141
16.6
513
10.4
80
0.0
0
Ap
pli
ca
nt
Eth
nic
ity
His
panic
or
Latino
994
4.9
9597
4.0
691
5.4
2230
23.1
456
6.6
120
16.1
30
0.0
0
Not
His
panic
or
Latino
16,0
03
80.3
412,3
19
83.8
71,3
32
79.3
81,6
27
10.1
7638
75.3
287
70.1
60
0.0
0
Join
t(H
isp/L
at
/N
ot
His
p/L
at)
233
1.1
7171
1.1
625
1.4
928
12.0
27
0.8
32
1.6
10
0.0
0
Eth
nic
ity
Not
Available
2,6
89
13.5
01,6
02
10.9
1230
13.7
1264
9.8
2146
17.2
415
12.1
00
0.0
0
Min
ori
tyS
tatu
s
White
Non-H
ispanic
14,4
62
72.6
011,3
26
77.1
11,1
83
70.5
01,3
34
9.2
2548
64.7
071
57.2
60
0.0
0
Oth
ers
,In
clu
din
gH
ispanic
2,7
55
13.8
31,7
49
11.9
1265
15.7
9550
19.9
6153
18.0
638
30.6
50
0.0
0
Ap
pli
ca
nt
In
co
me
Low
(0-4
9%
ofM
edia
n)
1,4
20
7.1
3914
6.2
2117
6.9
7331
23.3
158
6.8
50
0.0
00
0.0
0
Modera
te(5
0-7
9%
ofM
edia
n)
3,9
42
19.7
92,9
03
19.7
6345
20.5
6527
13.3
7167
19.7
20
0.0
00
0.0
0
Mid
dle
(80-1
19%
of
Media
n)
5,0
33
25.2
73,9
59
26.9
5390
23.2
4505
10.0
3179
21.1
30
0.0
00
0.0
0
Upper
(>=
120%
of
Media
n)
7,4
15
37.2
35,8
59
39.8
9684
40.7
6535
7.2
2337
39.7
90
0.0
00
0.0
0
Inco
me
Not
Availa
ble
2,1
09
10.5
91,0
54
7.1
8142
8.4
6251
11.9
0106
12.5
1124
100.0
00
0.0
0
Tra
ct/
BN
AC
ha
racte
risti
cs
Subst
antially
Min
ority
3,4
55
17.3
52,6
08
17.7
5292
17.4
0364
10.5
4129
15.2
30
0.0
00
0.0
0
Not
Subst
antially M
inority
16,3
36
82.0
112,0
78
82.2
21,3
85
82.5
41,7
85
10.9
3718
84.7
70
0.0
00
0.0
0
Low
(0-4
9%
ofM
edia
n)
713
3.5
8525
3.5
766
3.9
384
11.7
829
3.4
20
0.0
00
0.0
0
Modera
te(5
0-7
9%
ofM
edia
n)
3,3
74
16.9
42,5
36
17.2
6284
16.9
2337
9.9
9133
15.7
00
0.0
00
0.0
0
Mid
dle
(80-1
19%
of
Media
n)
8,9
50
44.9
36,6
27
45.1
2741
44.1
6970
10.8
4415
49.0
00
0.0
00
0.0
0
Upper
(>=
120%
of
Media
n)
6,7
12
33.7
04,9
70
33.8
3584
34.8
0753
11.2
2265
31.2
90
0.0
00
0.0
0
NA
170
0.8
531
0.2
13
0.1
85
2.9
45
0.5
9124
100.0
00
0.0
0
Low
/Mod
and/o
rSub
Min
ority
5,0
50
25.3
53,7
78
25.7
2426
25.3
9534
10.5
7201
23.7
30
0.0
00
0.0
0
All
Oth
er
Censu
sTra
cts
14,8
69
74.6
510,9
11
74.2
81,2
52
74.6
11,6
15
10.8
6646
76.2
7124
100.0
00
0.0
0
Ap
pli
ca
nt
Se
x
Male
4,6
83
23.5
13,2
72
22.2
8403
24.0
2723
15.4
4248
29.2
837
29.8
40
0.0
0
Fem
ale
3,9
18
19.6
72,8
48
19.3
9325
19.3
7524
13.3
7186
21.9
635
28.2
30
0.0
0
Join
t9,3
41
46.8
97,4
50
50.7
2817
48.6
9725
7.7
6308
36.3
641
33.0
60
0.0
0
Not
Applic
able
1,9
77
9.9
31,1
19
7.6
2133
7.9
3177
8.9
5105
12.4
011
8.8
70
0.0
0
To
tal
19,9
19
100.0
014,6
89
100.0
01,6
78
100.0
02,1
49
10.7
9847
100.0
0124
100.0
00
0.0
0
(1)
Perc
ento
fT
otal
Num
ber
ofA
ppli
cati
ons
(2)
Perc
ento
fT
otal
Num
ber
ofO
rigi
nati
ons
(3)
Num
ber
ofD
enie
dA
ppli
cati
ons
asa
Perc
ento
fN
umbe
rof
App
licat
ions
for
Lin
eIt
em
Not
e:V
alid
ityE
rror
sar
ein
clud
ed©
PCiC
orpo
ratio
nC
RA
Wiz
Tel
:800
-261
-311
1D
ata
Sour
ce:2
000
US
Cen
sus
SF1/
SF3
Standard Summary Report
124

Data Integrity and Scoping
7. Items for Discussion - Standard Summary Report:
7.1 This report has all action types. All columns (except for the Denied column) use % Column to show percentages. In other words, the 79 Applications from American Indian applicants represented 0.40% of all applications. The 39 Originations from those 79 applications represented .27% of all Originations.
7.2 In comparison, the Denied column percentages are based on % Row. The 29 Denied applications from American Indian applicants represented 36.71% of the 79 applications received from American Indian applicants. In other words, the Denied column reflects a true denial rate.
7.3 Compare the % Originated for each group to the % Approved Not Accepted and % Withdraw/Incomplete to see if there are any obvious issues.
Activity 2
1. Click the Filter button.
2. To navigate to the Loan Type and Purpose in order to filter these reports to Con-ventional Home Purchase loans:
2.1 Open Loan Informa-tion
2.2 Product Information2.3 Loan Type2.4 Select Conventional2.5 Purpose2.6 Select Home Purchase2.7 Click Apply
125

Fair Lending Wiz Training Guide
3. Click the Generate button to finish the action.
Test Your Knowledge
1. On the revised Summary Report - Action Taken, are there:
1.1 Minority groups with less than 2.5% of the applications? _________________________________________________
1.2 Minority groups with less than 2.5% of the originations? _________________________________________________
1.3 Minority groups with a denial index greater than 200 (2 to 1)? _________________________________________________
2. On the Standard Summary Report, are there:
2.1 Obvious disparities in the percentages of Approved Not Accepted or Withdrawn for any minority group? _________________________________________________
3. Change the filter to Conventional Refinance applications, and run the reports again.
4. On the Summary Report - Action Taken, are there:
4.1 Minority groups with less than 2.5% of the applications? _________________________________________________
4.2 Minority groups with less than 2.5% of the originations? _________________________________________________
4.3 Minority groups with a denial index greater than 200 (2 to 1)? _________________________________________________
126

Data Integrity and Scoping
Exercise 2: Generating the Data Quality Reports
Introduction
The Data Quality report enables you to detect any possible data integ-rity issues in the variables you plan to use for your models. Given a list of variables, the report determines the count, maximum, and minimum val-ues for that variable as well as the standard deviation, the mode, the median, and the average. The report breaks down each variable by race, gender, tract minority level, age, ethnicity and applicant income.
Note:In order to keep the numbers as accurate as possible, you should set a fil-ter to use originated loans only. Accurate data is not always available for denied loans, but it should be correct for Originated loans.
You should then set a filter for Denied loans, and run the same reports to know how good the data is for denied loans. For decisioning models, you are dependent upon the data on both sides of the equation.
Scenario
You have been charged by management to perform an analysis of the pricing within your institution. Therefore, you are going to look at the APR and the Note Rate to see if there are any obvious differences for any protected-class group.
In speaking with your underwriters and reviewing your loan and pricing policies you have noted that the Credit Score, Back End Ratio, and LTV ratio are the key factors that the underwriters use for their decisions. The pricing desk also uses these three factors as a base for pricing.
Before using these factors for fair lending analysis you need to check the data for accuracy.
Note:PCi recommends using two tests to determine “significance”. First, for pricing, a difference of .25% above the control group should be reviewed. Second, a statistically significant difference should be reviewed, regardless of the amount (assuming it is higher than the con-trol group).
For decisioning variables, a difference of 2 to 1 or higher should be reviewed. Again, a statistically significant difference would be a concern, even if the difference is less than 2 to 1.
127

Fair Lending Wiz Training Guide
Activity 1
To generate the Data Quality report for the selected factors, follow these steps:
1. Close all open reports (the “x” at top right corner of the reports).
2. Click the Standard Reports button in the View bar to uncheck the selected reports.
3. Select the Data Quality Report from the list of reports.
4. Click the Filter button, and click the Clear button to clear any existing filters and start a new query.
5. In the tree view, double-click the following folders as shown:
5.1 Loan Information
5.2 Product Information
5.3 Action
5.4 Select Originated
5.5 Click Apply
128

Data Integrity and Scoping
6. Under the Field Selections side of the screen, click on the Ellipsis.
7. Select these fields by double-clicking on each one in order:
7.1 APR
7.2 BERatio (DTI)
7.3 Cust_credt (credit score)
7.4 LTV
7.5 Note Rate
8. Click OK.
9. In the Tool bar, click Generate.
129

Fair Lending Wiz Training Guide
10. To understand this report:
Count - number of originated loans for each category
Maximum - highest value in originated loans
Minimum - lowest value
Standard Deviation - measure of how close to the average the population is
Mode - the most frequently occurring value
Median - the middle number
Average - or mean, is the sum of all of the values divided by the number in the “sample”
11. To analyze this information
There were 14,689 originated loans in this file (or “sample”) that had an APR that was not “null”
The maximum value for an originated loan was 14.50%, which may or may not be a reasonable value. Was that loan a second lien? No documentation? Cash out? Condo? If all of the above, it might be real.
The minimum value for an originated loan was .25%, which does NOT appear reasonable. Do you really believe there was originated mortgage for .25%?
The standard deviation is 0.81. Going back to the statistics chapter, this means that approximately 68% of the population of originated loans would have an APR from 5.49% to 7.11% (plus or minus 1 standard deviation). Also, 95% of the population would have an APR from 4.68% to 7.92%. Any APR below 4.68%, or above 7.92%, would be considered an outlier.
The mode was 5.99. That might mean there were only two, and that no other APR was repeated, or it could mean there were hundreds at that APR.
The median was 6.10%. The median is not used in our analysis.
The average was 6.30%.
130

Data Integrity and Scoping
12. Move your cursor over the Select Analysis button, and select Note Rate. Click on the Go button.
13. Question: How do the Max-imum and Minimum values relate to the APR? Do they appear to be reasonable?.
14. Go to the report for BERatio. Be sure to click Go.
How does this data look?
Do you think that a maximum value for an ORIGINATED loan of 500,060 might interfere with a good fair lending review?
What Race, Ethnicity, and Sex was this person with a reportedly high debt ratio?
Can you spot the reason why the ratio might be so high?
If a debt ratio of 500,060 remained in the fair lending data analysis, do you think it might have an impact?
15. On the next page, and if time permits, analyze the Credit Score and LTV ratio.
131

Fair Lending Wiz Training Guide
Analyzing the Credit Score:
How many originated loans with “valid” credit scores were there? _______
The credit score ranged from ______ to ______?
The average credit score was _______?
The mode was _______?
Any values that appear to be “invalid”?
Analyzing the LTV Ratio:
How many originated loans with “valid” LTV ratios were there? _______
The LTV ranged from ______ to ______?
The average LTV was _______?
The mode was _______?
Any values that appear to be “invalid”?
Activity 2
You now know that this dataset has some values in the fair lending (cus-tomer qualification) fields that would interfere with a valid fair lending analysis. For example, there were values for both debt ratios and LTV ratios well in excess of 100%. The credit scores appeared to be valid. To find out how many applications we have with valid data, apply a filter and run two of these reports again.
1. Close the Reports Window. Click the Filter button.
132

Data Integrity and Scoping
1. In the Current Filters tree view, double-click the Cus-tom Loan Information folder, then Create New Expression.
2. You are now in the Expres-sion Builder. There are two main ways to build an expres-sion:
2.1 If you don’t know the field name(s) you need to use, then activate the Column Selection win-dow by clicking any-where, then open folders, type the first letter of the field, and double-click the field when found.
2.2 If you know the field names well enough, you can type in the Expression yourself.
2.3 You are going to use both methods to enter the following: BERATIO <=100 AND LTV <= 103
133

Fair Lending Wiz Training Guide
3. In the Column Selection window:
3.1 Double-click the User Defined Variables folder.
3.2 Type enough of the word BERatio for the program to find it for you.
3.3 Double-click on BERatio to copy it into the Expression Creating Window.
4. Click into the Expression Window (after BERatio) and finish typing the rest of the expression <=100 and ltv <= 103. Click Apply.
Note:Clicking on Validate will tell you whether you have spelled the field names correctly, included quote marks where necessary, etc. Clicking on the Apply button will cause an error message to appear ONLY IF the statement is not correct.
5. Uncheck the Originated checkbox, then click into the Filter Name text box. Enter VALID DATA as a saved filter name, then click the Save button (the diskette). Click OK to the filter saved message.
134

Data Integrity and Scoping
6. Place a checkmark on the line for Originated loans, then click Apply. The custom expression is still checked, so both parts of the filter will be applied.
7. Move the mouse to the right of the word filter in the gray bar, and you should see a text box appear with the entire filter displayed.
8. In the Field Selections win-dow, click the Ellipsis button.
8.1 Double-click APR (removing it).
8.2 Double-click Cust_Credt.
8.3 Double-click Note Rate.
8.4 Click OK.
135

Fair Lending Wiz Training Guide
9. In the Tool bar, click the Generate button again. Compare the filtered report to the non-filtered report for BERatio.
9.1 How many records are now excluded from analysis? __________
9.2 Do the averages look more reasonable? _________
10. Switch to the report for LTV.
10.1How many records were excluded from analysis? _______
10.2Do the averages look more reasonable? _________
136

Data Integrity and Scoping
Test Your Knowledge
Scenario
Now that you have reviewed the data for originated loans, you want to see if there is good data for the denied loans as well.
Clear all filters
Place a filter for Denied loans
Run the Data Quality Report on BERatio, Cust_Credt, and LTV
Analyzing Back-End Ratio
The BERatio for all loans varied from a maximum of ____% to a minumum of ____%.
The average BERatio was _______.
The standard deviation was _____
The mode for BERatio is _____.
Do you think a filter would be beneficial? _____
Analyzing Cust_Credt
The Credit Score for all loans varied from a maximum of ____% to a minumum of ____%.
The average Credit Score was _______.
The standard deviation was _____
The mode for Credit Score is _____.
Do you think a filter would be beneficial? _____
Analyzing LTV
The LTV for all loans varied from a maximum of ____% to a minumum of ____%.
The average LTV was _______.
The standard deviation was _____
The mode for LTV is _____.
Do you think a filter would be beneficial? _____
137

Fair Lending Wiz Training Guide
Exercise 3: Generating and Analyzing Difference of Means Reports
Introduction
The Difference of Means report is designed to allow a review of explanatory factors used in the underwriting and pricing processes.
For example, Fair Lending Wiz will take all of the male applicants in your portfolio and determine the average APR charged. The software will then do the same for all the females in the loan file. Once the two aver-ages are determined they are subtracted to come up with a difference between males and females. The averages are compared to determine statistical significance.
PCi uses two tests to determine significance for pricing. The first test is to determine whether a minority group was charged an average APR or Note Rate that was .25% (25 basis points) higher than their control group. The second test is one of statistical significance. A difference can be lower than 25 basis points but be statistically significant.
There is not an exact definition of what a “significant difference” is. One senior analyst with the Federal Reserve stated “... a 10 basis point UNEXPLAINED difference in a rate between a minority and a SIMILARLY-SITUATED non-minority MIGHT be a concern.”
Note:This report has its own method for separating Approvals from Denials, so no filter is necessary. However, you should filter out “bad” data (as determined in the section prior to this).
Scenario
You want to run the Difference of Means report to determine if there is a difference between any protected class applicants and non-protected class applicants. This will be your first time running the report and prior to doing any other types of analysis you want to determine what areas have the greatest risk.
138

Data Integrity and Scoping
Activity 1
To generate the Difference of Means report, follow these steps:
1. At the Standard Reports screen, click the Filter but-ton
2. To select and apply a saved filter:
2.1 Click on the Saved Fil-ters tab
2.2 Double-click the Saved Filters folder
2.3 Select the VALID DATA filter (saved ear-lier)
2.4 Click Apply
3. In the View bar, click the Risk Assessment button.
139

Fair Lending Wiz Training Guide
4. Select Difference of Means.
5. The Difference of Means report wizard will appear. In Step 1 select Custom Com-parison, then click the Next button.
Note:Standard Comparison will look at three variables from any standard HMDA file: Loan Amount, Applicant Income, and the resulting ratio, Loan-to-Income.
Custom Comparison will allow the choice of any numeric variable contained in the analysis file.
6. In Step 2 Create Approved & Denied Classes screen leave the default selections, then click the Next button.
Note:The first time through any analy-sis, include only Denied loans under Denied and Originated loans under the Approved category.
140

Data Integrity and Scoping
7. In Step 3 - Select the Fac-tors window, you will select the variable(s) that you want to include in the analysis.
7.1 Double-click on Mortgage
7.2 Double-click on Pricing7.3 Select APR7.4 Select Note Rate
8. Double-click the Financial Ratios folder:
8.1 Select Loan-to-Value8.2 Select Back-End Ratio
9. Scroll up and double-click on the Credit Score folder:
9.1 Select Custom Credit Score
9.2 Click the Next button
141

Fair Lending Wiz Training Guide
10. In the Step 4 - Select the Significance Level window accept the default of 95% by clicking the Next button.
Note:The higher the significance level, the less likely the results are due to chance. If you select a 95% sig-nificance level then there is only a 5% chance that the statistical results are due to chance. A 95% significance level is the level accepted in case law.
11. In the Step 5 - Review of Comparison Choices Before Processing window click the Save button.
11.1Enter the name Stan-dard Variables in the text area, then click Save.
12. Click the OK button in the confirmation dialog box, then click Finish.
142

Data Integrity and Scoping
Analyzing APR in the Difference of Means Report
The Statistical Comparison Results screen has three tabs: Overall (displays the results for both denials and approvals), Approvals (displays the results for just approvals), and Denials (displays the results for just denied loans).
The top right corner contains a drop-down list with the vari-able(s) that you selected. Keep in mind that these are the variables that the underwriters stated were important for the product that you are examining.
You will want to review each variable for each action set.
There are several columns displayed in the Difference of Means results. The definitions for these col-umns is listed below:
The first column displays the name of the variable that was selected, and lists the categories for comparison.
Count: this column displays the total number of applications for each protected and comparator class.
Average: this column displays the average value for the variable that you selected.
Median: this column displays the middle value in the range of values that exists.
Standard Deviation: this column displays the spread from the mean or average.
Raw Difference of Means: this column displays the difference between the average value of the protected class and the average value for the comparator.
Interpretation: this column displays the result of the analysis. There are five possible outcomes:No Difference, Significant Difference, NA, Not Enough Data (for a statistical test) and blank.
Note:The control group appears in bold text for each category with a blank interpretation.
143

Fair Lending Wiz Training Guide
1. Click the Approvals tab. Open the drop-down list, and select APR from the list.
2. You are looking for positive .25 or more in the Raw Difference of Means column for any pro-hibited-basis group. Alterna-tively, you are looking for a statistically significant higher dif-ference between groups.
As you examine the Approvals tab for the APR, take note of the following facts:
Race
For Native American borrowers, there was a ______% difference between their average APR and the APR for white applicants. Does this difference indicate a possible concern?
The average APR for Black applicants was ________ and the raw difference of means was _______. Was this difference ALSO statistically significant? ________
Ethnicity
The average APR for Hispanic applicants was ______ and the raw difference of means was ______?
144

Data Integrity and Scoping
Tract Characteristics
In tracts having from 50% to 79% minority populations, what was the difference in the Raw Difference of Means compared to tracts having less than 10% minorities? ___________
What was the difference in 80% to 100% minority tracts? ________
What was the difference for borrowers from low-income tracts compared to middle- and upper-income tracts? _______
Test Your Knowledge
Switch the View to Note Rate. How many concerns do you find in reviewing the results for Note Rate?
145

Fair Lending Wiz Training Guide
Activity 2
You now know that there are some apparent issues with pricing. Of course, these issues are being raised without regard to the credit criteria which these customers bring with them.
To see if the concerns start to diminish somewhat when credit criteria is introduced into the equation, you will now review the Difference of Means Report for the Credit Score.
1. Click on the drop-down list containing the list of vari-ables, and select Custom Credit Score.
Analyzing the Credit Score for Approved Borrowers
Is the 25 BP (basis point) difference in pricing to Native Americans partially explained by their credit scores? ________
Is the 45 BP difference in pricing to Blacks partially explained by their credit scores? ________
Is the 52 BP difference in pricing to Hispanics partially explained by their credit scores? ________
Is the 43 BP difference in pricing to borrowers from tracts with 50% to 79% minorities partially explained by their credit scores? ______
Is the 39 BP difference in pricing to borrowers from tracts with 80% to 100% minorities partially explained by their credit scores? ______
Is the 71 BP difference in pricing to borrowers from low-income tracts partially explained by their credit scores? ________
146

Data Integrity and Scoping
Test Your Knowledge
The other factor that generally affects price is the LTV. Switch to the LTV report for approved loans, and answer the same questions noted for Credit Score.
Native Americans? ______
Blacks? ______
Hispanics? ______
Borrowers from 50% to 79% tracts? ______
Borrowers from 80% to 100% tracts? ______
Borrowers from low-income tracts? _______
Activity 3
One other function of the Difference of Means reports is to review the qualifications for denied applicants. Did a prohibited basis group appear to be better qualified than their control group, yet were still denied?
One caveat - these questions are being answered using averages for hun-dreds, if not thousands, of borrowers. This does not take the place of comparative file review, where individuals are compared directly against one another.
1. Click on the Denied tab, then click on the drop-down list and select Custom Credit Score.
147

Fair Lending Wiz Training Guide
Do any of the prohibited-basis groups appear to be better qualified than their control group?
Native Americans? __________
Asians? ________
Blacks? ________
Native Hawaiians? ________
Female applicants? _______
Applicants from 50% to 79% minority tracts? _______
Applicants from 80% to 100% minority tracts? _______
Applicants from low-income applicants? _______
Applicants from moderate-income applicants? _______
148

Data Integrity and Scoping
Exercise 4: Generating Risk Factor Analysis Reports
Introduction
The Risk Factor Analysis reports in Fair Lending Wiz have been designed to go through as many of the discrimination risk factors con-tained in the FFIEC Fair Lending Examination Procedures as can be analyzed using data. These factors are labeled as:
Overt Indicators (O1 - O5)
Underwriting Indicators (U1 - U9)
Pricing Indicators (P1 - P5)
Steering Indicators (S1 - S8)
Redlining Indicators (R1 - R8)
Marketing Indicators (M1 - M7)
There are some indicators that are impossible to quantify with data. Indicators such as overt and market-ing will not be evident from a review of financial ratios, credit scores or other fair lending data that you may have in your file. Therefore, those risk factors have to be analyzed in a different manner.
To help identify Overt indicators, it is recommended that you review any electronic or hand written comments made by the underwriters or loan officers that exist on an individual’s application. Overt indi-cator (O4) states, “Statements made by the institution’s officers, employees or agents which constitute an express or implicit indication that one or more such persons have engaged or do engage in discrimination on a prohibited basis in any aspect of a credit transaction.”
Example:
One institution was reviewing information for denied hispanic applicants and found a sticky note on the application that read, “No way Jose!”
To help identify Marketing indicators, it is recommended that you review any advertisements in the local media especially in heavily concentrated minority areas that you are serving. This will help you gauge just one aspect of meeting the needs of the community that you serve.
After researching for overt and marketing indicators, you may find a problem that needs to be addressed. Some of these issues can be handled with additional training, for loan officers or underwriters, regarding the types of discrimination that exist and how to avoid these. Mystery shopping is also another avenue that can be explored. Also, Second Review procedures can be used to review the denial decisions that were made or are being contemplated and compare them to historical decisions made by your institution.
149

Fair Lending Wiz Training Guide
Scenario
You want to run the Risk Factor Analysis reports and look at one area of concern. You want to see the underwriting related denial rates by Race. You will run the U1 Risk Factor report.
Activity 1
Note:Generally speaking, you do not want to have filters on while running the Risk Factor Analysis Reports.
Exception 1: You have a file containing Home Purchase, Home Improvement, and Refinance loans and you want these reports to be on a specific Loan Type and Purpose
Exception 2: You are going to run the Credit Score Override reports, and “bad” data (especially bad credit scores) would alter those results significantly
To generate the Risk Factor Analysis report, follow these steps:
1. Click on the Filter button, then click Clear, then Apply.
2. In the Risk Assessment main screen, select the Risk Factor Analysis Reports link.
150

Data Integrity and Scoping
3. In the Step 1 - Select Report Types screen, double-click the Disparities in Denial Rates: Underwriting (U1) folder.
4. Select Applicant Race vs. Action Taken, and Applicant Ethnicity vs. Action Taken.
5. Click the Next button.
6. In the Step 2 - Group by MSA screen, leave the default value, and click the Next button.
Note:The Group by MSA option allows you to either run the risk factor reports against all MSAs in the LAR or to aggregate the per-formance of several MSAs together.
Note:When you choose multiple MSAs the data will be aggregated. You will not get separate reports for each MSA. If you want to review the performance of a specific MSA then you must choose only that MSA.
151

Fair Lending Wiz Training Guide
7. In the Step 3- Review Risk Analysis Specifications screen, click Finish to run the analysis.
In the Specifications window you will see the report parameters that you selected as well as the MSAs selected.
8. The Risk Analysis Summary Results screen will now appear with the report(s) that you have selected to run. Click on the check boxes for the reports and deselect the Prompt Between Print Jobs box.
Note:The option located at the bottom right hand corner of the screen “Prompt Between Print Jobs” is selected by default. If it remains selected the program will stop after printing / or previewing the first report and ask if you would like to view or print the next report.
9. Both reports should be selected by default. Click the Print button, then OK to view the reports on screen.
152

Data Integrity and Scoping
Analyzing Risk Factor Reports
The Disparities in Denial Rates: Underwriting (U1) Applicant Race vs. Action Taken report is now displayed. The report displays and highlights disparities in the actions taken on minority appli-cants vs. applications for the con-trol group (white applicants). The report will also display the per-centages for each action taken by race.
By default the first page of the report displays All Income Classes together and then each subsequent page will display Low- and Moderate-Income, Middle Income, and Upper Income classes.
The report only includes records that have the following characteristics:
Valid race code (1-6)
Valid Ethnicity Code (1 or 2)
Valid gender code (1 or 2)
Income greater than (>) zero (0).
There are two tests to look for:
Any minority group denied at a ratio of 2 to 1 or higher. To perform this test, look at the white denial rate, and double it. Any minority group higher than that number is a risk factor.
A statistically significant difference between the denial rate for whites and the denial rate for a minority group. The software does this for you by making these BOLD.
Note:When performing this analysis, look for very small populations that can make a ratio look very bad, but represents a small risk due to the small number of people involved.
153

Fair Lending Wiz Training Guide
Take note of the following facts:
Looking at All Income Classes together there were _______ denied Black applicants and ______ denied White applicants.
The denial ratio for black applicants was _____ and the denial ratio for white applicants was _____.
The denial ratio for white applicants was 9.56%, so doubling that ratio would be 19.12%. Are there any minorities with denial ratios greater than 19.12%? ____________________________________________________
In this case, all of the ratios that are greater than 2 to 1 are ALSO statistically significant. That is not always the case!
There are _____ total black applicants included in this report.
There are _____ total white applicants in this report.
The smallest group of applicants was 10, for 2+ Minority (the applicant, for example, filled in code 1 (American Indian) AND code 3 (Black). With 4 denied, the ratio is 40%. This is a borderline.
154

Data Integrity and Scoping
Print Preview Navigator Ele-ments (from left to right):
Go to the first page of the report.Go back one pageGo to page...Go forward one pageGo to last pageZoom percentageClose Preview for this ReportGo to Print Dialog
SHORTCUT: When moving to the next report, double-click any-where on the blue bar to maxi-mize the report.
Warning:Do NOT close this print dialog box. If you do, you will not be able to move between pages, or print the report.
10. Navigate through the remaining pages of the report (LMI applicants, middle-income, upper-income). Does it appear that the apparent problem is due to low-income individuals being denied?
Activity 2
When you are done with the Race report, click the Close Preview button, and continue on to the Ethnicity report. Write down your results below:
What was the non-Hispanic denial rate? ______
What would that be when doubled? ______
Was the Hispanic denial rate over this amount? ______
Was the difference between the two group statistically significant? ______
Does the risk factor exist in all income levels, or is it just a particular one? ________________________________________________
155

Fair Lending Wiz Training Guide
Activity 3
You want to see the disparities in application Processing Times for Orig-inated Applications. You will run a U2 Risk Factor report.
To generate this Risk Factor Analysis report, follow these steps:
1. Click Cancel, Yes, then First to navigate to the Step 1 - Select Report Types screen.
1.1 Be sure to uncheck the previously selected reports.
1.2 Double-click the Dispari-ties in Processing Times: Underwriting (U2) folder.
2. Select the following:
2.1 Originated Applica-tions
2.2 Closed for Incomplete-ness Applications
2.3 Open the Denied Applications folder
2.4 Denials for Other2.5 Click Next
156

Data Integrity and Scoping
3. In the Step 2 - Group by MSA screen, leave the default. Click Next
4. In the Step 3- Review Risk Analysis Specifications screen, click Finish to run the analysis.
5. Deselect the Prompt Between Print Jobs, and click the Print button.
For these reports, you are looking ONLY for statistically significant differences between the groups, both positive (more time, which is in BOLD), or negative (less time, which is in italics).
157

Fair Lending Wiz Training Guide
Selected MSA(s): All
Disparities in Processing Times: Underwriting (U2)
Source:FLWiz Training File 2007 for Analysis Purposes2.2
Originated Applications
AverageMedianModeSt. Dev.MinimumMaximum
Total Action Time
Description Count
Total 12063 180.00 0.00 22.45 14.00 24.00 30.37
= significantly not = WhiteItalic= significantly = WhiteBold
AverageMedianModeSt. Dev.MinimumMaximum
Race Action Time
Description Count
Native American 35 116.00 2.00 28.63 14.00 22.50 31.03Asian 208 157.00 2.00 21.23 21.00 21.00 28.39Black 500 174.00 2.00 25.80 21.00 25.00 32.15Hawaiian/Pacific 47 66.00 2.00 15.78 15.00 15.00 20.09
White 11097 180.00 0.00 22.32 14.00 24.00 30.362+ Minority 3 28.00 11.00 7.13 28.00 25.50 20.67
Joint(Wht/Min) 173 126.00 2.00 20.69 28.00 26.00 30.94
= significantly not = Non HispanicItalic= significantly = Non HispanicBold
AverageMedianModeSt. Dev.MinimumMaximum
Ethnicity Action Time
Description Count
Hispanic/Latino 538 169.00 1.00 22.80 14.00 22.00 29.25Non Hispanic 11363 180.00 0.00 22.47 14.00 24.00 30.46Joint(Non Hisp/Hisp) 162 95.00 3.00 19.09 15.00 22.00 27.76
= significantly not = MaleItalic= significantly = MaleBold
AverageMedianModeSt. Dev.MinimumMaximum
Sex Action Time
Description Count
Male 8801 180.00 0.00 22.69 14.00 24.00 30.78Female 3262 178.00 0.00 21.75 20.00 22.00 29.27
Info NA 0 0.00 0.00 0.00 0.00 0.00 0.00Not Applicable 0 0.00 0.00 0.00 0.00 0.00 0.00
= significantly not < 62Italic= significantly < 62Bold
AverageMedianModeSt. Dev.MinimumMaximum
Age Action Time
Description Count
<18 years 0 0.00 0.00 0.00 0.00 0.00 0.0018-24 years 308 119.00 3.00 19.72 14.00 24.00 28.33
25-44 years 6317 179.00 0.00 22.20 14.00 24.00 30.5445-61 years 4420 180.00 0.00 22.88 14.00 24.00 30.87<62 11045 180.00 0.00 22.41 14.00 24.00 30.6162+ years 1018 180.00 0.00 22.65 21.00 21.00 27.77
= significantly not = Middle and UpperItalic= significantly = Middle and UpperBold
AverageMedianModeSt. Dev.MinimumMaximum
Income Action Time
Description Count
<50% 847 174.00 0.00 19.95 14.00 21.00 26.6550%-79% 2627 180.00 1.00 21.25 14.00 22.00 28.68Low and Mod 3474 180.00 0.00 20.96 14.00 22.00 28.1880%-119% 3539 180.00 1.00 22.26 14.00 23.00 29.69
© Wolters Kluwer Financial Services Wiz is registered in the U.S. Patent and Trademark Office. Tel: 800-261-3111 Page 1
Note: Includes all loan applications where the following conditions are true: (Race is American Indian/Native Alaskan or Asian orBlack or Hawaiian/Pacific Islander or White or Joint(White/Minority) or 2+ Minorities) and (Ethnicity is Hispanic/Latino or NonHispanic or Joint(Hispanic/Non Hispanic)) and (Sex is Male or Female) and (Income is greater than 0 and does not equal 'NA').
158

Data Integrity and Scoping
Questions:
Anything interesting in the first report (Originations)? ________________________________________________________________________________________________________________
Anything interesting in the second report (Closed for Reason “Other”)? ________________________________________________________________________________________________________________
In the third report (Closed for Incompleteness Applications), why does it take less time or more time to mark an application closed for being Incomplete?
What is policy that dictates the process?
Activity 4
The next reports are called the “Percentage of Credit Score Overrides: Underwriting (U7)”. These reports have nothing to do with the official override policy of the institution.
High Side Overrides - put in a score above which most people should be approved. Look at the percentages of denials by group. Once again, two tests are used. The first is the 2 to 1 ratio discussed before. The second is whether the difference is statistically significant.
Low Side Overrides - put in a score below which most people shold be denied. Look at the percentages of approvals by group. Two tests apply here as well, but the first one is different. You are no longer looking at 2 to 1. Instead, the ratio is .5 to 1 or less. Example: if whites with credit scores of 620 or lower get approved 20% of the time, then a black approval ratio of 10% or less would be a concern.
Note:Before running the Credit Score Override reports, you should filter out those records where the credit score was obviously bad, such as credit scores of 999, credit scores of 0, etc. In this case, there were no prob-lems with the credit score, so no filter will be applied.
Note:There is an alternative that should be considered. By filtering out “bad” credit scores, you are removing the record from any kind of analysis. Instead, you could make the “bad” values into “null” values by using the null replacement technique outlined in Chapter 2 (replacing zeroes with null values). In that manner, the record would still be considered in some tests, but removed from others.
159

Fair Lending Wiz Training Guide
To generate this Risk Factor Analysis report, follow these steps:
1. Navigate to Step 1 - Select Report Types screen
1.1 Double-click the Per-centage of Credit Scor-ing Overrides: Underwriting (U7) folder.
1.2 Select High Side Overrides
1.3 Select Low Side Overrides
1.4 Click Next
2. In the Step 2 - Set Report Parameters screen.
2.1 Change the high side credit score to 720
2.2 Change the low side credit score to 620
2.3 Click the Finish button2.4 Click the Finish button
again.
3. Select the reports, deselect Prompt Between Print Jobs, click the Print button, then OK to preview the reports.
160

Data Integrity and Scoping
Take note of the following facts:
How many Native Americans with credit scores over 720 were there? ______
How many of those individuals were denied? ______
Was the denial ratio equivalent to the denial rate for white applicants? _______
What was the white denial ratio? _______
Were there denial rates for minorities that were more than twice that of whites? ______
For the 2+ Minority group, how many applicants were there? _______
How many of those individuals were denied? ______
The percentage for the 2+ Minority group is much higher than the percentage for Blacks. Does this indicate a bigger concern? _______
161

Fair Lending Wiz Training Guide
Activity 5
Review the rest of the income classes for Race. Note risk factors below:
________________________________________________________________________________________________________________________________________________________________________________________________________________________________________________________________________________________
Review the reports for Ethnicity, Sex, and Age. Note risk factors below:
________________________________________________________________________________________________________________________________________________________________________________________________________________________________________________________________________________________________________________________________________________________________________________________________________
Activity 6
Go to first page of the Low Side Override report for Race, shown on the next page. Remember, you are now looking at the ORIGINATION rate. Anything in italics means that it is statistically lower than the origination rate for the control group.
162

Data Integrity and Scoping
Note the following facts for this page:
For white applicants with credit scores of 620 or lower, ______% were approved. Cut that in half, and you would have (approximate) _______%.
Are there origination rates lower than the number you just calculated? ______
If 55.90% of white applicants with low credit scores were approved, how many approvals would there have been for 16 Native American’s if the same percentage were applied? ________
How many Native American approvals were there? _______
Are there origination rates that aren’t .5 to 1 or lower that were statistically significant? _______
Review all of the low-side override reports. Make note of your findings:
________________________________________________________________________________________________________________________________________________________________________________________________________________________________
163

Fair Lending Wiz Training Guide
Activity 7
The next Risk Factor report is the Proportion of Conventional vs. FHA Mortgages. When this risk factor was articulated in the examination pro-cedures, FHA loans were more costly.
If this report indicates a potential risk factor, you might consider design-ing a custom table to show average rates by loan type and purpose. In that way, you could possibly counter this risk factor by showing that FHA loans are less costly in your product lineup.
To generate this Risk Factor Analysis report, follow these steps:
1. Navigate back to Step 1 - Select Report Types screen.
1.1 Double click the Pro-portion of Conven-tional vs. FHA Mortgages: Steering (S3) folder
1.2 Select Loan Amounts of $100,000 or More
1.3 Click Finish1.4 Click Finish again to run
the report.
2. As always, uncheck the Prompt Between Print Jobs checkbox. Click Print to preview the report.
164

Data Integrity and Scoping
Make a note of the following facts for this page:
How many black applicants were there for loans of $100,000 or higher? ____________
What percentage of these applicants were “steered” towards FHA loans? __________
Compare that percentage to white applicants. Was the difference statistically significant? __________
Were there any other minority groups above the 2 to 1 ratio? ________________________________________________________________________________________________________
165
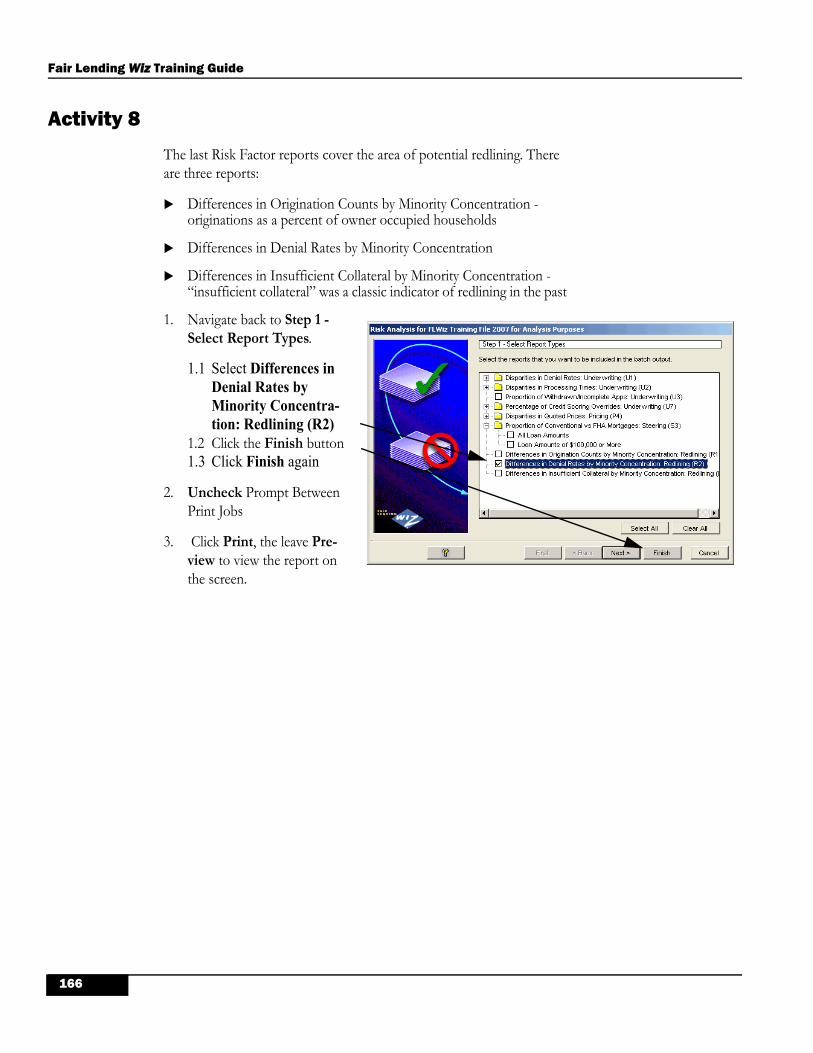
Fair Lending Wiz Training Guide
Activity 8
The last Risk Factor reports cover the area of potential redlining. There are three reports:
Differences in Origination Counts by Minority Concentration - originations as a percent of owner occupied households
Differences in Denial Rates by Minority Concentration
Differences in Insufficient Collateral by Minority Concentration - “insufficient collateral” was a classic indicator of redlining in the past
1. Navigate back to Step 1 - Select Report Types.
1.1 Select Differences in Denial Rates by Minority Concentra-tion: Redlining (R2)
1.2 Click the Finish button1.3 Click Finish again
2. Uncheck Prompt Between Print Jobs
3. Click Print, the leave Pre-view to view the report on the screen.
166

Data Integrity and Scoping
Any risk factors noted on this report? ________________________________________________________________________________________________________________________________________________________________________________________________________________________________________________________________________________________
167

Fair Lending Wiz Training Guide
Exercise 5: Generating HMDA Scoping Reports
Introduction
The HMDA Scoping reports in Fair Lending Wiz have been designed to give users a bird’s eye view of the rate spread risks that exist within the loan file. These reports were created by the Fed, but have been modified specifically for Fair Lending Wiz by expanding the information available for non-reportable rate spreads. This enables you to see the complete picture.
Note:HMDA Scoping Reports are dependent upon having a field called Raw_Rate_Spread in the file. The raw rate spread is calculated from the following fields that also must be contained within your LAR: APR, LienStatus, Rate_Lock_Date and Loan_Term.
To generate the HMDA Scoping Reports, follow these steps:
1. In the Risk Assessment main screen, select the HMDA Scoping Reports link.
168

Data Integrity and Scoping
1. From the menu, select the following:
1.1 Differences in Average Rate Spread
1.2 Pricing Disparity Summary
1.3 Risk Score by Geography
2. Click the OK button.
169

Fair Lending Wiz Training Guide
Ra
teS
pre
ad
Count
Maxi
mum
Min
imum
Sta
ndard
Devi
ation
Media
nValu
eM
ean
Valu
e
(Ave
rage)
Raw
Diffe
rence
of
Means
Inte
rpre
tation
FLW
izT
rain
ing
Fil
e2
00
7 f
or
An
aly
sis
Pu
rpo
se
s
Fil
ter:
No
ne
Pri
cin
gS
um
ma
ry:
Dif
fere
nce
sin
Ave
rag
eR
ate
Sp
rea
dfo
rA
llB
orr
ow
ers
Bo
rro
we
rC
ha
racte
risti
cs
Ra
ce
43
5.7
40.0
91.1
41.7
31.9
9Am
erica
nIn
dia
n/
Ala
ska
Native
0.5
4Sig
nific
ant
Diffe
rence
261
9.8
00.0
11.1
01.3
41.6
3Asi
an
0.1
8Sig
nific
ant
Diffe
rence
546
6.7
30.1
50.9
61.5
21.6
9Bla
ckor
Afr
ican
Am
erica
n0.2
4Sig
nific
ant
Diffe
rence
54
5.3
10.0
21.1
51.5
91.8
6N
ative
Haw
aiia
n/
Oth
er
Paci
fic
Isla
nder
0.4
1Sig
nific
ant
Diffe
rence
12,4
12
9.1
4-4
.75
0.8
81.2
61.4
5W
hite
0.0
0
53.3
51.0
51.1
12.7
92.2
52
or
More
Min
ority
Race
s0.8
0N
/A
185
6.1
8-0
.14
0.9
71.3
01.5
3Jo
int
(White/M
inority
Race
)0.0
8N
oD
iffe
rence
Eth
nic
ity
620
9.8
0-0
.30
1.0
11.5
61.7
2H
ispanic
or
Latino
0.2
7Sig
nific
ant
Diffe
rence
12,6
20
9.1
4-3
.92
0.8
81.2
61.4
5N
ot
His
panic
or
Latino
0.0
0
176
6.1
80.0
11.0
31.5
51.7
5Jo
int
(His
por
Lat/
Not
His
por
Lat)
0.3
0Sig
nific
ant
Diffe
rence
Min
ori
tyS
tatu
s
11,5
86
9.1
4-3
.92
0.8
81.2
51.4
4W
hite
Non-H
ispanic
0.0
0
1,8
19
9.8
0-0
.30
0.9
81.4
81.6
7M
inority
0.2
3Sig
nific
ant
Diffe
rence
In
co
me
957
9.8
0-0
.32
0.9
31.4
01.5
8Lo
w-
<50%
MSA/M
DM
edia
n0.1
4Sig
nific
ant
Diffe
rence
2,9
69
7.6
1-0
.50
0.9
01.3
01.4
9M
odera
te-
50-7
9.9
9%
MSA/M
DM
edia
n0.0
5Sig
nific
ant
Diffe
rence
3,9
26
9.8
0-0
.50
0.9
11.3
21.5
1Lo
wand
Modera
teIn
com
e0.0
7Sig
nific
ant
Diffe
rence
4,0
63
7.4
2-0
.36
0.9
01.2
21.4
5M
iddle
-80-1
19.9
9%
MSA/M
DM
edia
n0.0
1N
oD
iffe
rence
6,0
41
7.9
2-4
.75
0.9
01.2
11.4
3U
pper
-120%
or
More
MSA/M
DM
edia
n-0
.01
No
Diffe
rence
10,1
04
7.9
2-4
.75
0.9
01.2
21.4
4M
iddle
and
Upper
Inco
me
0.0
0
Ge
nd
er
3,3
62
9.8
0-3
.00
0.9
71.4
01.6
0M
ale
0.0
0
2,9
28
7.4
2-0
.50
0.9
21.3
61.5
5Fem
ale
-0.0
5Sig
nific
ant
Diffe
rence
7,6
31
7.6
1-4
.75
0.8
31.2
01.3
8Jo
int
(Male
/Fem
ale
)-0
.22
Sig
nific
ant
Diffe
rence
Ag
e
347
9.8
00.0
71.0
21.6
11.7
518-
24
0.3
0Sig
nific
ant
Diffe
rence
7,6
45
7.3
9-4
.75
0.9
01.2
71.4
925
-44
0.0
4Sig
nific
ant
Diffe
rence
5,5
73
9.1
4-3
.00
0.8
71.2
01.3
945
-61
-0.0
6Sig
nific
ant
Diffe
rence
13,5
65
9.8
0-4
.75
0.8
91.2
51.4
5<
62
0.0
0
1,5
37
7.6
1-3
.92
0.8
41.4
11.5
462 +
0.0
9Sig
nific
ant
Diffe
rence
Ce
nsu
s T
ract
Ch
ara
cte
risti
cs
Ra
cia
l/ E
thn
icC
om
po
sit
ion
4,6
76
9.1
4-4
.75
0.9
31.2
81.4
9<
10%
Min
ority
0.0
0
3,3
71
7.9
2-0
.32
0.8
91.2
71.4
610-1
9%
Min
ority
-0.0
3N
oD
iffe
rence
4,3
74
7.4
2-3
.92
0.8
51.2
51.4
420-4
9%
Min
ority
-0.0
5Sig
nific
ant
Diffe
rence
1,5
20
9.8
0-0
.26
0.8
81.2
71.4
450-7
9%
Min
ority
-0.0
5N
oD
iffe
rence
1,1
58
5.9
2-0
.30
0.8
81.3
11.4
880-1
00%
Min
ority
-0.0
1N
oD
iffe
rence
In
co
me
Ch
ara
cte
risti
cs
542
5.2
0-0
.30
0.8
41.2
91.4
5Lo
w-
<50%
MSA/M
DM
edia
n-0
.02
No
Diffe
rence
2,5
92
7.9
2-0
.30
0.8
71.2
51.4
3M
odera
te-
50-7
9.9
9%
MSA/M
DM
edia
n-0
.04
Sig
nific
ant
Diffe
rence
3,1
34
7.9
2-0
.30
0.8
61.2
61.4
3Lo
wand
Modera
teIn
com
e-0
.04
Sig
nific
ant
Diffe
rence
6,8
22
9.8
0-4
.75
0.8
91.2
71.4
7M
iddle
-80-1
19.9
9%
MSA/M
DM
edia
n0.0
0N
oD
iffe
rence
5,1
15
9.1
4-3
.92
0.9
01.2
81.4
7U
pper
-120%
or
More
MSA/M
DM
edia
n0.0
0N
oD
iffe
rence
11,9
37
9.8
0-4
.75
0.9
01.2
71.4
7M
iddle
and
Upper
Inco
me
0.0
0
170

Data Integrity and Scoping
Analyzing the HMDA Scoping Reports
Differences in Average Rate SpreadThe left column of the report details rows that Fair Lending Wiz uses to segregate data:
Race
Ethnicity
Minority Status (minority and Hispanic)
Income
Gender
Age
Census Tract Characteristics
Each of the major categories is broken into several classifications.
This report uses the field called Raw_Rate_Spread for the calculations. The raw rate spread is calculated by CRA/FL Wiz for each loan, regard-less of whether it was reportable (above the threshold).
There are two columns for you to review on this report:
Raw Difference of Means - scan this column for any difference for a minority of 25 basis points or more for a protected-class group.
Interpretation - this contains the results of the statistical calculation. If it says “Significant Difference”, then the difference was more than 2 standard deviations from the average.
Take note of the following results for this report:
For 43 American Indian applicants the rate spread was 54 BP over the average for white applicants. Was this difference also statistically significant? _______
Low- and moderate-income applicants had stastically significant differences in their rate spread over the rate spread for middle- and upper-income applicants. Were these differences over the 25 basis point threshold as well? ________
Female applicants had a statistically significant difference in their rate spread compared to male applicants. Is this difference worth looking into? _______
171

Fair Lending Wiz Training Guide
Ra
teS
pre
ad
sC
ha
rge
d
Count
%R
ow
Ratio
to C
ontr
ol
Gro
up
FL
Wiz
Tra
inin
g F
ile20
07fo
rA
nal
ysis
Pu
rpo
ses
Filt
er:
No
ne
Pri
cin
gD
isp
arit
yS
um
mar
y
Be
low
Th
resh
old
Ab
ove
Th
resh
old
Ove
rall
Count
%R
ow
Ratio
to C
ontr
ol
Gro
up
Count
% C
olu
mn
Bo
rro
we
rC
ha
racte
risti
cs
Ra
ce
43
100.0
0%
1.0
10
0.0
0%
0.0
0Am
erica
nIn
dia
n/
Ala
ska
Native
43
0.2
8%
257
98.4
7%
1.0
04
1.5
3%
1.2
4Asi
an
261
1.7
3%
530
97.0
7%
0.9
816
2.9
3%
2.3
8Bla
ckor
Afr
ican
Am
erica
n546
3.6
2%
52
96.3
0%
0.9
72
3.7
0%
3.0
1N
ative
Haw
aiia
n/
Oth
er
Paci
fic
Isla
nder
54
0.3
6%
12,2
59
98.7
7%
1.0
0153
1.2
3%
1.0
0W
hite
12,4
12
82.1
9%
5100.0
0%
1.0
10
0.0
0%
0.0
02
or
More
Min
ority
Race
s5
0.0
3%
183
98.9
2%
1.0
02
1.0
8%
0.8
8Jo
int
(White/M
inority
Race
)185
1.2
3%
Eth
nic
ity
605
97.5
8%
0.9
915
2.4
2%
1.9
4H
ispanic
or
Latino
620
4.1
1%
12,4
62
98.7
5%
1.0
0158
1.2
5%
1.0
0N
ot
His
panic
or
Latino
12,6
20
83.5
7%
174
98.8
6%
1.0
02
1.1
4%
0.9
1Jo
int
(His
por
Lat/
Not
His
por
Lat)
176
1.1
7%
Min
ori
tyS
tatu
s
11,4
53
98.8
5%
1.0
0133
1.1
5%
1.0
0W
hite
Non-H
ispanic
11,5
86
76.7
2%
1,7
78
97.7
5%
0.9
91.9
6M
inority
1,8
19
12.0
4%
41
2.2
5%
Inco
me
938
98.0
1%
0.9
919
1.9
9%
1.7
8Low
-<
50%
MSA/M
DM
edia
n957
6.3
4%
2,9
32
98.7
5%
1.0
037
1.2
5%
1.1
2M
odera
te-
50-7
9.9
9%
MSA/M
DM
edia
n2,9
69
19.6
6%
3,8
70
98.5
7%
1.0
056
1.4
3%
1.2
8Low
and
Modera
teIn
com
e3,9
26
26.0
0%
4,0
28
99.1
4%
1.0
035
0.8
6%
0.7
7M
iddle
-80-1
19.9
9%
MSA/M
DM
edia
n4,0
63
26.9
0%
5,9
63
98.7
1%
1.0
078
1.2
9%
1.1
5U
pper
-120%
or
More
MSA/M
DM
edia
n6,0
41
40.0
0%
9,9
91
98.8
8%
1.0
0113
1.1
2%
1.0
0M
iddle
and
Upper
Inco
me
10,1
04
66.9
1%
Ge
nd
er
3,2
86
97.7
4%
1.0
076
2.2
6%
1.0
0M
ale
3,3
62
22.2
6%
2,8
73
98.1
2%
1.0
055
1.8
8%
0.8
3Fem
ale
2,9
28
19.3
9%
172

Data Integrity and Scoping
Pricing Disparity SummaryWith this report, there are again two primary columns to review:
Above Threshold - % Row (this column will be BOLD if statistically significant)
Above Threshold - Ratio to Control Group (look for differences of 2.00 or higher
Note the following for this report:
Black or African American ratio to control group 2.38 to 1 (whites above the threshold 1.23% of the time, compared to 2.93% of the time for blacks). It isn’t statistically significant, so is it really a concern? ______
Native Hawaiians were above the threshold 3.01 times as often as whites! How many native Hawaiians were effected by this? ______
173

Fair Lending Wiz Training Guide
Rat
eS
pre
ad
Sta
teM
SA
Count
%R
ow
Count
%R
ow
Count
FLW
izT
rain
ing
Fil
e2
00
7 f
or
An
aly
sis
Pu
rpo
se
s
Fil
ter:
No
ne
Ris
kS
co
reb
y G
eo
gra
ph
y
Be
low
Th
resh
old
Ab
ov
eT
hre
sh
old
To
tals
Ris
kL
ev
el
Ris
kS
co
reA
ve
rag
eR
ate
Sp
rea
d
121
97.5
8%
3
IL(1
7)
2.4
2%
124
14060
Blo
om
ingto
n-N
orm
al,
ILM
SA
1.4
8 0
Low
185
98.9
3%
2
IL(1
7)
1.0
7%
187
16580
Cham
paig
n-U
rbana,IL
MSA
1.5
4 0
Low
9755
98.7
8%
120
IL(1
7)
1.2
2%
9875
16974
Chic
ago-N
aperv
ille-J
olie
t,IL
MD
1.4
4 6
Ele
vate
d
68
98.5
5%
1
IL(1
7)
1.4
5%
69
19180
Danvi
lle,IL
MSA
1.4
4 0
Low
222
99.1
1%
2
IL(1
7)
0.8
9%
224
19340
Dave
nport
-Molin
e-R
ock
Isla
nd,IA
-IL
MSA
1.2
5 0
Low
87
98.8
6%
1
IL(1
7)
1.1
4%
88
19500
Deca
tur,
ILM
SA
1.2
9 0
Low
101
98.0
6%
2
IL(1
7)
1.9
4%
103
28100
Kanka
kee-B
radle
y,IL
MSA
1.4
8 0
Low
916
98.4
9%
14
IL(1
7)
1.5
1%
930
29404
Lake
County
-Kenosh
aCounty
,IL
-WI
MD
1.4
2 4
Ele
vate
d
338
99.1
2%
3
IL(1
7)
0.8
8%
341
37900
Peoria,IL
MSA
1.4
8 0
Low
379
99.2
1%
3
IL(1
7)
0.7
9%
382
40420
Rock
ford
,IL
MSA
1.3
8 1
Modera
te
780
98.3
6%
13
IL(1
7)
1.6
4%
793
41180
St.
Louis
,M
O-I
LM
SA
1.4
2 0
Low
205
99.0
3%
2
IL(1
7)
0.9
7%
207
44100
Springfield
,IL
MSA
1.4
9 0
Low
1667
98.6
4%
23
IL(1
7)
1.3
6%
1690
99999
NA
1.4
9 2
Modera
te
1. T
he
follo
win
gfilters
are
auto
matica
lly a
pplie
dto
this
report
:Act
ion
must
be A
ppro
ved
or
Appro
ved
Not
Acc
epte
d,Li
en S
tatu
sm
ust
be F
irst
Lien
or
Seco
nd
lien.
2.
Applic
ation
counts
exc
lude
Purc
hase
dLo
ans;
Pre
Appro
vals
Denie
d a
nd P
reAppro
vals
Appro
ved b
ut
Not
Acc
epte
d.
To
tal
Ap
pli
ca
tio
ns
14824
98.7
4%
189
1.2
6%
15013
1.4
4 6
Ele
vate
d
3.
Ris
k Sco
rere
pre
sents
a c
om
posi
teof
8te
sts
calc
ula
ted
for
each
MSA. T
hese
test
sco
mpare
the d
iffe
rence
sin
the a
vera
ge
rate
spre
ad c
harg
ed
to a
min
ority
gro
up a
nd
the
contr
ol gro
up
for
each
of
the
follo
win
g P
rote
cted
Cla
ssca
tegories:
Race
,Eth
nic
ity,
Min
ority
Sta
tus,
Gender,
Age,Applic
ant
Inco
me L
eve
l, T
ract
Inco
me L
eve
l and T
ract
Min
ority
Leve
l.For
each
inst
ance
where
a m
inority
class
ific
ation
isch
arg
ed
more
than
the
contr
ol gro
up b
y a s
tatist
ically
signific
ant
marg
in,th
isco
unts
as
1 p
oin
tto
ward
the
risk
score
.
4.
Ris
kLe
vels
are
cate
gorize
d a
sfo
llow
s:Lo
w(s
core
of
0),
Modera
te(s
core
of
1-
3),
Ele
vate
d(s
core
of
4-
6),
and H
igh
(sco
reof
7-
8)
5.
Rate
spre
ad
valu
es
of
“NC”
(not
calc
ula
ted)
are
exc
luded
from
the
report
calc
ula
tions.
©W
olt
ers
Klu
we
rF
ina
ncia
lS
erv
ice
s.
Wiz
isre
gis
tere
din
th
eU
.S.
Pa
ten
ta
nd
Tra
de
ma
rk O
ffic
e.
Te
l:8
00
-26
1-3
11
1
174

Data Integrity and Scoping
Risk Score by GeographyThis report looks at aggregate data by geographic location.
The columns for this report are:
State
MSA
Risk Level
Risk Score
Average Rate Spread
Below [pricing] Threshold
Above [pricing] threshold
Total applications
In this case the thresholds are the aggregates of all minority data for the geographic location against the control group.
The Risk Levels and Risk Scores are a product of the Average Rate Spread and percentages of applications above or below threshold.
The risk score is calculated behind the scenes. It is the compilation of the numbers of instances of statistical significance found when doing a Dif-ference of Means test for each protected class against the non-protected class in each category.
Note the following regarding this report:
How many areas received a score of Elevated or High for this institution? _______
What was the highest risk score? ______
Was the volume within the area with the highest score significant? _______
175

Fair Lending Wiz Training Guide
Summary of Data Integrity and Risk Factors
Conclusions: Where do We Have Risk?
With the information you gain from the these reports you should be able to create a table somewhat like the one below, creating a matrix that allows you to visibly see the degree of your exposure to risk.
Data Quality
After generating these reports, it is evident that there are some data issues regarding the back-end ratio and LTV ratio. In order to effectively use these variables you must apply a filter to remove the “bad” data.
Difference of Means Analysis
The average APR was higher for Blacks and Hispanics. The average credit score seemed to account for some of this, but it is difficult to tell by looking at just averages.
Risk Factor Reports
The results of the Risk Factor reports showed repeated risks for the treatment of Black applicants, as well as some risks for American Indian as well as Native Hawaiians.
Summary Action Taken
Denial Rates Processing Times Overrides Steering Redlining
Races
AmericanIndianAsianBlack
NativeHawaiian
WhiteEthnicity
HispanicNon-Hispanic
176

Data Integrity and Scoping
HMDA Scoping
There were some risk factors showing up in the HMDA Scoping Reports as well. Rate spreads were higher for American Indian borrow-ers, as well as Native Hawaiian and Hispanic borrowers. The Pricing Dis-parity Report indicated that Blacks and Native Hawaiians were more likely to be above the reportable threshold than were whites.
177

Fair Lending Wiz Training Guide
178

Introduction to Decisioning Regression
Chapter 8
Introduction to Decisioning Regression
Upon completion of this lesson, you will:
Understand the general concepts of decisioning regression.
179

Fair Lending Wiz Training Guide
Overview of Logistic Regression
Two types of regression analysis are used in Fair Lending Wiz:
Logistic Regression - used for decisioning (approval versus denial)
Linear Regression - used for pricing analysis
In statistics, logistic regression analysis is a model used for prediction of the probability of occurrence of an event by fitting data to a logistic curve. It makes use of several predictive variables that may be either numerical or categorical.
For example, the probability that a person gets approved for a loan might be predicted based on knowledge of that person’s credit score (willingness to repay previous loans), back-end ratio (ability to pay cur-rent and future debt), and their loan-to-value ratio (collateral). By looking at the values of these three variables (or factors), and the decisions made for the various combinations of these variables, a prediction can be made regarding each individual’s chance of getting approved.
Logistic regression is a useful way of describing the relationship between one or more risk factors (e.g. credit score, BEratio, LTV) and the out-come (approval of their loan request). Since the loan request is either approved, or denied, this is considered a “binomial” model (two possibilities only). Approval is a “1”, and denial is a “0”.
The decision is known as the dependent variable, and the risk factors are known as the independent variables.
For your reference, the official “logistic function” is:
The variable z is usually defined as:
The first variable above is called the “intercept”, while the remaining variables are called the “regression coefficients”. The intercept is the value of z when the value of all risk factors is zero (i.e., the value of z in someone with no risk factors).
180

Introduction to Decisioning Regression
Specific Example of Logistic Regression
You run a “simple” regression model with the three factors that were mentioned above - credit score, back-end ratio, and LTV.
The applicant’s credit score was 725, their back-end ratio was 45.421%, and their LTV was 72.29%. The applicant was denied. What was the probability of approval for this applicant?
Intercept (calculated) = negative 4.2721
Coefficient of credit score = positive 0.0146
Coefficient of back-end ratio = negative 0.0488
Coefficient of LTV = negative 0.0251
z = -4.2721 + (725*.0146) + (45.421*(-.0146)) + (72.29*(-.0488))
OR z = -4.2721 + 10.585 + (-2.2165448) + (-1.814479), OR 2.2818762
The “Logistic Function”:
Using Excel to perform the calculation, the “Probability of Approval” for this applicant was .907, or 90.7%.
Remember, the applicant was denied. On the surface, the applicant looks well-qualified, so the real reason for denial must be something not con-tained in these variables. For example, what if the applicant filed for bankruptcy last week, and the credit score was pulled two weeks ago?
The decisioning regression model in Fair Lending Wiz identifies these “outliers”, then groups them by protected-classes. Were the individuals who were denied but had a high probability of approval in a protected-class group statistically more often? In other words, does there appear to be a “disparate impact” on these individuals from protected class groups?
181

Fair Lending Wiz Training Guide
182

Decisioning Regression
Chapter 9
Decisioning Regression
Upon completion of this chapter you will obtain the skills necessary to:
Create Approved and Denied Classes
Select Regression Factors
Select Significance Level
Review Regression Model Specifications
Interpret the Regression Summary Results
Intepret the Statistics Tab
Review the Advanced Statistics Tab
Interpret the Applicant Race Tab
Review the Applicant Ethnicity Tab
Review the Applicant Sex Tab
Interpret the Applicant Income Tab
Use the Visual Analysis Tab
Exporting and/or Printing Lists of Applicants to Review
183

Fair Lending Wiz Training Guide
Overview
Fair Lending Wiz gives you the ability to analyze the outcomes of loan applications submitted by appli-cants against a decisioning model. By conducting a decisioning regression you are simultaneously controlling for many of the underwriting factors important in the lending decision. You are verifying that the underwriting criteria stated in your policies actually supports the decisions that are being made.
When interpreting the results you should be able to determine:
If a pattern or practice exists that favors one race, ethnicity, gender, age, or income class over another, and
If an individual applicant appears to have been treated differently than other “similarly-situated” applicants.
Typical factors to include in a decisioning regression model:
Credit score (either FICO, Beacon, Empirica, or VantageScore)If your institution uses the middle of the three, then the lower of the applicant’s or co-applicants middle three, this is the score that should be included in the modelIf your institution uses a “credit tiering” system, then the raw credit score will not be sufficient and should not be used
Method 1: One user-defined field, with 0 for the highest tier, 1 for the second tier down, 2 for the third tier down, etc.Method 2: If there are six tiers, then have six fields (one for each range). Each field would have a 0 if the person’s score is outside the range, or a 1 if the score is inside the range. When placing these fields in the regression model, place the five lower tiers in the model, and leave the highest quality tier out. The results should indicate that Tier 2 lowers the chance of approval some, Tier 3 lowers the chance of approval by a greater amount, etc.
Components of the credit score (e.g. # of satisfactory accounts, # of collections, # of bankruptcies, # of foreclosures, # 60 days or less late, # of 90 day late accounts, etc.)Debt Ratio (back-end ratio, total debt ratio, etc.)Loan-to-value ratioCombined LTV (CLTV - total of first and second liens)Length of Employment in current jobLength of Employment in same type of jobLength in Current ResidenceHome Ownership flagSelf-employed flagOther numerical indicators of credit quality, credit history, or applicant stabilityPercentage of credit lines used
Factors that should not be included in a model:
HMDA “codes”, such as Occupancy, Property Type, Lien StatusThese types of items should be used in a filter BEFORE running the model
Text fields, such as verbal descriptions of documentation type
184

Decisioning Regression
Exercise 1: Creating a Decisioning Regression Model
Scenario
Lending money is a discriminatory business. You are constantly trying to discriminate between those who will pay you back and those who won’t. This is considered legal discrimination and it is something that is done every day by reviewing an applicant’s willingness and ability to repay a loan. However, if discrimination occurs which does not have anything to do with an applicant’s willingness and ability to repay, then you might have illegal discrimination.
Whether you do comparative file review or regression analysis, if there are outliers (unexpected decisions or prices) they will appear. That doesn’t mean that there were not legitimate reasons for their treatment, but it does mean that these are the applicants most likely to be questioned when your examiner does a similar review.
Regression is an excellent way to take those HMDA-reported risks and determine if there was any legitimacy to them once credit quality is accounted for.
Over the course of this analysis you have seen black applicants at apparent risk, but most of the analysis has been done without regard to credit quality. If this institution has a potential problem, regression analysis that includes credit quality factors should help you determine if the problem is real. As always, opening credit files (both denied and approved applications, is the ultimate test of whether or not there is a problem).
185

Fair Lending Wiz Training Guide
Activity 1
There are several different methods for creating a successful regression model.
One major theory is that you filter the records down a very homogeneous group of loans (specific loan type, loan purpose, occupancy, property type, loan program, loan term, etc). If you have hundreds of possible combinations, this can become tedious.
Another theory is to NOT filter the data. In other words, if an applicant comes in with a certain credit score, back-end ratio, and LTV combination, how did they fare - REGARDLESS of what product or type of loan they were applying for?
If this is the method you decide to use, the comparative model (to be discussed later) is where the specific loan program, loan term, property type, etc. would be taken into consideration.
For this first model, you are going to filter the records down to those that have valid data for LTV and Back-End Ratio (the Valid Data saved filter), along with applications for First Lien, Owner-Occupied units only.
Note:There is an alternative that should be considered. By filtering out “bad” BERatios and LTVs, you are removing those records from any kind of analysis. Instead, you could make the “bad” values into “null” values by using the null replacement technique outlined in Chapter 2 (replacing zeroes with null values, but modified to replace any value > 100 with nulls). In that manner, the record would still be considered in some tests, but removed from others.
To create a Decisioning Regression model, follow these steps:
1. In the View bar, click the Regression Analysis button.
2. To filter the records down to those you want in the model:.
2.1 Click the Filter button
2.2 Click Saved Filters
2.3 Open the Saved Filters folder
2.4 Select Valid Data
186
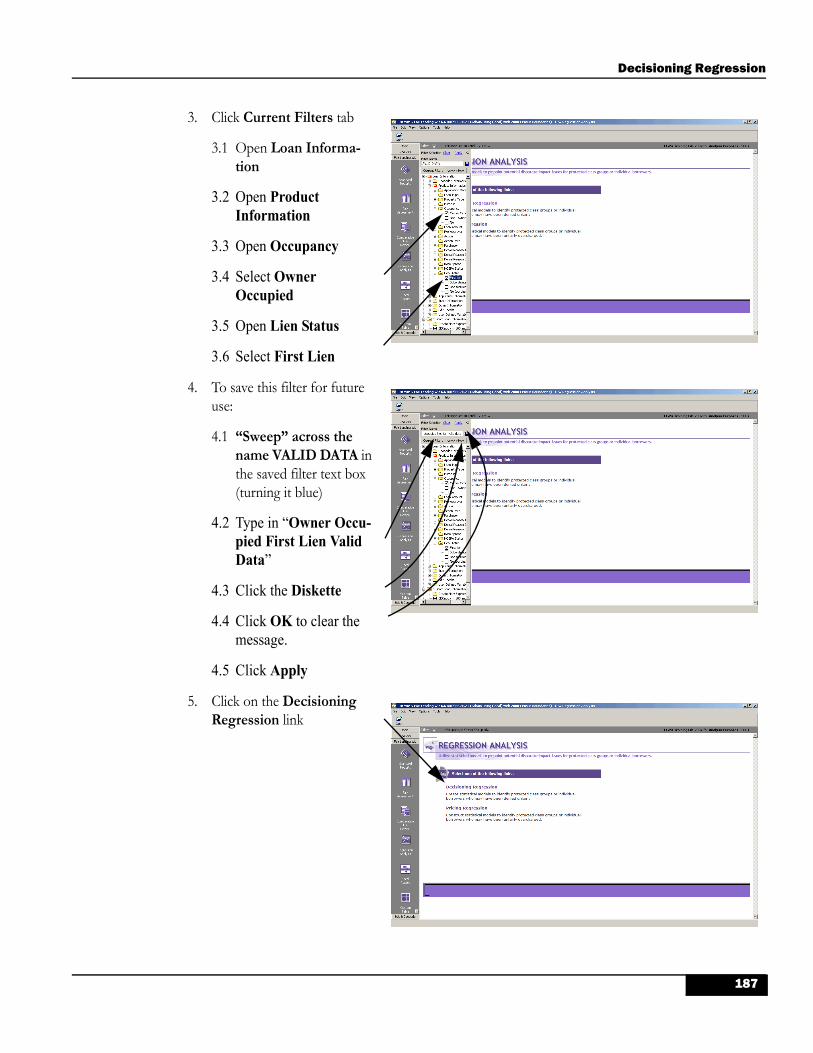
Decisioning Regression
3. Click Current Filters tab
3.1 Open Loan Informa-tion
3.2 Open Product Information
3.3 Open Occupancy
3.4 Select Owner Occupied
3.5 Open Lien Status
3.6 Select First Lien
4. To save this filter for future use:
4.1 “Sweep” across the name VALID DATA in the saved filter text box (turning it blue)
4.2 Type in “Owner Occu-pied First Lien Valid Data”
4.3 Click the Diskette
4.4 Click OK to clear the message.
4.5 Click Apply
5. Click on the Decisioning Regression link
187

Fair Lending Wiz Training Guide
6. On the Select Regression Model screen, click Custom Regression. Click Next.
Note: The Custom Regression selection gives you the ability to add any combination of underwriting variables that you would like to use in the regression model. You should use this option if at all possible.
The Standard HMDA Regression selection is useful if you are running a regression on a standard HMDA-LAR. The variables used will be Loan Amount, Loan-to-Income Ratio,% Vacant Units,% Rental Units, Median Age of Housing, and% Turnover. Most of these are from the US Census.
The Enhanced HMDA Regression selection requires the addition of some credit-related fields to the standard HMDA analysis. Required fields include This will include the Front-End and Back-End Ratios, Credit Inquiries, Satisfactory Credit Accounts, and Minor and Major Total Delinquencies. In addition, the model would use Loan Amount, Loan-to-Income Ratio, % Vacant Units,% Rental Units, and the Median Age of Housing.
7. On the Create Approved and Denied Classes window, leave the default selection and click Next.
Note:Regulators do not add Approved Not Accepted applications to Approvals, because they believe there might have been a reason for the applicant to walk away from the loan.
If you have very few denials (400 applications, 80 denials), you might need to add Withdrawn and Incomplete to Denials to Denials to make the model work properly. Doing so adds complexity to working the files, however, because they weren’t true denials.
188

Decisioning Regression
8. In the Select Regression Fac-tors screen, double-click the Mortgage folder:
9. Select the following vari-ables:.
9.1 Open the Credit Score folder
9.2 Select Custom Credit Score
9.3 Open Financial Ratios
9.4 Select Loan to Value
9.5 Select Back End Ratio
9.6 Scroll down, then open the Stability folder
9.7 Select Length in Residence
9.8 Click the Next button
189

Fair Lending Wiz Training Guide
10. In the Step 4 - Selecting the Significance Level screen, accept the default selection of 95%. Click Next.
Note:Case law has always used the 95% significance level. At 95%, there is a 1 in 20 chance that the results are incorrect. At 90%, that moves to 1 in 10, and at 75% it moves to 1 in 4.
11. In the Review Regression Model Specifications screen:
11.1 Review the selections made
11.2 Click Save
11.3 Enter Model - 4 factors
11.4 Click Save
11.5 Click OK
11.6 Click Finish
12. Click the Ok button.
190

Decisioning Regression
Exercise 2: Analyzing the Regression Results
The Decisioning Regression Summary Results screen displays the results in seven tabs. Those tabs are:
Statistics Tab - this tab lists the variables that you selected when creating the model and based on the data shows the effect each variable had for approvals and denials.
Adv. Statistics - this tab is used by advanced Fair Lending Wiz users or statisticians. The infor-mation displayed in this tab explains, among other things, the impact each factor has on the probabil-ity of approval.
Race, Ethnicity, Sex, Age, and Income - these tabs display the results by four protected class groups, plus income, giving you the ability to see how the decisions made by the underwriters effected each group individ-ually.
Visual Analysis - this tab displays all of the applicants in your file on a graph allowing you to filter on specific actions or variables.
191

Fair Lending Wiz Training Guide
Activity 1
The first thing that you want to understand is if the model is sound enough to continue analyzing the results. You want to review the % Agreement or Fit.
The % Agreement or Fit shows how well the model fits the decision mak-ing process. It compares the decisions that the underwriters made against the predicted decision that the model has come up with and calculates the % Agreement or Fit.
In the sample diagram displayed there were a total of 5,000 applications. The model agreed with 4,000 of the deci-sions made by the underwriters, there-fore the % Agreement or Fit is 80%.
Keep in mind that in this sample dia-gram the model did not agree with 20% of the decisions made which equals 1,000 applications.
1. Review the % Agreement
The % Agreement or Fit for the model you created is ______%.
Note:The higher the percentage, the more accurate the model is in replicating the decisions of the underwriters. If the percentage is low, you need to might need to modify the model before con-tinuing with analyzing the results.
There is no absolute guideline here. For direct loans you might have a % Agreement or Fit around 75%, and for indirect loans the fit might only be 50%. If you don’t hit these guidelines, however, there are other things to review to determine whether you want to proceed.
192
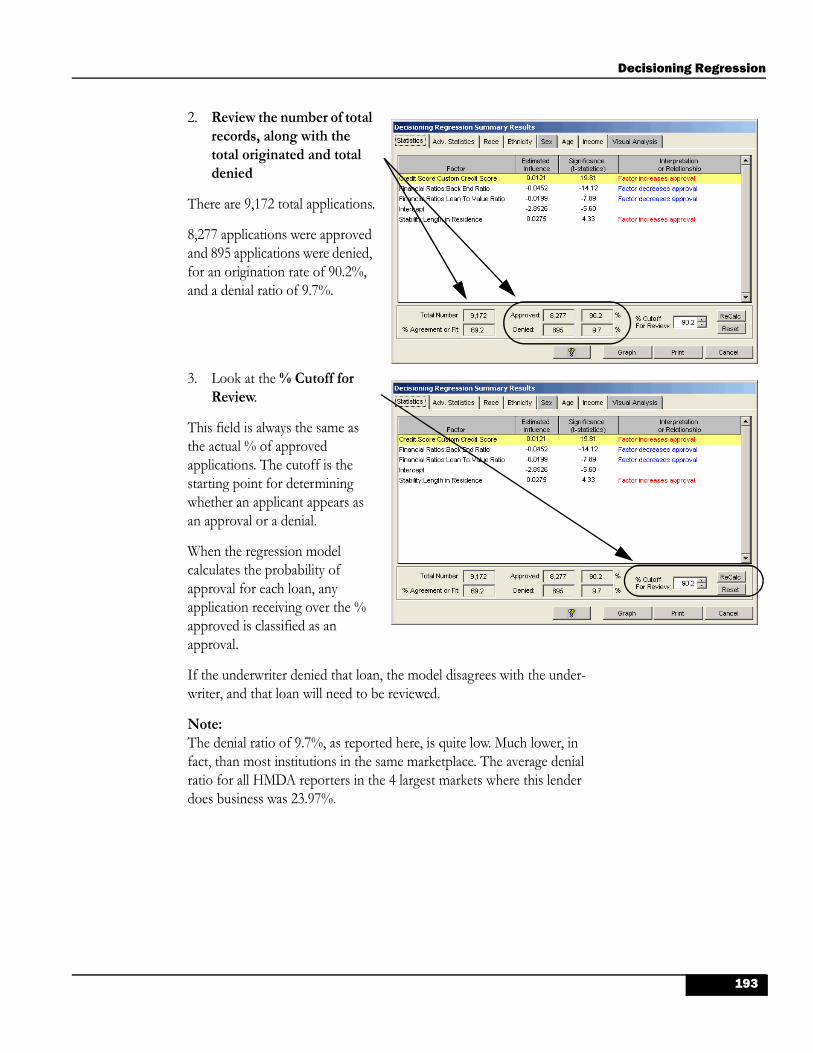
Decisioning Regression
2. Review the number of total records, along with the total originated and total denied
There are 9,172 total applications.
8,277 applications were approved and 895 applications were denied, for an origination rate of 90.2%, and a denial ratio of 9.7%.
3. Look at the % Cutoff for Review.
This field is always the same as the actual % of approved applications. The cutoff is the starting point for determining whether an applicant appears as an approval or a denial.
When the regression model calculates the probability of approval for each loan, any application receiving over the % approved is classified as an approval.
If the underwriter denied that loan, the model disagrees with the under-writer, and that loan will need to be reviewed.
Note:The denial ratio of 9.7%, as reported here, is quite low. Much lower, in fact, than most institutions in the same marketplace. The average denial ratio for all HMDA reporters in the 4 largest markets where this lender does business was 23.97%.
193

Fair Lending Wiz Training Guide
4. Analyze the variables used to conduct this regression. The Estimated Influence col-umn is a statistical calculation that refers to the weight that the logistic regression model estimates for any given vari-able.
The Significance (t-statistics) column displays a statistical calcu-lation for each factor. A large positive t-statistic indicates that the factor increases the likelihood of approval. A large negative t-statistic indicates that the factor decreases the likelihood of denial.
The Interpretation or Relationship column will display how each variable affects the decision making process of your underwriters. These relationships should make sense. If they do not make sense then you should revise the model even if the % Agreement or Fit is high.
5. Review each variable to see “if it makes sense”.
.According to the model, the Credit Score “Increases Approval”. Another way to inter-pret this is “The higher the credit score, the greater the likelihood of approval.” This variable acts as expected.
The Back-End Ratio “Decreases Approval”. The higher the debt ratio, the less likely the approval. This makes sense.
The LTV “Decreases Approval”. The higher the LTV, the less likely the approval. This makes sense.
The Length in Residence “Increases Approval”. The longer they have been in their residence, the more likely they are to get a refinance loan. This makes sense.
194

Decisioning Regression
Activity 2
You might want to know at least a couple of things about the advanced statistics tab.
1. Click on the Advanced Sta-tistics tab. This information might be useful for compar-ing two models against one another, or to provide to an in-house statistician. Other-wise, you can skip this review.
Partial Derivatives - if you raise the variable by 1, it raises the probability of approval by .07 (i.e. from 700 to 701 would raise the probability from 95.00 to 95.07). Similarly, raising the debt ratio from 30.0% to 31.0% would raise the probability from 95.00 to 95.25%.
X2 or Chi-Squared - another method for determining % Agreement. Higher is better.
AIC or Akaike Information Criterion - higher is better here as well. Probably the most useful statistic on the page when comparing two models to one another.
R2 or R-Squared - a “perfect” fit would produce a 1.00. The closer to 1 the better.
Steps - how many “iterations” did the model perform before determin-ing the answer.
DF or Degrees of Freedom - basically the number of variables used in the model.
X2 HL - Chi-Squared Hoesmer and Lemeshow. Two gentlemen who wrote a book titled “Applied Logistic Regression”. This is yet another method for determining % Agreement, with lower numbers being better.
195
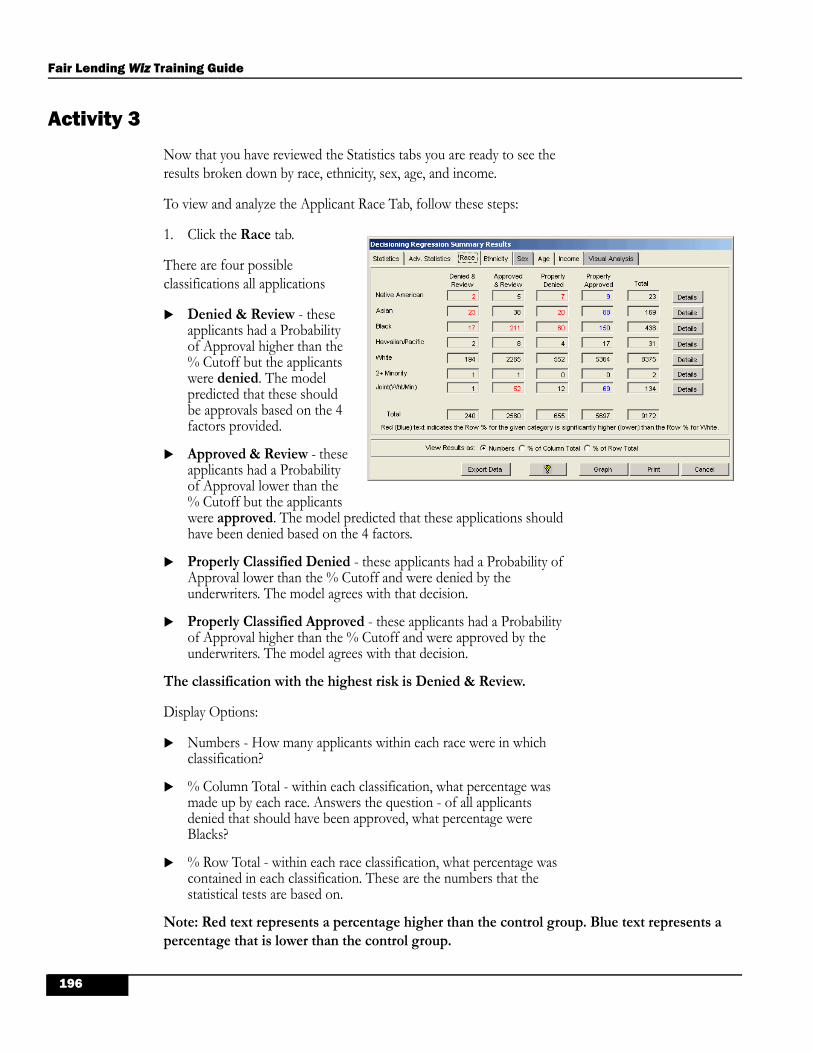
Fair Lending Wiz Training Guide
Activity 3
Now that you have reviewed the Statistics tabs you are ready to see the results broken down by race, ethnicity, sex, age, and income.
To view and analyze the Applicant Race Tab, follow these steps:
1. Click the Race tab.
There are four possible classifications all applications
Denied & Review - these applicants had a Probability of Approval higher than the % Cutoff but the applicants were denied. The model predicted that these should be approvals based on the 4 factors provided.
Approved & Review - these applicants had a Probability of Approval lower than the % Cutoff but the applicants were approved. The model predicted that these applications should have been denied based on the 4 factors.
Properly Classified Denied - these applicants had a Probability of Approval lower than the % Cutoff and were denied by the underwriters. The model agrees with that decision.
Properly Classified Approved - these applicants had a Probability of Approval higher than the % Cutoff and were approved by the underwriters. The model agrees with that decision.
The classification with the highest risk is Denied & Review.
Display Options:
Numbers - How many applicants within each race were in which classification?
% Column Total - within each classification, what percentage was made up by each race. Answers the question - of all applicants denied that should have been approved, what percentage were Blacks?
% Row Total - within each race classification, what percentage was contained in each classification. These are the numbers that the statistical tests are based on.
Note: Red text represents a percentage higher than the control group. Blue text represents a percentage that is lower than the control group.
196

Decisioning Regression
2. Review the Applicant Race tab and take note of the fol-lowing facts:
There were _____ total Denied & Review applicants.
There were _____ total Approved & Review applicants.
How many race categories had RED in the Denied & Review column? ________
Ignoring the 2+ Minority cate-gory for a moment, which race had the highest % Row percentage of Denied & Review applicants? __________
Why was the % Row percentage so high for the 2+ Minority group? ________________________________________________________
Activity 4
In your analysis of this model you noted that there were 23 Asian appli-cants in the Denied & Review classification. They make up 13.6% of all Asian applicants and 9.6% of all the Denied & Review applicants. You need to better understand what occurred for these 23 denied applicants.
To see the details on the 23 Denied & Review Asian applicants, follow these steps:
1. In the row for Asian appli-cants, click the Details but-ton located on the far right side of the screen.
197

Fair Lending Wiz Training Guide
2. The Decisioning Regres-sion Detail Results screen will now appear.
The four tabs on this screen correspond to the classifications you have already reviewed.
The default sort order for this list is by Application Number. This column can be sorted by clicking on the column name.
The Prob column displays the applications probability of approval. This column can be sorted by clicking on the column name.
Next to each application number are the various regression factors that were used by the model.
On the screens with denials, an up arrow to the right of any variable indicates that the value for that variable was statistically significantly higher than those in the entire pool of denied applicants.
On screens with approvals, a down arrow next to any variable indicates that the value for that variable was statistically significantly lower than those in the entire pool of approved applicants.
3. To sort the results:
3.1 Click the Prob column heading to sort in ascending order
3.2 Click the Prob column heading again to sort the list in descending order
198

Decisioning Regression
4. Click the Prob column head-ing again to sort the column in descending order.
Take note of the following facts:
Application number ______________ had the high-est probability of approval at _______%.
The credit score was ______?
The back-end ratio was _______?
The loan to value ratio was ______?
The length in residence was ______?
Activity 5
The statistics page pointed out that the Credit Score was the most important factor, followed closely by the back-end ratio. This applicant’s credit score was 804, and the back-end ratio was statistically lower than other denied applicants’ ratio, at 36.0%. You will need to review the file and look for the real reason among the many factors that were not considered in this model.
To view applicant detail, follow these steps:
1. With application number 4710165518 highlighted, click the View button.
199
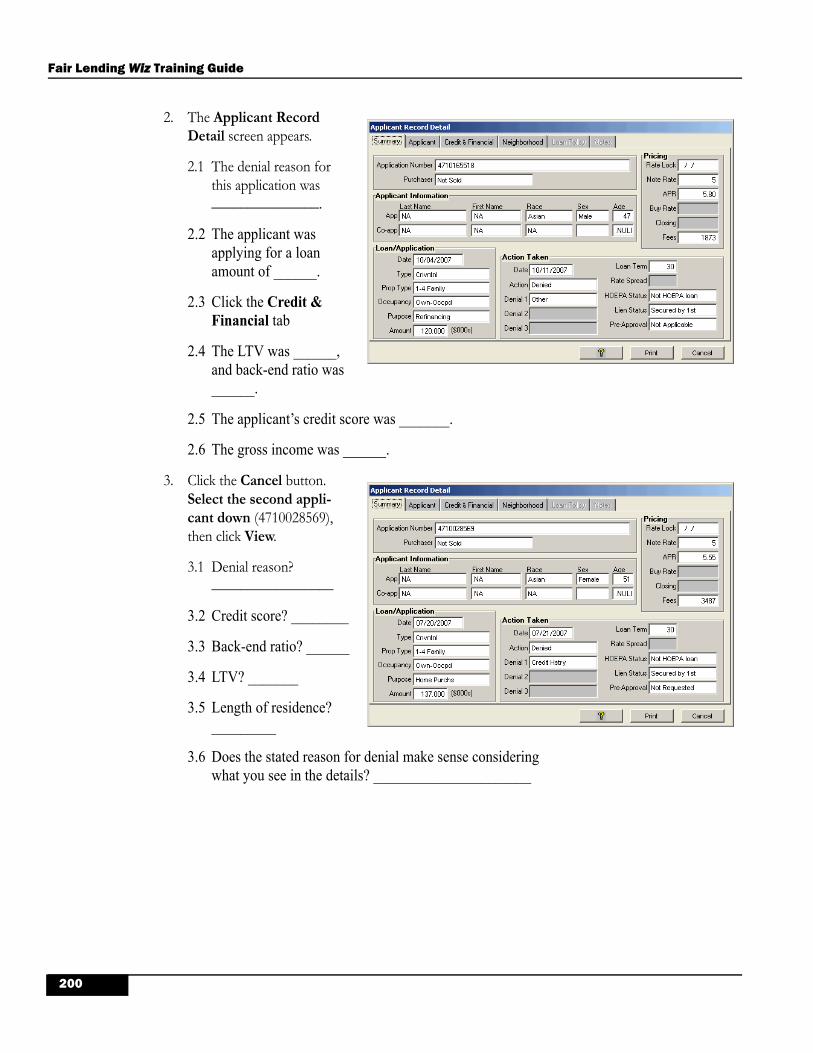
Fair Lending Wiz Training Guide
2. The Applicant Record Detail screen appears.
2.1 The denial reason for this application was _______________.
2.2 The applicant was applying for a loan amount of ______.
2.3 Click the Credit & Financial tab
2.4 The LTV was ______, and back-end ratio was ______.
2.5 The applicant’s credit score was _______.
2.6 The gross income was ______.
3. Click the Cancel button. Select the second appli-cant down (4710028569), then click View.
3.1 Denial reason? _________________
3.2 Credit score? ________
3.3 Back-end ratio? ______
3.4 LTV? _______
3.5 Length of residence? _________
3.6 Does the stated reason for denial make sense considering what you see in the details? ______________________
200

Decisioning Regression
4. Click the Cancel button, and select the fourth applicant in the list (4710028811).
4.1 Denial reason 1? _________________
4.2 Denial reason 2? _________________
4.3 Credit score? ________
4.4 Back-end ratio? ______
4.5 LTV? _______
4.6 Length of residence? _________
4.7 Do the stated reasons for denial make sense considering what you see in the details? _____________________________
Activity 6
You have now reviewed the electronic data for three Asian applicants. The first applicant was denied for reason “other”, the second for “Credit History” (with a credit score of 721), and the third was denied for “Debt-to-Income” (with a BERatio of 52.0) and “Unverifiable Info”. The unverifiable info reason complicates the issue, and you will have to open the file to find out what verifications were missing.
The only usable piece of information from those three applicants was the debt ratio of 52.0 which was apparently not good enough to get the approval. You need to look at the approvals (both Approved & Review and Properly Approved) to see if there were any approvals with debt ratios of 52.0 or greater.
By the way, Asian applicant 4710131748 (11th in the list), was denied solely for debt-to-income, with a 50 BERatio and a 773 credit score.
An easy way to quickly review the approvals is by using the visual analy-sis tab.
201

Fair Lending Wiz Training Guide
To use the Visual Analysis tab in the regression results, follow these steps:
1. Click Cancel to return to the Decisioning Regression Summary Results screen.
2. Click the Visual Analysis tab, and you will see the opening screen.
The graph displayed contains all the applicationsand all four classifications.
% Approval - is represented by the black line across the middle of the screen. In this model we noted earlier that the % Approval was 90.2%.
Denied & Review - represented by red circles
Approved & Review - represented by light cyan circles
Properly Denied and Properly Approved - represented by green or blue squares, respectively
Y axis = Probability of Approval
X axis = any of the varibles (factors) used in the creation of the regression model. If the X axis is changed you need to click the Redraw Graph button to redistribute the applications based on the variable selected.
Filters - this analysis screen is independent of the other tabs. Filters can and should be set to narrow the scope of your review. You can filter by classification, applicant race, applicant sex, applicant age and applicant income.
202

203
Decisioning Regression
3. Filter this view as follows:
3.1 Open the Classifica-tion folder
3.2 Select Approved & Review
3.3 Select Properly Approved
3.4 Open the Race folder
3.5 Select White
4. Continue with filtering:
4.1 Open the Ethnicity folder
4.2 Select Non-Hispanic
4.3 Under the Graph X-Axis options, select Back-End Ratio
4.4 Click Redraw Graph
5. You can now answer the question - “Were there any approvals with BERatios greater than 52 (or 50).?”
5.1 Look at the X-Axis, and determine where 52 (or 50) would be on the graph. All of the dots to the right of this line were approved with BERatios greater than 50.
5.2 To see how high the BERatio actually goes, click the dot circled on the graph. What was the reported BERatio for this individual? _________

Fair Lending Wiz Training Guide
6. To see the approved individ-ual with the lowest probabil-ity of approval who had the highest BERatio, click the dot indicated by the circle.
6.1 Click the Credit & Financial tab to see the BERatio, Credit Score, and LTV for this approved white non-His-panic applicant
7. Click Cancel to return to the Visual Analysis screen.
7.1 Right-click in the square indicated, and select Zoom In from the menu
204

Decisioning Regression
8. Zooming in redistributes the dots within that square over the entire grid
8.1 If desired, you could now click on any dot in the column for BERatio of 53, 54, or whatever you wanted to check on
8.2 Right-click anywhere in the grid, and select Zoom Out to return to the original view
Classroom Discussion:
Based on your review so far, what concerns would you have?
______________________________________________________
______________________________________________________
______________________________________________________
______________________________________________________
______________________________________________________
______________________________________________________
______________________________________________________
______________________________________________________
______________________________________________________
205

Fair Lending Wiz Training Guide
Test Your Knowledge
You have taken time to identify potential issues in the decision making progress for a few Asian applicants. You know that you will need to look at the loan files to see what other factors or notes will explain why the application was denied.
You will set aside this information for now and review the model results for Ethnicity, Sex, and Income. Using the other tabs, what other con-cerns might you have?
Applicant Ethnicity
There were _______ hispanics in the Denied & Review classification.This is significantly _______ than non-hispanics applicants.
This number represents ____% out of all the Denied & Review applica-tions for applicant ethnicity.
Prepare the Detail list for Hispanic Denied & Review applicants. Review the two applicants with the highest probability of approval. Do the rea-sons for denial make sense based on the information you have? ________________________________________________________________________________________________________________
Applicant Sex
There were _____ females in the Denied & Review classification. Any significant differences between females and males? _____________
This number represents ____% out of all the Denied & Review applica-tions for applicant sex.
Applicant Age
There were a total of _________ applicants in the Denied & Review classification for persons aged 62 or older.
Was the % Row total for the 62+ age group higher or lower than the % Row total for the less than 62 age group? ___________
Applicant Income
Any concerns noted for low- or moderate-income applicants? ________________________________________________________
206

Decisioning Regression
Classroom Discussion: Summary of the Test Your Knowledge
Based on the data that you reviewed in the remaining tabs, what con-cerns would you have?
______________________________________________________
______________________________________________________
_____________________________________________________
_____________________________________________________
______________________________________________________
______________________________________________________
207

Fair Lending Wiz Training Guide
Exercise 3: Changing the % Cutoff
The % Cutoff is initially set based on the Origination Rate for the filtered loans contained in your model.In this case, the origination rate was very high, at 90.2%.
To find out whether the origination rate was “normal”, a custom table was created to determine which states and MSAs this institution accepted applications from. In other words, a custom table was set up to produce the following table:
As you can see, 88.59% of all of their applications came from four areas within Illinois. In CRA-Wiz, an “Assessment Area” was created using these four areas. After that, this Assessment Area was used as a fil-ter against the 2006 Peer HMDA data to determine the approval/denial rates for the aggregate peer data. The results: Home Purchase denial rate 18.87%, Home Improvement 35.60%, and Refinance 26.26%. All loan types together produced an overall denial rate of 23.97%.
The % cutoff sets the “bar” for approval/denial in the regression model. The regression model calcu-lates the probability of approval for each and every applicant. Any applicant with a probability of approval below 90.2% (in this case) would be considered as a denial. If the loan was denied, it becomes part of the “Properly Denied” classification. If it was approved, it becomes part of the Approved & Review classification.
What happens if the origination rate is too high? There could be hundreds (or thousands) of applications classified by the model as denials, when it fact they should have been approved. Lowering the “bar” reclassifies all applications with a probability of approval between the old mark, and the new mark.
What’s the risk of lowering the bar? The risk is that there might be loans that you have to review that are determined to be OK. In other words, there may be loans identified as outliers that really weren’t. The risk of having the bar too high is just the opposite - loans may NOT be identified that should have been.
208

Decisioning Regression
Activity 1
You are going to lower the “bar” to 80%, from its current 90.2%. You are then going to review whether the problems identified at 90.2% still exist, or whether they have become more pronounced.
1. Click on the Statistics tab.
2. “Sweep” the cursor over the 90.2 in the % Cutoff for Review spinner box (until it turns blue as shown).
2.1 Type in 80
2.2 Click on the ReCalc button
3. None of the statistics will change at all. To see the changes, you have to the screens where the “classifica-tions” are calculated or dis-played.
209

Fair Lending Wiz Training Guide
4. Click the Race tab.
At the cutoff of 90.2%, there were 23 (13.6%) Asian applicants in Denied & Review. How many are there now? _______. What percentage? _________. Did the change raise the number of “out-liers” to review? _______
At 90.2% Cutoff, there were 2 Hawaiians in Denied & Review, and that number was not statisti-cally significant. How many Hawaiians are now in the Denied & Review classification? ______ What else happened to that group? ____________________________
At 90.2%, there were 17 Black applicants in the Denied & Review classi-fication. Now, there are more, but it is no longer classified as a statisti-cally significant difference when compared to the White applicants’ percentage. How could that happen? ______________________________________
FYI: the t-statistic for the 90.2% calculation for blacks was 2.23. At 80%, the t-stat was 1.76.
5. Click on the Ethnicity, Sex, Age, and Income tabs. Review for any significant changes. Note results here: ____________________________________________________________________________________________________________________________________________________________
6. Click the Visual Analysis tab.
6.1 All of the applications between the top line (90.2%) and the bottom line (80.0%) were reclassified as approvals.
210

Decisioning Regression
Exercise 4: Exporting and Printing Lists of Applicants
The regression model identified 2 Native Americans, 23 Asians, and 18 Black applicants who were considered outliers. These applicants were placed in the Denied & Review group for you to review.
The decisioning comparison model will also identify applicants for you to review, along with lists of comparators so you can perform a side-by-side comparison.
If an applicant appears in both lists, it means that the particular applicant was considered an outlier by the regression model, and has comparators identified by the comparison model. The applicants who appear in both lists are, quite possibly, your best candidates for review.
To compare the two lists, you need to have a list of the applicants classi-fied as Denied & Review by the regression model. There are two meth-ods for doing this:
Print each list (by going to Details, Print)
Export applicants according to your specifications (Export Data)
211

Fair Lending Wiz Training Guide
Activity 1
To print a list of Denied & Review applicants for a particular race, follow these steps:
1. Click the Statistics tab
1.1 Click the Reset button.
1.2 Click the Race tab
2. Click the Details button to the right of the Asian applicants.
212
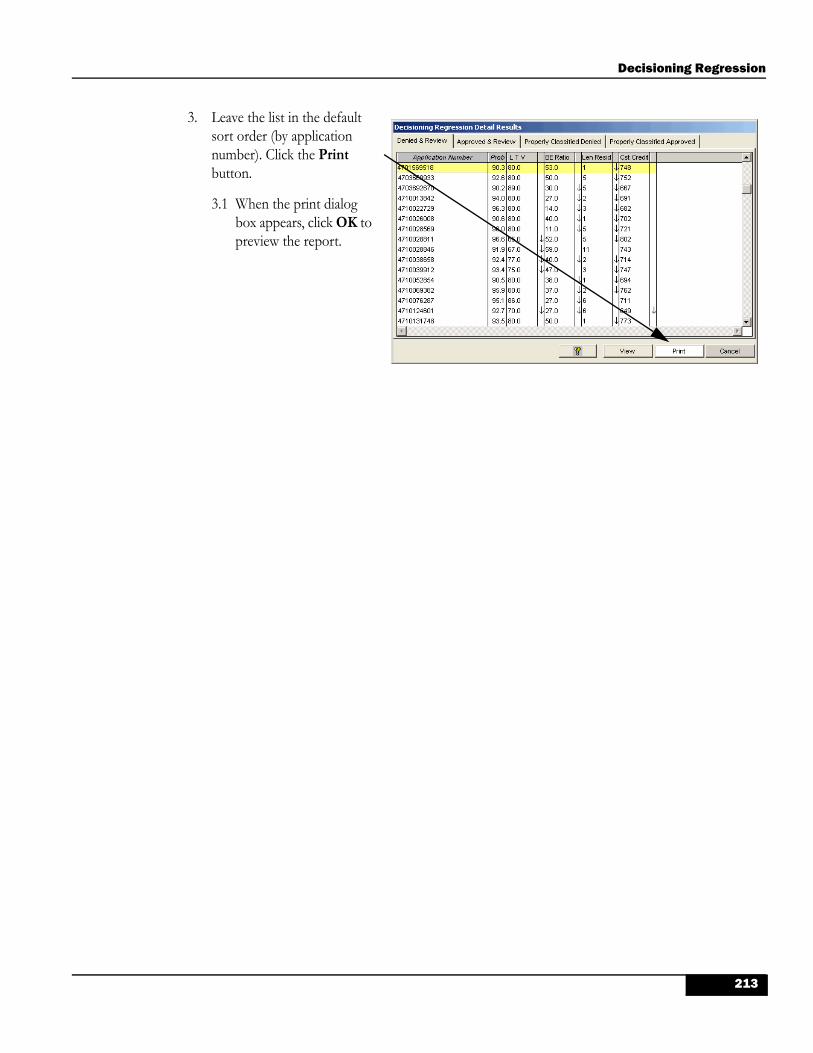
Decisioning Regression
3. Leave the list in the default sort order (by application number). Click the Print button.
3.1 When the print dialog box appears, click OK to preview the report.
213

Fair Lending Wiz Training Guide
AP
PL
ICA
TIO
NN
UM
BE
RL
T V
BE
RA
TIO
LE
NR
ES
IDC
ST
CR
ED
IT
RE
GR
ES
SIO
NM
OD
EL
TO
TA
LR
EC
OR
DS
AP
PR
OV
ED
DE
NIE
D
9,1
72
69.3
%9.8
%
8,2
77
895
90.2
%
Cust
om
:M
odel-
4fa
cto
rs
Ori
gin
ate
d
Denie
d
Filt
er:
Occ
up
ancy
is O
wn
er O
ccu
pie
dan
d(L
ien
Sta
tus
is F
irst
lien
)A
ND
(BE
Rat
io<
=10
0an
d L
TV
<=
103)
RE
GR
ES
SIO
ND
ET
AIL
RE
PO
RT
FO
RA
SIA
NA
PP
LIC
AN
TS
DE
NIE
D&
RE
VIE
WA
PP
LIC
AT
ION
S
So
urc
e:F
LW
izT
rain
ing
File
2007
for
An
alys
isP
urp
ose
s
95%
%A
GR
EE
ME
NT
AP
PR
OV
ED
AP
PL
ICA
TIO
NS
DE
NIE
DA
PP
LIC
AT
ION
SS
IGN
IFIC
AN
CE
LE
VE
L
AN
AL
YS
ISS
PE
CIF
ICA
TI O
N S
PR
OB
4701569518
↓80.0
53.0
1748
90.3
4703669933
↓80.0
50.0
5752
92.6
4703692670
↓↓
89.0
30.0
5667
90.2
4710013842
↓↓
80.0
27.0
2691
94.0
4710022729
↓↓
80.0
14.0
3682
96.3
4710026008
↓↓
80.0
40.0
1702
90.6
4710028569
↓↓
80.0
11.0
5721
98.0
4710028811
↓↓
65.0
52.0
5802
96.6
4710028846
↓67.0
59.0
11
743
91.9
4710038658
↓↓
↓77.0
40.0
2714
92.4
4710039912
↓↓
75.0
47.0
3747
93.4
4710052854
↓↓
80.0
38.0
1694
90.5
4710069382
↓↓
80.0
37.0
2762
95.9
4710076287
↓86.0
27.0
6711
95.1
4710124601
↓↓
↓70.0
27.0
6649
92.7
4710131748
↓80.0
50.0
1773
93.5
4710134220
↓↓
60.0
48.0
3789
96.8
4710138251
↓↓
80.0
41.0
2757
94.8
4710160689
↓80.0
50.0
2741
91.0
4710163857
↓↓
80.0
41.0
4710
91.7
4710165291
↓↓
80.0
41.0
1769
95.4
4710165518
↓↓
68.0
36.0
13
804
98.6
4710232586
80.0
46.0
10
717
91.8
A↑
indic
ate
s thatan
applic
ation's
valu
efo
r th
atva
riable
issta
tistically
sig
nficantly
gre
ate
r th
an the
ave
rage
valu
efo
rall
applic
ations
sim
ilarly
dis
positio
ned
(i.e
.,A
ppro
ved
or
Denie
d).
A↓
indic
ate
s thatan
applic
ation's
valu
efo
r th
atva
riable
issta
tistically
sig
nficantly
less than the
ave
rage
valu
efo
rall
applic
ations
sim
ilarly
dis
positio
ned.
07/1
8/2
008
Page 1
©W
olte
rsK
luw
erF
inan
cial
Serv
ices
Wiz
isre
gist
ered
inth
eU
.S.P
aten
tan
dT
rade
mar
kO
ffic
e.T
el:
800-
261-
3111
214

Decisioning Regression
Activity 2
You can also Export the lists of applicants to an Excel spreadsheet. The Export Data dialog box allows you to select which applicants you want to have exported.
To export the list containing the Denied & Review applicants, including the 2 Native American applicants, 23 Asian applicants, and 17 Black applicants, follow these steps:
1. Click Cancel to return to the Race tab.
2. Click the Export Data but-ton at the bottom of the screen.
3. To change the format and provide a name:
3.1 Click the drop-down list next to Format.
3.2 Select Excel.
3.3 In the File Name box, type DRapps (for Denied & Review applicants)
215

Fair Lending Wiz Training Guide
4. To continue:
4.1 Click the Ellipsis to the right of the Location text box
4.1 In the Select Directory dialog box, click the Select button to keep the default location (make note of where it is!)
5. Continue with selections:
5.1 Under the Classification, uncheck all except Denied & Review
5.2 Under Applicant Race, uncheck all except Native American, Asian, and Black
Note:If you also wanted to export the Hispanic Denied & Review applicants, you would have to do a second export, then combine the files using Excel. If you selected Hispanics now, you would export only those who were BOTH Native American, Asian, or Black, AND Hispanic.
216

Decisioning Regression
6. Click the Export button, and the list of applicants, along with all of their information, will be avail-able in an Excel spreadsheet!
217

Fair Lending Wiz Training Guide
218

Hands on Exercise - Decisioning Regression
Chapter 10
Hands on Exercise - Decisioning Regression
Upon completion of this exercise you will obtain the skills necessary to:
Develop, create, and analyze a Decisioning Regression model for Mortgage data.
219

Fair Lending Wiz Training Guide
Scenario
A community group has accused a local institution of denying minority applicants interested in attaining loans for refinancing. The accusation has been publicized by much of the media in your community and is beginning to receive widespread attention.
Although this accusation is against a competitor, you are concerned about the risk that could exist for your institution. In running the Risk Factor reports earlier you recall that there was a statistically signifi-cant denial ratio for black applicants when compared to white applicants. Black applicants had a denial percentage of 20.10% and white applicants had a denial percentage of 9.56%.
The products you are concerned about your refinancing products, so you will want to filter to Refinance applications. You may also want to filter to those with valid data, owner occupancy, and possibly lien status (if you believe that first and second liens are decisioned differently).
The underwriters use the following factors to make their decisions:
Loan-to-Value Ratio (LTV)
Combined Loan-to-Value Ratio (CLTV)
Back End Ratio (BERatio)
Credit Score (Cust_Credt)
Length of Employment (LenEmploy)
Length of Residence (LenResid)
Loan Amount (LoanAmount)
Create at least one regression model using any combination of factors from the list above. Experiment! Once you have a model you are happy with, make any notes on the following pages. Take note of any issues detected or any conclusions that you have drawn, or observations you have made.
220

Hands on Exercise - Decisioning Regression
Notes/Observations from the creation of the model:
Notes/Observations from analyzing the results of your model:
221

Fair Lending Wiz Training Guide
222

Introduction to Pricing Regression
Chapter 11
Introduction to Pricing Regression
Upon completion of this chapter, you will:
Understand the basic concept of Pricing Regression.
223

Fair Lending Wiz Training Guide
Overview
Linear Regression
A linear regression compares two numeric variables that have a range of values. In Fair Lending Wiz, linear regression is used in the Pricing Regression wizard. You select the dependent variable (for example, APR) on the Select Dependent Pricing Factor screen. You select one or more independent variables (for example, loan amount and applicant income) on the Select Pricing Regression Factors screen.
Note:The available options on both screens correspond to the data you imported from your source file.
The software displays the results of the linear regression analysis on the Results screen.
The decisioning regression model discussed previously was a logistic regression model, where the outcome was either approved or denied. In pricing, the APR (or Note Rate, Rate Spread, Fees, etc.) has a much wider range.
A linear regression model uses a technique called “least squares analysis” to PREDICT a price based on the factors provided. In other words, if a borrower has a credit score of 720, combined with an LTV of 80%, and the base rate for the day is 6.25% for that particular combination, the model should be able to easily predict the borrower’s price based on other loans in the file.
There are other factors involved in pricing, such as whether the borrower was asking for cash out, opted for an interest only amortization method, was purchasing a condo rather than a single-family residence, locked the rate in January rather than December, etc. The more of these factors fed into the model, the better the prediction should be.
After plotting all of the originated loans in the file, the model determines a predicted rate for each individual, then calculates the difference between the actual rate and the predicted rate using a formula called a “studentized residual”.
For a linear regression model, there is no “% Agreement or Fit”. Instead, there is an “Adjusted R-Squared”, which is measured on a scale of 1 to 100. The closer the value comes to 100, the closer the correlation between the dependent and independent variable(s).
224

Mortgage Pricing Regression
Chapter 12
Mortgage Pricing Regression
Upon completion of this chapter, you will obtain the skills necessary to:
Create a pricing regression model for a mortgage file.
Analyze the results of a pricing regression model.
225

Fair Lending Wiz Training Guide
Overview
In analyzing pricing decisions, regression analysis is used to iden-tify borrowers who may have received inappropriate pricing on their loans. Depending upon the variable selected, an analysis of overages or fees charged to protected classes can also be performed. The prices or fees are tested against a model that you build using the Regression Wizard.
Factors that are used to determine the rate charged, or fees assessed, are used in the model. If the actual rate charged, or fee assessed, is higher than the model predicts, and the difference impacts a protected class of applicants, there may be a potential fair lending problem. The regression model tests for statistically significant differences in the way various groups of applicants were treated.
226

Mortgage Pricing Regression
Exercise 1: Creating a Pricing Regression Model for a Mortgage File
Scenario
You have reviewed the policies and procedures for mortgage loans as well as talked to the underwriters to determine the variables that are used in the decision making process. You will now create a pricing regression model for the file Mortgage Loan Portfolio.
In reality, you should acquire copies of the pricing sheets for the various products offered by your institution to see what variables are considered when determining the price.
Note:Since this data is not “real”, some of the pricing decisions may not make sense. Follow the logic of building and interpreting the model, rather than trying to make sense of everything this data implies.
Note:The model presented in this chapter was tested both with and without the “Valid Data” filter applied for the Decisioning Regression model. The results with the filter (BERatio <= 100 and LTV <= 103) removed 24 records out of almost 12,000 records. Other findings were virtually identical. If your electronic file has significant problems with erroneous data, either apply your own valid data filter, or replace the erroneous data values with “null”.
If either of the above is the case for your institution, you would want/need to determine where the errors are coming from, and what can be done in the future to alleviate these problems.
The BEST option is to fix the data before continuing with the analysis!!!
227
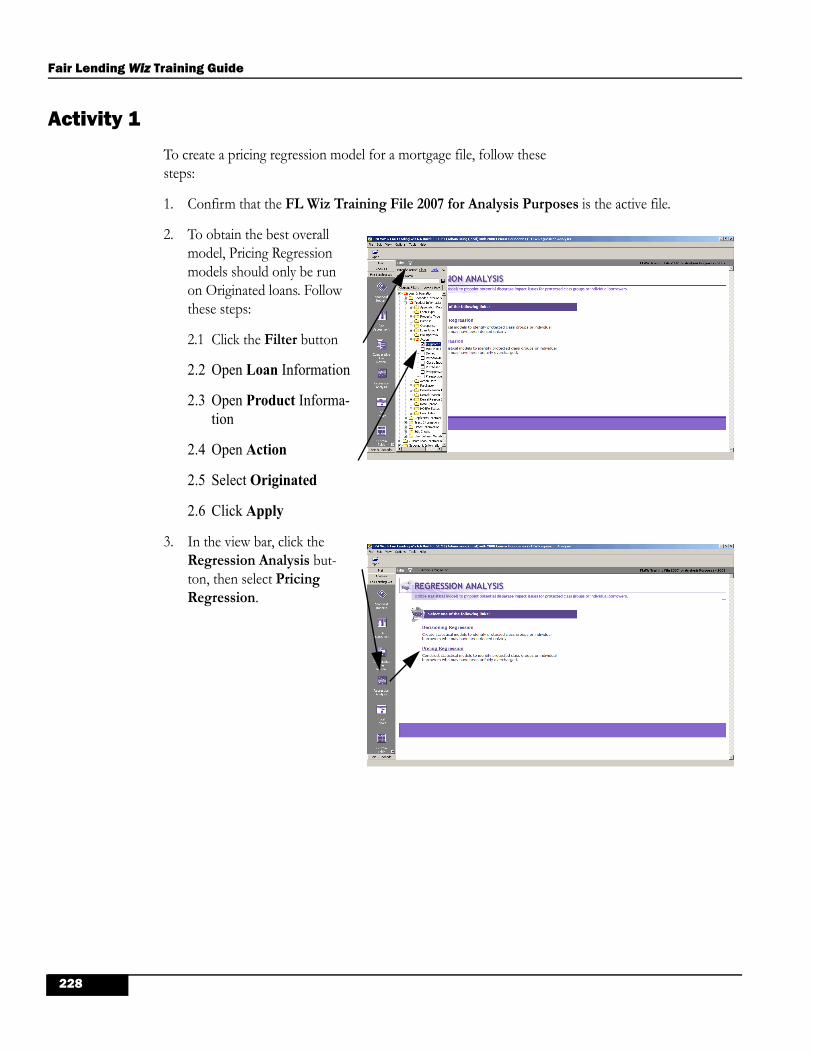
Fair Lending Wiz Training Guide
Activity 1
To create a pricing regression model for a mortgage file, follow these steps:
1. Confirm that the FL Wiz Training File 2007 for Analysis Purposes is the active file.
2. To obtain the best overall model, Pricing Regression models should only be run on Originated loans. Follow these steps:
2.1 Click the Filter button
2.2 Open Loan Information
2.3 Open Product Informa-tion
2.4 Open Action
2.5 Select Originated
2.6 Click Apply
3. In the view bar, click the Regression Analysis but-ton, then select Pricing Regression.
228

Mortgage Pricing Regression
4. Select the Custom Pricing Model.
5. Click the Next button.
6. Accept the default selection of APR, and click the Next button.
Note:When creating a pricing regres-sion model, you must define the pricing factor that you wish to base the model on.
Note:APR and Note Rate can vary over time, necessitating a date filter being placed along with the originations filter already in place. The Rate Spread (using Raw_Rate_Spread) could be used without date filters because it uses the difference between the APR and an equivalent maturity treasury yield.
229

Fair Lending Wiz Training Guide
7. Select the following pricing factors:
7.1 Open the Mortgage folder
7.2 Open the Credit Score folder
7.3 Select Custom Credit Score
7.4 Open the Loan/Appli-cation folder
7.5 Select Loan Term
8. Continue selecting pricing factors:
8.1 Select Loan Amount (by itself, below the sta-bility folder)
9. Continue selecting pricing factors:
9.1 Select Lien Status
230

Mortgage Pricing Regression
10. Continue selecting pricing factors:
10.1 Open the User-Defined Variables folder
10.2 Select Arm_01
10.3 Select CLTV
10.4Click Next
11. Accept the default selection of 95% for the Significance Level.
12. Click the Next button.
13. Click Finish to save and review the results of this model.
231

Fair Lending Wiz Training Guide
14. Click Yes to save the model, replacing the date and timestamp name with Train-ing Model 6 factors
232

Mortgage Pricing Regression
Exercise 2: Analyzing the Mortgage Pricing Regression Results
The Pricing Summary Results screen displays the results for the pricing regression model that you have created. The data for the results is separated into six differ-ent tabs. The tabs are:
Statistics Tab - this tab lists the variables that you selected when creating the model and based on the data shows the effect each variable has in determining the price of the loan.
Applicant Race, Applicant Sex, Applicant Age, and Applicant Income - these tabs display the results by four protected class groups, plus income, giving you the ability to see how the pricing decisions affected each group individually.
Visual Analysis - this tab displays all of the applicants in your file on a graph allowing you to filter on specific actions or variables.
233

Fair Lending Wiz Training Guide
Activity 1
The first thing that you want to understand is if the model is sound enough to continue analyzing the results. You want to review the % Adjusted R-Squared.
The % Adjusted R-Squared indicates how well the explanatory variables explain the pricing decisions that were made. The % Adjusted R-Squared measures the percent of variation in the dependent vari-able (price) that can be explained by the regression model you have created. The higher the value of this measure, the more accurate the model in replicating the pricing decisions.
1. The % Adjusted R-Squared for this regression model is ________.
2. The Degrees of Freedom mathematically indicates the total number of observa-tions, minus one, minus the number of factors used in the analysis. Generally, the more observations contained in the analysis, the more robust the results. (The minimum number of observations should be 250)
3. Analyze the variables used to conduct the regression.
3.1 The Estimated Coefficient is a statisti-cal calculation represent-ing the relative strength of the factor when deter-mining the predicted price.
3.2 The Significance is the coefficient calculated as a t-statistic (anything over +1.96 or under -1.96 is statistically sig-nificant).
3.3 The Interpretation or Relationship displays how each variable affects the pricing. These rela-tionships should make sense!
234

Mortgage Pricing Regression
4. Review each variable to see “if it makes sense”.
According to the model, the single most influential factor in pricing is the lien status. Lien status “Increases Rate or Cost”. Read another way, “as the lien status moves from a 1 (first lien) to a 2 (second lien) or a 3 (no lien), the price of the loan increases. This variable acts as expected.
The second item in the list is the intercept. The intercept is the value (price) if none of the other factors were present. In other words, the intercept of 5.1589 would be the price if there was no lien status, no credit score, no LTV, no loan amount, and no loan term. It would be better if the intercept was lower, and that most of the predicted price came from the price factors, not the intercept!
How could you make the intercept lower? By bringing in additional pricing factors, such as an Inter-est Only indicator, Cash Out indicator or amount, Balloon Payment indicator, Discount Points paid, etc.
The next most influential price factor was the UDF (user-defined field) called Arm_01. This is a 0 if the loan is an ARM, and a 1 if it is fixed-rate loan. The interpretation says “Increases Rate or Cost”. If true, moving from an ARM to a Fixed is more expensive. This could be true if the ARM loans come with lots of expensive options, on average
Next is CLTV, also showing an interpretation of “Increases Rate or Cost”. The higher the com-bined LTV, the higher the cost, which is absolutely true.
Next is Credit Score, which Decreases Rate or Cost. The higher the credit score, the lower the cost. Again, this is true, and is doing what is expected.
Next is Loan Amount, which also has a negative influence on price. Smaller loans cost more, overpow-ering the impact of jumbo loans in the analysis.
The last pricing factor is the Loan Term, with an interpretation of “Increases Rate or Cost”. Longer loan terms do indeed cost more, so this is absolutely correct.
235

Fair Lending Wiz Training Guide
Note:We might have seen more significant numbers if we had had detailed information on derogatories (mortgage lates), interest only options, cash out, number of units, and any other factors that influence price. The % Adjusted RSq is 47.25%, which isn’t bad, but could be better.
Note:Again, there is no absolute guideline here. Even with a low % Adjusted R-Squared, if the pricing factors are doing what is expected, go ahead and review the results. Work towards having more pricing factors available for next year’s data.
Activity 2
Now that you have reviewed the Statistics tab you are ready to see how the results are broken down by race, ethnicity, sex, age, and income. You need to look at each tab and see how the model you created compares to the pricing decisions made by the institution.
Note:For each borrower, there are three possibilities:
Above Predicted - this column displays the number of individuals that were charged significantly more than the predicted rate.
Below Predicted - this column displays the number of individuals that were charged significantly less than the predicted rate.
As Predicted - this column displays the number of individuals whose actual rates charged were consistent with the predicted rate.
Note:Red (Blue) text indicates the Row % for the given category is signifi-cantly higher (lower) than the Row % for the control group.
236

Mortgage Pricing Regression
1. Click the Race tab.
1.1 There were a total of 489 borrowers in the Above Predicted category.
1.2 Of these, only 4 were Native American. How could these 4 be in “red” print, indicating a significant difference? ________________
1.3 What percentage of white borrowers were in the Above Predicted category? ________
1.4 What percentage of Native American borrowers were in this category? _______ What about Blacks? _______
2. Click on the Details button in the row for Blacks
237

Fair Lending Wiz Training Guide
3. The list of borrowers is sorted in descending order by “Studentized Residual”, which is a statistical calculation that lets you see how much above the predicted rate the borrower was.
3.1 How much was the Studentized Residual for the borrower with the highest actual rate? __________
4. Click the View button when the first borrower is high-lighted (4710043638).
4.1 The borrower received a 30-year, home purchase, 1-4 family, conventional loan and received an APR of 9.36. The rate lock date was 4-19-2007.
4.2 Click the Credit & Financial tab
5. Review this borrower’s credit information.
5.1 What was her Gross Annual Income? ________
5.2 Credit Score? _______
5.3 LTV? _________
5.4 Click Print, then OK to Preview the total record.
238

Mortgage Pricing Regression
6. Click the Next Page button and review the User Defined Variables.
7. User Defined Variables are shown to the right. Take note of the specific loan program, whether it is an ARM or a Fixed loan, the Credit Tier, and the Automated Under-writing system. ________________________________________________________________________________________
7.1 Click on the Close Preview button, then Cancel twice to return to the Summary Results.
239

Fair Lending Wiz Training Guide
Analyzing Results Using the Visual Analysis tab
One interesting difference between a decisioning regression model and a pricing regression model is located on the Visual Analysis tab. With decisioning regression the Y axis is the probability of approval. In a pricing regression the Y axis is the “studentized residual”, representing the amount of the presumed overcharge or undercharge.
1. Click the Visual Analysis tab.
In the Visual Analysis tab the X-axis represents one of the vari-ables used in creating the model. The Y-axis contains the residual (the overcharge/undercharge).
The graph displayed contains all the applications that are in all three classifications.
The visual analysis is independent of the other tabs, so separate filters must be set. The filters that can be set are Classification, Race, Ethnicity, Sex, Age (if it is in your loan file), and Income. If a filter is set or you change the X-axis then you must click the Redraw Graph button to see the appropriate results based on your selection.
So far, you have only reviewed one Black applicant who was identified as an outlier by the regression model. Their information: Rate Lock Date 4-19-07, loan amount $193 thousand, LTV 92, Credit Score 576, first lien. APR was 9.36.
2. Double-click the Filter button.
2.1 Open Classification
2.2 Select Below Predicted
2.3 Open Race
2.4 Select White
240

Mortgage Pricing Regression
3. Continue with filter:
3.1 Open Ethnicity
3.2 Select Non-Hispanic
3.3 Change the X-Axis to Credit Score
3.4 Click Redraw Graph
4. Look for a “Below Pre-dicted” borrower with a similar credit score. Click on the dot indicated in the pic-ture to the right.
5. Note the following:
5.1 Rate lock date? ________________
5.2 APR? ___________
5.3 Loan Amount? _______
5.4 Occupancy? _________
5.5 Lien Status? _________
241

Fair Lending Wiz Training Guide
6. Click the Credit & Finan-cial tab:
6.1 LTV? _________
6.2 Credit Score? ________
6.3 Question: Based on this cursory review, do you think this borrower should have received an APR that was 446 basis points lower than the Black applicant? _________________
6.4 Question: How should the lien status have impacted the price? ______________________________________________
7. Click Cancel, then click the Race tab.
7.1 Click the Details tab for Black borrowers.
8. Click the Print button, then click OK to preview the list of loans (this list is on the next page of this chapter for future reference).
242

Mortgage Pricing Regression
AP
PL
ICA
TIO
NN
UM
BE
RL
OA
NA
MT
LO
AN
TE
RM
CS
TC
RE
DIT
LIE
NA
RM
_01
CL
TV
Filt
er:
Act
ion
is O
rig
inat
ed
PR
ICIN
GD
ET
AIL
RE
PO
RT
FO
RB
LA
CK
AP
PL
ICA
NT
SA
BO
VE
PR
ED
ICT
ED
AP
PL
ICA
TIO
NS
So
urc
e:F
LW
izT
rain
ing
File
2007
for
An
alys
isP
urp
ose
s
RE
GR
ES
SIO
NM
OD
EL
TO
TA
LR
EC
OR
DS
11,9
76
11,9
69
Cust
om
: T
rain
ing
model6
facto
rs
95%
47.2
5
AP
R
SIG
NIF
ICA
NC
E L
EV
EL
DE
PE
ND
EN
TV
AR
IAB
LE
DE
GR
EE
S O
F F
RE
ED
OM
%A
DJU
ST
ED
R-S
QU
AR
E
AN
AL
YS
ISS
PE
CIF
ICA
TI O
N S
%
Act
ual
Pre
dic
tS
tdR
es
4710043638
↑↑
↓↑
↓193
30
576
10
92.7
99.3
60
6.3
38
5.4
25
4710116394
↓↑
↓↑
↓86
30
669
10
99.9
68.8
80
6.2
84
4.6
59
4701606390
↓↓
↓↓
↓70
20
682
10
19.8
48.3
40
5.8
25
4.5
16
4703616209
↓↓
↓↓
↓15
20
583
10
9.1
08.2
40
5.9
23
4.1
62
4703753676
↑↑
↓↑
↓215
29
712
10
95.0
08.4
70
6.1
55
4.1
55
4703691196
↑↑
↑↑
↓309
29
784
10
90.0
08.1
50
6.0
06
3.8
49
4703730736
↑↑
↓↑
↓252
29
684
10
95.0
08.3
20
6.1
79
3.8
42
4703731812
↑↑
↓↑
↓260
29
654
10
95.0
08.2
40
6.2
16
3.6
32
4703731911
↑↑
↓↑
↓208
29
670
10
95.0
08.2
30
6.2
12
3.6
21
4710042909
↓↑
↓↑
↓97
30
637
10
100.0
08.3
10
6.3
23
3.5
67
4703730820
↑↑
↓↑
↓236
29
679
10
95.0
08.0
90
6.1
91
3.4
08
4701555892
↑↑
↓↑
↓310
30
635
10
100.0
08.1
40
6.2
56
3.3
82
4703735645
↓↓
↓↓
↓35
15
641
10
14.1
27.5
90
5.8
27
3.1
66
4703629618
↓↓
↑↓
↓9
5787
10
7.3
87.2
40
5.5
39
3.0
55
4710096966
↓↑
↓↑
↓136
30
635
10
85.0
07.9
30
6.2
43
3.0
29
4703730903
↑↑
↓↑
↓214
29
670
10
95.0
07.8
90
6.2
10
3.0
15
4703712648
↓↑
↓↑
↓176
29
679
10
95.0
07.8
60
6.2
11
2.9
60
4710078401
↓↓
↑↑
↓23
15
800
10
89.9
37.6
00
5.9
76
2.9
15
4703662943
↑↑
↑↑
↓252
29
749
10
95.0
07.6
90
6.0
94
2.8
65
4710189194
↓↑
↓↑
↓75
30
685
10
75.0
07.7
30
6.1
50
2.8
36
4701554866
↓↑
↓↑
↓86
30
667
10
88.1
57.7
30
6.2
32
2.6
89
4710037860
↓↑
↑↑
↓178
30
729
10
100.0
07.6
40
6.1
75
2.6
29
4703635316
↑↑
↓↑
↓295
29
685
10
95.0
07.6
10
6.1
64
2.5
95
4710123806
↓↑
↓↓
↓75
30
641
10
55.5
67.5
30
6.1
17
2.5
37
4710123815
↓↑
↓↓
↓75
30
641
10
55.5
67.5
20
6.1
17
2.5
19
4703666136
↑↑
↑↑
↓230
29
800
10
94.9
77.4
20
6.0
34
2.4
88
07/2
9/2
008
Page 1
©W
olte
rsK
luw
erF
inan
cial
Serv
ices
Wiz
isre
gist
ered
inth
eU
.S.P
aten
tan
dT
rade
mar
kO
ffic
e.T
el:
800-
261-
3111
243

Fair Lending Wiz Training Guide
244

Hands on Exercise - Pricing Regression Models
Chapter 13
Hands on Exercise - Pricing Regression Models
Upon completion of this exercise you will obtain the skills necessary to:
Create and analyze a Pricing Regression model for HMDA data.
245

Fair Lending Wiz Training Guide
Scenario for Mortgage data
The electronic file you have is fairly limited, with only a few pricing factors included. Try experimenting with the data you have, and see what happens to the results.
The variables to use are:
Loan to Value Ratio
Combined LTV
Credit Score
Loan Amount
Loan Term
Lien Status
Applicant Income
Credit Tier
Back End Ratio
Arm_01 (1 if ARM)
Fix_01 (1 if Fixed)
Create at least one pricing regression model using any combination of factors from the list above. Once the model has been created, make any notes on the following pages. Take note of any issues detected or any conclusions that you have drawn, or observations you have made.
You can also try different filters before running the model(s). See what impact the filters have on the results.
246

Hands on Exercise - Pricing Regression Models
Notes/Observations from the creation of the model (what factors worked, what didn’t):
247

Fair Lending Wiz Training Guide
Notes/Observations from analyzing the results of your model:
248

Best Practices for Regression
Chapter 14
Best Practices for Regression
Upon completion of this lesson you will identify recommendations for conducting a successful regression analysis. These suggestions include:
Setting goals before creating a regression model
Creating models on paper
Creating models in Fair Lending Wiz
Reviewing the Statistics tab
Reviewing the Protected Class tabs
Reviewing the Visual Analysis tabs
Repeating the process
Reviewing your results
249

Fair Lending Wiz Training Guide
Overview
Best Practices
Regression Analysis is a powerful tool that will enable you to uncover evidence of disparate impact. With this tool, the more work you do up front, the more likely you will create a valid model that explains your lending decisions or your pricing decisions.
1. Set your goals
There are two schools of thought associated with Regression Analysis, and you can choose to use either one, or both.
Technique 1: Analyze all loans together. You might use the filtering functions to filter down to specific characterizations (such as lien status = “1”, or Occupancy = “1”), but even that is not absolutely necessary.
The goal here is to see how ALL applicants (or borrowers if filtered to originations) fare when compared to all other applicants. In other words, REGARDLESS of whether the applicant is applying for a 30 year fixed conventional, or a first-time homebuyers program, if they had a credit score of 680 and and LTV of 90% were they approved or not?
This applies a very broad brush against your portfolio, but is useful to see if there are apparent disparities in the way a particular group of applicants is treated.
Technique 2: Compare Conventional Home Purchase applications against each other, and nothing else. Separate the regression models by at least Loan Type and Purpose, and perhaps by specific loan programs.
You could also filter by Occupancy, Lien Status, Property Type, or other similar fields.
You must THINK through what you are trying to accomplish. If the Risk Factor reports continuously pointed to Refinance Loans as the area of risk, then start with Refinance loans and work your way down to your Refinance products that have the volumes necessary to run regression models.
2. Create your models on paper
By this point, you should have already interviewed your underwriters and credit policy analysts. However, it is worth checking in with them again after you have created the models on paper. Review the variables in the electronic file to ensure they are valid. If your institution provides Loan-
250

Best Practices for Regression
to-Value only for approved loans, including this factor in a decisioning model would produce erroneous results.
The paper models should list all the elements used in decisioning or pric-ing in the order of importance based on all that you have learned. Have your underwriters confirm that this is so. Create one model for each product being reviewed and for each type of regression analysis required. You may also need different models to review different underwriting centers. If you are a large institution, you may need different models for different markets. Even if you aren’t large enough to require multiple models for the same product, you should be aware that these factors may influence your results.
3. Create your models in FLW
The models should encompass all the same criteria as your written mod-els. In some cases, you may have listed a factor in your written model that isn’t available in Fair Lending Wiz. There is probably little you can do about that at this stage except to recognize that an incomplete regres-sion model will yield different results than you would get if you had all the available factors.
4. Run the first model and review the Statistics Tab.
Run your first regression model, selecting the product that has been associated with the highest risk. Run the model that was built for this product or product type. (If there were no risk factors that were uncov-ered during the scoping process, select the model for the product for which you are most familiar.)
The first time through, plan on spending a significant amount of time reviewing each screen so that you are familiar with what you are looking at and how to interpret the data on each tab.
Start with the % Agreement or Fit (for decisioning) or % Adjusted R-squared (for pricing.) If those numbers seem inordinately low, see if you can obtain additional factors from another source. (In one institution, the pricing officer maintained an Excel spreadsheet with the application number and several pricing fields that were not available in the original model. A quick “update” of the file with these fields increased the model’s accuracy considerably). If the “fit” still doesn’t give you a good feeling, determine why the model doesn’t explain your decisions.
Are you missing critical variables?
Do you need to narrow your date range (this can be a particular issue for pricing analysis)?
Have you reviewed the data integrity of all the variables you are using?
251

Fair Lending Wiz Training Guide
Have you filtered to focus only on a single product type?
Fix the problems where possible, and run the model again. If your num-bers are significantly below a comfortable range, check to see if the fac-tors are exerting the proper influence on the model. If so, go ahead with the review - just be aware that the comparative file review will be even more important.
If your Decisioning Regression model contains only a few denials, or shows an above average origination rate, try lowering the “% cutoff for review” to a more reasonable number.
Review the Interpretation of Relationships for each factor. They should make sense. If they do not make sense:
Check the integrity of the variables in question (use the Data Quality report). If a particular variable does not look right for denials, try leaving it out of the decisioning model and try again.
Verify that you are reviewing products that can truly be mixed together.
Remember, at this point your models have been approved by the under-writers. Assuming that the underwriters are using the factors that you outlined, there should be a high correlation between the factors and the decisions.
5. Review the Protected Class Tabs
If there are any numbers appearing in Red under Denied & Review, select those to investigate first.
Remember, when you are evaluating the Denied & Review applicants, sort for the highest probability first. These represent your applicants who, according to the model, had the highest chance of being approved.
6. Review the Visual Analysis Tab
The Visual Analysis Tab is particularly useful for reporting purposes. Using the filters you can present a very clear picture of what the regres-sion analysis is revealing. When printed, these colorful pictures may make the explanation easier to follow.
252

Best Practices for Regression
7. OPEN and REVIEW both Denials and Approvals
The most critical step in the entire process involves opening files and reviewing the documentation. The regression models produce a list of applicants who were either Denied (and the model thought they should be Approved), or who were considered overcharged (Above Predicted).
For decisioning, review the denied loans, and review the reason for denial provided to the customer. Depending upon what the reason was, you could use the Visual Analysis to see if there are comparable approv-als. For loans that have comparables, review at least three.
For pricing, review the price sheet, and all pricing adjustments.
Remember, you are looking for consistency! Discretion exercised by loan officers, underwriters, and pricing agents is where problems can occur. Exceptions to policy can be flags for fair lending. Look for consistency in the assistance provided to each applicant.
8. Repeat for each product as necessary
Complete Decisioning regression analysis and then move onto Pricing Regression. The Decisioning model will use Originated/Denied applications, and the Pricing model will use only Originated loans.
9. Review your results
Any models that result in apparent disparate treatment should be reviewed by the underwriters in case there are additional factors that weren’t previously mentioned.
10. Develop conclusions.
The object of Regression Analysis is to ensure that you do not have sys-temic policies in place that inherently discriminate against a protected class.
Outline your methodology
Disclose your model and the departments who signed off on the model
Explain your results
Develop either a plan of action or a conclusion
It is a good practice to touch base with your legal department prior to doing this analysis so that they can be prepared in the event that a discrimination issue is uncovered.
253

Fair Lending Wiz Training Guide
254

Introduction to Comparative File Review
Chapter 15
Introduction to Comparative File Review
Upon completion of this lesson you will understand the following:
Comparative file review.
Difficulties of manual sampling.
The differences between Decisioning Comparison Review and Pricing Comparison Review.
255

Fair Lending Wiz Training Guide
Overview
Comparative File Review is a “head to head” comparison of loan applications and a review of the outcomes for similarly-situated individuals. When conducting a comparative file review you look at a target applicant who has either been denied, or priced higher, than those who appear to be less qualified.
The first step is to identify the “target” applicants (one of the protected-class members). The next step is to determine who would be considered good comparators for the target applicant that you are reviewing. You then review similarly qualified, or less qualified, comparator applicants as the target applicant but received a different decision or a lower price. The goal is to identify matches, and determine if the outcome is appropriate after controlling for credit quality and other characteristics.
When analyzing the data, the decision may be totally understandable. However, there may be times when the data points to disparate treatment for minority borrowers.
This process can be very time consuming and cumbersome if done manually. First, you would need to look at a denied file and try to determine which of the other files in the portfolio have similar characteristics, followed by a manual review of the data.
Fair Lending Wiz accomplishes the same objective. Fair Lending Wiz takes the first protected class applicant from your portfolio and compares the entire portfolio against that file. It then repeats this process for every protected class borrower.
In essence, you are expanding your review from just a few files to your entire portfolio of loans. The software creates all of the matched pairs for you, and allows you to focus your attention only on applicants that appear to have been treated differently. Using this process, you have greater coverage since you are examining your entire loan file rather than a limited sample size that may not truly be reflective of the entire portfolio.
Fair Lending Wiz provides flexibility when it comes to determining the underwriting factors that are used to determine which files are “similarly situated.” You can run the review based on your institution’s underwriting policy, plus you can add additional factors that may not be documented in the product policy.
256

Introduction to Comparative File Review
The Examination Procedures have an entire section devoted to Comparative File Review in Part III of the procedures. The necessary steps to perform a successful file review, according to the exam procedures, are as follows:
1. Review each protected-class denied applicant based on their primary denial reason.
2. For EACH denial reason, determine the MOST QUALIFIED denied individual (the top-ranked applicant sets the “benchmark” for that denial reason). For example, if a minority applicant was denied for “Debt-to-Income”, and had a 42% DTI ratio, then 42% is the benchmark for that reason.
3. For EACH denial reason, determine the APPROVALS from the control group who were LESS qualified (the Overlap Approvals). Using the above example, any approval with a DTI of 42% or higher would be the overlap approvals.
Reasons for denial, such as “collateral”, and “other” present a problem with this kind of analysis. You almost have to work all of these to deter-mine what the real problem was.
257

Fair Lending Wiz Training Guide
Decisioning Comparative Classifications
The model uses a standard statistics measure to “classify” each target applicant, but the classifications don’t necessarily mean what they say.
Where do they come from then? The model finds EVERYONE in the portfolio who meets the criteria you provided in the model. If the DENIED target happens to be Black, the model finds all Blacks who meet the qualifications provided (Approved and Denied). It does the same for the Comparators. You now have four categories of borrowers in the lower window of the model:
1. Approved Comparators - if the target applicant is Black, for example, the approved comparators are White
2. Denied Comparators - again, if the target applicant is Black, then Denied Comparators will be White
3. Approved Minorities - if the target applicant is Black, then all identified Black approvals are listed here
4. Denied Minorities - if the target applicant is Black, then all identi-fied Black denials are listed here (ALWAYS INCLUDES THE TARGET APPLICANT)
EXAMPLE 1: Review Needed
For the sake of this example, say that there are 20 Approved Comparators, and 20 Denied Comparators. The DENIAL RATE for these 40 people would be 50%.
To continue the example, say there are 20 Blacks (including the Target), 5 Approved and 15 Denied. The DENIAL RATE for these 20 applicants would be 75%.
The calculated T-Statistic comparing these two groups would be 2.18. THE MODEL WOULD CLASSIFY THE TARGET APPLICANT AS “REVIEW NEEDED”
EXAMPLE 2: No Review Needed
Use the same example as above, except approve 1 more Black, so there were 6 Approved and 14 Denied. The denial rate would drop to 70%, and the T-Statistic would drop to 1.74.
THE MODEL WOULD CLASSIFY THE SAME TARGET INDIVIDUAL AS “NO REVIEW NEEDED”.
EXAMPLE 3: Manual Review
This simply means that there were too few comparators to perform the statististical test. IT DOES NOT NECESSARILY MEAN THAT THERE ARE NO GOOD COMPARABLE FILES. There may very well be good comparators listed for this Target applicant.
258

Decisioning Comparison by Race/Ethnicity
Chapter 16
Decisioning Comparison by Race/Ethnicity
Upon completion of this lesson you will master the skills necessary to:
Select a File Comparison Model.
Create Approved and Denied Classes.
Select File Comparison Factors.
Understand and Set Factor Tolerances.
Select the Appropriate Significance Level.
Review File Comparison Model Specifications.
Interpret File Comparison Summary Results.
View and Understand the Applicant Record Detail.
Use the File Comparison Visual Analysis.
View and Interpret Side-by-Side Comparisons.
259

Fair Lending Wiz Training Guide
Exercise 1: Creating a Comparative File Review Model
Scenario
You have now completed the Scoping part of your institution’s Fair Lending Review. There were several indicators of potential problems. You have also run the Decisioning and Pricing Regression models, and both of those models identified applicants that needed to be reviewed.
The comparative file review will be the last step in the process. Be sure to apply any filters created that remove erroneous data from consideration.
One of the techniques outlined in the Regression model was to ignore differences in Loan Type, Loan Purpose, etc., letting the model look at all loan types together. The comparative model is where such things as loan purpose, loan type, occupancy, property type, loan program, and the like are included and compared.
Activity 1
To create a Comparative File Review model, follow these steps:
1. Click the Filter button.
1.1 Click the Saved Filters tab.
1.2 Select the saved filter called Valid Data.
1.3 Click Apply.
260

Decisioning Comparison by Race/Ethnicity
2. In the View bar, click the Comparative File Review button.
3. Select Decisioning Com-parison by Race/Ethnicity.
4. Click Custom Comparison, then click Next.
Note:Standard File Comparison is another option if you have a stan-dard HMDA file with no addi-tional fair lending fields. The model will look for comparable files using only Type, Purpose, Loan Amount and Income.
Custom File Comparison will allow you to use any field that you have in your file when looking for comparators.
261

Fair Lending Wiz Training Guide
5. In the Step 2 - Selecting Approved & Denied Classes screen, accept the default selection, then click Next.
Note:The option at the bottom (Include Approved Loans in Tar-get Review) might be useful if you have very few minority deni-als. It would add minority approvals to the model, making the model an Approval/Approval comparison. This type of model would be looking at Terms and Conditions only.
6. In the Step 3 - Select File Comparison Factors screen, you will select the fac-tors that you want Fair Lend-ing Wiz to use when determining the matching loans (or comparators).
Match Factors - These are dis-crete values (i.e. 1,2,3,) making them easy to match exactly. Match factors are based on the character (string) fields in your file.
For example, when finding a match for a denied Home Purchase application, you would want to compare it only with loans that had the same underwriting standards. Comparing a Home Purchase application against a Home Improvement loan would not make sense. You would use the Purpose code as a Match Factor in this example.
Tolerance Factors - The factors possess continuous values, such as the range of loan-to-value ratios for applicants. They are called tolerance factors because they are rarely matched exactly and, therefore, require relationship boundaries to make comparisons. Tolerance factors are based on the numeric fields in your file.
For example, it would be difficult to find an exact match for an LTV of 78.85%.
262

Decisioning Comparison by Race/Ethnicity
7. To start the process of select-ing comparison factors, double-click the Mortgage folder under Match factors:
7.1 Select Loan Program
7.2 Select Loan Purpose
7.3 Select Loan Type
7.4 Select Occupancy
7.5 Scroll down to Lien Status
8. Continue with selections:
8.1 Select Lien Status
8.2 Select Property Type
8.3 Scroll down to Tolerance Factors
Note:The chosen variables appear in the box on the right side of the screen. In order to deselect a vari-able click on the variable on either side. To clear all, click the Clear Factors button.
9. Double-click the Mortgage folder under Tolerance fac-tors:
9.1 Open Credit Score
9.2 Select Custom Credit Score
9.3 Open Financial Ratios
9.4 Select LTV
9.5 Select Back End Ratio
9.6 Scroll down to the bottom
263

Fair Lending Wiz Training Guide
10. Continue with selections:
10.1 Select Loan Amount
10.2 Click Next
11. Review the columns avail-able on this screen.
Relation - You can select +/-, <=, >=, or =. The relation is important for building a benchmark/overlap comparative model.
Tolerance (%) - if applying a +/- percentage, this sets the over/under percentage that is applied to the target’s value (i.e. target loan amount is $100k, then +/- 10% would mean a compara-tor would have to fall in the $90K to $110k range)
Weight - ONLY USEFUL when +/- is selected and you are looking for the MOST “similarly-situated” comparator. In other words, if you are looking to find the MOST similar applicant out of the comparators, and you believe that credit score is the most important factor in determining who is most similar, then you could “bump up” the importance of that factor.
When using the model for a true benchmark/overlap analysis, it does not matter who is most similar. The best comparator might be the least qualified applicant, the one LEAST like the target, but who still was approved.
Compare by Date - these fields allow you to limit the potential comparable files by Application Date, Action Date, or Rate Lock Date, but you can select only one. This option is more useful when building a pricing model. If significant changes have occurred to your underwriting criteria, consider using File Management’s Copy with Filter to break up the file by date.
264

Decisioning Comparison by Race/Ethnicity
12. Set the Relationships and Tolerances as follows:
12.1 Loan Amount +/- 10%
12.2 LTV as >=
12.3 Back End Ratio as >=
12.4 Credit Score as <=
12.5 Click Next
Note:Except for Loan Amount, all of the factors are set to find less qualified applicants who got approved.
13. On the Step 5 - Specify Comparator Grouping screen, deselect Hispanic/Latino and Joint (Non Hisp/Hisp). Click Next.
Note:These settings set the default group for Target and Comparator applicants. They can be changed in the model. For now, Target applicants will be any minority race, and Comparators will be White non-Hispanics.
14. On the Step 6 - Specify Race Grouping screen, accept the default selection of No Grouping, Use all Races Separately. Click Next.
Note:Race Grouping was originally intended to allow FL Wiz to calculate the statistical tests dis-cussed in the overview. For a benchmark/overlap analysis, which is recommended, the statistics are not meaningful.
265
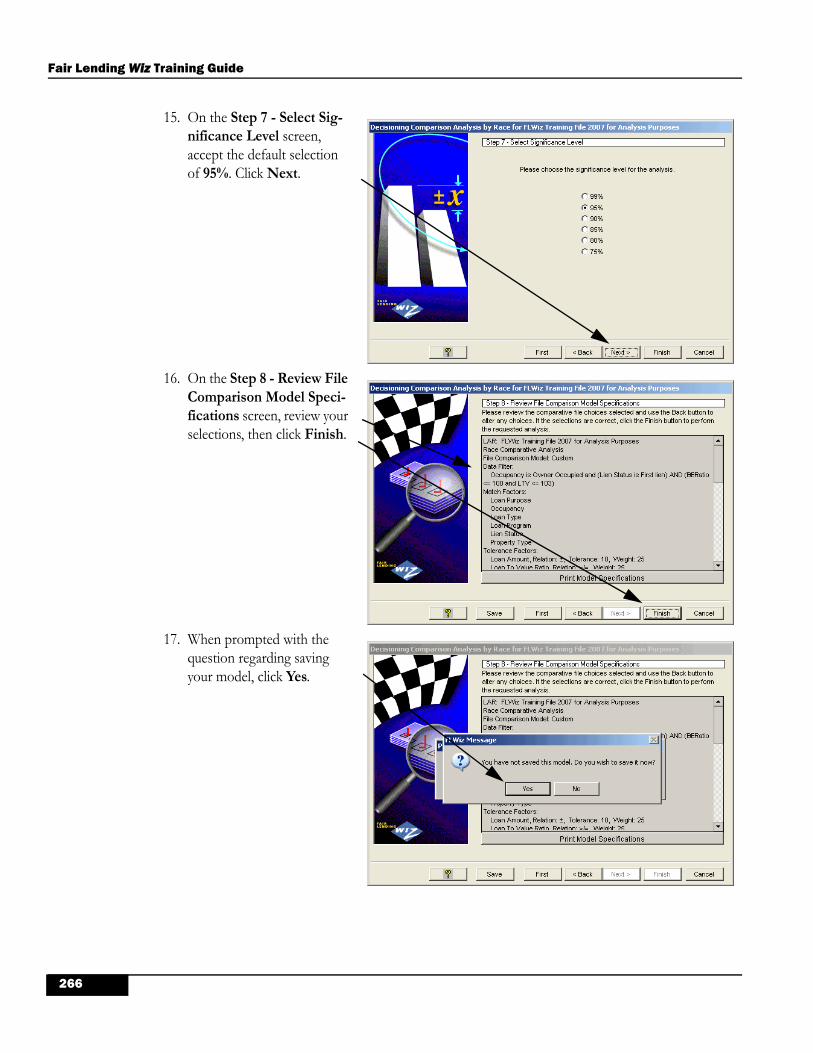
Fair Lending Wiz Training Guide
15. On the Step 7 - Select Sig-nificance Level screen, accept the default selection of 95%. Click Next.
16. On the Step 8 - Review File Comparison Model Speci-fications screen, review your selections, then click Finish.
17. When prompted with the question regarding saving your model, click Yes.
266

Decisioning Comparison by Race/Ethnicity
18. Enter the name Training 4 factors, click Save, then OK to the message.
267

Fair Lending Wiz Training Guide
Exercise 2: Analyzing the File Comparison Results
The File Comparison Sum-mary Results screen is broken down into four key areas to help you analyze the results accordingly.
1. Target Filters -allows you to filter your target applicants by race, ethnicity, or sex. You can also filter based on classifi-cation (see discussion in the Overview).
2. Target Applications - lists all of the target applications (minority denials) in this com-parative file review.
3. Comparator Filters - allows you to filter your comparator applicants by race and/or ethnicity. White is the default comparator class. You can change the comparator group, depending upon your needs.
4. Comparator Files - lists all comparable files identified by the model for the specific target applicant identified in section 1. The comparable files are also organized and displayed in five tabs:
All - displays all of the comparable files for the selected target applicant.
App. Comp. - displays all of the approved white comparators for the selected target applicant.
Den. Comp. - displays all of the denied white comparators for the selected target applicant.
App. Asian - displays all of the approved Asian comparators (because the target is Asian) for the selected target applicant.
Den. Asian - displays all of the denied Asian comparators (because the target is Asian) for the selected target applicant.
You can sort the target applications by any of the following columns by clicking on the column heading:
Application Number (default sort order)
Race/Ethnicity
Sex
Comparator
1. 2.
3. 4.
268
Decisioning Comparison by Race/Ethnicity
Activity 1
Scenario
You have already run a Decisioning Regression model that provided a list of “outliers”, identified as “Denied & Review”. Part of that list was provided in this manual in the Decisioning Regression chapter.
Your first priority should be to see if any of those Denied & Review applicants appear in this list with comparators. If so, you should review the denied applicants identified by both models, along with their com-parators.
Your second priority could be to see if there any Review Needed applicants.
Your third priority would be to scroll through the Target list of applicants, reviewing how many comparators each had and what their denial reason was.
Notes on the Number of Target and Comparator Applicants
Your goal in this kind of review is to review enough target and comparator applicants to fully understand the Fair Lending risks in your institution, if any are present. The scoping analysis you performed would let you know what APPARENT risks there were in your portfolio.
You can also refer to the examination procedures for recommended “sample” sizes for review, which are based on the number of denied protected-class applicants. The MINIMUM (assuming 5 to 50 prohibited basis denials) is to work ALL of those denials, along with 5 times the prohibited basis sample. The MAXIMUM (assuming over 150 prohib-ited basis denials) is to work 150 denials, along with up to 300 comparator files.
If you have too many target applicants with comparators, go back to the model and make it more restrictive (lowering tolerances, adding factors, etc.). If you have too few target applicants with comparators, go back to the model and make it less restrictive (raising tolerances, removing factors, etc.).
269

Fair Lending Wiz Training Guide
To start this review:
1. In the Comparator list win-dow, click on the App.Comp tab. Note that the first prohibited-basis group applicant is an Asian male, and there are no Approved Comparators for that applicant.
2. Click on the first applicant in the list, then use the down arrow on the keyboard to arrow down to the third applicant in the list (4701442622).
This applicant was a denied black female, and there are 4 approved comparators identified.
You might decide to review this applicant later, but first you want to look for the applicants identi-fied by the regression model. The first Asian Denied & Review identified by the regression model was applicant # 4701569518.
270

Decisioning Comparison by Race/Ethnicity
3. Click on the Slider beneath the list of target applicants. The program should be high-lighting the applicant ending in 622. Use the down arrow to move down through the list until you find 4701569518.
4. To familiarize yourself with this applicant, click the View button, then click OK.
4.1 What was the denial reason? __________
4.2 Review other information as desired.
4.3 With a denial reason of “other”, what do you look for to focus your review? ___________
5. Click the Credit & Finan-cial tab.
5.1 What was their Gross Income? ________
5.2 What was their LTV? _______
5.3 Back End Ratio? ______
5.4 Credit Score? ________
5.5 Click Cancel
271

Fair Lending Wiz Training Guide
6. Click on View once again. Select Comparators List and click OK.
Note that all of the match factors are indeed matching. The Loan Program, Loan Type, Purpose, Property Type, and Occupancy all match.
7. Highlight (click on) the Loan to Income Ratio line, which the institution might use as a part of their analysis.
7.1 Click the Right Arrow to move the next two approved loans into view, followed by the next two, etc., until you have reviewed them all.
7.2 If a loan-to-income ratio of 3.95 sounded high enough that you thought it might be a reason for denial, what was the highest LTI among the six approvals? ________
8. Click on the scroll down arrow (slowly) until the “CREDIT AND FINAN-CIAL INFORMATION” heading is at the top of the list.
8.1 Highlight the row with the Credit Scores.
8.2 What is the lowest credit score among the 8 approvals? _________
272

Decisioning Comparison by Race/Ethnicity
9. Review the other information for the Target denial and the 8 approvals. Can you find anything that might be the reason for denial? ___________________________________________________
10. Click the Cancel button. Click on the Slider below the list of Target applicants (this should highlight the application previously reviewed).
11. Use the Down Arrow key on your keyboard to move down three applications (to 4701571849).
12. Click the View button, then OK to select the Record Detail view.
12.1 What was the reason for denial? _____________
273

Fair Lending Wiz Training Guide
13. Click on the Credit & Financial tab.
13.1 The only information you have on Credit History is the credit score. What was the Credit Score used in the decision? ___________
13.2 While you are on this screen, what was this applicant’s LTV? _____
13.3 Back End Ratio? _________
13.4 Click the Cancel button.
Remember - the model was defined using the “worst-case” scenario. That is, all Comparators had to be less qualified in all three of these aspects (<= Credit Score, >= Back End Ratio, and >= LTV). Therefore, the 618 credit score had to be the BEST of the group.
To find the worst comparator, you could use the side-by-side comparison you used for the last applicant, or use the Visual Analysis.
Activity 2
Visual Analysis is an excellent tool. With it, you can search the comparators’ credit qualifications quickly and easily.
To review an applicants information in a visual manner, follow these steps:
1. With Application 4701571849 highlighted click the View button. Select Comparator Visual Analy-sis, then click OK.
274

Decisioning Comparison by Race/Ethnicity
The File Comparison Visual Analysis screen is now displayed. This screen shows the selected target applicant (the yellow square) as well all comparable files.
The screen displays a legend for the graph so that you can easily interpret what each color repre-sents.
The graph contains an X-axis which runs along the bottom of the screen and in this case repre-sents Loan Amount.
The Y-axis runs along the left side of the screen, in this case representing credit score. You have the abil-ity to change either the X or the Y-axis, or both, and redraw the graph.
You can also set filters for the graph that you are viewing. These filters are independent from the filters used in the Target and Comparator display that you just left.
2. To narrow the scope of your review, double-click the Fil-ters button, then:
2.1 Open Action
2.2 Select Approvals
2.3 Open Applicant Race
2.4 Select White (these are the comparator filters)
2.5 Open Applicant Eth-nicity
2.6 Select non-Hispanic
2.7 Scroll down to the bottom of the list.
275

Fair Lending Wiz Training Guide
3. Make the X-Axis the Cus-tom Credit Score.
3.1 Make the Y-Axis the Loan Amount.
3.2 Click the Redraw Graph.
4. Right-click in the square containing the Target and the Comparators (Loan Amount from 120 to 160, and Credit Scores from 560 to 700).
4.1 Select Zoom In from the contextual menu.
5. You already know that the Target’s credit score was 618, the Back End Ratio was 18, and the LTV was 65.
5.1 To review the Compara-tor who was the least qualified, click on the dot with the left-most credit score.
276

Decisioning Comparison by Race/Ethnicity
6. Click on the Credit & Financial tab:
6.1 What was this comparator’s credit score? ______
6.2 What was their Back End Ratio? _______
6.3 What was their LTV? _______
The question then becomes - why was the Target applicant denied, yet this comparator (who was less qualified in three major components) got approved?
You would have to open the Denied applicant’s file first, and carefully review all documentation, especially the underwriter’s and/or processor’s notes. What was the problem with the credit history that was not evident by the credit score?
DON’T STOP THERE! Review three comparator’s files, making sure the same problem did not exist with their credit history. A comparative file review is never complete after reviewing just the denial!
Note:The model you have worked on here was based on Race. To make it an Ethnicity model, you would remove all individual Races in the Target filter area, replacing them with Hispanic, and Joint Ethnicity. In the Comparator area, you would remove White, leaving just Non-Hispanic. IMPORTANT: Click the Recalc button after any change to the COM-PARATORS filters!
Classroom Discussion: Summary of the Comparative File Review Results
Based on the data that you have reviewed in the side by side list, record detail and visual analysis you have come to the following conclusions:
277

Fair Lending Wiz Training Guide
Exercise 3 (Optional): Exporting the Side-by-Side Comparison to Excel
Printing the side-by-side comparison takes a lot of paper. To be exact, 3 pages for every 3 comparators. Printing works fine for up to 9 to 12 comparators, but gets cumbersome with more than 12 or so.
The solution? Export the side-by-side list to Excel, do a little manipulation and formatting, and you have a 1 or 2 page document for your records.
These instructions are very detailed, allowing you to use Excel to its fullest potential.
Activity 1
To export to Excel, and use Excel to perform additional tasks for you, follow these steps:
1. Return to the list of Target applicants by clicking the Cancel button.
2. Click on the slider under the list of Target applicants to highlight the last Target applicant reviewed.
3. The list of target applicants is in numeric order. Scroll down the list (using the down arrow button or slider) to locate application number 4710028569 (an applicant identified by Decisioning Regression model).!
3.1 Note the 51 Compara-tors.
3.2 Click the View button.
3.3 Select Comparators List
3.4 Click OK.
278
Decisioning Comparison by Race/Ethnicity
4. With the Target and Com-parators list open, click the Export button.
5. Export settings:
5.1 File type - EXCEL
5.2 File Name - DC_race_4710028569
5.3 Location - click Ellipsis and select default loca-tion (c:\program files\PCi Corpora-tion\cra wiz and fair lending wiz 6.6 sp 1.1\fairwiz)
5.4 Click Select
5.5 Click Run Export
5.6 Click OK to message (file exported successfully)
6. Open Excel, click File > Open, and locate the file just created.
By default, the Target is listed as Compare2, and the first comparator is listed as Compare3. To make this as useful as possible, there are some changes that will be necessary.
279

Fair Lending Wiz Training Guide
7. Start the necessary changes:
7.1 Cell B1 - change to TARGET
7.2 Cell C1 - change to Comparator1
8. Move your cursor to the lower right corner of Cell C1 (you should see a plus sign appear).
8.3 Click and drag to the right until you cover all comparators (to cell BA1), then release the mouse click.
9. Your next task is to highlight all of the comparators and save them as a “named range”. Follow these steps to do this easily:
9.1 Press CTRL-G (same as Edit, Go To)
9.2 Click Special
9.3 Select Last Cell
9.4 Click OK
10. With the cursor in the last cell:
10.1 Press the F8 key (holds and expands the current selection)
10.1 Press CTRL-Home (expands selection to home)
10.1 Press and Hold the SHIFT key (holds selection while allowing additional selections)
280

Decisioning Comparison by Race/Ethnicity
10.1 Press the Right Arrow key twice (removes Column A and B)
11. All comparators should now be selected (highlighted). To establish and name the range where the comparators are:
11.1 Click in the Name Box (currently showing BA142), turning the existing cell name blue
11.2 Type in Comparators
11.3 Press Enter
11.4 Press the Esc key to stop the selection process
12. Select Column B by clicking on the column heading.
12.1 Click on the Fill Color icon in the tool bar (the paint bucket). Fill with Yellow.
13. To format each column to take only the width neces-sary:
13.1 Click the Select All but-ton
13.2 Click on the Format menu
13.3 Select Column > Autofit Selection
281

Fair Lending Wiz Training Guide
14. To freeze the spreadsheet so the field descriptions and Target applicant stay in view:
14.1 Click in Cell C2
14.2 Click the Window menu
14.3 Select Freeze Panes
Activity 2
You are now ready to use the spreadsheet to determine the best comparators for your review! To do that, you need to know a little bit about the Target applicant. The first thing to look for in a decisioning model is the reason for denial.
1. Look in Cell B17 for the rea-son for denial.
2. The reason for denial was credit history. Scroll down until you find what row con-tains the Credit Score (the Credit Score is in Row 63 in this example).
282

Decisioning Comparison by Race/Ethnicity
3. This Asian female was denied for credit history, yet her Credit Score was 721! To find the lowest credit score out of the 51 comparators:
3.1 FIRST (very impor-tant) - Select your com-parators by clicking on the name box, and selecting the range called Comparators.
4. Once the comparators ONLY are selected:
4.1 Click the Data menu, and select Sort.
4.2 In the sort dialog box, click Options.
5. Select Sort Left to Right, then click OK.
6. In the Sort by drop down list, select Row 63. Since you are looking for the lowest score, going to the highest, sort in Ascending order. Click OK.
283

Fair Lending Wiz Training Guide
7. You will almost always receive a Sort Warning. Choose the first option “sort anything that looks like a number, as a number”, then click OK.
8. You now have the lowest credit score next to the Tar-get (who was turned down for Credit History?). The lowest score for our approv-als was 566.
Note:User Defined Fields always appear at the bottom of the list.
OPTIONS:
Option 1: You can judgementally select which 3 to 5 comparators you want to review, then hide the rest of the columns.
Option 2: You can delete rows that aren’t being used. For example, in the picture above, Rows 61 and 62 do not have data in them and could be deleted. Row 60, however, contains the description of Row 63, so it is best to keep the category headings. On the other hand, if you wanted to keep the rows and fill in data manually on the printout, that would be useful.
Option 3: You can use a different Fill Color to highlight certain cells that you want to discuss.
284

Hands on Exercise - Decisioning Comparison
Chapter 17
Hands on Exercise - Decisioning Comparison
Upon completion of this exercise you will obtain the skills necessary to:
Create and analyze a Decisioning Comparative File Review model for Mortgage data.
285

Fair Lending Wiz Training Guide
Scenario for Mortgage data
There is no such thing as one right model. Your portfolio is not defined by one product and your fair lending review should not be limited to one view. The model that we built was a fairly standard, first-look type of model. It can find legitimate comparators for a fair portion of your lending.
If your institution is small, with only a few hundred HMDA applications per year, you may find it diffi-cult to find comparators.
If your institution is large (such as the training file), you may find too many Target applications and have to narrow down your search by “tweaking” the model.
Using any combination of the variables below, change the basic model to see what happens to the results. Don’t forget about the relation markers of </= and >/=. They can net you a host of different applicants and comparators to view.
Loan to Value Ratio
CLTV
Back End Ratio
Credit Score
Loan Amount
Applicant Income
Loan Program
Credit Tier (>= would work well with this factor)
Length of Residence
Length of Employment
Automated Underwriting method (AU) (could be used as a match factor)
Create a comparative file review model using any combination of factors from the list above. Once the model has been created, make any notes on the following pages. Take note of any issues detected or any conclusions that you have drawn, or observations you have made.
286

Hands on Exercise - Decisioning Comparison
Notes/Observations from the creation of the model:
Notes/Observations from analyzing the results of your model:
287

Fair Lending Wiz Training Guide
288
Pricing Comparison
Chapter 18
Pricing Comparison
Upon completion of this lesson you will master the skills necessary to:
Select a File Comparison Model.
Create Approved and Denied Classes.
Select File Comparison Factors.
Set Factor Tolerances.
Interpret File Comparison Summary Results.
View Applicant Record Detail.
Use the File Comparison Visual Analysis.
View and Interpret Side-by-Side Comparisons.
289

Fair Lending Wiz Training Guide
Exercise 1: Creating a Comparative File Review Model
Scenario
In the Scoping section of this manual, you ran the Difference of Means reports for this institution, and found some potential pricing issues. Blacks were charged 57 basis points more, on average, than whites, and Hispanics were charged 52 basis points more than non-Hispanics. Simi-lar findings appeared in the HMDA Scoping Reports.
The comparative file review, along with the regression model already run, will help confirm or deny whether any real problems exist.
Be sure to apply any filters created that remove erroneous data from consideration.
One of the techniques outlined in the Regression model was to ignore differences in Loan Type, Loan Purpose, etc., letting the model look at all loan types together. The comparative model is where such things as loan purpose, loan type, occupancy, property type, loan program, and the like are included and compared.
Activity 1
To create a Comparative File Review model, follow these steps:
1. Click the Filter button.
1.1 Click the Saved Filters tab.
1.2 Select the saved filter called Valid Data.
1.3 Click Apply.
Note:You should always compare prices on originated (approved) loans only. You could add it to the filter here, or filter to originations from within the model. Here, you will filter to originations within the model.
290

Pricing Comparison
2. In the View bar, click the Comparative File Review button.
3. Select Pricing Comparison.
4. Click Next to accept the default of Custom Compari-son.
Note:There is no “standard compari-son” for pricing. You can not perform a pricing analysis on a standard HMDA file.
291

Fair Lending Wiz Training Guide
5. In the Step 2 - Selecting Independent Pricing Fac-tor screen, accept the default selection, then click Next.
Note:Both APR and Note Rate vary over time, so are subject to time variances. Fees should not vary over time, and should be calcu-lated as a percentage, rather than a dollar amount. Rate Spread (raw rate spread) does not suffer from the time factor.
6. In the Step 3 - Select Pric-ing Comparison Factors screen, you will select the fac-tors that you want Fair Lend-ing Wiz to use when determining the matching loans (or comparators).
Match Factors - These are dis-crete values (i.e. 1,2,3,) making them easy to match exactly. Match factors are based on the character (string) fields in your file.
For example, when finding a match for a denied Home Purchase application, you would want to compare it only with loans that had the same underwriting standards. Comparing a Home Purchase application against a Home Improvement loan would not make sense. You would use the Purpose code as a Match Factor in this example.
Tolerance Factors - The factors possess continuous values, such as the range of loan-to-value ratios for applicants. They are called tolerance factors because they are rarely matched exactly and, therefore, require relationship boundaries to make comparisons. Tolerance factors are based on the numeric fields in your file.
For example, it would be difficult to find an exact match for an LTV of 78.85%.
292

Pricing Comparison
7. To start the process of select-ing comparison factors, double-click the Mortgage folder under Match factors:
7.1 Select Loan Program
7.2 Select Loan Purpose
7.3 Select Loan Type
7.4 Select Occupancy
7.5 Scroll down to Lien Status
8. Continue with selections:
8.1 Select Lien Status
8.2 Select Property Type
8.3 Scroll down to the bottom of the list
The chosen variables appear in the box on the right side of the screen. In order to deselect a vari-able click on the variable on either side. To clear all, click the Clear Factors button.
9. Double-click the User Defined Variables under Match factors:
9.1 Select AU (Automated Underwriting system)
9.2 Select Fix_Arm (text field using A for ARM and F for Fixed)
9.3 Scroll down to the bottom
293

Fair Lending Wiz Training Guide
10. Continue with selections:
10.1 Open the Mortgage folder
10.1Open Credit Score
10.2 Select Custom Credit Score
10.3 Open Financial Ratios
10.4 Select LTV
10.5 Scroll down to the bottom
11. Continue with final selec-tions:
11.1 Open Loan/Application
11.1 Select Loan Term
11.2 Select Loan Amount
11.3 Click Next
12. Review the columns avail-able on this screen.
Relation - You can select +/-, <=, >=, or =. The relation is important for building a Terms and Conditions comparative model.
Tolerance (%) - if applying a +/- percentage, this sets the over/under percentage that is applied to the target’s value (i.e. target loan amount is $100k, then +/- 10% would mean a compara-tor would have to fall in the $90K to $110k range)
294

Pricing Comparison
Weight - ONLY USEFUL when +/- is selected and you are looking for the MOST “similarly-situated” comparator. In other words, if you are looking to find the MOST similar applicant out of the comparators, and you believe that credit score is the most important factor in determining who is most similar, then you could “bump up” the importance of that factor by doubling, or quadrupling the weight.
When using the model for a “terms and conditions” analysis, it does not matter who is most similar. The best comparator might be the least qualified applicant, the one LEAST like the target, but who still received a lower price.
Compare by Date - these fields allow you to limit the potential comparable files by Application Date, Action Date, or Rate Lock Date, but you can select only one. This is a very important factor when building a valid pricing model.
13. Set the Relationships and Tolerances as follows:
13.1 Loan Amount as +/- 25%
13.2 LTV as >=
13.3 Loan Term as =
13.4 Credit Score as <=
13.5 Rate Lock Date as+/- 30
13.6 Click Next
Note:Except for Loan Amount and the Rate Lock Date, all of the factors are set to find less qualified applicants who received a better price.
14. On the Step 5 - Select Sig-nificance Level screen, accept the default selection of 95%. Click Next.
295

Fair Lending Wiz Training Guide
15. On the Step 6 - Review File Comparison Model Specifications screen, review your selections, then click Finish.
16. When prompted with the question regarding saving your model, click Yes.
17. Enter the name Training 4 factors + RLD 30, click Save, then OK to the message.
296

Pricing Comparison
Exercise 2: Setting the Model to be a “Race” Model
In the Decisioning Comparative model, you had a chance to set the default Race and Ethnicity for both the Target applicant and the Com-parator applicants before running the model.
In the pricing model, there was no option to do this ahead of time. Instead, EVERY borrower was compared to EVERY OTHER bor-rower. 100% of the loans with valid data are included in the model’s results.
It is up to you to determine whether the Target borrowers should be based on Race, Ethnicity, or Sex.
The following steps will set up this model to compare every minority borrower (Native American, Asian, Black, Hawaiian, 2 or more Minorities checked on the application, and Joint Race applicants) against White Non-Hispanic borrowers.
1.Target Filters - use to filter to a specific Classification, Action, Race, Ethnicity, and/or Sex.
2. Target Borrowers - target borrowers list.
3. Comparator Filters - use to filter the Comparators to a specific Action, Race, Ethnic-ity, and/or Sex.
4. Comparator List - for the specific Target borrower selected in the Target Borrower list.
5. Comparator Statistics - number of comparators for selected Target borrower, Average Price, Stan-dard Deviation for the comparators.
1. 2.
3. 4.
5.5.
297
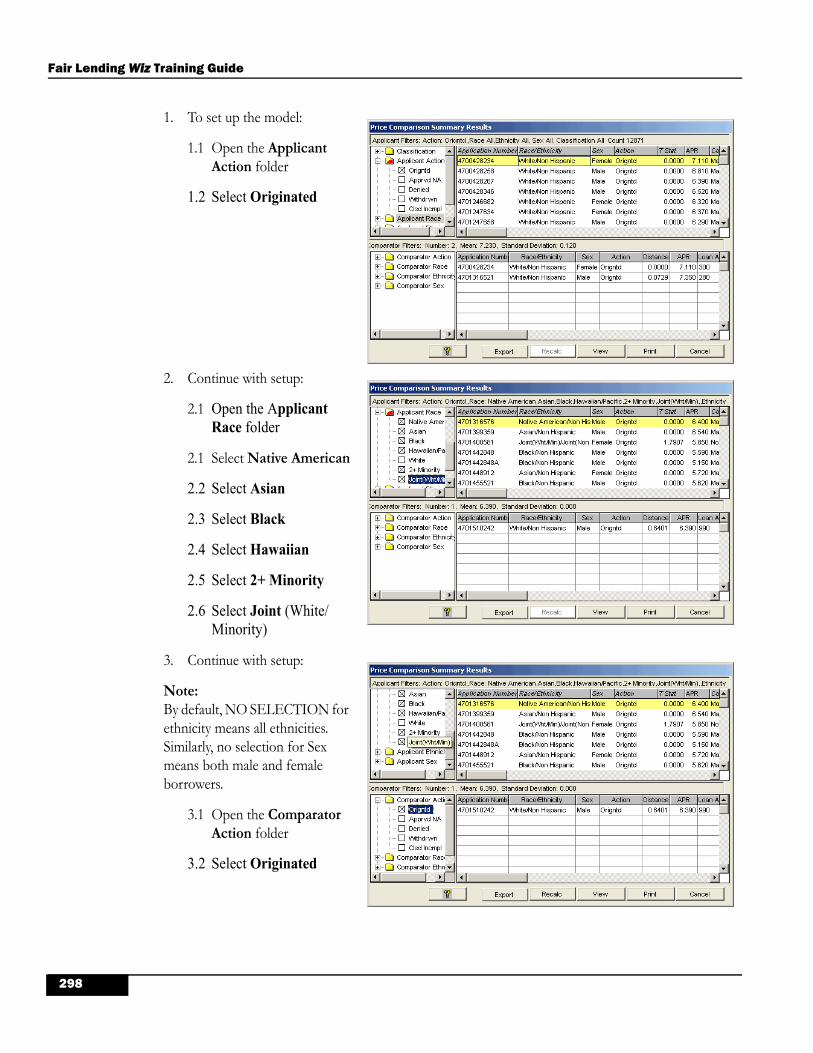
Fair Lending Wiz Training Guide
1. To set up the model:
1.1 Open the Applicant Action folder
1.2 Select Originated
2. Continue with setup:
2.1 Open the Applicant Race folder
2.1 Select Native American
2.2 Select Asian
2.3 Select Black
2.4 Select Hawaiian
2.5 Select 2+ Minority
2.6 Select Joint (White/Minority)
3. Continue with setup:
Note:By default, NO SELECTION for ethnicity means all ethnicities. Similarly, no selection for Sex means both male and female borrowers.
3.1 Open the Comparator Action folder
3.2 Select Originated
298

Pricing Comparison
4. Continue with setup:
4.1 Open Comparator Race
4.2 Select White
5. Continue with setup:
5.1 Scroll down
5.2 Open Comparator Ethnicity
5.3 Select Non Hispanic
5.4 Click the Recalc button
6. Place your cursor in the first line of text (above the list of target applicants).
6.1 Press the End key on your keyboard
6.2 How many total Tar-get applicants are there before you filter to a specific classifica-tion? ______________
299

Fair Lending Wiz Training Guide
7. In the Target filters box, scroll up to the top.
7.1 Open the Classification folder
7.2 Select Review Needed
Review Needed - those borrowers who received a price outside (both higher and lower) of the expected price range, based on the AVERAGE of the comparators that it identified for that borrower.
Manual Review - the program could not perform the statistical test because there were either no comparators, or too few to perform the statistical test.
No Review Needed - there were enough comparators to perform the statistical test, and the Target borrower’s price was within the expected price range.
8. Click in the first line of text again, and press the End key on your keyboard. How many Target applicants who were both UNDER-CHARGED and OVER-CHARGED? _________
300
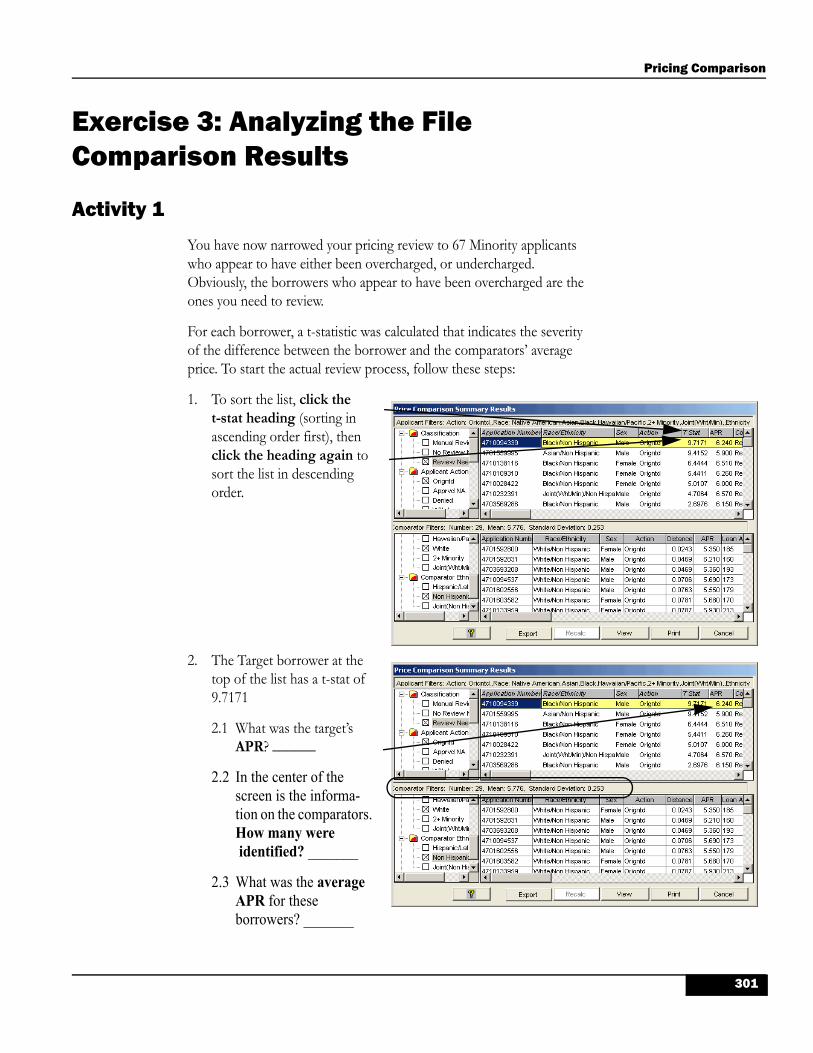
Pricing Comparison
Exercise 3: Analyzing the File Comparison Results
Activity 1
You have now narrowed your pricing review to 67 Minority applicants who appear to have either been overcharged, or undercharged. Obviously, the borrowers who appear to have been overcharged are the ones you need to review.
For each borrower, a t-statistic was calculated that indicates the severity of the difference between the borrower and the comparators’ average price. To start the actual review process, follow these steps:
1. To sort the list, click the t-stat heading (sorting in ascending order first), then click the heading again to sort the list in descending order.
2. The Target borrower at the top of the list has a t-stat of 9.7171
2.1 What was the target’s APR? ______
2.2 In the center of the screen is the informa-tion on the comparators. How many were identified? _______
2.3 What was the average APR for these borrowers? _______
301

Fair Lending Wiz Training Guide
3. The fastest way to compare the Target borrower’s selected pricing factors against the 29 Comparators’ factors is the Visual Analysis. To do this
3.1 Click the View button.
3.2 Select Comparator Visual Analysis
3.3 Click OK.
4. In the lower left corner is a box with the number of borrowers on the visual analysis graph. Click the Redraw Graph button to apply the previously defined filters.
5. There are 30 borrowers on the graph. Click on the Target borrower (the Yel-low Square).
What was the Loan Amount? ______
What was the rate lock date? ______________
What was the APR? ______
What was the Lien Status? _____
302

Pricing Comparison
6. Click on the Credit & Financial tab
What was the Credit Score? ____
What was the LTV? ______
6.1 Click Cancel.
7. For these graphs, the Y-Axis is whatever the pricing vari-able is (in this case - APR). The X-Axis can be adjusted to any of the factors chosen as Tolerance Factors. By def-inition (and depicted in the graph) the Target’s loan amount was in the middle of the group.
8. According to the Regression model, the LTV was slightly more important to pricing than the credit score was.
8.1 Select Loan-to-Value from the options
8.2 Click Redraw Graph
8.3 ALL of the comparators had the same or higher LTV as the Target. Would the most inter-esting for review be the borrowers with LTVs in excess of 80%, where the price should be higher?
303

Fair Lending Wiz Training Guide
9. Select Credit Score from the X-Axis options.
9.1 Here, the borrowers with the lowest credit scores, and lowest price, would be of interest for review.
9.2 Click on the indicated borrowers.
10. Since there are multiple bor-rowers in the same spot, select the White Male appli-cant, then click OK.
11. For this borrower:
11.1 What was the APR? ________
11.2What was the rate lock date? __________
11.3 What was the Loan Amount? ________
304

Pricing Comparison
12. Click on the Credit & Financial tab:
12.1 What was the LTV? _______
12.2 What was the Credit Score? _______
12.3 Click Cancel.
Activity 2
You now want to review in more detail the second target applicant. The application number is 470155995. The most efficient way to review all variables for the Target and Comparators is to look at a side-by-side comparison. This will allow you to see at a glance if there are obvious reasons for a difference in pricing.
To review a specific target applicant in a side-by-side comparison with comparable files, follow these steps:
1. Highlight application 470155995.
1.1 Click the View button.
1.2 Select Comparators List.
305

Fair Lending Wiz Training Guide
2. Select the row with APR and use the arrow keys to move through the compara-tors.
What is the highest APR for the comparators? ______
Was there a difference between the Note Rates for the two borrowers? ________
Was there a difference between the Rate Spreads for the two borrowers? ________
Was there a substantial difference in the Fees for the two borrowers? _______
3. Find the borrower with the LOWEST APR (5.42).
Was there a difference in the Note Rate between the two borrowers? _______
Was there a difference in Rate Spread? ______
Was there a difference in Fees? ________
4. Keeping the same columns, scroll down until Credit & Financial Information appears at the top.
4.1 Highlight the Credit Score (Other) line.
4.2 Was there a substantial difference in the credit scores? _______
4.3 LTVs? _______
4.4 Do you see anything that could explain the difference in the APR? _______
306

Pricing Comparison
Classroom Discussion: Summary of the File List Comparison Screens
You have reviewed two target borrowers that had higher APRs than their comparator files. You reviewed several factors that might have contributed to those situations.
What conclusions can you draw from the information you have reviewed?
307

Fair Lending Wiz Training Guide
Test Your Knowledge
Scenario
Convert the model to be based on Sex, rather than based on Race.
Be sure all Races are cleared.
Be sure that Ethnicity is not checked for either the Target or Comparator list.
Be sure to click the Recalc button when you have made the changes.
Be sure you are reviewing loans classified as Review Needed.
Be sure you have sorted in Ascending order by t-statistic.
Analyze the female borrower at the top of the list (highest t-statistic).
Note your observations here regarding that borrower and her male comparators.
_____________________________________________________________________________
______________________________________________________________________________
_____________________________________________________________________________
_____________________________________________________________________________
_____________________________________________________________________________
_____________________________________________________________________________
Classroom Discussion: Summary of the Test Your Knowledge Results
After reviewing the target applications above, what conclusions were reached?
308

Hands on Exercise - Pricing Comparison
Chapter 19
Hands on Exercise - Pricing Comparison
Upon completion of this exercise you will obtain the skills necessary to:
Create and analyze a Pricing Comparative File Review model for Mortgage data.
309

Fair Lending Wiz Training Guide
Scenario for Mortgage data
Just as in the Decisioning Model, there is no such thing as one right model. Your portfolio is not defined by one product and your fair lending review should not be limited to one view. The model built for pric-ing in the last chapter was fairly standard, but it did not encompass every pricing variable. It found a few Target borrowers with comparators, and the comparisons seemed reasonable.
If you come from a small institution, with only a few hundred HMDA applications per year, you may find it difficult to find comparators.
If you come from a large institution (such as the training file), you may find too many Target applications and have to narrow down your search by “tweaking” the model.
Using any combination of the variables below, change the basic model to see what happens to the results. Don’t forget about the relation markers of </= and >/=. They can net you a host of different applicants and comparators to view.
Loan to Value Ratio
CLTV
Credit Score
Credit Tier (you should never use both this and Credit Score in the same model)
Loan Amount
Loan Program
Length of Residence
Length of Employment
Automated Underwriting method (AU) (could be used as a match factor)
Arm-Fixed (use as a match factor)
Loan Term (use as “equal to” in tolerance)
Create a comparative file review model using any combination of factors from the list above. Once the model has been created, make any notes on the following pages. Take note of any issues detected or any conclusions that you have drawn, or observations you have made.
310

Hands on Exercise - Pricing Comparison
Notes/Observations from the creation of the model:
Notes/Observations from analyzing the results of your model:
311

Fair Lending Wiz Training Guide
312

Best Practices for Comparative File Review
Chapter 20
Best Practices for Comparative File Review
Upon completion of this lesson you will identify recommendations for conducting a successful comparative file review. These suggestions include:
Setting goals prior to starting a Comparative File Review
Understanding your underwriting criteria
Understanding what data is being collected
Completing the scoping work
Building models
Reviewing the results
Presenting your conclusions
313

Fair Lending Wiz Training Guide
Overview
It is very difficult to find or create one set of best practices that applies to all institutions regardless of size. Even if such a standard existed and was followed there is no guarantee that it would accomplish what your specific goals would be in conducting a comparative file review. Comparative File Review was always intended to be an interactive pro-cess whereby you are constantly refining your hypotheses and your models.
Whether you have years of experience in conducting a comparative file review, or are new to the process the steps detailed below are designed to give you a starting point for building or maintaining your comparative file review program. As you review these suggestions feel free to add anything that is specific to you and your institution making these best practices more specific to you needs.
Best Practices
1. Set goals and develop hypotheses.
While it is certainly possible to have only one comparative file review model, a robust comparative review program has many goals, each one requiring one or more models.When conducting this type of analysis, it may require the creation of multiple models depending on the product and the results.
It is not enough to say you want to run a decisioning comparative file review. Based on the results you uncovered when reviewing your risk factors, you want to follow those lines of thought to their natural conclusions. If there were no focal points revealed through scoping consider the following questions:
What am I trying to achieve?
What do I expect to find?
Am I looking for something specific?
Is there anything that I want to verify?
Having hypotheses will give you something to prove and provide more clarity to the comparative file review process. For example, if you know that you have a high denial rate to Hispanic applicants, you may want to verify that every Hispanic applicant was treated fairly. This is true regardless of whether treatment of Hispanics becomes a focal point.
314

Best Practices for Comparative File Review
2. Understand your underwriting and pricing standards
Before you begin creating models, you need to be clear on your underwriting criteria. Answer questions such as:
Do the underwriters at this institution use different variables to make decisions for home improvement loans than for home purchase loans?
Do we have different standards for different products, but use the same variables? In other words, does our first-time homebuyers product use the same underwriting factors, but allow a higher DTI, for example? If so, using loan product as a match factor should alleviate these differences.
Do we have certain products that do not rely on typical credit models?
The answers to questions such as these may require research on your part. Talk to your underwriters, loan officers, and credit policy analysts to receive any insight that they might have in answering such questions. Be sure to read any written guidelines or policies that may be beneficial when it comes to understanding products under review.
Positive answers to these questions are another indication of a need for multiple comparative file review models. Remember that you want to review each product on it’s own merit as well as each underwriting center.
3. Review the data being collected
Although creating, saving, and restoring models can be a simple process in Fair Lending Wiz, you do not want to start building models only to discover that you do not have the key data elements captured in Fair Lending Wiz or, in some cases, captured electronically at all. Knowing in advance what data you will or will not be able to use can help you develop realistic expectations as to your time commitment for this process.
For example, if you have access only to HMDA submitted data and you are a large lender, you will be spending a fair amount of time not only refining your model, but also pulling paper files since you won’t have the electronic evidence to discard a target applicant. This translates to a significant investment in time, though considerably less than if you had to find the targets and comparators through an entirely manual process.
However, if you have a significant number of credit variables available, not only will you create a more realistic set of comparable applicants, but also you have the opportunity to eliminate target applicants by reviewing their electronic data. You may be able to see the mitigating factors that made the difference in the decision or the price.
The task of determining the location of all the necessary data elements can be a daunting task. But at the same time, it is an excellent opportunity to get to know areas of your institution with which you may not have interacted with traditionally. It will also give you an opportunity to shape the direction of electronic data collection throughout the institution.
315

Fair Lending Wiz Training Guide
4. Bring into Fair Lending Wiz as many underwriting variables and mitigating factors that relate to your credit decisions and pricing decisions.
While the need for underwriting variables is apparent, the mitigating factors or flags are less obvious. These flags are fields in your file that usually require a yes/no answer and may involve questions like:
Is the applicant an existing customer?
Is the applicant self-employed?
These flags may also be used as additional match factors. For example, you may have a flag or a code to indicate whether a loan is fixed or an adjustable rate. This may make an excellent match factor so that you can be certain that your comparable applicants are truly the same.
While we supply you with guidelines for factors, it is critical that you bring in the variables that are important in your institution’s underwriting credit decisions.
At the same time, resist the temptation to bring in every variable being captured by your system unless you know what the variables are and how you plan on using them. Otherwise you will spend too much of your time attempting to identify factors that have no relevance to the decision or price of the loan.
5. Complete your scoping work.
This goes back to the first point. The end result of completing the scoping analysis is a series of hypoth-eses that you will use comparative file review to disprove. If you start with a premise, your approach will be consistently logical.
If your scoping reveals nothing significant, it doesn’t mean that you can forgo comparative file review. It merely means that you must develop your own hypotheses based on your understanding of your loan portfolio. If you are new to the institution, this is an excellent way to become familiar with your lending patterns and to review areas where there are no problems. This will give you the opportunity to do a data integrity check while you review your results.
6. Start building your models.
Don’t be afraid to spend a considerable amount of time creating your models. Although by this point you should have done your research as to which factors are critical, remember that this is supposed to be an iterative process.
Your first model is unlikely to be successful. You may end up with too many targets and comparators or you may not end up with enough. Look at your results. Did you create genuinely comparable applicants? If you have too many applicants that appear to have valid comparators, do a sample file review of the first few and see which variables would have eliminated the target from contention. Can you add those variables to your model?
7. Review your results.
The results of your scoping analysis will tell you whether you need to start with a Race, Ethnicity, Sex, or Age comparisons. Use those results to test your model. Are your Review Needed applicants coming from the pool indicated by the scoping results?
316

Best Practices for Comparative File Review
Take the results to the underwriters. Do they agree that these targets and comparators are comparable? If not, why not?
For any review, look for the Target applicants identified by both the Regression Model and the Compar-ative Model. Are the applicants identified as Review Need by the Decisioning Regression model listed as a Target applicant with comparators in the Decisioning Comparative model? Similarly, are the applicants listed as Above Predicted in the Pricing Regression model identified as Review Needed in the Pricing Comparison model?
Review Needed targets might be a good place to start. Please remember that for the Decisioning Com-parison model, the fact that there aren’t Review Needed Target applicants does not mean that you are done with the model. Go through each potential Target applicant and see if there are comparators listed for that individual.
For Pricing, the Review Needed loans are the ones you need to review. If there aren’t any identified, go back and tweak the model by widening tolerances, removing variables, etc., until you get to a point where any identified comparators wouldn’t be worth pursuing.
Keep in mind that it is not enough to only review the target applications. You must also review the comparators. If the target applicant can seemingly be explained away by another data element that was not in the model, you may want to create another model, including that data element possibly with a >/= or </= relationship. If the applicant still returns as a Review Needed, even when controlling for the new factor, then this applicant may need further review.
Pull files for any target applicant that isn’t easily explained by the electronic file. If the explanation is a data element that isn’t being electronically captured, check the originated comparators to ensure that they don’t test positive for the same element.
8. Discuss Potential Issues with Another Party.
Discuss any potential issues with another party within the bank who was not involved in the underwrit-ing or pricing decision. Do your conclusions make sense?
9. Present your conclusions to Management.
Assuming that you had Risk Factors (Focal Points) that appeared during your scoping review, the purpose of your review is to either prove or dis-prove that the Risk Factors actually carry risk for your institution. Did your file review reveal any issues that could not be satisfactorily explained away? If so, what should be done?
Be prepared to present the following to senior management or legal counsel:
An outline of your methodology
The initial findings that led to your hypotheses
The factors that were contained in your models
The results produced by your models
317

Fair Lending Wiz Training Guide
The conclusions you reached after your file review and discussions with appropriate individuals
Recommended corrective action for the unexplained decisions or pricing variances
Future strategies for mitigating the risks found
10. Additional notes
You may want to work with your legal counsel throughout this process. Your results, if done through file reviews, are considered a self-assessment, and can not be protected by attorney/client privilege. The results should be turned over to your examiners. If done properly, and documented well, the examiners will use your work to perform a streamlined examination of their own.
318

Focal Point Report
Chapter 21
Focal Point Report
Upon completion of this chapter you will obtain the skills necessary to:
Create a Focal Point Report from Models Previously Produced
Understand the Focal Point Report
Explain the Focal Point Report to Management
319

Fair Lending Wiz Training Guide
Overview
The Focal Point Report is a single report that attempts to summarize the findings made throughout your Fair Lending Review. The entire report, except for the denial ratios column, includes originated loans only.
The Focal Point Report focuses on prohibited basis groups, and breaks the risks into four sets of columns:
Marketing - by summarizing your distributions of originated loans
Underwriting - by summarizing the Denial Rates and the results of the Decisioning Regression Model
Risk - by summarizing each group’s average Credit Scores, Loan-to-Value Ratios, and Debt Ratios
Pricing - by summarizing these reports:
Above HMDA Reportable Thresholds
Difference of Means results for APR, Note Rate, and the difference between these two pricing variables (representing fees)
The Pricing Regression Model results
By having one report serve as a summary for the overall HMDA-LAR, as well as for each product category (Home Purchase, Home Improvement, Refinance), it is easier to make sense out of the dozens of reports that have been run for each category.
320

Focal Point Report
Exercise 1: Creating the Focal Point Report for the Overall LAR
The first focal point report to run should always be the “overall” report. This will summarize the risks seen in your entire portfolio. Following the overall report, you would have a report for each Loan Type and Purpose where your institution has substantial volume.
Keep in mind that your regulator, as well as outside community groups, will not have access to all of the information contained in the focal point report. For example, they will be able to see your declination ratios and the Above HMDA Threshold percentages, but will not have the actual APRs or Note Rates. Also, they will not have Credit Scores, Loan-to-Value Ratios, or Back End Ratios.
This report is for internal use, and for sharing with your regulator if you are so inclined. This report exhibits the types of tests that you are per-forming on your portfolio on an ongoing basis.
Note:Your goal is to have the Focal Point Reports match the individual Risk Factor reports already run. If you applied filters for different reports, you would need to apply the same filter before running the Focal Point Report.
Our recommendation is to have elements of the report based on the ENTIRE portfolio, with no filters applied. For example, the declination ratios should reflect all applications received, not just those with valid credit scores.
If you applied filters to remove erroneous data from your regression models, you would want the same filter to be applied before running the Focal Point Report that would include your Regression Results.
1. Make sure all previously applied filters are cleared (Filter, Clear, Apply)
321

Fair Lending Wiz Training Guide
2. In the View bar, click on Focal Report.
3. Click the link to activate the Focal Point Report wizard.
4. The first step of the Wizard provides a brief description of the components of the Focal Point Report. Click the Next button.
322

Focal Point Report
5. Conditional formatting can be used to highlight certain facts. Click Next.
Loan distribution - highlight if 2.5% of originations or less.
Declination Ratio - highlight if denial ratio is 2 to 1 or higher.
Regression Denied & Review - highlight if 2 to 1 or higher.
Pricing - highlight if .25% higher (or more).
Pricing Regression Above Pre-dicted - highlight if 2 to 1 or higher.
6. This screen has five buttons that must be selected in order:
6.1 Pricing and Risk Factors
6.2 Decisioning Regression
6.3 Pricing Regression
6.4 Pricing Disparity (HMDA Threshold Report)
6.5 Focal Point Report (the “finish” button)
6.6 Click on the Pricing and Risk Factors button.
323

Fair Lending Wiz Training Guide
7. The next step is to gather the proper fields to be used to obtain the APR, Note Rate, Credit Score, LTV, and Back End Ratio. Click Retrieve Pricing and Risk Factors, as these are the proper fields for this file.
Note:If your file’s Credit Score is stored in Beacon (or Fair_Issac), be sure to use the drop-down list and select the appropriate field.
If you want to use CLTV instead of LTV, select that field.
If any piece of data is missing from your file, then uncheck it here, and it will not be included in the analysis.
8. The next step is to select the saved Decisioning Regres-sion model (or create one from scratch). Click the Decisioning Regression button.
Note:Again, if special filters were applied when you produced the original Regression model, you would uncheck the Regression model here.
If that was the case, you would then run a second Focal Point Report with the filter applied.
324

Focal Point Report
9. Select the Custom Regression option, then click Restore.
10. Highlight the model already created (Model - 4 factors), then click Restore.
11. Click the Finish button to run the Regression Model (which will capture the results in the Focal Point Report).
325

Fair Lending Wiz Training Guide
12. The Decisioning Regression model shows “Complete” to the right. Click the Pricing Regression button.
Note:If you had applied special data filters before running your original Pricing Regression model, then be sure to UNCHECK the model here.
You would run a second Focal Point Report with the filter applied, so the results would match.
13. Click the Custom Pricing Model option, then click Restore.
14. Select Training Model 6 Factors then click the Restore button.
326
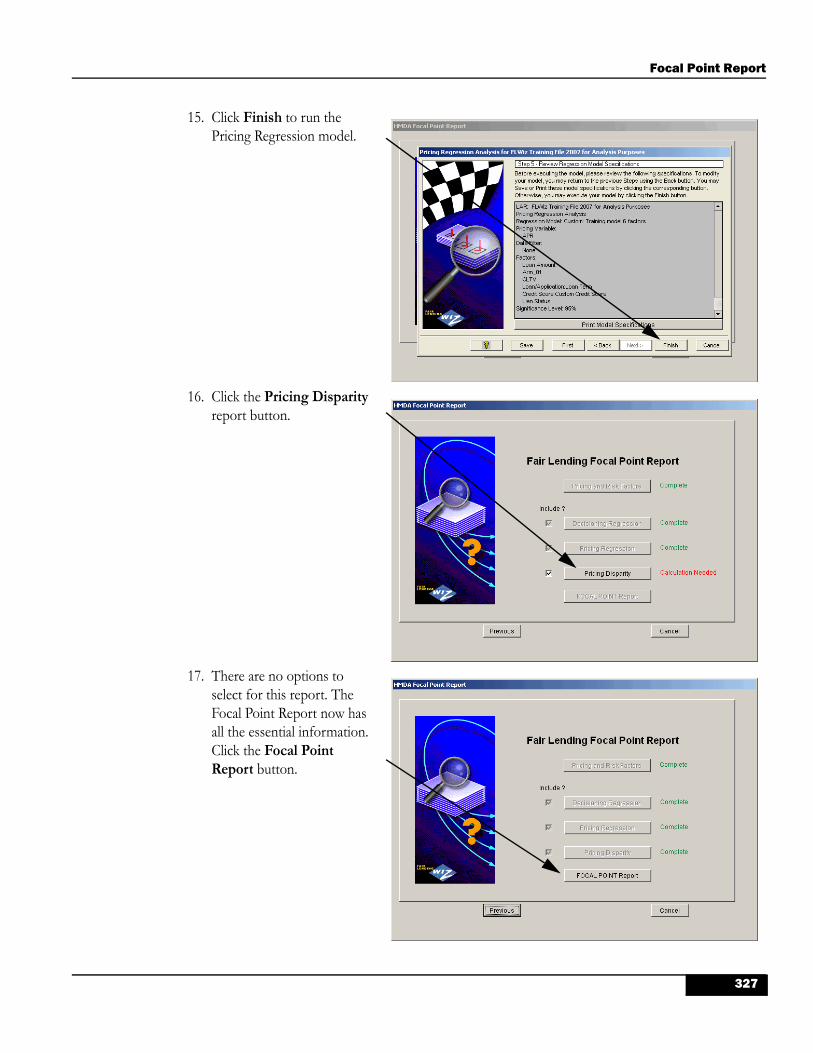
Focal Point Report
15. Click Finish to run the Pricing Regression model.
16. Click the Pricing Disparity report button.
17. There are no options to select for this report. The Focal Point Report now has all the essential information. Click the Focal Point Report button.
327

Fair Lending Wiz Training Guide
328

Focal Point Report
Exercise 2: Interpreting the Focal Point Report
The Focal Point Report will be between 2 and 3 pages, depending upon the options selected.
Page 1 has the following borrower categories:
Total Applications
Applicant Race
Applicant Ethnicity
Applicant Sex
Applicant Age
Page 2 has the following borrower categories:
Applicant Income
Tract % Minority
Tract Income
329

Fair Lending Wiz Training Guide
#O
rig
inat
ed
% o
f T
ota
l
Mar
keti
ng
Un
der
wri
tin
gR
isk
Pri
cin
g
Fai
r L
end
ing
"FO
CA
LP
OIN
T"
Rep
ort
Dec
lin
atio
n
Lo
ans
Rat
ioto
Co
ntr
ol
Gro
up
Dec
isio
nin
gR
egre
ssio
n
Res
ult
s:D
enie
d
&R
evie
w%
Ro
w+
/ -
Tar
get
+ /
- T
arg
et+
/ -
Tar
get
Th
resh
old
Rat
ioto
Co
ntr
ol
Gro
up
Ab
ove
HM
DA
Pri
cin
gR
egre
ssio
nR
esu
lts:
Ab
ov
Pre
dic
ted
%R
o
To
tal
FL
Wiz
Tra
inin
gF
ile20
07fo
rA
nal
ysis
Pu
rpo
ses
Filt
er:
No
ne
Ave
rag
e
Cre
dit
Sco
re
Ave
rag
e
LTV
Ave
rag
eB
E
Rat
io
Ave
rag
e
AP
R
Ave
rag
eN
ote
Rat
e
Ave
rag
eA
PR
-N
ote
Rat
e
Tot
al14,6
89
100.0
0-
721.6
769.7
838.2
66.3
00.8
32.9
4.0
-5.4
70.0
00.0
0-
Tota
lA
pplic
ations
App
lica
ntR
ace
39
709.5
758.3
140.0
36.9
10.7
1-
6.2
0-0
.13
0.27
3.69
7.7
11.7
0.62
0.75
Am
erican India
n / A
laska
Native
248
730.7
074.7
239.6
76.4
00.8
03.4
1.2
85.6
00.1
10.1
5-0
.04
1.69
2.18
12.0
Asia
n
525
3.5
7677.7
576.2
039.0
16.5
50.8
72.4
25.6
80.2
30.0
32.
095.
59.
10.
26B
lack
or
Afr
ican
Am
erican
51
717.6
072.0
041.6
06.7
10.9
46.5
3.1
15.7
70.1
00.
352.
196.
10.
420.
32N
ative
Haw
aiia
n / P
acific
Isla
nder
12,1
18
82.5
0-
723.6
969.3
438.1
96.2
90.8
42.6
3.8
1.0
05.4
50.0
00.0
0-
White
4718.6
798.3
347.6
77.2
40.5
7-
6.6
7-0
.27
0.03
3.35
33.3
33.3
0.95
1.22
2or
More
Min
ority
Races
181
0.9
0711.6
574.6
137.7
86.3
30.7
81.4
4.0
0.8
75.5
50.0
40.1
0-0
.06
1.23
Join
t(W
hite/M
inority
Race)
App
lica
ntE
thni
city
597
4.0
6690.1
175.1
740.0
16.5
50.9
24.4
6.0
1.9
65.6
30.1
70.0
92.
280.
26H
ispanic
or
Latino
12,3
19
83.8
7-
723.3
369.4
138.2
16.2
90.8
32.8
3.9
1.0
05.4
60.0
00.0
0-
NotH
ispanic
or
Latin
o
171
1.1
8710.2
077.3
036.4
06.5
80.8
02.4
6.9
0.9
15.7
8-0
.03
1.16
0.29
0.32
Join
t(H
isp
or
Lat/N
otH
isp
or
Lat)
App
lica
ntSe
x9,7
43
66.3
3-
721.9
370.2
137.7
16.2
80.8
32.8
3.6
1.0
05.4
50.0
00.0
0-
Male
3,8
27
26.0
51.2
1720.9
868.6
239.7
56.3
80.8
63.2
5.3
0.8
35.5
20.1
00.0
70.0
3F
em
ale
App
lica
ntA
ge338
-693.3
386.5
539.9
76.6
40.8
84.0
5.9
0.9
45.7
60.0
00.0
0-
2.30
18-
24
7,4
49
50.7
1-
714.9
575.6
738.4
66.3
40.8
32.6
3.4
1.0
65.5
10.0
00.0
0-
25
-44
5,4
28
36.9
5-
727.1
764.1
037.4
16.2
10.8
33.2
3.5
0.9
35.3
80.0
00.0
0-
45
-61
13,2
15
89.9
7-
719.2
471.3
438.0
86.3
00.8
42.9
3.5
1.0
05.4
60.0
00.0
0-
<62
1,4
74
10.0
3-
748.0
952.7
840.2
36.3
80.8
63.5
1.3
05.5
20.0
00.0
0-
10.0
62 +
330

Focal Point Report
Note the following from the Focal Point Report:
1. Marketing:
1.1 American Indian originations was only .27% of all originations.
1.2 Asian originations was 1.69% of all originations.
1.3 Native Hawaiian was .35% of all originations.
1.4 2 or More Minority Races was .03% of all originations (not a prohibited basis group on its own).
1.5 Joint Race was 1.23% of all originations (again, not a prohibited basis group).
1.6 Joint Ethnicity was 1.16% of all originations.
1.7 Age 18-24 was 2.30% of all originations (this would not be a concern, however, as only 62+ would raise an issue).
If this were your institution, how would you mitigate these apparent risks? You would have demographic analysis reports from your assess-ment areas showing that these groups represented approximately the same percentages of your population as the originations.
2. Declination Ratios:
2.1 American Indian applicants were denied 3.69 times as often as whites.
2.2 Asian applicants were denied 2.18 times as often as whites.
2.3 Black applicants were denied 2.09 times as often as whites.
2.4 Native Hawaiian applicants were denied 2.19 times as often as whites.
2.5 Hispanic applicants were denied 2.28 times as often as whites.
3. Decisioning Regression Results:
3.1 American Indian applicants were classified as Denied & Review 7.7% of the time, compared to 2.6% for whites.
3.2 Asian applicants were classified as Denied & Review12% of the time, Blacks 5.5%, Native Hawaiian 6.1% percent of the time, compared to 2.6% for whites.
3.3 Hispanic applicants were classified as Denied & Review 4.4% of the time, compared to 2.8% of the time for Non Hispanic applicants.
331

Fair Lending Wiz Training Guide
4. Pricing Indicators (HMDA Threshold, Difference of Means):
4.1 Black borrowers were above the HMDA reportable threshold 2.42 times as often as white borrowers.
4.2 American Indian borrowers received an average APR that was .62% (62 basis points or BP) higher than whites, and an average Note Rate that was 75 BP higher than whites.
4.3 Black borrowers received an average APR that was 26 BP higher than whites.
4.4 Native Hawaiian borrowers received an average APR that was 42 BP higher than whites, and an average Note Rate that was 32 BP higher than whites.
4.5 Borrowers indicating 2 or more Minorities received an average APR that was 95 BP higher than whites, and an average Note Rate that was 122 BP higher than whites.
4.6 Joine Ethnicity borrowers received an average APR that was 26 BP higher than non-Hispanic borrowers, and an average Note Rate that was 32 BP higher than non-Hispanic borrowers.
4.7 The APR minus Note Rate indicates Fees. No prohibited basis group had average fees that appeared to be out of line compared to whites.
5. Pricing Indicators (Pricing Regression Model):
5.1 American Indian borrowers were classified as Above Predicted 11.7% of the time, compared to 3.8% of the time for whites.
5.2 Black borrowers were classified as Above Predicted 9.1% of the time, compared to 3.8% of the time for whites.
5.3 Borrowers who were classified as 2 or more minorities were classified as Above Predicted 33.3% of the time, compared to 3.8% of the time for whites (this is probably due to a small num-ber of applicants, causing the percentage to look way out of line. The concern level, however, is probably minimal).
5.4 Borrowers of age 62 or higher were classified as Above Pre-dicted 10% of the time, compared to 3.5% of the time for bor-rowers under the age of 62.
332

Focal Point Report
6. Risk Indicators (best reviewed after the review of pricing):
6.1 American Indian borrowers had just about every indicator of being overpriced. Their average APR was 62 BP higher, their Note Rates were 75% BP higher, and they were classified as Above Predicted 11.7% of the time, even after controlling for ability and willingness to repay the loan.
6.2 Did their apparent risk justify this difference in price? Their average Credit Score was lower, but not by a significant amount (14.12 points lower, and not below any apparent thresholds for credit quality). Their average LTV was actually lower (11.03 points lower). Their average Debt Ratios were slightly higher (1.84 points higher on average). Therefore, the risk does NOT appear to justify the increased prices.
7. Summary of Regression Statistics - appears on the third page of the report, printed after the following page. Once again, you are looking for the factors to make sense. By this time, you should already have the detailed results of the completed Regression models in your documentation.
Your NEXT STEP would be to run a Focal Point Report for each of your Loan Type and Purpose combinations where you have a subtantial volume of applications. In other words, you would run a report for Conventional Home Purchase, Conventional Refinance Loans, Home Improvement, Government Home Purchase, etc.
333

Fair Lending Wiz Training Guide
#O
rig
inat
ed
% o
f T
ota
l
Mar
keti
ng
Un
der
wri
tin
gR
isk
Pri
cin
g
Fai
r L
end
ing
"FO
CA
LP
OIN
T"
Rep
ort
Dec
lin
atio
n
Lo
ans
Rat
ioto
Co
ntr
ol
Gro
up
Dec
isio
nin
gR
egre
ssio
n
Res
ult
s:D
enie
d
&R
evie
w%
Ro
w+
/ -
Tar
get
+ /
- T
arg
et+
/ -
Tar
get
Th
resh
old
Rat
ioto
Co
ntr
ol
Gro
up
Ab
ove
HM
DA
Pri
cin
gR
egre
ssio
nR
esu
lts:
Ab
ov
Pre
dic
ted
%R
o
To
tal
FL
Wiz
Tra
inin
gF
ile20
07fo
rA
nal
ysis
Pu
rpo
ses
Filt
er:
No
ne
Ave
rag
e
Cre
dit
Sco
re
Ave
rag
e
LTV
Ave
rag
eB
E
Rat
io
Ave
rag
e
AP
R
Ave
rag
eN
ote
Rat
e
Ave
rag
eA
PR
-N
ote
Rat
e
App
lica
ntIn
com
e914
6.2
2722.0
560.4
946.6
96.4
20.8
52.4
1.8
15.5
70.1
40.1
20.0
22.
7910
.2Low
-<
50%
2,9
03
19.7
61.6
0714.2
370.6
741.8
56.3
40.8
42.9
4.4
1.1
05.5
00.0
60.0
50.0
1M
odera
te-
50-7
9.9
9%
3,8
17
25.9
91.9
2716.1
468.1
943.0
36.3
60.8
52.8
5.8
1.2
85.5
10.0
80.0
60.0
2Low
and
Modera
te Incom
e
3,9
59
26.9
51.2
0715.7
972.5
338.9
06.2
90.8
12.9
2.8
0.7
75.4
80.0
10.0
3-0
.02
Mid
dle
-80-1
19.9
9%
5,8
59
39.8
90.8
6729.6
068.9
434.5
36.2
70.8
43.1
3.7
1.1
65.4
3-0
.01
-0.0
20.0
1U
pper
-120%
or
More
9,8
18
66.8
4-
723.9
170.4
236.3
36.2
80.8
33.0
3.3
1.0
05.4
50.0
00.0
0-
Mid
dle
and
Upper
Incom
e
Tra
ct%
Min
orit
y4,5
22
30.7
8-
723.7
268.9
438.2
36.3
20.8
2-
-1.0
05.5
00.0
00.0
0-
<10%
Min
ority
3,2
78
22.3
21.0
4720.0
370.4
738.3
86.3
00.8
1-
-0.8
45.4
9-0
.02
-0.0
1-0
.01
10-1
9%
Min
ority
4,2
78
29.1
20.9
8721.8
370.3
638.4
76.2
90.8
6-
-0.8
75.4
3-0
.03
-0.0
70.0
420-4
9%
Min
ority
1,4
86
10.1
20.9
5719.0
069.1
437.9
76.2
90.8
7-
-1.2
05.4
2-0
.03
-0.0
80.0
550-7
9%
Min
ority
1,1
22
7.6
41.0
0721.2
569.6
737.6
86.3
30.8
2-
-1.0
65.5
10.0
10.0
1-
80-1
00%
Min
ority
Tra
ctIn
com
e525
3.5
71.0
7720.7
569.5
137.5
96.2
80.8
5-
-1.4
05.4
3-0
.03
-0.0
50.0
2Low
-<
50%
2,5
36
17.2
60.9
1721.9
169.5
438.1
56.2
90.8
5-
-1.2
35.4
4-0
.02
-0.0
40.0
2M
odera
te-
50-7
9.9
9%
3,0
61
20.8
40.9
4721.7
169.5
338.0
66.2
90.8
5-
-1.2
65.4
4-0
.02
-0.0
40.0
2Low
and
Modera
te Incom
e
6,6
27
45.1
20.9
9721.7
269.9
338.3
16.3
10.8
3-
-0.9
25.4
80.0
00.0
0-
Mid
dle
-80-1
19.9
9%
4,9
70
33.8
31.0
2721.4
769.7
238.3
36.3
10.8
4-
-1.1
15.4
70.0
0-0
.01
0.0
1U
pper
-120%
or
More
11,5
97
78.9
5-
721.6
169.8
438.3
26.3
10.8
3-
-1.0
05.4
80.0
00.0
0-
Mid
dle
and
Upper
Incom
e
334

Focal Point Report
Fac
tor
Sig
nif
ican
ceS
ign
ific
ance
Su
mm
ary
of
Reg
ress
ion
Sta
tist
ics
Pri
cin
g In
terp
reta
tio
nD
ecis
ion
ing
Inte
rpre
tati
on
Cre
dit
Score
:Custo
mF
acto
rin
cre
ases
appro
val
20.7
1
Fin
ancia
lR
atios:B
ack
Facto
rdecre
ases
appro
val
-18.6
2
Fin
ancia
lR
atios:L
oan
-8.2
2
Inte
rcept
Facto
rdecre
ases
appro
val
-6.2
0
Sta
bili
ty:L
ength
inF
acto
rin
cre
ases
appro
val
4.0
5
Incre
ases
Rate
or
Cost
81.2
0
71.8
0
Incre
ases
Rate
or
Cost
36.2
3In
cre
ases
Rate
or
Cost
17.1
1
Decre
ases
Rate
or
Cost
-15.7
3
Decre
ases
Rate
or
Cost
-10.0
5
Incre
ases
Rate
or
Cost
7.8
7
Fac
tor
Lie
nS
tatu
s
Inte
rcept
Arm
_01
CLT
V
Cre
dit
Score
:Custo
m
Loan
Am
ount
Loan/A
pplic
ation:L
oan
©W
olters
Klu
wer
Fin
ancia
lS
erv
ices.
Wiz
isre
gis
tere
din
the
U.S
.P
ate
nt
and
Tra
dem
ark
Off
ice.
Tel:
800-2
61-3
111
335