flash flood czech republic
TRANSCRIPT

8/14/2019 Flash Flood Czech Republic
http://slidepdf.com/reader/full/flash-flood-czech-republic 1/24
STUDY OF HISTORICAL FLOODS IN CENTRAL ANDEASTERN EUROPE FROM AN INTEGRATED FLOOD
MANAGEMENT VIEWPOINT
CZECH REPUBLIC
Submitted by: Czech Hydrometeorological Institute, Regional Office,Brno
For the WMO/GWP Associated Programme on Flood Management
_______________________________________ NOTEThe designations employed and the presentation of material in this document do not imply the expression of anyopinion whatsoever on the part of the Secretariat of the World Meteorological Organization concerning the legalstatus of any country, territory, city or area or of its authorities, or concerning the delimitation of its frontiers or boundaries.It should be noted that this document is not an official WMO Publication and has not been subjected to theOrganization's standard editorial procedures. The views expressed by individuals or groups of experts and publishedin this document do not necessarily have the endorsement of the Organization.
World Meteorological Organization
8/14/2019 Flash Flood Czech Republic
http://slidepdf.com/reader/full/flash-flood-czech-republic 2/24
WMO/GWP Associated Programme on Flood Management
1
1. Introduction
On the 15th July 2002, between 17:30 and 19:00 hours CEST, an extraordinary torrential rainfall occurredin Moravia on the catchment boundary between the rivers Svratka and Svitava in the Counties of Blanskoand Žďár nad Sázavou, which caused on the left hand tributaries of the Svratka and on the right handtributaries of the Svitava a voluminous flood wave. During that time, 171.7 mm of rain was measured in
the precipitation measurement station in Olešnice, which is the largest daily sum measured on theterritory of South Moravia since the beginning of measurement. This flash flood caused considerabledamages and cost two human lives.
2. Description of area
2.1 Natural characteristics
The area affected by the flood is located in the catchment of the Morava River on the catchment boundary between the rivers Svratka and Svitava, North of the District city of Brno. The area is the region of theUpper-Svratka Highland, which is a part of the Bohemian-Moravian Highland, with elevation of around550 – 650 m A.S.L. The countryside is undulating, with numerous fields, meadows and groups of trees,
the hills here join into mountain ridges, which at places steeply fall into the valley, and at places areslowly transferred into a plain.
Among the most severely affected townships/villages were Olešnice, Crhov, Louka, K ř těnov, Kunštát,Hodonín u Kunštátu, Zbraslavec (County Blansko) and Ště pánov (County Žďár nad Sázavou). Throughthe municipalities of Olešnice, K ř těnov and Hodonín, the Hodonínka rivulet flows (stream of 5th order,Svratka catchment), which springs at an elevation of 652 m A.S.L. near the village of Nyklovice. InOlešnice, in the middle of the township, the Veselský Creek, which is piped within the township, joins theHodonínka. The Hodonínka joins Svratka in Ště pánov at an elevation of 340 m A.S.L., where it flowsfrom the east. The average slope of the Hodonínka catchment is 13.2 %. Through the village of Crhov,the Crhovský Creek flows, which joins the Hodonínka under K ř těnov. The municipalities of Kunštát andZbraslavec lie in the catchment of the Svitava River.
The geological underbed strata originated in the Cambrian era, and is created especially by crystallicslates, paragneisses, mica schists and phylites. In decrements, the solid rocks are overlain byunconsolidated sediments (especially by clays and sands).
The soil cover is created by Cambisols (brown soils) and podzols. The forest cover is approximately ... %.
2.2 Climatic characteristics
The average yearly precipitation sum in the catchment of the Hodonínka rivulet is 669 mm, in thecatchment of the Úmoř í Creek this value is also 669 mm (for the period of 1931 – 1980). The averageyearly distribution of temperatures in the station of Bystř ice nad Pernštejnem and average monthly precipitation sums in the station Olešnice are quoted in the Tables no.1 and 2.
Tab 1. Average yearly distribution of temperatures – station Bystřice nad Pernštejnem
Month 1. 2. 3. 4. 5. 6. 7. 8. 9. 10 11. 12. Year Air Temperature
[°C]-3,1 -1,8 2,1 6,5 12,1 14,7 16,5 16,2 11,9 7,0 1,4 -1,7 6,8

8/14/2019 Flash Flood Czech Republic
http://slidepdf.com/reader/full/flash-flood-czech-republic 3/24
WMO/GWP Associated Programme on Flood Management
2
Tab 2. Average monthly precipitation sums – station Olešnice (for period of 1971-2000)
Month 1. 2. 3. 4. 5. 6. 7. 8. 9. 10 11. 12. Year Precipitation
[mm]40 34 40 42 65 77 79 65 54 40 46 45 629
2.3 Hydrological characteristics
Basic data of the catchments of the Hodonínka Rivulet and the Zbraslavec Creek are shown in the Tableno.3 and 4:
A - Catchment areaL - Length of thalwegHavr - Average elevation of catchmenti - Average slope of thalwegα - Catchment characteristicsForest cover
Tab 3. Basic data of the Svratka catchment
Cross-sectionnumber
StreamA
[km2]
L
[km]
Havr
[m a.s.l.]
i
[%]
α
[A/L2]
Forest cover [%]
1Hodonínka abovethe village of Olešnice
15.87 8.2 635 1.56 0.24 16
2Hodonínka abovethe Veselský Creek
17.65 10.1 628 1.53 0.17 15
3VeselskýCreek
5.13 3.5 595 3.52 0.42 5
4CrhovskýCreek, village of
Crhov
7.96 4.5 597 2.20 0.38 10
5Hodonínka abovethe Dvorský Creek
36.15 13.3 619 1.26 0.20 13
6DvorskýCreek
3.25 2.9 586 6.26 0.39 5
7
Hodonínka under the confluence withthe RozsečskýCreek
47.27 17.0 589 1.17 0.16 20
8Hodonínka Rivulet,villageof Ště pánov
66.78 21.3 587 1.41 0.15 30
Tab 4. Basic data of the Svitava catchment
Cross-sectionnumber
StreamA
[km2]
L
[km]
Havr
[m a.s.l.]
i
[%]
α
[A/L2]
Forest cover [%]
9Úmoř í Creek,
Zbraslavec Creek 32,10 7,7 543 4.12 0.54 40

8/14/2019 Flash Flood Czech Republic
http://slidepdf.com/reader/full/flash-flood-czech-republic 4/24
WMO/GWP Associated Programme on Flood Management
3
2.4 Social characteristics
In the region there are the townships of Olešnice and Kunštát, and a number of villages of a rural type.Agriculturaly, this area can be denoted as a potato- and corn-growing region, animal production is aimed predominantly at the breeding of cattle, industry is concentrated especially in Olešnice.
In Olešnice, four retarding basins for flood mitigation purposes have been built.
Number of inhabitants:
Township/villageNumber of inhabitants
Olešnice 1774
Crhov 187
Louka 78
K řtěnov 212
Kunštát 2621
Zbraslavec 181
Štěpánov 720

8/14/2019 Flash Flood Czech Republic
http://slidepdf.com/reader/full/flash-flood-czech-republic 5/24
WMO/GWP Associated Programme on Flood Management
4
3. Meteorological causes of the flood
3.1 Development of weather situation in the first half of July 2002
In the first decade of July 2002, or roughly till 11 th July, weather in our country was determined by aregion of low air pressure, which was being kept or renewed in the region of the North and Norwegian
Sea, and Great Britain. Around this region of low pressure, relatively warm air from the South-West wasflowing to our country, and warm weather was only transiently interrupted by precipitation, mainlytogether with storms, which however above Moravia did not reach excessive intensity. A significantrearrangement of the weather situation occurred on the 10 th and 11th July, when after the passing of a coldfront, which in essence did not manifest itself over Moravia precipitation-wise, a pressure high started tospread from Western to Central Europe and over Scandinavia, which, after short slight cooling, brought toour territory sunny weather without precipitation.
The pressure high however relatively quickly receeded to the North over Scandinavia, and around a pressure low, which was created over North Italy, very warm and moist air started to flow to our territoryfrom the Balkans on Saturday 13th and Sunday 14th July. This warm and moist air was further beingwarmed, whereby suitable conditions for the origin of storms were being created. Storms indeed did occur on a larger scale over Central Europe and over Moravia already on Saturday 13th July. On the following
day the storm activity over the Czech Republic partly weakened, but on Monday 15 th July it againincreased.
As a result of the quoted development of the weather situation, above-normal weather prevailed inMoravia in the first half of July, with average daily temperatures from 17.7°C in Nedvězí to 21.9°C inBrno, which is approximately 2.5 - 3°C above the long-term average. Up till 12th July, more abundantrainfalls mostly did not occur, perhaps with the exception of 2nd, 4th and 7th July, when showers andstorms did occur, which were however of weak to mild intensity. Precipitation totals on monitoredstations of Southern and Central Moravia in the first half of July reached around 70-130 % of the long-term average.
3.2 Weather situation and development of convective storms on 15th July 2002 over Moravia
The weather analysis is illustrated by a picture of objective analysis of meteorological fields in variouslevels on Fig. 1 (in Appendix). Almost in all levels from the earth to the tropopause the pressure low can be seen, which had its centre in the region of Corsica, and around which warm air was flowing to our territory from the East or South-East. Near the ground, weak or mild wind from the North-East wasmostly blowing, but this did not bring any cooling, because warm air was also above the South-Easternhalf of Poland.
The morning in Moravia was half-overcast, The Bohemian-Moravian Highland had a solitary lowcloudiness or fogs. Numerical weather forecast models (the Aladin model and the model of the Germanweather service) forecast on the given area in the period of 14:00 to 20:00 hours CEST only up to 5 mmof rainfall, while it is known, that especially storm precipitation is hard to predict by these models, asopposed to large-area rainfalls. According to a Brno radio-probe station, the atmosphere was unstable
(moisture-unstable), i.e. conditions existed for the origin of a storm, however no index of instability hadan extraordinary value.
According to information from meteorological radars (see Fig. 2, Appendix), a zone of showers andstorms was advancing in the morning hours from Austria towards the North and was partially weakening.Around noon, rather local storms occurred in the region of the Jihlava hills, and these were advancingfurther to the North-West. For further development, further storms were important, which were created inthe Žďár nad Sázavou region, about 20 to 30 km from the afflicted area, around 16:00 hours. Out of these,cool and moist air was “flowing out”, whose face on the South-Easterly side was stimulating the creationof further storm cells, which were hence drawing near the afflicted region against the direction of the prevailing Southerly flow in the troposphere.

8/14/2019 Flash Flood Czech Republic
http://slidepdf.com/reader/full/flash-flood-czech-republic 6/24
WMO/GWP Associated Programme on Flood Management
5
Around 17:00 hours CEST, a significant storm cell was created several kilometres East of Olešnice, andsoon substantial rainfalls began in the region around Olešnice. The outflows from these storms initiatedthe creation of further strong output movements, which however did not advance further to the South-East, but repeated themselves on almost the same region, where therefore occurred an extraordinaryaccumulation of torrential rainfalls. Only around 19:30 CEST their impact shifted by about 5 to 10 kmfurther to the South-East, and around 20:00 hours the development of storm cells overall began to weaken.
It must be said, that apart from staying in one spot, the appearance of these storms was not tooconspicuous and not even further information, which were at the meteorologists’ disposal, pointed to adisaster of such extent.
The parameters of the atmosphere indicated, that strong convective storms with dangerous weather phenomena will occur, and therefore already on the 13th July an appropriate warning was given out for the days of 13th to 17th July 2002. During a regular consultation of the Central and Regional ForecastingWorkplace in Brno in the morning of the 15th July 2002, it was decided to leave the quoted warning in place.

8/14/2019 Flash Flood Czech Republic
http://slidepdf.com/reader/full/flash-flood-czech-republic 7/24
WMO/GWP Associated Programme on Flood Management
6
4. Hydrological situation
Before the flood event, water levels of streams in this area were low, flows from 10 th July 2002 on theupper Svratka River in the watergauging station Borovnice were on the level of 250- to 335-dailydischarges. In the watergauging station Bílovice on the Svitava River, the flows from 10 th July 2002 wereat the level of 240- to 330-daily discharges. Water levels up to the 13 th July were stable, on the 14th July a
slight increase of the water levels occurred.
There is no watergauging station directly in the afflicted area. On the upper Svratka above this area arewatergauging stations in Borovnice and in Dalečín, another watergauging station is under the Vír Reservoir. The closest station south of the afflicted area is Veverská Bítýška on the Svratka River. In thecatchment of the Svitava River there is a watergauging station in Letovice on the Svitava and inProstř ední Poř íčí on the K ř etínka River. In Olešnice there is a precipitation-measuring station of theCHMI Brno Regional Office.
On the 15th July 2002 after torrential rainfalls between 17:30 and 19:00 hours a flood wave was created,which receeded approximately at midnight. Most affected were left hand tributaries of the HodonínkaRivulet: Veselský Creek and Crhovský Creek. Approximately at 19:30 hours, the Mayor of Hodonín uKunštátu broadcast on the local radio, that a torrential floodwave is approaching Hodonín from Olešnice.
In the course of twenty minutes, water level reached 2.5 m in a place where the normal stage is 10 cm.This situation lasted for about 4 hours. According to local inhabitants, the Hodonínka Rivulet was 40 to50 m wide in a place where the normal width is 2 m.
In the region, the following streams were affected by the flood wave: Hodonínka, Veselský Creek,Crhovský Creek, Dvorský Creek, Loucký Creek (Svratka catchment), Petr ůvka Creek, Sebránek Creek,Sychotínský Creek, Úmoř í Rivulet (Svitava catchment).
In the morning after the flood on the 16th July 2002, two cars of the CHMI Brno Regional Office weresent into the afflicted area with 6 workers of the Hydrology Department to map the afflicted area, surveystream cross-sections and high water marks, perform stream gauging, acquire photo-documentation andgain data on the amount of fallen precipitation – see Tab. 5. Out of this field work, peak discharges wereevaluated in 10 cross-sections (see Fig. 4). Two cross-sections in Ště pánov on the Hodonínka Rivuletwere surveyed and evaluated on the 22nd July 2002. The results of the measurements appear in Tab. 3.
The precipitation-measurement station in Olešnice on the 15th July 2002 recorded a daily precipitationsum of 171.7 mm (see Tab. 6). This was a torrential rainfall with a return period of n > 200 years.Precipitation is being measured in Olešnice since 1923. The average yearly sum of precipitation for the period of 1931-2001 is 652 mm, and the average precipitation sum for July for the same period is 80 mm.The maximum daily precipitation sum was recorded in July 1997 – 89.6 mm. In 1997 however it was nota torrential rainfall, but a long-lasting moderate rain.
Tab 5. Causal precipitation sums on the 15th July 2002 – data according to measurementby local inhabitants
Locality Precipitation sum in mmSychotín (Kunštát) upper part of village near petrol station 160
Rozseč – upper part of village under the byre house no. 43103120
Crhov – upper part of village (4 measurements) 141 - 192Lamberk (lonely house above Olešnice) 131Louka - house no. 4 150

8/14/2019 Flash Flood Czech Republic
http://slidepdf.com/reader/full/flash-flood-czech-republic 8/24
WMO/GWP Associated Programme on Flood Management
7
Table 6 quotes daily precipitation sums recorded in the Blansko region and in the vicinity on the 15 th and16th July 2002 in the CHMI stations. The isohyets are shown on Figs. 4 and 5 of the Appendix A.
Tab 6. Daily precipitation sums – monitoring by CHMI Brno Regional OfficePrecipitation Hail Precipitation Hail
Station
15.7.200216.7.2002
Jevíčko ( ČHMÚ P-Ostrava ) 0,5 No 12,1 No
Vír 27 No 47,4 No Nedvězí 52,4 No 29,4 YesBř ezová nad Svitavou 3,4 No 34,7 NoPolička 5,2 No 18,9 NoHradec nad Svitavou 1,4 No 25,5 NoLetovice 9,7 No 40,4 NoLhota Rapotina No 28,8 NoKnínice u Boskovic No 34,8 NoProtivanov 0,1 No 16,7 NoSloup No 22,2 NoRozstání Not monitoredBlansko 0 No 29 NoSynalov 16,7 No 38,2 NoSejř ek 40,8 No 59,8 NoŠtě pánov nad Svratkou 15,8 No 46,5 NoÚsuší - Čížky 0,5 No 39,2 NoKuř im No 32,2 NoVelká Bíteš Not measurable No 66 NoSk ř inář ov 0,2 No 56,4 NoBystř ice nad Pernštejnem 4,1 No 41,9 NoVěcov - Jimramovské Pavlovice 5,8 No 31,9 NoOlešnice 171,7 No 14,7 No
Lísek Not measurable No 35 No Nové Město na Moravě 10,1 No 45,9 No

8/14/2019 Flash Flood Czech Republic
http://slidepdf.com/reader/full/flash-flood-czech-republic 9/24
WMO/GWP Associated Programme on Flood Management
8
Tab 7. Peak discharges on the 15th July 2002
Svratka catchment
Cross-sectionnumber
StreamA
[km2]Qmax
[m3.s-1]
Max.specific runoff
qmax
[m3
.s-1
.km-2
]
Q100
[m3.s-1]Return period
1Hodonínka above
the villageof Olešnice
15,87 8,5 0,536 30 2-5
2Hodonínka above
the VeselskýCreek
17,65 16 0,907 30,5 10-20
3Veselský
Creek 5,13 27 5,263 15 > 200
4Crhovský
Creek, village of Crhov
7,96 42 5,276 20 > 200
5 Hodonínka abovethe Dvorský Creek 36,15 76 2,102 43 > 200
6 DvorskýCreek
3,25 20 6,154 13 > 200
7
Hodonínka under the confluence
with theRozsečský Creek
47,27 110 2,327 50 > 200
8Hodonínka
Rivulet, villageof Ště pánov
66,78 110 1,647 60 > 200
Svitava catchment
Cross-sectionnumber
StreamA
[km2]Qmax
[m3.s-1]
Max.specific runoff qmax
[m3.s-1.km-2]
Q100
[m3.s-1]Return period
9Úmoř í Creek,
Zbraslavec Creek 32,10 22 0,685 25,5 50
A response to the extraordinary precipitation activity from 15 th July 2002 on the Svratka River inVeverská Bítýška came on the 16th July 2002. The discharge here peaked at 5:30 hours, reached 60 m3s-1
(approximately Q1) and the I. DFA (Degree of Flood Activity) was exceeded. The duration of the I. DFAwas 16th July 2002 from 2:50 to 9:30 hours. The volume of the flood wave was 1.6 – 1.8 million m 3 of water.
In the watergauging station Prostř ední Poř íčí on the K ř etínka River (Svitava catchment), the discharge before the flood was about 0.1 m3s-1. On the 15th July 2002, the discharge peaked at 21 hours with 4.54m3s-1 – smaller than 1 year discharge. In the watergauging station Letovice on the Svitava River on the15th July 2002 at 21:00 hours, a maximum discharge of 1.99 m3s-1 was recorded, which was an increase of about 1 m3s-1 compared to the previous discharges.
As can be seen from the hydrographs, a greater response to the torrential rainfall was manifested in theSvratka catchment, while the Svitava catchment was affected substantially less. In the Svratka catchment,the left hand tributaries registered maximum discharges with a return period greater than 200 years, whilein the Svitava catchment the most affected were right-hand tributaries Petr ůvka Creek and Úmoř í Rivulet,
8/14/2019 Flash Flood Czech Republic
http://slidepdf.com/reader/full/flash-flood-czech-republic 10/24
WMO/GWP Associated Programme on Flood Management
9
which registered maximum discharges with a return period of 50 years. The Úmoř í Rivulet is a right-handtributary of the Svitava River down below the Letovice watergauging station.
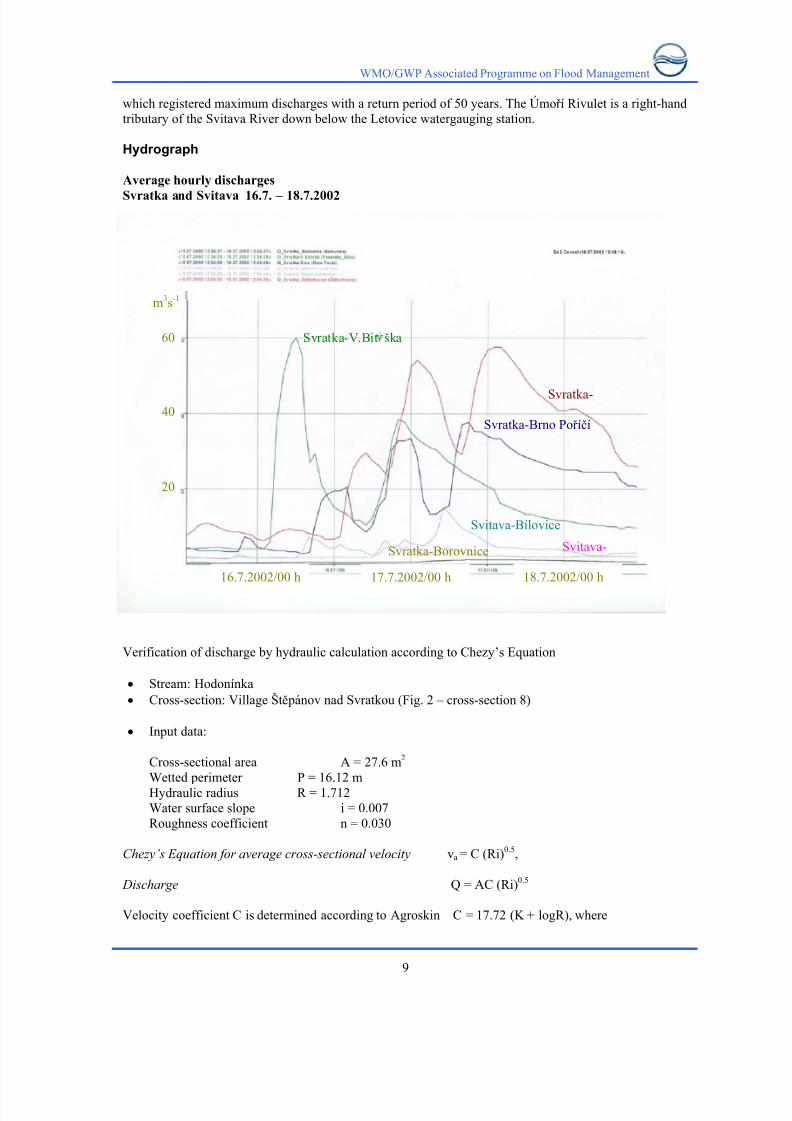
Hydrograph
Average hourly discharges
Svratka and Svitava 16.7. – 18.7.2002
Verification of discharge by hydraulic calculation according to Chezy’s Equation
• Stream: Hodonínka• Cross-section: Village Ště pánov nad Svratkou (Fig. 2 – cross-section 8)
• Input data:
Cross-sectional area A = 27.6 m2
Wetted perimeter P = 16.12 mHydraulic radius R = 1.712Water surface slope i = 0.007Roughness coefficient n = 0.030
Chezy’s Equation for average cross-sectional velocity va = C (Ri)0.5,
Discharge Q = AC (Ri)0.5
Velocity coefficient C is determined according to Agroskin C = 17.72 (K + logR), where
m3s-1
60
40
20
16.7.2002/00 h 17.7.2002/00 h 18.7.2002/00 h
Svratka-V.Bit ška
Svratka-
Svratka-Brno Poř íčí
Svitava-Bílovice
Svitava-Svratka-Borovnice

8/14/2019 Flash Flood Czech Republic
http://slidepdf.com/reader/full/flash-flood-czech-republic 11/24
WMO/GWP Associated Programme on Flood Management
10
K = 1.88 (according to tabulated values of K quoted for various types of river bed on p. 106 of Hydrological Handbook by A. Cherkashin).
Average cross-sectional velocity
va = 37.39 x 0.109 = 4.07 ms-1
Discharge
Q = 4.07 x 27.6 = 112.33 m3s-1
The average cross-sectional velocity according to the Chezy’s Equation in the river cross-section reached4 ms-1 for a water surface slope of 0.7 %. The discharge determined by the above-quoted way correspondsto the results of field watergauging and especially to the fact that the drag force of the water stream wasso large that it removed even large boulders in the river bed.

8/14/2019 Flash Flood Czech Republic
http://slidepdf.com/reader/full/flash-flood-czech-republic 12/24
WMO/GWP Associated Programme on Flood Management
11
5. Warning system
As already has been mentioned, meteorologists gave out already on the 13th July an appropriate notice of torrential precipitation. A caution was not given out, because nothing pointed to a disaster of such extent.
In higher-lying municipalities, inhabitants were not cautioned in any way. In the village of Hodonín, the
Mayor at 7:30 p.m. announced on the local broadcasting system, that a flood wave is approaching thevillage from the township of Olešnice. This warning contributed at least to a partial rescue of the propertyof the local inhabitants, and maybe also to the rescue of human lives.

8/14/2019 Flash Flood Czech Republic
http://slidepdf.com/reader/full/flash-flood-czech-republic 13/24
WMO/GWP Associated Programme on Flood Management
12
6. Rescue works
Fire Brigade units came to the flood-struck area still in the same evening. It was however difficult to getdirectly to the affected area and the situation during the night became very chaotic. That’s why the unitswere able to act only on the following day in the early morning hours. The civil defence unit from thevillage of Bučovice also joined in the action, as did volunteers from the surrounding municipalities. In the
village of Zbraslavec on the 16th July, inhabitants of six houses were evacuated. Excavators were used toremove the damages. Work was needed especially to free stream beds, to remove mud from floodedhouses and to pump water from cellars. Efforts were being made to restore energy supply, and drinkingwater was being carted to the affected communities.
On the 17th July, the Flood Commission meeting for the integrated Dyje catchment was convened. By thedecision of the Leader of the South Moravian District, danger state for the period of 20 days was called infive municipalities from the 17th July.
During the rescue works, information problems between the individual rescue teams occurred, however these were not of a serious character. It may be said, that everyone gave a maximum and unselfish effort.
Representatives of the Government of the Czech Republic visited the affected communities, as did
psychologists, who were helping the local population to overcome the psychical shock.

8/14/2019 Flash Flood Czech Republic
http://slidepdf.com/reader/full/flash-flood-czech-republic 14/24
WMO/GWP Associated Programme on Flood Management
13
7. Flood damages
The flood wave in the afflicted villages destroyed roads, flooded cellars, and endangered the stability of several tens of houses. Two women lost their lives.
The most afflicted village was the village of Crhov. Out of the total number of 60 houses in the village,
30 were damaged in some way. An asphalt road, not quite two months old, was completely destroyed.
In Olešnice, 5 houses were under water, 135 houses were damaged, also damaged were the bathing pool,library, Cultural Centre and a sewage treatment works. In Olešnice during the last 5 years, floodmitigation measures built consisted of dry retarding basins on the Veselský Creek to protect the villagefrom 40- to 50-year flood. The retarding basins however could not hold the force of the water, and their dam wall was breached. Damage to the dam wall was estimated to be 5 to 6 million Czk.
Flood-caused damages to property, which comes under the Administration and Upkeap of Roads inBlansko, was preliminarily estimated by road experts to be 25 to 30 million Czk. The most seriousdamage was a completely destroyed bridge on a road of third class between the villages of Olešnice andHodonín. Only about a metre footbridge was all that remained from the road bridge. Among other damaged road sections was the road between the villages of Rozseč and Kunštát, on the main road
connecting Žďár nad Sázavou, Boskovice and Prostě jov. About 10 km of roads were damaged. Moredamaged were local roads, in some villages the footpaths and local road were completely obliterated. TheŽďár region had large road damages.
Tab 8. Estimation of damages caused by flood in millions of Czk
Village Municipal property Private propertyOlešnice 8 – 10 15 až 20Crhov 15 25K řtěnov 4 0,5Zbraslavec 1,5 0,5 - 1Hodonín 2,5 5
Kunštát 1 1,5Louka 0,5 0,3Svitávka 1,5 0,5
Estimates of some other damagesLesy ČR 10Olešnice – Dairy 5 až 7Administration and Upkeap of Roads 67Source: Information from Mayors and company directors published in the daily “Southern MoraviaToday” (Jižní Morava Dnes) on the 18th July 2002.

8/14/2019 Flash Flood Czech Republic
http://slidepdf.com/reader/full/flash-flood-czech-republic 15/24
WMO/GWP Associated Programme on Flood Management
14
8. Conclusion
A flash flood occurred in the affected region, which was caused by an extraordinary torrential rainfall,which was an extreme daily rainfall sum with a Return Period greater than 200 years.
The occurrence of these torrential rainfalls may not be in the forecast precisely localised. According to the
information from meteorological radars it may be determined with a considerable error of estimation andwith a certain time delay, caused by the procedure of data processing. The time delay of data obtained bythe method of remote detection, and the great dynamics of strong storms are the main limiting factorsduring the giving out of the appropriate warnings.
With the development of meteorological and hydrological modelling there however exists a hope, that infuture we will be able to flexibly react to sudden atmospheric changes, and that we will in this way prevent not only material damages, but especially losses of human lives.

8/14/2019 Flash Flood Czech Republic
http://slidepdf.com/reader/full/flash-flood-czech-republic 16/24
WMO/GWP Associated Programme on Flood Management
15
References
• Soukalová E., Šálek M., Dostál P. and coll., Report on the flood in Blansko Region and Ště pánovnad Svratkou 15th July 2002, ČHMI office Brno, 2002
• Čerkašin, A.: Hydrological handbook, Hydrometeorological Institute Prague, 1964• Coll.: Hydrological aspects in ČSSR, Hydrometeorological Institute Prague, 1970• Peša, Z.: Flood day-book – Olešnice, 2002

8/14/2019 Flash Flood Czech Republic
http://slidepdf.com/reader/full/flash-flood-czech-republic 17/24
WMO/GWP Associated Programme on Flood Management
16
List of Appendices:
Appendix A
• Fig. 1 Situation – area affected by the flood on the 15.7.2002• Fig. 2 Situation – surveyed cross-sections in the Svratka catchment• Fig. 3 Information from meteorological radars• Fig. 4 Daily precipitation sums from the 15.7.2002• Fig. 5 Daily precipitation sums from the 16.7.2002
Appendix B
• Photodocumentation

8/14/2019 Flash Flood Czech Republic
http://slidepdf.com/reader/full/flash-flood-czech-republic 18/24
WMO/GWP Associated Programme on Flood Management
17
Appendix A
Fig 1. Situation – area affected by the flood on the 15.7.2002

8/14/2019 Flash Flood Czech Republic
http://slidepdf.com/reader/full/flash-flood-czech-republic 19/24
WMO/GWP Associated Programme on Flood Management
18
Fig 2. Situation – surveyed cross-sections in the Svratka catchment

8/14/2019 Flash Flood Czech Republic
http://slidepdf.com/reader/full/flash-flood-czech-republic 20/24

8/14/2019 Flash Flood Czech Republic
http://slidepdf.com/reader/full/flash-flood-czech-republic 21/24
WMO/GWP Associated Programme on Flood Management
20
Fig 3(b). Information from meteorological radars from 17, 18, 19 a 20 hours CESTon the 16.7.2002 (15, 16, 17 and 18 hours UTC – world time). Township of Olešnice is denoted by alittle red cross.

8/14/2019 Flash Flood Czech Republic
http://slidepdf.com/reader/full/flash-flood-czech-republic 22/24

8/14/2019 Flash Flood Czech Republic
http://slidepdf.com/reader/full/flash-flood-czech-republic 23/24
WMO/GWP Associated Programme on Flood Management
22
Appendix B – Photo documentation
Township of Olešnice – Veselský Creek in piping on the 16.7.2002
Deposits of gravel, clay and small stones in the l7ow part of the township under the dairy. The high water mark can be seen on the houses on the right. The road has already been scraped. The maximum dischargehere has been evaluated to be 27 m3/s.
The affected part of the township, street below the dairy, a scour hole about 2 m deep. The VeselskýCreek is piped under the road.

8/14/2019 Flash Flood Czech Republic
http://slidepdf.com/reader/full/flash-flood-czech-republic 24/24