flashstack converged infrastructure solution - pure...
TRANSCRIPT

FlashStack Converged Infrastructure SolutionDesign Guide for Citrix XenDesktop 7.6.1
With Pure Storage FlashArray 400, Cisco UCS B-Series B200-M4 blade servers, Cisco Nexus 5500-series Switches and VMware vSphere 6.0.
Version 1.0
Ravi Venkat, Solutions Architect, Pure StorageKyle Grossmiller, Solutions Architect, Pure Storage

2
Table of Contents
3 Introduction
3 Goals and Objectives
3 Audience
4 Reference Architecture Design Principles
5 Infrastructure Components of the Reference Architecture
15 Design Guide Solutions Overview
20 VMware vSphere Configuration and Tuning
23 Citrix XenDesktop Configuration and Tuning
26 Microsoft Windows 7 Desktop Configuration
26 Desktop Testing tool – Login VSI 4.1.3
29 Pure Storage FlashArray Configuration
30 Solution Validation
33 Scalability Results
63 Test Summary
64 Design Considerations and Sizing Guidelines
65 Summary of Findings
66 Conclusions
66 About Login VSI
66 About the Authors

3
Introduction
Pure Storage has introduced a converged infrastructure platform known as FlashStack that is built upon trusted hardware from Cisco and Pure Storage. FlashStack leverages Cisco’s extremely flexible and expandable Unified Computing System (UCS) to provide the compute horsepower, Cisco Nexus Switches for networking and Pure Storage FlashArray 400 Series as the storage foundation. FlashStack partners can provide the guidance, services, and experience necessary to help you deploy FlashStack quickly and with confidence. FlashStack Authorized Support Partners provide a single point of contact for services and end-‐to-‐end support on the entire FlashStack converged infrastructure solution.
This document describes a reference architecture for deploying Citrix XenDesktop 7.6.1 VDI environments on Pure Storage FlashArray (FA-‐400 series) using VMware vSphere 6.0, Login VSI 4.1.3 (a performance testing tool for virtualized desktop simulation), and Microsoft Windows Server 2012R2 and Microsoft Windows 7 (x64) as the guest operating system. Pure Storage has validated the reference architecture within its lab – this document presents the hardware and software configuration, the test workload configuration, testing results and further offers implementation and sizing guidance for a VDI population of over a hundred users all the way up to two thousand concurrent users.
Goals and Objectives
The goal of this document is to showcase the ease of deploying a large number of virtual desktops on the Pure Storage FlashArray. We will demonstrate the scalability of XenDesktop-‐based virtual desktop building blocks with Login VSI as a performance benchmark tool running the Office Worker workload (real-‐world user workload). XenDesktop Machine Creation Services (MCS)-‐based Windows 7 64-‐bit desktops will be deployed incrementally in number to find the high-‐end scalability characterization of the FlashStack. We will demonstrate linear scalability via testing with increasing cluster sizes of one, two, four, eight and later two entire UCS 5108 chassis with sixteen B-‐200M4 servers with a particular focus and emphasis on storage. In addition, we highlight the benefits of the Pure Storage FlashArray including data reduction and low latency that directly impacts the user experience and provides customers an ideal solution for any XenDesktop deployment project.
Audience
The target audience for this document includes storage and virtualization administrators, consulting data center architects, field engineers, and desktop specialists who want to implement XenDesktop-‐based virtual desktops on a Pure Storage FlashArray with VMware vSphere for virtualization. A working knowledge of VMware vSphere, Citrix XenDesktop, Login VSI, server, storage, networks and data center design is assumed but is not a prerequisite to read this document.

4
Reference Architecture Design Principles
The guiding principles for implementing this reference architecture are:
• Repeatable: Create a scalable building block that can be easily replicated at any customer site. Publish the version of various firmware under test and weed out any issues in the lab before customers deploy this solution.
• Virtualized: Implement every infrastructure component as a virtual machine.
• Available: Create a design that is resilient and not prone to failure of a single component. For example, we include best practices to enforce multiple paths to storage, multiple NICs for connectivity, and high availability (HA) clustering including dynamic resource scheduling (DRS) on vSphere.
• Efficient: Take advantage of inline data reduction and low latency of the Pure Storage FlashArray by pushing the envelope of VMs per server density.
• Simple: Avoid unnecessary and/or complex tweaks to make the results look better than a normal out-‐of-‐box environment.
• Scalable: By reporting the linear scaling of XenDesktop environments within the FlashStack architecture and by incrementing the number of UCS hosts, we will show exceptional end-‐user experience, outstanding VM per host density and best-‐in-‐class flash storage performance.

5
Infrastructure Components of the Reference Architecture
The IT industry has been transformed over the past decade over the concept of virtualizing and centralizing servers to enable IT to deliver a more secure, manageable, less costly, and ultimately more mature compute model. While the industry as a whole is not 100% virtualized, the availability of commodity scalable server architectures with increasingly large amounts of CPU power and centralized memory have made the promise of virtualizing those remaining power, business critical workloads much closer to reality. The same principles are being applied to virtual desktops as more and more customers are hosting their end user desktops in the data center to securely, reliably, and efficiently manage end user needs.
The Pure Storage FlashArray
Pure Storage is the leading all-‐flash enterprise array vendor, committed to enabling companies of all sizes to transform their businesses with flash.
Built on 100% consumer-‐grade MLC flash, Pure Storage FlashArray delivers all-‐flash enterprise storage that is 10X faster, more space and power efficient, more reliable, and infinitely simpler, and yet typically costs less than traditional performance disk arrays.
Pure Storage FlashArray sets the benchmark for all-‐flash enterprise storage arrays. It delivers:
Consistent Performance FlashArray delivers consistent < 1 ms average latency. Performance is optimized for the real-‐world applications workloads that are dominated by I/O sizes of 32K
Figure 1: Pure Storage FlashArray 400 Series Specifications

6
or larger vs. 4K/8K hero performance benchmarks. Full performance is maintained even under failures/updates.
Less Cost than Disk Inline de-‐duplication and compression deliver 5 – 10x space savings across a broad set of I/O workloads including Databases, Virtual Machines and Virtual Desktop Infrastructure.
Mission-‐Critical Resiliency FlashArray delivers >99.999% proven availability, as measured across the Pure Storage installed base and does so with non-‐disruptive everything without performance impact.
Disaster Recovery Built-‐In FlashArray offers native, fully-‐integrated, data reduction-‐optimized backup and disaster recovery at no additional cost. Setup disaster recovery with policy-‐based automation within minutes. And, recover instantly from local, space-‐efficient snapshots or remote replicas.
Simplicity Built-‐In FlashArray offers game-‐changing management simplicity that makes storage installation, configuration, provisioning and migration a snap. No more managing performance, RAID, tiers or caching. Achieve optimal application performance without any tuning at any layer. Manage the FlashArray the way you like it: Web-‐based GUI, CLI, VMware vCenter, Rest API, or OpenStack.
Pure Storage FlashArray FA-‐400 Series includes FA-‐405, FA-‐420, and FA-‐450. A FlashArray is available for any application, and any budget.
Purity Operating Environment 4.5.0
Purity is a storage operating environment built from the ground-‐up for flash. Purity is provided at no additional cost with every FlashArray, and runs consistently across the entire FlashArray hardware family.
The heart of Purity is the Purity Core, a foundation layer which virtualizes the entire array into a large pool of flash. It manages, protects, and extends the life of the flash via FlashCare technology, ensures consistent performance, and provides advanced data services via the Adaptive Metadata Fabric.
On top of the core run three key Purity Services: FlashReduce, FlashProtect and FlashRecover, ensuring array-‐wide efficiency and data protection.

7
The foundation of Purity is FlashCare and Purity Core providing media management and
metadata tools to maintain healthy, high performance flash adaptable to any workload.
Cisco Unified Computing System
The Cisco Unified Computing System™ (Cisco UCS™) is a next-‐generation data center platform that unites compute, network, storage access, and virtualization into an organized structure aimed to reduce total cost of ownership and introduce vastly improved infrastructure deployment mechanisms at scale. UCS incorporates a unified network fabric with scalable, modular and powerful x86-‐architecture servers. With an innovative and proven design, Cisco UCS delivers an architecture that increases cost efficiency, agility, and flexibility beyond what traditional blade and rack-‐mount servers provide. Cisco makes organizations more effective by addressing the real problems that IT managers and executives face and
solves them on a systemic level.
Figure 2: Building block of the Purity Operating Environment 4.5.0
Figure 3: Cisco Unified Computing System

8
Greater Time-‐on-‐Task Efficiency
Automated configuration can change an IT organization’s approach from reactive to pro-‐active. The result is more time for innovation, less time spent on maintenance, and faster response times. These efficiencies allow IT staff more time to address strategic business initiatives. They also enable better quality of life for IT staff, which means higher morale and better staff retention—both critical elements for long-‐term efficiency.
Cisco UCS Manager is an embedded, model-‐based management system that allows IT administrators to set a vast range of server configuration policies, from firmware and BIOS settings to network and storage connectivity. Individual servers can be deployed in less time and with fewer steps than in traditional environments. Automation frees staff from tedious, repetitive, time-‐consuming chores that are often the source of errors that cause downtime, making the entire data center more cost effective.
Easier Scaling
Automation means rapid deployment, reduced opportunity cost, and better capital resource utilization. With Cisco UCS, rack-‐mount and blade servers can move from the loading dock and into production in a “plug-‐and-‐play” operation. Automatically configure blade servers using predefined policies simply by inserting the devices into an open blade chassis slot. Integrate rack-‐mount servers by connecting them to top-‐of-‐rack Cisco Nexus® fabric extenders. Since policies make configuration automated and repeatable, configuring 100 new servers is as straightforward as configuring one server, delivering agile, cost-‐effective scaling.
Virtual Blade Chassis
With a separate network and separate management for each chassis, traditional blade systems are functionally an accidental architecture based on an approach that compresses all the components of a rack into each and every chassis. Such traditional blade systems are managed with multiple management tools that are combined to give the illusion of convergence for what is ultimately a more labor-‐intensive, error-‐prone and costly delivery methodology. Rack-‐mount servers are not integrated and must be managed separately or through additional tool sets, adding complexity, overhead, and the burden of more time.
Architecturally, Cisco UCS blade and rack-‐mount servers are joined into a single virtual blade chassis that is centrally managed yet physically distributed across multiple blade chassis, rack-‐mount servers, and even racks and rows. This capability is delivered through
Cisco® fabric interconnects that provide redundant connectivity, a common management and networking interface, and enhanced flexibility. This larger virtual chassis, with a single redundant point of management, results in lower infrastructure cost per server, with fewer management touch points, and lower administration, capital, and operational costs.

9

10
Cisco Nexus 5500UP Switches
Cisco Nexus 5500UP Switches, using cut-‐through architecture, supports line-‐rate 10 Gigabit Ethernet on all ports while maintaining consistently low latency independent of packet size and services enabled. It supports a set of network technologies known collectively as Data Center Bridging (DCB) that increases the reliability, efficiency, and scalability of Ethernet networks. These features allow the switches to support multiple traffic classes over a lossless Ethernet fabric, thus enabling consolidation of LAN, SAN, and cluster environments. Its ability to connect Fibre Channel over Ethernet (FCoE) to native Fibre Channel protects existing storage system investments while dramatically simplifying in-‐rack cabling. The Nexus 5500UP series switch we used was a Nexus 5548UP (see Figure 4 below), which is a 1RU 10 Gigabit Ethernet, Fibre Channel, and FCoE switch offering up to 960 Gbps of throughput and up to 48 ports. The switch has 32 unified ports and one expansion slot.
VMware vSphere 6.0
VMware vSphere is the industry-‐leading virtualization platform for building cloud infrastructures. It enables IT to meet SLAs (service-‐level agreements) for the most demanding business critical applications, at the lowest TCO (total cost of ownership). vSphere accelerates the shift to cloud computing for existing data centers and also underpins compatible public cloud offerings, forming the foundation for the industry’s only hybrid cloud model. With the support of more than 3,000 applications from more than 2,000 ISV partners, vSphere is the trusted platform for any application.
• VMware vSphere Hypervisor Architecture provides a robust, production-‐proven, high-‐performance virtualization layer. It enables multiple virtual machines to share hardware resources with performance that can match (and in some cases exceed) native throughput.
• Each vSphere Hypervisor 6.0 instance can support as many as 480 logical CPUs, 12TB of RAM, and 1024 virtual machines. By leveraging the newest hardware advances, ESXi 6.0 enables the virtualization of applications that were once thought to be nonvirtualizable.
• VMware ESXi™ 6.0 has dramatically increased the scalability of the platform. With vSphere Hypervisor 6.0, clusters can scale to as many as 64 hosts, up from 32 in previous releases. With 64 hosts in a cluster, vSphere 6.0 can support 8,000 virtual machines in a single cluster. This enables greater consolidation ratios, more efficient use of VMware vSphere Distributed Resource Scheduler™ (vSphere DRS), and fewer clusters that must be separately managed.
• VMware vSphere Virtual Machine File System (VMFS) allows virtual machines to access shared storage devices (Fibre Channel, iSCSI, etc.) and is a key enabling
Figure 4: Cisco Nexus 5548UP Switch

11
technology for other vSphere components such as VMware vSphere Storage vMotion®.
• VMware vSphere Storage APIs provide integration with supported third-‐party data protection, multipathing and storage array solutions.
Citrix XenDesktop 7.6.1
Citrix XenDesktop provides both desktop and application virtualization solutions, which provide a streamlined approach to deliver, protect, and manage Windows desktops and applications to the end user so they can work anytime, anywhere, on any device.
Key Features
XenDesktop 7.6.1 leverages desktop virtualization and builds on these capabilities, allowing IT to deliver virtualized and remoted desktop and applications through a single platform and supports users with access to all their Windows and online resources through one unified workspace.
XenDesktop 7.6.1 supports the following key functionalities:
• Desktops and Applications Delivered through a Single Platform – Deliver virtual or remote desktops and applications through a single platform to streamline management and easily entitle end users.
• Unified Workspace – Securely delivers desktops, applications, and online services to end users through a unified workspace, providing a consistent user experience across devices, locations, media, and connections.
• Closed Loop Management and Automation – Consolidated control, delivery and protection of user compute resources with cloud analytics and automation, cloud orchestration and self-‐service features.
• Optimization with the Software-‐Defined Data Center – Allocates resources dynamically with virtual storage, compute, and networking to manage and deliver desktop services on demand.
• Central Image Management – Central image management for physical, virtual, and BYO devices.
• Hybrid-‐cloud flexibility – Provides an architecture built for onsite and cloud-‐based deployment.
12
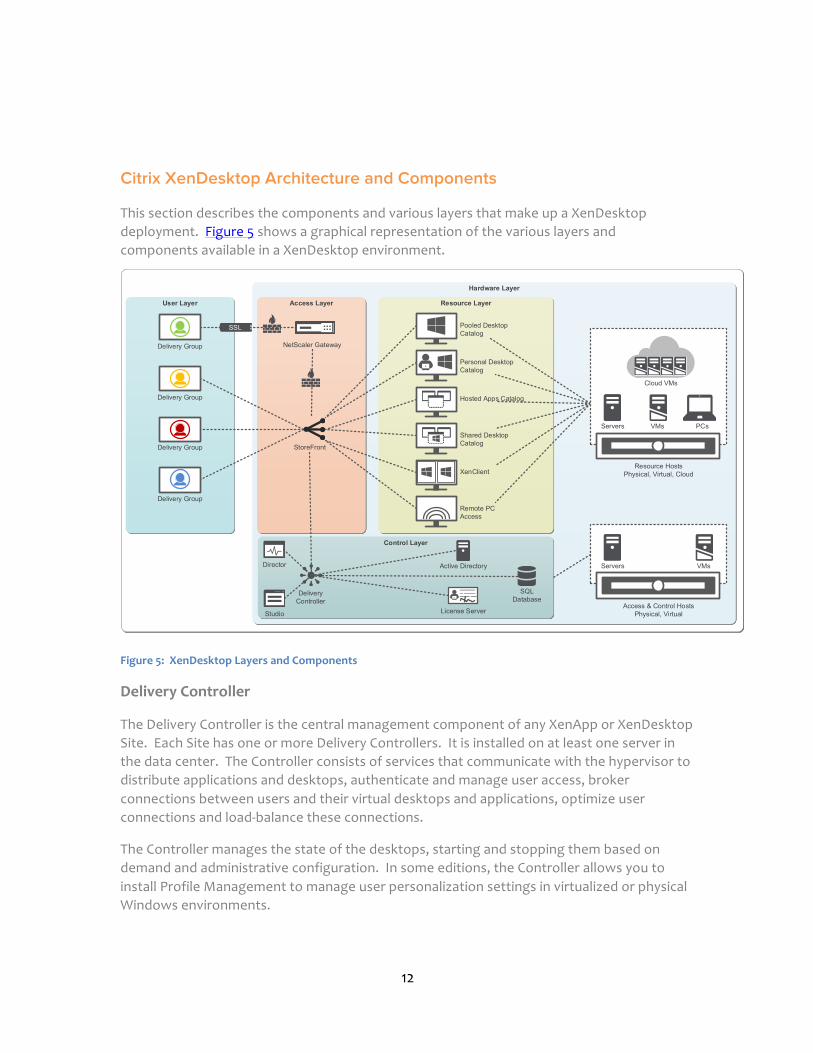
Citrix XenDesktop Architecture and Components
This section describes the components and various layers that make up a XenDesktop deployment. Figure 5 shows a graphical representation of the various layers and components available in a XenDesktop environment.
Hardware Layer
Control Layer
Access LayerUser Layer Resource Layer
NetScaler Gateway
StoreFront
Delivery Controller
XenClient
Remote PCAccess
Pooled Desktop Catalog
Hosted Apps Catalog
Personal Desktop Catalog
Shared Desktop Catalog
Director
Studio
SQL Database
SSL
Delivery Group
Delivery Group
Delivery Group
Delivery Group
Resource HostsPhysical, Virtual, Cloud
Cloud VMs
VMsServers PCs
Access & Control HostsPhysical, Virtual
VMsServersActive Directory
License Server
Figure 5: XenDesktop Layers and Components
Delivery Controller
The Delivery Controller is the central management component of any XenApp or XenDesktop Site. Each Site has one or more Delivery Controllers. It is installed on at least one server in the data center. The Controller consists of services that communicate with the hypervisor to distribute applications and desktops, authenticate and manage user access, broker connections between users and their virtual desktops and applications, optimize user connections and load-‐balance these connections.
The Controller manages the state of the desktops, starting and stopping them based on demand and administrative configuration. In some editions, the Controller allows you to install Profile Management to manage user personalization settings in virtualized or physical Windows environments.

13
StoreFront
StoreFront authenticates users to Sites hosting resources and manages stores of desktops and applications that clients access. It hosts your enterprise application store, which lets you give users self-‐service access to desktops and applications you make available to them. It also keeps track of users’ application subscriptions, shortcut names, and other data to ensure that they have a consistent experience across multiple devices.
NetScaler Gateway
A data-‐access solution that provides secure access inside or outside the LAN’s firewall with additional credentials.
Citrix Director
A web-‐based tool that allows administrators access to real-‐time data from the Broker agent, historical data from the site database and HDX data from NetScaler for troubleshooting and support.
Citrix Studio
A management console that allows administrators to configure and manage sites, entitle users and groups of users for access and provide real-‐time usage data. Studio provides various wizards to guide you through the process of setting up your environment, creating your workloads to host applications and desktops and assigning applications and desktops to users. You can also use Studio to allocate and track Citrix licenses for your site.
Virtual Delivery Agent (VDA) The VDA is installed on each physical or virtual machine in your Site that you want to make available to users. It enables the machine to register with the Controller, which in turn allows the machine and the resources it is hosting to be made available to users. VDAs establish and manage the connection between the machine and the user device, verify that a Citrix license is available for the user or session, and apply whatever policies have been configured for the session. The VDA communicates session information to the Broker Service in the Controller through the broker agent included in the VDA.
XenApp and XenDesktop include VDAs for Windows server and desktop operating systems. VDAs for Windows server operating systems allow multiple users to connect to the server at one time. VDAs for Windows desktops allow only one user to connect to the desktop at a time
Citrix Receiver
Citrix Receiver clients are available for Windows, Mac, Linux, iOS, Android, Chrome OS, BlackBerry 10, Windows Phone as well as various Thin and Zero client devices to provide the connection to remote desktops from your device of choice. The client supplies the connection to the virtual machine and communicates with StoreFront via secure access.

14
Provisioning Methods • Machine Creation Services (MCS) — A collection of services that create virtual
servers and desktops from a master image on demand, optimizing storage utilization and providing a virtual machine to users every time they log on. Machine Creation Services is fully integrated and administered in Citrix Studio.
• Provisioning Services — Enables computers to be provisioned and reprovisioned in real-‐time from a single shared-‐disk image. Provisioning Services manages target devices as a device collection. The desktop and applications are delivered from a Provisioning Services vDisk that is imaged from a master target device, which enables you to leverage the processing power of physical hardware or virtual machines. Provisioning Services is managed through its own console.
• Existing images — Applies to desktops and applications that you have already migrated to virtual machines in the data center. You must manage target devices on an individual basis or collectively using third-‐party electronic software distribution (ESD) tools.
Login VSI 4.1.3
Login VSI (www.loginvsi.com), the industry standard load testing solution for virtualized desktop environments is a tool designed to simulate a large-‐scale deployment of virtualized desktop systems and study its effects on an entire virtualized infrastructure. The tool is scalable from a few virtual machines running on one VMware ESXi (or other supported hypervisor) host up to hundreds to even thousands of virtual machines distributed across a cluster of ESXi hosts. Moreover, in addition to performance characteristics of the virtual desktops themselves, this tool also accurately shows the absolute maximum number of virtual machines that can be deployed on a given host or cluster of hosts. This is accomplished by using ‘Launcher’ Windows machines that simulate one or more end-‐point devices connecting in to the target VDI cluster and execute pre-‐defined classes of workloads that closely mimic real-‐world users.
Login VSI assists in the setup and configuration of the testing infrastructure, runs a set of application operations selected to be representative of real-‐world user applications, and reports data on the latencies of those operations.
Login VSI consists of the following components:
• Number of desktop virtual machines running on one or more UCS ESXi hosts to be exercised by the benchmarking tool and measured for performance against the selected workload.
• Number of client ‘launcher’ virtual machines running on one or more ESXi hosts on an entirely separate cluster to simulate end-‐users connecting into the VDI environment.

15
• Management Console on a Windows Server OS. Figure 6 below shows a conceptual overview of a typical Login VSI layout.
Login VSI Workload Applications and User Operations
Design Guide Solutions Overview
FlashStack consists of a combined stack of hardware (storage, network and compute) and software (Cisco UCS Manager, Citrix XenDesktop, VMware vCenter/ESXi, and Pure Storage GUI.
• Network: Cisco Nexus 5500UP and Cisco UCS Fabric Interconnect 6248UP for external and internal connectivity of IP and FC network.
• Storage: Pure Storage FlashArray FA-‐405 with Fibre Channel connectivity
• Compute: Cisco UCS B200 M4 Blade Server
Figure 6: Conceptual diagram of the Login VSI layout used in FlashStack XenDesktop testing

16
Figure 7: FlashStack connectivity diagram
Figure 7 shows a detailed topology of the reference architecture configuration. A major goal of the architecture is to build out a highly redundant and resilient infrastructure. Thus, we used powerful servers with dual Fibre Channel ports connected redundantly to two SAN switches that were connected to redundant FC target ports on the FlashArray. The servers were hosted in a vSphere HA cluster and had redundant network connectivity.
Cisco UCS Server Configuration
A pair of Cisco UCS Fabric Interconnects 6248UP, and scaling up to two chassis with sixteen identical Intel CPU-‐based Cisco UCS B-‐series B200-‐M4 blade servers were deployed for hosting the virtual desktops. The UCS manager, UCS Fabric Interconnects and the components in the chassis were upgraded to 2.2.3f firmware level.
The server had the same Cisco VIC 1340 cards and they were connected four ports from each Cisco Fabric extender of the Cisco UCS chassis to the Cisco Fabric Interconnect, they were in turn connected to Cisco Nexus 5548UP Switch for upstream connectivity to access the Pure Storage FlashArray LUNs. The server configuration is described in Table 1.

17
Table 1: UCS server hardware configuration

18
Cisco UCS Service Profile configuration
In order to facilitate rapid deployment of UCS servers, a service profile template was created with the following characteristics [more details can be found in the deployment guide].
1. We configured boot from SAN policy so that the server booted from a Pure Storage boot LUN (see Figure 8 below)
2. We kept every other setting to the default, we didn’t tweak any parameters
3. The Ethernet and FC adapter policy was set to VMware policy
4. The BIOS defaults were used for the B200-‐M4 blade servers
5. We configured two vHBA FC adapters and four vNIC Eth adapters on the Cisco VIC cards to avoid any single point of failure.
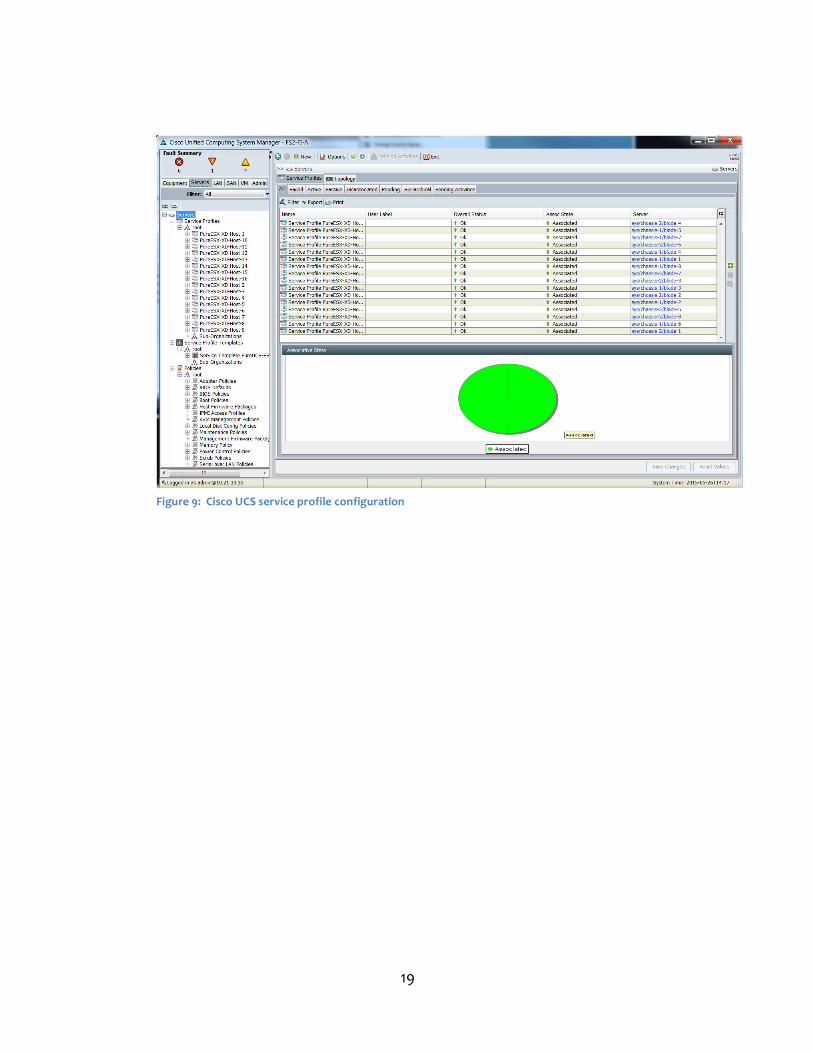
6. We deployed sixteen service profiles from the template and associated it with the blade servers in the two chassis. Figure 9 below shows the Cisco UCS manager snapshot of service profile setup for the tests.
Figure 8: Cisco UCS service profile template with boot from SAN policy configuration
19
Figure 9: Cisco UCS service profile configuration

20
VMware vSphere Configuration and Tuning
In this section, we discuss the ESXi 6.0 cluster configuration, network configuration and ESXi tuning for the system configuration.
ESXi Cluster and Storage Configuration
A datacenter and a cluster with up to sixteen hosts were configured with VMware High Availability (HA) clustering and Distributed Resource Scheduling (DRS) features. DRS was set to partially automated mode with power management turned off. The host EVC policy was set to Intel Haswell. The default BIOS for B200-‐M4 was chosen for all the service profiles. We had to create two datastore for the ESXi cluster for making the HA cluster datastore heartbeat work correctly. Note that DRS and HA were not active for our single host testing as a cluster size larger than that is required for those two features to be enabled.
Due to the simplicity of both the Pure Storage FlashArray and the Cisco UCS, configuration of VMware ESXi best practice configuration is accordingly simple. ESXi uses its Native Multipathing Plugin architecture to manage I/O multipathing to underlying SAN storage volumes. Pure Storage FlashArray volumes (while not actually an ALUA array—it indeed is active/active) volumes are claimed by default by the Storage Array Type Plugin (SATP) for ALUA devices. Therefore all devices (by default) would inherit the Most Recently Used (MRU) Path Selection Policy (PSP). This would limit I/O to a single path and would be a colossal detriment to performance, as only leveraging a single path/port to the array would remove the active/active nature and performance advantage of the FlashArray.
All the ESXi servers were configured to change the default PSP for Pure devices from MRU to Round Robin (with advanced configuration to alternate paths after every I/O). The following command was run on each ESXi server prior to the presentation of FlashArray devices:
esxcli storage nmp satp rule add -s "VMW_SATP_ALUA" -V "PURE" -M "FlashArray" -
P "VMW_PSP_RR" -O "iops=1"
Figure 10 shows a properly configured Pure Storage LUN.
Figure 10: VMware vSphere web client showing Pure Storage LUN multipathing configuration

21
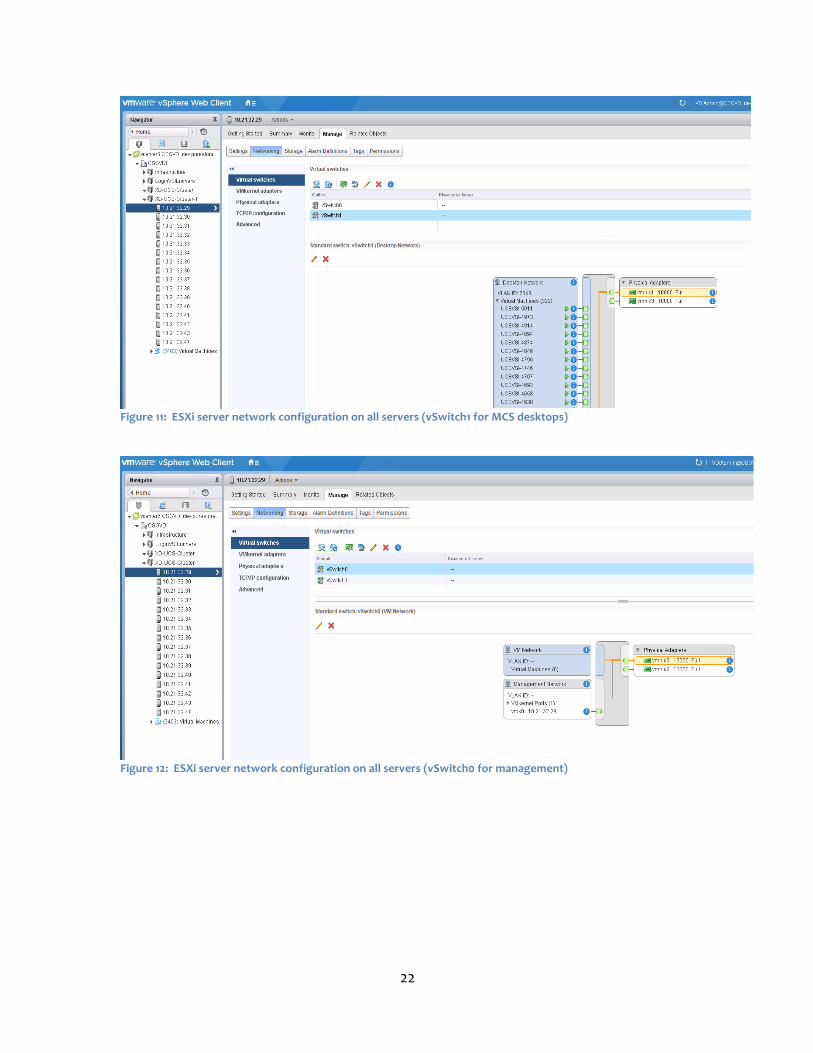
ESXi Network configuration
Two virtual switches each containing two vmnics were used for each host. We went with a standard vSwitch for this design. The redundant NICs were teamed in active/active mode and VLAN configurations were done on the upstream Cisco Nexus 5500 UP switches. The virtual switch configuration and properties are shown in Figure 11 and Figure 12 on the next page.
22
Figure 11: ESXi server network configuration on all servers (vSwitch1 for MCS desktops)
Figure 12: ESXi server network configuration on all servers (vSwitch0 for management)

23
Citrix XenDesktop 7.6.1 Configuration and Tuning
Citrix XenDesktop 7.6.1 customizations were quite minimal; some of the tuning is highlighted in the section.
1. Tune maximum simultaneous actions
The default concurrent XenDesktop concurrent operations are defined in the Hosting Configuration section of Citrix Studio. These default values are quite conservative and can be increased to higher values. Pure Storage FlashArray can withstand more operations including –
Max new actions per minute (recommended value >= 50)
Max Simultaneous actions (all types) (recommended value >= 50)
The higher values will drastically cut down the amount of time spent for operations such as creating and updating your machine catalogs.
Some caveats include –
a) These settings are global settings and will affect all machine catalogs and delivery groups. Catalogs with other disk arrays will suffer if you set these values higher, so enabling these will have adverse effects.
Figure 13: Changing maximum number of simultaneous actions on delivery controller

24
b) vCenter and Delivery Controller configurations, especially number of vCPUs, amount of memory, and the backing storage has implications from these settings. In order to attain the performance levels we have described in this white paper, it is important to note the ESXi configurations listed above.
2. We applied minimal policy settings shown in Table 2 to our Delivery Controller(s) across our entire Site. These and the additional XenDesktop policy settings are highly dependent upon the scope of operations for each unique XenDesktop deployment but those shown below should be suitable for almost any POC type of project (if printing is a requirement for a POC, make sure to set those policies shown below to their default or other appropriate value for your environment).
Table 2: Policy settings for XenDesktop Delivery Controller
Citrix XenDesktop Machines Creation Services Windows 7 desktop pool
VMware vCenter 6.0 was installed on a Windows Server 2012 R2 VM with 4 vCPU/16GB of memory. For smaller deployments using four or fewer UCS ESXi hosts, the amount of RAM can be halved. The Delivery Controller was installed on a separate Windows Server 2012 R2 VM with 4 vCPU/16 GB of memory for MCS desktop deployment and was used to create the

25
machine catalogs used for Login VSI testing. As we scaled up the environment, additional Delivery Controllers and StoreFront servers were added and will be covered in more detail later in this document in the testing results for various cluster sizes.
• The Machine Catalogs in our test environment all had the following characteristics:
• Windows 7 x64 Enterprise Desktop OS
• Power-‐managed VMs using Citrix Machine Creation Services
• Users connect to a new (random) desktop at each login and the machines were used to delivery Desktops only
• MCS Desktops were configured with 1 vCPU, 1.5GB of RAM and a 32GB vmdk local hard drive.
• We did not use a NetScaler Gateway for our testing as all components were within the Pure Storage lab environment.
• We kept machines assigned to our Delivery Groups 100% powered on and would recommend adjusting your power settings to be equal to or slightly above your estimated concurrent VDI sessions for that time of day in order to keep boot storms at a minimum.

26
Microsoft Windows 7 Desktop Configuration
Login VSI provided recommended guidelines for configuring the base Windows 7 image for the Office Worker Workload. The Windows 7 Enterprise (64-‐bit) desktop had the configuration shown in Table 3.
Table 3: Windows 7 template desktop configuration
The template image was also configured using all steps referenced in the XenDesktop Windows 7 Optimization Guide that can be found here.
Desktop Testing Tool – Login VSI 4.1.3
Login VSI is a 3rd party tool designed to simulate real-‐world deployments of virtualized desktop systems and study its effects on an entire virtualized infrastructure. The tool is scalable from a few virtual machines running on one VMware vSphere host up to thousands of virtual machines distributed across a cluster of vSphere hosts.
Login VSI runs a set of operations selected to be representative of real-‐world user applications, and reports data on the latencies of those operations. In our tests, we used this
27
tool to simulate a real world scenario, and then accepted the resultant application latency as a metric to measure end user experience.
For this experiment, we chose to use the new Login VSI Office Worker Workload. That workload simulates the following applications found in almost every environment:
• Microsoft Word
• Microsoft Excel
• Microsoft PowerPoint
• Microsoft Outlook
• Microsoft Internet Explorer
• Document browse
• Picture album browse
• Adobe Reader
• Archiving software
• Video playback software
• Doro PDF Writer
• Photo Viewer/Edit
The simulated desktop workload is scripted in a 48 minute loop when a simulated Login VSI user is logged on, performing generic Office worker activities. After the loop is finished it will restart automatically. Within each loop the response times of five specific operations are measured in a regular interval: twelve times in within each loop. The response times of these five operations are used to determine VSImax. VSImax is the “Virtual Session Index” that provides a useful aggregate single score that can be used to easily compare results when environment changes are made or different cluster configurations are tested.
The five operations from which the response times are measured are:
Notepad File Open (NFO)
Loading and initiating VSINotepad.exe and opening the open file dialog. This operation is
handled by the OS and by the VSINotepad.exe itself through execution. This operation seems
almost instant from an end-‐user’s point of view.
Notepad Start Load (NSLD)
Loading and initiating VSINotepad.exe and opening a file. This operation is also handled by
the OS and by the VSINotepad.exe itself through execution. This operation seems almost
instant from an end-‐user’s point of view.

28
Zip High Compression (ZHC)
This action copy's a random file and compresses it (with 7zip) with high compression
enabled. The compression will very briefly spike CPU and disk IO.
Zip Low Compression (ZLC)
This action copy's a random file and compresses it (with 7zip) with low compression enabled.
The compression will very briefly disk IO and creates some load on the CPU as well.
CPU
Calculates a large array of random data and spikes the CPU for a short period of time.

29
Pure Storage FlashArray Configuration
The FlashArray FA-‐405 contains no special configurations or value changes from any normal configuration. The FlashArray contains two drive bays fully populated with 256 GB SSDs with two NVRAM devices per shelf.
The UCS hosts are redundantly connected to the controllers with two FC connections to each controller from two HBAs on each host over the Fibre Channel protocol for a total of eight logical paths.
A cluster group was configured with all the ESXi hosts and a private volume was created for boot from SAN for each host. Two 50 TB LUNs were shared across the entire host group for hosting the desktops. A screen shot of the Pure Storage Storage tab is shown in Figure 14.
Figure 14: Pure Storage Boot and VDI LUNs

30
Solution Validation
In order to deploy and scale from hundreds to thousands of desktops a proper hardware and software configuration, a good test plan and success criteria are required. This section talks about the test infrastructure, hardware configuration and infrastructure VM setup we had in place for this reference architecture.
Test Setup
The XenDesktop and other infrastructure components were placed on a dedicated infrastructure host that was completely separate from the FlashStack.
For the XenDesktop FlashStack, the boot LUNs for each ESXi hosts and all the desktops were hosted on a single 5.5 TB (raw) FlashArray FA-‐405.
The tested configuration included:
• One 5.5 TB Pure Storage FlashArray FA-‐405 in HA configuration, including two controllers and one disk shelf:
o 2 x 50 TB volume was provisioned on Pure Storage FlashArray
o 16 X 50 GB Boot volume for the sixteen Cisco UCS Blade servers
• We started with one, then incrementally scaled up to 16 Cisco UCS B-‐series blade server based on dual socket Intel E5-‐2670v3 @ 2.3GHz processor with 256 GB of memory running ESXi 6.0 as the hypervisor were used to host the desktops
• Two dedicated infrastructure servers in an HA-‐enabled cluster were used to host the all of the infrastructure virtual machines including:
o Active directory VM, DNS VM, and DHCP VM
o Citrix Delivery Controller(s)
o Citrix StoreFront Server(s)
o Citrix Licensing Server
o Citrix Database Server
o VMware vSphere Virtual Center server
o Microsoft SQL server for vCenter
o Login VSI Management Console
Test Plan and Success Criteria
The test plan was to first determine the number of desktops that can be deployed on a single server and use that as a building block for scaling and deploying desktops on two entire

31
blade server chassis or 16 servers. The single server testing was done to find out the breaking point of the server starting with 150 desktops on one server and scaling it in increments of 10. Once the maximum number of VMs for a given cluster size is found, we determine our recommended VMs per host density and retest.
The success criteria is as follows:
1. The server utilization has to be less than 100% CPU and 100% memory consumption with no memory ballooning or swapping for our recommended number of virtual machines per host.
2. Login VSI provides a Baseline Performance Score as listed below in addition to the VSImax value. Successful tests must fall into the ‘Good’ category of that metric in order to confirm both good end-‐user experience and adequate environment performance.
Table 4: Login VSI Baseline Scoring Values
The baseline score must also be achieved using Login VSI ‘Benchmark mode,’ which locks down certain settings in order to provide a standardized scoring methodology.
3. Related to success criteria #1 above; we will analyze the Login VSI results and extrapolate the proper number of VMs that can be run on each cluster size based upon virtual desktop aggregate performance. Since the VSImax value generally means the absolute maximum of concurrent VDI sessions that can be run on a cluster, lowering that value by approximately 10%-‐15% is a good practice in order to ensure adequate server CPU and memory headroom for a good user experience and account for randomized high CPU and memory tasks that often occur in VDI environments. In order to confirm that the (VSImax – 10-‐15%) value is indeed a supportable amount, the Login VSI test will be re-‐run with that value to verify test criteria success and results will be shown for all important components.
4. The backend Pure Storage FlashArray is keeping up with the I/O needs and is getting below 3 millisecond latency.
Once we determined the single server scalability numbers we then scaled the number of servers from 1 to 2 to 4 to 8 servers (1 full chassis) and finally 16 or two complete chassis. At each point we captured the ESXi server CPU/Memory/Disk utilization along with the Pure Storage FlashArray disk utilization data. Login VSI provided a detailed report on each of the test runs which would determine if our environment was properly configured and if we were seeing linear scaling of VMs per host as expected.

32
Scalability Results
This section highlights the test results for the scalability testing starting with single server scale testing which would be used in the subsequent two, four, eight and sixteen server testing.
For each UCS cluster size, the results will be broken into two parts and shown as follows:
1. Maximum Supported VMs per UCS Cluster Size
a. The absolute VSImax value, VSI Baseline Performance Score and VSImaxv4 chart showing the environment’s behavior during the simulation.
b. Charts from the ESXi cluster showing: CPU utilization and overall memory utilization (including ballooning and swapping when it occurs).
c. Pure Storage Dashboard showing the array performance during the entire simulation run including latency, IOPs, bandwidth, storage spaced used and data reduction.
2. Recommended VMs per UCS Cluster Size
a. The VSImax value will not be reached in this simulation, but the VSI Baseline Performance Score and VSImaxv4 chart showing the environment’s ability to handle the recommended concurrent VDI workloads will be used to confirm our recommended sizing guidelines.
b. Charts from the ESXi cluster showing: CPU utilization, overall memory utilization (including any minimal ballooning).
c. Pure Storage Dashboard showing the array performance during the entire simulation run including latency, IOPs, bandwidth, storage spaced used and data reduction.

33
Single Server Testing
Figure 15 below describes the test setup for a single UCS server. A single Cisco UCS B200-‐M4 blade server is deployed and concurrent VDI sessions are executed on the single host until CPU and/or Memory saturation is reached. Storage performance is also closely monitored and captured. Using Login VSI as the workload generator the test data is verified to see if it meets the success criteria outlined in an earlier section. The number of desktops at the VSImax point is determined through experimentation and from that value approximately 10% to 15% is subtracted and the resultant number of desktops are re-‐ran within Login VSI to confirm success criteria are met.
Figure 15: Single server scale test configuration

34
Test Results: VSImax on One Server
Running the Login VSI Office Workload Benchmark on a single server (with all other servers in the Cluster in maintenance mode) we were able to reach a VSImax value of 166 desktops on a single host while achieving a Login VSI baseline performance score of 1066. The resource utilization of the ESXi server and storage utilization is shown below, with the saturation point coming on the right-‐hand side of the VSImax v4 chart. The exact point where Login VSI judges maximum VM density is denoted by a red X.
Figure 16: VSImax v4 chart for a single UCS host

35
Figure 17: ESXi CPU utilization for a single UCS host showing saturation at 166 VMs
Figure 18: ESXi memory utilization for a single UCS host showing a small amount of ballooning

36
Figure 19: Pure Storage Dashboard for a single UCS host during Login VSI simulation
Test Results: 150 Concurrent XenDesktop MCS Sessions on One Server
Once we determined the Login VSI max value of 166 VMs per single host, we then re-‐ran the Login VSI simulation with 150 concurrent VDI sessions, as that value is approximately ten percent less than VSImax. The results of that test proved that 150 concurrent VMs per single host utilizes a high percentage of the server’s memory and CPU resources while still provided an excellent user experience as well as adequate CPU and memory headroom for random CPU and memory spikes. The FlashArray was not taxed in any regard during either simulation using 1 host as the dashboard diagram below clearly shows.

37
Figure 20: VSImax v4 Chart for a single UCS host running 150 VDI sessions
Figure 21 -‐ Single ESXi host CPU utilization for 150 VDI sessions showing a maximum of 91% CPU load

38
Figure 22: Single ESXi UCS host memory utilization for 150 VDI sessions showing no ballooning or swapping.
Figure 23: Pure Storage Dashboard for a single UCS host during 150VM Login VSI simulation
UCS Host(s) Machine
Catalog Size VSI Baseline Performance
Max Latency (ms)
Average Latency (ms)
1 150 1044 0.6 0.3 Table 5: Storage summary for a single UCS host during 150VM Login VSI simulation

39
Two Server Testing
Figure 24 below describes the test setup for a two server cluster testing. Two Cisco UCS B200-‐M4 blade servers are active and 380 XenDesktop MCS desktops are created on them. We arrived at 380 MCS desktops by using the 175 MCS desktop pool from the previous single UCS server testing section as a rough sizing guide and experimented from there. Using Login VSI as the workload generator the cluster is exercised to determine the maximum number of concurrent VDI sessions that can be hosted before the server resources become saturated.
Figure 24: Two UCS servers scale test configuration
Test Results: VSImax on Two Servers
Running the Login VSI Office Workload Benchmark on a two servers (with all other servers in the Cluster in maintenance mode) we were able to reach a VSImax value of 326 desktops on two hosts while achieving a Login VSI baseline performance score of 1065. The resource utilization of the ESXi servers and storage utilization is shown below.

40
Figure 25: VSImax performance chart for two UCS server cluster
Figure 26: Single ESXi CPU utilization chart of one UCS server from two UCS server cluster showing a maximum CPU load
41
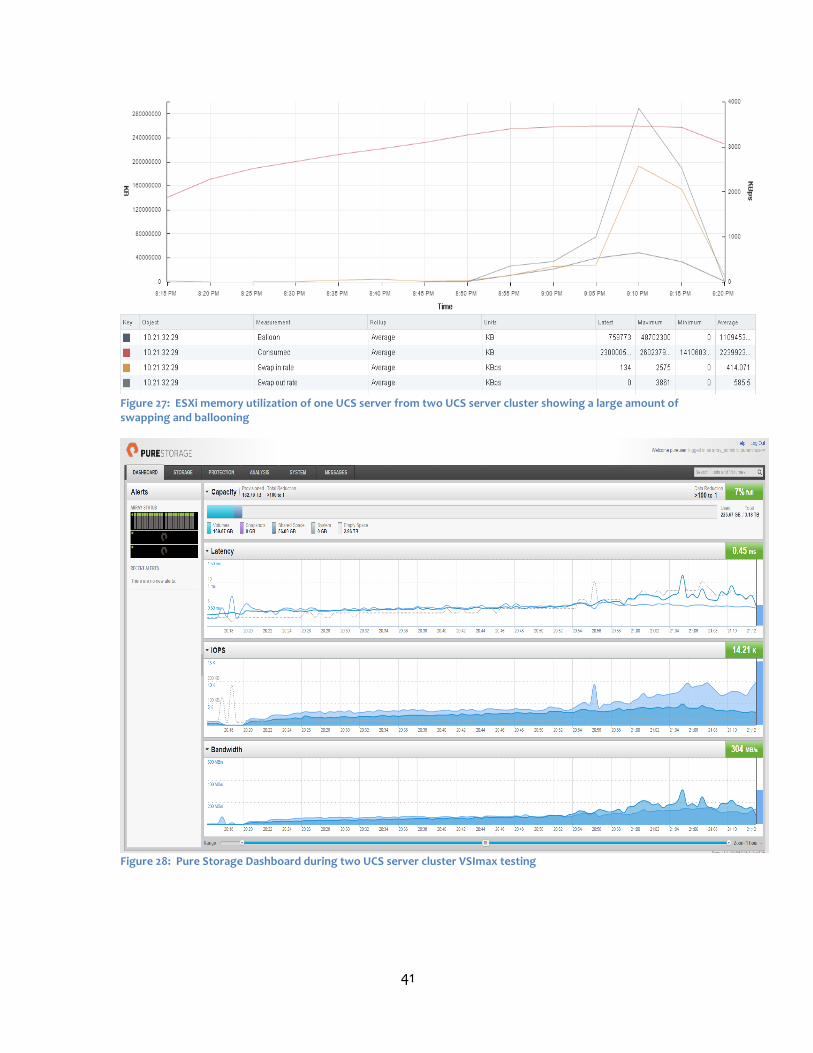
Figure 27: ESXi memory utilization of one UCS server from two UCS server cluster showing a large amount of swapping and ballooning
Figure 28: Pure Storage Dashboard during two UCS server cluster VSImax testing

42
Test Results: 300 Concurrent XenDesktop MCS Sessions on Two Servers
Once we determined the Login VSI max value of 326 VMs per 2 host cluster, we then re-‐ran the Login VSI simulation with 300 concurrent VDI sessions, as that value is approximately ten percent less than VSImax and also maintains linear scaling of 150VMs per host. The results of that test proved that 300 concurrent VMs per single host utilizes a high percentage of the server’s memory and CPU resources while still providing an excellent user experience as well as adequate CPU and memory headroom for random CPU and memory spikes. As shown in Figure 32 and Table 6, the FlashArray was easily able to handle the 300 VDI session simulation -‐ maintaining sub-‐ms latency throughout the entire test.
Figure 29: VSImax performance characteristic of 300 concurrent VDI sessions

43
Figure 30: ESXi CPU utilization of one UCS server from two UCS server cluster during 300 concurrent VDI session testing
Figure 31: ESXi Memory Utilization of one UCS server from two UCS server cluster during 300 Concurrent VDI Session Testing.

44
Figure 32: Pure Storage Dashboard during two UCS server cluster 300 concurrent VDI session testing
UCS Hosts Machine
Catalog Size VSI Baseline Performance
Max Latency (ms)
Average Latency (ms)
2 300 1057 0.55 0.4 Table 6: Storage summary for two UCS host cluster during 300VM Login VSI simulation
Four Server Testing
Figure 33 below describes the test setup for a four server testing. Four Cisco UCS B200-‐M4 blade servers are deployed and 750 desktops are deployed on them. Using Login VSI as the workload generator the cluster is exercised to determine the maximum number of concurrent VDI sessions that can be hosted before the server resources become saturated.

45
Figure 33: Four server scale test configuration
Test Results: VSImax on Four Servers
Running the Login VSI Office Workload Benchmark on a four servers (with all other servers in the Cluster in maintenance mode) we were able to reach a VSImax value of 698 desktops on four hosts while achieving a Login VSI baseline performance score of 1065. The resource utilization of the ESXi server and storage utilization is shown below.
We saw similar heavy CPU and memory utilization on the server as seen in one node and two node testing (detailed Login VSI reports are available on request).

46
Figure 35: ESXi CPU utilization of one UCS server from four UCS server cluster showing a high CPU load
Figure 34: VSImax performance characteristics for four server cluster

47
Figure 36: ESXi memory utilization of one UCS server from four UCS server cluster showing large amount of swapping and ballooning
Figure 37: Pure Storage Dashboard during four UCS server cluster VSImax testing

48
Test Results: 600 Concurrent XenDesktop MCS Sessions on Four Host Cluster
Once we determined the Login VSI max value of 698 VMs on a four host cluster, we then re-‐ran the Login VSI simulation with 600 concurrent VDI sessions, as that value is approximately fifteen percent less than VSImax and shows linear scaling of 150 VMs per host. The results of that test proved that 600 concurrent VMs per single host utilizes a high percentage of the server’s memory and CPU resources while still providing an excellent user experience as well as adequate CPU and memory headroom for random CPU and memory spikes. The FlashArray maintained sub-‐millisecond latency throughout the test using 4 hosts as the dashboard and table in the following results shows.
Figure 38: VSImax performance characteristic of 600 concurrent VDI sessions

49
Figure 39: ESXi CPU utilization of one UCS server from four UCS server cluster during 600 concurrent VDI session testing
Figure 40: ESXi memory utilization of one UCS server from four UCS server during 600 concurrent VDI session testing

50
Figure 41: Pure Storage Dashboard during four UCS server cluster 600 concurrent VDI session testing
UCS Hosts Machine
Catalog Size VSI Baseline Performance
Max Latency (ms)
Average Latency (ms)
4 600 1042 1.5 0.75 Table 7: Storage summary for four UCS host cluster during 600VM Login VSI simulation
Eight Servers or Single Chassis Testing
Figure 42 below describes the test setup for an eight server simulation. Eight Cisco UCS B200-‐M4 blade servers are deployed and 1450 desktops are moved over to them. Using Login VSI as the workload generator the test data is verified to see if it meets the success criteria and the results are noted.

51
Test Results: VSImax on 8 Servers or Single Chassis
Running the Login VSI Office Workload Benchmark on eight servers we were able to reach a VSImax value of 1421 desktops while achieving a Login VSI Baseline Performance score of 1052. In this scenario the memory swapping and ballooning, along with host queuing on the cluster hit a high level and introduced latency into the environment and resulted in a poor end-‐user experience. For this reason, our recommended sizing of a maximum of 150 VMs per host is of paramount importance at this scale and above in order to achieve an environment that will be acceptable to your end-‐user community.
Figure 42: Eight servers or a single chassis scale test configuration

52
Figure 43: VSImax performance characteristics for eight server cluster running 1450 concurrent VDI sessions

53
Test Results: 1200 Concurrent XenDesktop MCS Sessions on Eight Servers
Once we determined the Login VSI max value of 1421 VMs on an eight host cluster, we then re-‐ran the Login VSI simulation with 1200 concurrent VDI sessions, as that value is approximately fifteen percent less than VSImax and shows our recommended linear scaling of 150 VMs per host. The results of that test proved that 1200 concurrent VMs per single host utilizes a high percentage of the server’s memory and CPU resources while still provided an excellent user experience as well as adequate CPU and memory headroom for random CPU and memory spikes. The FlashArray continued to provide extremely low latency despite heavy IOPs and bandwidth load during the simulation as the results show below.
Figure 44: VSImax performance characteristics during 1200 concurrent VDI session test

54
Figure 45: Overall ESXi CPU utilization for 8 host UCS server cluster during 1200 concurrent VDI session test
Figure 46: Overall ESXi memory utilization for 8 host UCS server cluster during 1200 concurrent VDI session test

55
To further show the resiliency and robustness of this hardware stack, we elected to simulate a cable failure during the 1200 user simulation run. We disconnected a fiber-‐channel cable during this test and still experienced sub-‐ms latency throughout the simulation. The error message on the Pure Dashboard that can be seen in Figure 47 where it immediately notified the administrator of the component failure and the array can also be configured to send out automated email alerts.
Figure 47: Pure Storage Dashboard during 1200 concurrent VDI sessions test showing FC cable failure error message
UCS Hosts Machine
Catalog Size VSI Baseline Performance
Max Latency (ms)
Average Latency (ms)
8 1200 933 0.75 0.6 Table 8: Storage summary for eight UCS host cluster during 1200VM Login VSI simulation

56
Test Results: 2,000 Concurrent XenDesktop MCS Sessions on Sixteen Servers or 2 Complete Chassis
Our final simulation that is shown in Figure 48 was to simulate 2,000 concurrent VDI sessions on two fully populated UCS chassis or 16 hosts. As before, we used the Login VSI Office workload to exercise the FlashStack and collect performance metrics.
Figure 48: Sixteen servers or a two chassis scale test configuration
Running the Login VSI Office Workload Benchmark on eight servers we were able to run 2,000 concurrent desktops while achieving an outstanding Login VSI baseline performance score of 955. The resource utilization of the ESXi server and storage utilization is shown below. At this scale, we implemented a second delivery controller into the environment to help with load balancing for the high volume of launched XenDesktop sessions.

57
Figure 49: VSImax performance characteristics during 2,000 concurrent VDI session test
Figure 50: Overall ESXi CPU utilization for 16 host UCS server cluster during 2,000 concurrent VDI session test

58
Figure 51: Overall ESXi memory utilization for 16 host UCS server cluster during 2,000 concurrent VDI session test
Figure 52: Pure Storage Dashboard during 2,000 concurrent VDI session test showing exceptional performance and 57.7 to 1 data reduction.

59
UCS Hosts Machine
Catalog Size VSI Baseline Performance
Max Latency (ms)
Average Latency (ms)
16 2,000 955 2.9 0.9 Table 9: Storage summary for sixteen UCS host cluster during 2,000VM Login VSI simulation
Test Results: Boot Storm of 2,000 MCS Desktops and Recomposing 2,000 MCS Desktops
For our two final tests, we decided to boot storm 2,000 MCS desktops at once and later recompose 2,000 desktops to a different snapshot in order to show how the array performs during these common VDI administrator operations at scale.
For the boot storm test, we were able to power on all 2,000 MCS desktops in approximately 14 minutes during which time the array saw sustained 100K IOPS and over 2GB of bandwidth while maintaining an average latency of 1 ms. Figure 53 shows the Dashboard of the array during this operation.
Figure 53: Pure Dashboard during 2,000 VDI desktop boot storm.
For the recompose operation, we applied a set of monthly Microsoft patches, took a

60
snapshot and updated the entire Machine Catalog of 2,000 desktops to the later snapshot. The operation took approximately 40 minutes to complete from start to finish during which time the array saw sustained bandwidth of over 2GB/s (primarily reads) and 60K IOPs while maintaining sub-‐ms latency throughout. Figure 54 shows the array performance during the Machine Catalog update operation.
Figure 54: Pure Storage Dashboard performance characteristics during 2,000 XenDesktop Machine Catalog update
61
Test Summary
Based on the performance data from one, two, four, eight and sixteen servers testing, we conclude the following:
1. We saw up to 100K IOPS during boot-‐up of 2,000 desktops on sixteen servers with a consistent ~ 1 ms latency.
2. The Pure Storage FlashArray consistently showed a 0.5 ms latency throughout the tests and an average of 0.35 ms (for both reads and write) when using recommended 150 VMs per host sizing for up to eight hosts. Latency slightly increases when using two fully populated UCS chassis running 2,000 concurrent VDI sessions but was still well within usable parameters and did not impact end user experience in any way.
3. Linear scaling of VMs per host can be achieved through a single chassis and up to 2,000 desktops can be easily hosted on two chassis with minimal latency despite driving tens of thousands of IOPs and hundreds of MBs of bandwidth.
4. The data reduction of between 57.7 and 100 to 1 during 2,000 user testing was due to our tests using identical, non-‐persistent MCS pools that were based upon a single template image using Purity 4.5.0. The FA-‐405 has ample space to account for additional applications and user data beyond the base Win7 x64 image used in this testing. 2,000 concurrently hosted desktops took up just 510GB of space.

62
Design Considerations and Sizing Guidelines
The space consumption and the IOPS we saw in the 2,000 desktops deployment could easily have been sustained in the smallest FlashArray configuration. As the deployment grows, it is easy to expand capacity by adding more shelves to the array without downtime.
A pilot can be implemented on a two-‐controller HA system and ½ drive shelf system. As the deployment passes out of the pilot phase, you can upgrade to a two-‐controller HA system and full shelf for 2,000 desktops. As your user data grows, additional shelves can be added. Both controllers and shelves can be added without downtime.
Based on the documented results in this design guide we believe that the FA-‐405 can accommodate up to 2,000 desktops from an IOPS perspective. For a 3,000 desktop deployment, we recommend a fully configured FA-‐420 with two controllers and two or more drive shelves. These sizing guidelines are approximations based upon the current testing and workload characterization, your actual desktop density may vary depending on how the desktops are configured, whether or not user data is stored in the desktops or the array, and a variety of other factors. Pure Storage recommends a pilot deployment in your user community to fully-‐understand space and performance requirements.
Adding a new shelf to increase capacity is very straightforward and involves simply connecting SAS cables from the controller to the new shelf that can be done while the array is online. The shelf addition can be done non-‐disruptively and without any impact to the desktop users (no down time nor any performance impact at all). The Pure Storage FlashArray features stateless controllers, which means all the configuration information is stored on the storage shelves instead of within the controllers themselves. In the event of a controller failure, one can easily swap out a failed controller with a new controller without reconfiguring SAN zoning, which again can be done non-‐disruptively.

63
Summary of Findings
• We deployed 2,000 Citrix XenDesktop MCS-based linked clone Windows 7 desktops and ran a realistic load generator with Login VSI that simulated 2,000 users performing common computing tasks, resulting in achievement of the best Login VSI Baseline Score in every single test that was performed, even where VSImax was reached. This score means the majority of the applications used in the Office workload performed with outstanding performance and response times.
• Throughout the testing, FlashArray delivered up to 100,000 IOPS and maintained latency under 1 ms, demonstrating the FlashArray’s consistent latency and ability to deliver the best all-flash VDI end-user experience at all times. FlashArray delivers a better desktop experience for end-‐users than dedicated laptops with SSDs, and doesn’t risk end-‐user experience by relying on caching as hybrid flash/disk arrays do.
• In total throughout the testing we deployed more than 2,000 desktops (each of 32 GB disk size), together only consuming about 510 GB of physical storage on the FlashArray. This massive data reduction (57.7-‐to-‐1) is the result of the high-‐performance inline data reduction (deduplication and compression) delivered by the FlashArray, which enables using any combination of linked clones or persistent full-clone desktops – both of which reduce to about the same amount of space on the array.
• As tested, the 5.5 TB FlashArray FA-‐405 delivered best-in-class VDI performance for 2,000 desktops.
• Running Unmap at least weekly to reclaim dead space is a critical operation for any VDI implementation on Pure Storage and is especially important for non-‐persistent linked-‐clones. For more information please see the following primer on Cody Hosterman’s blog.
• Throughout the testing we performed common VDI administrator operations and found a drastic reduction in time for cloning persistent desktops, (re)booting desktops, and other day-‐to-‐day virtual desktop operations. Taken together these operational savings deliver substantial efficiency gains for VDI administrators throughout the VDI day.
• The power footprint for the tested FA-‐405 FlashArray was 8 Amps (110V) which is a fraction of any mechanical disk storage array available in the marketplace. This configuration consumed four rack units (4 RU) in data center space.
• This reference architecture has shown FlashStack CI to be able to provide multiple XenDesktop building blocks so as to better provide sizing and scaling recommendations. Customers can add more server and infrastructure components to scale the architecture out to 1000’s of desktops. Based on the results, we believe a single FA-405 can support up to 2,000 desktops with any mix of linked clones

64
and/or persistent desktops.
Conclusions
We set out to prove that FlashStack Converged Infrastructure with Pure Storage FlashArray offers the ultimate storage for virtual desktop deployment and we achieved the same score while we scaled the desktops from one server to sixteen servers while running an industry standard desktop workload generator. The Login VSI scores reflect the latency observations on the Pure Storage dashboard that showed minimal latency throughout the testing and even during boot storm, login storm and test ramp-‐up scenarios. Factors like rapid deployment, ease of storage management, lower storage cost, lower power, rack space savings, and lower cooling requirements make the TCO for large scale deployments even more attractive.
About Login VSI
Login VSI provides proactive performance management solutions for virtualized desktop and server environments. Enterprise IT departments use Login VSI products in all phases of their virtual desktop deployment—from planning to deployment to change management—for more predictable performance, higher availability and a more consistent end user experience. The world's leading virtualization vendors use the flagship product, Login VSI, to benchmark performance. With minimal configuration, Login VSI products works in VMware Horizon View, Citrix XenDesktop and XenApp, Microsoft Remote Desktop Services (Terminal Services) and any other Windows-‐based virtual desktop solution.
For more information, download a trial at www.loginvsi.com.
About the Authors
Ravindra “Ravi” Venkat is a Virtualization Solutions Architect at Pure Storage for over three and half years where he strives to be the company’s expert at the intersection of flash and virtualization. Prior to that he held a similar role at Cisco for three plus years where he helped drive the virtualization benefits of Cisco's new servers -‐ Unified Computing System (UCS). He helped build reference architectures and virtualization solutions with Citrix, VMware, and Cisco
UCS with various storage partners that are still being used today.
Prior to that he was part of the storage ecosystem engineering team at VMware for three years, and a lead engineer at VERITAS working on storage virtualization, volume management and file system technologies for the prior eight years.
Ravi maintains a blog at http://www.purestorage.com/blog/author/ravi and you can follow

65
him on twitter @ravivenk.
Kyle Grossmiller is a VDI Solutions Architect at Pure Storage since early 2015 where he focuses on helping customers bring their VDI projects to the next level of success using Pure’s All-‐Flash Arrays. Prior to joining Pure, Kyle was at Lockheed Martin Space Systems Company for over 12 years where he worked in dual IT roles supporting their engineering user base as well as serving as the technical lead for an internal private-‐cloud VDI.
Kyle maintains a blog at http://www.purestorage.com/blog/author/kyle/ and you can follow him at twitter @kylegrossmiller

© 2015 Pure Storage, Inc. All rights reserved. Pure Storage, Pure1, and the P Logo are trademarks of Pure Storage, Inc. All other trademarks are the property of their respective owners.
Pure Storage, Inc. Twitter: @purestorage
www.purestorage.com
650 Castro Street, Suite #260 Mountain View, CA 94041
T: 650-290-6088 F: 650-625-9667
Sales: [email protected] Support: [email protected]
Media: [email protected] General: [email protected]