flaws in fst research - applied personnel...
TRANSCRIPT

http://AppliedPersonnelResearch.com Copyright © 2006 Joel Wiesen
1
Limitations and Flaws in the Research Supporting SFSTs
By Joel Wiesen, Ph.D.Applied Personnel Research
NACDL/NCDD 10th Annual SeminarOctober 12, 2006

http://AppliedPersonnelResearch.com Copyright © 2006 Joel Wiesen
2
SFST Research Is Flawed
• Flaws in:- The original research- Later studies- Training- Field implementation- Test content
-- Removed from driving tasks

http://AppliedPersonnelResearch.com Copyright © 2006 Joel Wiesen
3
My Background
• Industrial Psychologist• Specialize in testing• Published test author• Peer reviewer• Expert witness in testing cases• Presenter at professional testing conferences
http://AppliedPersonnelResearch.com Copyright © 2006 Joel Wiesen
4
Overview of Talk
• Criteria for evaluating tests and test research- Professional standards
• Three major NHTSA SFST research reports
http://AppliedPersonnelResearch.com Copyright © 2006 Joel Wiesen
5
APA Testing Standards
• Standards for Educational and Psychological Testing (1999)
• Published jointly by:- American Psychological Association - American Educational Research Association- National Council on Measurement in Education

http://AppliedPersonnelResearch.com Copyright © 2006 Joel Wiesen
6
Definition of a Test
• “An evaluative device or procedure in which a sample of an examinee’s behavior in a specified domain is obtained and subsequently evaluated and scored using a standardized process.” (Page 183)
http://AppliedPersonnelResearch.com Copyright © 2006 Joel Wiesen
7
SFST Research Studies
• We will look today at:- Burns and Moskowitz, 1977- Burns and Anderson, 1995- Stuster and Burns, 1998

http://AppliedPersonnelResearch.com Copyright © 2006 Joel Wiesen
8
Approach to Each Study
• Summary• Strengths • Weaknesses• Overall evaluation

http://AppliedPersonnelResearch.com Copyright © 2006 Joel Wiesen
9
Burns and Moskowitz, 1977
• Psychophysical Tests for DWI Arrest

http://AppliedPersonnelResearch.com Copyright © 2006 Joel Wiesen
10
Burns and Moskowitz, 1977:Summary
• Goals:- Evaluate then current FSTs- Develop/evaluate more reliable FSTs- Standardize test administration- Recommend “best” SFSTs- Evaluate relationship between
BAC and driving impairment

http://AppliedPersonnelResearch.com Copyright © 2006 Joel Wiesen
11
Burns and Moskowitz, 1977:Summary
• Findings:- Correlations of test score with BAC- Correlation of BAC with driving- Inter-rater reliability

http://AppliedPersonnelResearch.com Copyright © 2006 Joel Wiesen
12
Burns and Moskowitz, 1977:Summary
• Correlations of test scores with BAC:OLS: .48WAT: .55Nystagmus: .67Total score: .67 (Page 17)
http://AppliedPersonnelResearch.com Copyright © 2006 Joel Wiesen
13
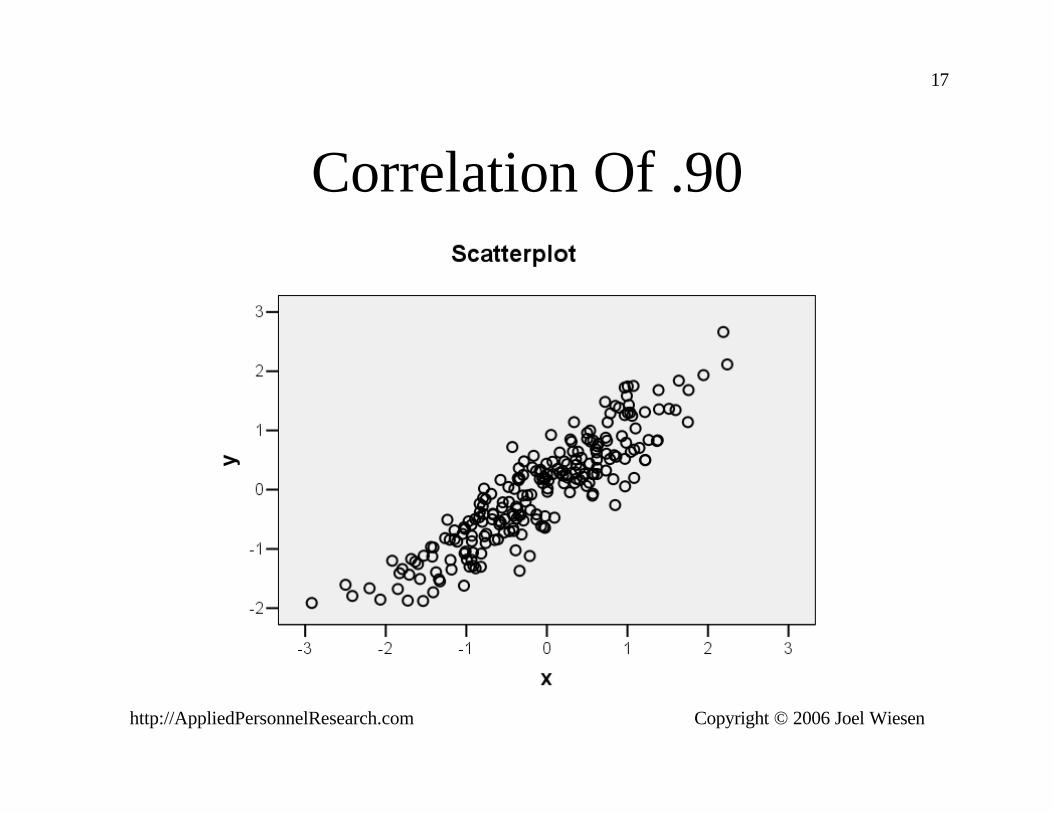
Review of Correlation Coefficients
• A correlation is a statistic, denoted as r• Correlations are numerically calculated• r can range from -1 to +1• r = 0 means there is no linear relationship• r = 1 means a perfect linear relationship• r = -1 means a perfect linear relationship

http://AppliedPersonnelResearch.com Copyright © 2006 Joel Wiesen
14
Correlation Of Zero

http://AppliedPersonnelResearch.com Copyright © 2006 Joel Wiesen
15
Correlation Of .30

http://AppliedPersonnelResearch.com Copyright © 2006 Joel Wiesen
16
Correlation Of .60
http://AppliedPersonnelResearch.com Copyright © 2006 Joel Wiesen
17
Correlation Of .90

http://AppliedPersonnelResearch.com Copyright © 2006 Joel Wiesen
18
Burns and Moskowitz, 1977:Summary
• Correlations of test score with BAC:OLS: r = .48WAT: r = .55Nystagmus: r = .67Total score: r = .67 (Page 17)

http://AppliedPersonnelResearch.com Copyright © 2006 Joel Wiesen
19
Correlation Of .67

http://AppliedPersonnelResearch.com Copyright © 2006 Joel Wiesen
20
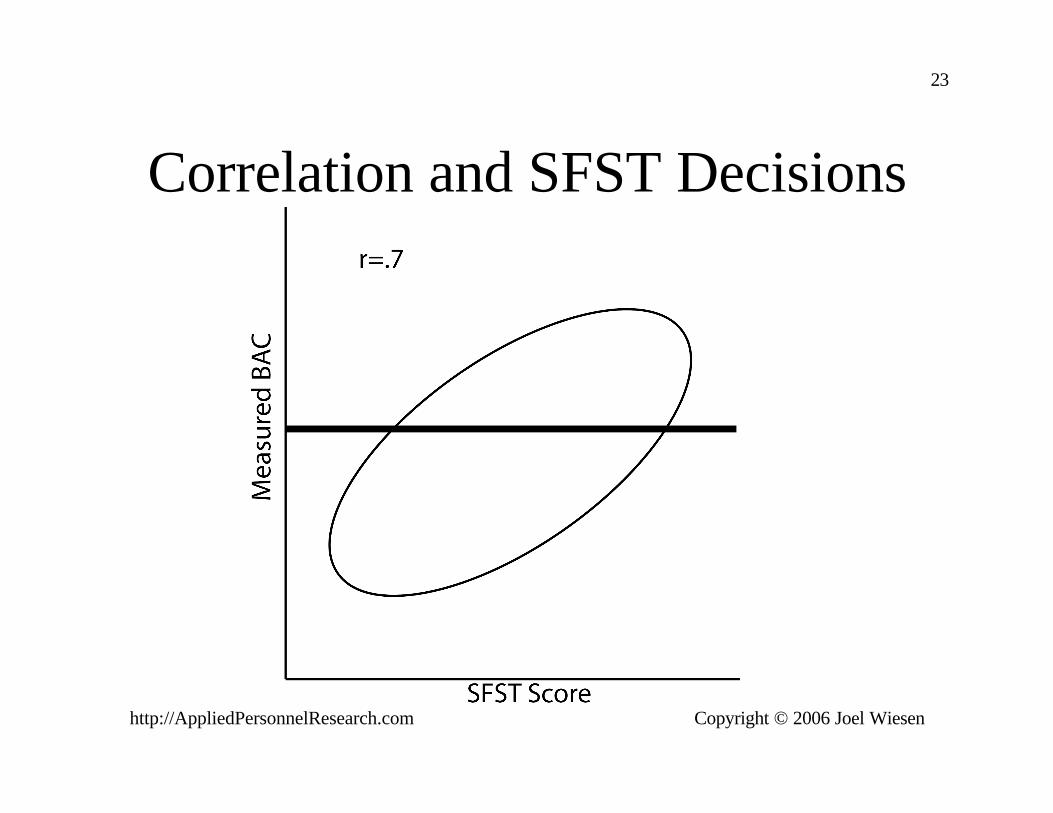
Correlation and SFST Decisions
• Understand some limits of SFSTs• False Alarm Rates

http://AppliedPersonnelResearch.com Copyright © 2006 Joel Wiesen
21
Correlation and SFST Decisions

http://AppliedPersonnelResearch.com Copyright © 2006 Joel Wiesen
22
Correlation and SFST Decisions
http://AppliedPersonnelResearch.com Copyright © 2006 Joel Wiesen
23
Correlation and SFST Decisions
http://AppliedPersonnelResearch.com Copyright © 2006 Joel Wiesen
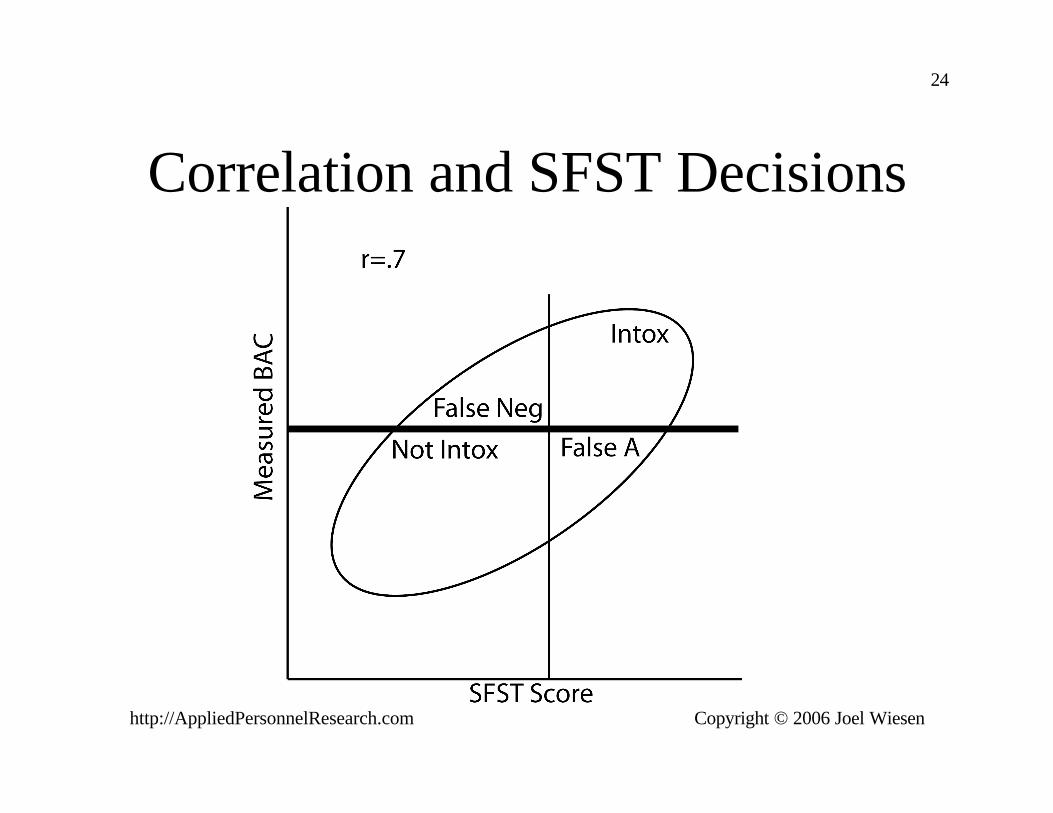
24
Correlation and SFST Decisions

http://AppliedPersonnelResearch.com Copyright © 2006 Joel Wiesen
25
Correlation and SFST Decisions
• Decrease false alarms and false negatives• Only ONE WAY to do this• Increase the validity of test
- Make the oval thinner

http://AppliedPersonnelResearch.com Copyright © 2006 Joel Wiesen
26
Correlation and SFST Decisions
• To improve validity:- Improve the test- Improve the training of test administrators
• Hard to improve- After 30 years of improvements

http://AppliedPersonnelResearch.com Copyright © 2006 Joel Wiesen
27
Burns and Moskowitz, 1977:Summary
• Correlations of SFSTs with drivingsimulation reaction time:
OLS: r = .15 WAT: r = .12Nystagmus: r = .27 (Page 55)

http://AppliedPersonnelResearch.com Copyright © 2006 Joel Wiesen
28
Burns and Moskowitz, 1977:Summary
• Inter-rater reliability (Page 33)
OLS: .82WAT: .80Nystagmus: .90Total: .92

http://AppliedPersonnelResearch.com Copyright © 2006 Joel Wiesen
29
Reliability
• The degree to which test scores are repeatable
• Would a suspect get the same score if:- he/she had the same BAC tomorrow and
were tested again tomorrow- tested twice by two trained administrators - the test were given at different times of
day, or in different locations.
http://AppliedPersonnelResearch.com Copyright © 2006 Joel Wiesen
30
Reliability
• Reliability is NOT validity

http://AppliedPersonnelResearch.com Copyright © 2006 Joel Wiesen
31
Reliability and Validity
• High reliability• Low validity
• Low reliability• High validity

http://AppliedPersonnelResearch.com Copyright © 2006 Joel Wiesen
32
Reliability and Validity
• A test must be reliable to be valid• A test can be reliable and not valid• Statistical relationship:

http://AppliedPersonnelResearch.com Copyright © 2006 Joel Wiesen
33
Inter-Rater Reliability
• The degree to which a suspect would get the same score from any trained test administrator

http://AppliedPersonnelResearch.com Copyright © 2006 Joel Wiesen
34
Burns and Moskowitz, 1977:Strengths
• Double-blind design- Officers did not see drinkers outside of
testing sessions• 238 participants

http://AppliedPersonnelResearch.com Copyright © 2006 Joel Wiesen
35
Burns and Moskowitz, 1977:Weaknesses
• Report narrative not clear• Report deficiencies• Research design not followed• Data analyses contain errors• Data analyses not fully reported• Data analyses biased

http://AppliedPersonnelResearch.com Copyright © 2006 Joel Wiesen
36
Burns and Moskowitz, 1977:Report Narrative Not Clear
• “Q-F-V” used 20 times without explanation (e.g., page 19)(quantity-frequency-variability index)
• “Mean Test Score (error)” (Pages 23, 24)
- Used twice with no explanation- This is not standard terminology

http://AppliedPersonnelResearch.com Copyright © 2006 Joel Wiesen
37
Burns and Moskowitz, 1977:Report Narrative Not Clear
• Scientists communicate through publications
• Must be clear enough for another scientist to understand and replicate what was done- procedure- statistical analysis

http://AppliedPersonnelResearch.com Copyright © 2006 Joel Wiesen
38
Burns and Moskowitz, 1977:Report Narrative Not Clear
• Apparatus has 40 peripheral lamps- spaced every 5 degrees from 15 to 100
degrees, on left and right (Appendix 9, page 1)
• But 20 lamps would go from 15 to 110 degrees
• There are more places where report is not clear

http://AppliedPersonnelResearch.com Copyright © 2006 Joel Wiesen
39
Burns and Moskowitz, 1977:Report Deficiencies
• Means reported without standard deviations (e.g., Tables 1 and 2, pages 11, 21)

http://AppliedPersonnelResearch.com Copyright © 2006 Joel Wiesen
40
APA Publication Manual
• “Be sure to include sufficient descriptive statistics (e.g., … standard deviations)…”(Publication Manual of the APA, 2001, page 22)

http://AppliedPersonnelResearch.com Copyright © 2006 Joel Wiesen
41
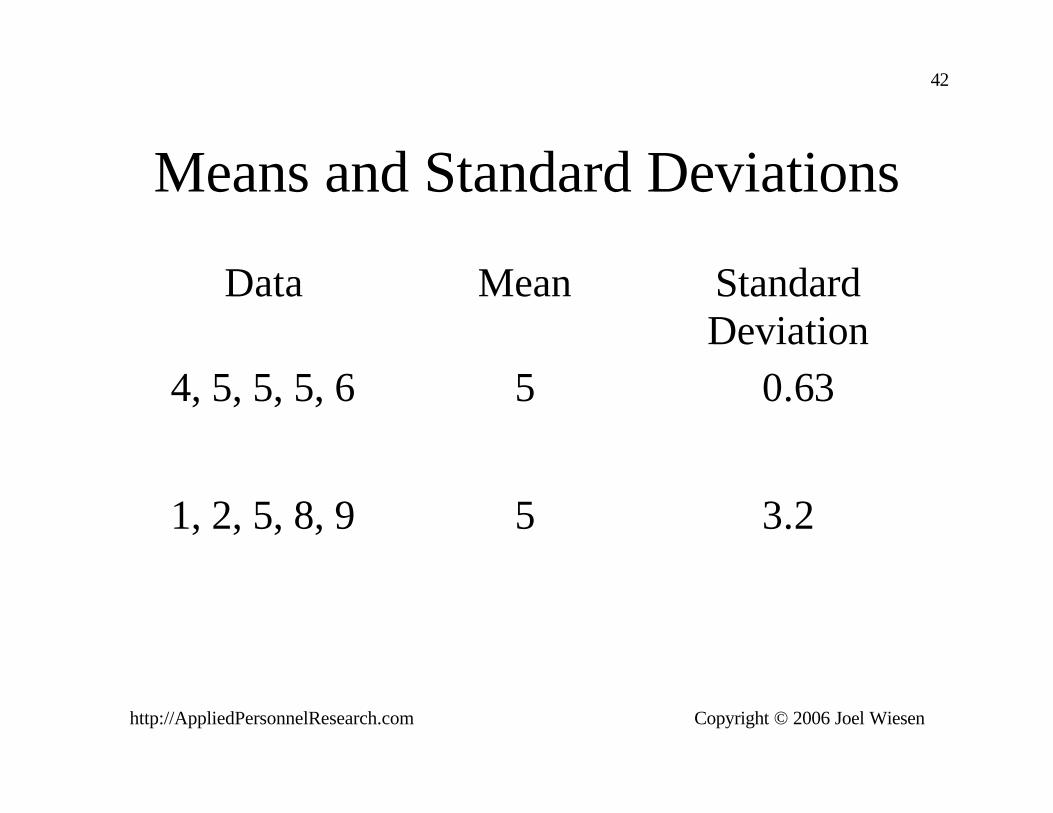
Means and Standard Deviations
• Descriptive statistics• Mean:
- numeric average- measure of central tendency (c.f., median)
• Standard deviation- calculated from the data- a measure of variability (c.f., range)
http://AppliedPersonnelResearch.com Copyright © 2006 Joel Wiesen
42
Means and Standard Deviations
Data Mean Standard Deviation
4, 5, 5, 5, 6 5 0.63
1, 2, 5, 8, 9 5 3.2

http://AppliedPersonnelResearch.com Copyright © 2006 Joel Wiesen
43
Means and Standard Deviations
Data Mean StandardDeviation
40, 50, 50, 50, 60 50 6.3
14, 15, 15, 15, 16 15 0.63

http://AppliedPersonnelResearch.com Copyright © 2006 Joel Wiesen
44
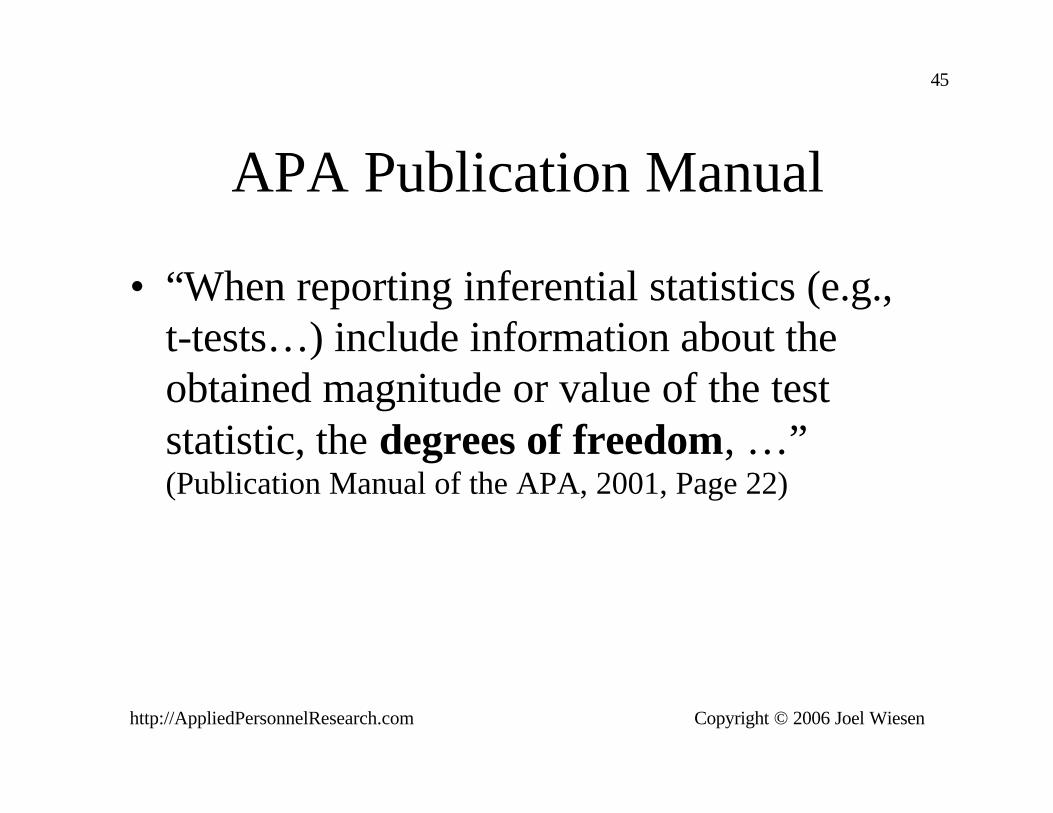
Burns and Moskowitz, 1977:Report Deficiencies
• t-tests reported, but without degrees of freedom (d.f.)(Page 53)
http://AppliedPersonnelResearch.com Copyright © 2006 Joel Wiesen
45
APA Publication Manual
• “When reporting inferential statistics (e.g., t-tests…) include information about the obtained magnitude or value of the test statistic, the degrees of freedom, …” (Publication Manual of the APA, 2001, Page 22)
http://AppliedPersonnelResearch.com Copyright © 2006 Joel Wiesen
46
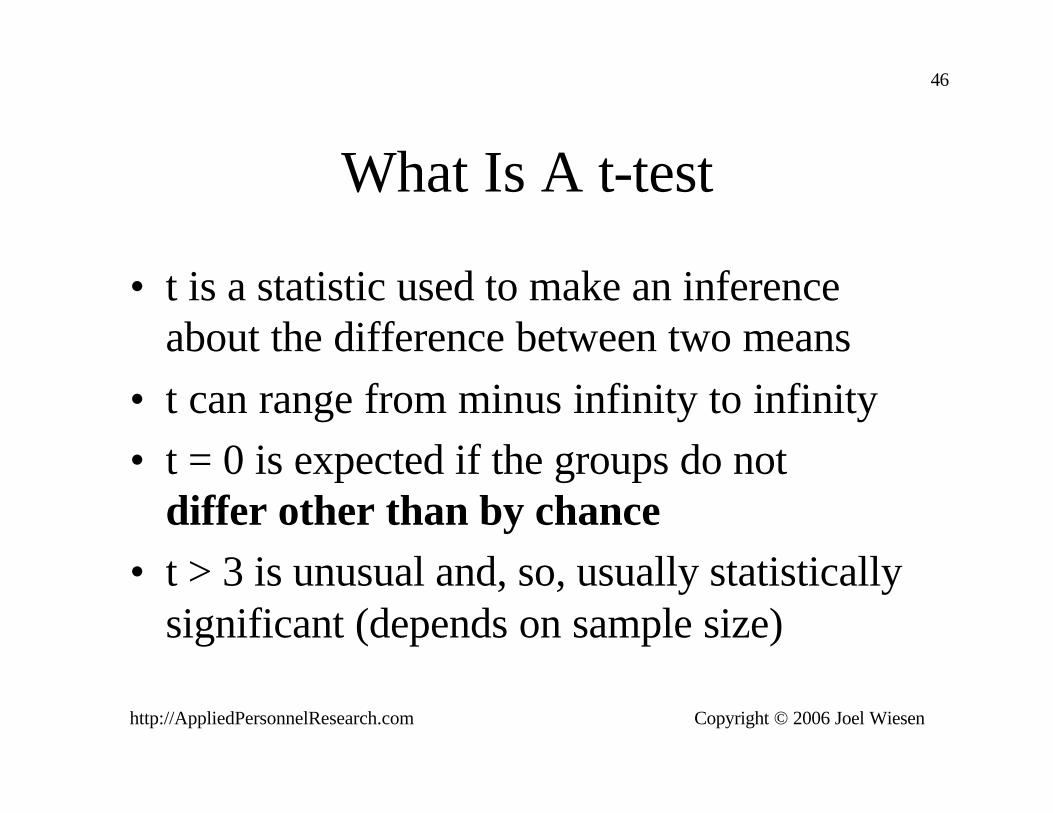
What Is A t-test
• t is a statistic used to make an inference about the difference between two means
• t can range from minus infinity to infinity• t = 0 is expected if the groups do not
differ other than by chance• t > 3 is unusual and, so, usually statistically
significant (depends on sample size)

http://AppliedPersonnelResearch.com Copyright © 2006 Joel Wiesen
47
Statistical Significance
• Means computed from 2 groups are unlikely to be exactly equal.
• How much of a difference indicates a real difference between the groups’ means?
• A difference unlikely to occur by chance is called “Statistically Significant”
• Need both t and d.f. to make an inference
http://AppliedPersonnelResearch.com Copyright © 2006 Joel Wiesen
48
Burns and Moskowitz, 1977:Report Deficiencies
• Correlation between BAC and driving simulation not given
• Data collected but no correlation reported• Mystifying

http://AppliedPersonnelResearch.com Copyright © 2006 Joel Wiesen
49
Burns and Moskowitz, 1977: Research Design Not Followed
• Officers may not have been blind to dosage
• More heavy drinkers tested later in study (Page 19)
• Last officer tested:- 15 male drinkers, 13 heavy drinkers- 14 female drinkers, 0 heavy drinkers (Pg 20)

http://AppliedPersonnelResearch.com Copyright © 2006 Joel Wiesen
50
Burns and Moskowitz, 1977:Data Analyses Contain Errors
• Number of participants summed wrong29 + 0 reported as 3012 + 16 reported as 27 (Page 114)
• Can we trust the tabled numbers?• Were they computer generated?• There are other errors, some subtle• What other numbers are reported wrong?
http://AppliedPersonnelResearch.com Copyright © 2006 Joel Wiesen
51
Burns and Moskowitz, 1977:Data Analyses Biased
• “…borderline cases are assumed to fall into the non-error category.” (Page 28)
- No indication of how many such cases- This is unheard of in published research
• Other examples of data analysis bias

http://AppliedPersonnelResearch.com Copyright © 2006 Joel Wiesen
52
Burns and Moskowitz, 1977:SFSTs Then vs. Now
• Nystagmus evaluated at 30 and 40 degrees• “Observation of the characteristic jerking at
a gaze of more extreme than 45 degrees should not be relied upon as an index of intoxication.” (Page 90)
• Max scores: HGN=20, WAT=10, OLS=10• Nystagmus test with one eye covered

http://AppliedPersonnelResearch.com Copyright © 2006 Joel Wiesen
53
Burns and Moskowitz, 1977:Evaluation
• Studied tests different from today’s SFSTs• Cannot make statistical statements about the
accuracy or reliability of today’s SFSTs
http://AppliedPersonnelResearch.com Copyright © 2006 Joel Wiesen
54
Burns and Moskowitz, 1977:Evaluation
• Selected from existing tests- Did not develop new tests
• Selected plausible battery• Inflated usefulness of battery• No way to accurately evaluate SFSTs

http://AppliedPersonnelResearch.com Copyright © 2006 Joel Wiesen
55
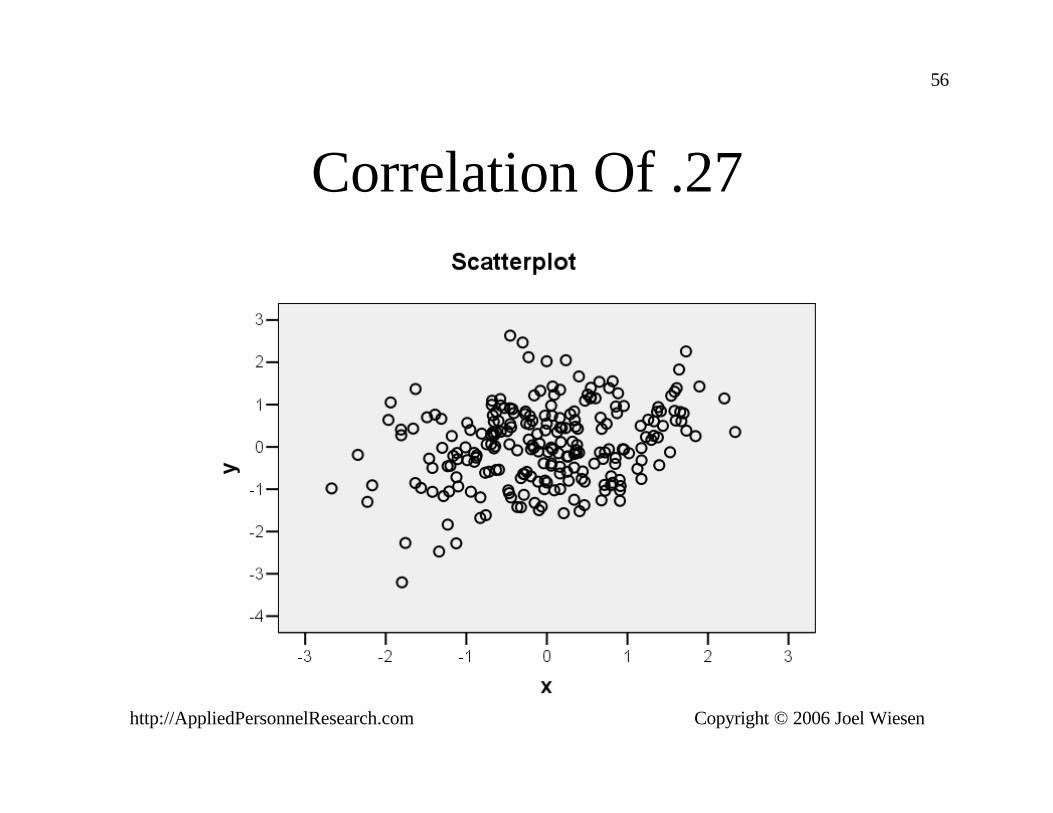
Burns and Moskowitz, 1977:Evaluation
• Relationship of SFSTs and driving skills• Correlations between SFSTs and reaction
time are:r = .15 for OLSr = .12 for WATr = .27 for Total Nystagmus (Page 55)
http://AppliedPersonnelResearch.com Copyright © 2006 Joel Wiesen
56
Correlation Of .27

http://AppliedPersonnelResearch.com Copyright © 2006 Joel Wiesen
57
Burns and Moskowitz, 1977:Evaluation
• Peer review needed• This publication is not consistent with
professional standards in field of testing• The scientific community would not accept
the conclusions of the authors

http://AppliedPersonnelResearch.com Copyright © 2006 Joel Wiesen
58
Burns and Anderson, 1995
• A Colorado Validation Study of the Standardized Field Sobriety Test (SFST) Battery

http://AppliedPersonnelResearch.com Copyright © 2006 Joel Wiesen
59
Approach to Each Study
• Summary• Strengths • Weaknesses• Overall evaluation
http://AppliedPersonnelResearch.com Copyright © 2006 Joel Wiesen
60
Burns and Anderson, 1995:Summary
• Goal: evaluate arrest decision accuracy(Page i, Technical Summary)
- experienced officers- under roadside conditions- in winter, spring and summer (Page 4)
• Field Study in Colorado• 305 participants (234 with complete data)

http://AppliedPersonnelResearch.com Copyright © 2006 Joel Wiesen
61
Burns and Anderson, 1995: Summary
• Findings:- Officers’ arrest decisions: 93% accurate- Officers’ release decisions: 64% accurate
(Page 16)

http://AppliedPersonnelResearch.com Copyright © 2006 Joel Wiesen
62
Burns and Anderson, 1995: Weaknesses
• Report narrative not clear• Research design deficiencies• Research design not followed• Report deficiencies• Report contains errors• Data analyses not fully reported

http://AppliedPersonnelResearch.com Copyright © 2006 Joel Wiesen
63
Burns and Anderson, 1995: Report Narrative Not Clear
• Officers did not have PBTs (Page 5)
• PBT results recorded (Page 9)
• Report BAC results on 234 SFSTs (Page 14)
• Observers present and collected PBT for 125 SFSTs (Page 5)
• Who collected BAC for the other 109 SFSTs?- When?

http://AppliedPersonnelResearch.com Copyright © 2006 Joel Wiesen
64
Burns and Anderson, 1995: Research Design Deficiencies
• Drivers not arrested asked for PBT (Page 5)
- If more intoxicated decline, the accuracyof release decisions inflated
• Officers all volunteers (Page 6)
- May be more proficient with SFSTs• Officers got refresher training (Page 6)
- Better trained than the typical officer

http://AppliedPersonnelResearch.com Copyright © 2006 Joel Wiesen
65
Burns and Anderson, 1995: Research Design Deficiencies
• Half of the officers had two roles, at different times: (Page 10)
- enforcement - observers
• May be some conflict of interest- I observe you, you observe me
http://AppliedPersonnelResearch.com Copyright © 2006 Joel Wiesen
66
Burns and Anderson, 1995: Research Design Not Followed
• Plan was to collect some data in winter months- Start was planned for Dec/Jan- Start delayed until end of Feb (Page 27)

http://AppliedPersonnelResearch.com Copyright © 2006 Joel Wiesen
67
Burns and Anderson, 1995: Report Deficiencies
• 305 SFSTs administered• 135 in March (Page 10, Figure 2)
• 70 in May, June, and July, combined• No analysis of March alone
- Did officers always use same stop criteria?

http://AppliedPersonnelResearch.com Copyright © 2006 Joel Wiesen
68
Burns and Anderson, 1995: Report Deficiencies
• No 2 by 2 table with SFST and BAC- Authors have the data- Data not reported
• No correlation reported between SFST and BAC
http://AppliedPersonnelResearch.com Copyright © 2006 Joel Wiesen
69
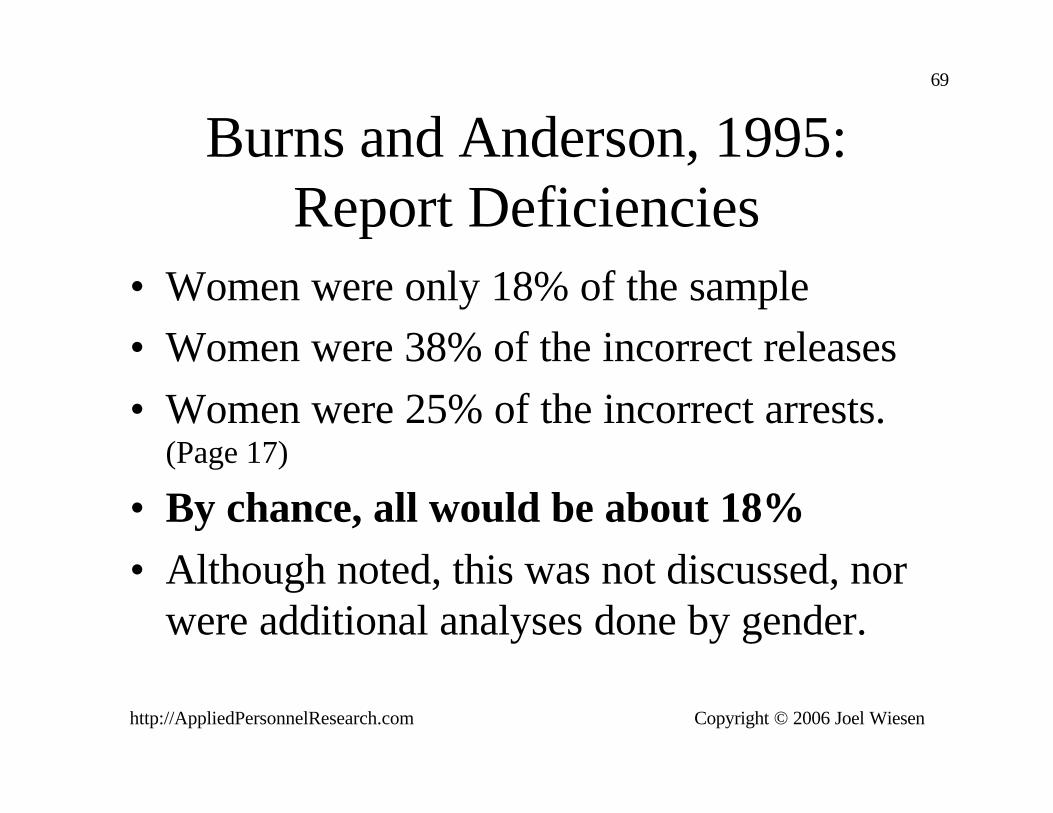
Burns and Anderson, 1995: Report Deficiencies
• Women were only 18% of the sample• Women were 38% of the incorrect releases• Women were 25% of the incorrect arrests.
(Page 17)
• By chance, all would be about 18%• Although noted, this was not discussed, nor
were additional analyses done by gender.
http://AppliedPersonnelResearch.com Copyright © 2006 Joel Wiesen
70
Burns and Anderson, 1995: Report Contains Errors
• 13 participants from LPD (Tables 1 and 2)
• 14 participants from LPD (Table 3)

http://AppliedPersonnelResearch.com Copyright © 2006 Joel Wiesen
71
Burns and Anderson, 1995:Data analyses not fully reported
• Gives means for DUI and DWAI (Page 18)
• No standard deviations given

http://AppliedPersonnelResearch.com Copyright © 2006 Joel Wiesen
72
Burns and Anderson, 1995:SFST Then and Now
• Then:- WAT: 13 possible errors listed (Page 20)
- OLS: 5 possible errors listed (Page 22)
• Now:- WAT: 8 clues- OLS: 4 clues
http://AppliedPersonnelResearch.com Copyright © 2006 Joel Wiesen
73
Burns and Anderson, 1995: Evaluation
• Evaluated arrest decisions of specially trained and supervised, volunteer officers, who used SFST and other data
• No analyses of the data on SFST validity- Data available, but not analyzed!
• No direct evaluation of SFSTs• Employed obsolete SFST scoring
http://AppliedPersonnelResearch.com Copyright © 2006 Joel Wiesen
74
Stuster and Burns, 1998
• Validation of the Standardized Field Sobriety Test Battery at BAC’s Below 0.10 Percent
http://AppliedPersonnelResearch.com Copyright © 2006 Joel Wiesen
75
Approach to Each Study
• Summary• Strengths • Weaknesses• Overall evaluation

http://AppliedPersonnelResearch.com Copyright © 2006 Joel Wiesen
76
Stuster and Burns, 1998: Summary
• Goals: (Pages 9, 11)
- Evaluate SFSTs as they assist officerdecision making
- Evaluate modifications to test scoring- Do SFSTs identify people at .08 and .04%- How reliable/consistent are tests- Are modified tests useable and acceptable
to officers?

http://AppliedPersonnelResearch.com Copyright © 2006 Joel Wiesen
77
Stuster and Burns, 1998: Summary
• Evaluated SFSTs at .08% and .04% BAC• Field study of almost 300 stops• 91% accuracy of officers’ decisions (Page 18)
• 79-88% accuracy of SFST decisions (Page 21)
• SFSTs correlated .69 with BAC (Pages 17, 25)
• SFSTs are reliable (Page 26)

http://AppliedPersonnelResearch.com Copyright © 2006 Joel Wiesen
78
Stuster and Burns, 1998:Strengths
• Field study (San Diego PD)• Improved data collection form (Page 12)
• 297 participants (one refused BAC test)• Got BACs for all 297 stops (Page 15)

http://AppliedPersonnelResearch.com Copyright © 2006 Joel Wiesen
79
Stuster and Burns, 1998:Weaknesses
• Research design deficiencies• Report deficiencies• Report contains errors• Data analyses not fully reported
http://AppliedPersonnelResearch.com Copyright © 2006 Joel Wiesen
80
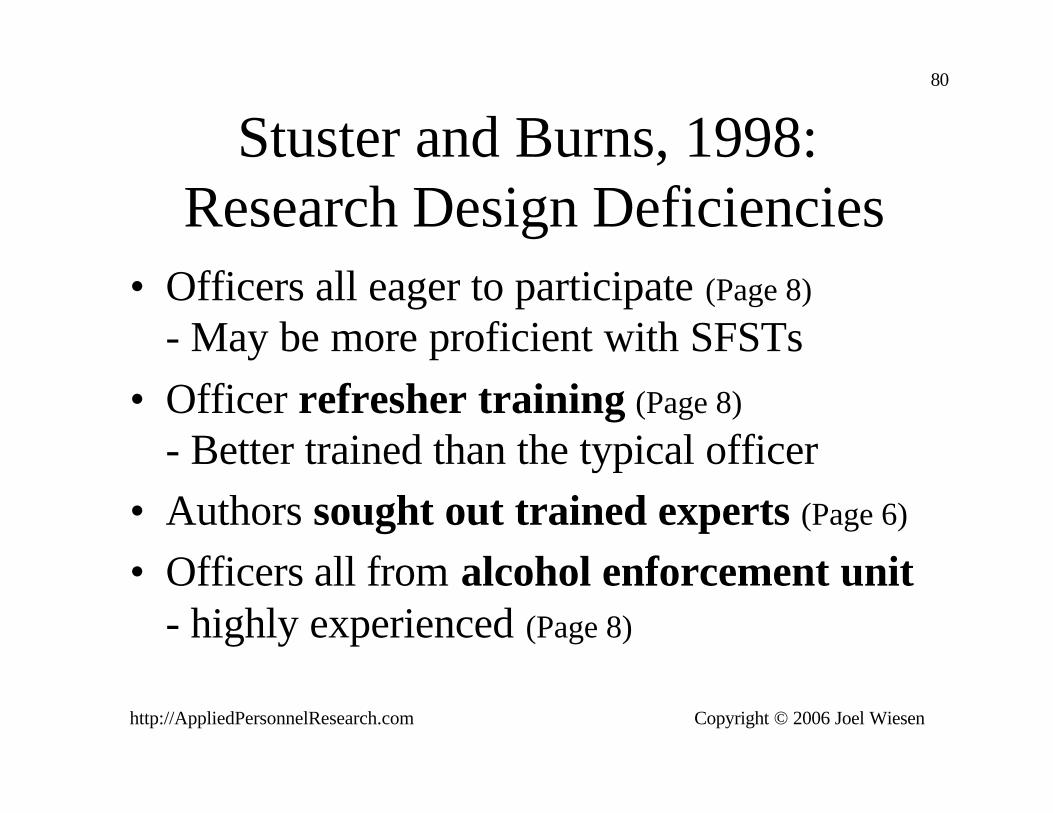
Stuster and Burns, 1998:Research Design Deficiencies
• Officers all eager to participate (Page 8)
- May be more proficient with SFSTs• Officer refresher training (Page 8)
- Better trained than the typical officer• Authors sought out trained experts (Page 6)
• Officers all from alcohol enforcement unit- highly experienced (Page 8)
http://AppliedPersonnelResearch.com Copyright © 2006 Joel Wiesen
81
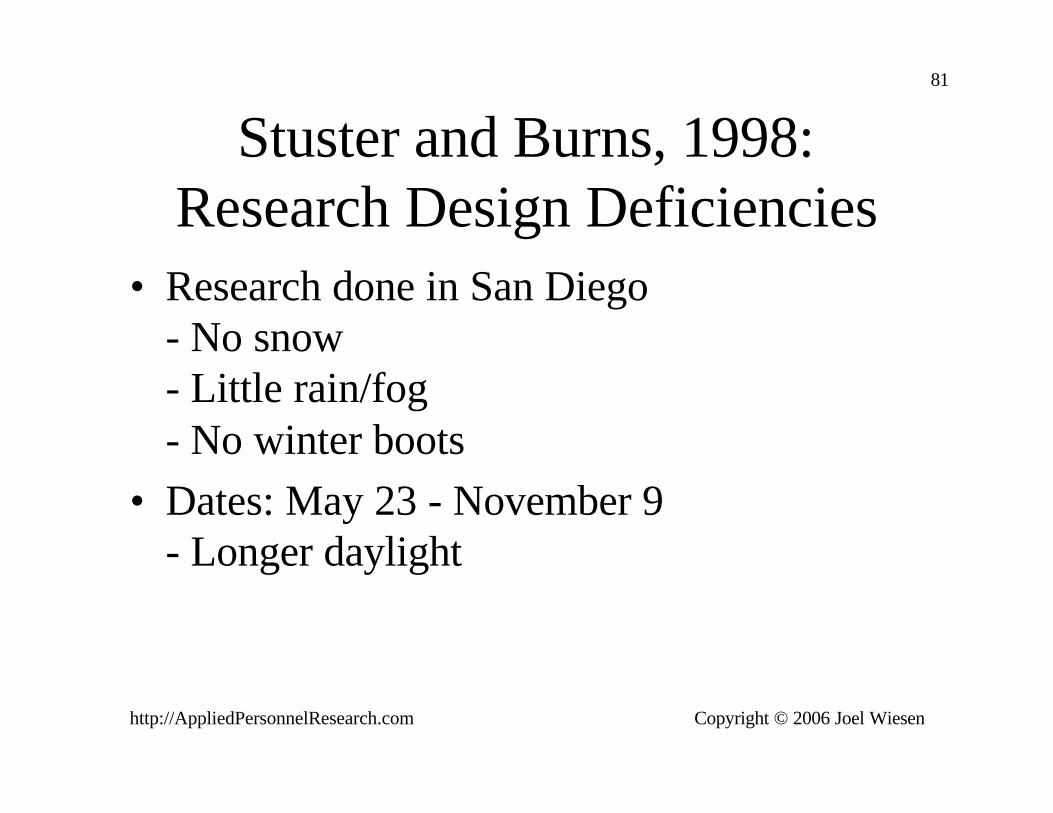
Stuster and Burns, 1998: Research Design Deficiencies
• Research done in San Diego- No snow- Little rain/fog- No winter boots
• Dates: May 23 - November 9- Longer daylight
http://AppliedPersonnelResearch.com Copyright © 2006 Joel Wiesen
82
Stuster and Burns, 1998: Research Design Deficiencies
• No data collection instrument for this goal:Are modified tests useable and acceptableto officers?
• No survey on usability limits• No systematic interviews

http://AppliedPersonnelResearch.com Copyright © 2006 Joel Wiesen
83
Stuster and Burns, 1998: Report Deficiencies
• Did procedural safeguards work?• “Requiring officers to record the time of
BAC estimates and BAC tests ensured that officers’ estimates were not influenced by the results of the chemical tests.” (Page 11)
• Time data collected but not analyzed or even reported (Page 12)

http://AppliedPersonnelResearch.com Copyright © 2006 Joel Wiesen
84
Stuster and Burns, 1998: Report Deficiencies
• Project staff ride-alongs (Page 11)
- to monitor data collection• No statement of number of ride-alongs• No comparison of data from monitored vs.
unmonitored stops

http://AppliedPersonnelResearch.com Copyright © 2006 Joel Wiesen
85
Stuster and Burns, 1998: Report Deficiencies
• “…the officers’ mean estimated BACs were very close to the measured BACs...” (Page 15)
• Means can obscure differences• Better to include also:
- distribution of difference scores- a scatter plot

http://AppliedPersonnelResearch.com Copyright © 2006 Joel Wiesen
86
Stuster and Burns, 1998: Report Deficiencies
• Authors treat false positives with measured BAC between .07% and .08% as if they were over .08%- Illegitimate way to inflate accuracy
(Page 20)
• (Authors also present uninflated rates)

http://AppliedPersonnelResearch.com Copyright © 2006 Joel Wiesen
87
Stuster and Burns, 1998: Report Deficiencies
• Scores for 3 SFSTs combined (Page 17)
• No description of how combined• Possibilities:
- Total number of clues- Weight clues from WAT more than HGN- Overall pass-fail (fail any test = failure)

http://AppliedPersonnelResearch.com Copyright © 2006 Joel Wiesen
88
Stuster and Burns, 1998: Report Deficiencies
• States that BAC measurement has a margin of error of about .01% (Page 20)
- No citation for this- If so, it would put a ceiling on the
validity coefficient- Hard to predict an unreliable criterion
• No discussion of the impact of this

http://AppliedPersonnelResearch.com Copyright © 2006 Joel Wiesen
89
Stuster and Burns, 1998: Report Deficiencies
• “The only appropriate criterion measure to assess the accuracy of SFSTs is BAC.”(Page 10)
• But Anderson & Burns (1995) used arrest decision as the criterion.
• But Burns and Moskowitz (1977) included a driving simulation.

http://AppliedPersonnelResearch.com Copyright © 2006 Joel Wiesen
90
Stuster and Burns, 1998: Report Contains Errors
• Arrest accuracy of 91% based on 297 stops• Only 261 stops had SFST (Page 17)
• Goal: Did SFST assist officers decisions?• Why lump SFST and non-SFST stops?• Correct analysis on 261 stops not reported

http://AppliedPersonnelResearch.com Copyright © 2006 Joel Wiesen
91
Stuster and Burns, 1998:Data Analyses Not Fully Reported
OverallAccuracy
False Alarms(Not Reported)
HGN 88% 37%
WAT 79% 53%
OLS 83%(Page 21)
41%

http://AppliedPersonnelResearch.com Copyright © 2006 Joel Wiesen
92
Stuster and Burns, 1998:Data Analyses Can Mislead
• Arrest accuracy rate of 91% reported• 72% of suspects were over .08% (Page 18)
• Arresting all would have 72% accuracy• Random arrests would have 72% accuracy
http://AppliedPersonnelResearch.com Copyright © 2006 Joel Wiesen
93
Stuster and Burns, 1998:SFST Then and Now
• Appendix A describes a Combined Measure scoring of SFSTs
• Fail suspect if:- HGN of 0 and WAT > 5- HGN of 1 and WAT > 4, etc.
• This study validates an old scoring system- Applicability to current FSTs uncertain

http://AppliedPersonnelResearch.com Copyright © 2006 Joel Wiesen
94
Stuster and Burns, 1998: Evaluation
• Study evaluated SFSTs two ways• Evaluated arrest decisions of specially
trained and supervised officers, who used SFST and other data- May not be the best criterion
• Evaluated SFST decisions- This is relevant

http://AppliedPersonnelResearch.com Copyright © 2006 Joel Wiesen
95
Stuster and Burns, 1998: Evaluation
• Evaluated best case:- Highly experienced officers- Refresher training- Good weather in San Diego

http://AppliedPersonnelResearch.com Copyright © 2006 Joel Wiesen
96
Stuster and Burns, 1998: Evaluation
• Presents evidence for accuracy of test• Presents evidence for validity of test• Ignores false alarm rates• Evaluates somewhat obsolete SFST scoring

http://AppliedPersonnelResearch.com Copyright © 2006 Joel Wiesen
97
Stuster and Burns, 1998: Evaluation
• Results are less positive than as presented• Not clear how much the errors and
weaknesses affected the reported findings- Might be very much

http://AppliedPersonnelResearch.com Copyright © 2006 Joel Wiesen
98
General Conclusions
• These research reports:- Appear biased- Have many weaknesses- Do not live up to professional standards- Cannot be taken at face value
• SFSTs have promise- Need more work to perfect them
http://AppliedPersonnelResearch.com Copyright © 2006 Joel Wiesen
99
Wrap up
• Defense may want to focus on:- High false alarm rates- Level of inter-rater reliability- Level of correlation of SFST and BAC- Flawed research- Research done on old versions of SFSTs- Low correlation of BAC & driving ability- Inflated estimates of accuracy/validity

http://AppliedPersonnelResearch.com Copyright © 2006 Joel Wiesen
100
Looking Ahead
• FSTs will never have low false alarm rates- Especially for people with .07%
• Better SFSTs are possible• Develop measures of driving skills
- Reaction time (easy to measure)- Judge speed/distance of movement - Multi-limb coordination

http://AppliedPersonnelResearch.com Copyright © 2006 Joel Wiesen
101
ReferencesAmerican Educational Research Association, American Psychological Association, & National Council
on Measurement in Education. (1999). Standards for educational and psychological testing. Washington, DC; American Educational Research Association.
American Psychological Association. (2001). Publication Manual of the American Psychological Association 5th edition. Washington, DC: Author.
Burns, M., & Anderson, E. (1995). A Colorado validation study of the standardized field sobriety test (SFST) Battery (Project No. 95-408-17-05). Los Angeles, CA: Southern California Research Institute; Aspen, CO: Pitkin County Sheriff’s Office. (NTIS No. PB2003-106102). Retrieved August 22, 2006 from http://www.ndaa-apri.org/pdf/co_val2.pdf
Burns, M., & Moskowitz, H. (1977). Psychophysical tests for DWI arrest (Contract No. DOT-HS-5-01242, Report No. DOT HS-802 424).Washington, DC: U.S. Department of Transportation, National Highway Traffic Safety Administration. Retrieved August 22, 2006 from http://www.ndaa-apri.org/pdf/psy_tes2.pdf
Stuster, J., & Burns, M. (1998). Validation of the standardized field sobriety test Battery at the BACs below 0.10 percent (Contract No. DTNH22-95-C-05192). Santa Barbara, CA: Anacapa Sciences; Washington, DC: U.S. Department of Transportation, National Highway Traffic Safety Administration. (NTIS No. PB2003-106107)

http://AppliedPersonnelResearch.com Copyright © 2006 Joel Wiesen
102
Seminar CD
• NHTSA SFST research reports• Several articles on SFSTs• Annotated bibliography• Bibliography by Steve Rubenzer, Ph.D.• Horn Affidavit• These slides
(See www:AppliedPersonnelResearch.com\papers for updated\version)

http://AppliedPersonnelResearch.com Copyright © 2006 Joel Wiesen
103
Q&A’s
• Questions submitted prior to the conference

http://AppliedPersonnelResearch.com Copyright © 2006 Joel Wiesen
104
Thank You
• An expanded version of this presentation is available on request