fleet asset management plan -...
TRANSCRIPT

City of Mandurah
VEHICLES, PLANT AND EQUIPMENTASSET MANAGEMENT PLAN
Version 1.0 07-04-2010

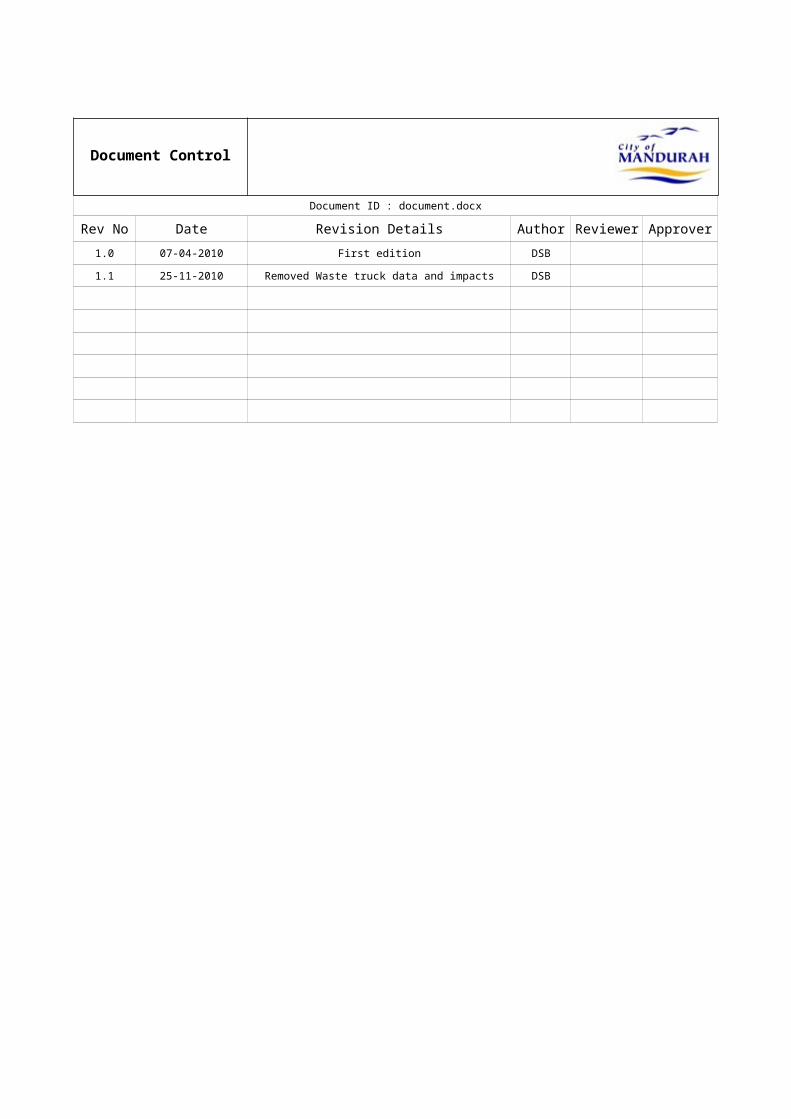
Document Control
Document ID : document.docx
Rev No Date Revision Details Author Reviewer Approver1.0 07-04-2010 First edition DSB
1.1 25-11-2010 Removed Waste truck data and impacts DSB
ContentsEXECUTIVE SUMMARY...................................................................................................1INTRODUCTION...............................................................................................................3
Background...............................................................................................................3Stakeholders.............................................................................................................4Goals and Objectives of Asset Management............................................................4Plan Framework........................................................................................................5
LEVELS OF SERVICE......................................................................................................6Customer Research and Expectations.....................................................................6Legislative Requirements..........................................................................................6Current Levels of Service..........................................................................................6Risk Review of Levels of Service..............................................................................8
FUTURE DEMAND..........................................................................................................11Demand Forecast...................................................................................................11Changes in Technology..........................................................................................12Demand Management and New Assets from Growth.............................................12Risk Review of Future Demand..............................................................................15
LIFE CYCLE MANAGEMENT PLAN..............................................................................16Background Data....................................................................................................16Routine Maintenance Plan......................................................................................18Energy Plan............................................................................................................22Asset Replacement and Disposal Plan (Plant Replacement Program)..................25Future Assets Acquisition Plan...............................................................................26Risk Review of Life Cycle Management.................................................................27
FINANCIAL SUMMARY..................................................................................................31Financial Statements and Projections.....................................................................31Funding Strategy.....................................................................................................32Valuation Forecasts................................................................................................32Key Assumptions made in Financial Forecasts......................................................33
ASSET MANAGEMENT PRACTICES............................................................................35Accounting/Financial Systems................................................................................35Asset Management Systems..................................................................................35Information Flow Requirements and Processes.....................................................35Standards and Guidelines.......................................................................................36
PLAN IMPROVEMENT AND MONITORING..................................................................37Performance Measures...........................................................................................37Improvement Plan...................................................................................................37Monitoring and Review Procedures........................................................................37
REFERENCES................................................................................................................38Appendix A Maintenance Response Levels of Service..........................................39Appendix B Projected 20 year Capital Renewal Works Program...........................39Appendix C Planned Upgrade/Exp/New 20 year Capital Works Program..............39
GLOSSARY.....................................................................................................................40
CITY OF MANDURAH – VEHICLE, PLANT AND EQUIPMENT ASSET MANAGEMENT PLAN - Page i -

EXECUTIVE SUMMARYWhat the City of Mandurah ProvidesThe City provides the Vehicle, Plant and Equipment fleet as an in-house service provider to all departments. The service's objectives are the provision of a modern, high quality cost effective fleet, maintained to industry standards, as an integral part of its customers' operations. The fleet includes:
Light passenger and commercial vehicles Trucks and buses Construction plant and equipment Mowing and parks maintenance plant and
equipment Other motorised mobile or portable equipment.
The City plans to operate and maintain the fleet to achieve the following tactical objectives.
1. Most economically advantageous life cycle cost2. Provide and actively seek emerging safety features in
the acquisition of new items, while ensuring the fleet is maintained at a safe and functional standard.
3. Seek reductions in the emissions from fuels, vehicle components, oils and service methods.
4. Meet the functional requirement of the operation while enhancing productivity and personal attributes
5. Limit exposure to fuel sustainability and price risks.These objectives are conducted under the strategic objectives “Provide and develop good governance and financial management”, and “Enhance Mandurah’s air quality and reduce greenhouse gas emissions”.What does it Cost?There is one key indicator of cost to provide the fleet:
The life cycle cost evaluated over ten years which includes the total fuel, maintenance, other operating expenditure and capital renewal expenditure that is required to deliver services.
The life cycle cost to provide the fleet service is estimated at $1.90 Million per annum (maintenance and depreciation). Council’s planned expenditure for year 1 of the asset management plan is $2.26 Million (maintenance and net capital) which gives a life cycle sustainability index of 0.93.
As each asset’s life cycle is usually less than ten years the life cycle sustainability index is also the ten year sustainability index.
This life cycle sustainability index is expected to vary between 0.76 and 1.38 on a year by year basis as vehicle assets, particularly road sweepers and heavy construction equipment, age and are replaced.
The total fuel, maintenance and capital renewal expenditure required to provide the current level of fleet service in the next 10 years is estimated at $35.2 Million. This is an average of $3.52 Million per annum.
Risk ReviewThroughout the plan, risks have been identified along with recommended controls. Risks rated High or Extreme are noted here:
Risk that the projections in this plan are either too low or too high, and consequently the financial and resource bases are planned incorrectly;
Action: The assumptions in this plan need to be verified and funding set aside to meet expected increases.
Risk that price and Supply of Fuel (petrol and diesel) require a reduction of services;
Action: Complete a study of the City’s sensitivity to fuel, and prepare a Procedure to address and plan for energy (fuel) shortages.
Risk that staff or public are injured through use of vehicles, plant or equipment.
Action: Implement a comprehensive system to cover each step in acquisition, induction and ongoing operation of all vehicles, plant and equipment.
Plans for the FutureDramatic growth within key departments such as Parks and Community bus services, and general growth across all departments will place significant demands on the capital funding, operational funding, and most importantly will impact on the staff resources for Cityfleet.
Although the Waste Alliance is due to complete in 2015, there is not a determination as to whether the City would outsource this service again or bring it in house. This plan therefore specifically excludes any impact associated with the waste collection services. Forecast expenditure based on growth and demand shows a total increase over ten years of:
$1.0 million capital $1.3 million fuel and maintenance 75 fleet items 3 staff
Key departmental changes include: Reduction in construction equipment by seven
major items Increase in parks and mowing crews by three
crews with associated equipment Increase in community bus services.
Measuring our PerformanceKey performance indicators are or will be used for the Community, Customer and Technical aspects of work. The KPIs are listed in the section “Current Levels of Service”, and cover performance elements of:
Vehicle specification, Presentation, Quality, Quantity, Availability, Time, Service, Safety
The Next Steps
CITY OF MANDURAH – VEHICLE, PLANT AND EQUIPMENT ASSET MANAGEMENT PLAN - Page 2 -

This actions resulting from this asset management plan are:
Implement funding strategies such as a fuel price hedging reserve, fleet maintenance balancing reserve, and plant replacement reserve to level the funding needed each year.
Conduct a range of activities to reduce risks.
CITY OF MANDURAH – VEHICLE, PLANT AND EQUIPMENT ASSET MANAGEMENT PLAN - Page 3 -

INTRODUCTIONBackgroundThis asset management plan is to demonstrate responsive management of assets (and services provided from assets), compliance with regulatory requirements, and to communicate funding to provide the required levels of service.The asset management plan is to be read with the following associated planning documents:
Ten Year Plant Replacement Program Plant Charges Procedures for Vehicles, Plant and Equipment, Light Vehicle Selection, Light
Vehicle Custodianship and others Annual Plant Program
This asset management plan covers vehicles, plant and machinery, being generally any motorised self-propelled or portable item.
Assets covered by this PlanAsset category Description Replacement
Value ($M)1 Light passenger vehicles Four wheel sedans, wagons, hatches and
passenger vans including people movers seating less than 9 passengers and generally not classed as utility or commercial vehicles.
2.11
2 Light Commercial vehicles Four wheel utilities and vans whose primarily role is goods rather than passenger transport. This category also includes two-wheel motorbikes and motorised scooters, and troop carriers.
1.59
3 Trucks and Buses Trucks having a GVM from 3,500kg and above, and vans or buses able to carry more than 8 passengers.
4.74
4 Trailers Towed units with self-contained axles, registered for on-road use, designed to carry goods and plant. This category may include trailers purchased for less than $1500 due to their extreme age. (Replacement items are expected to cost over $1500.)
0.33
5 Construction Earthmoving, road maintenance and construction, compaction, drainage and associated equipment valued at over $1500 each. Includes graders, loaders, compactors of various types, pumps, concrete saws.
2.08
6 Parks and Mowing equipment
Agricultural and horticultural equipment including mowers, tractors and implements pulled by tractor units, with purchase price over $1500.
1.01
7 Miscellaneous plant Items not readily categorised with the above categories, such as path sweepers, sprayers, each with purchase price $1500 or over.
0.41
8 Minor equipment All motorised, mobile or portable machinery valued at under $1500. Includes brushcutters, chainsaws, power tools, small concrete saws, small compactors. Not intended to include hand
0.58
CITY OF MANDURAH – VEHICLE, PLANT AND EQUIPMENT ASSET MANAGEMENT PLAN - Page 4 -

tools or simple non-motorised equipment such as wheelbarrows.
TOTAL 12.381
StakeholdersKey stakeholders in the preparation and implementation of this asset management plan are:Coordinator Fleet Management Author and primary instigator of any associated
actions.Cityfleet Workshop Supervisor Conduct of all maintenance activities Manager Infrastructure Management
Oversight and resource allocation
Director Works and Services Strategic direction and resource allocationManager Operations Services Primary customer representative for 70% of the fleet
(by replacement value).
Goals and Objectives of Asset ManagementThe City of Mandurah as an organisation exists to provide services to its community. Some of these services are provided by using vehicle, plant and equipment assets. Council has acquired vehicle assets by purchase and by lease.The City’s goal in managing vehicle, plant and equipment assets is to meet the required level of service in the most cost effective manner for present and future customers. The key elements of asset management are:
Taking a life cycle approach, Developing cost-effective management strategies for the long term, Providing a defined level of service and monitoring performance, Understanding and meeting the demands of growth through demand
management and asset investment, Managing risks associated with asset failures and energy sources, Sustainable use of physical resources, Continuous improvement in asset management practices.2
This asset management plan is prepared under the direction of Council’s vision, mission, goals and objectives.
Council’s vision is:Mandurah: Vibrant, prosperous, connected and sustainable ... excited about our future!Council’s mission is:Shaping Mandurah’s future through strong leadership and organisational excellence that sustains growth while ensuring a quality lifestyle for all that is uniquely Mandurah.
Relevant Council goals and objectives and how these are addressed in this asset management plan are:
Council Goals and how these are addressed in this Plan
1 All values sourced from the 10-20 Ten Year Plant Replacement Program2 IIMM 2006 Sec 1.1.3, p 1.3
CITY OF MANDURAH – VEHICLE, PLANT AND EQUIPMENT ASSET MANAGEMENT PLAN - Page 5 -

Goal Objective How Goal and Objectives are addressed in IAMPOrganisational Excellence
Provide and develop good governance and financial management.
Analysis and planning of operational and capital expenditure associated with the vehicles, plant and equipment.
The vehicles, plant and equipment as assets provide services to all the departments within the City of Mandurah and as such contribute indirectly to all strategic objectives.The Cityfleet department is involved in the objective “Enhance Mandurah’s air quality and reduce greenhouse gas emissions.”, however the means of reaching that objective are addressed through asset selection practices and that level of detail is not included in this Asset Management Plan.
Plan FrameworkKey elements of the plan are
Levels of service: Specifies the services and levels of service to be provided by council.
Future demand and growth: How this will impact on future service delivery and how this is to be met.
Life cycle management: How the City will manage its existing and future assets to provide the required services. This includes expenditure projections for maintenance, fuel and capital.
Financial summary: What funds are required to provide the required services. Asset management practices: Record keeping and computer systems. Monitoring and review: How the plan will be monitored and updated to ensure it is
meeting the City’s objectives.
CITY OF MANDURAH – VEHICLE, PLANT AND EQUIPMENT ASSET MANAGEMENT PLAN - Page 6 -

LEVELS OF SERVICECustomer Research and ExpectationsThe Cityfleet department which manages the fleet assets has not carried out structured research on customer expectations. This will be investigated for future updates of the asset management plan. Expectations listed below are assumed.
Customer expectations are for vehicles, plant and equipment that: Have low downtime and high reliability; Promote personal and general safety; Are maintained to a high standard; Ensure capital and operating costs are low and within budget; Have low fuel consumption rates; Have low environmental impact; Meet all legislative requirements.
Legislative RequirementsThe City has to meet many legislative requirements including Australian and state legislation and state regulations. These include:
Table 1: Legislative Requirements
Legislation RequirementLocal Government Act Sets out role, purpose, responsibilities and powers of local
governments including the preparation of a long term financial plan supported by asset management plans for sustainable service delivery.Specifies requirements relating to purchasing (Tendering) and disposal of assets.
Road Traffic Act 1974 Requirement to licence vehicles to be driven on the road, and all driving regulations.
Road Traffic Amendment Act 2000 Requirement for the owner of the vehicle to be liable for drivers’ compliance with the regulations
Motor Vehicle Standards Act 1989 Requirement to register and assign identification to each vehicle imported to or manufactured in Australia
National Environment Protection (Diesel Vehicle Emissions) Measure
Supporting legislation to the National Environment Protection Council Act 1994 that requires monitoring and control of emissions from diesel vehicles.
Australian Design Rules Requirement for all new vehicles sold in Australia to meet standards relating to anti-theft, safety and emissions.
Occupational Health and Safety Act 1984
Requirement for organisations and individuals to apply a duty of care to others. Includes requirements relating to undertaking modifications to vehicles.
Current Levels of ServiceAlthough being an internal service provider, Cityfleet services provides assets that are used within the community, and in some occasions by the community (e.g. volunteers and community group members driving community buses). There are therefore three categories of service levels:
1. Community Levels of Service relate to how the community perceives the service in terms of safety, quality, quantity, reliability, responsiveness, cost/efficiency and
CITY OF MANDURAH – VEHICLE, PLANT AND EQUIPMENT ASSET MANAGEMENT PLAN - Page 7 -

legislative compliance, noting that in most cases the perception of the fleet will be considered as part of a wider service that is being provided e.g. the condition of the local park is partly affected by the appearance and quality of output from the mowing plant and equipment.
2. Customer Levels of Service relate to how the internal customers receive the service in terms of safety, quality, quantity, reliability, responsiveness, cost/efficiency and legislative compliance.
3. Supporting the customer service levels are operational or technical measures of performance developed to ensure that the minimum customer levels of service are met.
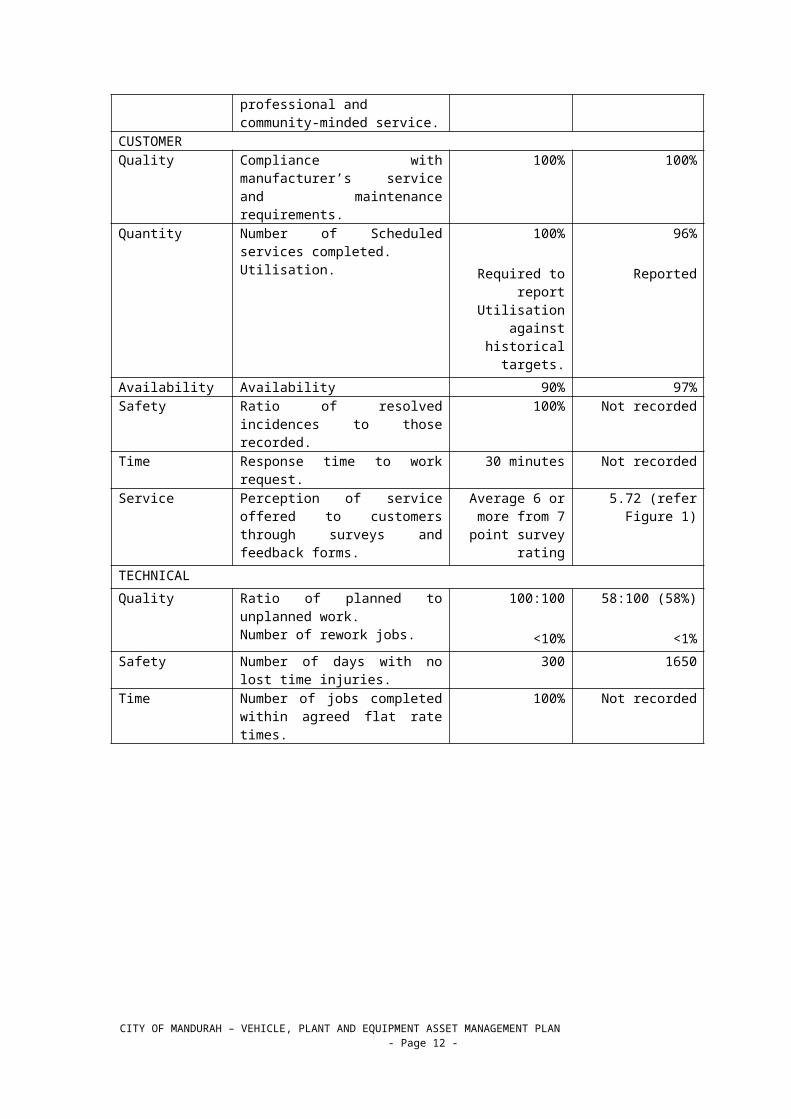
The City’s current service levels are detailed in Table 2.Table 2: Current Service Levels
Key Performance
Measure
Performance Measure Process
Performance Target
Current Performance
COMMUNITY Vehicle specification
Vehicles are to be specified to improve the quality of service provided by the customer, including the needs of the operator(s).
N/A Acceptable.
Vehicle Presentation
Vehicles are presented for use in the community in a clean and tidy condition, reflecting a professional and community-minded service.
N/A Acceptable.
CUSTOMER Quality Compliance with manufacturer’s
service and maintenance requirements.
100% 100%
Quantity Number of Scheduled services completed. Utilisation.
100%
Required to report Utilisation against historical targets.
96%
Reported
Availability Availability 90% 97%Safety Ratio of resolved incidences to
those recorded. 100% Not recorded
Time Response time to work request. 30 minutes Not recordedService Perception of service offered to
customers through surveys and feedback forms.
Average 6 or more from 7 point
survey rating
5.72 (refer Figure1)
TECHNICAL Quality Ratio of planned to unplanned
work. Number of rework jobs.
100:100
<10%
58:100 (58%)
<1%Safety Number of days with no lost time
injuries.300 1650
Time Number of jobs completed within agreed flat rate times.
100% Not recorded
CITY OF MANDURAH – VEHICLE, PLANT AND EQUIPMENT ASSET MANAGEMENT PLAN - Page 8 -

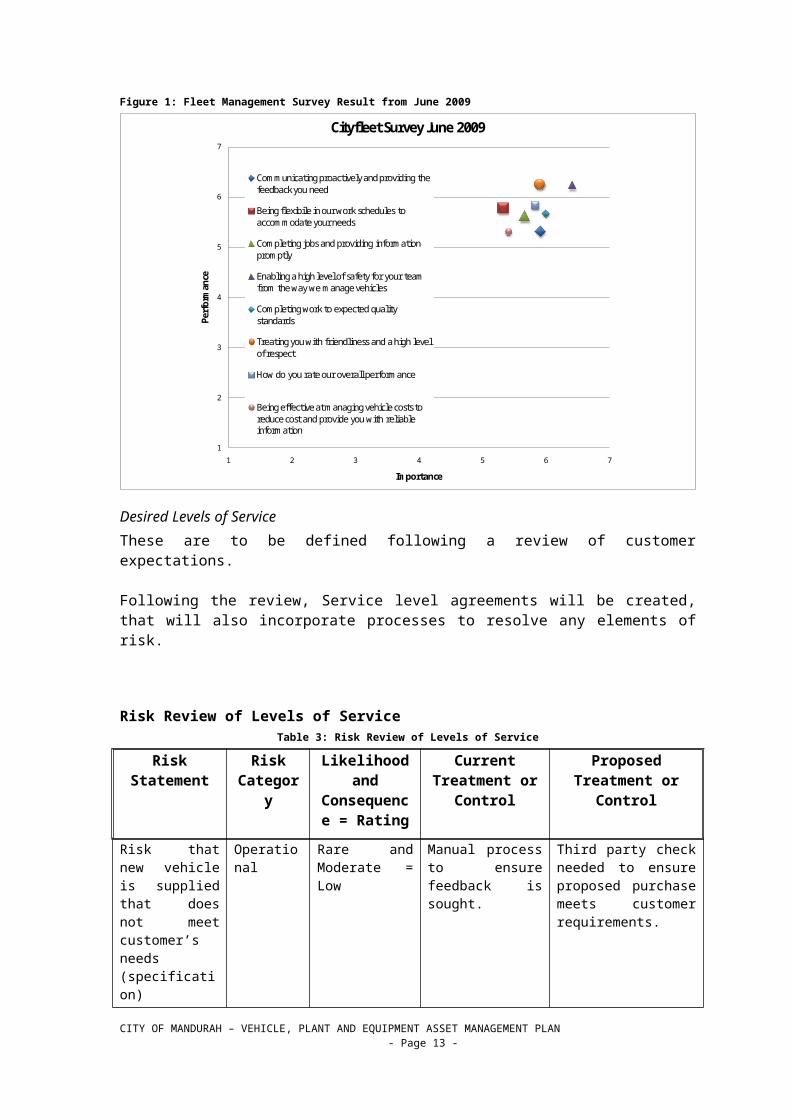
Figure 1: Fleet Management Survey Result from June 2009
1
2
3
4
5
6
7
1 2 3 4 5 6 7
Perf
orm
ance
Importance
Cityfleet Survey June 2009
Communicating proactively and providing the feedback you need
Being flexibile in our work schedules to accommodate your needs
Completing jobs and providing information promptly
Enabling a high level of safety for your team from the way we manage vehicles
Completing work to expected quality standards
Treating you with friendliness and a high level of respect
How do you rate our overall performance
Being effective at managing vehicle costs to reduce cost and provide you with reliable information
Desired Levels of ServiceThese are to be defined following a review of customer expectations.
Following the review, Service level agreements will be created, that will also incorporate processes to resolve any elements of risk.
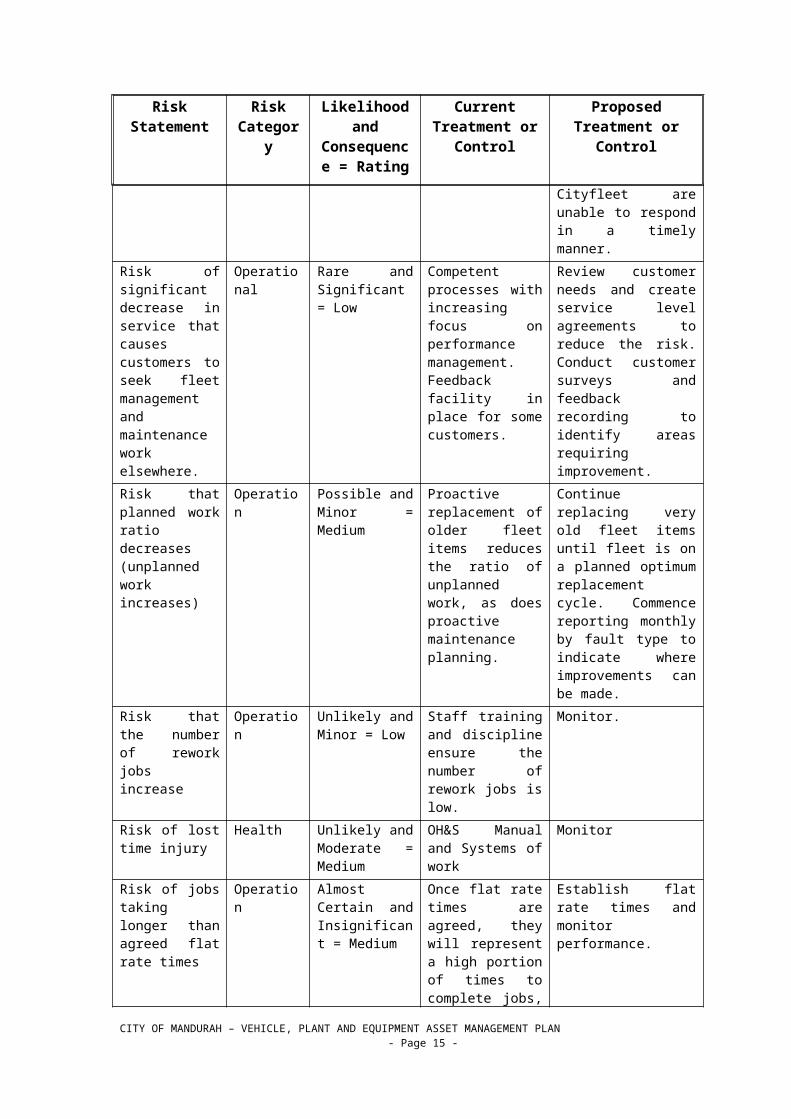
Risk Review of Levels of ServiceTable 3: Risk Review of Levels of Service
Risk Statement
Risk Category
Likelihood and
Consequence = Rating
Current Treatment or
Control
Proposed Treatment or
Control
Risk that new vehicle is supplied that does not meet customer’s needs (specification)
Operational Rare and Moderate = Low
Manual process to ensure feedback is sought.
Third party check needed to ensure proposed purchase meets customer requirements.
Risk that non-compliance with manufacturer’s service requirements voids warranty
Financial Rare and Moderate = Low
Service program in Fleet system is relied on, however this is prone to errors.
Improved fleet system to be acquired 09-10.
Risk that utilisation not reported, or not
Financial Possible and Minor = Medium
Utilisation is reported monthly
Customer groups need to be informed on the impact of over and
CITY OF MANDURAH – VEHICLE, PLANT AND EQUIPMENT ASSET MANAGEMENT PLAN - Page 9 -

Risk Statement
Risk Category
Likelihood and
Consequence = Rating
Current Treatment or
Control
Proposed Treatment or
Control
acted upon under utilisation, and performance targets applied to the customer/ user.
Risk that repair and maintenance or other operational risks cause significant loss of availability.
Operational Possible and Moderate = Medium
Some categories of asset have spares to provide replacement item, some items can be hired or service contracted.
Move to more standardisation so it is easier to swap units between departments. Identify critical and core units with poor backup options. Introduce more items into stores exchange program for minor equipment.
Risk of delayed response to repair and maintenance request.
Operational Almost Certain and Minor = Medium
Cityfleet staff respond as quickly as possible subject to workload
Business case has been presented for additional Mechanic based on increased fleet numbers. Investigate alternative practices that can be used, in the event that Cityfleet are unable to respond in a timely manner.
Risk of significant decrease in service that causes customers to seek fleet management and maintenance work elsewhere.
Operational Rare and Significant = Low
Competent processes with increasing focus on performance management. Feedback facility in place for some customers.
Review customer needs and create service level agreements to reduce the risk. Conduct customer surveys and feedback recording to identify areas requiring improvement.
Risk that planned work ratio decreases (unplanned work increases)
Operation Possible and Minor = Medium
Proactive replacement of older fleet items reduces the ratio of unplanned work, as does proactive maintenance planning.
Continue replacing very old fleet items until fleet is on a planned optimum replacement cycle. Commence reporting monthly by fault type to indicate where improvements can be made.
Risk that the number of rework jobs increase
Operation Unlikely and Minor = Low
Staff training and discipline ensure the number of rework jobs is low.
Monitor.
Risk of lost time injury
Health Unlikely and Moderate = Medium
OH&S Manual and Systems of work
Monitor
CITY OF MANDURAH – VEHICLE, PLANT AND EQUIPMENT ASSET MANAGEMENT PLAN - Page 10 -

Risk Statement
Risk Category
Likelihood and
Consequence = Rating
Current Treatment or
Control
Proposed Treatment or
Control
Risk of jobs taking longer than agreed flat rate times
Operation Almost Certain and Insignificant = Medium
Once flat rate times are agreed, they will represent a high portion of times to complete jobs, and as such some over-times are expected. These will not have significant impacts provided they are monitored and managed.
Establish flat rate times and monitor performance.
CITY OF MANDURAH – VEHICLE, PLANT AND EQUIPMENT ASSET MANAGEMENT PLAN - Page 11 -
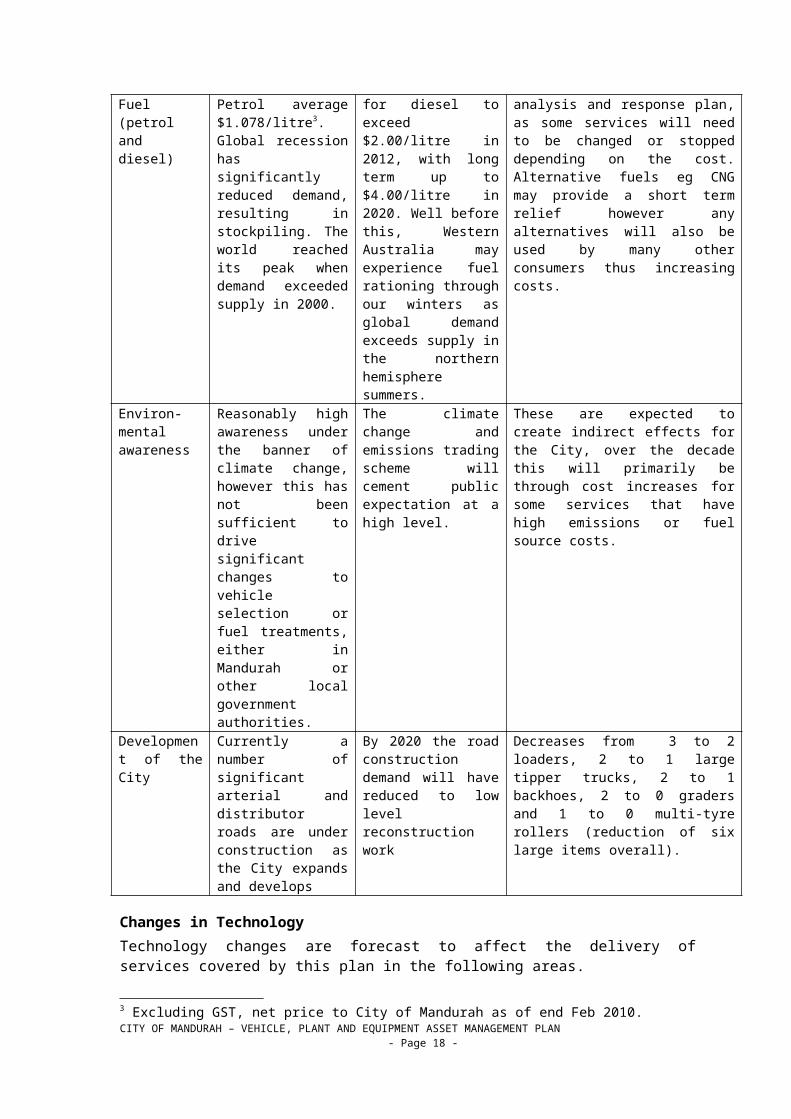
FUTURE DEMANDDemand ForecastFactors affecting demand include population change, changes in demographics, seasonal factors, employment, customer preferences and expectations, economic factors, operational practices, environmental awareness, and so on.Demand factor trends and impacts on service delivery for the fleet assets are summarised in Table 4.
Table 4: Demand Factors, Projections and Impact on Services
Demand factor
Present position2010
Projectionto 2020
Impact on services
Population 67,053 95,584 The impact for the vehicle assets is indirect, and mainly arises from two areas: an increasing expectation of standards for parks and reserves that will lead to more plant required for maintenance, and continuing land development creating greater areas. Notably, major road construction works are expected to reduce over the decade, resulting in decreases. Refer to the separate demand forecast below.
Demo-graphics
Dual peaks, with a higher number of residents in the teenage bracket and the 50 to 70 years old bracket.
Very similar demographic age structure, with increasing numbers across all age groups.
As above, with no significant change in the age structure the vehicle asset demand will relate to increasing levels of service within existing service areas.
Waste Alliance Contract
Waste collection for domestic, recycling and bulk verge is undertaken by a contractor.
The alliance ends June 2015. There may or may not be an impact on the City’s fleet, depending on the service method adopted.
No impact assessed for this plan.
Price and Supply of Fuel (petrol and diesel)
Diesel average $1.071/litrePetrol average $1.078/litre3. Global recession has significantly reduced demand, resulting in stockpiling. The world reached its peak when demand exceeded supply in 2000.
Short term projections are for diesel to exceed $2.00/litre in 2012, with long term up to $4.00/litre in 2020. Well before this, Western Australia may experience fuel rationing through our winters as global demand exceeds supply in the northern hemisphere summers.
The City of Mandurah requires a fuel impact analysis and response plan, as some services will need to be changed or stopped depending on the cost. Alternative fuels eg CNG may provide a short term relief however any alternatives will also be used by many other consumers thus increasing costs.
Environ-mental awareness
Reasonably high awareness under the banner of climate change, however this has not been sufficient to drive
The climate change and emissions trading scheme will cement public expectation at a high level.
These are expected to create indirect effects for the City, over the decade this will primarily be through cost increases for some services that have high emissions or fuel source costs.
3 Excluding GST, net price to City of Mandurah as of end Feb 2010.CITY OF MANDURAH – VEHICLE, PLANT AND EQUIPMENT ASSET MANAGEMENT PLAN
- Page 12 -

significant changes to vehicle selection or fuel treatments, either in Mandurah or other local government authorities.
Development of the City
Currently a number of significant arterial and distributor roads are under construction as the City expands and develops
By 2020 the road construction demand will have reduced to low level reconstruction work
Decreases from 3 to 2 loaders, 2 to 1 large tipper trucks, 2 to 1 backhoes, 2 to 0 graders and 1 to 0 multi-tyre rollers (reduction of six large items overall).
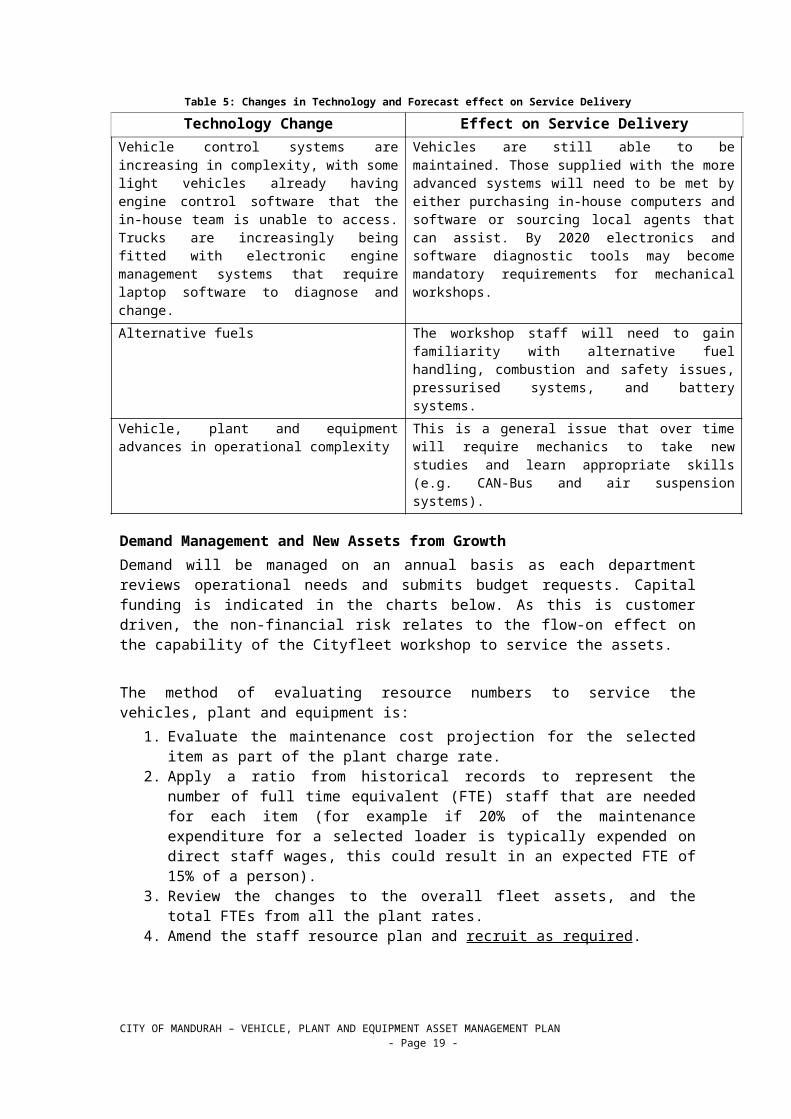
Changes in TechnologyTechnology changes are forecast to affect the delivery of services covered by this plan in the following areas.
Table 5: Changes in Technology and Forecast effect on Service Delivery
Technology Change Effect on Service DeliveryVehicle control systems are increasing in complexity, with some light vehicles already having engine control software that the in-house team is unable to access. Trucks are increasingly being fitted with electronic engine management systems that require laptop software to diagnose and change.
Vehicles are still able to be maintained. Those supplied with the more advanced systems will need to be met by either purchasing in-house computers and software or sourcing local agents that can assist. By 2020 electronics and software diagnostic tools may become mandatory requirements for mechanical workshops.
Alternative fuels The workshop staff will need to gain familiarity with alternative fuel handling, combustion and safety issues, pressurised systems, and battery systems.
Vehicle, plant and equipment advances in operational complexity
This is a general issue that over time will require mechanics to take new studies and learn appropriate skills (e.g. CAN-Bus and air suspension systems).
Demand Management and New Assets from GrowthDemand will be managed on an annual basis as each department reviews operational needs and submits budget requests. Capital funding is indicated in the charts below. As this is customer driven, the non-financial risk relates to the flow-on effect on the capability of the Cityfleet workshop to service the assets.
The method of evaluating resource numbers to service the vehicles, plant and equipment is:
1. Evaluate the maintenance cost projection for the selected item as part of the plant charge rate.
2. Apply a ratio from historical records to represent the number of full time equivalent (FTE) staff that are needed for each item (for example if 20% of the maintenance expenditure for a selected loader is typically expended on direct staff wages, this could result in an expected FTE of 15% of a person).
3. Review the changes to the overall fleet assets, and the total FTEs from all the plant rates.
4. Amend the staff resource plan and recruit as required.
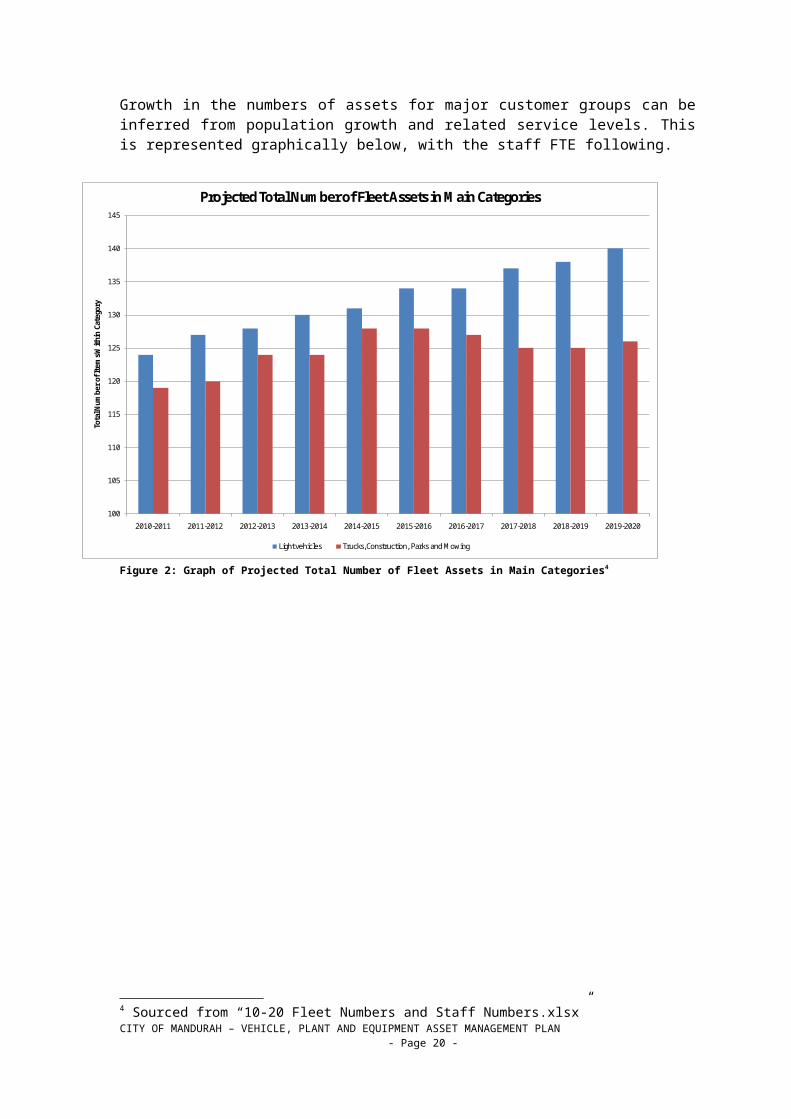
Growth in the numbers of assets for major customer groups can be inferred from population growth and related service levels. This is represented graphically below, with the staff FTE following.
CITY OF MANDURAH – VEHICLE, PLANT AND EQUIPMENT ASSET MANAGEMENT PLAN - Page 13 -
100
105
110
115
120
125
130
135
140
145
2010-2011 2011-2012 2012-2013 2013-2014 2014-2015 2015-2016 2016-2017 2017-2018 2018-2019 2019-2020
Tota
l Num
ber o
f Ite
ms W
ithin
Cat
egor
y
Projected Total Number of Fleet Assets in Main Categories
Light vehicles Trucks, Construction, Parks and Mowing
Figure 2: Graph of Projected Total Number of Fleet Assets in Main Categories4
4 Sourced from “10-20 Fleet Numbers and Staff Numbers.xlsx”CITY OF MANDURAH – VEHICLE, PLANT AND EQUIPMENT ASSET MANAGEMENT PLAN
- Page 14 -
0
1
2
3
4
5
6
7
2010-2011 2011-2012 2012-2013 2013-2014 2014-2015 2015-2016 2016-2017 2017-2018 2018-2019 2019-2020
Proj
ecte
d St
aff N
umbe
rs (d
edica
ted
to C
ityfle
et)
Projected Total Staff Numbers to Support Fleet Asset
Workshop Supervision Administration
Figure 3: Graph of Projected Total Staff Numbers to Support Fleet Assets5
To summarise, an increase in fleet asset numbers from 720 to approximately 795 items (including minor equipment) is expected from 2009 to 2020. The numbers of minor equipment are far more variable than other categories. In this analysis however they have a low effect on the required staff numbers.
The increase in fleet asset numbers will require support services for administration, repair and maintenance. The service will require increases in staff resources comprising one and nine-tenths (1.9) FTE administration staff and one FTE workshop staff from January 2010 to 2020.
Assumptions used to derive the demand and growth graphs were: Establishment of three new mowing crews or equivalent consisting of a truck,
trailer, mowing items and minor equipment. A new crew at regular periods through to 2014-2015;
Regular increases in community bus services adding 6 buses over the ten year period.
Regular increase in passenger and utility vehicle requirements for admin, rangers, operations etcetera adding 20 vehicles in total by 2020.
One full time workshop mechanic from 2010-2011 to resolve current workload issues, then further resourcing with one more administration position as soon as possible.
Risk Review of Future DemandTable 6: Risk Review of Future Demand
Risk Statement Risk Likelihood Current Treatment Proposed Treatment
5 Sourced from “10-20 Fleet Numbers and Staff Numbers.xlsx”CITY OF MANDURAH – VEHICLE, PLANT AND EQUIPMENT ASSET MANAGEMENT PLAN
- Page 15 -

Category and Consequence
= Rating
or Control or Control
Staff resources are not provided to service the fleet while the number of assets increases
Operational
Unlikely and Significant = Medium
Staff workloads are variable and the overall effect of increasing fleet numbers is mitigated to some extent by selective outsourcing of batches of work.
Selective outsourcing has limits, the main impediments being the increased cost of work, and the travel time for items to and from Perth where most dealerships are located. Business cases will continue to be submitted in addition to analyses in this plan.
Risk that the projections in this plan are either too low or too high, and consequently the financial and resource bases are planned incorrectly
Financial Possible and Significant = HIGH
Budgets are submitted on an annual basis with no reserve or future funding/hedging.
The assumptions in this plan need to be verified and funding set aside to meet expected increases. Increases that dramatically exceed those represented will need to be prioritised within the respective years’ budget. Decreases will result in surplus funds being set aside that can be used for other purposes.
Risk that technology changes outpace the staff ability to repair and maintain (or operate) the fleet. This includes the risk that staff may not be able to maintain new assets.
Operational
Unlikely and Moderate = Medium
Staff can increase their knowledge and skills as required, however already some electronic components exceed local (Mandurah) ability to diagnose and repair them.
Future acquisitions need to be specified or monitored for technology changes that inhibit the ability to repair and maintain the items. Standardising where possible will enable the workshop to then source the appropriate hardware, software, and training.
Risk that price and Supply of Fuel (petrol and diesel) require a reduction of services
Operational and Financial
Possible and Significant = HIGH
Fuel pricing is being monitored. Small steps taken to move vehicles to non-petroleum dependency. Fuel sensitivity analysis being prepared.
Complete a study of the City’s sensitivity to fuel, and prepare a Procedure to address and plan for energy (fuel) shortages.
CITY OF MANDURAH – VEHICLE, PLANT AND EQUIPMENT ASSET MANAGEMENT PLAN - Page 16 -
LIFE CYCLE MANAGEMENT PLANThe lifecycle management plan details how the City plans to manage and operate the assets at the agreed levels of service (defined in section 3) while optimising life cycle costs.
Background Data
Physical parametersThe assets covered by this asset management plan are shown below.
Table 7: Asset Categories and Replacement Values
Asset category Description Replacement Value ($M)
1 Light passenger vehicles Four wheel sedans, wagons, hatches and passenger vans including people movers seating less than 9 passengers and generally not classed as utility or commercial vehicles.
2.11
2 Light Commercial vehicles Four wheel utilities and vans whose primarily role is goods rather than passenger transport. This category also includes two-wheel motorbikes and motorised scooters, and troop carriers.
1.59
3 Trucks and Buses Trucks having a GVM from 3,500kg and above, and vans or buses able to carry more than 8 passengers.
4.74
4 Trailers Towed units with self-contained axles, registered for on-road use, designed to carry goods and plant. This category may include trailers purchased for less than $1500 due to their extreme age. (Replacement items are expected to cost over $1500.)
0.33
5 Construction Earthmoving, road maintenance and construction, compaction, drainage and associated equipment valued at over $1500 each. Includes graders, loaders, compactors of various types, pumps, concrete saws.
2.08
6 Parks and Mowing equipment
Agricultural and horticultural equipment including mowers, tractors and implements pulled by tractor units, with purchase price over $1500.
1.01
7 Miscellaneous plant Items not readily categorised with the above categories, such as path sweepers, sprayers, each with purchase price $1500 or over.
0.41
8 Minor equipment All motorised, mobile or portable machinery valued at under $1500. Includes brushcutters, chainsaws, power tools, small concrete saws, small compactors. Not intended to include hand tools or simple non-motorised equipment such as wheelbarrows.
0.58
TOTAL 12.386
6 All values sourced from the 10-20 Ten Year Plant Replacement ProgramCITY OF MANDURAH – VEHICLE, PLANT AND EQUIPMENT ASSET MANAGEMENT PLAN
- Page 17 -

All items are owned or leased by the City. State Emergency Services and Bushfire Brigade equipment is not included in this assessment as these assets are managed by Fire and Emergency Services Australia.The age profile of the City’s assets is shown in Table 8.
Table 8: Asset Age Profile; Number of Items In Each Category at that Age
Age In Years<1 1 2 3 4 5 6 7 8 9 10 11
to 15
16+
1 Light Passen-ger
23 29 10 1 0 0 0 0 0 0 0 0 0
2 Light Com-mercial
19 22 15 1 0 0 0 0 0 0 0 0 0
3 Trucks and Buses
0 10 6 9 2 10 3 2 0 0 0 0 0
4 Trailers 2 3 3 4 1 0 1 0 0 0 1 15 25
5 Construction 1 5 1 3 5 4 6 1 3 2 1 4 0
6 Parks and Mowing
2 5 3 9 1 3 0 0 1 2 0 7 3
7 Misc. >$1.5k 8 8 2 6 3 2 2 4 4 3 5 14 9
8 Minor Equip-ment
79 18 41 17 32 21 14 8 10 4 6 62 54
Areas of attention are: Ten trucks at five years of age. Within the next five years these will require
replacement. To reduce the impact on capital funding within any one year, the replacements will need to be spread over a number of years.
A large number of very old trailers. Although maintenance expenditure is not significant on trailers compared to other categories, the number of older trailers creates additional work and many of these are in very poor condition. In 09-10, twelve of the oldest trailers were targeted for replacement, with the remaining scheduled over 10-11 and 11-12.
The few very old items in the Construction, Parks and Mowing and Miscellaneous categories are being scheduled for replacement in 10-11.
The high number of very old items showing for Minor Equipment is due to a lack of a coordinated replacement program combined with the need for old data records to be cleaned up. This will be resolved through 10-11 years.
Asset capacity and performanceVehicle, plant and equipment assets are repaired and maintained to working condition under an optimum replacement methodology. As each asset ages, the amount of work required increases, and the cost of maintenance increases. The cost of ownership decreases over time, and when these two cost elements are compared, an optimum ownership lifetime can be evaluated. This optimum replacement point will result in the lowest cost of ownership and maintenance.
The asset capacity and performance, as related to vehicles, plant and equipment, decreases with age primarily as a result of loss of reliability in the asset. In other words, an increase in faults and maintenance required causes the item to be less available and
CITY OF MANDURAH – VEHICLE, PLANT AND EQUIPMENT ASSET MANAGEMENT PLAN - Page 18 -

suffer more breakdowns. A number of key performance indicators can be used to evaluate this element, however unless downtime costs are recorded specifically for the asset, the loss of reliability and associated tangible or intangible costs are not included in the optimum replacement analyses.
Individual assets are assessed on a case by case, or category by category basis, with exceptional items submitted for budget consideration each year.
Asset conditionThe condition profile is similar to the age profile. Some assets may decrease in condition more rapidly due to the nature of the operating environment and the utilisation level. Items experiencing a high cost of operation relative to their age are targeted for earlier replacement in accordance with the optimum replacement analyses.
Asset valuationsThe value of assets as at March 2010 covered by this asset management plan is summarised below. Assets are re-valued annually as part of the plant rates calculations.
Current Replacement Cost $12.48 M7
Depreciable Amount (DA) $ 6.03 M8
Annual Depreciation Expense (D) $ 1.20 M9
Asset Consumption (D/DA) (1.20 / 6.03) 20%Asset renewal (Renewal exp/DA) (1.8110 / 6.03) 30%Annual Upgrade/expansion 10% 11
Routine Maintenance PlanRoutine maintenance is the regular work that is necessary to keep assets operating due to wear and tear and scheduled servicing.
Maintenance planServicing is conducted to manufacturer’s requirements.All maintenance work is managed through a computerised maintenance management system (CMMS). CMMS activities include recording work schedules, recording work completed, failure records, scheduling and reporting what was done to develop a maintenance history and improve maintenance and service delivery performance. The cost of maintenance and repair work is registered in a financial system against each asset. Costs are recorded against plant cost codes for each asset, with the current cost codes in use:
1 Cityfleet Labour 2 Materials and Services 3 Fuel
7 Total replacement value indicated in the 10-20 Ten Year Plant Replacement Program8 Purchase price less estimated trade from the 10-11 Plant Rates list9 Annual depreciation from the 10-11 Plant Rates list10 Average net capital from the 10-20 Ten Year Plant Replacement Program11 This can not be evaluated directly. Assets are generally specified to a higher standard with each replacement, but this value can usually not be determined separately as the costs are integral to the cost of replacement.CITY OF MANDURAH – VEHICLE, PLANT AND EQUIPMENT ASSET MANAGEMENT PLAN
- Page 19 -
4 Registrations 5 Insurance Claim Costs 9 Hire or Lease
Cost codes available but not in use due to system faults include: 6 Commission and Decommission Costs 7 Tyres 8 Operator Labour 10 Insurance Premium
The cost codes and associate reporting functions enable some analysis to be conducted on life cycle cost of plant. Each maintenance activity is recorded as a separate job in the CMMS, with fault codes assigned using the following types:
R&M Due to Design Fault R&M Due to Driver R&M Due to Lack of Daily Maintenance R&M Due to Operational Work R&M Due to Wear and Tear or Age Crash 1 Insurance Claim Crash 2 Under Excess Warranty Claim Rework by Workshop Callout –Breakdown or Service
Due to limitations with the CMMS, limited reporting is available on the time taken and the number of jobs within each fault type. Due to having no integration with the job costs, there is no facility to analyse the cause of high cost jobs or plant.Planned maintenance work is 79% of total maintenance by the number of jobs. Ideally this value would be reported by dollar value, however the CMMS and finance systems are not linked. As indicated in the key performance indicators in the section “DesiredLevels of Service”, the ideal target is to exceed 50% planned work. Although this is currently being achieved, it should be noted that the unplanned jobs are more often of a very high expenditure and take much longer than the scheduled and planned jobs.Maintenance work is prioritised on the basis of internal, undocumented rules. While there is no precise order of priority due to the varying needs of the different customer groups, on a general approach the following items are dealt with as a higher priority:
Servicing Road sweepers Graffitti trailers Construction plant Community Buses
Standards and specificationsMaintenance work is carried out in accordance with the manufacturer’s requirements. Modifications to plant are carried out in accordance with the relevant Australian Standard.
Maintenance Expenditure for Current FleetMaintenance expenditure trends for the current fleet are shown in the Figure 4. Expenditure is estimated by vehicle category, group and type depending on the amount CITY OF MANDURAH – VEHICLE, PLANT AND EQUIPMENT ASSET MANAGEMENT PLAN
- Page 20 -
of variation expected within the respective levels. Some maintenance predictions are based on the group average, while others are increased year by year using historical records to project future expenditure.
CPI of 2% has been included.
-
100,000
200,000
300,000
400,000
500,000
600,000
700,000
800,000
900,000
2010
-201
1
2011
-201
2
2012
-201
3
2013
-201
4
2014
-201
5
2015
-201
6
2016
-201
7
2017
-201
8
2018
-201
9
2019
-202
0
Ten Year R&M by Category (2% CPI)
8 MINOR EQUIPMENT
7 MISCELLANEOUS >$2K
6 PARKS AND MOWING
5 CONSTRUCTION (EARTH AND CONCRETE)
4 TRAILERS
3 TRUCKS AND BUSES
2 LIGHT COMMERCIAL
1 LIGHT PASSENGER
Figure 4: Ten Year Maintenance Expenditure
The variability in expenditure is primarily caused by heavy construction equipment and the road sweepers. This results in maintenance expenditure varying between $533,000 in 2013 and $672,000 in 2017.Maintenance expenditure levels are considered to be adequate to meet existing service levels.
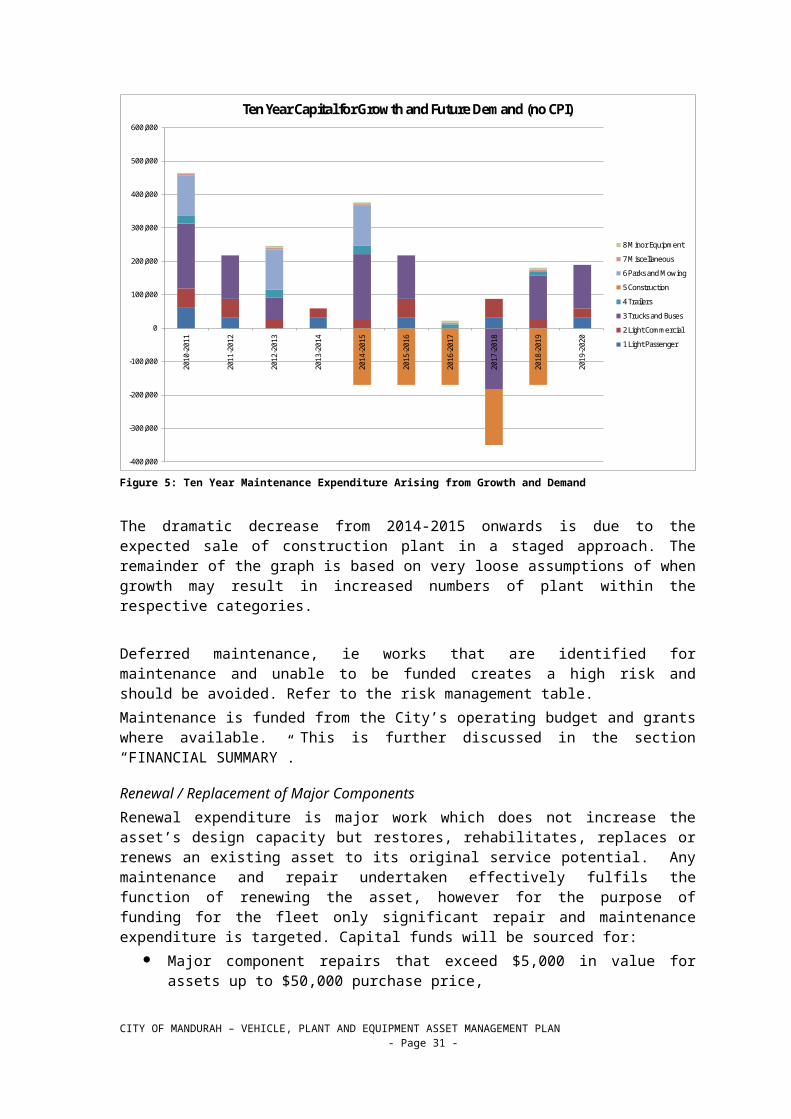
Maintenance Expenditure for Demand and Growth ForecastsWith reference to the demand and growth forecasts in section “Demand Managementand New Assets from Growth”, the impact of maintenance expenditure is shown in the following graph Figure 5, representing the increase in maintenance expenditure attributed to the increase (or decrease) in assets.
CITY OF MANDURAH – VEHICLE, PLANT AND EQUIPMENT ASSET MANAGEMENT PLAN - Page 21 -
-400,000
-300,000
-200,000
-100,000
0
100,000
200,000
300,000
400,000
500,000
600,000
2010
-201
1
2011
-201
2
2012
-201
3
2013
-201
4
2014
-201
5
2015
-201
6
2016
-201
7
2017
-201
8
2018
-201
9
2019
-202
0
Ten Year Capital for Growth and Future Demand (no CPI)
8 Minor Equipment
7 Miscellaneous
6 Parks and Mowing
5 Construction
4 Trailers
3 Trucks and Buses
2 Light Commercial
1 Light Passenger
Figure 5: Ten Year Maintenance Expenditure Arising from Growth and Demand
The dramatic decrease from 2014-2015 onwards is due to the expected sale of construction plant in a staged approach. The remainder of the graph is based on very loose assumptions of when growth may result in increased numbers of plant within the respective categories.
Deferred maintenance, ie works that are identified for maintenance and unable to be funded creates a high risk and should be avoided. Refer to the risk management table.Maintenance is funded from the City’s operating budget and grants where available. This is further discussed in the section “FINANCIAL SUMMARY”.
Renewal / Replacement of Major ComponentsRenewal expenditure is major work which does not increase the asset’s design capacity but restores, rehabilitates, replaces or renews an existing asset to its original service potential. Any maintenance and repair undertaken effectively fulfils the function of renewing the asset, however for the purpose of funding for the fleet only significant repair and maintenance expenditure is targeted. Capital funds will be sourced for:
Major component repairs that exceed $5,000 in value for assets up to $50,000 purchase price,
Major component repairs that exceed 10% of the purchase price for assets over $50,000 purchase price,
Non urgent repairs, which can be planned for the following funding period (eg financial year)
The work when the full scope can be quantified and costed.Any major works not meeting these requirements must be repaired as operational expenditure.
CITY OF MANDURAH – VEHICLE, PLANT AND EQUIPMENT ASSET MANAGEMENT PLAN - Page 22 -

Energy PlanThe vehicles, plant and equipment are fuelled by diesel, unleaded petrol, and a very few items are powered by electricity. In the recent past vehicles have also been fuelled by liquefied petroleum gas (LPG).
Fuel PlanFuel is provided through BP fuel stations and through bulk fuel deliveries to the Operations Centre fuel tanks. Fuel issuing is controlled by BP fuel card and by a fuel management system at the Operations Centre called Datafuel. These systems enable day, time, litres, fuel type, cost and odometer readings to be recorded for each asset. Information is transferred to both the CMMS and the Finance System for fuel consumption, odometer reading and cost records.The Operations Centre fuel tanks and bowsers are very old and will require periodic inspection and condition checking to ensure they remain viable. 348,000 litres of diesel and petrol were issued in the 12 months ending 28 Feb 2010. Due to the restricted single location the fuel source carries a low risk of theft but a high risk of loss due to fire. The BP fuel cards are able to be used at any public BP fuel station, and are updated as required to meet vehicle fuelling needs. 188,000 litres of diesel and petrol were purchased through the BP fuel cards in the twelve months ending 28 Feb 2010. Due to the restricted card function the fuel source carries a low risk of theft and the diverse sites result in a low risk of loss due to fire.
Standards and specificationsFuel is purchased to Australian Standards, as required for the vehicles, plant and equipment. The BP fuel card sourced fuel is available in a range of specifications with the most commonly used being 91 RON Unleaded petrol and Low sulphur diesel. The Operations centre fuel is 91 RON unleaded petrol and Low sulphur diesel. Two-stroke oil is purchased and mixed to manufacturer’s recommended ratios in ten litre jerry cans.Items using electricity are powered through mains or generators to meet the items’ voltage and amperage needs.
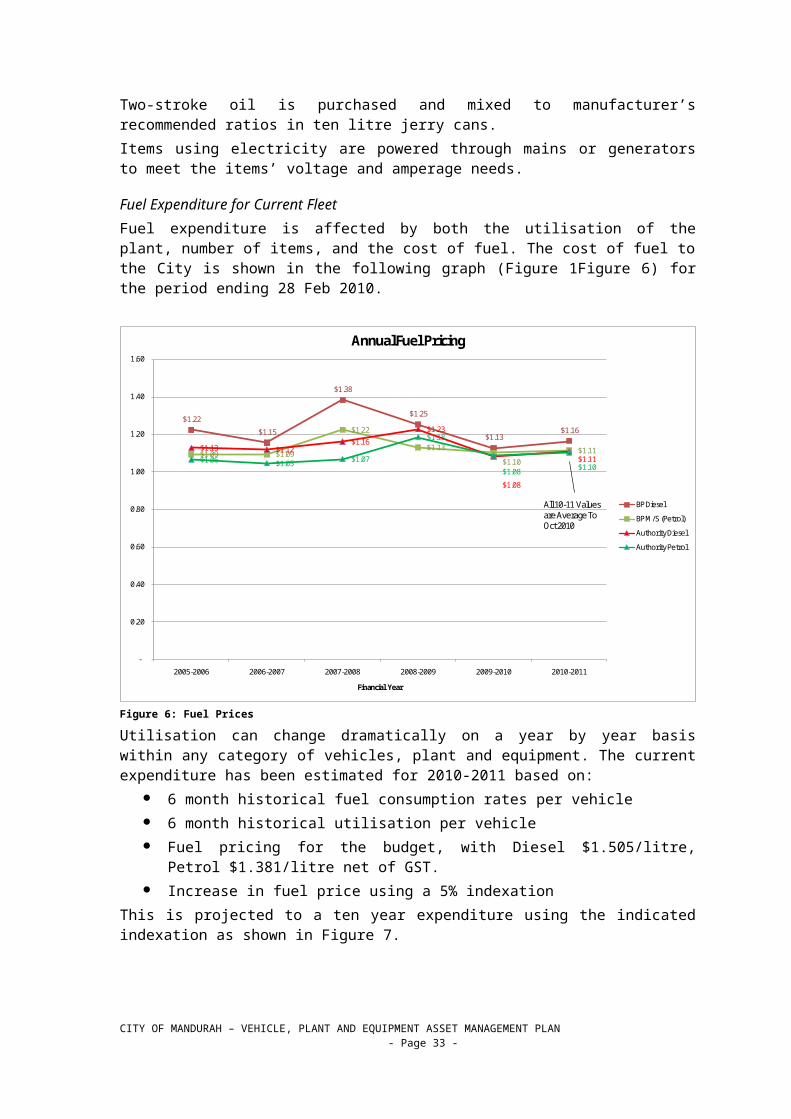
Fuel Expenditure for Current FleetFuel expenditure is affected by both the utilisation of the plant, number of items, and the cost of fuel. The cost of fuel to the City is shown in the following graph (Figure 1Figure 6) for the period ending 28 Feb 2010.
CITY OF MANDURAH – VEHICLE, PLANT AND EQUIPMENT ASSET MANAGEMENT PLAN - Page 23 -

$1.22
$1.15
$1.38
$1.25
$1.13 $1.16
$1.09 $1.09
$1.22
$1.13
$1.10 $1.11 $1.13 $1.12
$1.16
$1.23
$1.08
$1.11 $1.06 $1.05 $1.07
$1.18
$1.08 $1.10
-
0.20
0.40
0.60
0.80
1.00
1.20
1.40
1.60
2005-2006 2006-2007 2007-2008 2008-2009 2009-2010 2010-2011
Financial Year
Annual Fuel Pricing
BP Diesel
BP M/S (Petrol)
Authority Diesel
Authority Petrol
All 10-11 Values are Average To Oct 2010
Figure 6: Fuel Prices
Utilisation can change dramatically on a year by year basis within any category of vehicles, plant and equipment. The current expenditure has been estimated for 2010-2011 based on:
6 month historical fuel consumption rates per vehicle 6 month historical utilisation per vehicle Fuel pricing for the budget, with Diesel $1.505/litre, Petrol $1.381/litre net of GST. Increase in fuel price using a 5% indexation
This is projected to a ten year expenditure using the indicated indexation as shown in Figure 7.
CITY OF MANDURAH – VEHICLE, PLANT AND EQUIPMENT ASSET MANAGEMENT PLAN - Page 24 -

-
200,000
400,000
600,000
800,000
1,000,000
1,200,000
1,400,000
2010
-201
1
2011
-201
2
2012
-201
3
2013
-201
4
2014
-201
5
2015
-201
6
2016
-201
7
2017
-201
8
2018
-201
9
2019
-202
0
Ten Year Fuel by Category (5% CPI)
8 MINOR EQUIPMENT
7 MISCELLANEOUS >$2K
6 PARKS AND MOWING
5 CONSTRUCTION (EARTH AND CONCRETE)
4 TRAILERS
3 TRUCKS AND BUSES
2 LIGHT COMMERCIAL
1 LIGHT PASSENGER
Figure 7: Ten Year Fuel Expenditure
Minor equipment fuel is not shown as the low volume is typically purchased with a larger item.
Fuel Expenditure for Demand and Growth ForecastsWith reference to the demand and growth forecasts in the section “DemandManagement and New Assets from Growth”, the impact of fuel expenditure is shown in the following graph (Figure 8), representing the increase in fuel expenditure attributed to the increase or decrease in assets.
CITY OF MANDURAH – VEHICLE, PLANT AND EQUIPMENT ASSET MANAGEMENT PLAN - Page 25 -

-60,000
-40,000
-20,000
0
20,000
40,000
60,000
80,000
100,000
120,000
140,000
2010
-201
1
2011
-201
2
2012
-201
3
2013
-201
4
2014
-201
5
2015
-201
6
2016
-201
7
2017
-201
8
2018
-201
9
2019
-202
0
Ten Year Fuel for Growth and Future Demand (no CPI)
8 Minor Equipment
7 Miscellaneous
6 Parks and Mowing
5 Construction
4 Trailers
3 Trucks and Buses
2 Light Commercial
1 Light Passenger
Figure 8: Ten Year Fuel Growth
Asset Replacement and Disposal Plan (Plant Replacement Program)Assets requiring replacement are identified from optimum life analyses and current maintenance expenditure. Generally each item is programmed in accordance with optimum life cycle analyses, thus ensuring the lowest life cost is achieved. There is however some flexibility as noted below.Items with high utilisation, high maintenance cost, extensive down time, and that are critical to the provision of the service are ranked as Urgent. Items with low utilisation, low maintenance cost, low down time, that are not critical to the provision of the service or where the service carries a lower priority are ranked as Medium. They are programmed at their optimum replacement point and will typically have a wide range of ownership life, within which the item can be replaced without incurring a cost penalty. Items at ten years of age or older are targeted for replacement to prevent obsolescence, and are ranked High. Items that fall between these ranges with varying attributes are ranked appropriately. This enables some items to be deferred to balance the funding requirements each year.
Replacement StandardsItems are replaced to meet current and expected future functional need. In most cases replacements are specified like-for-like, as the functional needs do not significantly change. A simple process ensures that replacements meet requirements:
A specification is prepared based on the current equivalent make and model of plant
This is presented to the customer(s) with suitable alternatives Managers, Coordinators and staff are consulted to compare current specifications
with the previous items and to ensure functional needs are met
CITY OF MANDURAH – VEHICLE, PLANT AND EQUIPMENT ASSET MANAGEMENT PLAN - Page 26 -

The specification is amended to suit, and the item is acquired following the purchasing procedures and subject to budget funding.
Future Replacement ExpenditureProjected future replacement expenditures are forecast using current 2010 dollar values, and are presented as the 2010-2020 Ten Year Plant Replacement Program. A simple two percent index is applied although within some classes the increase in price can be as high as 15% per year. The costs are summarised in Figure 1.
-
500,000
1,000,000
1,500,000
2,000,000
2,500,000
3,000,000
2010
-201
1
2011
-201
2
2012
-201
3
2013
-201
4
2014
-201
5
2015
-201
6
2016
-201
7
2017
-201
8
2018
-201
9
2019
-202
0
Amou
nt
Year
Ten Year Plant Replacement Program 2010-2020 (Net Capital)
Figure 9: Ten Year Program
The peak in 2018-2019 is due to a coincidence of replacement of expensive plant items, and would need to be managed closer to the time by spreading replacements between adjacent years.
Future Assets Acquisition PlanAssets are acquired in accordance with normal procedures, using the same specification process as noted in the section “Future Replacement Expenditure”.Once assets are acquired, they are registered in the following Ten Year Plant Replacement Program based on optimum replacement terms. In most cases plant items are assumed to require replacement when they reach their optimum life, as the service will continue.
Selection criteriaNew fleet assets are selected in accordance with the budget process.
Standards and specificationsStandards and specifications for new assets and for upgrade/expansion of existing assets are the same as those for renewal.
Future Assets ExpenditureCapital expenditure for forecast growth and demand is summarised in Figure 1Figure 10.
CITY OF MANDURAH – VEHICLE, PLANT AND EQUIPMENT ASSET MANAGEMENT PLAN - Page 27 -

-400,000
-300,000
-200,000
-100,000
0
100,000
200,000
300,000
400,000
500,000
600,000
2010
-201
1
2011
-201
2
2012
-201
3
2013
-201
4
2014
-201
5
2015
-201
6
2016
-201
7
2017
-201
8
2018
-201
9
2019
-202
0
Ten Year Capital for Growth and Future Demand (no CPI)
8 Minor Equipment
7 Miscellaneous
6 Parks and Mowing
5 Construction
4 Trailers
3 Trucks and Buses
2 Light Commercial
1 Light Passenger
Figure 10: Ten Year Capital for Growth
The drop in 2014-2015 as mentioned previously relates to an expected reduction in the numbers of large construction plant items. Those items and the negative values should be represented as a decrease in the funding requirements of the Ten Year Replacement Program.
New assets and services are to be funded from Council’s capital works program and grants where available. This is further discussed in the section “Funding Strategy”.
Risk Review of Life Cycle ManagementAs all items are programmed for replacement according to optimum replacement terms, there are no items that represent critical risks. High maintenance and high utilisation items create the greatest problems for both operation and maintenance, and this in turn is reflected in the optimum replacement terms.
Table 9: Risk Review of Life Cycle Management
Risk Statement Risk Category
Likelihood and
Consequence = Rating
Current Treatment or
Control
Proposed Treatment or Control
Road sweepers: If the three units are not replaced at staged times, there is a risk that all three can reach old age and experience high cost failures and downtime at the same time.
Operational Unlikely and Moderate = Medium
Stage the replacements of the road sweepers to ensure a two year gap between ages, and thus control downtime and cost of maintenance. Ensure that the there units together have surplus operating capacity that enables any one unit to complete
CITY OF MANDURAH – VEHICLE, PLANT AND EQUIPMENT ASSET MANAGEMENT PLAN - Page 28 -

Risk Statement Risk Category
Likelihood and
Consequence = Rating
Current Treatment or
Control
Proposed Treatment or Control
the work of another when it is under repair.
Ride-on mowers: Risk that they are purchased at a common time and incur high maintenance and downtime at over the same period
Operational Unlikely and Moderate = Medium
Nine mowers are being purchased in 09-10 due to not being replaced in an appropriate frequency previously. Spare decks are on order. Limited spare capacity within current numbers.
Stage the replacements. Ensure spare operating capacity so one or more units can complete the work of others. Purchase spare decks and reel units to reduce the turn-around time for repairs.
Risk of having units of a unique format, under core use with limited replacement hire options. Any breakdown of units that are unique can impact on operations and raise costs.
Operational Unlikely and Moderate = Medium
A number of fleet items are single in both make, model, and format, although some of these can be replacement-hired easily.
Manage replacements and operational needs to reduce or eliminate single and unique format items. Ensure spare operating capacity so the unit(s) can be substituted if necessary.
Risk of having units with high operating demand but no spare capacity, core use with limited replacement hire options: Any breakdown of units even if many are available can impact on operations and raise costs if the operational team is unable to substitute the items
Operational Unlikely and Moderate = Medium
This is the current status across a range of asset categories.
Manage fleet numbers within each format of asset to ensure spare operating capacity is available.
Maintenance Plan: Risk of servicing not completed adequately
Operational Unlikely and Moderate = Medium
Servicing program run through CMMS. Reviewed fortnightly. New items have schedules
Maintain active checks, particularly unusual items that are not consistently used with major items and may be missed. Maintain and
CITY OF MANDURAH – VEHICLE, PLANT AND EQUIPMENT ASSET MANAGEMENT PLAN - Page 29 -
Risk Statement Risk Category
Likelihood and
Consequence = Rating
Current Treatment or
Control
Proposed Treatment or Control
entered when purchased.
improve CMMS.
Maintenance Plan: Risk of continuing technical problems with plant cost centres prevents adequate diagnosis of cost increases.
Financial Possible and Minor = Medium
Request submitted for this problem to be fixed, but no priority offered by the supplier.
Request priority resolution.
Maintenance Plan: Risk of continuing inability to analyse high cost jobs by fault code, prevents adequate analysis of costs and practices.
Financial Possible and Minor = Medium
Costs reported independently and historical analyses based on annual costs.
New CMMS to include integration so costs can be recognised against the asset, however still no job cost record. Present for future budget consideration.
Maintenance Plan: Risk of customer dissatisfaction and confusion in planning work through a lack of documented maintenance prioritisation system
Operational Possible and Moderate = Medium
Verbal Maintenance prioritisation rules to be documented as part of the JIG process, then presented to customer groups.
Maintenance Plan: Risk of assets being acquired and safety attributes not recognised by staff, leading to injury to staff or the public
Health Likely and Moderate = HIGH
Verbal induction given to operators and mechanics who are present on delivery, manuals provided.
Comprehensive system required to cover each step in acquisition, induction and ongoing operation of all vehicles, plant and equipment.
Energy Plan: Fire, safety and environmental hazards from the Operations centre fuel storage and bowsers.
Health, Financial, Operational
Possible and Severe = HIGH
Area is has been reviewed against the Australian Standards and meets requirements. Area is a no smoking area. Staff are familiar with dispensing procedure, and pedestrian
Current treatments are adequate.
CITY OF MANDURAH – VEHICLE, PLANT AND EQUIPMENT ASSET MANAGEMENT PLAN - Page 30 -
Risk Statement Risk Category
Likelihood and
Consequence = Rating
Current Treatment or
Control
Proposed Treatment or Control
movement is restricted.
Energy Plan: Risk of theft of fuel from BP
Financial Possible and Insignificant = Low
BP fuel cards limit opportunities for theft as either the person needs to know the PIN or they need to bypass the cashier’s check on what is being fuelled.
The current system is adequate, however the full fleet fuel cards are due for renewal in October 2010, so the card details could be updated.
Energy Plan: Risk of theft of fuel from Operations centre bowsers
Financial Possible and Insignificant = Low
The enclosed location, close to the workshop means the area is frequently within view of many people. Staff need to activate fuel dispensing through a dedicated fuel key.
Current system is adequate.
Energy Plan: Fire, safety and environmental hazards from the BP stations.
Health Rare and Severe = Medium
BP stations have standard layouts and equipment with a high level of signage and controls.
Monitor.
CITY OF MANDURAH – VEHICLE, PLANT AND EQUIPMENT ASSET MANAGEMENT PLAN - Page 31 -

FINANCIAL SUMMARYThis section contains the financial requirements resulting from all the information presented in the previous sections of this asset management plan. The financial projections will be improved as further information becomes available on desired levels of service and current and projected future asset performance.
Financial Statements and ProjectionsThe financial projections are shown in Table 10 for renewal of current expenditure and expenditure due to demand and growth. The operating expenditure has been further segregated to fuel and maintenance due to the different impacts.
Table 10: Summary Ten Year Operating and Capital Costs
2010-2011
2011-2012
2012-2013
2013-2014
2014-2015
2015-2016
2016-2017
2017-2018
2018-2019
2019-2020
Operating R&MRenewal 0.64 0.65 0.57 0.64 0.66 0.70 0.77 0.73 0.73 0.80Growth 0.03 0.04 0.05 0.05 0.07 0.08 0.07 0.07 0.07 0.08Subtotal 0.67 0.69 0.62 0.69 0.73 0.78 0.84 0.80 0.80 0.88Operating FuelRenewal 0.86 0.90 0.94 0.99 1.04 1.09 1.15 1.20 1.27 1.33Growth 0.03 0.05 0.06 0.07 0.08 0.09 0.08 0.07 0.07 0.09Subtotal 0.89 0.95 1.00 1.06 1.12 1.18 1.23 1.27 1.34 1.42Net CapitalRenewal 1.62 2.00 1.30 1.42 1.42 1.87 2.20 1.73 2.64 1.39Growth 0.46 0.22 0.25 0.06 0.21 0.05 -0.15 -0.26 0.01 0.19Subtotal 2.08 2.22 1.55 1.48 1.63 1.92 2.05 1.47 2.63 1.58Subtotal R&M, Fuel and Capital for Renewal
3.12 3.55 2.81 3.05 3.12 3.66 4.12 3.67 4.64 3.52Subtotal R&M, Fuel and Capital for Growth
0.52 0.31 0.36 0.18 0.36 0.22 0.00 -0.12 0.15 0.36Total R&M, Fuel and Capital for Growth and Renewal
3.64 3.86 3.17 3.23 3.48 3.88 4.12 3.55 4.79 3.88All values in million dollars.
Note that all costs are shown in 2010 dollar values. Indexation has only been applied to the Renewal estimates.
Sustainability of service deliveryThere is one key indicator for financial sustainability that has been considered in the analysis of the services provided by this asset category, this being the long term life cycle costs. For this category of asset, the long term plan, being a ten year plan, is sufficiently long to cover most asset replacements and life cycles hence a longer term assessment is not required. Life cycle costs (or whole of life costs) are the average costs that are required to sustain the service levels over the predicted asset life. Life cycle costs include maintenance and
CITY OF MANDURAH – VEHICLE, PLANT AND EQUIPMENT ASSET MANAGEMENT PLAN - Page 32 -
asset consumption (depreciation expense)12. The annual average life cycle cost for the existing services covered in this asset management plan is $1.90 million.Life cycle costs can be compared to life cycle expenditure to give an indicator of sustainability in service provision. Life cycle expenditure includes maintenance and capital renewal expenditure. Life cycle expenditure will vary depending on the timing of asset renewals. The life cycle expenditure at the start of the plan is $2.26 million.A gap between life cycle costs and life cycle expenditure gives an indication as to whether present consumers are paying their share of the assets they are consuming each year. The purpose of this Fleet asset management plan is to identify levels of service that the community needs and can afford and develop the necessary long term financial plans to provide the service in a sustainable manner.The life cycle gap for services covered by this asset management plan is an average $545,000 per annum. The life cycle sustainability index is 0.93.The reason for this gap is that internal users are charged the current level of depreciation as a loss in value of the item over the life of the item. This could be considered a repayment of capital. Users are not required to fund a higher rate that would accommodate price increases. The gap between depreciation collected through charges and the increase in cost of new items must therefore be covered through independent funding. As a fund reserve is not established, in practice the full capital funds must be sourced from the municipal fund each year.
Funding StrategyProjected expenditure identified in the section LIFE CYCLE MANAGEMENT PLAN is to be funded from the City’s operating and capital budgets. Achieving the funding for Renewals will require:
The establishment of a fuel reserve fund to offset the expected dramatic increase in fuel prices over the next decade;
The annual management of budget to align to the varying repair and maintenance expenditures and replacement capital.
Achieving the funding for Growth and Demand will require: Forward planning for grant funds and operating expenditure budgets to occur in
synchronisation for community bus services; Defined forward plan for increasing Parks and Reserves maintenance plant and
equipment, with appropriate amounts of capital and operating set aside for each future year;
Valuation ForecastsAsset values and replacement costs are forecast in the 10-20 Plant Replacement Program. The values are summarised in Table 11 below.
Table 11: 10-20 Plant Replacement Program Values
2010-2011
2011-2012
2012-2013
2013-2014
2014-2015
2015-2016
2016-2017
2017-2018
2018-2019
2019-2020
Light Passenger Vehicles
430
476
350
510
428
440
451
518
393
518 Light Commercial Vehicles
12 Whole of life costs used to charge out vehicles will also include the cost of fuel, however the fuel consumption rate does not vary significantly over the life of the assets so is not considered in this life analysis.CITY OF MANDURAH – VEHICLE, PLANT AND EQUIPMENT ASSET MANAGEMENT PLAN
- Page 33 -
311
177
505
284
256
415
301
255
457
304
Trucks and Buses
335
753
109
299
462
585
725
415
828
34 Trailers
34
100
-
8
-
17
46
11
21
60
Construction Plant
212
264
35
16
29
89
375
432
401
32 Parks and Mowing
188
127
222
177
174
245
208
24
418
303
Miscellaneous Items
56
47
30
68
16
21
37
24
66
88 Minor Equipment
53
54
55
56
57
58
59
60
61
62
Total
2,360
2,651
2,160
2,214
2,106
2,725
2,954
2,510
3,497
2,223 All values in thousands (‘000).
Key Assumptions made in Financial ForecastsKey assumptions made in this asset management plan are:
The City will purchase assets rather than lease them due to the proven savings of ownership compared to lease.
The City will continue to operate a mechanical workshop with the associated advantages in the provision of mechanical services;
Current services will not diminish except where noted for road construction. The current fleet establishment represents a reasonable and cost effective
method of providing those services; Services provided by customers, that are using fleet assets, will continue to be
provided and require the same type and configuration of fleet assets; Fuel sources are available and the current method of acquiring fuel will continue
to a similar extent (noting the significant risks identified for supply and price); Repair and maintenance methods can continue with similar practices as used
currently, including parts availability, and service received from Mandurah and Perth based dealerships (noting risks arising from developing technologies and supply issues);
Year-by-year funding for renewal of assets, including operational and capital budgets will be made available within the range of needs identified in the plan, hence not causing a dramatic shift in financial requirements;
Future growth and demand services will be planned to an appropriate level within the City to ensure large expenditures are funded over many years, thus reducing the impact on any single year and ensuring appropriate revenue streams are available.
CITY OF MANDURAH – VEHICLE, PLANT AND EQUIPMENT ASSET MANAGEMENT PLAN - Page 34 -
Repair and maintenance estimates are based on existing vehicle averages and historical costs, and these provide reasonable projections of future expenditure;
Fuel expenditure can be estimated from the current fleet, using current fuel consumption rates, utilisation, and target fuel prices;
Residual values of vehicles are evaluated using historical values and industry guides, and these are accurate enough to set income budgets for the following years.
Accuracy of future financial forecasts may be improved in future revisions of this asset management plan by the following actions.
Get a clearer forward plan from relevant departments for the quantity and type of fleet items that will be required, including changes to services and vehicle needs.
CITY OF MANDURAH – VEHICLE, PLANT AND EQUIPMENT ASSET MANAGEMENT PLAN - Page 35 -

ASSET MANAGEMENT PRACTICESAccounting/Financial SystemsThe City uses the finance system “Authority” to record asset values and depreciate them in accordance with AAS27. Operating expenditure is recorded against the assets in Authority, including separate recognition of Labour, Materials, Registration, Fuel, and Lease costs as explained in the section “Maintenance plan”.Fuel expenditure for some assets is imported from a separate fuel management system, Datafuel, with the expenditure issued against assets in Authority as issues of inventory. Meter readings are also imported into Authority. Fuel sourced from fuel cards is costed to the assets on a monthly basis.Asset records in Authority are maintained by Finance Services. All payments and invoicing, account structures, ledgers and accounting regulations are the responsibility of Finance Services.Refer section “Renewal / Replacement of Major Components” for the treatment of high expense maintenance items as capital expenditure.
Asset Management SystemsThe City uses the fleet management system “Fleet 5” for operational administration and record keeping. Fleet 5 has detailed records of each asset, including service schedules, drivers and departments. Due to a range of system problems, the City will be investigating an alternative fleet management system with improved fleet functionality. Repair and maintenance is recorded in Fleet 5 via the service scheduling, maintenance records for individual jobs, and with fault codes as listed in section “Maintenance plan”. Fuel records are imported from both the fuel management system Datafuel and the BP fuel records, to provide meter readings, fuel consumption rates and utilisation levels.There is currently no integration of Fleet 5 with the finance system. Cityfleet conduct all administration associated with the CMMS and Datafuel and determine the level of detail and management of the system and data.The City uses the fuel management system Datafuel to control the issuing of fuel onto assets. Records from Datafuel are imported into the finance system to enable costs to be allocated to the assets.
Information Flow Requirements and ProcessesThe key information flows into this asset management plan are:
The asset register data on size, age, value, fuel consumption and maintenance expenditure;
Optimum life cycle analyses and ownership terms Service levels; Projections of various factors affecting future demand for services;
The key information flows from this asset management plan are: Funding requirements; Risk identification Action plans
These will impact the Long Term Financial Plan, Strategic Business Plan, annual budget and departmental business plans and budgets.
CITY OF MANDURAH – VEHICLE, PLANT AND EQUIPMENT ASSET MANAGEMENT PLAN - Page 36 -

Standards and Guidelines Australian Standards, where applicable Legislation as noted in the section “Legislative Requirements” Procedure Vehicles, Plant and Equipment Procedure Light Vehicle Selection Procedure Light Vehicle Custodianship Procedure Acquisition and Disposal of Vehicles, Plant and Equipment Procedure Fleet Safety (being drafted) Other procedures to be drafted covering fuel management, repair and
maintenance management, and plant and equipment custodianship.External guide documents
IPWEA Plant and Vehicle Management Manual
CITY OF MANDURAH – VEHICLE, PLANT AND EQUIPMENT ASSET MANAGEMENT PLAN - Page 37 -
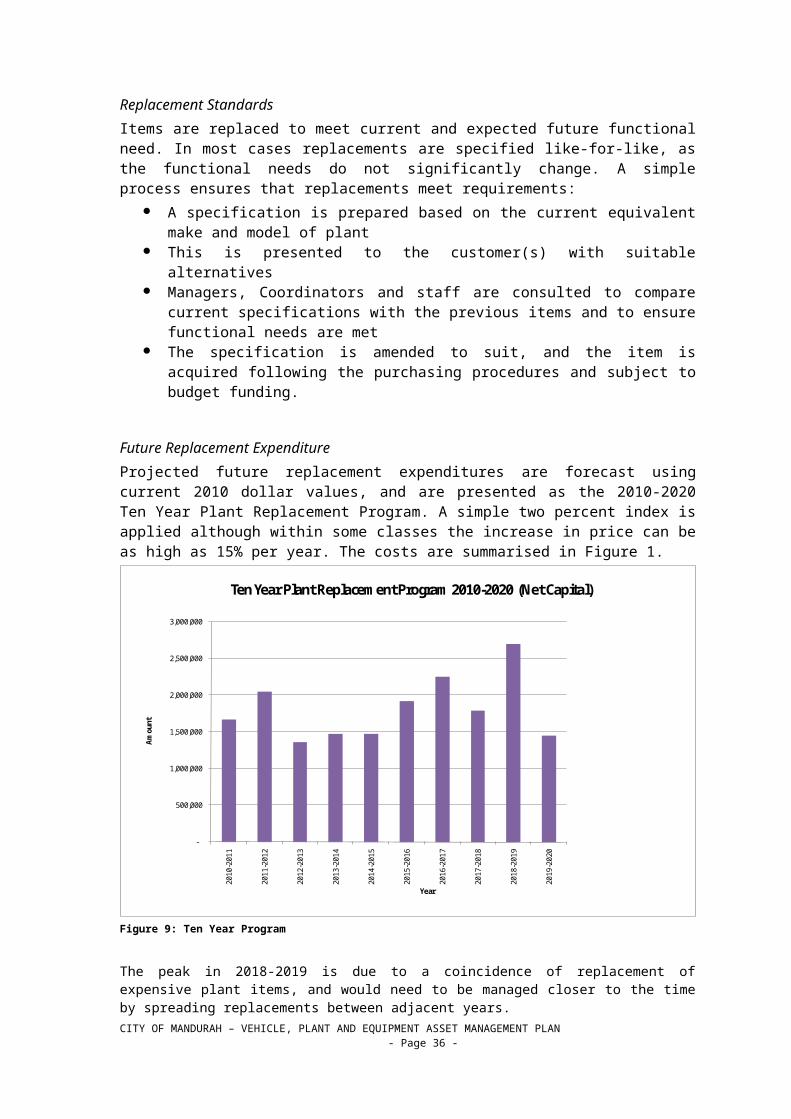
PLAN IMPROVEMENT AND MONITORINGPerformance MeasuresThe effectiveness of the asset management plan can be measured in the following ways:
The degree to which the required funding identified in this asset management plan are incorporated into council’s long term financial plan;
The accuracy of growth projections compared to actual needs over the ten year forecast;
The accuracy of forecast budgets; Reduction of exposure to risks; Completion of identified actions; Implementation of all key performance indicators identified in section “Current
Levels of Service.
Improvement PlanThe Improvement of the Asset Management Plan examines activities that can improve the data accuracy and integrity that is used to generate the plan, and in turn the level of outcomes that arise from the plan. As the AMP already identifies a number of improvements in asset management practices, the improvement plan consists of a selection of actions from the risk reviews within the Asset Management Plan, listed in Table 12 below.
Table 12: Improvement Actions
Task No
Task Responsibility Resources Required
Timeline
1. Risk that the projections in this plan are either too low or too high, and consequently the financial and resource bases are planned incorrectly.The assumptions in this plan need to be verified and funding set aside to meet expected increases. Increases that dramatically exceed those represented will need to be prioritised within the respective years’ budget. Decreases will result in surplus funds being set aside that can be used for other purposes.
SMG, EMG Documented ten year forward plans
1-2 Years
2. Risk that price and Supply of Fuel (petrol and diesel) require a reduction of services Complete a study of the City’s sensitivity to fuel, and prepare a procedure to address and plan for energy (fuel) shortages.
CFM - 1 Year
3. Risk of continuing inability to analyse high cost jobs by fault code, prevents adequate analysis of costs and practices.New CMMS to include integration so costs can be recognised against the asset, however still no job cost record. Submit for future budget consideration.
CFM Budget 1-2 Years
Monitoring and Review ProceduresMuch of the source data for this asset management plan is reviewed monthly and annually. For review therefore, the requirement is to identify trends over the longer term and for this purpose a four yearly revision and update is required.
CITY OF MANDURAH – VEHICLE, PLANT AND EQUIPMENT ASSET MANAGEMENT PLAN - Page 38 -

REFERENCESCity of Mandurah “Our Strategic Plan 2009-2012”City of Mandurah “Risk Management Guidelines 2009/2010”City of Mandurah “10-11 Plant Rates.xlsx”City of Mandurah “10-20 Ten Year Plant Replacement Program.xlsx”City of Mandurah “09-10 Financial Expenditure.xlsx”
CITY OF MANDURAH – VEHICLE, PLANT AND EQUIPMENT ASSET MANAGEMENT PLAN - Page 39 -

GLOSSARYAsset condition assessment The process of continuous or periodic inspection, assessment, measurement and interpretation of the resultant data to indicate the condition of a specific asset so as to determine the need for some preventative or remedial action.Asset management The combination of management, financial, economic, engineering and other practices applied to physical assets with the objective of providing the required level of service in the most cost effective manner.Assets Future economic benefits controlled by the entity as a result of past transactions or other past events (AAS27.12). Property, plant and equipment with benefits expected to last more than 12 months.Capital expenditure Expenditure for items costing individually over $1,500, which have benefits that are expected to last for more than 12 months. Capital expenditure includes replacement and new items. Capital funding Funding to pay for capital expenditure.Capital grants Monies received generally tied to the specific projects for which they are granted.Capital investment expenditure See capital expenditure definitionCapital new expenditure Expenditure for a new vehicle, plant or equipment item that provides a new or additional service to the customer that did not exist beforehand. As it increases service potential it may impact revenue and will increase future operating and maintenance expenditure.Capital renewal expenditure Expenditure to replace an existing asset, due to the existing asset exceeding its optimum replacement term.Component An individual part of an asset which contributes to the composition of the whole and can be separated from or attached to an asset or a system.Cost of an asset The amount of cash or cash equivalents paid or the fair value of the consideration given to acquire an asset at the time of its acquisition or fabrication, plus any costs necessary to place the asset into service. Current replacement cost (CRC) The cost the entity would incur to acquire the asset on the reporting date. The cost is measured by reference to the lowest cost at which the gross future economic benefits could be obtained in the normal course of business or the minimum it would cost, to replace the existing asset with a technologically modern equivalent new asset (not a second hand one) with the same economic benefits (gross service potential) allowing for any differences in the quantity and quality of output and in operating costs.Depreciable amount The cost of an asset, or other amount substituted for its cost, less its residual value (AASB 116.6)Depreciation / amortisation The systematic allocation of the depreciable amount (service potential) of an asset over its useful life.Economic life See useful life definition.
Expenditure The spending of money on goods and services. Expenditure includes recurrent and capital.Fair value The amount for which an asset could be exchanged, or a liability settled, between knowledgeable, willing parties, in an arms length transaction.Level of service The defined service quality for a particular service against which service performance may be measured. Service levels usually relate to quality, quantity, reliability, responsiveness, environmental, acceptability and cost.Life Cycle Cost ** The life cycle cost (LCC) is average cost to provide the service over the longest asset life cycle. It comprises annual maintenance, energy, and asset consumption expense, represented by depreciation expense. The Life Cycle Cost does not indicate the funds required to provide the service in a particular year. Life Cycle Expenditure ** The Life Cycle Expenditure (LCE) is the actual or planned annual maintenance, energy, and capital renewal expenditure incurred in providing the service in a particular year. Life Cycle Expenditure may be compared to Life Cycle Expenditure to give an initial indicator of life cycle sustainability.Loans / borrowings Loans result in funds being received which are then repaid over a period of time with interest (an additional cost). Their primary benefit is in ‘spreading the burden’ of capital expenditure over time. Although loans enable works to be completed sooner, they are only ultimately cost effective where the capital works funded (generally renewals) result in operating and maintenance cost savings, which are greater than the cost of the loan (interest and charges).Maintenance includes reactive, planned and cyclic maintenance work activities.Maintenance and renewal gap Difference between estimated budgets and projected expenditures for maintenance and renewal of assets, totalled over a defined time (eg 5, 10 and 15 years).Maintenance and renewal sustainability index Ratio of estimated budget to projected expenditure for maintenance and renewal of assets over a defined time (eg 5, 10 and 15 years).Maintenance expenditure Recurrent expenditure, which is periodically or regularly required as part of the anticipated schedule of works required to ensure that the asset achieves its useful life and provides the required level of service. It is expenditure, which was anticipated in determining the asset’s useful life.Materiality An item is material is its omission or misstatement could influence the economic decisions of users taken on the basis of the financial report. Materiality depends on the size and nature of the omission or misstatement judged in the surrounding circumstances.Operating expenditure Recurrent expenditure, which is continuously required excluding maintenance and depreciation, eg power, fuel, staff, plant equipment, on-costs and overheads.
CITY OF MANDURAH – VEHICLE, PLANT AND EQUIPMENT ASSET MANAGEMENT PLAN - Page 40 -

Planned Maintenance** is repair work that is identified and planned at least 24 hours in advance of the work. Planning includes ensuring the parts are available, the customer is notified and able to provide the item, and staff are available to conduct the work.Rate of annual asset renewal* A measure of the rate at which assets are being renewed per annum expressed as a percentage of depreciable amount (capital renewal expenditure/DA).Rate of annual asset upgrade* A measure of the rate at which assets are being upgraded and expanded per annum expressed as a percentage of depreciable amount (capital upgrade/expansion expenditure/DA).Reactive maintenance Unplanned repair work.Recurrent expenditure Relatively small (immaterial) expenditure or that which has benefits expected to last less than 12 months. Recurrent expenditure includes operating and maintenance expenditure.Recurrent funding Funding to pay for recurrent expenditure.Remaining life The time remaining until an asset ceases to provide the required service level or economic usefulness. Age plus remaining life is economic life.Renewal See capital renewal expenditure definition above.Residual value The net amount which an entity expects to obtain for an asset at the end of its useful life after deducting the expected costs of disposal.Risk management The application of a formal process to the range of possible values relating to key factors associated with a risk in order to determine the resultant ranges of outcomes and their probability of occurrence.Service potential The capacity to provide goods and services in accordance with the entity's objectives, whether those objectives are the generation of net cash inflows or the provision of goods and services of a particular volume and quantity to the beneficiaries thereof. Strategic Management Plan (SA)** Documents the organisation’s objectives for a specified period (3-5 yrs), the principle activities to achieve the objectives, the means by which that will be carried out, estimated income and expenditure, measures to assess performance and how rating policy relates to the organisation’s objectives and activities.Sub-component Smaller individual parts that make up a component part.Useful life Either:(a) the period over which an asset is expected to be
available for use by an entity, or(b) the number of production or similar units expected
to be obtained from the asset by the entity.It is estimated or expected time between placing the asset into service and removing it from service, or the estimated period of time over which the future economic benefits embodied in a depreciable asset, are expected to be consumed by the council. It is the same as the economic life.Value in Use The present value of estimated future cash flows expected to arise from the continuing use of an asset and from its disposal at the end of its
useful life. It is deemed to be depreciated replacement cost (DRC) for those assets whose future economic benefits are not primarily dependent on the asset's ability to generate new cash flows, where if deprived of the asset its future economic benefits would be replaced.
Source: DVC 2006, GlossaryNote: Items shown * modified to use DA instead of CRC Additional glossary items shown **
CITY OF MANDURAH – VEHICLE, PLANT AND EQUIPMENT ASSET MANAGEMENT PLAN - Page 41 -