fletcher building 2013 annual report
TRANSCRIPT

3
Fletcher Building 2013 Annual Report

You can obtain an electronic copy of the Annual Report by going to the following website address: fbu.com/investor-centre/reports.
The Annual Shareholders’ Meeting of Fletcher Building Limited will be held in the Level 4 Lounge, South Stand, Eden Park, Reimers Avenue, Auckland, at 10.30am on Wednesday, 16 October 2013.
This report is dated 4 September 2013 and is signed on behalf of the board of Fletcher Building Limited.
Ralph Waters Chairman of Directors
Snapshot 1
Chairman’s review 2
Chief Executive’s review 4
Board of Directors 6
Management team 8
Divisional overview 10
Divisions
Infrastructure Products 12
Building Products 14
Laminates & Panels 16
Distribution 18
Construction 20
FBUnite 22
Canterbury update 24
People 26
Health & Safety 28
Environment & Sustainability 29
Corporate governance 30
Remuneration report 32
Financial review 36
Financial statements 38
Independent auditor’s report 77
Trend statement 78
Regulatory disclosures 79
Investor information 88
Directory 89Mark AdamsonManaging Director

OPERATING EARNINGs for the 2013 financial year.
$569million
$326NET EARNINGs for the financial year to 30 June 2013, 76% higher than for the prior year. million
PER sHARE DIVIDEND for the 2013 financial year.
34c
SNAPSHOT

This past year Fletcher Building has once again encountered mixed economic conditions. In contrast to the past four years, this year we experienced a strong improvement in market conditions in New Zealand, and a marked deterioration in activity levels in Australia. Also diverging from recent trends was the US market which had solid growth in volumes compared with China, previously a strong growth market but which slowed in the past year.
CHAIRMAN’S REVIEW
BUILDINGON SUCCESS
Uncertain economic conditions have thus continued to set the background for the performance of the company. In this context, it is pleasing to report that we have delivered operating earnings within the guidance range provided to the market last year and that this has been achieved at the same time as a number of restructuring initiatives have been undertaken. Importantly, while underlying growth in earnings over last year was modest, operating cashflows were up strongly reflecting the renewed focus during the year on lifting cash returns.
Repositioning for the future
Following his appointment as chief executive officer last year, Mark Adamson has undertaken a thorough review of Fletcher Building’s strategy and operating model. As detailed later in this report, Mark and the executive team have identified a number of opportunities where, by making
changes to the decentralised operating model, further efficiency gains and operational improvements can be effected. These initiatives have been grouped together under the project name FBUnite.
A key priority of FBUnite is to ensure that our businesses remain competitive in the face of strong domestic currencies and increased competition from local manufacturers and imports. The board is in full support of the FBUnite programme and believe that its successful implementation will provide a very strong foundation for the next chapter in Fletcher Building’s future.
Operating performance
Net earnings for the year to 30 June 2013 were $326 million, compared with $185 million in the 2012 financial year. As the prior year’s result included significant items totalling $132 million after tax, prior year net earnings before significant items were $317 million. Net earnings before significant items were 3 percent higher than for the prior year.
Operating earnings (earnings before interest and tax) were $569 million compared with $403 million achieved in the prior year, and prior year operating earnings before significant items of $556 million.
Total group revenues of $8,517 million were down 4 percent mainly due to the sale of several businesses during the year.
New Zealand operating earnings before significant items increased by 38 percent and this was driven by rising levels of new house building activity, strong momentum with the repairs and rebuilding work in Canterbury, and contributions from several large infrastructure projects. We were able to counter the impacts of the high New Zealand dollar and increased competition through cost reduction and efficiency initiatives that were implemented during the year.
Economic conditions in Australia deteriorated as the year progressed. Residential and
2

commercial markets were weak, and a slowdown in mining and resources investment had a knock-on effect across other parts of the construction industry. Consequently, operating earnings before significant items from the Australian businesses fell by 22 percent.
Operating earnings before significant items from our operations beyond Australasia declined by 11 percent. Improved volumes in North America were offset by worsening conditions in Europe, while Asia was generally flat or slightly down.
A highlight of this year’s result was cashflow from operations, which was 25 percent higher at $559 million. This was driven by stronger cash contributions from the Construction, Building Products and Distribution divisions.
Balance sheet
As a result of the increase in operating cashflow and lower capital expenditure levels, the balance sheet was strengthened during the year. Net debt declined by $283 million and our gearing ratio, the ratio of net debt to net debt plus equity, declined to 33.3 percent from 37.4 percent in the prior year.
shareholder return
It is especially pleasing to report that the total shareholder return for the year to 30 June 2013 was 50.5 percent, driven principally by a resurgent share price. A year ago I noted the negative investor sentiment towards the building materials sector that had resulted in disappointing returns to shareholders. This year’s very strong outcome reflects the sharp change in the view of investors towards our sector, with most building materials and products companies in Australia experiencing similarly strong share price appreciation.
Dividend
The total dividend for the year is 34 cents per share, consistent with what was paid in the prior year. This represents a pay-out
ratio of 71 percent, a level we are comfortable with given this year’s strong operating cashflow and the strength of the balance sheet. We anticipate that in the future the dividend will grow at a slower rate than earnings as we seek to return the dividend pay-out ratio to a level that is sustainable over the long term.
People
This past year has continued to present many challenges for our people. Some have had to grapple with the pressures of rapidly increased demand for products and services, whilst others have faced the difficulty of dealing with declining markets and industry over-capacity. The need to further rationalise operations in a number of our businesses has tested many of our people. On behalf of the board I thank everyone for their commitment and efforts this year.
Directors
As noted in last year’s annual report, Hugh Fletcher and Jonathan Ling retired from the board at the end of September 2012. The retirement of Hugh Fletcher was part of the board’s programme of regular rotation of directors with most only having a nine year expected term. Typically this has seen one director retiring each year, so refreshing the board over time.
Outlook
As we look ahead, we expect many of the trends that we have experienced over the past year to influence our performance in 2014.
In New Zealand, we are expecting a further increase in construction activity across most sectors. The residential housing market, particularly in Auckland, is expected to be strong in the coming year. The repair of houses and infrastructure in Christchurch will continue to boost activity levels and there is growing interest in commercial building projects within the central business area.
After a long period of weak demand in civil infrastructure and commercial building, a steady
improvement is expected. Recent government announcements for major projects in Auckland and Canterbury are encouraging, and there are good opportunities for building in the health and education sectors as well.
The outlook in Australia remains uncertain. While volumes have generally stabilised at current levels, there has been little improvement evident in residential construction and commercial activity has remained flat with no obvious signs of recovery. The knock-on impact of a slowdown in mining and resources investment is expected to impact overall activity levels.
Trading conditions in North America continue to remain mixed. While there have been improving trends in the residential housing market and positive signs that the market may continue to improve during the year, the commercial market has remained flat.
In South-East Asia, demand has remained firm and the outlook is positive, however, growth and activity levels have slowed in China and Taiwan and the near term outlook in these markets remains uncertain.
European markets show no signs of improvement, and a recovery there is not expected in the short to medium term.
In terms of the earnings outlook for the 2014 financial year, a sustained improvement in activity levels in New Zealand coupled with operational efficiency gains should drive earnings growth. However, no significant volume growth is forecast in the Australian market and any further deterioration from current levels will temper earnings momentum elsewhere across the group.
3

CHIEF EXECUTIVE’S REVIEW
BUILDINGOUR FUTURE
Since starting as chief executive in October last year, the executive team and I have been looking at the Fletcher Building business model and how we might evolve the way we work in the future. Through this process we formed a strong view of the opportunities to foster greater collaboration across the group, combine resources and better leverage our scale, improve our operating efficiency and better target investment towards future growth opportunities.
4
These ideas have evolved into a number of separate but related work streams, which will collectively transform how Fletcher Building operates, under the banner of FBUnite. FBUnite’s goal is to build the foundations for Fletcher Building’s next phase, by fundamentally transforming the way Fletcher Building operates, with the twin aims of creating shareholder value and charting the growth path for the next decade and beyond.
We want to retain the best aspects of our decentralised business model, with businesses working close to their customers and being focused on their product and market segments. At the same time we want to harness the collective strength of the Fletcher Building group to reduce costs and more efficiently deliver supporting and enabling services to our businesses.
A further priority since I started last October has been to undertake, in conjunction with the board and executive team, a broad strategy review. This work has validated
our position as an integrated manufacturer and distributor of infrastructure and building products, as well as a construction company.
This strategy review has led to several new areas of exploration within the FBUnite programme. In particular, we have work streams looking at:
■ how we can harness digital technologies to further drive revenues and make it easier for customers to interact with us;
■ future opportunities in our distribution activities across Australia and New Zealand;
■ other growth opportunities for expansion in adjacent products or industries.
This work is on-going and will feed into the strategic conversations we are having at executive and board level.
simplifying the business
During the year, a number of changes were made to simplify our divisional structure and bring
greater clarity around business clusters.
The long steel and distribution businesses have been brought into the Infrastructure Products division, alongside the concrete, concrete products and quarry businesses. Subsequently, the Iplex Pipelines and Crane Copper Tube businesses that were acquired as part of the acquisition of Crane were also combined with Infrastructure Products, thereby bringing all the pipe business units together in one division and providing a broader suite of products to end customers. The Infrastructure Products division is thus comprised of businesses that manufacture products used typically in the early part of the construction cycle and involve heavy manufacturing processes. In grouping these businesses in this way, we have been able to leverage existing channels to market and better serve our customers with a broader solutions offering.
The other businesses within the Steel division – the coated steel
businesses of Stramit Building Products, Dimond, Pacific Coilcoaters and Gliderol – have been grouped within the Building Products division. Again, there was a clear rationale for this, as the Building Products division is comprised of building materials businesses that are more commonly utilised in the middle and latter parts of the construction cycle.
Both the Infrastructure Products and Building Products divisions have made a number of further organisational changes during the year to combine businesses and reduce complexity.
Management changes
As a result of the changes over the past year, both the Steel and Crane divisions were disestablished as separate divisions, reducing our number of divisions to five from seven.
Following these changes, David Worley decided to leave Fletcher Building. Tim Hickey was appointed

5
Operating earnings of $569 million were within the guidance range provided at the half year, albeit towards the lower end of the range. This was due to the deterioration in trading conditions we experienced in Australia throughout the year.
A particularly noteworthy aspect of this year’s result was the strong uplift in operating cashflow of 25 percent to $559 million. This was driven by a focused effort across our businesses on cash management.
Investing for the future
Consistent with our increased focus on cash management, capital expenditure for the 2013 financial year was $246 million, down from $353 million in the previous year. Looking ahead we expect a modest increase in capital expenditure in the current year between $250 million and $300 million excluding acquisitions. In addition to the continued investment across our businesses, this year we will be prioritising capital expenditure on information technology and supporting infrastructure that will enable various FBUnite projects.
Health and safety
We have continued to further reduce our injury rates over the past year. Our primary injury rate measure is the 12-month rolling average Total Recordable Injury Frequency Rate per million employee and contractor hours (TRIFR), with total injuries being the sum of lost-time and medical treatment injuries. In the year to 30 June 2013 this rate was 6.80, a reduction from 8.48 in the prior year. This figure was more than 60 in 2005. Our lost time injury frequency rate has dropped from 3.27 to 2.82.
Delivering in Canterbury
This past year has been one of considerable progress in our role as project manager for the Canterbury Home Repair Programme. In June we reached an important milestone with the completion of 40,000 full scope home repairs – marking the halfway point in the home repair
programme. We expect repairs to the final Earthquake Commission (EQC) referred property will be completed in December 2014 which is well ahead of the original target set.
With this achievement, our attention is turning to ensuring that we are able to transition our people involved with the home repair programme to larger commercial construction projects and other parts of our business as the residential repair workload decreases. Their skills will be invaluable to the work that remains to be done in Canterbury.
Looking aheadWhile implementing FBUnite is a key priority for us over the next few years, we will continue to work on strengthening and extending our core positions across New Zealand and Australia. We believe there will be good opportunities across our markets for further organic growth through our existing businesses and that we can also drive internal efficiencies and improve our cost competitiveness. At the same time, we will continue to seek opportunities to extend core positions in New Zealand and Australia through infill and adjacent acquisitions, along with opportunities to leverage existing assets and capabilities in selected new markets.
Beyond Australia and New Zealand, we will seek to build and enhance positions in select products and geographies where we believe we have proven capabilities that can be leveraged successfully.
chief executive Distribution Australia in March, having worked previously as a senior executive for Yum Brands in the US and as the CEO of Midas Australia.
In June, John Beveridge announced his resignation as chief executive of the Distribution division. Dean Fradgley has been appointed chief executive of the New Zealand Distribution business to replace John, and will relocate from the UK to take up his role in October 2013. Dean has more than twenty years’ experience in retailing and for the past thirteen years has worked within the trade and hardware sectors.
Earnings overview
Achieving net earnings for the year of $326 million was a solid outcome given the mixed trading conditions we encountered across our operations. This year’s result included a number of costs relating to restructuring and business efficiency initiatives, the benefits of which will be seen in the current financial year and beyond.
Mark AdamsonChief Executive

6
BOARDOF DIRECTORS
Ralph G Waters
CPEng, FIE Aust, M Bus
Independent Non-Executive Chairman of Directors
Chairman of the Nominations Committee
First appointed 10 July 2001
Mr Waters, 64, has extensive management experience in the Australasian building products industry including as managing director of Email, a major Australian industrial company, and until 31 August 2006 as the chief executive officer and managing director of Fletcher Building. He is chairman of Woolworths, Fletcher Building Industries and the ICC Cricket World Cup 2015 and is a director of Asciano. Mr Waters is a Chartered Professional Engineer and a Fellow of the Institution of Engineers Australia.
Mark D Adamson
BA (Hons), ACA, ATII
Non-independent Executive Director
First appointed 1 October 2012
Mr Adamson, 47, is chief executive officer and managing director of the company. He joined the Formica Group in 1998 as chief financial officer of the European division followed by the role of managing director UK and Eire and in 2004 became president of Formica Europe. He became the chief executive of Formica Corporation in 2008 and of the Laminates & Panels division in 2011. Prior to joining Formica he was financial controller of the pharmaceutical company GlaxoSmithKline. Mr Adamson is a member of the English Institute of Chartered Accountants and the Institute of Taxation and a director of Fletcher Building Industries.
Antony J Carter
BE (Hons), ME, MPhil (Loughborough)
Independent Non-Executive Director
Member of the Remuneration and Nominations Committees
First appointed 1 September 2010
Mr Carter, 55, was previously managing director of Foodstuffs (Auckland) and Foodstuffs (New Zealand), New Zealand’s largest retail organisation, and a director of a number of related companies. He has extensive experience in retailing, having joined Foodstuffs in 1994 and from having owned and operated several Mitre 10 hardware stores, and was a director and later chairman of Mitre 10 New Zealand. Mr Carter is chairman of Fisher & Paykel Healthcare, Air New Zealand (with effect from 27 September) and the Blues LLP, a director of ANZ Bank New Zealand and Fletcher Building Industries, co-chair of the NZ Initiative and a trustee of the Maurice Carter Charitable Trust.
Alan T Jackson
BEng (Hons), PhD (Auckland), MBA (IMD Management Institute)
Independent Non-Executive Director
Chairman of the Remuneration Committee and member of the Nominations Committee
First appointed 1 September 2009
Dr Jackson, 60, was until 2009 chairman Australasia, senior vice president and director of The Boston Consulting Group. He has been an international management consultant since 1987 with The Boston Consulting Group and has proven experience at the most senior levels of international and government business. Dr Jackson has worked across a range of industries including resources, diversified industrials, building products and construction sectors including as chairman of Housing Corporation New Zealand. Dr Jackson is a Fellow of the Institution of Professional Engineers. He is a director of Delegat’s Group and Fletcher Building Industries and a trustee of The ICEHOUSE Auckland.

7
John F Judge
BCom, FCA, MPP, FINSTD
Independent Non-Executive Director
Chairman of the Audit and Risk Committee and member of the Nominations Committee
First appointed 9 June 2008
Mr Judge, 60, has considerable experience in Australasian business and brings financial and analytical knowledge to the board. His career includes various roles within Ernst & Young culminating in the position of chief executive of Ernst & Young New Zealand. He is chairman of ANZ Bank New Zealand and the Auckland Art Gallery Foundation, a director of Fletcher Building Industries and a member of the Otago University Business School advisory board.
Kathryn D Spargo
LLB (Hons), BA
Independent Non-Executive Director
Member of the Audit and Risk and Nominations Committees
First appointed 1 March 2012
Ms Spargo, 61, has extensive business experience from advisory roles on strategic and governance issues following a career in legal practice in both the public and private sectors. She has a number of non-executive directorships, including ASX listed companies, UGL and Sonic Healthcare, and of SMEC Holdings and Investec Bank (Australia). She also serves as a director on a number of “not for profit” businesses. Ms Spargo is currently the chair of the Australian Accounting Professional and Ethical Standards Board, is a member of the International Ethics Standards Boards for Accountants and is a Fellow of the Australian Institute of Company Directors.
Cecilia Tarrant
BA, LLB (Hons), LLM (Berkeley)
Independent Non-Executive Director
Member of the Audit and Risk and Nominations Committees
First appointed 10 October 2011
Ms Tarrant, 52, is an executive-in-residence at The University of Auckland Business School after over 20 years’ experience in international banking and finance in the USA and Europe. In that time, she worked as a real estate finance lawyer and as an investment banker with Credit Suisse First Boston and Morgan Stanley, culminating in holding the position of managing director in Morgan Stanley’s Global Capital Markets Group in London. Ms Tarrant is currently a trustee of The University of Auckland Foundation, a director of Fletcher Building Industries and Shopping Centres Australasia Property Group Trustee NZ and deputy chair of the Government Superannuation Fund Authority.
Gene T Tilbrook
BSc, MBA (University of Western Australia)
Independent Non-Executive Director
Member of the Audit and Risk and Nominations Committees
First appointed 1 September 2009
Mr Tilbrook, 62, was finance director at Wesfarmers until his retirement in May 2009. He led Wesfarmers’ business development group, becoming executive director, business development in 2002 and finance director in 2005. Mr Tilbrook is a director of Fletcher Building Industries, Orica, Aurizon Holdings and the GPT Group. He is a councillor of Curtin University of Technology and of the Australian Institute of Company Directors (WA).

8
MANAGEMENTTEAM
Mark MalpassChief Executive Infrastructure Products
Tim HickeyChief Executive Distribution Australia
Gerry BollmanChief Executive Business Strategy and Performance
Mark AdamsonChief Executive Officer and Managing Director
Kate DalyGroup General Manager Human Resources
Martin FarrellCompany Secretary and General Counsel
Tim RichardsChief Executive Building Products
Nick OlsonChief Financial Officer
Paul ZuckermanChief Executive Laminates & Panels
Graham DarlowChief Executive Construction

9
Mark Adamson Chief Executive Officer and Managing Director
Mark Adamson is the chief executive officer and managing director of Fletcher Building. Prior to taking up his current role in October 2012, Mark held a number of positions with the Formica Group. He joined the Formica Group in 1998 as chief financial officer of the European division. Following that role he was appointed managing director UK and Eire, in 2004 was appointed president of Formica Europe and then chief executive of Formica Corporation in 2008. Prior to joining Formica Corporation he was financial controller of the pharmaceutical company GlaxoSmithKline. Mark holds a Bachelor of Arts degree in Business Finance from Northumbria University UK. He is a member of the English Institute of Chartered Accountants and the Institute of Taxation.
Gerry Bollman Chief Executive – Business Strategy and Performance
Gerry Bollman joined the senior management team at Formica Group in 2008, based in the United States of America but working extensively across Europe, Asia and India. Prior to moving to New Zealand in October 2012 to commence his current role, Gerry was most recently Formica Group’s vice president – strategy & business development. In that role Gerry spent considerable time working with Formica Asia on their China growth and expansion; with Formica Europe on the acquisition in India; and with the Laminex Australia and New Zealand teams on their transformation programmes. Before joining Formica he spent 7 years with the global management consultancy Booz Allen Hamilton. Gerry holds an MBA from The University of Michigan and a Bachelor of Science degree (Finance) from Xavier University in Cincinnati.
Kate Daly Group General Manager – Human Resources
Kate Daly joined Fletcher Building as the group general manager of human resources in June 2011.
Prior to this she was general manager corporate affairs, people & performance at Coca-Cola Amatil (NZ). Ms Daly has also worked for Deutsche Bank, Merrill Lynch, ABN AMRO and Greenwich Healthcare Trust in London. Kate holds a Bachelor of Commerce degree (majoring in Economics and International Business) and a Bachelor of Science degree (majoring in Pharmacology) from The University of Auckland.
Graham Darlow Chief Executive – Construction
Graham Darlow has held the role of chief executive, construction since November 2011. He joined Fletcher Building in 1988, after starting his career as a professional engineer in Australia and the United Kingdom. He progressed through Fletcher Construction’s engineering division to become general manager in 2001. After holding senior positions on many of New Zealand’s largest construction projects, he now plays a significant role in the rebuild of Christchurch. Graham is a fellow and past president of the Institution of Professional Engineers New Zealand and a fellow of the Institute of Civil Engineers (UK). Graham holds a Bachelor of Engineering (Civil) from Auckland University and attended the Advanced Management Programme at Mt Eliza Business School.
Martin Farrell Company Secretary and General Counsel
Martin Farrell joined Fletcher Challenge Limited in 1980 where he headed the tax function across the Fletcher Challenge group. In early 2000 he also became company secretary. His responsibilities have been with the board, governance, legal and taxation matters. Prior to joining Fletcher Challenge he worked for KPMG. Martin has Bachelor of Commerce and Bachelor of Laws degrees from the University of Otago. He is a chartered accountant and a member of the New Zealand Institute of Chartered Accountants.
Tim Hickey Chief Executive – Distribution Australia
Tim Hickey was appointed chief executive, Distribution Australia, in July 2013. Prior to this permanent appointment he was interim executive general manager of Tradelink between April 2013 and July 2013. Tim was most recently chief executive of Midas Australia, a business which was transformed from a position of voluntary administration into a profitable franchise operation under Tim’s leadership. He has previously worked as a senior executive for PepsiCo restaurants and Yum Brands in the US, holding various roles in marketing and operations. Tim has a Bachelor of Economics from Macquarie University and has completed courses in marketing management from the University of NSW and strategic management from the Macquarie Graduate School of Management.
Mark Malpass Chief Executive – Infrastructure Products
Mark was appointed chief executive, infrastructure products division (formerly concrete) in November 2011. Prior to joining Fletcher Building he had a 19 year career with ExxonMobil Corporation. He has had senior leadership roles in Australia, United States and most recently Singapore, where he led strategic change across the Asia-Pacific business. Mark has also held the role of country manager and chairman of Mobil Oil New Zealand. He was also a director of the New Zealand Refining Company. Mark holds an MBA from Victoria University of Wellington, Bachelor of Engineering (BE Mechanical, Hons) from the University of Auckland, and New Zealand Certificate in Engineering (NZCE Mechanical) from Auckland Institute of Technology.
Nick Olson Chief Financial Officer
Nick Olson joined Fletcher Building as chief financial officer in April 2013. Prior to this he held the position of chief financial officer, Telecom Corporation of New Zealand Limited, from October 2010 until December
2012. Nick joined Telecom in January 2002, and between 2002 and 2010 held numerous roles with the company, including treasurer, general manager finance and group controller. Prior to this he spent 13 years in the investment banking industry. Nick has extensive capital markets, mergers and acquisitions and corporate finance experience. In 2012 was awarded ‘CFO of the year’ at the annual New Zealand CFO Awards. Nick holds a Bachelor of Engineering (1st Class Hons) from the University of Auckland and is an Associate Chartered Accountant (NZICA).
Tim Richards Chief Executive – Building Products
Tim Richards was appointed chief executive, building products division in October 2011. He has been with Fletcher Building since 2005 when the Amatek Group was acquired and he became general manager of Stramit, a leading Australian manufacturer and distributor of steel building products and systems. Prior to joining Stramit Tim worked for Boral Timber and KPMG. Tim holds a Bachelor of Business (Accountancy) from Charles Sturt University, is a member of the Institute of Chartered Accountants in Australia, and in 2010 attended the Advanced Management Program at The Wharton School, University of Pennsylvania.
Paul ZuckermanChief Executive – Laminates & Panels
Paul Zuckerman was appointed chief executive, laminates & panels division in October 2012. Prior to this he was chief executive of the steel division, a role he held since May 2007. Prior to joining Fletcher Building he held the position of president, Greater China with BlueScope Steel. He held numerous senior management roles with BlueScope over a 13 year period. Prior to this he spent eight years at PPG Industries, a leading global manufacturer of industrial coating, glass and chemical products. Paul gained his Bachelor of Science degree in Chemistry from Syracuse University and his Master of Business Administration from Ohio State University.

10
The Infrastructure Products division is a manufacturer, distributor and marketer of heavy construction materials, including aggregate, cement, concrete and masonry products, plastic PE and PVC pipe, and long steel products. Its products and services are typically used in the early stages of the construction cycle.
Key businessesCrane Copper Tube
Firth
Fletcher Easysteel
Golden Bay Cement
Humes Pipeline Systems
Iplex Pipelines
Rocla Pipeline Products
Rocla Quarry Products
Winstone Aggregates
Infrastructure ProductsPage 12 25% of total revenue
39% operating earnings
16% of total revenue
21% operating earnings
20% of total revenue
21% operating earnings
25% of total revenue
9% operating earnings
14% of total revenue
15% operating earnings
Building ProductsPage 14
The Building Products division manufactures a broad range of building products for residential and commercial markets. Those products include plasterboard, glasswool insulation and other insulation and acoustic products, metal roof tiles, longrun roofing and other rolled steel products.
Key businessesDecra Roofing Systems
Dimond
Fletcher Aluminium
Fletcher Insulation
Forman Group
Gerard Roofing Systems
Pacific Coilcoaters
Stramit Building Products
Tasman Insulation
Winstone Wallboards
DistributionPage 18
The Distribution division consists of building, plumbing and pipeline distribution businesses in Australia and New Zealand. PlaceMakers and Mico operate in New Zealand, with Tradelink, Hudson Building Supplies, Northern’s Plumbing Supplies and Mico Design operating in Australia.
Key businessesHudson Building Supplies
Mico
PlaceMakers
Tradelink
ConstructionPage 20
The Fletcher Construction Company is the preeminent general contractor in New Zealand and the South Pacific. The company’s five divisions are; Building + Interiors, Developments, South Pacific, Earthquake Recovery (EQR) and Engineering. Fletcher Residential is New Zealand’s leading specialist residential home building group.
Key businesses Building + Interiors
Developments
Earthquake Recovery
Infrastructure
South Pacific
Residential
Laminates & PanelsPage 16
The Laminates & Panels division includes the Laminex and Formica businesses. Formica manufactures and distributes decorative surface laminates in North America, Europe and Asia. Laminex is the leading Australasian manufacturer and distributor of decorative surface laminates, component products, particleboard and medium density fibreboard (MDF).
Key businessesFormica
Laminex
Percentage of operating earnings excludes corporate costs.
DIVISIONAL OVERVIEW

18,830 people
$8,517million Total revenue
Across all divisions
$246millionCapital expenditure

12
Mark Malpassmeets with Golden Bay Cement general manager, Michele Creagh, at Eastport, Auckland.

13
INFRASTRUCTURE PRODUCTS
The Infrastructure Products division is a manufacturer, distributor and marketer of heavy construction materials, including aggregate, cement, concrete and masonry products, plastic PE and PVC pipe, and long steel products. Its products are typically used in the early stages of the construction cycle.Infrastructure Products operating earnings increased by $13 million to $222 million as a result of continued operational improvements, cost reductions and efficiency gains.
Revenues were 9 percent lower primarily due to the sale of the Austral Wright metals business in June 2012. On a like-for-like basis, revenues decreased by 2 percent while market shares were largely stable for all businesses.
Significant divisional restructuring was carried out this year, with businesses being reorganised into logical, larger business units. This has resulted in annualised savings of $6 million and will enable the division to better leverage operational capabilities, functional depth and the benefits of scale.
Operating earnings of the cement, concrete and aggregates businesses increased by 6 percent to $73 million. Cement volumes were up 4 percent, and while slightly lower prices were offset by operational improvements, earnings were impacted by increased distribution costs. Ready-mix concrete volumes were up 19 percent, and prices were generally stable. Aggregates volumes in New Zealand were up 6 percent, while Australian volumes declined 15 percent.
The concrete pipes and products businesses recorded a 10 percent increase in operating earnings to $67 million. Australian pipe volumes were 9 percent lower, but earnings benefitted from further cost efficiencies and improved product premiums. New Zealand concrete pipe volumes increased by 9 percent due to growth in the Auckland and Canterbury markets.
Operating earnings in Iplex Pipelines and Crane Copper Tube were 21 percent lower at $54 million, due to the sale of the Austral Wright and Mico Metals businesses at the start of the year. In Australia volumes declined by 4 percent with weaker mining demand and continued soft
building markets, partially offset by contracts to supply coal seam gas projects. Product substitution continued to have a significant impact on Crane Copper Tube. Impacts of volume declines were partially offset with the implementation of cost-to-serve tools, account management and continued rationalisation of the businesses. New Zealand plastic pipe volumes increased in line with activity levels in Canterbury and Auckland.
Steel operating earnings increased to $28 million from $11 million in the prior year. The long steel business benefitted from improved manufacturing efficiencies which helped to reduce conversion costs. Volumes were 6 percent higher, reflecting the increase in demand in New Zealand. Steel distribution businesses experienced increased earnings with a focus on product mix and reducing customer service costs.
Looking ahead, disciplined cost management will continue across both markets, in conjunction with a comprehensive programme of manufacturing and supply-chain optimisation.
A focus of the division is to continue leveraging its scale to drive utilisation and efficiencies,
with emphasis on innovation and enhancing our overall value proposition. Share growth across the value chain is also a priority, as is building deep functional capability, particularly in sales and operations management.
09
EBIT pre significant items
10
246
11 12 13
146 16
4
209 22
2
Infrastructure Products (NZ $million)
Mark MalpassChief Executive Infrastructure Products
‘ Through reorganising our businesses into logical, larger business units we have enabled the division to better leverage operational capabilities, functional depth and the benefits of scale.’

14
BUILDING PRODUCTS
Building Products manufactures a broad range of building products for the residential and commercial markets. Products manufactured by Building Products businesses include: plasterboard, glasswool insulation and other insulation and acoustic products, metal roof tiles, roofing and other rolled steel products.Building Products operating earnings before significant items of $122 million were 12 percent higher than the prior year. Revenues declined by 3 percent but the benefit of cost reduction initiatives undertaken in the first half of the year positively impacted earnings.
The plasterboard business recorded a 43 percent increase in operating earnings in a stronger New Zealand residential construction market.
The insulation business’ operating earnings were down 36 percent on the prior year. Australian glasswool margins continue to be soft due to the strong Australian dollar and continued excess inventory across the industry. Restructuring undertaken in Australia during the
first half of the year helped to drive earnings higher in the second half. New Zealand glasswool volumes were flat on the prior year reflecting increased levels of competition and a warmer autumn.
Operating earnings for the sinkware business declined by 37 percent due to declining volumes and margins. Operating earnings for the New Zealand aluminium business doubled driven by increased market share and volumes. The opening of a new aluminium powder coating and assembly facility in Christchurch in July 2012 significantly improved our capability in the region.
In late 2012 the coated steel businesses were transferred to the Building Products division. In grouping our coated steel businesses with other materials commonly utilised in the middle and latter parts of the construction cycle we can better leverage our channels to market and provide improved end-to-end solutions.
Operating earnings for the coated steel businesses were up 7 percent to $52 million due to strong performances from the New Zealand based businesses. Roof tile volumes increased by 10 percent driven by strong increases in Europe, Africa and
New Zealand, and operating earnings increased by 31 percent.
In Australia, volumes in the Stramit roll-forming business were down on the prior year but an improving trend during the year meant that second half volumes were slightly ahead of the same period in the prior year. Restructuring in Stramit has substantially lowered the fixed operating cost of the business, and operating earnings in that business in the second half of the year were 25 percent higher than for the prior corresponding period.
Under Stramit we now operate three engineered solutions businesses, all involved primarily in the manufacture and supply of small buildings and garages. This presence provides a valuable channel to market for our roll-formed steel product and brings us closer to the end customer.
A key divisional priority for 2014 is to continue the business efficiency and cost reduction initiatives particularly in Australia where volumes and margins remain soft and the economic outlook is uncertain. Enhancing cross-business opportunities and efficiency through shared technology solutions is also an area of investment across the division and the group more broadly.
Building Products (NZ $million)
09 10
156
11 12 13
157 16
9
109 12
2EBIT pre significant items
Tim RichardsChief Executive Building Products
‘ A key priority is to continue the business efficiency initiatives particularly in Australia where volumes and margins remain soft.’

15
Tim Richards (right) meets Pacific Coilcoaters general manager at Mt Wellington, Auckland.

16
LAMINATES & PANELS
The Laminates & Panels division includes Laminex and Formica. Formica manufactures and distributes high-pressure decorative surface laminates in North America, Europe and Asia. Laminex operates in Australia and New Zealand and is the leading Australasian manufacturer and distributor of decorative surface laminates, component products, particleboard and medium density fibreboard (MDF).Operating earnings in Laminates & Panels were $120 million compared with $65 million in the prior year. The prior year’s result included significant items totalling $74 million. Excluding significant items, operating earnings were 13 percent lower than the prior year. Revenues declined by 6 percent to $1,738 million.
Prices and margins were generally flat or slightly down as a result of strong price competition in markets where volumes were under pressure. The continued promotion and extension of premium products, particularly in North America, helped mitigate
price pressure. Input prices in key materials such as paper and resins were either flat or down on the prior year.
FoRMICAFormica’s operating earnings before significant items were $58 million, down from $71 million in the prior year. Volumes and revenue in markets in Europe were down by 5 percent. Markets in Spain, Central Europe and the United Kingdom continued to deteriorate while Scandinavia remained stable. However, further increases were recorded in the growth markets of Russia and the Middle East. Further costs were incurred in the closure of Formica’s plant in Bilbao, Spain, which was completed during the year.
Revenue in Asia was down by 2 percent with volumes down in China and Taiwan by 2 percent and 3 percent respectively, while Thailand remaining stable. During the year Formica acquired a small manufacturing site in India, which will provide direct access to the fastest growing high pressure laminate market.
In North America revenue was up by 1 percent while volumes were up marginally over the prior year. Continued improvement in the residential sector was largely offset
by the commercial market in which Formica has greater exposure, with no improvement evident over the prior year.
LAMINEXLaminex’s operating earnings before significant items were $62 million compared with $68 million in the prior year. Australian revenue was down 9 percent with increased new residential commencements off-set by decline in the housing renovation and commercial sectors. Sales volumes were maintained but there was significant pressure on product pricing and margins.
New Zealand revenues were down by 10 percent due to the exit of some product ranges and the sale of the bench fabrication business. Underlying revenue was up slightly on the previous year. In both Australia and New Zealand we completed a number of cost reduction and business restructure initiatives, aimed at reducing cost and re-sizing operations in line with market demand.
Enhanced digital and Enterprise Resource Planning (ERP) systems capabilities are a priority for the coming year, along with operational and service
improvements, and product development and innovation.
In October Formica will open its purpose-built manufacturing facility in Jiujiang, China, which will significantly increase capacity across Formica’s Asia operations.
Paul ZuckermanChief Executive Laminates & Panels
‘The continued promotion and extension of premium products helped mitigate price pressure.’
Laminates & Panels (NZ $million)
09 10
74
11 12 13
141 16
8
139
120
EBIT pre significant items

17
Paul Zuckerman (left) meets with local staff at the Formica Showroom in Melbourne.

18
Tim Hickey (right) is shown around the Mico showroom in Mt Wellington, Auckland, by branch staff.

19
DISTRIBUTION
Distribution (NZ $million)
09 10
30
11 12 13
38
55
65
50
EBIT pre significant items
Tim HickeyChief Executive Distribution Australia
‘Our focus is on lifting our customer offering through better product availability and improved speed of service.‘
of digital platforms to improve the customer experience, a focus which extends across Fletcher Building.
Cost-out initiatives will continue in Australia in the coming year with trading conditions expected to remain flat. The benefit of improvement initiatives and expected positive uplift in economic conditions should deliver earnings improvements.
NEW ZEALAND
PlaceMakers is the premier supplier of building materials to New Zealand’s residential and commercial construction markets. Mico Plumbing specialises in the distribution of plumbing, pipeline and bathroom products.
AUSTRALIA
Tradelink Plumbing Centres, a network of 211 branches supplying plumbing supplies to residential and commercial markets, is our largest distribution business in Australia. Northern’s Plumbing Supplies and Mico Design also operate in the plumbing, bathroom and associated industries. Hudson Building Supplies business specialises in the supply of building hardware and products.
PlaceMakers Revenues rose 9 percent with market conditions showing improvement from the second quarter onwards. Operating earnings increased by 33 percent
over the prior year to $36 million, with the increase in revenues more than offsetting the margin decline of almost 1 percent. Earnings were positively impacted by operational improvements, such as procurement benefits and reduction in facility and employee costs. In addition, inventory and working capital ratios improved on the prior year.
In June, PlaceMakers opened a new purpose-built branch in the Christchurch suburb of Hornby. Following the resignation of John Beveridge after four years leading the business, Dean Fradgley was appointed chief executive Distribution New Zealand and he will have responsibility across all our New Zealand distribution businesses.
Tradelink, Hudson Building supplies, Mico PlumbingOperating earnings for these distribution businesses were $14 million compared with $37 million in the prior year.
Australian revenues declined 11 percent due to difficult trading conditions. Hudson delivered earnings benefits from an improved cost position as some Queensland locations were rationalised during 2013 whilst retaining revenue
across its markets in NSW and Queensland. Tradelink revenues fell sharply in the second and third quarters of 2013, particularly in Western Australia and South Australia. In the final quarter of 2013 revenues began to improve as branch improvement programmes targeting improved service levels to customers were implemented and economic conditions stabilised.
New Zealand revenues were down 18 percent due to the sale of the Corys Electrical business with effect from December 2012. On a like-for-like basis, revenues increased by 3 percent over the prior year driven by improved economic activity and market share gains in the plumbing segment. Operating earnings included $4 million profit from the sale of surplus property in Christchurch.
A key appointment this year was that of Tim Hickey to the position of chief executive, Distribution Australia. Tim was appointed in an interim role leading Tradelink and Hudson Building Supplies in March, with his permanent appointment announced in July 2013.
Looking ahead, a key strategic focus for PlaceMakers is enhancing and greatly broadening its use

20
CONSTRUCTION
The Fletcher Construction Company is the preeminent general contractor in New Zealand and the South Pacific. The division is grouped around a building and interiors business, engineering infrastructure, South Pacific construction and earthquake recovery (Fletcher EQR). Fletcher Residential is one of New Zealand’s leading home building groups, offering a range of homes and developments.The Construction division’s operating earnings for the year were $87 million, up 74 percent on the prior year. This was due to a significant upturn in house sales and increased activity in Christchurch, particularly with the Canterbury Home Repair Programme and the infrastructure rebuild.
In June the Canterbury Home Repair Programme reached the halfway point in respect of full-scope house repairs, with 40,000 homes completed. A further 47,000 emergency repairs and 18,000 installations under the winter heating initiative have also been completed. It is anticipated
the final Earthquake Commission (EQC) referred property will be completed in December 2014, well ahead of the original target set.
Fletcher EQR has proven a valuable talent incubator within our business, with considerable engineering and other technical expertise built up over time. Ensuring we retain these skills across the business when residential repair work decreases is a key priority.
The repair of houses and infrastructure in Christchurch is expected to continue for some time and there is growing interest in commercial building projects within the CBD.
All other business units performed in line with expectations.
The Construction backlog was $1,022 million at the end of June compared with $1,094 million at the end of June 2012. However, Fletcher Construction is the preferred bidder on the MacKays to Peka Peka roading project north of Wellington ($570 million) and the Wynyard land development proposal is preferred for Fonterra‘s new Head Office in Auckland ($70 million). The contract for the Aquatic Centre for the South
Pacific Games in Papua New Guinea ($61 million) was confirmed after balance date.
Major contracts awarded during the year include the University of Auckland Science Block upgrade for $138 million, the Rangiriri Bypass Project for $75 million and a further $99 million share of the Stronger Christchurch Infrastructure Rebuild Team (SCIRT) work.
A number of major projects are progressing well including the Waterview Tunnel Alliance. Assembly of the tunnel boring machine has started and tunnelling is due to commence in November. Construction of the Men’s Prison at Wiri is also progressing well and the new headquarters for ASB Bank was completed on time and to budget.
After a long period of weak demand in civil infrastructure and commercial building, a steady improvement is expected. The recent Government announcements for major projects in Auckland and Canterbury are encouraging, and there are opportunities for building in the health and education sectors as well.
Fletcher Residential performed very well with strong sales from the Stonefields development in
Auckland. Large land holdings have also been secured in the Auckland region for future building activity. There is now a strategy to extend housing operations beyond the current model to include multi-storey and affordable homes in Auckland and elsewhere.
Construction (NZ $million)
09 10
59
11 12 13
57 60
50
87
EBIT pre significant items
Graham DarlowChief Executive Construction
‘ After a long period of weak demand in civil infrastructure and commercial building, we’re expecting a steady improvement.’

21
Graham Darlow discusses the recent ASB headquarters construction in Auckland with ASB CEO Barbara Chapman.

22
‘FBUnite will transform how Fletcher Building operates whilst retaining the decentralised business model that keeps businesses focused on their customers.’
FBUNITE
The FBUnite business transformation programme seeks to drive benefits across Fletcher Building from greater collaboration, combining resources and leveraging the group’s scale, improving operating efficiency, and investing in the capabilities for growth. FBUnite is comprised of a number of work streams that will collectively transform how Fletcher Building operates whilst at the same time retaining those aspects of the decentralised business model that keep businesses focused on their customers, products and core market segments.
It is expected that annual total benefits from FBUnite will be in the range of $75 million to $100 million per annum. FBUnite is, however, a multi-year programme, with individual work streams set to be completed within different timeframes such that this quantum of benefit will take several years to be fully realised. Capital and operating expenditure will be incurred in the 2014 financial year to enable a number of work streams to be implemented which will offset
early gains, although benefits should become evident from the 2015 financial year onwards.
A number of work streams have commenced within the business transformation programme including the following:
shared services
The shared services project aims to reduce the cost of core support functions through centralising transactional tasks and increasing productivity by leveraging the group’s scale. The project is targeting finance (accounts receivable, accounts payable, credit management), human resources (payroll, recruitment, learning and development, health and safety) and ICT (user support, IT maintenance, IT infrastructure).
Procurement
The procurement project is focussed on achieving greater procurement co-ordination and cost savings from the $800 million per annum of indirect third party expenditure across the group. A specialist procurement function has been established leveraging the group’s size, experience and leading practice. Reductions in the cost to suppliers of serving the group, fostering greater
collaboration and innovation in procurement, are other core goals. The first categories targeted have included transport and logistics, office supplies, mobile plant, printing, plant consumables, packaging, health and safety, waste management, temporary labour and fuel.
Property
The group’s total property costs across New Zealand and Australia are in excess of $200 million per annum from around 1,000 property interests. A review of the property portfolio is being undertaken, with the goal of reducing the group’s property footprint through network optimisation and business co-location opportunities.
Operations excellence
The operational excellence programme is addressing manufacturing and supply chain aspects of Fletcher Building’s manufacturing and warehouse facilities. The programme will provide the tools needed to achieve operations excellence and is expected to take around 3 years to be fully implemented, in conjunction with other work streams including procurement and property management.
Network optimisationThe network optimisation project will identify, evaluate and implement options to move products from the point of manufacture or supply to the customer at the lowest cost, while meeting service requirements. The options will consider how the network of transport lanes, storage and distribution locations is best configured and used to meet customer demand, and whether changes are required to transport, warehouses, product handling, business processes and information systems.
Gerry BollmanChief Executive Business Strategy and Performance

23
Nick Olson (left) Chief Financial Officer and Gerry Bollman (right) Chief Executive – Business Strategy and Performance at Fletcher Building Head Office.

24

25
In the past year Canterbury has settled to a great degree in respect of seismic activity, allowing repair and rebuild work in the region to progress further and removing some uncertainty and nerves from the minds of residents. Undoubtedly there are still challenges to face before the region returns to a level of normality similar to that prior to the earthquakes. Pleasingly, we made considerable progress in Canterbury over the past 12 months, primarily through Fletcher EQR’s role as project manager for the Canterbury Home Repair Programme (CHRP).
We passed two major milestones in 2013. In January 2013 the amount paid to contractors involved in the programme reached $1 billion. By the end of June that figure had reached $1.3 billion and the programme reached the halfway point in respect of full-scope house repairs – 40,000 homes completed. The completion rate at June was approximately 1,700 homes per month.
It is anticipated the final Earthquake Commission (EQC) referred property will be completed in
December 2014, well ahead of the original targets set.
Work on the programme involves a range of challenges including the recruitment and retention of skilled staff and contractors; meeting technical requirements for foundations, other structural and general building work; and delivering to the valid expectations of various stakeholders, including homeowners.
A key priority going forward is to ensure we facilitate opportunities for Fletcher EQR’s highly-skilled employees to transition from the home repair programme to larger commercial construction projects and other parts of our business as the residential repair workload decreases. Their skills are invaluable considering the work still ahead in Canterbury.
We also continued to invest in our other operations in Canterbury over the past year. Fletcher Aluminium officially opened a $5 million powder coating and assembly facility in Wigram, Christchurch in July 2012, and Firth opened its third ready-mix concrete plant in the region in April this year. In June PlaceMakers opened a brand new 2,745sqm store in the Christchurch suburb of Hornby.
As a large employer in the region, our involvement in the community also continues. We remain a significant sponsor and supporter of the Christchurch Arts Festival, and are a sponsor of the Champion Canterbury Business Awards and its acknowledgement of achievement and innovation in the region.
We are also a foundation sponsor of the recently established University of Canterbury Quake Centre. It is working with the engineering and construction industries on joint-venture earthquake engineering research projects, training initiatives and product development, while building on New Zealand’s established reputation in the field of earthquake engineering. Lessons learnt in Canterbury will undoubtedly have benefit much further afield than Canterbury and New Zealand.
CANTERBURY UPDATE
Homes completed per month, as at June 2013
House repairs completed by the CHRP programme, as at 30 June 2013
1,700
40,000
Amount paid per week to contractors
Fletcher EQR scorecard as at 23 August 2013
$14.5m
staff and contractors inducted
Emergency repairs
Homes completed per day
18,373
47,500
80
26
‘Developing a strong internal pipeline of future leaders is a key priority.’
PEOPLE
We employ a diverse workforce of 18,830 people, based across 40 countries. The main areas of focus with regard to our people strategy is to develop a strong leadership pipeline, the attraction and retention of talent across the group and the creation of a high performance, highly engaged and diverse workforce.
Developing leaders
Developing a strong internal pipeline of future leaders is a key priority. During the year we launched a Leadership Framework across the group to provide a clear structure for learning and development. Branch management has been identified as a focus area to develop a strong pipeline of leadership talent, and Branching Out was the first leadership programme launched under the new framework. Over 160 branch managers have completed the first two modules and this will be a core leadership programme going forward. A senior leadership programme, The Leaders Edge, was developed and launched in partnership
with The University of Auckland Business School. The final two leadership programmes will be delivered in the coming year.
Attracting and retaining talent
Our aspiration is to be an employer of choice in every country in which we operate. Demand for roles across New Zealand and Australia remains high, with the processing of over 26,000 applications over the past year. Our internal sourcing model places emphasis on providing an effective and efficient service to the business and 1,100 roles across New Zealand and Australia have been placed during the year.
The Employee Educational Fund continues to be a strong retention tool for New Zealand, Australia and the South Pacific. The fund provided over $4 million of funding in the 2013 financial year. This funding was used for workplace learning, leadership development, grants for tertiary study for employees, supporting dependants of employees to retrain and re-enter the workforce, and to provide financial support for employees’ children to study in tertiary institutions.
Rebuilding Christchurch
The Fletcher Construction Earthquake Recovery (EQR) team
continues to play a significant role in the Christchurch rebuild. During the year the team grew in size from 540 to 700 direct employees. With the final referred claim now expected to be completed by the end of December 2014, a priority in the coming year is to determine how the skills and expertise of the EQR team can be best utilised beyond that time. Given the labour shortages in Christchurch, we are working together with the Ministry for Social Development to ensure opportunities to create a skills legacy are provided for Christchurch.
Diversity
Building a diverse and inclusive workforce is a key focus area across the group. In the past year we have provided employment opportunities for 54 people through alliances with Te Puni Kokiri, Limited Services Volunteer, Work and Income and the Department of Corrections. As the principal sponsor of the First Foundation we funded 6 scholarships for high achievers from low decile schools in the past year.
During the year the Remuneration Committee approved a diversity policy that will drive greater
participation across the Fletcher Building group with the specific focus of creating a more diverse and inclusive workplace. Directors were pleased to see that over the past twelve months the number of female senior leaders increased from 14 percent to 16 percent. There will be a continued focus to ensure that this trend continues. The board composition remains unchanged from 2012; there are eight directors, with 25 percent being women.
We are also into our fourth year of participation with the Global Women programme and continue to have board representation on the Equal Employment Opportunities Trust.
Kate DalyGroup General Manager Human Resources

27
Kate Daly (left) developing work with senior Fletcher Building teams, Auckland.

28
The correlation between improved health and safety, engagement and productivity in the workplace makes health and safety a key strategic priority. In the past year we have paid particular attention to the reports of the Pike River Royal Commission and the Independent Task Force Review of Health and Safety in New Zealand. Broadly we believe that improved safety performance can be driven by business organisations setting clear goals for continual improvement, reinforced by regulatory requirements that ensure safety performance is addressed with due diligence.
Additionally, we support improved alignment of health and safety legislation across New Zealand and Australia, as is soon to be implemented. This will enable increased consistency and coordination of health and safety management across Fletcher Building; one of the objectives of our FBUnite business transformation programme. FBUnite has been a catalyst for integrating health and safety and daily operational management, ensuring safety is a key consideration in every operational decision made.
HEALTH & SAFETY
Pleasingly, over the past year we further reduced our injury rates. Our primary injury rate measure is the 12-month rolling average Total Recordable Injury Frequency Rate per million employee and contractor hours (TRIFR), with total injuries being the sum of lost-time and medical treatment injuries. In the year to 30 June 2013 this rate was 6.80, a reduction from 8.48 in the prior year. This figure was more than 60 in 2005. Our lost time injury frequency rate has dropped from 3.27 to 2.82.
Despite our progress, serious injuries still occur. During the past year, 15 employees and contractors suffered serious injuries, including 10 severe lacerations and five fractures. Each of these incidents has been investigated and measures to mitigate the associated risks have been implemented.
To reduce significant operational risks and hazards that could result in serious injuries or fatalities, we have engaged external process-safety audits of our most high-risk sites. Our four most high-risk facilities have now been audited and improvements across those locations are being implemented. Our first priority has been to mitigate the risk of fires and
6.80
2012
2013
Injury rates
Based on the 12-month rolling average TRIFR.
Lost time injury frequency
Our rate has dropped 13.8% from 3.27 to 2.82.
13.8%
explosions in our high-temperature manufacturing facilities. We are developing further standardised controls for significant hazards across the group, driven by business unit input.
Additionally, each of our business units has developed long-term plans for prioritising and addressing general workplace health issues. Workplace health has a considerable impact on business productivity, culture and engagement. To ensure our on-site managers are competent in respect of health and safety, an enhanced group-wide training programme has been developed and implemented by the FB Learning Academy. Areas of focus include safety leadership development and ensuring a strong understanding of emerging regulatory requirements.
For the sixth year, our Health, Safety and Sustainability Awards were held in recognition of achievements around the company. Submissions were received from business units across the world. The business unit award for safety excellence went to Fletcher Aluminium, for demonstrating a high level of safety commitment, with evidence of successful programmes to reduce injuries and to improve overall workplace health.
8.48

29
ENVIRONMENT & SUSTAINABILITY
In addition to reducing the environmental impacts resulting from the manufacture and distribution of building materials, we seek to play a broader role in leading our industries towards improved sustainable performance. From the extraction of raw materials to the eventual end-of-life of products and projects, our environmental efforts span across the entire value-chain. As a largely manufacturing-based business, a key focus remains the reduction of carbon emissions. Pleasingly, we achieved our goal of reducing group CO2 emissions intensity by 5 percent between 2007 and the end of 2012. Total CO2 emissions and energy use were reduced by 11 percent, although these numbers are largely attributable to a decrease in overall production.
Our energy and CO2 inventory is updated every six months, and provisional figures for the 2013 financial year show total CO2 emissions of 1,287,961 tonnes – an increase of 6,938 on the prior corresponding period. This includes the CO2 emitted
during the generation of electricity used by Fletcher Building. Emissions from our New Zealand operations totalled 711,397 tonnes, while Australian operations emitted 419,190 tonnes and international 157,374 tonnes.
Our goal now is to further reduce our CO2 emissions by 10 percent between 2012 and 2020. Achieving this will be driven by further process and efficiency improvements, increasing our use of alternative energy sources and being smarter about the way we store and distribute our products.
We have partnered with the New Zealand Energy Efficiency and Conservation Authority (EECA) to identify and implement energy reduction initiatives across our New Zealand operations. In Australia, we have a programme of energy efficiency assessments that is reported to the Federal Government, as part of our requirements under the Energy Efficiency Opportunities programme. Through our group-wide programme of operational excellence we are pursuing further efficiency improvements.
The implementation of dedicated software to capture and report on energy use, CO2 emissions and other sustainability factors will also
help facilitate improvement across the business.
Our environmental strategy has been influenced by the additional costs associated with the emissions trading schemes in New Zealand and Australia, and the fact that reduced carbon emissions will have a broader positive impact on society.
Sustainability and climate change in particular have a major influence on research, innovation and product development across Fletcher Building. A number of our businesses are developing new products and solutions to further meet emerging customer preferences in areas of environmental sustainability. Examples include Firth Industries’ seismic foundation solution, window glazing systems with a thermal break to reduce heat loss through the aluminium frames and insulated concrete floors and masonry products. Many of these products are also being developed to align with external building rating criteria and to gain certification in recognition of their environmental attributes.
To ensure overall transparency we continue to participate in the Carbon Disclosure Project (CDP), which requires us to report how we
manage the risks and opportunities of climate change, and provide a complete inventory of our annual energy use and CO2 emissions. In February we were the only New Zealand manufacturer named in the 2012 NZX50 Carbon Disclosure Project Leadership Index. To be included in the leadership index a company must be in the top 10 percent of respondents in respect of the quality and completeness of their disclosures, and have a measured understanding of climate change issues, risks and opportunities facing it.
In November 2012 we published our second sustainability report (fbu.com/sustainability/). This will be updated again later this year.
Reduced emissions
Our total CO2 emissions and energy use were reduced by 11%.
11.0%
Ngaruawahia bypass bridge, New Zealand.

30
CORPORATE GOVERNANCE
Fletcher Building is a New Zealand based building materials manufacturer whose securities are listed on the New Zealand and Australian stock exchanges.These exchanges require formal adoption of approved corporate governance practices by listed company boards of directors. Accordingly, the board of Fletcher Building confirms that it is committed to the highest standards of behaviour and accountability, and has adopted policies and procedures that reflect this commitment.
The company has adopted the principles recognised by the ASX Corporate Governance Council as an appropriate way to organise its corporate governance policies and reporting. In establishing its corporate governance procedures, the company reviews the practices and trends in corporate governance in other jurisdictions, and has incorporated these where appropriate.
The company believes that the practices it has adopted ensure that it meets the requirements of NZX’s Corporate Governance Best Practice Code and the Financial Markets Authority’s Corporate Governance in New Zealand Principles.
Fletcher Building’s corporate governance practices, including matters reserved for the board and those delegated to senior executives, are fully detailed on its website and shareholders seeking an in-depth review are encouraged to access information from this source.
This section on corporate governance contains commentary on seven of the eight principles recognised by the ASX Corporate Governance Council. The Remuneration Report addresses the final principle being the requirement to remunerate fairly and responsibly.
A fuller discussion on corporate governance is included on the company’s website at fbu.com/investor/governance.
1. Ensuring solid foundations for management and oversight
The company’s procedures are designed to: ■ Enable the board to provide strategic
guidance for the company and effective oversight of management.
■ Clarify the respective roles and responsibilities of board members and senior executives in order to facilitate board and management accountability to both the company and its shareholders.
■ Ensure a balance of authority so that no single individual has unfettered powers.
The board has an obligation to protect and enhance the value of the company’s assets, and to act in its interests. It exercises this obligation through the approval of appropriate corporate strategies and processes, with particular regard to portfolio composition and
return expectations. These include approval of transactions relating to acquisitions, divestments and capital expenditures above delegated authority limits, financial and dividend policy and the review of performance against strategic objectives.
As part of its review of the strategic direction of the company, a strategy session is held with senior management each year. Senior management are expected to address strategic issues in the business as part of their board review sessions. Special strategic reviews are also held of each business unit on a rolling two year cycle or where material change is evident or contemplated.
The company achieves board and management accountability through written terms of reference for the chairman, directors and management, and a formal delegation of authority to the chief executive. The effect of this framework is that whilst the board has statutory responsibility for the activities of the company, this is exercised through delegation to the chief executive, who is charged with the day-to-day leadership and management of the company. As part of its annual review of its governance processes, the board reviews the delegations to the chief executive each year.
The terms of reference for directors and the chairman, the charters for board committees and the delegation to the chief executive officer all provide for reviews of the performance of directors and senior management. The nominations committee assesses the composition and effectiveness of the board and its committees annually. The chair of the nominations committee undertakes one-on-one reviews annually with all directors on the effectiveness of the board.
The board evaluates annually the performance of the chief executive and the chief executive’s direct reports. The evaluation is based on criteria that include the performance of the business and the accomplishment of long-term strategic objectives, and other non-quantitative objectives established at the beginning of each year. During the most recent financial year, performance evaluation of senior executives were conducted in accordance with this process.
In addition to these annual performance reviews, significant policy issues and capital expenditure or divestment decisions of management are required to undergo a formal peer group review process, including review by the company’s executive committee or approval by the board where necessary.
The governance procedures require the board to be comprised of a majority of independent directors and for there to be a separation of the role of chairman from that of the chief executive. These policies also provide that a director who has been employed in an executive capacity in the last three years cannot be considered an independent director.
Therefore, R G Waters has been an independent director from 1 September 2009. With M D Adamson being an executive director, seven of the eight directors are independent directors.
2. structuring the board to add value
Directors believe that for the board to be effective it needs to facilitate the efficient discharge of the duties imposed by law on the directors and add value to the company. To achieve this, the board is organised in such a way that it:
■ Obtains a proper understanding of, and competence to deal with, the current and emerging issues of the business.
■ Can effectively review and challenge the performance of management and exercise independent judgement.
■ Can assist in the identification of director candidates for shareholder vote.
Board compositionWhile the constitution provides that the appropriate size for the board is between three and nine members, the board has determined that eight is an appropriate number at this time to ensure proper rotation arrangements. At least one-third of all directors stand for election every year although this can be increased due to requirements of the stock exchanges. The directors who retire in each year are those who have been longest in office since their last election or, if there are more than one of equal term, those determined by agreement. Subject to continued shareholder support, the standard term for a non-executive director is six years from the date that he or she initially stands for election. At the end of this term the director will offer his or her resignation. The board may, if it considers it appropriate, offer a further term of up to three years.
The board has constituted a nominations committee, chaired by the chairman of the company and composed of all the non-executive directors. This committee assists in the identification of appropriate directors and, through the committee chair, reviews the performance of existing directors.
CommitteesCommittees established by the board review and analyse policies and strategies, usually developed by management, which are within their terms of reference. They examine proposals and, where appropriate, make recommendations to the full board. Committees do not take action or make decisions on behalf of the board unless specifically mandated by prior board authority to do so. A committee or an individual director may engage separate independent counsel at the expense of the company in appropriate circumstances, with the approval of the chairman.
The current standing committees of the board are audit and risk, remuneration and

31
nominations. These meet when necessary and consist entirely of non-executive directors. From time to time, the board may create ad hoc committees to examine specific issues on its behalf. The health and safety committee established to review on-site safety practices is one of those ad hoc committees.
Board processAlthough directors are elected by the shareholders to bring special expertise or perspectives to board deliberations, decisions of the board are made as a group, after taking each perspective into account and the best interests of the company.
The directors receive comprehensive information on the company’s operations before each meeting and have unrestricted access to any other information or records. To assist in ensuring information is timely, focused and concise, board papers are prepared and distributed electronically. Where directors cannot participate in a meeting they forward their views to another director in advance of the meeting. Senior management are also available at each meeting to address queries, and to assist in developing the board’s understanding of the issues facing the company and the performance of its businesses.
Director participation remains very high, with no apologies for absences from any of the ten regular meetings during the year. In addition to these meetings were seven site visits and a strategic session with senior management. The audit and risk committee met on four occasions and the remuneration and nominations committees both met twice.
3. Promoting ethical and responsible decision-making
The company has written procedures to: ■ Clarify the standards of ethical behaviour
required of company directors and key executives, and ensure observance of those standards through a code of conduct and the terms of reference for directors and management.
■ Prescribe the circumstances where directors and employees can trade in company securities.
■ Annually establish and review progress against measurable objectives for correcting imbalances in workforce diversity and in particular, gender diversity at senior levels of the group.
The company has a written code of values and a code of conduct with which all employees are required to comply.
The company has a written policy on illegal and unethical conduct. It reinforces this policy with promotional programmes to employees and provides a FairCall confidential telephone hotline to enable reporting of inappropriate behaviour. The FairCall line is operated by an
independent party, and the outcome of all matters raised is reported to the audit and risk committee.
New Zealand legislation and the company’s securities trading code of conduct prevent short-term trading and dealing in the company’s securities whilst directors and senior executives are in possession of non-public material and relevant information. The company reinforces these measures by requiring that any of the 127 persons comprising executives and directors, who are currently designated as having the opportunity to access price sensitive information, can transact in its securities only with the prior approval of the company secretary.
The company recognises that it has a number of legal and other obligations to non-shareholder stakeholders such as employees, clients, customers and the community as a whole. Its commitment to these obligations is captured in the code of values, and in various policies and procedures for ethical conduct, the responsibilities of employees, conflicts of interest, and relationships with suppliers and customers. These are incorporated into the employment terms of all employees.
The company is committed to developing an inclusive working environment that promotes employment equity and workforce diversity at all levels, including senior management and the board of directors. Fletcher Building believes that a workforce in which diversity differences, particularly in such matters as gender, age and race, are well-represented, builds competitive advantage and enhances business and thinking around the world.
4. safeguarding the integrity in financial reporting
While the ultimate responsibility to ensure the integrity of the company’s financial reporting rests with the board, the company has in place a structure of review and authorisation designed to ensure truthful and factual presentation of its financial position. This includes:
■ An appropriately resourced audit and risk committee operating under a written charter.
■ Review and consideration by the audit and risk committee of the accounts and the preliminary releases of results to the market.
■ A process to ensure the independence and competence of the company’s external auditors.
■ Establishment of an internal audit function in the corporate office, with reporting responsibility to the audit and risk committee.
■ Responsibility for appointment of the auditors residing with the audit and risk committee.
5. Making timely and balanced disclosure
The company has in place procedures designed to ensure compliance with the NZX and ASX Listing Rules such that:
■ All investors have equal and timely access to material information concerning the company, including its financial situation, performance, ownership and governance.
■ Company announcements are factual and presented in a clear and balanced way.
Accountability for compliance with disclosure obligations is with the company secretary. Significant market announcements, including the preliminary announcement of the half year and full year results, the accounts for those periods, and any advice of a change in an earnings forecast require prior approval by either the audit and risk committee or the board.
6. Respecting the rights of shareholders
The company seeks to ensure that its shareholders understand its activities by:
■ Communicating effectively with them. ■ Giving them ready access to balanced and
clear information about the company and corporate proposals.
■ Making it easy for them to participate in general meetings.
To assist with this, a company website is maintained with relevant information, including copies of presentations, reports and media releases. The corporate governance procedures are also included on the website. To further assist shareholders the company prepares and distributes its accounts in electronic format to shareholders who have so requested. This annual report is also available in electronic format. The company has continued to provide to all shareholders an annual review which is a summary of the group’s operations and financial performance for the year.
7. Recognising and managing risk
The company has a formalised system for identifying, overseeing, managing and controlling risk. The processes involved require the maintenance of a risk register that identifies key risks facing the business and the status of initiatives employed to reduce them. The risk register is reviewed regularly, including as part of the internal audit reviews.
During the most recent financial year, management has reported to the board on the effectiveness of the company’s management of its material business risks. As part of that report, appropriate assurances were received from management that the system of risk management and internal control is operating effectively in all material respects in relation to financial reporting risks.

32
REMUNERATION REPORT
Remunerating fairly and responsibly
The company seeks to ensure that its remuneration policies are fair and reasonable. It also seeks to ensure these policies attract and maintain talented and motivated directors and employees as a way of enhancing the performance of the company and aligning their interests with those of the company.
Non-executive directors’ remuneration
The fees paid to non-executive directors for services in their capacity as directors during the year ended 30 June 2013 are shown in the table to the right.
The remuneration policy for non-executive directors does not include participation in either a share or share option plan. Non-executive directors or their associates are nevertheless required to hold at least 20,000 shares in the company.
The company’s policy is to align directors’ remuneration with that for comparably sized New Zealand and Australian companies. Directors’ fees are normally reviewed annually by the nominations committee with effect from the beginning of the calendar year.
As part of its 2013 review of remuneration, the company commissioned an independent report on directors’ remuneration in Australasia, which indicated that some increase in fees was justified having regard to market changes. As a result, from 1 January 2013, the base director’s fee was increased from $140,000 per annum to $154,000 per annum, with audit and risk, remuneration and nomination committee fees remaining the same at $23,000, $17,500 and $10,000 respectively. The maximum aggregate fees payable in any year was set at $2,000,000 at the 2011 annual shareholders’ meeting.
Committee chairs receive a 50 percent premium to the committee fee. The board chairman’s fee is two and a half times the aggregate of the base and nominations committee fees paid to directors, and is inclusive of the time committed by the chairman for participation on other board committees. In acknowledgement of the additional time commitment required of any Australian-based director, a travelling allowance of $18,000 per annum is also payable. Where an ad hoc committee is convened, such as for due diligence, additional remuneration may be payable at $1,200 per half day.
The company believes that this provides an appropriate remuneration structure which recognises the increased global focus of the company’s activities and the increased corporate governance obligations imposed on directors.
Directors do not receive any further remuneration in respect of them also being directors of Fletcher Building Industries
Limited, the NZX listed issuer of the group’s debt securities.
Executive directors’ remuneration
J P Ling was the chief executive and managing director until his retirement on 30 September 2012. Mr Ling’s remuneration for the period from 1 July 2012 to 30 September 2012 was $2,236,321 comprising salary and accrued annual leave of $560,042 and termination payments of $1,676,278, including a special incentive to extend his tenure until the board was ready to appoint his replacement rather than leaving many months earlier as was his contractual right, and a final payment in respect of his participation in the Executive Long-Term Share Scheme.
M D Adamson was appointed chief executive and managing director on 18 June 2012 with effect from 1 October 2012. His remuneration comprises base remuneration of $1,500,000, a short-term incentive if specified annual performance targets are satisfied of up to 115% of base remuneration and participation in the company’s long-term incentive scheme of up to 100% of base remuneration. In addition, his total remuneration includes a portion of the assessed value of options granted to him in November 2012.
The actual remuneration and the value of other benefits received by Mr Adamson in respect of the financial year was $3,320,446. This comprised $1,508,429 of base remuneration and relocation costs and allowances and accommodation payments in respect of his move from the United States to New Zealand as provided in his employment agreement, a short-term incentive payment of $1,538,250 and $273,767 paid in October 2012 in respect of his participation in the 2009 Executive Long-Term Incentive Scheme.
As required by the NZSX and ASX Listing Rules, shareholder approval of the two components of Mr Adamson’s long-term incentives was
received at the annual shareholders’ meeting on 20 November 2012. His current long-term incentives consist of the issue of 500,000 options over shares of the company and entitlement to shares granted pursuant to the Executive Long-Term Share Scheme. The value of the 146,288 shares in the company acquired under the Executive Long-Term Share Scheme on 20 November 2012 was $1,005,000, although these are subject to on-going performance criteria.
The first grant of 500,000 options was made with effect from 1 October 2012, being the date of Mr Adamson’s appointment. A further issue of up to 500,000 options may be made to Mr Adamson at the discretion of the board during the period from 1 October 2015 to 20 November 2015.
Each option was granted for no cash consideration. The initial exercise price for the first grant was $6.22, being the volume weighted price of Fletcher Building shares sold on the NZX in the ten business days immediately preceding the announcement of his appointment on 18 June 2012. The exercise price is increased annually, with effect from the date of grant, by the company’s cost of capital, less any dividends actually paid.
There is a restrictive period of three years from the date of grant during which the options may not be exercised. Subject to the company’s rules on the trading of securities, options may be exercised at any time between the third and sixth anniversary of the date of grant.
Directors are satisfied that they have received independent advice that Mr Adamson’s terms of employment provide an appropriate remuneration package for the role of chief executive officer.
As executive directors, Messrs Ling and Adamson did not receive any further remuneration in their capacity as directors of Fletcher Building Industries Limited or other subsidiaries.
Non-executive directors’ remuneration
Base Fees$
Committee Fees $
OtherFees $
Total$
A J Carter 147,000 27,500 174,500
H A Fletcher 35,000 8,250 43,250
A T Jackson 147,000 36,500 183,500
J F Judge 147,000 44,500 191,500
K D Spargo 147,000 33,000 18,000 198,000
C Tarrant 147,000 33,000 180,000
G T Tilbrook 147,000 33,000 18,000 198,000
R G Waters 392,500 18,000 410,500
Total 1,309,500 215,750 54,000 1,579,250

33
Directors’ and officers’ indemnification and insurance
The company has arranged a programme of directors’ and officers’ liability insurance covering directors, executives and employees in managerial positions acting on behalf of the company. Cover is for damages, judgements, fines, penalties, legal costs awarded and defence costs arising from wrongful acts committed whilst acting for the company.
Actions not covered include dishonest, fraudulent or malicious acts or omissions; wilful breach of a statute, regulation or a duty to the company; improper use of information to the detriment of the company; and breach of professional duty. The insurance cover is supplemented by indemnification by the company, but this does not cover liability for criminal acts.
senior management remuneration
The company’s remuneration strategy aims to attract, retain and motivate high calibre employees at all levels of the organisation, and so drive performance and sustained growth in shareholder value. Underpinning this strategy is a philosophy that total remuneration should be provided that is competitive in the markets in which the company operates – particularly for delivering superior performance that contributes to improved business results.
Total remuneration for executives comprises fixed pay, including the value of any benefits, and a short-term variable incentive in the form of an annual performance related bonus that forms a significant portion of the total package.
All executive performance bonuses require achievement of a mixture of company financial and personal targets.
The company’s remuneration committee is kept fully appraised of relevant market information and best practice, obtaining advice from external advisors when necessary. Remuneration levels are reviewed annually for market competitiveness.
Fixed remuneration
It is the company’s policy to pay fixed remuneration comparable to the median and total compensation comparable to the upper quartile for equivalent roles in the country or region in which the incumbent is located. For the purposes of determining total remuneration within the senior executive group, it is assumed that senior executives will on average achieve 75 percent of their potential short-term incentives over time, such percentages to be reassessed periodically in the light of the actual earnings achieved over the business cycle. It is considered appropriate that 50 percent of long-term variable incentives be achieved over a normal business cycle.
short-term incentive remuneration
Short-term incentive remuneration is available to recognise the contribution of senior executives to company and individual performance objectives. Short-term incentive remuneration targets are expressed as a percentage of fixed remuneration which is up to 100 percent of the fixed remuneration for the chief executive and the direct reports to the chief executive, and up to 40 percent for all other senior executives.
Participation in the plan is by annual invitation, at which time the target incentive is established. This involves each participant being notified of a financial target and several challenging, measurable personal objectives for the financial year. Personal and financial objectives are independently assessed such that a participant can achieve their personal objectives even if the minimum financial target is not achieved.
The financial measures include the operating earnings target for the applicable division or business unit and the corporate Economic Value Added (EVA) target. Corporate executives are measured on a mix of EVA and personal objectives.
The target for commencement and determination of variable incentive payments is an assessed measure for each business unit or operating division, and is based on the approved budget. In most years 100 percent of the financial component is earned if 100 percent of target is achieved and up to 120 percent of the financial component is earned if 110 percent of budget target is achieved.
Individual variable compensation payments are offered entirely at the discretionof the board.
Long-term incentives
The company has implemented long-term cash-based performance incentive schemes, targeted at around 350 executives most able to influence financial results. Where performance targets are met, a cash bonus is payable with the after-tax amount invested in the company’s shares. Participation in any year is by invitation, renewable annually and at the complete discretion of the company.
Where permitted by securities legislation in the relevant jurisdiction, participants purchase shares in the company at the offer price with an interest-free loan. The offer price is established at market value at the time of offer, which will normally be each 30 September. The shares are held by a trustee on behalf of participants until the end of a three year restrictive period which may be extended for one further year for up to 50 percent of the entitlement. Provided certain performance criteria are met and participants remain employed with the company throughout the restrictive period, legal title in the shares
will be transferred to them at the end of the restrictive period.
The schemes are either share-ownership based for New Zealand and Australian executives or are designed to deliver the same economic value as the share scheme and is for a small number of executives in other jurisdictions where offering a share scheme is not optimum.
The cash-based share-ownership scheme, the Executive Long-Term Share Scheme (ELSS), will be offered to all eligible executives this year and is described in detail on the company’s website at fbu.com/investor-centre/governance.
In circumstances where shares cannot be acquired under the applicable securities legislation, equivalent economic entitlements are conveyed by way of cash bonus entitlements.
The comparator group of Australasian companies used to determine relative TSR performance for the 2013 offer comprises Adelaide Brighton, Amcor, Arrium, BlueScope, Boral, Brickworks, CSR, GWA Group, James Hardie, Leighton Holdings, Nuplex, Sims Group and Steel & Tube. The minimum and maximum EPS targets for the 2013 offer are for EPS for the year ended 30 June 2013 to increase by 8 percent per annum and 14 percent per annum respectively.
On 30 September 2013 the three year restrictive period in respect of the third issue under the ELSS, which was made in 2010, ends. The EPS minimum vesting threshold for the 2010 ELSS will not be met and accordingly no shares will vest in respect of the EPS tranche of shares in that offer. However, present indications are that the TSR of the company for the period will be in the 65th percentile of the comparator group of companies and accordingly participating executives in the ELSS (in respect of the TSR tranche) will be entitled to take up ownership of around 220,000 Fletcher Building shares.
superannuation
Participation in defined benefit and defined contribution retirement savings plans is made available to executives as required by remuneration practices in relevant jurisdictions. For those participating, an amount to recognise the value of the employer contributions required is included in the remuneration information in the remuneration information later in this report.
Holding the company’s securities
A standard term in the senior executive employment contract is a requirement that, over time, senior executives must acquire and maintain a holding in the company’s ordinary shares until such time as the sum so invested, or the market value of their

REMUNERATION REPORT CONTINUED
34
shareholding, exceeds 50 percent of their fixed remuneration. In meeting this obligation executives are required, from the date of receipt of the first payment under the senior executive short-term variable incentive plan, to apply at least half of the after tax proceeds so earned in acquiring shares.
The company believes this shareholding strengthens the alignment of senior executives with the interests of shareholders and puts their own remuneration at risk to long-term company performance. Apart from the long-term cash-based performance incentive schemes outlined above where an agreed percentage of any cash received is to be invested in purchasing shares, executives are left to their own discretion to organise acquiring the shares within the normal insider trading rules, and no allowance is made for the restriction on trading those shares. Directors may, in any year at their discretion, ease the share investment percentage required in terms of this policy in respect of any incentive payment arising in that year.
Shares issued to executives under the long-term incentive scheme, but still subject to the restrictive period, do not count towards the required minimum shareholding obligation.
The company does, however, allow New Zealand-based executives to meet their requirement to hold the company’s shares by having an economic exposure to the shares through a defined contribution investment account in the Fletcher Building Retirement Plan, the value of which is calculated by reference to the Fletcher Building share price.
Disclosure policyThe New Zealand Companies Act 1993 requires the disclosure of all remuneration payable over $100,000 per annum in $10,000 bands. As the company must comply with this obligation, it has chosen not to also make detailed disclosure of the remuneration of the five highest paid executives as is considered best practice under the ASX Corporate Governance Guidelines.
Compliance with AsX corporate governance guidelinesThe company meets all the best practice requirements of the ASX Corporate Governance Council other than making detailed disclosure of the five highest executives’ remuneration. As is noted above, the company makes the remuneration disclosures required of a New Zealand company under the Companies Act 1993.
Employee remuneration Section 211 (1) (g) of the New Zealand Companies Act 1993 requires disclosure of remuneration and other benefits, including redundancy and other payments made on termination of employment, in excess of $100,000 per year, paid by the company or any of its subsidiaries worldwide to any employees who are not directors of the company. To give more appropriate information on total employees’ remuneration, where there is a contractual commitment to provide incentive remuneration in respect of the year ended 30 June 2013, the amount accrued as at 30 June 2013 has also been included in the total remuneration disclosed in the table to the right.

35
Number of employees
From NZ$ To NZ$International
business activitiesNew Zealand
business activities Total100,000 110,000 522 350 872 110,000 120,000 389 240 629 120,000 130,000 300 159 459 130,000 140,000 232 117 349 140,000 150,000 161 82 243 150,000 160,000 116 66 182 160,000 170,000 82 39 121 170,000 180,000 79 41 120 180,000 190,000 74 28 102 190,000 200,000 53 32 85 200,000 210,000 53 23 76 210,000 220,000 30 19 49 220,000 230,000 33 17 50 230,000 240,000 28 14 42 240,000 250,000 12 11 23 250,000 260,000 11 15 26 260,000 270,000 18 11 29 270,000 280,000 20 6 26 280,000 290,000 22 7 29 290,000 300,000 12 6 18 300,000 310,000 11 6 17 310,000 320,000 10 4 14 320,000 330,000 11 4 15 330,000 340,000 8 2 10 340,000 350,000 9 4 13 350,000 360,000 6 4 10 360,000 370,000 5 2 7 370,000 380,000 4 2 6 380,000 390,000 8 2 10 390,000 400,000 2 1 3 400,000 410,000 3 4 7 410,000 420,000 1 5 6 420,000 430,000 4 1 5 430,000 440,000 3 2 5 440,000 450,000 3 3 450,000 460,000 3 1 4 460,000 470,000 2 2 4 470,000 480,000 1 3 4 480,000 490,000 3 3 490,000 500,000 2 2 4 500,000 510,000 1 1 510,000 520,000 2 2 520,000 530,000 1 1 2 540,000 550,000 1 1 2 550,000 560,000 1 1 570,000 580,000 3 3 580,000 590,000 1 1 590,000 600,000 1 1 610,000 620,000 2 2 650,000 660,000 1 1 670,000 680,000 1 1 680,000 690,000 1 1 700,000 710,000 2 2 730,000 740,000 1 1
770,000 780,000 2 2 780,000 790,000 1 1 1,000,000 1,010,000 1 1 1,030,000 1,040,000 2 2 1,130,000 1,140,000 1 1 1,180,000 1,190,000 2 2 1,360,000 1,370,000 1 1 1,480,000 1,490,000 1 1 2,550,000 2,560,000 1 1
2,363 1,350 3,713

36
08 09 10
5.6
11 12 13
3.94.0
4.9 5.
1
3.7
08 09 10
42.0
14.1
11 12
24.5
14.2
13
50.5
-27.
2
-42.
9
08 09 10
19.0
11 12 13
10.8
3.4 12
.7
10.6
7.4
Cashflow and capital expenditureCashflow from operations was $559 million, up 25 percent on the $448 million achieved in the prior year. The improvement was due to strong cashflows in the Construction, Building Products and Distribution divisions, and reductions in working capital.
Capital expenditure for the period was $246 million, down from $353 million in the prior year. Of this total, $148 million was for stay-in-business capital projects and $98 million was for new growth initiatives, including $13 million for the acquisition of new businesses.
Capital management and fundingThe group’s gearing3 at 30 June 2013 was 33.3 percent compared with 37.4 percent at 30 June 2012.
The group had total available funding of $2,690 million as at 30 June 2013. Of this, $819 million was undrawn and there was an additional $123 million of cash on hand. The group has drawn debt facilities maturing within the next 12 months of $33 million, and a further $112 million of capital notes subject to interest rate and term reset. These maturities are more than covered by the undrawn facilities and cash on hand.
The average maturity of the debt is 5 years and the currency split is 49 percent Australian dollar; 33 percent New Zealand dollar; 11 percent US dollar; and 7 percent spread over various other currencies.
74 percent of all borrowings have fixed interest rates with an average duration of 3 years and a rate of 7.4 percent. Inclusive of floating
rate borrowings the average interest rate on the debt is 6.7 percent. All interest rates are inclusive of margins but not fees.
Interest coverage4 for the period was 3.9 times compared with 3.7 times in the previous year.
Risk managementThe company has an integrated programme to manage risk associated with movements in interest rates, commodity prices and exchange rates. This aims to ensure a base level of profitability and reduces volatility of earnings. Further details are provided in note 27 of the financial statements.
Retirement plansThe company operates a number of defined benefit retirement plans for its employees. The investment in all plans totalled 743 million at 30 June 2013.
During the year the company contributed $24 million towards funding these plans. The group expects to contribute $21 million to its defined benefit plans during the year to June 2014.
1 Share price movement in year and gross dividend received, to opening share price.
2 EBIT to average funds (net debt and equity less deferred tax asset).
3 Net debt (borrowings less cash and deposits) to net debt and equity.
4 EBIT before significant items to total interest paid.
FINANCIAL REVIEW
08 09 10
434
11 12 1355
9
533
522
402 44
8
08 09 10
40.1
11 12 13
33.3
31.3
26.8 34
.3 37.4
Total shareholder return (percentage) 1
Operating cashflow (NZ $million)
Interest cover (times) 4
Return on average funds (percentage) 2
Gearing (percentage) 3

FINANCIALSTATEMENTS
Earnings statement 38
Statements of comprehensive incomeand movements in equity
39
Balance sheet 40
Statement of cashflows 41
Reconciliation of net earnings to net cashfrom operating activities
43
Statement of accounting policies 44
Notes to the financial statements 47
Independent auditor’s report 77
37

38
Earnings statement
For the year ended 30 June 2013
Fletcher Building Group Fletcher Building Limited
Notes Year endedJune 2013
NZ$M
Year endedJune 2012
NZ$M
Year endedJune 2013
NZ$M
Year endedJune 2012
NZ$M
Sales 8,517 8,839
Cost of goods sold (6,346) (6,613)
Gross margin 2,171 2,226
Selling and marketing expenses (1,040) (1,095)
Administration expenses (585) (603)
Share of profits of associates 21 21 26
Other investment income 1 2 2
Intercompany investment income 32 140 677
Other gains and losses 3 4 1
Amortisation of intangibles 20 (2)
Restructuring and impairment charges 4 (153)
Operating earnings (EBIT) 569 403 142 679
Funding (costs)/income 6 (147) (152) 136 40
Earnings before taxation 422 251 278 719
Taxation expense 7 (85) (58) (39) (11)
Earnings after taxation 337 193 239 708
Earnings attributable to minority interests (11) (8)
Net earnings attributable to the shareholders 326 185 239 708
Net earnings per share (cents) 9
Basic 47.6 27.2
Diluted 47.5 27.2
Weighted average number of shares outstanding (millions of shares) 9
Basic 685 681
Diluted 711 681
Dividends declared per share (cents) 34.0 34.0
The accompanying notes form part of and are to be read in conjunction with these financial statements.
On behalf of the Board, 21 August 2013
Ralph Waters Chairman of Directors
Mark AdamsonManaging Director
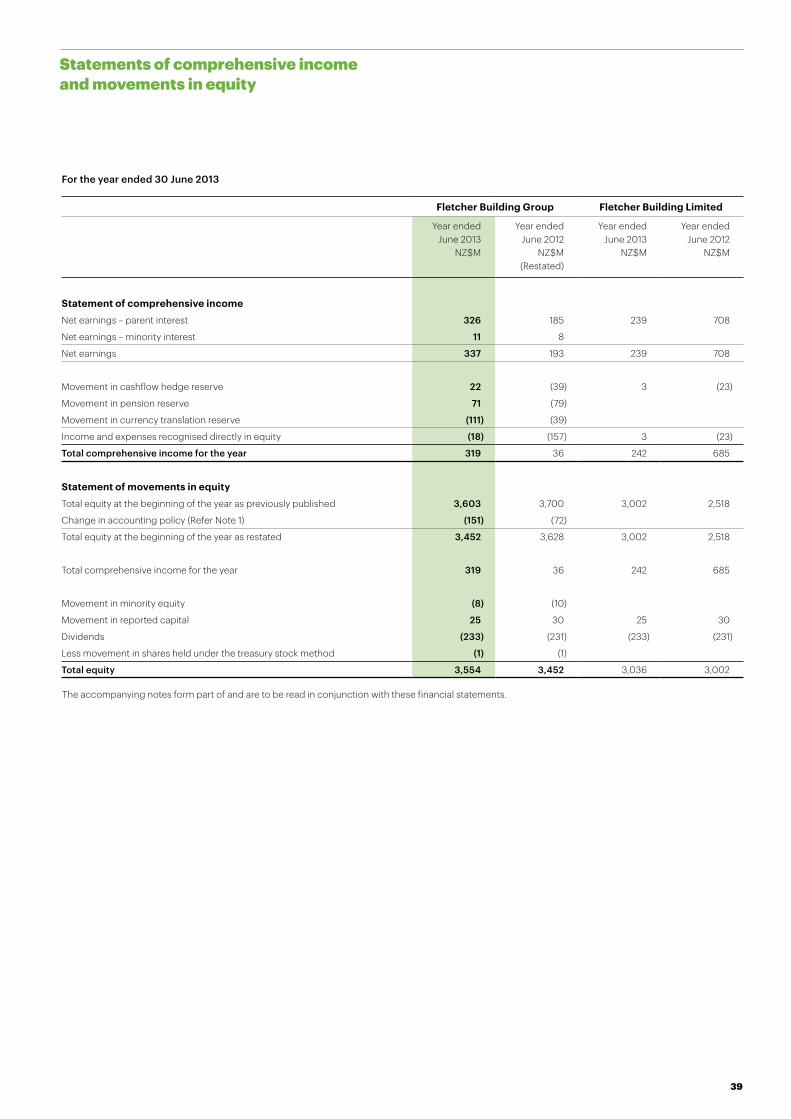
39
Statements of comprehensive income and movements in equity
For the year ended 30 June 2013
Fletcher Building Group Fletcher Building Limited
Year endedJune 2013
NZ$M
Year endedJune 2012
NZ$M(Restated)
Year endedJune 2013
NZ$M
Year endedJune 2012
NZ$M
Statement of comprehensive income Net earnings – parent interest 326 185 239 708
Net earnings – minority interest 11 8
Net earnings 337 193 239 708
Movement in cashflow hedge reserve 22 (39) 3 (23)
Movement in pension reserve 71 (79)
Movement in currency translation reserve (111) (39)
Income and expenses recognised directly in equity (18) (157) 3 (23)
Total comprehensive income for the year 319 36 242 685
Statement of movements in equity Total equity at the beginning of the year as previously published 3,603 3,700 3,002 2,518
Change in accounting policy (Refer Note 1) (151) (72)
Total equity at the beginning of the year as restated 3,452 3,628 3,002 2,518
Total comprehensive income for the year 319 36 242 685
Movement in minority equity (8) (10)
Movement in reported capital 25 30 25 30
Dividends (233) (231) (233) (231)
Less movement in shares held under the treasury stock method (1) (1)
Total equity 3,554 3,452 3,036 3,002
The accompanying notes form part of and are to be read in conjunction with these financial statements.

40
Balance sheet
As at 30 June 2013
Fletcher Building Group Fletcher Building Limited
Notes June 2013NZ$M
June 2012NZ$M
(Restated)
June 2013NZ$M
June 2012NZ$M
AssetsCurrent assets:
Cash and deposits 15 123 168 38 77
Current tax asset 25 30 46
Derivatives 27 10 4
Debtors 16 1,346 1,460 26 27
Stocks 17 1,353 1,434
Total current assets 2,862 3,112 64 104
Non current assets:
Fixed assets 18 2,261 2,348
Goodwill 19 1,219 1,243
Intangibles 20 510 519
Investments 21 180 150 5,447 5,429
Derivatives 27 39 69 49 65
Deferred taxation asset 25 32 38 13 15
Advances to subsidiaries 32 864 781
Total non current assets 4,241 4,367 6,373 6,290
Total assets 7,103 7,479 6,437 6,394
LiabilitiesCurrent liabilities:
Provisions 22 63 95 2
Creditors and accruals 23 1,181 1,249 1 1
Current tax liability 25 15 18 38 12
Derivatives 27 12 3
Contracts 24 102 115
Borrowings 26 144 456 9 55
Advances from subsidiaries 32 3,262 3,208
Total current liabilities 1,517 1,936 3,310 3,278
Non current liabilities:
Provisions 22 20 21
Creditors and accruals 23 87 92
Deferred taxation liability 25 40 20
Retirement plan liability 34 84 137
Derivatives 27 46 50 57 52
Borrowings 26 1,755 1,771 34 62
Total non current liabilities 2,032 2,091 91 114
Total liabilities 3,549 4,027 3,401 3,392
EquityReported capital 11 2,606 2,582 2,628 2,603
Revenue reserves 12, 13 1,078 985 441 435
Other reserves 12, 13 (165) (147) (33) (36)
Shareholders' funds 3,519 3,420 3,036 3,002
Minority equity 14 35 32
Total equity 3,554 3,452 3,036 3,002
Total liabilities and equity 7,103 7,479 6,437 6,394
The accompanying notes form part of and are to be read in conjunction with these financial statements.

41
Statement of cashflows
For the year ended 30 June 2013
Fletcher Building Group Fletcher Building Limited
Year endedJune 2013
NZ$M
Year endedJune 2012
NZ$M
Year endedJune 2013
NZ$M
Year endedJune 2012
NZ$M
Cashflow from operating activities
Receipts from customers 8,539 8,908 26 2
Dividends received 19 32 140 677
Interest received 1 164 60
Total received 8,558 8,941 330 739
Payments to suppliers, employees and other 7,790 8,227 44
Interest paid 149 143 28 20
Income tax paid 60 123
Total applied 7,999 8,493 28 64
Net cash from operating activities 559 448 302 675
Cashflow from investing activities
Sale of fixed assets 18 16
Sale of investments 9
Sale of subsidiaries 64 11
Total received 91 27
Purchase of fixed assets 233 261
Purchase of investments 2 6
Purchase of subsidiaries 11 86
Net debt in subsidiaries acquired 10
Total applied 246 363
Net cash from investing activities (155) (336)
Cashflow from financing activities
Net debt drawdown 107 59
Issue of capital notes 67
Total received 174 59
Net debt repayment 170 74
Repurchase of capital notes 57 21
Advances to subsidiaries 59 487
Distribution to minority shareholders 12 13
Dividends 208 201 208 201
Total applied 447 235 341 688
Net cash from financing activities (447) (61) (341) (629)
Net movement in cash held (43) 51 (39) 46
Add opening cash deposits 168 115 77 31
Effect of exchange rate changes on net cash (2) 2
Closing cash and liquid deposits 123 168 38 77
The accompanying notes form part of and are to be read in conjunction with these financial statements.

42
Statement of cashflowscontinued
For the year ended 30 June 2013
Fletcher Building Group
Year endedJune 2013
NZ$M
Year endedJune 2012
NZ$M
Analysis of subsidiaries acquiredFixed assets 8 41
Goodwill on acquisition 3 102
Current assets 1 19
Minority interests (2)
Debt in subsidiaries (10)
Current liabilities (1) (11)
Total assets and liabilities recognised 11 139
Gain recognised in respect of investment previously held (4)
Adjustment to derecognise investment previously held in subsidiaries acquired (49)
Cash paid to date for subsidiaries acquired 11 86
During the year the group acquired two minor subsidiaries for aggregate consideration of $11 million.
The accompanying notes form part of and are to be read in conjunction with these financial statements.
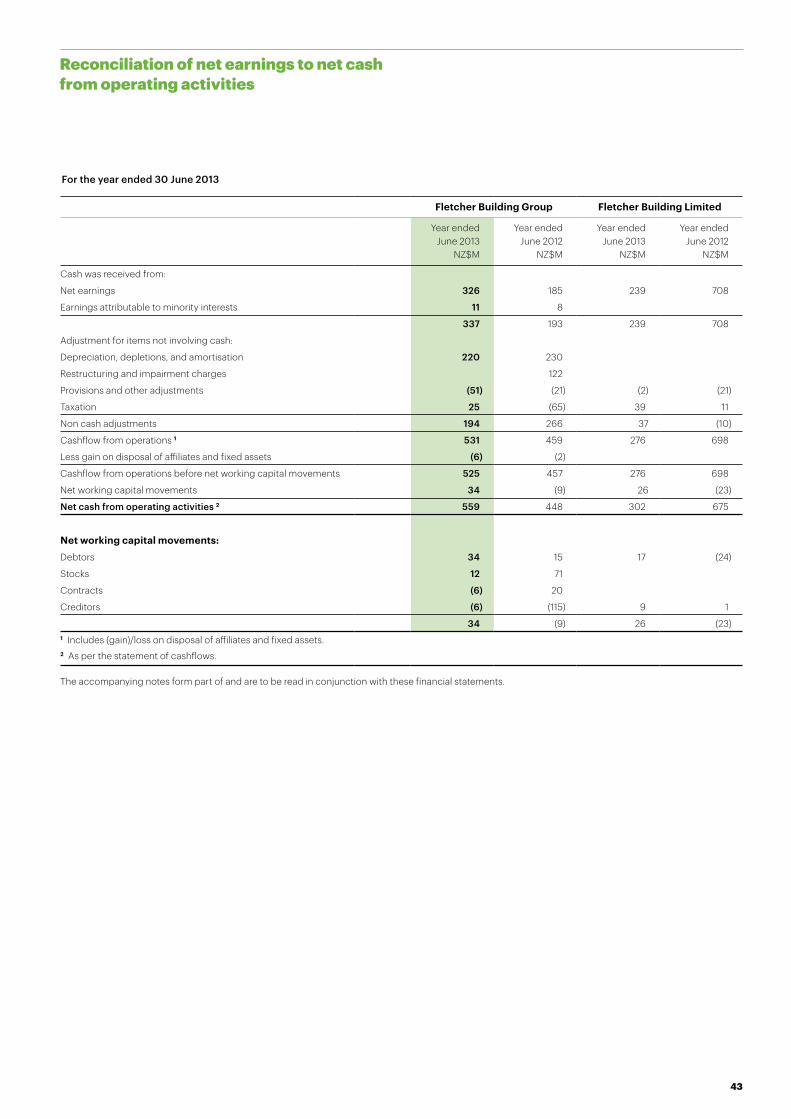
43
Reconciliation of net earnings to net cash from operating activities
For the year ended 30 June 2013
Fletcher Building Group Fletcher Building Limited
Year endedJune 2013
NZ$M
Year endedJune 2012
NZ$M
Year endedJune 2013
NZ$M
Year endedJune 2012
NZ$M
Cash was received from:
Net earnings 326 185 239 708
Earnings attributable to minority interests 11 8
337 193 239 708
Adjustment for items not involving cash:
Depreciation, depletions, and amortisation 220 230
Restructuring and impairment charges 122
Provisions and other adjustments (51) (21) (2) (21)
Taxation 25 (65) 39 11
Non cash adjustments 194 266 37 (10)
Cashflow from operations 1 531 459 276 698
Less gain on disposal of affiliates and fixed assets (6) (2)
Cashflow from operations before net working capital movements 525 457 276 698
Net working capital movements 34 (9) 26 (23)
Net cash from operating activities 2 559 448 302 675
Net working capital movements:Debtors 34 15 17 (24)
Stocks 12 71
Contracts (6) 20
Creditors (6) (115) 9 1
34 (9) 26 (23)1 Includes (gain)/loss on disposal of affiliates and fixed assets.2 As per the statement of cashflows.
The accompanying notes form part of and are to be read in conjunction with these financial statements.

44
Statement of accounting policies
Basis of presentationThe financial statements presented are those of Fletcher Building Limited (the company) and its subsidiaries (the group). Fletcher Building Limited is a company domiciled in New Zealand, is registered under the Companies Act 1993, and is an issuer in terms of the Securities Act 1978 and the Financial Reporting Act 1993. The registered office of the company is 810 Great South Road, Penrose, Auckland. Fletcher Building Limited is a profit oriented entity.The financial statements comprise the earnings statement, statement of comprehensive income, statement of movements in equity, balance sheet, statement of cashflows, and significant accounting policies, as well as the notes to these financial statements.
Accounting conventionThe financial statements are based on the general principles of historical cost accounting, except that financial assets and liabilities as described below are stated at their fair value. These financial statements have been prepared in accordance with Generally Accepted Accounting Practice in New Zealand which is the New Zealand equivalent to International Financial Reporting Standards (NZ IFRS). They also comply with International Financial Reporting Standards.The accounting policies have been applied consistently by all group entities, except as disclosed in note 1, changes in accounting policies.
Segmental reportingSegmental information is presented in respect of the group’s industry and geographical segments. The use of industry segments as the primary format is based on the group’s management and internal reporting structure, which recognises groups of assets and operations with similar risks and returns. Inter-segment pricing is determined on an arm’s length basis.
EstimatesThe preparation of financial statements in conformity with NZ IFRS requires the directors to make estimates and assumptions that affect the reported amounts of assets and liabilities, disclosure of contingent assets and liabilities at the date of the financial statements and the reported amounts of sales and expenses during the reporting period. Actual results could differ from those estimates. The estimates and assumptions are reviewed on an ongoing basis. For further information on areas of estimation and judgement, refer to the notes to the financial statements, in particular note 19.
Basis of consolidationThe consolidated financial statements comprise the company and its subsidiaries and the group’s interest in associates, partnerships and joint ventures. Inter-company transactions are eliminated in preparing the consolidated financial statements.
SubsidiariesSubsidiaries are included in the consolidated financial statements using the acquisition method of consolidation, from the date control commences until the date control ceases.
AssociatesThe equity method has been used for associate entities in which the group has a significant but not controlling interest.
Goodwill on acquisitionFair values are assigned to the identifiable assets and liabilities of subsidiaries and associates of the group at the date they are acquired. Goodwill arises to the extent of the excess of the cost of the acquisition over the fair value of the assets and liabilities.Goodwill is stated at cost, less any impairment losses. Goodwill is allocated to cash generating units and is not amortised, but is tested annually for impairment. Goodwill in respect of associates is included in the carrying amount of associates. Any discount on acquisition is recognised directly in earnings on acquisition.
Joint ventures and partnershipsWhere the ownership interest in the joint venture is in the net residue of the business and does not give rise to an economic or controlling interest in excess of 50 percent, the share of the net assets and liabilities and earnings of the investment is included on an equity basis. If the interest does give rise to a controlling interest in excess of 50 percent, the investment is consolidated.Joint ventures in which the ownership interest is directly in the assets and liabilities, rather than the net residue, are included on a proportional basis with assets, liabilities, revenues and expenses based on the group’s proportional interest.
Valuation of assets
Land, buildings, plant and machinery, fixtures and equipmentThe cost of purchasing land, buildings, plant and machinery, fixtures and equipment is the value of the consideration given to acquire the assets and the value of other directly attributable costs which have been incurred in bringing the assets to the location and the condition necessary for their intended service, including subsequent expenditure.The costs of self constructed assets include, where appropriate, the costs of all materials used in construction, direct labour on the project, site preparation and installation costs, costs of obtaining resource consents, financing costs that are directly attributable to the project, variable and fixed overheads and unrecovered operating costs incurred during planned commissioning. Costs cease to be capitalised as soon as the asset is ready for productive use. All feasibility costs are expensed as incurred. Leases in which the group assumes substantially all the risks and rewards of ownership are classified as finance leases and are measured at the lower of their fair value or the present value of the minimum lease payments at the inception of the lease.
Land, buildings, plant and machinery, leased assets and fixtures and equipment are stated at cost, less accumulated depreciation.
InvestmentsInvestments are valued at historical cost. Impairments in the value of investments are written off to earnings as they arise.
StocksTrading stock, raw materials and work in progress are valued at the lower of cost or net realisable value, determined principally on the first-in, first-out basis. Cost includes direct manufacturing costs and manufacturing overheads at normal operating levels.
DebtorsDebtors are valued at estimated net realisable value. The valuation is net of a specific provision maintained for doubtful debts. All known losses are written off to earnings in the period in which it becomes apparent that the debts are not collectable. Trade debtors normally have 30 to 90 day terms.
Construction work in progressConstruction work in progress is stated at cost plus profit recognised to date, less progress billings and any provision for foreseeable losses. Cost includes all expenditure directly related to specific projects and an allocation of fixed and variable overheads incurred in the group’s contract activities based on normal operating capacity.
CashCash and deposits comprise cash and demand deposits with banks or other financial institutions and highly liquid investments that are readily convertible to cash.
ImpairmentImpairment is deemed to occur when the recoverable amount falls below the book value of the asset. The recoverable amount is determined to be the greater of the fair value, less disposal costs or the sum of expected future discounted net cashflows arising from the ownership of the asset. Future net cashflows take into account
For the year ended 30 June 2013

45
the remaining useful life and the expected period of continued ownership, including any intended disposals, and any costs or proceeds expected to eventuate at the end of the remaining useful life or the end of the expected period of continued ownership.For the purposes of considering whether there has been an impairment, assets are grouped at the lowest level for which there are identifiable cashflows that are largely independent of the cashflows of other groups of assets. When the book value of a group of assets exceeds the recoverable amount an impairment loss arises and is recognised in earnings immediately.Goodwill and brands with an indefinite life are tested for impairment in June of each year. Other assets are tested for impairment when an indication of impairment exists.
BrandsBrands for which all relevant factors indicate that there is no limit to the foreseeable net cashflows, are considered to have an indefinite useful life and are held at cost and are not amortised, but are subject to an annual impairment test.
Retirement plansThe group’s net asset in respect of its retirement plans is calculated separately for each plan by an independent actuary, as being the fair value of the plan’s assets less the present value of the future obligations to the members. The value of the asset recognised cannot exceed the present value of any future refunds from the plans or reductions in future contributions to the plans.
Foreign currency
Translation of the financial statements of foreign operationsThe assets and liabilities of the group’s overseas operations are translated into New Zealand currency at the rates of exchange ruling at balance date. The revenue and expenditure of these entities are translated using an average exchange rate reflecting an approximation of the appropriate transaction rates.
Exchange variations arising on the translation of these entities are recognised directly in the currency translation reserve.
Exchange differencesMonetary assets and liabilities in foreign currencies at balance date which are not covered by forward exchange contracts are translated at the rates of exchange ruling at balance date. Monetary assets and liabilities in foreign currencies at balance date which are covered by forward exchange contracts are effectively translated at the exchange rates specified in those contracts.Non-monetary assets and liabilities in foreign currencies are translated at the exchange rates in effect when the amounts of these assets and liabilities were determined.
Net investments in foreign operationsExchange differences arising from the translation of the net investment in foreign operations, and of related hedges, are taken to the currency translation reserve and are released to earnings upon disposal.
Financial instruments
Non-derivative financial instrumentsNon-derivative financial instruments comprise borrowings, trade and other payables, cash and cash equivalents, and trade and other receivables.Non-derivative financial instruments are recognised initially at fair value. Subsequent to initial recognition, non-derivative financial instruments are measured at amortised cost using the effective interest method, less any impairment losses.
Derivative financial instrumentsDerivative financial instruments including foreign exchange contracts, interest rate swaps, currency swaps, options, forward rate agreements and commodity price swaps are utilised to reduce exposure to market risks.Group policy specifically prohibits the use of derivative financial instruments for trading or speculative purposes. All the group’s derivative financial
instruments are held to hedge risk on underlying assets, liabilities and forecast and committed trading transactions.The fair values of derivative financial instruments, as disclosed in the financial instrument note, are determined by applying quoted market prices.The group holds derivative instruments until expiry except where the underlying rationale from a risk management point of view changes, such as when the underlying asset or liability which the instrument hedges no longer exists, in which case early termination occurs.Derivative financial instruments are initially recorded at fair value and are then revalued to fair value at balance date. The gain or loss on revaluation is recorded either in earnings or equity depending on whether the instruments qualify for hedge accounting and the nature of the item being hedged. For a derivative instrument to be classified and accounted for as a hedge, it must be highly correlated with, and effective as a hedge of the underlying risk being managed. This relationship must be documented from inception.
Fair value hedgesWhere a derivative financial instrument is designated as a hedge of a recognised asset or liability, or of a firm commitment, any gain or loss is recognised directly in earnings together with any changes in the fair value of the hedged risk.
Cashflow hedgesWhere a derivative financial instrument is designated as a hedge of the variability in cashflows of assets or liabilities, or of a highly probable forecasted transaction, the effective part of any gain or loss is recognised directly in the cashflow hedge reserve within equity and the ineffective part is recognised immediately in earnings. The effective portion is transferred to earnings when the underlying cashflows affect earnings.
Net investment hedges Where the derivative financial instruments are designated as
a hedge of a net investment in a foreign operation, the derivative financial instruments are accounted for on the same basis as cashflow hedges through the currency translation reserve within equity.
Derivatives that do not qualify for hedge accountingWhere a derivative financial instrument does not qualify for hedge accounting, or where hedge accounting has not been elected, any gain or loss is recognised directly in earnings.
Valuation of liabilities
TaxationThe provision for current tax is the estimated amount due for payment during the next 12 months by the group. The provision for deferred taxation has been calculated using the balance sheet liability method. Deferred tax is recognised on the temporary difference between the carrying amount of assets and liabilities and their taxable value.Deferred tax assets are not recognised on temporary differences and tax losses unless recovery is considered probable.
Finance leasesFinance leases are capitalised to reflect the borrowings incurred and the cost of the asset acquired. Such obligations are classified within borrowings. The finance cost portion of lease payments is written off to earnings. The leased asset is depreciated on a straight line basis over the estimated useful life of the asset with regard to residual values.
BorrowingsInterest bearing borrowings are initially recognised at fair value.
CreditorsTrade creditors and other liabilities are stated at cost or estimated liability where accrued.
Annual leaveAnnual leave is recognised on an accrual basis.
ProvisionsA provision is recognised when the group has a current obligation and it is probable that an economic benefit will be required to settle it.

46
Intercompany guaranteesWhere the company enters into financial guarantee contracts to guarantee the performance or indebtedness of other companies within the group, the company considers these to be insurance arrangements and accounts for them as such. In this respect, the company treats the guarantee contract as a contingent liability until such time as it becomes probable that the company will be required to make a payment under the guarantee.
Equity
Share capitalOrdinary shares are classified as shareholders funds. Costs directly attributable to the issue of new shares or options are shown in shareholders funds as a reduction from the proceeds.Dividends are recognised as a liability in the period in which they are declared.Where a member of the group purchases the company’s share capital the consideration paid is deducted from equity under the treasury stock method as if the shares are cancelled, until they are reissued or otherwise disposed of.
Income determination
Sales recognitionSales are recognised in accordance with the terms of sale when the benefits of ownership and risk of loss passes to the customer.
Construction contractsEarnings on construction contracts (including sub-contracts) are determined using the percentage-of-completion method. Earnings are not recognised until the outcome can be reliably estimated. The company uses its professional judgement to assess both the physical completion and the forecast financial result of the contract. Provision is made for estimated future losses on the entire contract from the date it is first recognised that a contract loss may be incurred.
Investment revenueDividends and distributions are taken to earnings when received, or accrued where declared prior to balance date.
Funding costsNet funding costs comprise interest expense, interest income, amortisation of prepaid expenses and gains/losses on certain financial instruments that are recognised in earnings.
DepreciationDepreciation of fixed assets is calculated on the straight line method. Expected useful lives, which are regularly reviewed on a weighted average basis are:
Buildings 30 years
Plant and machinery 13 years
Fixtures and equipment 5 years
Leased assets capitalised 10 years
Leasing commitmentsExpenditure arising from operating leasing commitments is written off to earnings in the period in which it is incurred.
Retirement plan expenseObligations for contributions to defined contribution plans are recognised in earnings as incurred. The actuarial cost of providing benefits under defined benefit plans is expensed as it accrues over the service life of the employees, after taking account of the income expected to be earned by the assets owned by the plans.All actuarial gains or losses are recognised in the pension other comprehensive income reserve (the pension reserve) in the year in which are they incurred.
Long service leaveLong service leave is recognised in earnings on an actuarial basis.
Research and developmentExpenditure on research activities is recognised in earnings as incurred.
Executive share schemeThe company has implemented a long term cash-based performance incentive scheme targeted at the company’s executives most able to influence the results of the company with an agreed percentage of any cash received to be invested in purchasing the company’s shares.The executive long-term share scheme introduced in 2008 allows group executives to acquire shares
in the company at market price, funded by an interest free loan from the group. The executives are entitled to vote on the shares and to receive cash dividends, the proceeds of which are used to repay the loan. The shares are held in trust for the executives by the Trustee, Fletcher Building Share Schemes Limited. Payment of half of any benefit under the executive performance share scheme is dependent upon the group’s total shareholder return exceeding the 51st percentile of the total shareholder return of a comparative group of companies over a three year restricted period.
Payment of the other half of any benefit is dependent upon the group achieving an earnings per share target. In addition, in respect of the benefit which is dependant on total shareholders return, the three year restricted period is automatically extended for up to one year if total shareholders return is less than the 51st percentile. Executives can elect to extend the restricted period for up to one year if total shareholders return is between the 51st and 75th percentile. No extension is permitted for the benefit which is dependant upon achieving an earnings per share target.
At the end of the restricted period or any extension, the group will pay a bonus to the executives to the extent that performance targets have been met, the after tax amount of which will be sufficient for the executives to repay the balance of the loan for the shares which vest.
If the performance obligations are not met or are only partially met, the trustee will acquire the beneficial interest in some or all of the shares. The loan provided in respect of those shares which do not transfer to the executives (the forfeited shares) will be novated to the trustee and will be fully repaid by the transfer of the forfeited shares.
The group will recognise an expense in earnings over the restricted period to provide for the maximum bonus payable.
The group accounts for the share schemes under the treasury stock method. The receivable owing from the executives, representing the shares held in the company, is deducted from the group’s paid up capital. If the performance targets based on total shareholder return are not met and the shares do not vest, the after tax amount of the bonus provision will be transferred to equity and will not be released to earnings. If the performance targets based on earnings per share are not met and the shares do not vest, the after-tax amount of the bonus provision will be released to earnings. The shares will continue to be deducted from equity until they are disposed of by the trustee. To the extent that the performance targets are met and the shares vest the bonus will be paid enabling repayment of the loan, and to the extent of this loan repayment paid up capital will increase.
Employee share purchase scheme – FBuShareThe global employee share purchase scheme, FbuShare, allows eligible group employees to regularly save up to NZ$5,000 per annum of their after-tax pay and purchase shares in the company (purchased shares) at market prices. At the end of rolling three year qualification periods, and provided they remain employed by a group company, employees will be awarded one free award share for every two purchased shares acquired in the first year of each three year qualification period and still held at the end of those periods.Dividends payable will be re-invested in additional shares. Employees will receive award shares on any additional shares, subject to the same conditions set out above. The employees are responsible for any income tax liability payable on dividends and on the value of any award shares.At the end of each three year qualification period, employees may continue to hold any purchased, additional and award shares or they may sell some or all of the shares. The group accrues the liability to pay for award shares over the three year qualification periods.
Statement of accounting policiescontinued

47
Notes to the financial statements
1 Changes in accounting policiesNZ IAS 19 Employee Benefits has been revised with an effective date of 30 June 2014 for the group. The group decided to adopt this early for the year ended 30 June 2013. This resulted in the unrecognised loss in respect of its retirement plans at 30 June 2011 of $87 million ($72 million net of tax) being written off to the pension other comprehensive income reserve (the pension reserve). In addition the actuarial loss of $95 million ($79 million net of tax) incurred during the year ended 30 June 2012 has been written off to the pension reserve. Therefore the total write-off at 30 June 2012 is $182 million ($151 million net of tax) and this has been written off to the pension reserve. The group has recalculated its pension expense for the current and prior year and this has not changed materially. Going forward the adoption of the revised standard is not expected to have a material impact on the group’s earnings.
The International Accounting Standards Board has issued a number of other standards, amendments and interpretations which are not yet effective. The group has not yet applied these in preparing these financial statements although the application of these standards, amendments and interpretations would require further disclosures, but they are not expected to have a material impact on the group’s earnings. There have been no other changes in accounting policies in the year ended 30 June 2013, however certain comparatives have been restated to conform with the current year’s presentation.
2 AcquisitionsDuring the 2013 year the group acquired subsidiaries for a total consideration of $11 million (2012: $86 million).
The following values are recognised in the financial statements:
Finalfair value
NZ$M
Fixed assets 8
Goodwill on acquisition 3
Current assets 1
Current liabilities (1)
Enterprise value 11
Consideration paid 11
During the year to 30 June 2013 these acquisitions contributed sales of $5 million and an operating earnings loss of $1 million. As these acquisitions occurred at the beginning of the year, the above contributions are the same as the annualised results. A formal fair value exercise of the assets and liabilities for the above acquisitions has been completed.
The major acquisition during the prior year was the purchase of the remaining half of Homapal on 2 April 2012 for a consideration of $52 million, having previously held a 50 percent investment. From that date Homapal has been accounted for as a subsidiary of the group, having previously been equity accounted as an associate.
The following values are recognised in the financial statements in respect of this acquisition:
Finalfair value
NZ$M
Fixed assets 13
Brands 14
Goodwill on acquisition 85
Inventories 7
Receivables 3
Current liabilities (6)
Deferred taxation liability (1)
Enterprise value 115
Less debt acquired (10)
Gain recognised in respect of investment previously held (4)
Adjustment to derecognise investment previously held (49)
Consideration paid 52

48
3 Specific disclosures
Fletcher Building Group Fletcher Building LimitedYear ended
June 2013NZ$M
Year endedJune 2012
NZ$M
Year endedJune 2013
NZ$M
Year endedJune 2012
NZ$M
The following items are specific disclosures required to be made and are included within the earnings statement:
Net periodic pension cost 14 12
Employee related short term costs 1 1,436 1,429
Other long term employee related benefits 67 68
Research and development 3 2
Bad debts written off 7 7
Donations and sponsorships 2 1
Maintenance and repairs 169 167
Operating lease expense 179 180
Other gains and (losses) 2 4 1
Auditors’ fees and expenses payable for:
Statutory audit – KPMG 3 3
Other services – KPMG 3 1 1
Other professional services to other firms 1 2 1 Remuneration for the executive committee included
in the above is disclosed in note 32.2 Other gains and (losses) include the following:
Sale of assets 13 8
Acquisition costs (3)
Insurance proceeds 1
Impairment of assets (2)
Net cost of repairs due to earthquake damage (1)
Net redundancies and restructuring costs (11) (3)
Other 2 1
4 1
3 Fees paid to the auditors during the year for other services are mainly with respect to the half year review, other assurance services and tax compliance work.
Notes to the financial statements continued

49
4 Restructuring and impairment charges – significant items (previously referred to as Unusual items)
There are no items or transactions that the company believes should be separately disclosed as significant items in the year ended June 2013. In the prior year, significant items were as follows:
Fletcher Building Group – June 2012
Acquisition income and
expenses 1
NZ$M
Restructuring costs 2
NZ$M
Intangiblesimpairment 3
NZ$M
Write-off offixed assets 4
NZ$M
Write-off of stock 5
NZ$MTotal
NZ$M
Building Products division 75 4 79
Laminates & Panels division (1) 45 20 10 74
Total restructuring and impairment charges – EBIT (1) 45 75 20 14 153
Tax benefit on above items 6 (7) (4) (6) (4) (21)
Total restructuring and impairment charges – net earnings (1) 38 71 14 10 132
Fletcher Building Group 20121 The group recorded a gain of $4 million arising from the revaluation of its existing 50 percent share in Homapal. In addition the group incurred $3 million
of acquisition costs.2 The group incurred $45 million of restructuring costs in the Laminates & Panels division. $21 million is attributable to the decision to close the Formica
factory in Bilbao, Spain and consolidate operations at the Valencia site. The remaining $24 million was incurred in restructuring the Laminex Australia and New Zealand businesses. .
3 A strategic review of the Australian insulation business was completed during the year ended 30 June 2012. The review identified that medium term earnings prospects had deteriorated, necessitating a reduction in the carrying value of the business. As a result the group wrote off $62 million of goodwill and $13 million of brands. .
4 The group decided to write off a further $3 million of fixed assets for The O’Brien Group Limited and $17 million for Laminex Australia. The Laminex Australia write-offs were a result of product rationalisation initiatives.
5 The group also wrote off $10 million of stock in Laminex Australia as a result of product rationalisation initiatives, and incurred a further $4 million in disposing of surplus stock in Fletcher Insulation Australia.
6 Tax benefit, see note 7.

50
5 Discontinued operationsThere were no discontinued operations in the current or the comparative year.
6 Funding costs
Fletcher Building Group Fletcher Building Limited
Year endedJune 2013
NZ$M
Year endedJune 2012
NZ$M
Year endedJune 2013
NZ$M
Year endedJune 2012
NZ$M
Interest expense
Loans and derivatives 97 101 23 15
Capital notes 38 39
Other 2
Interest income
Subsidiary companies (163) (62)
Cash and deposits (1) (2) (1) 2
134 140 (141) (45)
Plus bank fees, registry and issue expenses 13 12 5 5
147 152 (136) (40)
Included in interest expense is the net settlement of the group’s interest derivatives. This consisted of $100 million of interest income and $110 million of interest expense (2012: $80 million interest income; $86 million interest expense).
For items applying fair value hedges the gains or losses on the hedging instrument and on the hedged item net off to zero.
7 Taxation expense
Fletcher Building Group Fletcher Building Limited
Year endedJune 2013
NZ$M
Year endedJune 2012
NZ$M
Year endedJune 2013
NZ$M
Year endedJune 2012
NZ$M
Earnings before taxation 422 251 278 719
Taxation at 28 cents per dollar 118 70 78 201
Adjusted for:
Higher tax rate in overseas jurisdictions 1
Non assessable income (9) (3) (39) (190)
Non deductible expenses 3 19
Tax losses not recognised 3 11
Benefit of tax losses recognised (5)
Tax in respect of prior years (2) (17)
Other permanent differences (24) (22)
85 58 39 11
Tax on operating profits pre restructuring and impairment charges 85 79 39 11
Tax benefit on restructuring and impairment charges (21)
85 58 39 11
Total current taxation expense 104 47 39 11
Total deferred taxation expense (19) 11
85 58 39 11
Notes to the financial statements continued

51
8 Shareholder tax credits
Fletcher Building Group Fletcher Building Limited
Year endedJune 2013
NZ$M
Year endedJune 2012
NZ$M
Year endedJune 2013
NZ$M
Year endedJune 2012
NZ$M
Imputation credit account
Imputation credits at the beginning of the year 3 1
Taxation paid 34 29
Imputation credits received 1 1 35 32
Imputation credits attached to dividends paid (34) (33) (34) (33)
1 1
Fletcher Building’s practice is to attach imputation credits to the final dividend and the company has until 31 March 2014 to fund any deficiency in its imputation credit account.
Fletcher Building Group Fletcher Building Limited
Year endedJune 2013
A$M
Year endedJune 2012
A$M
Year endedJune 2013
A$M
Year endedJune 2012
A$M
Franking credit account
Franking credits at the beginning of the year 49 25 40
Taxation paid 56
Franking credits received 4 7 6 79
Franking credits attached to dividends paid (41) (39) (41) (39)
12 49 5 40
9 Net earnings per share The diluted net earnings per share calculation uses the weighted average number of shares as determined for basic net earnings per share, adjusted for dilutive securities. Capital notes and options are convertible into the company’s shares and may therefore result in dilutive securities for purposes of determining the diluted net earnings per share. Fletcher Building may, at its option, purchase or redeem the capital notes for cash at the principal amount plus any accrued but unpaid interest.
Fletcher Building Group Fletcher Building Limited
Year endedJune 2013
NZ$M
Year endedJune 2012
NZ$M
Year endedJune 2013
NZ$M
Year endedJune 2012
NZ$M
Numerator
Net earnings 326 185
Numerator for basic earnings per share 326 185
Dilutive capital notes distribution 12
Numerator for diluted net earnings per share 338 185
Denominator (millions of shares)
Denominator for basic net earnings per share 685 681
Conversion of dilutive capital notes 26
Denominator for diluted net earnings per share 711 681

52
10 Dividends
Fletcher Building Group Fletcher Building Limited
Year endedJune 2013
NZ$M
Year endedJune 2012
NZ$M
Year endedJune 2013
NZ$M
Year endedJune 2012
NZ$M
Dividends paid to shareholders 233 231 233 231
233 231 233 231
On 21 August 2013 the directors declared a dividend of 17 cents per share, payable on 16 October 2013.
11 Capital
Reported capital at the beginning of the year 2,603 2,573 2,603 2,573
Issue of shares 25 30 25 30
Reported capital at the end of the year including treasury stock 2,628 2,603 2,628 2,603
Treasury stock (22) (21)
2,606 2,582 2,628 2,603
All ordinary shares are issued and fully paid, and carry equal rights in respect of voting, dividend payments and distribution upon winding up. Costs directly attributable to the issue of new shares are shown as a deduction from the proceeds. Shares held by the trustee of the Fletcher Building executive long-term share scheme are deducted from the group’s capital until the shares vest, are reissued or otherwise disposed of. When such shares do vest, are reissued or otherwise disposed of, any consideration received is included in the group’s equity.
Fletcher Building Group Fletcher Building Limited
Year endedJune 2013
Year endedJune 2012
Year endedJune 2013
Year endedJune 2012
Number of ordinary shares:
Number of shares on issue at the beginning of the year 682,866,936 678,573,570 682,866,936 678,573,570
Shares issued under the dividend reinvestment plan 3,229,491 4,293,366 3,229,491 4,293,366
Total number of shares on issue 686,096,427 682,866,936 686,096,427 682,866,936
Less accounted for as treasury stock (2,998,233) (2,696,181)
683,098,194 680,170,755 686,096,427 682,866,936
Share options:On 1 September 2009, the Company issued 500,000 share options under the executive option scheme. As at 30 June 2013, the exercise price of the share options is $9.72 and is increased annually by the company’s cost of capital, less actual dividends paid. The restrictive period was until 1 September 2012 and the final exercise date is 1 September 2015. On 1 October 2012 the Company issued a further 500,000 options under the executive option scheme. At 30 June 2013 the exercise price of these share options is $6.50. The restrictive period is until 1 October 2015 and the final exercise date is 1 October 2018.
The options carry no dividend or voting rights. The company has calculated the fair value of granting these options and has expensed $0.5 million in respect of the 2009 share options and $0.1 million in respect of the 2012 options to a share option reserve. .
Notes to the financial statements continued
12 Reserve balances
Fletcher Building Group Fletcher Building Limited
June 2013NZ$M
June 2012NZ$M
June 2013NZ$M
June 2012NZ$M
Reserves comprise:
Retained earnings 1,078 985 441 435
Share option reserve 1 1 1 1
Cashflow hedge reserve (31) (53) (34) (37)
Currency translation reserve (55) 56
Pension reserve (80) (151)
913 838 408 399

53
13 Reserve movements
Fletcher Building Group Fletcher Building Limited
Year endedJune 2013
NZ$M
Year endedJune 2012
NZ$M
Year endedJune 2013
NZ$M
Year endedJune 2012
NZ$M
Retained earnings
Retained earnings at the beginning of the year 985 1,031 435 (42)
Net earnings for the year – parent interest 326 185 239 708
Dividends paid during the year (233) (231) (233) (231)
1,078 985 441 435
Share option reserve
Share option reserve at the beginning of the year 1 1 1 1
Arising in the year
1 1 1 1
Cashflow hedge reserve
Cashflow hedge reserve at the beginning of the year (53) (14) (37) (14)
Arising in the year 22 (39) 3 (23)
(31) (53) (34) (37)
Currency translation reserve
Currency translation reserve at the beginning of the year 56 95
Arising in the year (111) (39)
(55) 56
Pension reserve
Pension reserve at the beginning of the year (151) (72)
Arising in the year 73 (79)
Currency translation (2)
(80) (151)
14 Minority equity
Fletcher Building Group Fletcher Building Limited
June 2013NZ$M
June 2012NZ$M
June 2013NZ$M
June 2012NZ$M
Share capital 21 20
Reserves 14 12
35 32
15 Cash and deposits
Cash and bank balances 90 89 9 11
Short-term deposits 33 79 29 66
123 168 38 77

54
16 Debtors
Fletcher Building Group Fletcher Building Limited
June 2013NZ$M
June 2012NZ$M
June 2013NZ$M
June 2012NZ$M
Trade debtors 1,071 1,168
Contract debtors 95 89
Contract retentions 18 27
Less provision for doubtful debts (41) (47)
Trade and contract debtors 1,143 1,237
Other receivables 203 223 26 27
1,346 1,460 26 27
Current 815 906
0 – 30 days over standard terms 255 267
31 – 60 days over standard terms 43 42
61+ days over standard terms 71 69
Provision (41) (47)
Trade and contract debtors 1,143 1,237
17 Stocks
Fletcher Building Group Fletcher Building Limited
June 2013NZ$M
June 2012NZ$M
June 2013NZ$M
June 2012NZ$M
Raw materials 300 338
Work in progress 138 126
Finished goods 856 912
Consumable stores and spare parts 59 58
1,353 1,434
Stock held at cost 1,252 1,351
Stock held at net realisable value 101 83
1,353 1,434
The group also has conditional commitments for the purchase of land to be used for residential construction totalling $192 million (June 2012: $42 million). Delivery of this land is expected to take place in the period to September 2017.
Notes to the financial statements continued
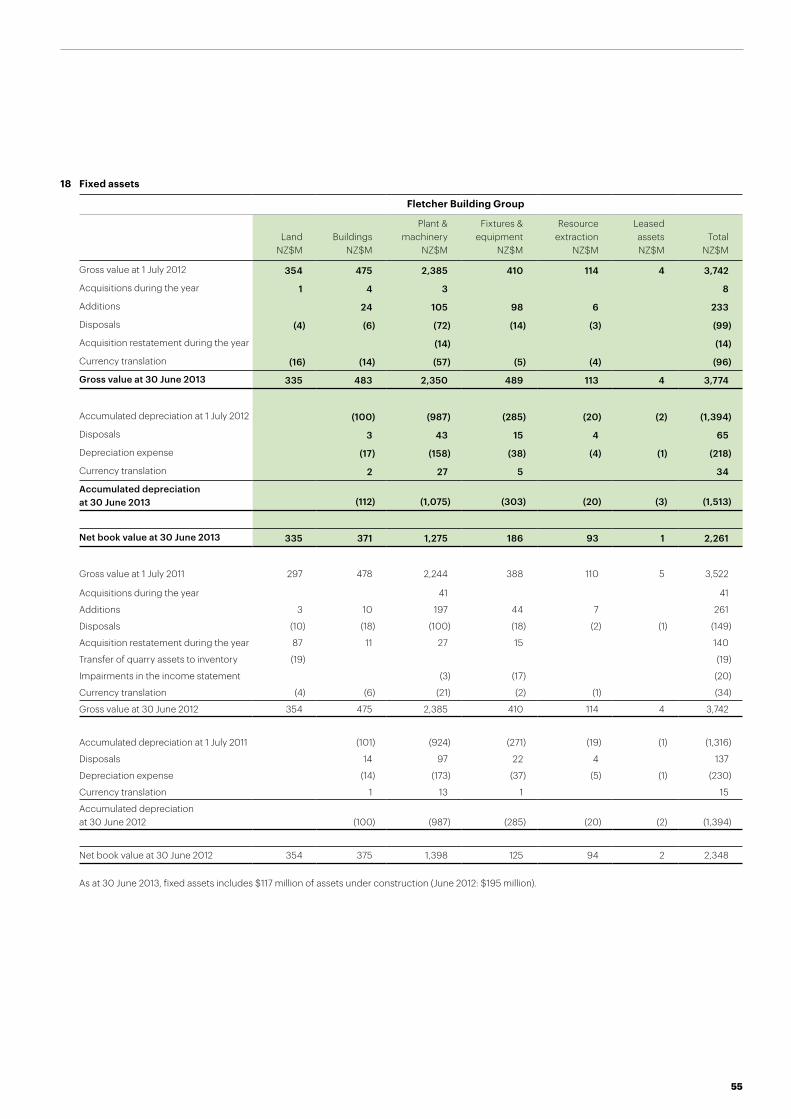
55
18 Fixed assets
Fletcher Building Group
LandNZ$M
BuildingsNZ$M
Plant &machinery
NZ$M
Fixtures & equipment
NZ$M
Resourceextraction
NZ$M
Leased assetsNZ$M
TotalNZ$M
Gross value at 1 July 2012 354 475 2,385 410 114 4 3,742
Acquisitions during the year 1 4 3 8
Additions 24 105 98 6 233
Disposals (4) (6) (72) (14) (3) (99)
Acquisition restatement during the year (14) (14)
Currency translation (16) (14) (57) (5) (4) (96)
Gross value at 30 June 2013 335 483 2,350 489 113 4 3,774
Accumulated depreciation at 1 July 2012 (100) (987) (285) (20) (2) (1,394)
Disposals 3 43 15 4 65
Depreciation expense (17) (158) (38) (4) (1) (218)
Currency translation 2 27 5 34
Accumulated depreciation at 30 June 2013 (112) (1,075) (303) (20) (3) (1,513)
Net book value at 30 June 2013 335 371 1,275 186 93 1 2,261
Gross value at 1 July 2011 297 478 2,244 388 110 5 3,522
Acquisitions during the year 41 41
Additions 3 10 197 44 7 261
Disposals (10) (18) (100) (18) (2) (1) (149)
Acquisition restatement during the year 87 11 27 15 140
Transfer of quarry assets to inventory (19) (19)
Impairments in the income statement (3) (17) (20)
Currency translation (4) (6) (21) (2) (1) (34)
Gross value at 30 June 2012 354 475 2,385 410 114 4 3,742
Accumulated depreciation at 1 July 2011 (101) (924) (271) (19) (1) (1,316)
Disposals 14 97 22 4 137
Depreciation expense (14) (173) (37) (5) (1) (230)
Currency translation 1 13 1 15
Accumulated depreciation at 30 June 2012 (100) (987) (285) (20) (2) (1,394)
Net book value at 30 June 2012 354 375 1,398 125 94 2 2,348
As at 30 June 2013, fixed assets includes $117 million of assets under construction (June 2012: $195 million).

56
19 Goodwill
Fletcher Building Group Fletcher Building Limited
June 2013NZ$M
June 2012NZ$M
June 2013NZ$M
June 2012NZ$M
Goodwill acquired at cost 1,373 1,362
Accumulated currency translation 19 54
Accumulated impairment (173) (173)
Goodwill at the end of the year 1,219 1,243
Goodwill at the beginning of the year 1,243 1,424
Acquired during the year 3 102
Acquisition restatement during the year 8 (220)
Goodwill in subsidiaries sold during the year (1)
Impaired during the year (62)
Currency translation (35)
1,219 1,243
Formica Asia 234 232
Tradelink 223 238
The Laminex Group 178 190
Stramit Corporation 108 116
Iplex New Zealand 105 105
Homapal Plattenwerk GmbH 85 77
Forman Insulation 46 46
Mico Plumbing 44 44
Tasman Insulation New Zealand 43 43
Tasman Sinkware 42 45
Iplex Australia 37 40
Roof Tile Group 23 23
Other subsidiaries 51 44
Goodwill by major subsidiaries 1,219 1,243
Impairment of goodwill
Goodwill has been tested for impairment in June 2013. Each business unit which carries goodwill has prepared a discounted cashflow on a value-in-use basis. They have used their past experience of sales growth, operating costs and margin, and external sources of information where appropriate, to determine their expectations for the future. These cashflow projections are based on the group’s three year strategic plan approved by the directors which has been extended for a further two years. Cashflows beyond the five year period have been extrapolated using estimated terminal growth rates which do not exceed the long term average growth rate for the industries in which the business units operate. The growth rates used range from 2 percent to 3 percent, with the majority of the business units using 2 percent. The cashflows are discounted using a nominal rate of 10 percent after tax, with the exception of Formica which has used 9 percent. This adjustment to the standard rate of 10 percent reflects the risk profile for the countries in which Formica operates. The valuation models used are most sensitive to changes in the terminal year earnings and cashflows.
The group operates in cyclical markets and currently faces uncertain market conditions that make it difficult to predict future profitability. Residential markets are still below long-term averages in many jurisdictions, however, there has been a recent improvement in New Zealand and USA.
The group has identified certain business units where the review indicated the recoverable amount was only marginally in excess of the carrying amount. Management have identified a number of strategies and initiatives to achieve an appropriate improvement in their operating earnings. If this improvement does not eventuate there would be a need for an impairment.
The impairment review confirmed that, for all other business units, there is clear headroom over the carrying value and as such there are no impairment issues necessitating a write-down of goodwill. .
Notes to the financial statements continued

57
20 Intangibles
Fletcher Building Group Fletcher Building Limited
June 2013NZ$M
June 2012NZ$M
June 2013NZ$M
June 2012NZ$M
Brands 504 511
Intangible assets 6 8
510 519
Brands
Brands at the beginning of the year 511 396
Acquisition restatement during the year 14 135
Brands in subsidiaries sold during the year (1)
Impaired during the year (13)
Currency translation (20) (7)
504 511
The Laminex Group 145 155
Formica Corporation including Homapal 140 124
Tradelink 57 61
Stramit Corporation 47 50
Iplex Australia 40 44
Other subsidiaries 75 77
Brands by major subsidiaries 504 511
Brands are considered to have an indefinite useful life as there are no factors which indicate that there is a limit on their capacity to generate foreseeable cashflows. Factors considered before arriving at this conclusion are whether the businesses which own the brands are going concerns, whether there is any evidence of obsolescence due to changes in either technology or regulatory conditions, whether the businesses are trading profitably and whether there are any other market based indications. Brands have been tested for impairment in June 2013 on a value-in-use basis. This exercise confirmed that there are no impairment issues necessitating a write-down.
Intangible assets
Intangible assets acquired at cost 25 25
Currency translation (1) (1)
Accumulated amortisation (18) (16)
Intangible assets at the end of the year 6 8
Intangible assets at the beginning of the year 8 8
Charged to earnings (2)
6 8

58
21 Investments
Fletcher Building Group Fletcher Building Limited
June 2013NZ$M
June 2012NZ$M
June 2013NZ$M
June 2012NZ$M
Investment in associates 137 150
Retirement plan surplus – see note 34 42
Other investments 1
Investment in subsidiary companies 1 5,447 5,429
180 150 5,447 5,429
1 The principal subsidiaries included within investment in subsidiary companies are disclosed in note 33, principal operations.
Carrying amount of associates:
Carrying amount at the beginning of the year 150 209
Acquisition of associates 6
Loans to associates 1 (1)
Equity accounted earnings of associates 21 26
Purchase of controlling interest of Homapal investment (49)
Acquisition restatement during the year (5)
Sale of investment in associates (9)
Currency translation (7) (4)
Dividends from associates (19) (32)
Investment in associates 137 150
Investment by associate:
Wespine Industries Pty Limited 61 67
Dynea Industries WA Pty Limited 19 20
Sims Pacific Metals Limited 20 19
Mt Marrow Blue Metal Quarries Pty Limited 11 10
Mitchell Water Australia Pty Limited 7
Mittagong Sands Pty Limited 6 6
Regional Resources NW Quarrying 4 5
Other 16 16
137 150
Associate information:
Balance sheet information for associates – 100%
Assets 310 351
Liabilities 162 175
Equity 148 176
Equity – Fletcher Building share 64 71
Goodwill acquired at cost 56 63
Plus loans to associates at the end of the year 17 16
Investment in associates 137 150
Equity accounted earnings comprise:
Sales – 100% 525 535
Earnings before taxation – 100% 53 64
Earnings before taxation – Fletcher Building share 26 32
Taxation expense (5) (6)
Earnings after taxation – Fletcher Building share 21 26
Notes to the financial statements continued

59
22 Provisions
Restructuring NZ$M
Construction claims NZ$M
Warranty & environmental
NZ$MOther NZ$M
TotalNZ$M
June 2013 Fletcher Building Group
Carrying amount at the beginning of the year 37 2 43 34 116
Currency translation (1) (1) (2)
Charged to earnings 8 16 20 44
Settled or utilised (33) (1) (15) (16) (65)
Released to earnings (3) (4) (3) (10)
9 1 39 34 83
June 2012 Fletcher Building Group
Carrying amount at the beginning of the year 25 2 43 31 101
Currency translation (1) (1)
Acquired 2 2
Charged to earnings 42 1 19 17 79
Settled or utilised (23) (15) (14) (52)
Released to earnings (6) (1) (4) (2) (13)
37 2 43 34 116
June 2013 Fletcher Building Limited
Carrying amount at the beginning of the year 2 2
Released to earnings (2) (2)
June 2012 Fletcher Building Limited
Carrying amount at the beginning of the year 2 2
2 2
During the year the group utilised $33 million (30 June 2012: $23 million) in respect of restructuring obligations at certain businesses. The remaining balance of restructuring claims are expected to be utilised in the next two years. Construction claims relate to disputes on jobs and provisions in regard to the wind-down of overseas operations and are expected to be utilised over the next two years. Warranty and environmental provisions relate to products sold and services provided and are expected to be utilised over the next three years. Other provisions relate to miscellaneous matters withno individual amounts being significant.
Fletcher Building Group Fletcher Building Limited
June 2013NZ$M
June 2012NZ$M
June 2013NZ$M
June 2012NZ$M
Current portion 63 95 2
Non current portion 20 21
Carrying amount at the end of the year 83 116 2

60
23 Creditors and accruals
Fletcher Building Group Fletcher Building Limited
June 2013NZ$M
June 2012NZ$M
June 2013NZ$M
June 2012NZ$M
Trade creditors 811 890
Contract retentions 31 25
Accrued interest 31 31
Other liabilities 128 131 1 1
Employee entitlements 248 244
Workers' compensation schemes 19 20
1,268 1,341 1 1
Current portion 1,181 1,249 1 1
Non current portion 87 92
Carrying amount at the end of the year 1,268 1,341 1 1
The non current portion of creditors and accruals relates to long service employee entitlement obligations.
24 Contracts
Fletcher Building Group Fletcher Building Limited
June 2013NZ$M
June 2012NZ$M
June 2013NZ$M
June 2012NZ$M
Gross construction work in progress plus margin to date 2,699 1,956
Progress billings (2,801) (2,071)
Work in progress/(money received in advance) (102) (115)
Construction contracts with net work in progress 18 3
Construction contracts with net money received in advance of cost and margin (120) (118)
Carrying amount at the end of the year (102) (115)
Included in sales is $972 million of contract revenue (June 2012: $845 million).
Notes to the financial statements continued
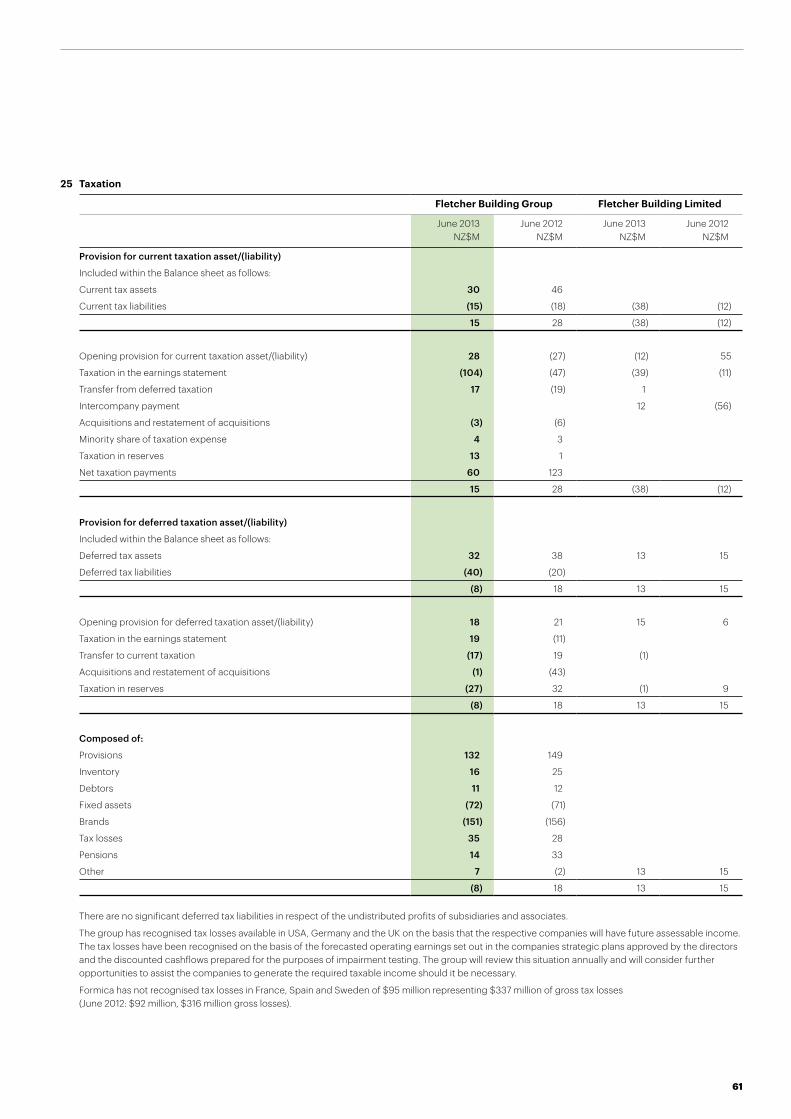
61
25 Taxation
Fletcher Building Group Fletcher Building Limited
June 2013NZ$M
June 2012NZ$M
June 2013NZ$M
June 2012NZ$M
Provision for current taxation asset/(liability)
Included within the Balance sheet as follows:
Current tax assets 30 46
Current tax liabilities (15) (18) (38) (12)
15 28 (38) (12)
Opening provision for current taxation asset/(liability) 28 (27) (12) 55
Taxation in the earnings statement (104) (47) (39) (11)
Transfer from deferred taxation 17 (19) 1
Intercompany payment 12 (56)
Acquisitions and restatement of acquisitions (3) (6)
Minority share of taxation expense 4 3
Taxation in reserves 13 1
Net taxation payments 60 123
15 28 (38) (12)
Provision for deferred taxation asset/(liability)
Included within the Balance sheet as follows:
Deferred tax assets 32 38 13 15
Deferred tax liabilities (40) (20)
(8) 18 13 15
Opening provision for deferred taxation asset/(liability) 18 21 15 6
Taxation in the earnings statement 19 (11)
Transfer to current taxation (17) 19 (1)
Acquisitions and restatement of acquisitions (1) (43)
Taxation in reserves (27) 32 (1) 9
(8) 18 13 15
Composed of:
Provisions 132 149
Inventory 16 25
Debtors 11 12
Fixed assets (72) (71)
Brands (151) (156)
Tax losses 35 28
Pensions 14 33
Other 7 (2) 13 15
(8) 18 13 15
There are no significant deferred tax liabilities in respect of the undistributed profits of subsidiaries and associates.
The group has recognised tax losses available in USA, Germany and the UK on the basis that the respective companies will have future assessable income. The tax losses have been recognised on the basis of the forecasted operating earnings set out in the companies strategic plans approved by the directors and the discounted cashflows prepared for the purposes of impairment testing. The group will review this situation annually and will consider further opportunities to assist the companies to generate the required taxable income should it be necessary.
Formica has not recognised tax losses in France, Spain and Sweden of $95 million representing $337 million of gross tax losses (June 2012: $92 million, $316 million gross losses).

62
26 Borrowings
Fletcher Building Group Fletcher Building Limited
June 2013NZ$M
June 2012NZ$M
June 2013NZ$M
June 2012NZ$M
Bank loans 317 52
Other loans 39 71 15 10
Capital notes 112 75
Foreign currency revaluation on debt derivatives (7) (7) (6) (7)
Current borrowings 144 456 9 55
Bank loans 136 23 23
Private placements 1,246 1,338 37 45
Other loans 57 4 4
Capital notes 322 420 8
Foreign currency revaluation on debt derivatives (6) (14) (7) (14)
Non current borrowings 1,755 1,771 34 62
Borrowings 1,899 2,227 43 117
Less fair value adjustment included in borrowings (28) (81) (41) (53)
Borrowings excluding fair value adjustment 1,871 2,146 2 64
Total available funding 2,690 2,928
Unutilised banking facilities 819 782
The undrawn facilities have a weighted average maturity of 2.4 years (June 2012: 2.9 years).
Notes to the financial statements continued
Negative pledge The group borrows certain funds based on a negative pledge arrangement. The negative pledge includes a cross guarantee between a number of wholly owned subsidiaries and ensures that external senior indebtedness ranks equally in all respects and includes the covenant that security can be given only in very limited circumstances. At 30 June 2013 the group had debt subject to the negative pledge of $1,394 million (June 2012: $1,614 million).
Bank loans At 30 June 2013, the group had a syndicated revolving credit facility on an unsecured, negative pledge and borrowing covenant basis, with ANZ Bank New Zealand, Bank of Tokyo Mitsubishi UFJ, Bank of New Zealand, Commonwealth Bank of Australia, Citibank N.A., The Hong Kong and Shanghai Banking Corporation and Westpac Banking Corporation. The funds under this facility can be borrowed in United States, Australian and New Zealand dollars. The borrowing covenants relate to net debt to EBITDA and interest cover, and at 30 June 2013, and throughout the year, the group was in compliance with the covenants.
Private placements The group has borrowed funds from private investors (primarily US & Japanese based) on an unsecured, negative pledge and borrowing covenant basis. These borrowings comprise NZ$144 million, AU$231 million, US$525 million and YEN10,000 million with maturities between 2015 and 2027. The borrowing covenants relate to net debt to EBITDA and interest cover and at 30 June 2013, and throughout the year, the group was in compliance with the covenants.
Other loans At 30 June 2013, the group had $31 million (June 2012: $45 million) of loans which are secured against the subsidiaries’ own balance sheet or against specific assets and had unsecured loans at 30 June 2013 of $32 million (June 2012: $30 million) some of which are subject to the negative pledge. Other loans includes bank overdrafts, short-term loans, working capital facilities, financial leases, PlaceMakers joint venture funding, amortising loans and discounted receivables.
Foreign currency revaluation on debt derivatives This is the foreign currency revaluation of derivatives that have been specifically taken out to convert the various borrowings to the required currencies. The majority of these instruments have the benefit of the negative pledge and includes cross currency interest rate swaps and foreign exchange forwards.
Capital notes Capital notes are long-term fixed rate unsecured subordinated debt instruments. On each election date, the coupon rate and term to the next election date of that series of the capital notes is reset. Holders may then choose either to keep their capital notes on the new terms or to convert the principal amount and any interest into shares, at approximately 98 percent of the current market price. Instead of issuing shares to holders who choose to convert, Fletcher Building may, at its option, purchase or redeem the capital notes for cash at the principal amount plus any interest. Under the terms of the capital notes, nonpayment of interest is not an act of default although unpaid interest is accrued and is interest bearing at the same rate as the principal of the capital notes. Fletcher Building Limited has covenanted not to pay dividends to its shareholders while interest that is due and payable on these capital notes has not been paid.
The capital notes do not carry voting rights and do not participate in any change in value of the issued shares of Fletcher Building Limited. If the principal amount of the capital notes held at 30 June 2013 were to be converted to Fletcher Building shares, 51 million shares (June 2012: 83 million) would be issued at the share price as at 30 June 2013, of $8.43 (June 2012: $5.87).
As at 30 June 2013 the group held $102 million (30 June 2012: $45 million) of capital notes as treasury stock.
Fair value adjustment included in borrowings This is the revaluation of certain borrowings that have been designated in fair value hedge relationships for changes in benchmark interest rates.
Credit rating The company has not sought and does not hold a credit rating from an accredited rating agency.
.

63
27 Financial instrumentsFinancial risk management overview
Exposures to credit, liquidity, currency, interest rate and commodity price risks arise in the normal course of the group’s business. The principles under which these risks are managed are set out in policy documents approved by the board. The policy documents identify the risks and set out the group’s objectives, policies and processes to measure, manage and report the risks. The policies are reviewed periodically to reflect changes in financial markets and the group’s businesses. Risk management is carried out in conjunction with the group’s central treasury, which ensures compliance with the risk management policies and procedures set by the board.
The group enters into derivative financial instruments to assist in the management of the identified financial risks. The group does not enter into derivative financial instruments for trading or speculative purposes. All derivative transactions entered into are to hedge underlying physical positions arising from normal business activities.
Risks and mitigation
(a) Credit riskTo the extent the group has a receivable from another party there is a credit risk in the event of nonperformance by that counterparty and arises principally from receivables from customers, derivative financial instruments and the investment of cash.
(i) Trade receivablesThe group has a credit policy in place under which customers are individually analysed for credit worthiness and assigned a purchase limit. If no external ratings are available, the group reviews the customers’ financial statements, trade references, bankers’ references and/or credit agencies’ reports to assess credit worthiness. These limits are reviewed on a regular basis. Due to the group’s industry and geographical spread at balance date there were no significant concentrations of credit risks in respect of trade receivables. Please refer to note 16 for debtor aging analysis.
Most goods are sold subject to retention of title clauses, so that in the event of non-payment the group may have a secured claim. The group does not require collateral in respect of trade receivables.
(ii) Derivative financial instruments and the investment of cashThe group enters into derivative financial instruments and invests cash with various counterparties in accordance with established limits as to credit rating and dollar value but does not require collateral or other security except in limited circumstances. In accordance with the established counterparty restrictions, there are no significant concentrations of credit risk in respect of the financial instruments and no loss is expected.
The group has not renegotiated the terms of any financial assets which would otherwise be overdue or impaired. The carrying amount of non-derivative financial assets represents the maximum credit exposure. The carrying amount of derivative financial assets are at their current fair value.
(b) Liquidity riskLiquidity risk is the risk that the group will encounter difficulty in meeting its financial commitments as they fall due. The group manages its liquidity risk by maintaining a target level of undrawn committed credit facilities and a spread of the maturity dates of the group’s debt facilities. The group reviews its liquidity requirements on an on going basis.
The following maturity analysis table sets out the remaining contractual undiscounted cashflows, including estimated interest payments for non-derivative financial liabilities and derivative financial instruments. Creditors and accruals are excluded from this analysis as they are not part of the group’s assessment of liquidity risk. .
Fletcher Building Group – June 2013
Contractual cashflows NZ$M
Up to 1 year NZ$M
1-2 yearsNZ$M
2-5 yearsNZ$M
Over 5 yearsNZ$M
Bank loans 136 136
Capital notes 430 112 74 226 18
Private placements 1,223 549 674
Other loans 95 39 3 52 1
Non-derivative financial liabilities – Principal cashflows 1,884 151 77 963 693
Gross settled derivatives – To pay 617 236 381
Gross settled derivatives – To receive (630) (243) (387)
Debt derivatives financial instruments – Principal cashflows (13) (7) (6)
Total principal cashflows 1,871 144 77 963 687
Contractual interest cashflows 650 120 109 215 206
Total contractual cashflows 2,521 264 186 1,178 893

64
27 Financial instruments continued(b) Liquidity Risk continued
Fletcher Building Group – June 2012
Contractual cashflows NZ$M
Up to 1 yearNZ$M
1-2 yearsNZ$M
2-5 yearsNZ$M
Over 5 yearsNZ$M
Bank loans 340 317 23
Capital notes 487 75 112 236 64
Private placements 1,265 389 876
Other loans 75 71 1 3
Non-derivative financial liabilities – Principal cashflows 2,167 463 113 651 940
Gross settled derivatives – To pay 788 349 32 407
Gross settled derivatives – To receive (809) (356) (39) (414)
Debt derivatives financial instruments – Principal cashflows (21) (7) (7) (7)
Total principal cashflows 2,146 456 106 651 933
Contractual interest cashflows 797 127 112 251 307
Total contractual cashflows 2,943 583 218 902 1,240
Fletcher Building Limited – June 2013Contractual
cashflows NZ$MUp to 1 year
NZ$M1-2 years
NZ$M2-5 years
NZ$MOver 5 years
NZ$M
Other loans 15 15
Non-derivative financial liabilities – Principal cashflows 15 15
Gross settled derivatives – To pay 1,150 236 146 768
Gross settled derivatives – To receive (1,166) (243) (155) (768)
Debt derivatives financial instruments – Principal cashflows (16) (7) (9)
Total principal cashflows (1) 8 (9)
Contractual interest cashflows (6) 8 2 (10) (6)
Total contractual cashflows (7) 16 2 (19) (6)
Fletcher Building Limited – June 2012Contractual
cashflows NZ$MUp to 1 year
NZ$M1-2 years
NZ$M2-5 years
NZ$MOver 5 years
NZ$M
Bank loans 75 52 23
Other loans 10 10
Non-derivative financial liabilities – Principal cashflows 85 62 23
Gross settled derivatives – To pay 1,254 348 32 52 822
Gross settled derivatives – To receive (1,267) (355) (40) (50) (822)
Debt derivatives financial instruments – Principal cashflows (13) (7) (8) 2
Total principal cashflows 72 55 (8) 25
Contractual interest cashflows 25 9 2 (24) 38
Total contractual cashflows 97 64 (6) 1 38
Notes to the financial statements continued
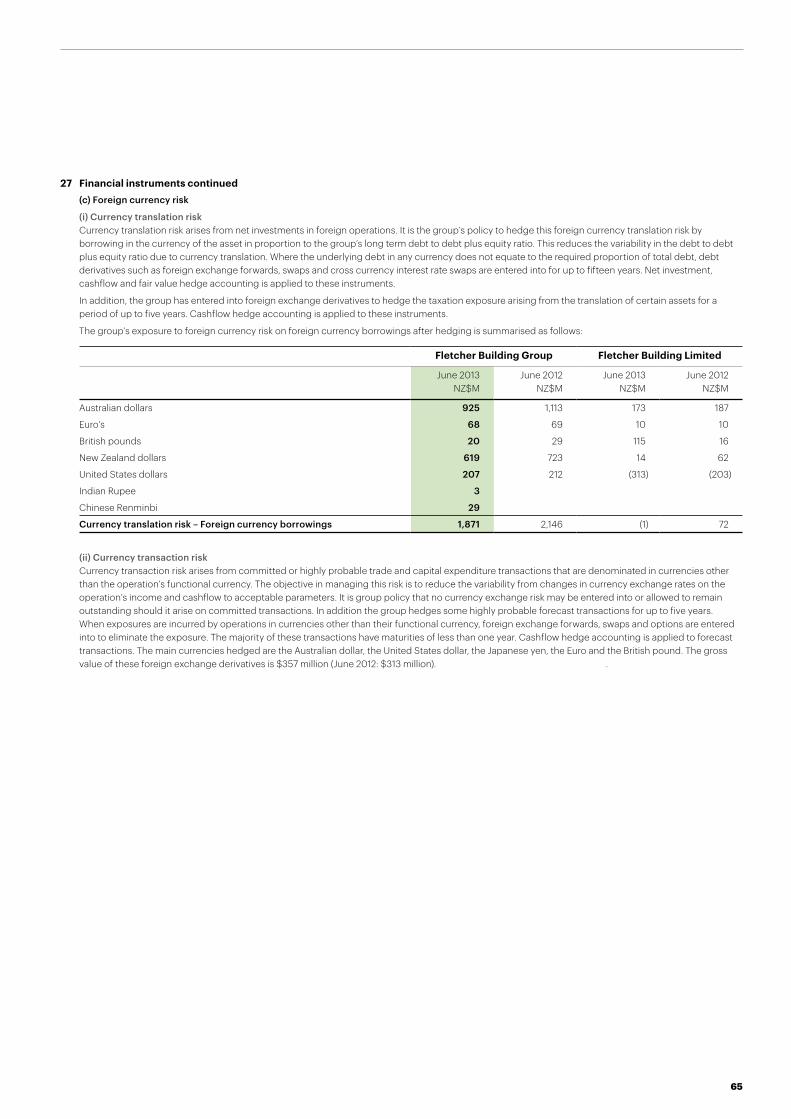
65
27 Financial instruments continued(c) Foreign currency risk
(i) Currency translation riskCurrency translation risk arises from net investments in foreign operations. It is the group’s policy to hedge this foreign currency translation risk by borrowing in the currency of the asset in proportion to the group’s long term debt to debt plus equity ratio. This reduces the variability in the debt to debt plus equity ratio due to currency translation. Where the underlying debt in any currency does not equate to the required proportion of total debt, debt derivatives such as foreign exchange forwards, swaps and cross currency interest rate swaps are entered into for up to fifteen years. Net investment, cashflow and fair value hedge accounting is applied to these instruments.
In addition, the group has entered into foreign exchange derivatives to hedge the taxation exposure arising from the translation of certain assets for a period of up to five years. Cashflow hedge accounting is applied to these instruments.
The group’s exposure to foreign currency risk on foreign currency borrowings after hedging is summarised as follows:
Fletcher Building Group Fletcher Building Limited
June 2013NZ$M
June 2012NZ$M
June 2013NZ$M
June 2012NZ$M
Australian dollars 925 1,113 173 187
Euro's 68 69 10 10
British pounds 20 29 115 16
New Zealand dollars 619 723 14 62
United States dollars 207 212 (313) (203)
Indian Rupee 3
Chinese Renminbi 29
Currency translation risk – Foreign currency borrowings 1,871 2,146 (1) 72
(ii) Currency transaction riskCurrency transaction risk arises from committed or highly probable trade and capital expenditure transactions that are denominated in currencies other than the operation’s functional currency. The objective in managing this risk is to reduce the variability from changes in currency exchange rates on the operation’s income and cashflow to acceptable parameters. It is group policy that no currency exchange risk may be entered into or allowed to remain outstanding should it arise on committed transactions. In addition the group hedges some highly probable forecast transactions for up to five years. When exposures are incurred by operations in currencies other than their functional currency, foreign exchange forwards, swaps and options are entered into to eliminate the exposure. The majority of these transactions have maturities of less than one year. Cashflow hedge accounting is applied to forecast transactions. The main currencies hedged are the Australian dollar, the United States dollar, the Japanese yen, the Euro and the British pound. The gross value of these foreign exchange derivatives is $357 million (June 2012: $313 million). .

66
27 Financial instruments continued(d) Interest rate riskInterest rate risk is the risk that the value of a financial instrument or cashflows associated with the instrument will change due to changes in market interest rates and arises primarily from the group’s interest bearing borrowings. The group manages the fixed interest rate component of its debt and capital notes obligations and aims to maintain this ratio between 40 to 70 percent, and at 30 June 2013, the group was slightly above the upper limit at 74% fixed (June 2012: 67% fixed). The position in this range is managed depending upon underlying interest rate exposures and economic conditions. Cross currency interest rate, interest rate swaps, forward rate agreements and options are entered into to manage this position. The financial instruments entered into are in Australian dollars, United States dollars, Euros, Japanese Yen and New Zealand dollars, and will mature over the next fourteen years.
Hedge accounting is applied on these instruments for floating-to-fixed instruments as cashflow hedges or for fixed-to-floating as fair value hedges.
Interest rate repricingThe following tables set out the interest rate repricing profile of interest bearing financial assets and liabilities. The group’s overall weighted average interest rate excluding fees is 6.65% (June 2012: 6.65%).
Fletcher Building Group Fletcher Building LimitedJune 2013
NZ$MJune 2012
NZ$MJune 2013
NZ$MJune 2012
NZ$M
Floating 495 702 (377) (343)
Fixed up to 1 year 254 70 143 (5)
Fixed 1-2 years 428 268 354 156
Fixed 2-5 years 491 850 (17) 366
Fixed over 5 years 203 256 (104) (102)
Total financial liabilities 1,871 2,146 (1) 72
Floating financial assets (123) (168) (39) (77)
(e) Commodity price risk
Commodity price risk arises from committed or highly probable trade and capital expenditure transactions that are linked to traded commodities. Where possible the group manages its commodity price risks through negotiated supply contracts and, for certain commodities, by using commodity price swaps and options. The group manages its commodity price risk depending on the underlying exposures, economic conditions and access to active derivatives markets. Currently the group’s guideline is to hedge up to 100 percent of the New Zealand business units’ electricity requirements for up to five years. Cashflow hedge accounting is applied to commodity derivative contracts.
At balance date, the notional value of fixed electricity exposure was as follows:
Fletcher Building Group Fletcher Building LimitedJune 2013
NZ$MJune 2012
NZ$MJune 2013
NZ$MJune 2012
NZ$M
Fixed up to 1 year 8 5 8 5
Fixed 1-2 years 34 35 34 35
Fixed 2-5 years 18 36 18 36
Total 60 76 60 76
NZ$/MWh NZ$/MWh NZ$/MWh NZ$/MWh
Average hedge price 92 96 92 96
Aluminium and copper are also hedged but the volume and values are not material.
Notes to the financial statements continued
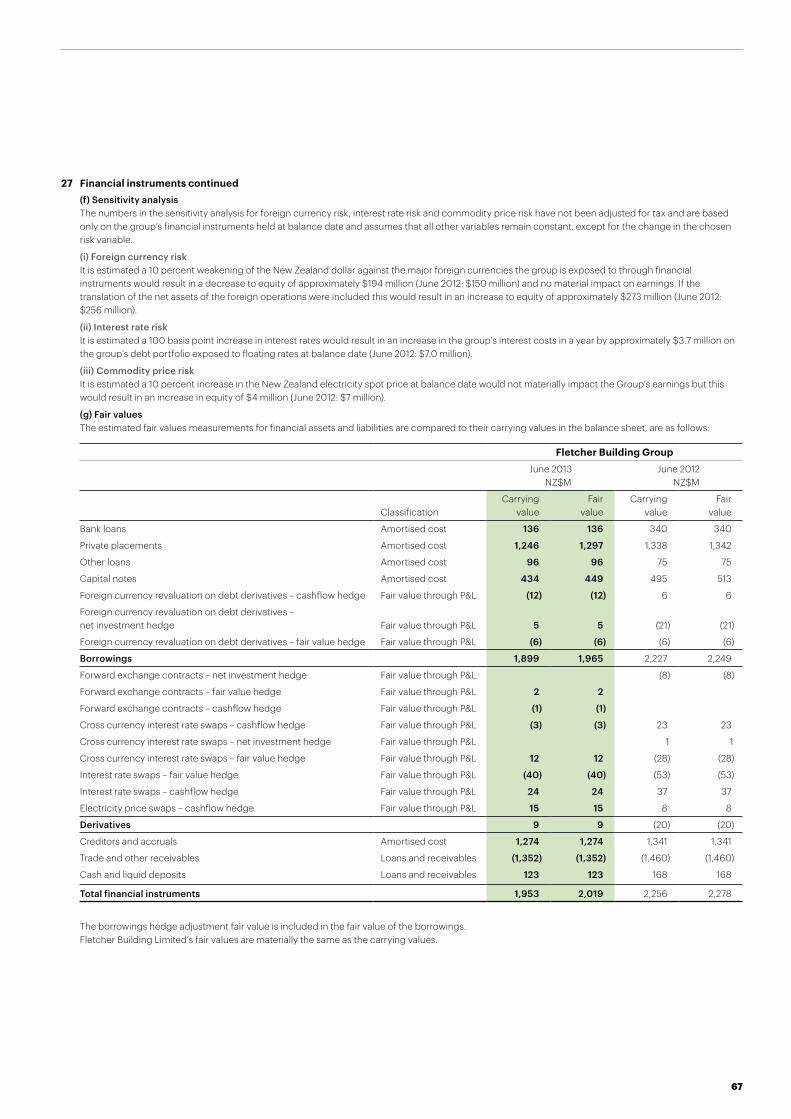
67
27 Financial instruments continued(f) Sensitivity analysisThe numbers in the sensitivity analysis for foreign currency risk, interest rate risk and commodity price risk have not been adjusted for tax and are based only on the group’s financial instruments held at balance date and assumes that all other variables remain constant, except for the change in the chosen risk variable.
(i) Foreign currency riskIt is estimated a 10 percent weakening of the New Zealand dollar against the major foreign currencies the group is exposed to through financial instruments would result in a decrease to equity of approximately $194 million (June 2012: $150 million) and no material impact on earnings. If the translation of the net assets of the foreign operations were included this would result in an increase to equity of approximately $273 million (June 2012: $256 million).
(ii) Interest rate riskIt is estimated a 100 basis point increase in interest rates would result in an increase in the group’s interest costs in a year by approximately $3.7 million on the group’s debt portfolio exposed to floating rates at balance date (June 2012: $7.0 million).
(iii) Commodity price riskIt is estimated a 10 percent increase in the New Zealand electricity spot price at balance date would not materially impact the Group’s earnings but this would result in an increase in equity of $4 million (June 2012: $7 million).
(g) Fair valuesThe estimated fair values measurements for financial assets and liabilities are compared to their carrying values in the balance sheet, are as follows:
Fletcher Building GroupJune 2013 NZ$M
June 2012 NZ$M
ClassificationCarrying
valueFair
valueCarrying
valueFair
value
Bank loans Amortised cost 136 136 340 340
Private placements Amortised cost 1,246 1,297 1,338 1,342
Other loans Amortised cost 96 96 75 75
Capital notes Amortised cost 434 449 495 513
Foreign currency revaluation on debt derivatives – cashflow hedge Fair value through P&L (12) (12) 6 6
Foreign currency revaluation on debt derivatives – net investment hedge Fair value through P&L 5 5 (21) (21)
Foreign currency revaluation on debt derivatives – fair value hedge Fair value through P&L (6) (6) (6) (6)
Borrowings 1,899 1,965 2,227 2,249
Forward exchange contracts – net investment hedge Fair value through P&L (8) (8)
Forward exchange contracts – fair value hedge Fair value through P&L 2 2
Forward exchange contracts – cashflow hedge Fair value through P&L (1) (1)
Cross currency interest rate swaps – cashflow hedge Fair value through P&L (3) (3) 23 23
Cross currency interest rate swaps – net investment hedge Fair value through P&L 1 1
Cross currency interest rate swaps – fair value hedge Fair value through P&L 12 12 (28) (28)
Interest rate swaps – fair value hedge Fair value through P&L (40) (40) (53) (53)
Interest rate swaps – cashflow hedge Fair value through P&L 24 24 37 37
Electricity price swaps – cashflow hedge Fair value through P&L 15 15 8 8
Derivatives 9 9 (20) (20)
Creditors and accruals Amortised cost 1,274 1,274 1,341 1,341
Trade and other receivables Loans and receivables (1,352) (1,352) (1,460) (1,460)
Cash and liquid deposits Loans and receivables 123 123 168 168
Total financial instruments 1,953 2,019 2,256 2,278
The borrowings hedge adjustment fair value is included in the fair value of the borrowings.Fletcher Building Limited’s fair values are materially the same as the carrying values.
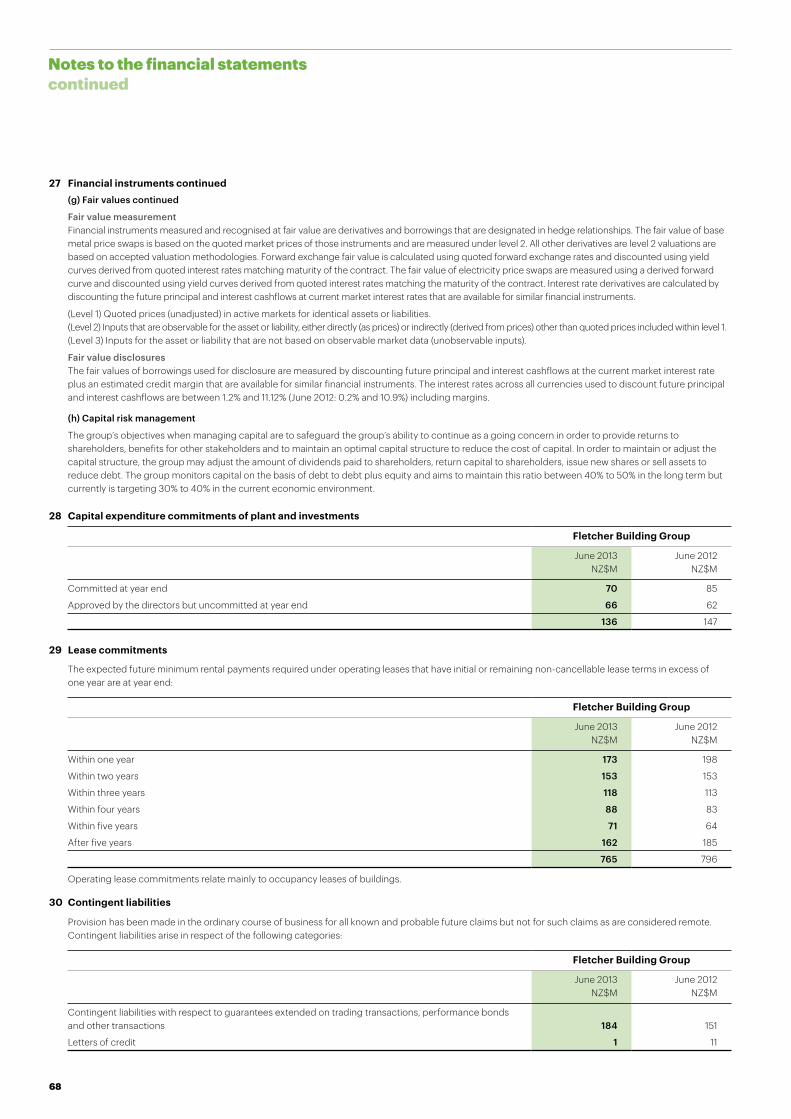
68
27 Financial instruments continued(g) Fair values continued
Fair value measurementFinancial instruments measured and recognised at fair value are derivatives and borrowings that are designated in hedge relationships. The fair value of base metal price swaps is based on the quoted market prices of those instruments and are measured under level 2. All other derivatives are level 2 valuations are based on accepted valuation methodologies. Forward exchange fair value is calculated using quoted forward exchange rates and discounted using yield curves derived from quoted interest rates matching maturity of the contract. The fair value of electricity price swaps are measured using a derived forward curve and discounted using yield curves derived from quoted interest rates matching the maturity of the contract. Interest rate derivatives are calculated by discounting the future principal and interest cashflows at current market interest rates that are available for similar financial instruments.
(Level 1) Quoted prices (unadjusted) in active markets for identical assets or liabilities. (Level 2) Inputs that are observable for the asset or liability, either directly (as prices) or indirectly (derived from prices) other than quoted prices included within level 1.(Level 3) Inputs for the asset or liability that are not based on observable market data (unobservable inputs).
Fair value disclosures The fair values of borrowings used for disclosure are measured by discounting future principal and interest cashflows at the current market interest rate plus an estimated credit margin that are available for similar financial instruments. The interest rates across all currencies used to discount future principal and interest cashflows are between 1.2% and 11.12% (June 2012: 0.2% and 10.9%) including margins.
(h) Capital risk management
The group’s objectives when managing capital are to safeguard the group’s ability to continue as a going concern in order to provide returns to shareholders, benefits for other stakeholders and to maintain an optimal capital structure to reduce the cost of capital. In order to maintain or adjust the capital structure, the group may adjust the amount of dividends paid to shareholders, return capital to shareholders, issue new shares or sell assets to reduce debt. The group monitors capital on the basis of debt to debt plus equity and aims to maintain this ratio between 40% to 50% in the long term but currently is targeting 30% to 40% in the current economic environment.
30 Contingent liabilities
Provision has been made in the ordinary course of business for all known and probable future claims but not for such claims as are considered remote. Contingent liabilities arise in respect of the following categories:
Fletcher Building Group
June 2013NZ$M
June 2012NZ$M
Contingent liabilities with respect to guarantees extended on trading transactions, performance bonds and other transactions 184 151
Letters of credit 1 11
28 Capital expenditure commitments of plant and investments
Fletcher Building Group
June 2013NZ$M
June 2012NZ$M
Committed at year end 70 85
Approved by the directors but uncommitted at year end 66 62
136 147
29 Lease commitments
The expected future minimum rental payments required under operating leases that have initial or remaining non-cancellable lease terms in excess of one year are at year end:
Fletcher Building Group
June 2013NZ$M
June 2012NZ$M
Within one year 173 198
Within two years 153 153
Within three years 118 113
Within four years 88 83
Within five years 71 64
After five years 162 185
765 796
Operating lease commitments relate mainly to occupancy leases of buildings.
Notes to the financial statements continued

69
31 InsuranceThe company monitors its capacity to retain otherwise insurable losses. The directors believe that the group’s risk management programmes are adequate to protect its assets and earnings against losses incurred. Based on past experience, the company does not anticipate that future losses within these levels would have a significant impact on the group’s financial position or performance. In general terms, the group-wide insurance policies are with insurers having a Standard & Poor’s A- grade rating (or equivalent) or better.
June 2013$M
June 2012$M
The following risks are insured at 1 July 2013 in respect of each event up to a maximum of:
Public and product liability US$150 US$150
Loss or damage to group property including business interruption NZ$1,000 NZ$1,000
Marine public liability NZ$50 NZ$50
Public liability resulting from construction activities NZ$100 NZ$100
Contract works – separate covers are arranged for each contract where the insured value exceeds NZ$20M; annual policy is in place for lower value contracts. NZ$20 NZ$20
32 Related party transactions
Fletcher Building Group Fletcher Building Limited
June 2013NZ$M
June 2012NZ$M
June 2013NZ$M
June 2012NZ$M
Fletcher Building group
Trading activities with related parties:
Purchase of scrap metal from Sims Pacific Metals Limited 112 124
Amounts owing relating to the purchase of scrap metal from Sims Pacific MetalsLimited, and is included within creditors 4 4
Purchase of raw materials from Wespine Industries Pty Limited and Dynea Industries WA Pty Limited 32 49
Amounts owing relating to the purchase of raw materials from Wespine Industries Pty Limited and Dynea Industries WA Pty Limited, and is included within creditors 2 3
Purchase of materials from Dongwha Pattina NZ Limited 14 14
Sale of materials to Dongwha Pattina NZ Limited 1
Purchase of materials from Mt Marrow Blue Metal Quarries Pty Limited 2 2
Key management personnel compensation
Directors fees 2 2
Executive committee remuneration paid, payable or provided for:
Short term employee benefits 15 11
Termination benefits 2
Long term incentive payments 2 3
Fletcher Building Limited
Dividend income received from subsidiary companies 140 677
Term receivable owing from subsidiary companies 1 864 781
Liability owing to subsidiary companies 2 7 148
Liability owing to subsidiary companies 3 955 838
Liability owing to subsidiary company 4 2,300 2,222
1 These unsecured advances represent long term funding even though they are for no fixed term and bear interest at 10.2 percent. 2 These unsecured advances represent long term funding even though they are for no fixed term and bear interest at 7.5 percent.3 These unsecured advances represent long term funding even though they are for no fixed term and bear interest at 6.7 percent. 4 The unsecured advance represents long term funding even though it is for no fixed term and is non interest bearing.
Fletcher Building Limited is the holding company of the Fletcher Building group. Fletcher Building Limited has a relationship with each of its subsidiaries, associates and joint ventures. A full list of all the subsidiaries of the group is included in the Regulatory Disclosures section of the annual report.
Fletcher Building Retirement Plan
As at 30 June 2013, Fletcher Building Nominees Limited (the New Zealand retirement plan) held $7,300,000 of shares and $13,500,000 of capital notes in Fletcher Building, (June 2012: $6,000,000 of shares; $18,500,000 of capital notes) in respect of economic interests that members of the retirement plan have in Fletcher Building shares and capital notes.

70
33 Principal operations
Fletcher Building Limited is the holding company of the Fletcher Building group. The principal subsidiaries and associates, as at 30 June 2013, are outlined below:
Country of domicile % Holding Principal activity
Principal subsidiaries
Fletcher Building Holdings Limited NZ 100 Holding company
Fletcher Building Holdings New Zealand Limited NZ 100 Holding company
Fletcher Building Products Limited NZ 100 Building products
Fletcher Concrete and Infrastructure Limited NZ 100 Concrete products
Fletcher Distribution Limited NZ 100 Merchandising
Fletcher Steel Limited NZ 100 Steel production
Fletcher Residential Limited NZ 100 Housing
The Fletcher Construction Company Limited NZ 100 Construction
Winstone Wallboards Limited NZ 100 Gypsum plasterboard
Fletcher Property Limited NZ 100 Property management
PlaceMakers subsidiaries – wholly owned NZ 100 Retail
PlaceMakers subsidiaries – joint venture ownership NZ 50.1 Retail
Fletcher Building Industries Limited NZ 100 Holding company
Tasman Insulation New Zealand Limited NZ 100 Insulation
AHI Roofing Limited NZ 100 Roofing
Forman Group Limited NZ 100 Insulation
Crane Distribution NZ Limited NZ 100 Retail
Fletcher Building (Fiji) Limited Fiji 100 Infrastructure
Laminex Group Limited Australia 100 Building products
Fletcher Building (Australia) Pty Limited Australia 100 Holding company
Tasman Insulation Pty Limited Australia 100 Insulation
Tasman Sinkware Pty Limited Australia 100 Sinks
Rocla Pty Limited Australia 100 Concrete products
Stramit Corporation Pty Limited Australia 100 Steel production
Insulation Solutions Pty Limited Australia 100 Insulation
Crane Group Limited Australia 100 Holding company
Crane Distribution Limited Australia 100 Retail
Hudson Building Supplies Pty Limited Australia 100 Retail
Iplex Pipelines Australia Pty Limited Australia 100 Building products
Kingston Bridge Engineering Pty Limited Australia 100 Building products
Australian Construction Products Pty Limited Australia 100 Construction
Fletcher Construction (Solomon Islands) Limited Solomon Islands 100 Construction
Fletcher Morobe Construction Pty Limited PNG 100 Construction
Fletcher Building Netherlands B.V. Netherlands 100 Finance
Notes to the financial statements continued

71
33 Principal operations continued
Country of domicile % Holding Principal activity
Tasman Investments (Netherlands Antilles) N.V. Neth Antilles 100 Finance
Decra Roofing Systems Inc. United States 100 Roofing
Formica Corporation United States 100 Building products
Formica Canada Inc. Canada 100 Building products
Formica Limited United Kingdom 100 Building products
Formica S.A. Spain 100 Building products
Shanghai Formica Decorative Material Co. Ltd China 100 Building products
Formica IKI Oy Finland 100 Building products
Formica Scandinavian AB Sweden 100 Building products
Formica (Thailand) Co., Ltd Thailand 100 Building products
Homapal Plattenwerk GmbH & Co. KG. Germany 100 Building products
Formica Laminates (India) Pte Limited India 100 Building products
Associates
Wespine Industries Pty Limited Australia 50 Saw miller
Dynea Industries WA Pty Limited Australia 50 Building products
Mt Marrow Blue Metal Quarries Pty Limited Australia 50 Quarrying
Mittagong Sands Pty Limited Australia 50 Quarrying
Regional Resources NW Quarrying Australia 50 Quarrying
Sims Pacific Metals Limited NZ 50 Metal recycling
Dongwha Pattina NZ Limited NZ 20 Building products
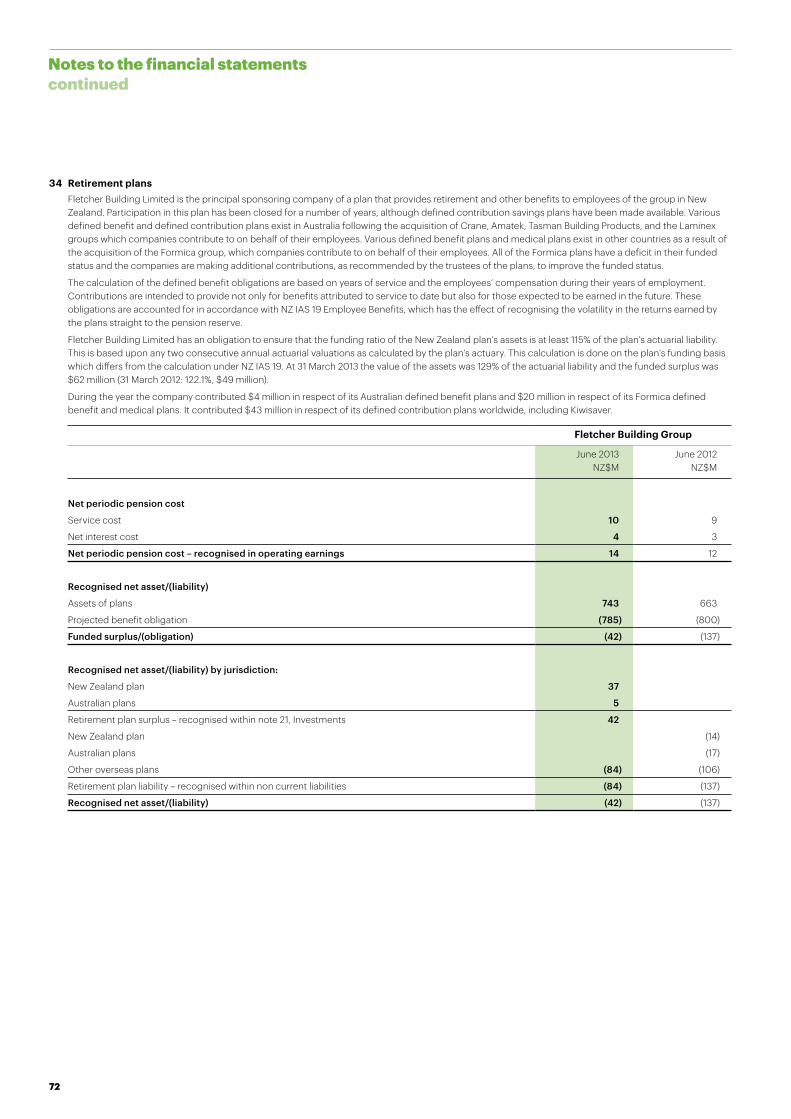
72
34 Retirement plansFletcher Building Limited is the principal sponsoring company of a plan that provides retirement and other benefits to employees of the group in New Zealand. Participation in this plan has been closed for a number of years, although defined contribution savings plans have been made available. Various defined benefit and defined contribution plans exist in Australia following the acquisition of Crane, Amatek, Tasman Building Products, and the Laminex groups which companies contribute to on behalf of their employees. Various defined benefit plans and medical plans exist in other countries as a result of the acquisition of the Formica group, which companies contribute to on behalf of their employees. All of the Formica plans have a deficit in their funded status and the companies are making additional contributions, as recommended by the trustees of the plans, to improve the funded status.
The calculation of the defined benefit obligations are based on years of service and the employees’ compensation during their years of employment. Contributions are intended to provide not only for benefits attributed to service to date but also for those expected to be earned in the future. These obligations are accounted for in accordance with NZ IAS 19 Employee Benefits, which has the effect of recognising the volatility in the returns earned by the plans straight to the pension reserve.
Fletcher Building Limited has an obligation to ensure that the funding ratio of the New Zealand plan’s assets is at least 115% of the plan’s actuarial liability. This is based upon any two consecutive annual actuarial valuations as calculated by the plan’s actuary. This calculation is done on the plan’s funding basis which differs from the calculation under NZ IAS 19. At 31 March 2013 the value of the assets was 129% of the actuarial liability and the funded surplus was $62 million (31 March 2012: 122.1%, $49 million).
During the year the company contributed $4 million in respect of its Australian defined benefit plans and $20 million in respect of its Formica defined benefit and medical plans. It contributed $43 million in respect of its defined contribution plans worldwide, including Kiwisaver.
Fletcher Building Group
June 2013NZ$M
June 2012NZ$M
Net periodic pension cost
Service cost 10 9
Net interest cost 4 3
Net periodic pension cost – recognised in operating earnings 14 12
Recognised net asset/(liability)
Assets of plans 743 663
Projected benefit obligation (785) (800)
Funded surplus/(obligation) (42) (137)
Recognised net asset/(liability) by jurisdiction:
New Zealand plan 37
Australian plans 5
Retirement plan surplus – recognised within note 21, Investments 42
New Zealand plan (14)
Australian plans (17)
Other overseas plans (84) (106)
Retirement plan liability – recognised within non current liabilities (84) (137)
Recognised net asset/(liability) (42) (137)
Notes to the financial statements continued

73
34 Retirement plans continued
Fletcher Building Group
June 2013NZ$M
June 2012NZ$M
Movement in recognised net asset
Recognised net asset/(liability) at the beginning of the year as previously reported 45 35
Change in accounting policy (182) (87)
Recognised net asset/(liability) at the beginning of the year as restated (137) (52)
Currency translation (1)
Actuarial movements for the year 85 (95)
Net periodic pension cost (14) (12)
Employer contributions 24 23
Recognised net asset/(liability) (42) (137)
Assets of the plans
Assets of plans at the beginning of the year 663 690
Actual return on assets 113 1
Total contributions 29 29
Benefit payments (53) (55)
Settlements and curtailments (5)
Currency translation (9) 3
743 663
Assets of the plans consist of:
Australasian equities 80 76
International equities 307 257
Property 35 34
Bonds 282 261
Cash and short term deposits 14 9
Other assets 25 26
743 663
Projected benefit obligation
Projected benefit obligation as at the beginning of the year (800) (742)
Service cost (10) (9)
Interest cost (28) (34)
Member contributions (5) (6)
Actuarial gain/(loss) arising on movements in the discount rate (15) (79)
Actuarial gain/(loss) arising on changes in financial assumptions 15
Actuarial gain/(loss) arising on other assumptions – experience adjustments (4) 13
Benefit payments 53 55
Settlements and curtailments 5
Currency translation 9 (3)
(785) (800)

74
34 Retirement plans continuedAssumptions used
The following table provides the weighted average assumptions used to develop the net periodic pension cost and the actuarial present value of projected benefit obligations for the group’s plans:
Fletcher Building Group
2013%
2012%
Assumed discount rate on benefit obligations 4.14 3.36
Annual rate of increase in future compensation levels 2.70 3.26
Expected returns on plan assets have been determined by the independent actuaries as the weighted average of the expected return after tax and investment fees for each asset class by the target allocation of assets to each class.
The group expects to contribute $21 million to its Australian and other overseas defined benefit plans during the year to 30 June 2014.
35 Share based paymentsExecutive share schemes
The group has implemented a long-term cash based incentive scheme targeted at the executives most able to influence the results of the group, with an agreed percentage of any cash received to be invested in purchasing the company’s shares.
The executive long-term share scheme introduced in 2008 allows group executives to acquire shares in the company at market price. Payment of half of any benefit under the executive performance share scheme is dependent upon the group’s total shareholder return exceeding the 51st percentile of the total shareholder return of a comparative group of companies over a three year restricted period. Payment of the other half of any benefit is dependent upon the group achieving an earnings per share target. In addition, in respect of the benefit which is dependant on total shareholders return, the three year restricted period is automatically extended for up to one year if total shareholders return is less than the 51st percentile. Executives can elect to extend the restricted period for up to one year if total shareholders return is between the 51st and 75th percentile. No extension is permitted for the benefit which is dependant upon achieving an earnings per share target.
The group provides interest free loans to executives, who instruct the trustee to purchase shares on their behalf. The shares purchased by executives are held by the trustee with executives entitled to vote and receive dividends, the proceeds of which are used to repay the interest free loan.
At the end of the restricted period the group will pay a bonus to the executives to the extent the performance targets have been met, sufficient for the executives to repay the balance of the interest free loan on those shares which vest. The shares upon which performance targets have been met will then fully vest to the executives. The loan owing on shares upon which performance targets have not been met (the forfeited shares) will be novated from the executives to the trustee and will be fully repaid by the transfer of the forfeited shares. The receivable from the executives, which is secured only against the shares held in the company, has been accounted for under the treasury stock method and deducted from paid up capital.
The following are details in regards to the share schemes:
2012 Scheme 2011 Scheme 2010 Scheme 2009 Scheme
Grant date 1 October2012
1 October2011
1 October2010
1 October2009
Number of shares granted 1,542,549 1,340,033 1,019,011 811,927
Market price per share at grant date $6.87 $7.43 $8.32 $8.23
Total consideration paid $10,597,312 $9,956,445 $8,478,172 $6,682,159
Vesting date 30 September2015
30 September2014
30 September2013
30 September2012
Maximum bonus payable – expensed over three years $19,317,505 $17,962,298 $15,305,364 $13,063,404
Number of shares:
Number of shares originally granted 1,542,549 1,340,033 1,019,011 811,927
Less forfeited over life of scheme (96,834) (397,499) (350,871) (536,758)
Less vested over life of scheme (13,224) (2,186) (55,700) (262,665)
Number of shares held at 30 June 2013 1,432,491 940,348 612,440 12,504
Fletcher Building Group
June 2013NZ$
June 2012 NZ$
Total amount expensed in year for executive performance share schemes 13,617,241 12,133,319
Liability recognised at year end for bonus payable 26,290,102 20,002,557
Notes to the financial statements continued

75
36 Segmental information
Industry segmentsYear ended
June 2013NZ$M
June 2012NZ$M
June 2013NZ$M
June 2012NZ$M
Gross sales Gross sales External sales External sales
Building Products 1,474 1,517 1,350 1,390
Construction 1,201 1,046 1,193 1,040
Distribution 2,161 2,300 2,141 2,261
Infrastructure 2,373 2,514 2,095 2,299
Laminates & Panels 1,761 1,882 1,738 1,849
Other 7 6
Group 8,977 9,265 8,517 8,839
less intersegment sales (460) (426)
Group external sales 8,517 8,839 8,517 8,839
Operating earnings (EBIT)
Operating earnings (EBIT)
Significant items in operating earnings
Significant items in operating earnings
Building Products 122 30 (79)
Construction 87 50
Distribution 50 65
Infrastructure 222 209
Laminates & Panels 120 65 (74)
Other (32) (16)
Group 569 403 (153)
Depreciation and amortisation expense
Depreciation and amortisation expense
Capital expenditure including acquisitions
Capital expenditure including acquisitions
Building Products 37 38 24 38
Construction 8 11 5 11
Distribution 21 21 17 14
Infrastructure 90 91 77 131
Laminates & Panels 60 66 118 162
Other (including debt and taxation) 4 3 5 7
Group 220 230 246 363
Funds* Funds*
Building Products 770 789
Construction 69 109
Distribution 703 816
Infrastructure 1,841 1,974
Laminates & Panels 1,788 1,743
Other (including debt and taxation) (1,617) (1,979)
Group 3,554 3,452
* Funds represent the external assets and liabilities of the group and are used for internal reporting purposes.

76
36 Segmental information continued
June 2013NZ$M
June 2012NZ$M
June 2013NZ$M
June 2012NZ$M
Geographic segments Year ended
External sales External sales Funds* Funds*
New Zealand 3,832 3,642 1,682 1,730
Australia 3,640 4,139 2,541 2,740
North America 396 396 238 234
Asia 255 256 436 372
Europe 307 318 291 238
Other (including debt and taxation) 87 88 (1,634) (1,862)
Group 8,517 8,839 3,554 3,452
Operating earnings (EBIT)
Operating earnings (EBIT)
Significant items in operating earnings
Significant items in operating earnings
New Zealand 286 198 (9)
Australia 203 135 (124)
North America 40 26
Asia 40 40
Europe (8) (7) (20)
Other 8 11
Group 569 403 (153)
* Funds represent the net external assets and liabilities of the group and are used for internal reporting purposes.
During the year the Steel division was reorganised, with the long steel and distribution businesses incorporated into the Infrastructure Products division, and the coated steel businesses incorporated into the Building Products division.
Additionally, the Crane division was reorganised, with the Iplex pipelines and Crane Copper Tube businesses incorporated into the Infrastructure Products division. The Crane distribution businesses, Tradelink, Hudson and Mico have been consolidated with the PlaceMakers business as a Distribution division.
Prior period data has been restated.
Notes to the financial statements continued
77
TO ThE ShAREhOLDERS OF FLETChER BUILDING LIMITED
Report on the company and group financial statementsWe have audited the accompanying financial statements on pages 38 to 76 of Fletcher Building Limited (‘’the company’’) and the group, comprising the company and its subsidiaries. The financial statements comprise the balance sheets as at 30 June 2013, the earnings statements and statements of comprehensive income, movements in equity and cashflows for the year then ended, and a summary of significant accounting policies and other explanatory information, for both the company and the group.
Directors’ responsibility for the company and group financial statementsThe directors are responsible for the preparation of company and group financial statements in accordance with generally accepted accounting practice in New Zealand that give a true and fair view of the matters to which they relate, and for such internal control as the directors determine is necessary to enable the preparation of company and group financial statements that are free from material misstatement whether due to fraud or error.
Auditor’s responsibilityOur responsibility is to express an opinion on these company and group financial statements based on our audit. We conducted our audit in accordance with International Standards on Auditing (New Zealand). Those standards require that we comply with ethical requirements and plan and perform the audit to obtain reasonable assurance about whether the company and group financial statements are free from material misstatement.
An audit involves performing procedures to obtain audit evidence about the amounts and disclosures in the company and group financial statements. The procedures selected depend on the auditor’s judgement, including the assessment of the risks of material misstatement of the financial statements, whether due to fraud or error. In making those risk assessments, the auditor considers internal control relevant to the company and group’s preparation of the financial statements that give a true and fair view of the matters to which they relate in order to design audit procedures that are appropriate in the circumstances, but not for the purpose of expressing an opinion on the effectiveness of the company and group’s internal control. An audit also includes evaluating the appropriateness of accounting policies used and the reasonableness of accounting estimates, as well as evaluating the presentation of the financial statements.
We believe that the audit evidence we have obtained is sufficient and appropriate to provide a basis for our audit opinion.
Our firm has also provided other services to the company and group in relation to taxation and other assurance services. Partners and employees of our firm may also deal with the company and group on normal terms within the ordinary course of trading activities of the business of the company and group. These matters have not impaired our independence as auditor of the company and group. The firm has no other relationship with, or interest in, the company and group.
OpinionIn our opinion the financial statements on pages 38 to 76:
■ comply with generally accepted accounting practice in New Zealand;
■ give a true and fair view of the financial position of the company and the group as at 30 June 2013 and of the financial performance and cashflows of the company and the group for the year then ended.
Report on other legal and regulatory requirementsIn accordance with the requirements of sections 16(1)(d) and 16(1)(e) of the Financial Reporting Act 1993, we report that:
■ we have obtained all the information and explanations that we have required; and
■ in our opinion, proper accounting records have been kept by Fletcher Building Limited as far as appears from our examination of those records.
21 August 2013KPMG Auckland, New Zealand
Independent auditor’s report

78
June 2013
June 2012
June 2011
June 2010
June 2009
June 2008
June 2007
June 2006
June 2005
June 2004
Notes 5 4 3 2 1
NZ$M NZ$M NZ$M NZ$M NZ$M NZ$M NZ$M NZ$M NZ$M NZ$M
Financial performance
Operating sales/revenue 8,517 8,839 7,416 6,799 7,103 7,091 5,926 5,520 4,636 3,958
Operating earnings (EBIT) 569 403 492 521 159 768 703 675 612 460
Net earnings 326 185 283 272 (46) 467 484 379 347 240
Cashflow from operations 559 448 402 522 533 434 483 560 479 424
Earnings per share – basic (cents per share) 47.6 27.2 45.0 44.9 (8.7) 93.2 101.9 81.3 77.6 55.7
Dividends for the period (cents per share) 34.0 34.0 33.0 29.0 38.0 48.5 45.0 40.0 32.0 25.0
Balance sheet
Current assets 2,862 3,112 3,104 2,317 2,255 2,549 2,074 1,699 1,484 1,171
Non current assets 4,241 4,367 4,388 3,397 3,550 3,686 2,359 2,400 2,173 1,611
Total assets 7,103 7,479 7,492 5,714 5,805 6,235 4,433 4,099 3,657 2,782
Current liabilities 1,517 1,936 1,700 1,384 1,313 1,436 1,187 1,207 1,239 818
Non current liabilities 2,032 2,091 2,092 1,307 1,508 2,043 950 1,092 991 918
Total liabilities 3,549 4,027 3,792 2,691 2,821 3,479 2,137 2,299 2,230 1,736
Capital 2,606 2,582 2,553 1,912 1,895 1,364 1,325 970 929 754
Reserves 913 838 1,113 1,077 1,057 1,351 926 786 455 252
Minority equity 35 32 34 34 32 41 45 44 43 40
Total equity 3,554 3,452 3,700 3,023 2,984 2,756 2,296 1,800 1,427 1,046
Total liabilities and equity 7,103 7,479 7,492 5,714 5,805 6,235 4,433 4,099 3,657 2,782
Other financial data
Return on average funds (%) 6 10.8 7.4 10.6 12.7 3.4 19.0 24.8 26.1 29.3 24.7
Return on average equity (%) 7 9.4 5.2 8.2 9.1 (1.6) 19.0 26.0 24.6 29.5 24.3
Gearing (%) 8 33.3 37.4 34.3 26.8 31.1 40.1 22.2 37.1 44.4 43.1
Net tangible assets per share ($) 2.61 2.65 2.71 2.90 2.80 2.90 3.25 2.47 2.11 1.68
Market capitalisation (NZ$M) 5,784 4,009 5,850 4,763 3,967 3,197 6,166 4,296 3,207 1,987
Total shareholders return (%) 9 51 (27) 14 24 14 (43) 42 40 61 33
1 The Tasman Building Products group was acquired on 30 September 2003. The balance sheet at June 2004 has been restated under NZ IFRS. 2 The Amatek Holdings group was acquired on 1 March 2005. The results for June 2005 have been restated under NZ IFRS.3 The Formica Corporation group was acquired on 2 July 2007.4 The Crane group was acquired with an effective acquisition date of 28 March 2011. 5 The June 2012 balance sheet has been restated following revisions to IAS 19 Employee Benefits adopted by the group. 6 EBIT to average funds (net debt and equity less deferred tax asset).7 Net earnings to average shareholders’ funds.8 Net debt (borrowings less cash and deposits) to net debt and equity.9 Share price movement in year and gross dividend received, to opening share price.
Trend statement

79
Regulatory disclosures
Directors’ relevant interests in equity securities at 30 June 2013
Ordinary shares Capital notes
Directly held Held by associated persons Directly held Held by associated persons
M D Adamson 1 587,675 146,288
A J Carter 32,409 150,000
A T Jackson 20,000
J F Judge 88,275 200,000
K D Spargo 25,000
C Tarrant 18,242 1,810
G T Tilbrook 18,000
R G Waters 1,000,093
668,917 1,268,875 350,000
1 Includes 500,000 options over ordinary shares.
Securities dealings by directorsDuring the year, directors disclosed in respect of section 148(2) of the Companies Act 1993 that they (or their associated persons) acquired or disposed of a relevant interest in securities as follows:
Director Number of securities acquired
Number of securities disposed
Consideration $ Date
J F Judge 3 30 $212 17/10/12
M D Adamson 2,261 $15,969 17/10/12
A J Carter 710 5,015 17/10/12
A T Jackson 2,000 $14,360 7/11/12
M D Adamson 500,000 Nil 20/11/12
M D Adamson 146,288 $1,005,000 20/11/12
C Tarrant 1,000 $7,944 28/11/12
C Tarrant 2,000 $17,220 25/02/13
M D Adamson 9,700 $88,561 8/03/13
K D Spargo 5,000 $45,875 6/03/13
G T Tilbrook 6,000 $52,009 19/03/13
J F Judge 3 19 $161 16/04/13
M D Adamson 1,162 $9,851 16/04/13
C Tarrant 242 $2,052 16/04/13
J F Judge 3 65,663 N/A 1/05/13
J F Judge 2,3 200,000 N/A 1/05/13
A J Carter 2,928 $23,411 6/05/13
C Tarrant 3 1,810 N/A 24/06/13
2 Fletcher Building Industries capital notes.3 Non-beneficial interest.

80
Stock exchange listings
The company’s shares are listed on the New Zealand (NZX) and Australian (ASX) stock exchanges.
20 largest shareholders as at 31 July 2013
Name Number of shares % of shares
New Zealand Central Securities Depository Limited 315,721,598 46.02
National Nominees Limited 40,237,542 5.86
JP Morgan Nominees Australia Limited 37,883,726 5.52
HCBC Custody Nominees (Australia) Limited 24,023,090 3.50
RBC Dexia Investor Services Australia Nominees PTY Limited 18,431,837 2.69
Custodial Services limited 15,879,339 2.31
Citicorp Nominees PTY Limited 12,148,050 1.77
BNP Paribas Nominees PTY Limited 9,944,806 1.45
FNZ Custodians Limited 6,906,297 1.01
Forsyth Barr Custodians Limited 5,852,211 0.85
Investment Custodial Services Limited 4,852,572 0.71
Southern Steel Group PTY Limited 3,876,365 0.56
Fletcher Building Share Schemes Limited 2,958,878 0.43
Masfen Securities Limited 2,587,898 0.38
AMP Life Limited 2,252,116 0.33
Fletcher Building Educational Fund Limited 2,069,462 0.30
New Zealand Depository Nominee Limited 1,698,594 0.25
Argo Investments Limited 1,350,701 0.20
UBS Nominees PTY Ltd 1,330,000 0.19
Australian Foundation Investment Company Limited 1,096,631 0.16
Directors’ interests register
Directors’ certificates to cover entries in the interests register in respect of remuneration, dealing in the company’s securities, insurance and other interests have been disclosed as required by the Companies Act 1993.
In accordance with Section 140(2) of the Companies Act 1993, directors have advised changes in their interests during the year ended 30 June 2013 of:
G T Tilbrook Resigned as a director of NBN 5/08/12
R G Waters Appointed as a director of Asciano 23/08/12
R G Waters Resigned as a director of Westpac New Zealand 1/09/12
A T Jackson Appointed as a director of Delegat’s Group 15/10/12
R G Waters Appointed as chairman of Woolworths 22/11/12
C Tarrant Appointed as a director of Shopping Centres Australasia Property Group Trustee NZ 18/12/12
A T Jackson Resigned as chairman of the NZ Racing Board 19/02/13
G T Tilbrook Resigned as a director of Transpacific Industries Group 1/03/13
R G Waters Appointed as chairman of the ICC Cricket World Cup 2015 1/04/13
R G Waters Resigned as a director of Fonterra Co-operative Group 18/04/13
A J Carter Appointed as chairman of Air New Zealand (effective 27 September 2013) 14/05/13
A J Carter Appointed as chairman of the Blues LLP 17/05/13
A T Jackson Resigned as chairman of Housing NZ Corporation 6/06/13
C Tarrant Appointed as deputy chair of the Government Superannuation Fund Authority 27/06/13
Regulatory disclosures continued

81
Stock exchange listings continued
New Zealand Central Securities Depository Limited provides a custodial depository service that allows electronic trading of securities to its members and does not have a beneficial interest in these shares. Its major holders of Fletcher Building shares are:
Name Number of shares % of shares
JP Morgan Chase Bank NA 92,043,388 13.42
HSBC Nominees (New Zealand) Limited 75,278,566 10.98
BNP Paribas Nominees (NZ) Limited 24,901,508 3.62
Accident Compensation Corporation 22,926,632 3.34
Citibank Nominees (New Zealand) Limited 22,293,881 3.25
National Nominees New Zealand Limited 19,801,871 2.89
New Zealand Superannuation Fund Nominees Limited 18,149,208 2.65
Tea Custodians Limited 15,245,235 2.22
Premier Nominees Limited 11,141,270 1.62
Westpac NZ Shares 2002 Wholesale Trust 4,229,075 0.62
Substantial security holdersAccording to notices given to the company under the Securities Markets Act 1988, as at 31 August 2013, the substantial security holders in the company and their relevant interests are noted below. The total number of issued voting securities of Fletcher Building Limited as at that date was 686,096,427.
Substantial security holders Number of voting securities Date of notice
The Capital Group Companies, Inc 42,945,596 12/07/13
Distribution of shareholders and holdings as at 31 July 2013
Size of holdings Number of shareholders % Number of shares %
1 to 999 17,058 37.50 6,958,490 1.01
1,000 to 4,999 20,803 45.74 46,017,580 6.71
5,000 to 9,999 4,487 9.87 29,876,429 4.35
10,000 to 49,999 2,822 6.20 48,947,018 7.13
50,000 to 99,999 153 0.34 10,139,697 1.48
100,000 to 499,999 104 0.23 17,849,699 2.60
500,000 and over 54 0.12 526,307,514 76.72
Total 45,481 100.00 686,096,427 100.00
Geographic distribution Number of shareholders % Number of shares %
New Zealand 34,850 76.62 498,538,478 72.67
Australia 9,981 21.95 184,791,327 26.93
Rest of the World 650 1.43 2,766,622 0.40
Total 45,481 100.00 686,096,427 100.00
All shares issued are fully paid and have full voting rights. The number of shareholders holding less than the marketable parcel of A$500 under the listing rules of the ASX is 1,000.
The other equity securities on issue are 531 million of Fletcher Building Industries Limited capital notes, which can convert to Fletcher Building Limited ordinary shares on the basis of 98 percent of the then current value of the shares. There were 8,278 holders of the capital notes at 31 July 2013. These equity securities are quoted on the NZX but are unquoted on the ASX.

82
Distribution of capital noteholders and holdings as at 31 July 2013
Fletcher Building Industries Limited
Size of holding Number of noteholders % Number of capital notes %
1 to 4,999 1,110 13.41 3,192,166 0.60
5,000 to 9,999 1,346 16.26 8,569,666 1.61
10,000 to 49,999 4,396 53.11 90,103,000 16.96
50,000 to 99,999 885 10.69 52,323,500 9.85
100,000 to 499,999 477 5.76 76,920,750 14.48
500,000 and over 64 0.77 300,210,918 56.50
Total 8,278 100.00 531,320,000 100.00
Limitations on the acquisition of the company’s securities
The terms of the company’s admission to the ASX and ongoing listing require the following disclosures.
The company is incorporated in New Zealand. As such it is not subject to Chapters 6, 6A, 6B and 6C of the Australian Corporations Act dealing with the acquisition of shares (such as substantial holdings and takeovers). Limitations on acquisition of the securities are, however, imposed on the company under New Zealand law:
(a) Securities in the company are in general freely transferable and the only significant restrictions or limitations in relation to the acquisition of securities are those imposed by New Zealand laws relating to takeovers, overseas investment and competition.
(b) The New Zealand Takeovers Code creates a general rule under which the acquisition of more than 20 percent of the voting rights in the company or the increase of an existing holding of 20 percent or more of the voting rights in the company can only occur in certain permitted ways. These include a full takeover offer in accordance with the Takeovers Code, a partial takeover offer in accordance with the Takeovers Code, an acquisition approved by an ordinary resolution, an allotment approved by an ordinary resolution, a creeping acquisition (in certain circumstances) or compulsory acquisition if a shareholder holds 90 percent or more of the shares in the company.
(c) The New Zealand Overseas Investment Act and Overseas Investment Regulations regulate certain investments in New Zealand by overseas persons. In general terms, the consent of the New Zealand Overseas Investment Office is likely to be required where an “overseas person” acquires shares or an interest in shares in the company that amount to more than 25 percent of the shares issued by the company or, if the overseas person already holds 25 percent or more, the acquisition increases that holding.
(d) The New Zealand Commerce Act 1986 is likely to prevent a person from acquiring shares in the company if the acquisition would have, or would be likely to have, the effect of substantially lessening competition in a market.
(e) On 31 March 2009, ASX granted the company an ongoing waiver from ASX Listing Rule 7.1 which regulates the circumstances where companies listed on ASX are required to seek shareholder approval for the issue of securities. One of the conditions of the waiver is that the company remains subject to, and complies with, the listing rules of NZX with respect to the issue of new securities.
In accordance with the requirements of the ASX waiver, the company certifies that during the 12 months to 30 June 2013 it has been subject to, and has complied with, the requirements of the NZX with respect to the issue of new securities and that it continues to comply with those requirements.
NZX waiver
The company has been granted a waiver from NZX Listing Rule 7.6.6(a), to allow its chief executive officer and managing director, Mr Mark Adamson, to participate in the Fletcher Building Limited Executive Long-Term Share Scheme (the Scheme) and to receive financial assistance as part of that Scheme, for as long as Mr Adamson remains an employee of the company and a participant in the scheme.
This waiver was granted subject to the following conditions:
(a) the company obtains shareholder approval for the provision of financial assistance to Mr Adamson in connection with his participation in the Scheme at its annual shareholders’ meeting (the meeting); and
(b) the notice of meeting contains the precise terms and conditions of Mr Adamson’s participation in the Scheme, and a description of the waiver and its implications, being that financial assistance may continue to be provided to Mr Adamson for the period for which he is a participant in the Scheme, which approval was given at the 2012 meeting.
Regulatory disclosures continued

83
SUBSIDIARY COMPANY DIRECTORS
Section 211(2) of the New Zealand Companies Act 1993 requires the company to disclose, in relation to its subsidiaries, the total remuneration and value of other benefits received by directors and former directors and particulars of entries in the interests registers made during the year ended 30 June 2013.Apart from some overseas subsidiaries which have independent directors or are required to have a specific number of local residents as directors, no wholly owned subsidiary has directors who are not full-time employees of the group. The company had 256 subsidiaries worldwide at 30 June 2013. No employee of Fletcher Building Limited appointed as a director of Fletcher Building Limited or its subsidiaries receives, or retains any remuneration or other benefits, as a director. The remuneration and other benefits of such employees, received as employees, are included in the relevant bandings for remuneration disclosed previously under Employee remuneration. Except where shown below, no other director of any subsidiary company within the group receives director’s fees or other benefits as a director. The following persons respectively held office as directors of subsidiary companies at the end of the year, or in the case of those persons with the letter (R) after their name ceased to hold office during the year. Alternate directors are indicated by the letter (A) after their name. Companies placed in liquidation during the year are indicated by the letter (L) after their name.
AHI Roofing (Malaysia) SDN BHDZ Bin Mat Desa (R), P Binti Mohamad (R), T Richards, W Roest (R), P Wilson, I Bin Harun, P Lamb
AHI Roofing (Middle East) LimitedT Richards, W Roest (R), N Olson
AHI Roofing Gyarto Es Kereskedelmi Korlatolt Felelossegu TarasagM Adamson, O Pascutiu, P Wilson
AHI Roofing LimitedT Richards, W Roest (R), N Olson
AHI Roofing Proizvodnja In Distribucija Stresnih Sistemov D.O.O.M Adamson (R), O Pascutiu, T Richards, P Wilson
AHI Roofing Pty LimitedD Le Quesne, T Richards
Aickin Timber LimitedJ Beveridge, W Roest (R), N Olson
Amatek Holdings LimitedM Farrell, N Gleeson (R), D Le Quesne, W Roest (R), N Olson, L Huynh
Amatek Industries Pty LimitedN Gleeson (R), D Le Quesne, W Roest (R), N Olson, L Huynh
Amatek Investments LimitedM Farrell, N Gleeson (R), D Le Quesne, W Roest (R), N Olson, L Huynh
Amtel Pty LimitedN Gleeson (R), M Negri, T Richards, W Roest (R), P Zuckerman (R)
Andy Sellar Building Supplies LimitedJ Beveridge, V Grant (A), A Sellar
Anson Building Supplies LimitedJ Beveridge
Associated Water Equipment Pty. Ltd.D Worley (R), W Roest (R), N Olson, L Mayne
Austral Bronze Crane Copper LimitedS Robertson, W Roest (R), D Worley (R), N Olson, L Mayne
Australian Construction Products Pty LimitedS Baker, M Malpass
Australian Fibre Glass Pty LimitedN Gleeson (R), D Le Quesne, L Huynh
Bandelle Pty LimitedN Gleeson (R), D Le Quesne, L Huynh
Baron Insulation Pty LtdT Richards, C Zeitlyn, S McKay (R)
Boden Building Supplies LimitedJ Beveridge, P Boden, V Grant (A)
Builders Hardware Company LimitedJ Beveridge
Building Choices LimitedJ Beveridge, D Close, V Grant (A)
Building Prefabrication Solutions LimitedJ Beveridge, N Olson
Building Products Superannuation Fund Pty LimitedS Hart, W Roest (R), L Box
Burford Building Supplies LimitedJ Beveridge
Calvert Building Supplies LimitedJ Beveridge
Cameron Building Supplies LimitedJ Beveridge, D Cameron, V Grant (A)
Caravan Components Pty LimitedN Gleeson (R), D Le Quesne, L Huynh
Charmac Industries Proprietary LimitedW Roest (R), D Worley (R), N Olson, L Mayne
Cleaver Building Supplies LimitedJ Beveridge, M Cleaver, V Grant (A)
Cloudguard No 96 Pty LtdW Roest (R), D Worley (R), N Olson, L Mayne
Collier Building Supplies LimitedJ Beveridge
Consort Laminates LimitedM Adamson (R), P Hall, N Mason
Crane Distribution LimitedL Mayne, W Roest (R), D Worley (R), N Olson, T Hickey
Crane Distribution NZ LimitedM Farrell, W Roest (R), D Worley (R), N Olson
Crane Distribution Properties LimitedM Farrell, W Roest (R), D Worley (R), N Olson
Crane Employee Services Pty LimitedW Roest (R), D Worley (R), N Olson, L Mayne

84
Crane Enfield Metals Pty LimitedW Roest (R), D Worley (R), N Olson, L Mayne
Crane Group LimitedD Le Quesne, W Roest (R), D Worley (R), N Olson, L Mayne
Creeks Metal Industries Pty LimitedD Le Quesne, N Gleeson (R), L Huynh
Crevet LtdR McLeod, W Roest (R), D Worley (R), N Olson, L Mayne
Crevet Pipelines Pty LtdR McLeod, W Roest (R), D Worley (R), N Olson, L Mayne
CTCI Pty LimitedW Roest (R), P Sackville (R), D Surveyor, E Woldhuis, N Olson, A Webster (A)
Cullen Building Supplies LimitedJ Beveridge, R Cullen, V Grant (A)
Cullity Timber Holdings Pty LimitedW Roest (R), D Surveyor, N Olson, P Zuckerman
Dale King Building Supplies LimitedJ Beveridge, V Grant (A), D King
Davis & Casey Building Supplies LimitedJ Beveridge, T Davis, V Grant (A)
Deavoll Building Supplies LimitedJ Beveridge, V Grant (A)
Decra Roofing Systems, Inc.W Hudson, T Richards, W Roest (R), N Olson
Delcon Holdings (No. 1) LimitedW Roest (R), P Zuckerman, N Olson
Delcon Holdings (No. 2) LimitedW Roest (R), P Zuckerman, N Olson
Delcon Holdings (No. 3) LimitedA Cadman, W Roest (R), N Olson
Delcon Holdings (No. 8) LimitedT RIchards, W Roest (R), N Olson
Delcon Holdings (No. 10) LimitedM Farrell, W Roest (R), N Olson
Delcon Holdings (No. 11) LimitedM Farrell, W Roest (R), N Olson
Delcon Holdings (No. 15) LimitedG Darlow, W Roest (R), N Olson
Delcon Holdings (No. 16) LimitedM Farrell, W Roest (R), N Olson
EE-Fit Pty LimitedT Richards, C Zeitlyn, S McKay (R)
EFA Technologies Pty LimitedD Le Quesne, M Malpass
Engineered Timber Solutions LtdJ Beveridge
Evans Building Supplies LimitedJ Beveridge, M Evans, V Grant (A)
FBHS (Aust) Pty LimitedW Roest (R), P Zuckerman, T Richards, N Gleeson (R), M Negri
FBSOL Pty LimitedW Roest (R), P Zuckerman, T Richards (R), N Gleeson (R), M Negri
FDL No. 28 LimitedJ Beveridge
FDL No. 29 LimitedJ Beveridge
FDL No. 30 LimitedJ Beveridge
Fletcher Building (Australia) Finance Pty LimitedN Gleeson (R), D Le Quesne, L Huynh
Fletcher Building (Australia) Pty LimitedM Farrell, N Gleeson (R), D Le Quesne, W Roest (R), N Olson, L Huynh
Fletcher Building (Fiji) LimitedA Kumar, P Thumath (R), C White, A Brown, M Malpass
Fletcher Building Holdings LimitedM Farrell, W Roest (R), J Ling (R), N Olson
Fletcher Building Holdings New Zealand LimitedM Farrell, M Adamson, W Roest (R), J Ling (R), N Olson
Fletcher Building Holdings USA Inc.W Hudson (R), W Roest (R), M Quint, N Olson
Fletcher Building Industries LimitedA Carter, H Fletcher (R), A Jackson, J Judge, J Ling (R), K Spargo, C Tarrant, G Tilbrook, R Waters, M Adamson
Fletcher Building Netherlands Antilles B.V.S Coeriel (R), M Farrell, E Rakers (US $3,865), W Roest (R), N Olson, J Mol-Rozema
Fletcher Building Netherlands B.V.M Farrell, W Roest (R), P Ruoff (R), N Olson, D Slob, A Van De Werken (EUR 2,500)
Fletcher Building (New Zealand) LimitedM Farrell, W Roest (R), N Olson
Fletcher Building Nominees LimitedJ McDonald, G Niccol, M Farrell, W Roest (R), C Munkowits, K Daly, N Olson
Fletcher Building Products LimitedT Richards, W Roest (R), N Olson
Fletcher Building Share Schemes LimitedG Niccol, J McDonald
Fletcher Challenge Building Bolivia S.A.M Binns, K Cowie, H Ritchie
Fletcher Challenge Building UK LimitedJ Ollard, D Wood
Fletcher Challenge Finance Investments LimitedM Farrell, W Roest (R), N Olson
Fletcher Challenge Forest Industries LimitedM August, J Ollard, D Wood
Fletcher Challenge Industries S.A.M Binns, K Cowie, H Ritchie
Fletcher Challenge Investments Overseas LimitedM Farrell, W Roest (R), N Olson
Fletcher Challenge Overseas Holdings LimitedM Farrell, W Roest (R), N Olson
Fletcher Composite Research LimitedW Roest (R), P Zuckerman, N Olson
Fletcher Concrete (Fiji) LimitedP Thumath (R), A Kumar, A Brown, M Malpass, C White
Fletcher Concrete & Infrastructure LimitedM Malpass, W Roest (R), N Olson
Fletcher Construction (Nouvelle Caledonie) S.A.R.L.A Brown
Fletcher Construction (Solomon Islands) LimitedA Brown, L Gray
Fletcher Construction Australia Pty LimitedN Gleeson (R), C Munkowits, L Huynh
Fletcher Construction Company (Fiji) LimitedA Brown, L Gray, J Matthews
Regulatory disclosures continued

85
Fletcher Construction Pty LimitedN Gleeson (R), C Munkowits, L Huynh
Fletcher Distribution LimitedJ Beveridge, W Roest (R), N Olson
Fletcher Insulation (Vic) Pty LimitedT Richards, C Zeitlyn, S McKay (R)
Fletcher Insulation Pty LimitedT Richards, C Zeitlyn, S McKay (R)
Fletcher Morobe Construction Pty LimitedA Brown, K Fletcher, L Gray, L Mathias
Fletcher Pacific Steel (Fiji) LimitedD Hargovind (FJ $2,500), I Jones, W Roest (R), P Zuckerman
Fletcher Property Developments UK LimitedM August, J Ollard, D Wood
Fletcher Property Investments UK LimitedM August, J Ollard, D Wood
Fletcher Property LimitedG Darlow, W Roest (R), N Olson
Fletcher Residential LimitedG Darlow, W Roest (R), N Olson
Fletcher Steel LimitedW Roest (R), P Zuckerman (R), M Malpass, T Richards, N Olson
Fletcher Wood Panels (Australia) Pty LimitedW Roest (R), D Surveyor, N Olson, P Zuckerman
FM Holdings Inc.M Adamson (R), L Box, W Roest (R), M Quint, P Zuckerman
FMB Comércio Importacão e Exportacão de Laminados Decorativos LtdaG Pikielny
Forman Building Systems LimitedT Richards, W Roest (R), N Olson
Forman Building Systems Pty LimitedT Richards, C Zeitlyn
Forman Commercial Interiors LimitedT Richards, W Roest (R), N Olson
Forman Group LimitedT Richards, W Roest (R), N Olson
Forman Insulation LimitedT Richards, W Roest (R), N Olson
Forman Manufacturing LimitedT Richards, W Roest (R), N Olson
Formica (Asia) LtdC Wang, D Wang
Formica (China) Trading Co., LtdC Wang, C Kao, C Gray
Formica (Malaysia) Sdn. Bhd.K Leong, C Wang, J Yang
Formica (N.Z.) LimitedM Adamson (R), W Roest (R), N Olson, P Zuckerman
Formica (Nederland) B.V. J Ruurd de Pater, N Mason
Formica (Singapore) Pte. LtdC Wang, C Chang, DH Wang
Formica (Thailand) Co., LtdW Kunanantakul, S Mahacharoenkeat, DH Wang, C Wang
Formica Canada Inc.M Adamson (R), L Box, C Sarrazin, M Quint
Formica CorporationM Adamson, L Box, W Roest (R), M Quint
Formica Danmark A/SI Delen, U Hector, R Pollington
Formica de Mexico SA DE CVM Adamson (R), L Box, M Quint, B Strobel
Formica Decorative Materials (China) Co., LtdP Foreman (R), C Kao, C Wang, C Gray
Formica Finance LimitedM Adamson (R), P Hall, W Roest (R), N Mason, R Pollington
Formica Global LLCM Adamson (R), R Bollman (R), L Box, M Vernon, M Quint, B Strobel
Formica Holdco UK LimitedM Adamson (R), P Hall, N Mason, R Pollington
Formica Holding Corp.M Adamson (R), L Box, W Roest (R), M Quint, P Zuckerman
Formica Holding GmbHM Adamson, E Hoernisch, T Ruhnke
Formica Holdings LimitedM Adamson (R), P Hall, N Mason, R Pollington
Formica II CorporationM Adamson R), L Box, W Roest (R), M Quint, P Zuckerman
Formica Iki OyM Adamson (R), I Delen, R Pollington, P Zuckerman
Formica International LLCM Adamson (R), R Bollman (R), L Box, M Vernon, M Quint, B Strobel
Formica Korea CorporationT Ren, C Wang
Formica Laminates (India) Private LimitedM Adamson (R), S Badri, L Box, N Mason, R Pollington, P Zuckerman
Formica LimitedM Adamson (R), L Box, P Foreman, P Hall, N Mason, D Pallas, R Pollington, W Roest (R), P Zuckerman
Formica LLCI Delen, N Mason, R Pollington, A Tsvetov
Formica Middle East B.V.M Adamson
Formica Norge A/SI Delen, U Hector
Formica PSM LimitedM Adamson (R), P Hall
Formica S.A. (Spain)M Adamson (R), P Hall, H Ruloffs
Formica S.A.S (France)M Adamson (R), P Hall (R), N Mason, R Pollington, P Zuckerman
Formica Skandinavien ABM Adamson (R), I Delen, R Pollington
Formica SP.zo.O.N Mason
Formica Taiwan CorporationT Ren, C Wang, DH Wang
Gatic Pty LimitedR McLeod, W Roest (R), D Worley (R), N Olson, L Mayne
G E Crane Investments Pty LtdW Roest (R), D Worley (R), N Olson, L Mayne
G E Crane Securities Pty LtdW Roest (R), D Worley (R), N Olson, L Mayne
G. E. Crane N.Z. Holdings LtdM Farrell, W Roest (R), D Worley (R), N Olson
G. E. Crane N.Z. LimitedM Farrell, W Roest (R), D Worley (R), N Olson

86
Geoff Brown Building Supplies LimitedJ Beveridge, G Brown, V Grant (A)
Geraldton Independant Building Supplies Pty LimitedW Roest (R), D Surveyor, N Olson, P Zuckerman
Graeme Joy Building Supplies LimitedJ Beveridge, V Grant (A), G Joy
Gravure et Polissage de Surfaces MetalliquesM Adamson, P Hall, N Mason
Homapal GmbH T Ruhnke
Home&Dry Limited (formerly DVS Limited)T Richards, W Roest (R), N Olson
Hudson Building Supplies Pty LimitedW Roest (R), D Worley (R), N Olson, L Mayne
Icon Industries National Administration Pty LtdW Roest (R), D Worley (R), N Olson, L Mayne
Insulation Solutions Holdings Pty LimitedN Gleeson (R), D Le Quesne, L Huynh
Iplex Pipelines Australia Pty LimitedR McLeod, W Roest (R), D Worley (R), N Olson, L Mayne
Iplex Pipelines NZ LimitedM Farrell, W Roest (R), D Worley (R), N Olson
Iplex Properties Pty. LimitedR McLeod, W Roest (R), D Worley (R), N Olson, L Mayne
John Cockburn Building Supplies LimitedJ Beveridge, J Cockburn, V Grant (A)
Ken Jones Building Supplies LimitedJ Beveridge, V Grant (A), K Jones
Kenna Building Supplies LimitedJ Beveridge, V Grant (A), L Kenna
Kevin Jarvis Building Supplies LimitedJ Beveridge
Key Plastics Distribution Pty LtdW Roest (R), D Worley (R), N Olson, L Mayne
Key Plastics Pty. Ltd.R McLeod, W Roest (R), D Worley (R), N Olson, L Mayne
KH Consolidated Industries (Canberra) Pty LimitedD Le Quesne, P Zuckerman (R), T Richards
Kimura Building Supplies LimitedJ Beveridge, V Grant (A), J Kimura
Kingston Bridge Engineering Pty LtdR McLeod, W Roest (R), D Worley (R), N Olson, L Mayne
Kinsey Kydd Building Supplies LimitedJ Beveridge, V Grant (A), S Kinsey
Kusabs Building Supplies LimitedJ Beveridge, V Grant (A), G Kusabs
Laminates Acquisition Co.M Adamson (R), L Box, W Roest (R), M Quint, P Zuckerman
Laminates Holdings Pty LimitedW Roest (R), D Surveyor, N Olson, P Zuckerman
Laminex (Australia) Pty. Ltd.W Roest (R), D Surveyor, N Olson, P Zuckerman
Laminex Finance Pty LimitedN Gleeson (R), D le Quesne, L Huynh
Laminex Group (N.Z.) LimitedM Adamson (R), W Roest (R), N Olson, P Zuckerman
Laminex Group Pty LimitedW Roest (R), D Surveyor, N Olson, P Zuckerman
Laminex Overseas Holdings Pty LimitedN Gleeson (R), D Le Quesne, L Huynh
Laminex US Holdings Pty LimitedN Gleeson (R), D Le Quesne, L Huynh
Macready Building Supplies LimitedJ Beveridge, V Grant (A), J MacReady
McDonald Building Supplies LimitedJ Beveridge, R Callon (A)
McGill Building Supplies LimitedJ Beveridge
Meleccio Enterprises LimitedG Darlow, W Roest (R), N Olson
Milnes-Gatic Pty LtdW Roest (R), D Worley (R), N Olson, L Mayne
Milnes Holdings LimitedR McLeod, W Roest (R), D Worley (R), N Olson, L Mayne
Minnell Building Supplies LimitedJ Beveridge, V Grant (A), D Minnell
Morinda Australia Pty LimitedW Roest (R), P Zuckerman (R), T Richards, M Negri
Mount Timber & Hardware LimitedJ Beveridge, W Roest (R), N Olson
New Zealand Ceiling & Drywall Supplies LimitedD Jones
Nick Letica Building Supplies LimitedJ Beveridge, V Grant (A), N Letica
Nock Building Supplies LimitedJ Beveridge
Northern Iron and Brass Foundry Pty. Ltd.R McLeod, W Roest (R), D Worley (R), N Olson, L Mayne
NZ Insulation Services Limited (formerly DVS Healthy Homes Limited)T Richards, W Roest (R)
Pacific Trade & Export LimitedG Darlow, W Roest (R), N Olson
Perstorp Warerite LimitedM Adamson (R), P Hall, N Mason
PinkFit LimitedT Richards, W Roest (R), N Olson
Placemakers LimitedJ Beveridge, W Roest (R), N Olson
Polymer Fusion Education Pty LtdR McLeod, W Roest (R), D Worley (R), N Olson, L Mayne
Raoul Holdings LimitedM Malpass, W Roest (R), N Olson
Rocla Australia Pty LimitedD Le Quesne, M Malpass
Rocla Concrete Pipes Pty LimitedD Le Quesne, M Malpass
Rocla Drilling Pty LimitedD Le Quesne, M Malpass
Rocla Group Superannuation Fund Pty LimitedJ Gardiner, W Roest (R), L Box
Rocla Industries Pty LimitedN Gleeson (R), D Le Quesne, L Huynh
Rocla Masonry Pty LimitedD Le Quesne, M Malpass
Rocla Materials Pty LimitedD Cilento, M Malpass
Regulatory disclosures continued

87
Rocla NSW Pty LimitedD Le Quesne, M Malpass
Rocla Pty LimitedS Baker, D Cilento, M Malpass
Rocla SA Pty LimitedD Le Quesne, M Malpass
Rocla Vic Pty LimitedN Gleeson (R), D Le Quesne, L Huynh
Rolleston Building Supplies LimitedJ Beveridge, V Grant (A), R Rolleston
S Cubed Pty LimitedW Roest (R), P Zuckerman (R), T Richards, N Gleeson (R), M Negri
Seabar Holdings (No 16) LimitedG Darlow, W Roest (R), N Olson
Servicios Formica de Mexico SA DE CVM Adamson (R), L Box, M Quint, B Strobel
Shanghai Fletcher Building Materials Trading Company LimitedW Roest (R), C Wang, P Wilson
Shanghai Formica Decorative Material Co., LtdP Foreman (R), J Hu, C Kao, C Wang, C Gray
Shed Boss NZ LimitedM Farrell, W Roest (R), N Olson
Sisalation Pty LimitedT Richards, S McKay (R), C Zeitlyn
Southbound Building Supplies LimitedJ Beveridge, V Grant (A), A Rance
Steven Marshall Building Supplies LimitedJ Beveridge, V Grant (A), S Marshall
Stickland Building Supplies LimitedJ Beveridge, V Grant (A), L Stickland
Stramit (Preston) Pty LimitedD Le Quesne, P Zuckerman (R), T Richards
Stramit Corporation Pty LimitedW Roest (R), P Zuckerman (R), T Richards, M Negri
Stramit Pty LimitedD Le Quesne, P Zuckerman (R), T Richards
Sullivan & Armstrong Building Supplies LimitedJ Beveridge, V Grant (A), J Sullivan
Surface Materials Iki OyM Adamson, P Alderson, J Kerbs
TAF Building Systems Pty LimitedD Le Quesne, T Richards
Tasman Australia Pty LimitedN Gleeson (R), D Le Quesne, L Huynh
Tasman Building Products Pty LimitedN Gleeson (R), D Le Quesne, L Huynh
Tasman Insulation New Zealand LimitedT Richards, W Roest (R), N Olson
Tasman Investments (Netherlands Antilles) N.V.S Coeriel (R), M Farrell, E Rakers (US $3,675), W Roest (R), J Mol-Rozema, N Olson
Tasman Sinkware North America, Inc.W Roest (R), N Olson
Tasman Sinkware Pty LimitedJ Bayer, T Richards, W Roest (R), L Mayne
TBP Group Pty LimitedN Gleeson (R), D Le Quesne, L Huynh
Ted Harper Building Supplies LimitedJ Beveridge, V Grant (A), E Harper
Tenedora Formica Mexico, S.A. de C.V.M Adamson (R), L Box, M Quint, B Strobel
Terrace Insurances (PCC) LimitedJ Crowder, M Eades (£2,500), M Farrell, W Roest (R), N Olson
Terry Mellsop Building Supplies LimitedJ Beveridge
The Diller CorporationM Adamson (R), L Box, W Roest (R), M Quint, P Zuckerman
The Fletcher Construction Company Cook Islands LimitedA Brown, L Gray
The Fletcher Construction Company LimitedG Darlow, W Roest (R), N Olson
The Fletcher Organisation (Vanuatu) LimitedA Brown, L Gray, Diract Limited, Lotim Limited
The Fletcher Trust and Investment Company LimitedG Darlow, W Roest (R), N Olson
Thomas Street Pty LimitedD Le Quesne, M Malpass
Thor Plastics Pty LtdW Roest (R), D Worley (R), N Olson, L Mayne
Trade Mart LimitedJ Beveridge, W Roest (R), N Olson
Trademates LimitedJ Beveridge, W Roest (R), N Olson
Unidur GmbHM Adamson
Ward Building Supplies LimitedJ Beveridge
Wesfi LimitedD Le Quesne (R), W Roest (R), D Surveyor, N Olson, P Zuckerman
Wesfi Manufacturing Pty LimitedW Roest (R), D Surveyor, N Olson, P Zuckerman
Winstone Wallboards LimitedT Richards, W Roest (R), N Olson
COMPANIES LIqUIDATED:
Laminex IncW Roest (R), M Quint
Waterman Building Supplies LimitedJ Beveridge
COMPANIES AMALGAMATED:
Auckland Frame and Truss Supplies LimitedJ Beveridge, B Bibbie, R Grimmer, D King, O Lyttleton, S Marshall, L Stickland, J Sullivan, R Spiers, B Deavoll (R)
Christchurch Frame & Truss LimitedJ Beveridge, B Bibbie, M Cleaver, D Close, M Evans, R Grimmer (A), O Lyttelton (A), R Callon (R)
Decorative Surfaces Holding ABM Adamson, I Delen, U Hector
Formica Vertriebs GmbHM Adamson, E Hoernisch, T Ruhnke
Homapal Plattenwerk Beteiligungs-GmbHT Ruhnke
Homapal Plattenwerk GmbH & Co KGT Ruhnke, M Adamson (R), F Homann (R)
Waikato/BOP Frame & Truss Limited (formerly Tango Warkworth Limited)J Beveridge
Wellington Frame & Truss LimitedJ Beveridge
The O’Brien Group LimitedM Adamson, W Roest (R), D Worley (R)

88
Investor information
Annual shareholders’ meetingThe Annual Shareholders’ Meeting of Fletcher Building Limited will be held in the Level 4 Lounge, South Stand, Eden Park, Reimers Avenue, Auckland, at 10.30am on Wednesday 16 October 2013.
Final dividend informationThe company has declared a final dividend for the year of 17 cents per share payable on 16 October 2013. This is in addition to the interim dividend of 17 cents per share paid in April 2013. The final dividend has imputation credits attached at a 28 percent tax rate. There are no Australian franking credits attached.
Dividend Reinvestment PlanFletcher Building shareholders (excluding those in jurisdictions where the issue of shares is not permitted by law) can participate in a Dividend Reinvestment Plan, under which they have the opportunity to reinvest their dividends in additional shares. To participate, please contact the share registry.
Further information onlineDetails on Fletcher Building, its governance policies, and its operations for the year ended 30 June 2013 can be viewed on the Fletcher Building website at fbu.com. This website contains all news releases to the NZX and ASX financial presentations made by the company.
Shareholder communicationsThe company is not required to send printed copies of the annual report and half year review to shareholders. Instead, Fletcher Building sends an annual review which is a summary of the company’s operational and financial activities for the year, although holders can view the reports on the company’s website. In addition, they have a right to receive a copy of these reports on request.
Direct crediting of interest and dividendsTo minimise the risk of fraud and misplacement of dividend cheques shareholders are strongly recommended to have all payments made by way of direct credit to their nominated New Zealand or Australian bank account. This can be done by simply giving the share registry written notice.
Share registriesDetails of the company’s share registries are given in the Directory on the inside back cover of this report.Shareholders with enquiries about share transactions, changes of address or dividend payments should contact the share registry in the country in which their shares are registered.

Registered offices
New Zealand Fletcher Building LimitedPrivate Bag 92 114Auckland 1142New Zealand
Fletcher House810 Great South RoadPenrose, Auckland 1061New ZealandT. +64 9 525 9000
AustraliaFletcher Building AustraliaLocked Bag 7013,Chatswood DC 2067NSW 2067, Australia
Level 11, Tower B, Zenith Centre821 Pacific HighwayChatswood, NSW 2067, AustraliaT. +61 2 8986 0900ARBN 096 046 936
Shareholder enquiriesChanges of address, payment instructions and investment portfolios can be viewed and updated online: investorcentre.co/nz. Enquiries may be addressed to the Share Registrar, Computershare Investor Services:
New ZealandComputershare Investor Services LimitedPrivate Bag 92 119Auckland 1142New Zealand
Level 2, 159 Hurstmere RoadTakapuna, Auckland 0622New ZealandT. +64 9 488 8777F. +64 9 488 8787E. [email protected]
AustraliaComputershare Investor Services Pty LimitedGPO Box 3329Melbourne, VIC 3001, Australia
Yarra Falls, 452 Johnston StreetAbbotsford, VIC 3067, AustraliaT. 1800 501 366 (within Australia)T. +61 3 9415 4083 (outside Australia)F. +61 3 9473 2009
Other investor enquiriesFletcher Building LimitedPrivate Bag 92 114Auckland 1142, New ZealandT. +64 9 525 9000F. +64 9 525 9032E. [email protected]
Other informationfbu.com
DIRECTORY
89

New ZealandAuckland Bay of PlentyCanterburyCentral North IslandHawkes BayNelson & MarlboroughNorthlandOtago & SouthlandTaranaki & ManawatuWaikatoWellington
AsiaEuropeNorth AmericaSouth Pacific
AustraliaACTNew South WalesNorthern TerritoryQueenslandSouth AustraliaTasmaniaVictoriaWestern Australia