flexibility and bed margins of the community of madrid's
TRANSCRIPT

International Journal of
Environmental Research
and Public Health
Article
Flexibility and Bed Margins of the Community of Madrid’sHospitals during the First Wave of the SARS-CoV-2 Pandemic
Eugenio F. Sánchez-Úbeda 1,* , Pedro Sánchez-Martín 1 , Macarena Torrego-Ellacuría 2 ,Ángel Del Rey-Mejías 2,3 , Manuel F. Morales-Contreras 1,4 and José-Luis Puerta 5
�����������������
Citation: Sánchez-Úbeda, E.F.;
Sánchez-Martín, P.; Torrego-Ellacuría,
M.; Rey-Mejías, Á.D.;
Morales-Contreras, M.F.; Puerta, J.-L.
Flexibility and Bed Margins of the
Community of Madrid’s Hospitals
during the First Wave of the
SARS-CoV-2 Pandemic. Int. J. Environ.
Res. Public Health 2021, 18, 3510.
https://doi.org/10.3390/ijerph18073510
Academic Editors: Giovanni Gabutti,
Andrea Orsi, Armando Stefanati and
Jon Øyvind Odland
Received: 17 December 2020
Accepted: 24 March 2021
Published: 28 March 2021
Publisher’s Note: MDPI stays neutral
with regard to jurisdictional claims in
published maps and institutional affil-
iations.
Copyright: © 2021 by the authors.
Licensee MDPI, Basel, Switzerland.
This article is an open access article
distributed under the terms and
conditions of the Creative Commons
Attribution (CC BY) license (https://
creativecommons.org/licenses/by/
4.0/).
1 Institute for Research in Technology (IIT), ICAI School of Engineering, Comillas Pontifical University,28015 Madrid, Spain; [email protected] (P.S.-M.); [email protected] (M.F.M.-C.)
2 Unidad de Innovación, Hospital Clínico San Carlos, IdISSC, 28040 Madrid, Spain;[email protected] (M.T.-E.); [email protected] (Á.D.R.-M.)
3 Departamento de Psicobiología y Metodología en Ciencias del Comportamiento, Facultad de Psicología,Universidad Complutense, 28223 Madrid, Spain
4 Faculty of Business Management and Economics, ICADE, Comillas Pontifical University, 28015 Madrid, Spain5 Consejería de Sanidad y Dirección General de Estadística, Comunidad de Madrid, 28013 Madrid, Spain;
[email protected]* Correspondence: [email protected]
Abstract: Background: The COVID-19 pandemic has had global effects; cases have been counted in thetens of millions, and there have been over two million deaths throughout the world. Health systemshave been stressed in trying to provide a response to the increasing demand for hospital beds duringthe different waves. This paper analyzes the dynamic response of the hospitals of the Communityof Madrid (CoM) during the first wave of the severe acute respiratory syndrome coronavirus 2(SARS-CoV-2) pandemic in the period between 18 March and 31 May 2020. The aim was to modelthe response of the CoM’s health system in terms of the number of available beds. Methods: Aresearch design based on a case study of the CoM was developed. To model this response, we usetwo concepts: “bed margin” (available beds minus occupied beds, expressed as a percentage) and“flexibility” (which describes the ability to adapt to the growing demand for beds). The Linear HingesModel allowed a robust estimation of the key performance indicators for capturing the flexibilityof the available beds in hospitals. Three new flexibility indicators were defined: the Average RampRate Until the Peak (ARRUP), the Ramp Duration Until the Peak (RDUP), and the Ramp GrowthUntil the Peak (RGUP). Results: The public and private hospitals of the CoM were able to increase thenumber of available beds from 18,692 on 18 March 2020 to 23,623 on 2 April 2020. At the peak of thewave, the number of available beds increased by 160 in 48 h, with an occupancy of 90.3%. Withinthat fifteen-day period, the number of COVID-19 inpatients increased by 200% in non-intensive careunit (non-ICU) wards and by 155% in intensive care unit (ICU) wards. The estimated ARRUP fornon-ICU beds in the CoM hospital network during the first pandemic wave was 305.56 beds/day, theRDUP was 15 days, and the RGUP was 4598 beds. For the ICU beds, the ARRUP was 36.73 beds/day,the RDUP was 20 days, and the RGUP was 735 beds. This paper includes a further analysis ofthe response estimated for each hospital. Conclusions: This research provides insights not only foracademia, but also for hospital management and practitioners. The results show that not all of thehospitals dealt with the sudden increase in bed demand in the same way, nor did they providethe same flexibility in order to increase their bed capabilities. The bed margin and the proposedindicators of flexibility summarize the dynamic response and can be included as part of a hospital’smanagement dashboard for monitoring its behavior during pandemic waves or other health crises asa complement to other, more steady-state indicators.
Keywords: hospital bed management; flexibility; bed margin; intensive care; non-intensive care;coronavirus; COVID-19
Int. J. Environ. Res. Public Health 2021, 18, 3510. https://doi.org/10.3390/ijerph18073510 https://www.mdpi.com/journal/ijerph

Int. J. Environ. Res. Public Health 2021, 18, 3510 2 of 22
1. Introduction
When severe acute respiratory syndrome coronavirus 2 (SARS-CoV-2) was first discov-ered in Wuhan (China) in December 2019, even the most qualified experts did not anticipatethat it would rapidly spread to create the worst global public health crisis since the 1918 flupandemic [1]. The total number of COVID-19 cases in the world is counted in the tens ofmillions, with deaths in over two million cases. It is well known that emerging viral pan-demics “can place extraordinary and sustained demands on public health and healthcaresystems and on providers of essential community services” [2]. A crisis such as the currentCOVID-19 pandemic is a dramatic event, which takes place in a difficult environment withenormous emotional tension, coupled with a serious disproportion between needs andavailable resources. In these circumstances, managing healthcare services is a constantand changing challenge [3]. Therefore, flexibility in the usage of hospital beds is a crucialelement for efficiently organizing critical capacity [4]. In Spain, as in many other countries,in the spring of 2020, COVID-19 produced such a significant number of seriously ill patientsthat the healthcare system almost collapsed. In some of its Autonomous Communities(ACs), particularly in the Autonomous Community of Madrid (CoM), where the capital ofSpain (Madrid city) is located, the situation was especially pronounced.
Thus, on 31 March, at least 450,611 cases had been reported in Europe. The CoM reg-istered a cumulative incidence in the previous 14 days of 363.22 and Spain registered 192.3,followed by Italy (122.2), Belgium (103), France (56.6), and the UK (40). The accumulatedcases in the CoM were 29,840, 29% those of all of Spain (102.136). The highest fatality ratein Europe was in Italy (11.7), followed by Spain with 8.9, while in the CoM, it reached 13(46% higher). In the CoM, the deaths per 100,000 inhabitants amounted to 57.7, tripling thatof Spain (17.3), which was followed by Belgium (14.8), Italy (13.4), France (6.24), and theUK (5.6). The accumulated deaths in the CoM (3865) represented 42.7% of those registeredin Spain (9053) [5,6]. If we look at the situation of beds in the CoM’s hospitals to describetheir evolution, which is the main objective of this paper, it can be seen that the number ofpatients hospitalized just for COVID-19 in the intensive care units (ICUs) was 1514, and13,713 patients were in beds other than intensive care (non-ICU). However, the situationcan be described even better by comparing the figures of the CoM beds with those of Spain:5872 (ICU) and 45,546 (non-ICU) [5]; Italy: 4023 (ICU) and 32,215 (non-ICU); France: 5496(ICU) and 22,672 (non-ICU); and Belgium: 1088 (ICU) and 4989 (non-ICU) [7].
Due to the need to hospitalize a huge number of COVID-19 patients, which increasedrelentlessly with different degrees of severity during this first wave, the CoM’s hospitalsrapidly increased their capacity to levels never seen before. Not only the number of hospitalbeds, but also the intensive support and invasive ventilation were of concern, as COVID-19is a disease with a potentially fatal evolution. These circumstances meant that the numberof available beds had to be increased from 18,692 (18 March 2020) to 23,623 (2 April 2020)in just 15 days, i.e., an increment of 26.4%. Although the first admission for COVID-19 ina CoM hospital occurred on 25 February 2020, in this paper, we analyze the data for theperiod between 18 March 2020 and 31 May 2020. The first date corresponds to the first dayon which we had the complete data of the hospitals that are analyzed in this article.
The COVID-19 pandemic, as mentioned above, forced the CoM’s hospitals to increasethe number of available beds. Given the shortage of papers in the world on the capacitiesof hospitals to increase their numbers of beds with the speed required by a pandemicwave, the aim of this article is to set dynamic performance indicators in order to modelthe dynamic response in terms of the number of available beds instead of using morestationary approaches. For this purpose, not only are specific visualization graphs usedto show the daily evolution of the variables under consideration, such as the bed marginof the CoM’s hospitals, but a new set of indexes for quantifying their flexibility and arobust estimation method are proposed. Thus, the proposed approach to analyzing andquantifying the dynamics related to flexibility could be used for further analysis and as areference for decision making not only at the hospital level, but also from a centralized orglobal perspective.

Int. J. Environ. Res. Public Health 2021, 18, 3510 3 of 22
The remainder of this paper is structured as follows. Section 2 describes the materialsand methods, and it is composed of three parts: (i) the healthcare system of the hospitalnetwork in the CoM; (ii) the data and the variables used in our study; and (iii) the method-ology, where the proposed concepts of the bed margin and flexibility are defined. Theresults are presented in Section 3, first as an aggregate view of the healthcare system, andsecond as disaggregated view by hospital. Finally, Section 4 contains a discussion of theresults, and conclusions and directions for future work are provided in Section 5.
2. Materials and Methods2.1. The Hospital Network in the CoM
The Spanish National Health System (Sistema Nacional de Salud, SNS) is organized attwo levels: national and regional. Its structure is a mirror of the administrative division ofthe country, i.e., the healthcare competences are transferred to the 17 ACs. The main actorsin the ACs are the Departments of Health (Consejerías de Sanidad, CSs), which fulfill the roleof a health authority, that is, healthcare delivery, regulation, planning, budgeting, and third-party payment. Above the CSs is the Spanish Ministry of Health, whose fundamental role,according to the law, is the coordination of the 17 CSs (through a collegiate body) and thepublication of standards or laws that are mandatory throughout the SNS. In practice, CSsact with enormous autonomy, and there is little tradition of coordination among them [8].
The CoM’s public hospital network is made up of 34 hospitals, which are classifiedaccording to the degree of complexity of the medical procedures they offer (e.g., transplants,heart surgery, neurosurgery, radiotherapy, special treatments, etc.) into levels of high,medium, and low complexity, but only 28 of them were considered [9]. The other six arenot acute-care general hospitals; therefore, they are of little interest for this study. However,we included a field hospital, Hospital IFEMA (HIFEMA), which began operating on 22March 2020 and closed on 1 May 2020. In the CoM, although citizens can choose their publichospital and their primary care center, they are assigned a referral hospital depending onthe geographic area in which they live. Furthermore, the referral hospitals of the primarycare centers are the same as those of the patients under their care. Consequently, whencitizens have to be hospitalized, they go to their referral hospital because of its proximityand, as in many cases, because they have been treated there on previous occasions. Thisexplains why, if the geographical area that depends on a hospital has a high incidence ofcases that require hospitalization, the hospital in question has a high occupancy.
In the period analyzed in this study, 33 private hospitals in the CoM also admittedCOVID-19 patients, although for the purposes of this analysis, all of them were consideredas a single hospital (HPRIVATE). This was due to the difference in the number of bedswith respect to public hospitals (on 18 March 2020: 5885 vs. 12,807). This was also due tothe fact that many of them were monographic hospitals and, above all, because hospitaloccupancy data were received aggregated as a group during most of the study period.Table 1 shows the main characteristics of the hospitals considered within this study. Notethat the numbers of non-ICU and ICU beds were included as a mere reference of the sizesof the hospitals.
The Community of Madrid (CoM) is located in the center of Spain, with 6.7 millioninhabitants. The population density varies within the community itself, with the vastmajority of the population concentrated in the capital, Madrid, and its metropolitan area,making it one of the most densely populated regions in Europe. The population of Madrid,according to the latest 2019 census [10], is approximately 3.3 million. These inhabitantsare concentrated in an area of 600 square kilometers. Thus, the population density of thecapital city of Spain is 5500 persons per square kilometer. However, the appearance ofcases does not only depend on population density, but also on other factors, e.g., mobilityand social interaction.

Int. J. Environ. Res. Public Health 2021, 18, 3510 4 of 22
Table 1. List of the Community of Madrid’s (CoM’s) hospitals and their main characteristics.
ID Hospital Complexity Level Nº of Non-ICU Beds a Nº of ICU Beds a
1 HU12O High 1116 792 HULPR High 387 203 HGUGM High 1046 1084 HULPZ High 1137 355 HURYC High 773 676 HCSC High 717 617 HFJD High 507 188 HUPHM High 518 49
9 HGUC Medium 403 1910 HUMO Medium 285 1511 HUPA Medium 442 1412 HUSO Medium 344 1313 HUG Medium 400 3314 HUFA Medium 374 1215 HUF Medium 344 1016 HUIS Medium 295 817 HUIL Medium 358 818 HRJC Medium 363 319 HGV Medium 195 920 HTO b Medium 180 1621 HCCR Medium 152 022 HUSC Medium 103 4
23 HEE Low 75 024 HIE Low 168 425 HUHE Low 243 1026 HIC Low 159 927 HTA Low 91 628 HSE Low 134 6
29 HIFEMA c Field hospital 1150 1030 HPRIVATE d Medium/low 5523 362
a Average number of available beds during January and February 2020; b Average number of available bedsduring January and February 2019; c Number of available beds on 3 April 2020 when it was fully operative(opened at 22 March 2020); d Number of available beds on 18 March 2020.
The metropolitan region of Madrid follows a radio-centric spatial structure, whichis similar to the organization that can be found in cities such as London or Paris. Thereis a central core form around which different areas have been developed, forming belts.Figure 1 shows the locations of the public hospitals of the CoM. Note that most of thehospitals are in the metropolitan area of the city (Figure 2). The hospital occupancy demandwas heterogeneous in the CoM because the cumulative incidence of COVID-19 varied inthe different geographical areas. The areas with the highest incidence in March and Aprilwere located in the periphery of the capital—the lower and upper quadrants of the areashown in Figure 2, specifically in the regions where hospitals 17, 10, 12, and 16 are located.

Int. J. Environ. Res. Public Health 2021, 18, 3510 5 of 22
Figure 1. Map of the CoM with the locations of its public hospitals. The yellow tags correspond withthe IDs in Table 1. Black patches represent regions with similar numbers of inhabitants.
2.2. Data Description
It should be clarified that, during the pandemic, hospital beds were divided into twolarge groups (non-ICU beds and ICU beds); therefore, the collected data were rankedaccording to this classification. The beds assigned to each group were further subdividedinto available beds (beds that had all the equipment and personnel necessary for theirfunction), occupied beds (beds that were occupied by inpatients), and unoccupied beds(i.e., available beds that were not occupied). We also distinguished between the beds thatwere occupied by COVID-19 patients or non-COVID-19 patients. In pandemic waves,which pushed the CoM’s hospitals beyond their functional limits, it was necessary toorganize the beds in a different way in order to control the situation as well as possible.Indeed, this not only happened in the CoM, but also in other countries. So, for example,the National Health Service of England wisely stated that the “hospital capacity has hadto be organized in new ways as a result of the pandemic to treat COVID and non-COVIDpatients separately and safely... As a result caution should be exercised in comparingoverall occupancy rates between this year and previous years” [11]. Bearing this advice inmind, this paper analyzes the evolution of beds in the CoM’s hospitals according to thestructure and limits of the information received by the COVID-19 Control Center (CCC).

Int. J. Environ. Res. Public Health 2021, 18, 3510 6 of 22
Figure 2. Zoom of Figure 1 with a detail of the metropolitan area of Madrid (green square in Figure 1).
The data used in this study were supplied daily by each hospital, starting on 18 March2020 and finishing on 31 May 2020. The original dataset consisted of 34 public and 33private hospitals, although for the purposes of this study, we selected those described inTable 1. Notice that, although hospitals admitted COVID-19 patients prior to 18 March 2020,due to the lack of reliable data from hospitals during the beginning of the first pandemicwave, the series analyzed in this paper begins on 18 March 2020.
The CCC, in which some of the authors of this paper worked during the first wave, wascreated [12] by the CoM’s Government on 13 March 2020 due to the emergency situation.The CCC aimed to receive daily data from the hospitals, interact with them to filter anddebug errors, and use tools that allow their visualization. The information was obtained bymeans of a spreadsheet in which said hospitals filled out a template shared by all of themon a daily basis, as well as through a web application developed on the Microsoft Teamsplatform, in which data concerning the situations in the emergency departments were alsorequested as additional information. For their part, private hospitals sent their daily datain aggregate form only by means of a spreadsheet that had the same template as that usedby the public hospitals. The CCC was just in charge of digitizing information; its functionwas not to make decisions about the management of the hospitals.
2.3. Methodology
To achieve the goal of this research, a case study methodology was used because (1)there was an interest in knowing the “how” and “why” of the phenomenon, (2) there waslittle or no control over behavioral events, and (3) the study’s focus is a contemporary

Int. J. Environ. Res. Public Health 2021, 18, 3510 7 of 22
phenomenon—a “case” [13]. Building theory inductively from cases is likely to haveimportant strengths, such as novelty, testability, and empirical validity, which arise fromthe intimate linkage with empirical evidence” [14], and it is also “likely to produce theorythat is accurate, interesting, and testable”, as a wide range of data sources can be used,such as qualitative and quantitative documentations, data, and/or direct observations [15].
Based on the qualitative and quantitative data gathered for the case study, the dynamicresponse of the healthcare system consisting of the hospital network in the CoM wasanalyzed. In particular, both the demand and the capacity of the system were studied.System demand refers to the demand or the number of patients that require a service tobe provided at a hospital (in this case, the use of a hospital bed combined with treatmentand care services) with non-ICU and ICU beds. The availability of non-ICU and ICU bedsrefers to the readiness or disposal of beds in a hospital that can be offered to potential newpatients that demand this service.
In order to analyze the network’s response to the increase in the bed demand, weused the concepts of the bed margin and flexibility in this paper. According to Green [16],hospital occupancy is defined as the ratio of occupied beds to the total number of beds.Following this concept, we defined the bed margin as the ratio of unoccupied beds to thetotal number of available beds, where the number of unoccupied beds is the differencebetween the number of available beds and the occupied beds. Note that the proposed bedmargin is also related to the well-known concept of utilization in the context of operationsmanagement (see, e.g., [17,18]).
The flexibility of a system is not a novel concept. For example, in electric powersystems, it is used to characterize the ability of electricity generators to accommodate varia-tion and uncertainty in demand (see, e.g., [19,20]). In this paper, we define the flexibilityof a healthcare system as the system’s ability to accommodate a large and unexpectedincrease in bed demand by modulating the availability of beds across the hospital networkover time. Hospitals are managed in order to maintain the balance between quality andcosts. Small variations and uncertainties, as well as seasonal fluctuations, in bed demandare managed by hospitals without problems by maintaining an appropriate bed margin.However, dealing with rare abrupt increases in bed demand, such as those generated bythe COVID-19 pandemic, indicates a big challenge for hospitals that requires a differenttype of response—a flexibility induced by the response to a large perturbation.
In order to quantify this flexibility, we propose three different indexes (see Table 2):the Ramp Duration Until the Peak (RDUP), the Ramp Growth Until the Peak (RGUP), andthe Average Ramp Rate Until the Peak (ARRUP). According to Figure 3, the RDUP can beeasily computed from the raw data as the difference between the time where the peak wasreached tp and the starting time of the increase in the bed demand t0. In the same way, theRGUP can be obtained from the difference between the number of available beds at thepeak np and at the starting time of the increase in the demand n0.
However, to compute the ARRUP index, a robust estimation of the slope of theunderlying non-linear bed curve is required. In this paper, we first fit the Linear HingesModel (LHM) to the raw data, and then directly compute the slopes from the fitted LHM.The LHM was proposed by Sánchez-Úbeda et al. [21]; it is a piecewise linear model definedby K knots, the points specifying the pieces (see the illustrative example in Figure 3). Basedon the slopes given by the LHM, the ARRUP can be estimated by computing the weightedmean of the slopes just before the peak, where the weights are given by the proportionof the number of days within each segment. Furthermore, both the RDUP and the RGUPcan also be estimated directly from the LHM, providing a more robust estimation of theseindexes. In this paper, an implementation of the LHM fitting algorithm in the MatlabSoftware [22] was used.

Int. J. Environ. Res. Public Health 2021, 18, 3510 8 of 22
Table 2. Proposed flexibility indexes.
Index Description Units
RDUP Ramp Duration Until the Peak daysRGUP Ramp Growth Until the Peak bedsARRUP Average Ramp Rate Until the Peak beds/day
RDUP
ARRUP
RGU
P
Raw dataLHM
Figure 3. Graphic illustration of the proposed flexibility indicators and their estimation based on theLinear Hinges Model (LHM). The raw data represent the variation in the number of available bedswith time, with small random variations around a trend. The LHM is fitted to the raw data in orderto estimate the trend, allowing a robust determination of the three indexes.
Note that, although there exist plenty of curve-fitting models that can be used tofit the beds’ curve, such as polynomials or splines, the LHM was selected for estimatingthe flexibility indicators because it is especially suited for this problem, since it is anefficient approach to curve-fitting under stringent high-noise conditions and thus providesstraightforward information on slopes. Moreover, the main advantage of the LHM isthat its learning algorithm automatically selects the number and locations of the knots,adapting its complexity to the quality and availability of the data, and thus allows thedescription of a wide range of functional forms. In particular, the number and positionsof the knots are obtained automatically by using a learning algorithm that combines agreedy divide-and-conquer strategy with a computationally efficient pruning approachand special updating formulas [23].
3. Results
The results are presented first as an aggregate view of the healthcare system, andsecond as a disaggregated view by hospital. We distinguish between non-ICU and ICUbeds, and apply the proposed bed margin and flexibility indicators in order to quantify thedynamic response.
3.1. Aggregate View of the Healthcare System3.1.1. System Demand for Non-ICU and ICU Beds
The healthcare system of the CoM was stressed as the number of ill people by SARS-CoV-2 steeply increased in March 2020. Figure 4 shows the daily non-ICU beds occupiedby COVID-19 patients for the CoM’s hospitals, as well as the daily total non-ICU occupiedbeds (i.e., COVID-19 and non-COVID-19). Similarly, Figure 5 shows both the daily ICUbeds occupied by COVID-19 patients and the total occupied ICU beds. In the interpretationof the evolution of the curves for each type of bed, it should be taken into account that theaverage length of stay in an ICU bed was longer than that in a non-ICU bed, and that theflow of patients into ICU beds had a double origin: from the emergency department—inpatients with severe clinical presentation—or from non-ICU beds after clinical worseningof the symptoms, which occurred between 2 and 4 days after admission to the hospital [24].

Int. J. Environ. Res. Public Health 2021, 18, 3510 9 of 22
Finally, note that if the patient’s stay in the ICU was successful, they were re-admitted to anon-ICU bed.
Mar 18 Apr 01 Apr 15 Apr 29 May 13 May 27
2020
5000
10,000
15,000
20,000
Nº
of
occu
pie
d n
on
-IC
U b
ed
s
Total
COVID-19
Figure 4. Daily number of total occupied non-intensive care unit (ICU) beds and COVID-19-occupiednon-ICU beds.
Mar 18 Apr 01 Apr 15 Apr 29 May 13 May 27
2020
500
1000
1500
Nº
of occu
pie
d IC
U b
ed
s
Total
COVID-19
Figure 5. Daily number of total occupied intensive care unit (ICU) beds and COVID-19-occupiedICU beds.
This increase in hospital inpatients caused by the new disease implied that the demandfor beds in the CoM’s healthcare system grew rapidly during that period. Note that theweekly seasonal pattern, which is visible in the second part of the occupied bed time series(beyond 29 April 2020), was due to the recovery of the regular activity after the peak, whereelective patients were usually not admitted on weekends.
From 18 March 2020 to 31 March 2020 (13 days), the daily non-ICU inpatients withCOVID-19 increased from 4578 up to 13,725, i.e., an increase of 200%. During the sameperiod, the ICU admissions due to COVID-19 increased by 155% (from 590 to 1502).According to newspapers and television, during the peak period, the time spent by patientsin emergency rooms and hallways waiting for a bed increased dramatically in manyhospitals of the CoM (see, e.g., [25]).
3.1.2. Availability of Non-ICU and ICU Beds
Creating enough capacity in the CoM’s hospitals to deal with the COVID-19 demandwas a big challenge during March 2020. This capacity expansion meant not only increas-ing the availability of physical beds, but also of specialized personnel and the requiredequipment.

Int. J. Environ. Res. Public Health 2021, 18, 3510 10 of 22
In order to fulfill this objective, hospitals implemented several strategies. At first,operating rooms and semi-intensive care beds were transformed into fully operating ICUbeds within existing hospitals. Later, several hotels were turned into recovery units towhich non-critical patients could be transferred. A field hospital was also opened on 22March 2020 in an existing convention center (IFEMA) to release some of the pressure onpermanent hospitals. This hospital started with 185 non-ICU beds and reached a maximumat 3 April 2020 with 1150 and 10 non-ICU and ICU beds, respectively. It was operative until30 April 2020. Furthermore, from the demand side, the Spanish government implementedthe confinement of the country with severe restrictive measures to lower the spread of thevirus and to reduce the demand for beds in the short term, i.e., the so-called “flattening thecurve” [26,27].
Figure 6 compares the system’s capacity and the demand for non-ICU and ICU beds.This capacity is measured as the number of available beds. The numbers of non-ICU andICU beds provided by the system rose drastically to follow the growth of the demand forbeds.
Mar 18 Apr 01 Apr 15 Apr 29 May 13 May 27
2020
1.2
1.4
1.6
1.8
2
2.2
Nº
of non-I
CU
beds
104 (a) Daily non-ICU beds in CoM
Available beds
Occupied beds
Mar 18 Apr 01 Apr 15 Apr 29 May 13 May 27
2020
600
800
1000
1200
1400
1600
1800
Nº
of IC
U b
eds
(b) Daily ICU beds in CoM
Available beds
Occupied beds
Figure 6. Daily availability and occupation of beds in the CoM’s hospital system.
3.1.3. System Bed Margin
Figure 7 shows the daily number of unoccupied beds and the bed margin for both thenon-ICU and ICU beds. On 18 March 2020, at the beginning of the peak, the number ofunoccupied non-ICU beds was 4053, whereas the number of unoccupied ICU beds was 351,making the bed margins 22% and 29.8%, respectively. However, 29 March 2020 was theworst day in terms of the non-ICU bed margin (7.6%) for the health system as a whole; thenumber of unoccupied non-ICU beds reached a minimum value of 1688. For the ICU beds,the worst day was 30 March 2020, with 128 unoccupied ICU beds, which represents an ICUbed margin of 7.1%. From 1 April 2020, the margin started to recover. In particular, the

Int. J. Environ. Res. Public Health 2021, 18, 3510 11 of 22
non-ICU bed margin stabilized in May, with an average value of 27.3% (4664 unoccupiedbeds). On the other hand, the ICU bed margin continued increasing up to 50% (around 500unoccupied beds).
Mar 18 Apr 01 Apr 15 Apr 29 May 13 May 27
2020
2000
3000
4000
5000
6000N
º o
f N
on
-IC
U b
ed
s
200
300
400
500
600
Nº
of
ICU
be
ds
(a) Daily non-occupied beds in CoM
Mar 18 Apr 01 Apr 15 Apr 29 May 13 May 27
2020
10
20
30
40
50
Be
ds m
arg
in (
%)
(b) Daily beds margin (%) in CoM
Non-ICU
ICU
Figure 7. Daily unoccupied beds and the bed margin (%) in the CoM’s hospital system.
3.1.4. Healthcare System Flexibility
Figure 8 shows the LHM obtained for the available non-ICU and ICU beds. The LHMfor the non-ICU beds consisted of eight knots, whereas the model for the ICU beds hadK = 7.
According to the LHM for non-ICU beds (Figure 8, top), the peak was on 2 April 2020,when the maximum number of available non-ICU beds was reached. This model detectedtwo different ramps until the peak (see Table 3). In the first period, the slope was around384 beds/day over 11 days. Just four days, before the peak, during the second segmentgiven by the model, the ramp rate went down to around 92 non-ICU beds/day. Somethingsimilar happened for the available ICU beds, where the slope also slowed down just beforethe peak (Figure 8, bottom). In this case the LHM estimated three segments until 7 April2020 (see Table 4), with a slope of nearly 61 ICU beds/day during the first 10 days. Theduration of the third ramp was six days, with a rate of around 9 beds/day. The reductionwith time in the slopes of both non-ICU and ICU available beds confirmed the great effortsduring the first days to increase the bed capacity, as well as the difficulties in obtainingadditional capacity near the peak.
Based on these LHMs, the flexibility indicators were estimated (see Tables 3 and 4). Inparticular, the ARRUP for non-ICU beds was 305.56 beds/day (384.47 × 0.73 + 92.22 × 0.27),the RDUP was 15 days, and the RGUP was 4598 beds. For the ICU beds, the ARRUP was36.73 beds/day, the RDUP was 20 days, and the RGUP was 735 beds.

Int. J. Environ. Res. Public Health 2021, 18, 3510 12 of 22
Mar 18 Apr 01 Apr 15 Apr 29 May 13 May 27
2020
1.7
1.8
1.9
2
2.1
2.2
Nº
of non-I
CU
beds
104 (a) Daily available non-ICU beds in CoM
LHM
Available beds
Mar 18 Apr 01 Apr 15 Apr 29 May 13 May 27
2020
1200
1400
1600
1800
Nº
of IC
U b
eds
(b) Daily available ICU beds in CoM
LHM
Available beds
Figure 8. Model of the available beds using LHM.
Table 3. Estimated slopes for available non-ICU beds.
Starting Date End Date Days Slope Weight
18 March 2020 29 March 2020 11 384.47 0.7329 March 2020 2 April 2020 4 92.22 0.27
Table 4. Estimated slopes for available ICU beds.
Starting Date End Date Days Slope Weight
18 March 2020 28 March 2020 10 60.77 0.528 March 2020 1 April 2020 4 18.78 0.21 April 2020 7 April 2020 6 8.64 0.3
3.2. Disaggregated View by Hospital
In the previous section, the system’s response to the COVID-19 pandemic was an-alyzed. This provided a global view of the aggregated response of the CoM’s hospitalnetwork as a unique system. However, not all the hospitals were confronted with thesame bed demand, nor did they provide the same flexibility in order to increase the bedcapabilities. In this section, we provide a disaggregated view by hospital. In order toquantify the response of each hospital, the concepts of the bed margin and flexibility wereapplied straightforwardly to each hospital.
Int. J. Environ. Res. Public Health 2021, 18, 3510 13 of 22
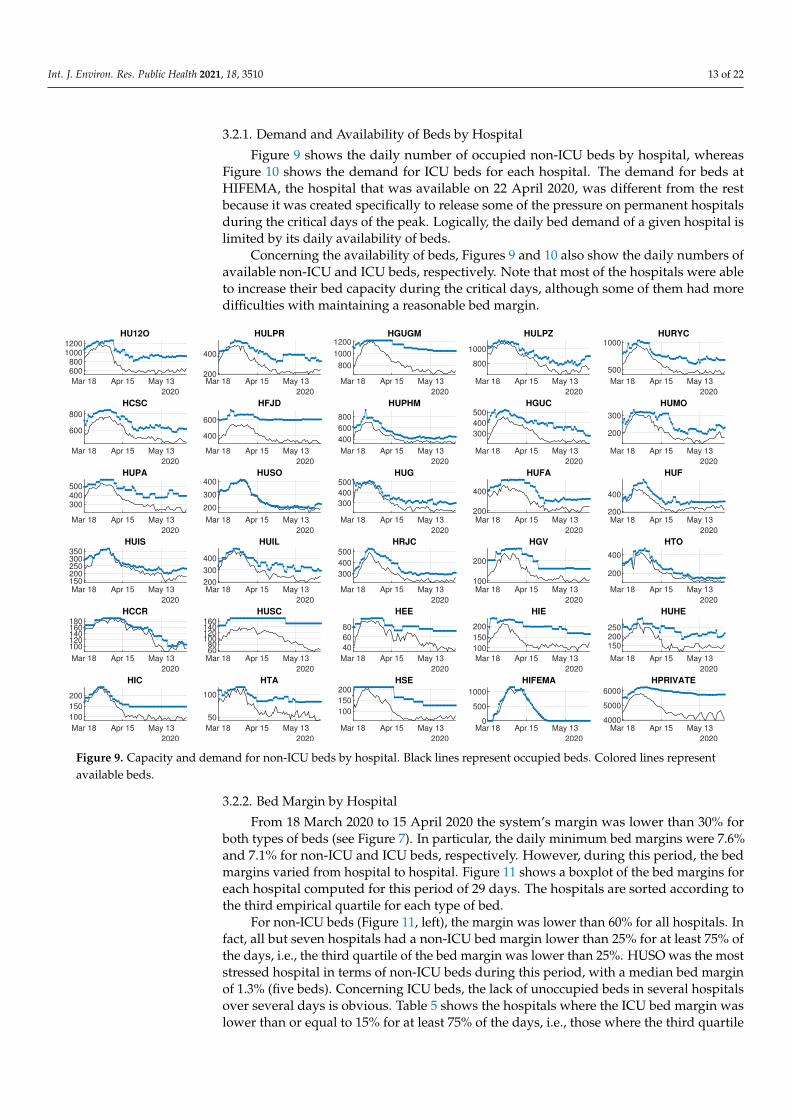
3.2.1. Demand and Availability of Beds by Hospital
Figure 9 shows the daily number of occupied non-ICU beds by hospital, whereasFigure 10 shows the demand for ICU beds for each hospital. The demand for beds atHIFEMA, the hospital that was available on 22 April 2020, was different from the restbecause it was created specifically to release some of the pressure on permanent hospitalsduring the critical days of the peak. Logically, the daily bed demand of a given hospital islimited by its daily availability of beds.
Concerning the availability of beds, Figures 9 and 10 also show the daily numbers ofavailable non-ICU and ICU beds, respectively. Note that most of the hospitals were ableto increase their bed capacity during the critical days, although some of them had moredifficulties with maintaining a reasonable bed margin.
Mar 18 Apr 15 May 13
2020
600800
10001200
HU12O
Mar 18 Apr 15 May 13
2020
200
400
HULPR
Mar 18 Apr 15 May 13
2020
800
1000
1200HGUGM
Mar 18 Apr 15 May 13
2020
800
1000
HULPZ
Mar 18 Apr 15 May 13
2020
500
1000HURYC
Mar 18 Apr 15 May 13
2020
600
800
HCSC
Mar 18 Apr 15 May 13
2020
400
600
HFJD
Mar 18 Apr 15 May 13
2020
400
600
800
HUPHM
Mar 18 Apr 15 May 13
2020
300
400
500HGUC
Mar 18 Apr 15 May 13
2020
200
300
HUMO
Mar 18 Apr 15 May 13
2020
300400500
HUPA
Mar 18 Apr 15 May 13
2020
200
300
400HUSO
Mar 18 Apr 15 May 13
2020
300
400
500HUG
Mar 18 Apr 15 May 13
2020
200
400
HUFA
Mar 18 Apr 15 May 13
2020
200
400
HUF
Mar 18 Apr 15 May 13
2020
150200250300350
HUIS
Mar 18 Apr 15 May 13
2020
200
300
400
HUIL
Mar 18 Apr 15 May 13
2020
300
400
500
HRJC
Mar 18 Apr 15 May 13
2020
100
200
HGV
Mar 18 Apr 15 May 13
2020
200
400
HTO
Mar 18 Apr 15 May 13
2020
100120140160180
HCCR
Mar 18 Apr 15 May 13
2020
6080
100120140160
HUSC
Mar 18 Apr 15 May 13
2020
40
60
80
HEE
Mar 18 Apr 15 May 13
2020
100
150
200
HIE
Mar 18 Apr 15 May 13
2020
150200250
HUHE
Mar 18 Apr 15 May 13
2020
100
150
200
HIC
Mar 18 Apr 15 May 13
2020
50
100
HTA
Mar 18 Apr 15 May 13
2020
100
150
200HSE
Mar 18 Apr 15 May 13
2020
0
500
1000
HIFEMA
Mar 18 Apr 15 May 13
2020
4000
5000
6000
HPRIVATE
Figure 9. Capacity and demand for non-ICU beds by hospital. Black lines represent occupied beds. Colored lines representavailable beds.
3.2.2. Bed Margin by Hospital
From 18 March 2020 to 15 April 2020 the system’s margin was lower than 30% forboth types of beds (see Figure 7). In particular, the daily minimum bed margins were 7.6%and 7.1% for non-ICU and ICU beds, respectively. However, during this period, the bedmargins varied from hospital to hospital. Figure 11 shows a boxplot of the bed margins foreach hospital computed for this period of 29 days. The hospitals are sorted according tothe third empirical quartile for each type of bed.
For non-ICU beds (Figure 11, left), the margin was lower than 60% for all hospitals. Infact, all but seven hospitals had a non-ICU bed margin lower than 25% for at least 75% ofthe days, i.e., the third quartile of the bed margin was lower than 25%. HUSO was the moststressed hospital in terms of non-ICU beds during this period, with a median bed marginof 1.3% (five beds). Concerning ICU beds, the lack of unoccupied beds in several hospitalsover several days is obvious. Table 5 shows the hospitals where the ICU bed margin waslower than or equal to 15% for at least 75% of the days, i.e., those where the third quartile

Int. J. Environ. Res. Public Health 2021, 18, 3510 14 of 22
of the bed margin was lower than 15%. Furthermore, the second quartile of the number ofunoccupied ICU beds was equal to 1 for many hospitals, i.e., for half of the days, no morethan one ICU bed was unoccupied in those hospitals. HUMO and HCCR did not haveunoccupied ICU beds for at least 75% of the days.
Mar 18 Apr 15 May 13
2020
50
100
HU12O
Mar 18 Apr 15 May 13
2020
304050
HULPR
Mar 18 Apr 15 May 13
2020
50
100
HGUGM
Mar 18 Apr 15 May 13
2020
50
100
150HULPZ
Mar 18 Apr 15 May 13
2020
50
100
HURYC
Mar 18 Apr 15 May 13
2020
40
60
80
HCSC
Mar 18 Apr 15 May 13
2020
50
100
HFJD
Mar 18 Apr 15 May 13
2020
40
60
80
HUPHM
Mar 18 Apr 15 May 13
2020
102030
HGUC
Mar 18 Apr 15 May 13
2020
10
20
30
HUMO
Mar 18 Apr 15 May 13
2020
10
20
30
HUPA
Mar 18 Apr 15 May 13
2020
10
20
30
HUSO
Mar 18 Apr 15 May 13
2020
20
40
HUG
Mar 18 Apr 15 May 13
2020
20
40
HUFA
Mar 18 Apr 15 May 13
2020
20
40
HUF
Mar 18 Apr 15 May 13
2020
10
20
30
40HUIS
Mar 18 Apr 15 May 13
2020
10
20
30
HUIL
Mar 18 Apr 15 May 13
2020
20
40
HRJC
Mar 18 Apr 15 May 13
2020
10
20
30
HGV
Mar 18 Apr 15 May 13
2020
10
20
HTO
Mar 18 Apr 15 May 13
2020
0
5HCCR
Mar 18 Apr 15 May 13
2020
0
5
10
HUSC
Mar 18 Apr 15 May 13
2020
0
5
10
HEE
Mar 18 Apr 15 May 13
2020
10
20
30HIE
Mar 18 Apr 15 May 13
2020
10
20
30HUHE
Mar 18 Apr 15 May 13
2020
10
20HIC
Mar 18 Apr 15 May 13
2020
5
10
HTA
Mar 18 Apr 15 May 13
2020
510152025
HSE
Mar 18 Apr 15 May 13
2020
0
5
10HIFEMA
Mar 18 Apr 15 May 13
2020
200
400HPRIVATE
Figure 10. Capacity and demand for ICU beds by hospital. Black lines represent occupied beds. Colored lines representavailable beds.
Table 5. Quartiles (1 to 3) of the bed margin (%) and number of unoccupied ICU beds for hospitals.Q1, Q2, and Q3 are the three quartiles.
Hospital ICU Bed Margin Unoccupied ICU BedsQ1 Q2 Q3 Q1 Q2 Q3
HUMO 0.00 0.00 1.09 0 0 0HCCR 0.00 0.00 5.00 0 0 0HUG 1.27 1.89 5.94 1 1 3HUIL 0.00 3.33 6.67 0 1 2HTA 0.00 8.33 8.33 0 1 1HGUGM 0.00 6.72 8.99 0 8 11HUSO 2.34 5.00 9.38 1 1 3HIC 0.00 6.67 9.52 0 1 2HTO 0.00 7.14 10.71 0 2 3HUHE 0.00 6.67 10.81 0 1 3HUIS 0.00 4.00 12.85 0 1 5HUF 4.45 9.80 14.58 2 5 6HULPR 6.96 10.34 14.59 4 6 8HU12O 9.42 12.61 14.64 9 12 15

Int. J. Environ. Res. Public Health 2021, 18, 3510 15 of 22
0 20 40 60 80
Beds Margin (%)
(a) Non-ICU Beds
HUSOHCCRHUISHULPZHICHUGHUILHCSCHIFEMAHUPAHPRIVATEHUMOHURYCHEEHGUCHUPHMHTAHTOHUFHGUGMHRJCHUHEHUFAHULPRHU12OHGVHUSCHFJDHSEHIE
0 20 40 60 80
Beds Margin (%)
(b) ICU Beds
HUMOHCCRHUGHUILHTAHGUGMHUSOHICHTOHUHEHUISHUFHULPRHU12OHULPZHSEHCSCHUPAHUPHMHGVHIEHUFAHURYCHFJDHRJCHPRIVATEHGUCHUSCHEEHIFEMA
Figure 11. Compact boxplot representation of the non-ICU and ICU bed margins (%) by hospital. For each distribution, themedian is represented by a circled dot, the interquartile range by a rectangle, the whiskers by lines, and the outliers byempty circles.
3.2.3. Flexibility by Hospital
It was possible to calculate the previously defined indexes—RDUP, RGUP, and ARRUP(see Table 2)—for each hospital using the same approach based on the LHM. In this case, itwas even more necessary to have a robust slope estimation mechanism because the randomvariations around the main curve were more important. For example, Figure 12 shows thedetails of the LHM fitted to the available ICU beds of four different hospitals. Notice thatthe LHM allows the extraction of the main underlying response for each particular hospitalby assimilating the daily fluctuations in the original data.
Table 6 shows the estimated values of the indexes for the non-ICU beds for eachhospital, whereas Table 7 shows the results for the ICU beds. According to the first table,larger public hospitals, such as HU120, HGUGM, and HULPZ, which had more than 1000regular beds on 18 March 2020, had a lower RGUP and ARRUP than other medium-sizedhospitals, such as HUF, HRJC, or HUPHM. For example, HU120 increased the numberof available non-ICU beds by 188 (10%), whereas the HUF was able to increase by 241non-ICU beds (70%). However, according to Table 7, the HULPZ was the public hospitalwith the largest RGUP in ICU beds, as it was able to increase by 82 ICU beds (120%) in 15days. HU12O and HGUGM also had a large RGUP.

Int. J. Environ. Res. Public Health 2021, 18, 3510 16 of 22
Mar 18 Apr 01 Apr 15 Apr 29
2020
80
100
120
HGUGM
Mar 18 Apr 01 Apr 15 Apr 29
2020
80
100
120
140
HULPZ
Available beds
LHM
Mar 18 Apr 01 Apr 15 Apr 29
2020
70
80
90
HCSC
Mar 18 Apr 01 Apr 15 Apr 29
2020
20
25
30
35
HUMO
Figure 12. Model of the number of available ICU beds using the LHM (details of four hospitals).
Table 6. Non-ICU bed flexibility by hospital. The initial and the maximum numbers of availablebeds, as well as the three flexibility indicators, are shown for each hospital. The top eight hospitalshave a high complexity (see Table 1).
HospitalAvailable Beds FlexibilityIni Max RGUP RDUP ARRUPBeds Beds Beds Days Beds/Day
HU12O 1069 1,257 188 21 9.4HULPR 388 529 141 14 10.8HGUGM 1112 1,223 111 12 10.1HULPZ 1034 1,112 78 9 9.8HURYC 802 1,024 222 12 20.2HCSC 712 867 155 16 10.4HFJD 577 680 103 11 10.2HUPHM 571 835 264 11 26.3
HGUC 446 522 76 13 6.4HUMO 259 330 71 13 5.9HUPA 488 569 81 15 5.8HUSO 312 418 106 19 5.9HUG 487 498 11 15 0.8HUFA 408 516 108 14 8.4HUF 328 569 241 16 16.0HUIS 290 368 78 18 4.6HUIL 346 481 135 14 10.4HRJC 298 521 223 12 20.3HGV 195 260 65 14 5.0HTO 288 460 172 17 10.7HCCR 160 190 30 27 1.1HUSC 139 170 31 12 2.8

Int. J. Environ. Res. Public Health 2021, 18, 3510 17 of 22
Table 6. Cont.
HospitalAvailable Beds FlexibilityIni Max RGUP RDUP ARRUPBeds Beds Beds Days Beds/Day
HEE 78 97 19 20 1.0HIE 149 237 88 3 43.7HUHE 262 305 43 15 3.0HIC 175 240 65 12 5.9HTA 103 116 13 19 0.7HSE 205 213 8 29 0.3
HIFEMA 1 1155 1154 17 72.1HPRIVATE 5446 6228 782 15 55.9
Table 7. ICU bed flexibility by hospital. The initial and the maximum numbers of available beds, aswell as the three flexibility indicators, are shown for each hospital. The top eight hospitals have ahigh complexity (see Table 1).
HospitalAvailable Beds FlexibilityIni Max RGUP RDUP ARRUPBeds Beds Beds Days Beds/Day
HU12O 61 112 51 34 1.6HULPR 22 58 36 11 3.6HGUGM 79 134 55 22 2.6HULPZ 70 152 82 15 5.8HURYC 78 123 45 13 3.8HCSC 63 92 29 28 1.1HFJD 66 103 37 9 4.6HUPHM 69 83 14 22 0.7
HGUC 24 39 15 49 0.3HUMO 23 37 14 20 0.7HUPA 28 39 11 14 0.9HUSO 17 33 16 14 1.3HUG 40 58 18 9 2.2HUFA 31 60 29 45 0.7HUF 22 52 30 15 2.1HUIS 17 41 24 26 1.0HUIL 18 30 12 26 0.5HRJC 41 49 8 18 0.5HGV 28 34 6 33 0.2HTO 21 28 7 10 0.8HCCR 3 5 2 20 0.1HUSC 6 13 7 7 1.2
HEE 4 13 9 15 0.6HIE 19 30 11 3 5.5HUHE 14 30 16 19 0.9HIC 12 21 9 10 1.1HTA 12 12 0 0 0.0HSE 19 25 6 14 0.5
HIFEMA 0 10 10 17 0.6HPRIVATE 253 409 156 23 7.1

Int. J. Environ. Res. Public Health 2021, 18, 3510 18 of 22
4. Discussion
Analyzing healthcare data through the first wave of SARS-CoV-2 has brought up anopportunity to better understand hospital performance under these severe circumstances.Specifically, by analyzing the flexibility and bed margin, it is possible to dynamicallygraph—as an alternative or complement to other, more static models—not only the day-to-day response of the system as a whole for all of the hospitals within the CoM region, butalso the response of each hospital (Figures 9 and 10). These graphs provide information forhospital managers and healthcare system supervisors, since they can check (in a dynamicway) certain situations that are referred to later on.
This paper focuses on modeling the hospital capacities in terms of ICU and non-ICU bedsduring the pandemic while distinguishing between patients with and without COVID-19,since most publications focus on bed management in other contexts [28–33] (except forCondes and Arribas [34] and Fanelli et al. [35]). We have not found a work in the literaturethat gives information on this topic with the details and large number of hospital andinpatients that this article uses, highlighting the fact that the hospitals involved in this studywere in the epicenter of the first wave of the COVID-19 pandemic at the European level.Therefore, the data presented here could be beneficial in the future in order to comparewhat happened during the first wave in other healthcare systems and to better preparein the event new epidemic waves caused by SARS-CoV-2 or other pathogens. Finally,this article shows a way to classify hospitalized patients in pandemic situations and tomanage infected and uninfected inpatients. Among other things, this classification makesit possible, with the previously mentioned safeguards, to compare the first wave withthe pre-pandemic situation in order to know how many patients could not be admittedto hospitals for diseases other than COVID-19. The previous situation, in our opinion,should be a clear invitation to other researchers to address such a critical scenario whenthat information is available.
The above-mentioned achievements were obtained by analyzing and extracting infor-mation from the available data from the CCC. The relevant figures of the first pandemicwave in the CoM were: From 18 March 2020 to 31 March 2020 (13 days), COVID-19 inpa-tients increased by 200% in non-ICU wards and by 155% in ICU wards. The maximumoccupancy of available beds took place on 31 March 2020. On that day, in all of the hospitalsthat we analyzed, the total number of available beds was 23,463, of which 21,549 (92%)were occupied. The capacity in many hospitals was exhausted, but the fear that the demandwould continue to increase caused the number of available beds to increase by 160 in 48 h,reaching the figure of 23,623 beds on 2 April 2020, with an occupancy of 90.3%.
The previous paragraph describes the first wave scenario in the CoM. Our analysis,which was focused on the proposed bed margin and flexibility indexes, shows that hospitalsadapted to unexpected requirements with different responses. Notice the following fact:All but seven hospitals presented a non-ICU bed margin (Figure 11, left) lower than 25%for at least 75% of the days, and one of them presented a median bed margin of 1.3% (fivebeds). Focusing on ICU beds, the lack of unoccupied beds in several hospitals over severaldays was notorious (Table 5). For at least 75% of the days, in 14 of the 30 hospitals analyzed,the ICU bed margin was lower than or equal to 15%, and two hospitals lacked free ICUbeds. Occupied non-ICU beds and ICU beds did not return to the values of 18 March 2020until the third week of April and the first week of May, respectively.
Under normal conditions, hospitals sometimes operate with difficulties, especially inemergency departments. Contrary to popular belief, hospitals are complex but vulnerableinstitutions [36]. This vulnerability is mainly due to three factors: First, as seen withpersonal protective equipment and laboratory reagents, they are highly dependent onexternal supplies. Second, the key staff is highly specialized and is not easy to increaseor replace. Third, their infrastructure (beds, doctor offices, medical equipment, etc.) isdimensioned to care for a range of pathologies and a maximum number of patients.Therefore, a modest variation in the admission volume, as happens when the seasonal fluarrives, can lead the hospital beyond its functional reserves.

Int. J. Environ. Res. Public Health 2021, 18, 3510 19 of 22
It is worth noting how unexpected demands cause situations like those shown inFigures 4 and 5. These figures compare the beds occupied by patients with or withoutCOVID-19 who were hospitalized inside and outside ICUs. Moreover, they show how thedemand for hospitalizations due to COVID-19 severely reduced the hospitals’ capacities toadmit new patients with other types of pathologies, especially in the ICUs. Flexibility inavailable beds is a significant driver for managing hospitals efficiently, and its importanceacquires greater relevance in situations such as the COVID-19 pandemic.
Quantifying the flexibility with a regression technique such as the LHM is an attemptto model the dynamic performance from the observed data. More specifically, the LHMwas used to obtain a robust estimation of the proposed flexibility indexes by means ofthe piecewise slope estimations that it provided for the time series of the number ofavailable beds. In particular, the LHM obtained for available non-ICU and ICU beds inthe CoM’s whole health system detected several different ramps before and after the peak(see Figure 8). The reduction of the available beds after the peak is explained easily by thesystematic decrease in bed demand. However, the slowdown in the ramp rate of availablebeds started before the bed demand decreased (see Figure 5). The systematic reduction inthe bed margin before the peak is noticeable for both non-ICU and ICU beds (see Figure 6);thus, the ramps began to slow down as they approached the peak. The justification issupported by the reduction in bed demand and the system’s limitations for additionalcapacity when the bed demand was peaking. These limitations show up due to the lack ofextra physical space, equipment, and qualified personnel.
The flexibility performance indicators and the LHM model were used in an attemptto provide insights that could help improve the hospitals’ management and decisionmaking. However, it cannot be determined a priori what the optimal level of beds orhuman resources for facing a pandemic crisis should be. Unfortunately, it is not possible torespond to this question until after a new epidemic wave is addressed.
Figures 9 and 10 show the supply of and demand for beds. The observed variationscan be explained, in a summarized way, by saying that hospitals of high complexity, whichare those with more beds, generally fared better than hospitals of lower complexity (whichare the ones with the fewest beds). This fact emphasizes the importance of having areal-time control panel that could avoid having hospitals under the pressure of a verynarrow bed margin. Distributing inpatients throughout the hospital system can ease thepressure on some hospitals. In this way, two main objectives will be achieved in a verycomplex environment: avoiding the professionals’ exhaustion and providing the best careto patients. Let us remember that both objectives are intimately interweaved.
This paper focuses on the first wave of the COVID-19 pandemic in a specific geo-graphic area (the CoM in Spain). The proposed model is dynamic (compared to existingstatic models) and could be used in other geographic regions, as well as in future wavesof pandemics or other health crises. The introduction of new mathematical models foremulating the dynamics of a hospital network in terms of capacity, flexibility, and bedmargin will pave the way to a better understanding of the impacts of health policies andresource management during health crises. An example of this type of research is the workby Wood [37], where the ICU capacity of a large British public hospital in the context ofCOVID-19 was analyzed using public data from the Intensive Care National Audit andResearch Centre [38].
5. Conclusions
The main objective of our study was to analyze the dynamic response of the CoM’shospitals during the first wave of the SARS-CoV-2 pandemic. In order to carry out thisanalysis, a set of very informative indicators was proposed. These indexes were able tosummarize the observed dynamics of the curve of the available beds during the pandemicin a simple way. In particular, we proposed the bed margin as a useful index of the availableresources, as well as three new indicators for capturing the flexibility with respect to thegrowing demand for beds. The main indicator of flexibility is the Average Ramp Rate Until

Int. J. Environ. Res. Public Health 2021, 18, 3510 20 of 22
the Peak (ARRUP), but it cannot be interpreted in isolation. The Ramp Duration Until thePeak (RDUP) and the Ramp Growth Until the Peak (RGUP) provide useful informationthat allows one to answering questions, such as: For how many days can the observedramp rate be maintained? What is the maximum number of beds that can be available?
Our results, which are based on the proposed bed margin and flexibility indexes,show that the hospital network in the CoM can increase the number of available ICU bedswith a rate of at least 61 beds/day for 10 days. Furthermore, the considered hospitalswere able to adapt to unexpected requirements with different responses. This study offersvaluable insights concerning not only the system’s response, but also about the individualresponses of the CoM’s hospitals.
The proposed indicators are ready to use for monitoring of networks of hospitals. Forexample, the estimated indexes for a particular hospital during the first pandemic wave canbe used as a reference for this hospital, which is useful for monitoring its behavior during asimilar pandemic wave. Future research could apply the proposed methodology based onthe bed margin and flexibility indexes in order to analyze a health system’s response duringother pandemic waves or similar catastrophes. The comparison of our findings during thisfirst wave with those of future responses may provide additional insights. Moreover, dueto the existence of particular characteristics of the hospitals that could affect their dynamicresponses under these critical circumstances, future research may be developed in order toidentify machine learning models that are able to estimate a given hospital’s flexibility as afunction of its characteristics.
Author Contributions: Conceptualization, E.F.S.-Ú., P.S.-M., M.T.-E., Á.D.R.-M., M.F.M.-C., andJ.-L.P.; methodology, E.F.S.-Ú.; software, E.F.S.-Ú.; validation, E.F.S.-Ú., P.S.-M., M.T.-E., Á.D.R.-M.,M.F.M.-C., and J.-L.P.; formal analysis, E.F.S.-Ú. and P.S.-M.; data curation, M.T.-E. and E.F.S.-Ú.;writing—original draft preparation, E.F.S.-Ú., J.-L.P., and M.T.-E.; writing—review and editing, E.F.S.-Ú., P.S.-M., M.T.-E., Á.D.R.-M., M.F.M.-C., and J.-L.P.; visualization, E.F.S.-Ú. and P.S.-M.; supervision,E.F.S.-Ú. and M.F.M.-C. All authors have read and agreed to the published version of the manuscript.
Funding: This research received no external funding.
Institutional Review Board Statement: Submission for ethical approval is not applicable. The studydid not involve humans or animals, limiting itself to the use of hospital resources.
Informed Consent Statement: Not applicable.
Data Availability Statement: Restrictions apply to the availability of these data. The data wereobtained from the network of public and private hospitals in the CoM and are available from theCCC with the permission of the Department of Health, CoM Government. The dataset is neitherpublic nor available in the way that it has been used as a source in this article.
Acknowledgments: We would like to thank all of the hospital personnel who worked with andhelped those in need during the arrival of this pandemic. They coped with scarce resources indangerous situations, enduring long working hours. We could not have overcome the first fightagainst COVID-19 without them.
Conflicts of Interest: The authors declare no conflict of interest.
Software Availability Statement: The LHM fitting software used in this study is available from IIThttp://www.iit.comillas.edu/, but restrictions apply to the availability of the software, which is notpublicly available.
AbbreviationsThe following abbreviations are used in this manuscript:
AC Autonomous CommunityARRUP Ramp Duration Until the PeakCCC COVID-19 Control CenterCoM Autonomous Community of MadridCOVID-19 Coronavirus Disease 2019
Int. J. Environ. Res. Public Health 2021, 18, 3510 21 of 22
CS Consejería de Sanidad—Departments of HealthDEA Data Envelopment AnalysisICU Intensive Care UnitLHM Linear Hinges Modelnon-ICU Non-Intensive Care UnitRDUP Ramp Duration Until the PeakRGUP Ramp Growth Until the PeakSARS-CoV-2 Severe Acute Respiratory Syndrome Coronavirus 2SNS Sistema Nacional de Salud—Spanish National Health System
References1. Kaplan, E.H. Containing 2019-nCoV (Wuhan) coronavirus. Health Care Manag. Sci. 2020, 23, 311–314. [CrossRef] [PubMed]2. US Department of Health and Human Services. Pandemic Influenza Plan: 2017 Update. Technical Report. 2017. Available online:
https://www.cdc.gov/flu/pandemic-resources/pdf/pan-flu-report-2017v2.pdf (accessed on 25 October 2020).3. Leiva, C. Manual de Procedimientos en Gestión de Crisis Volume 2; Crisis Management: Madrid, Spain, 2007.4. Bekker, R.; Koole, G.; Roubos, D. Flexible bed allocations for hospital wards. Health Care Manag. Sci. 2016, 20, 453–466. [CrossRef]
[PubMed]5. Ministerio de Sanidad, Consumo y Bienestar de España. Centro de Coordinación de Alertas y Emergencias Sanitarias. Actual-
ización nº 62. Enfermedad por el Coronavirus (Covid-19). 2020. Available online: https://www.mscbs.gob.es/profesionales/saludPublica/ccayes/alertasActual/nCov/documentos/Actualizacion_62_COVID-19.pdf (accessed on 22 January 2021)
6. European Centre for Disease Prevention and Control. Historical Data (to 14 December 2020) on the Daily Number of NewReported COVID-19 Cases and Deaths Worldwide. Available online: https://www.ecdc.europa.eu/en/publications-data/download-todays-data-geographic-distribution-covid-19-cases-worldwide (accessed on 22 January 2021).
7. European Centre for Disease Prevention and Control. Data on Hospital and ICU Admission Rates and Current Occupancy forCOVID-19. Available online: https://www.ecdc.europa.eu/en/publications-data/download-data-hospital-and-icu-admission-rates-and-current-occupancy-covid-19 (accessed on 22 January 2021).
8. Bernal-Delgado, E.; García-Armesto, S.; Oliva, J.; Sánchez Martínez, F.I.; Repullo, J.R.; Peña-Longobardo, L.M.; Manuel, R.L.;Hernández-Quevedo, C. Spain: Health system review. In Health Systems in Transition; World Health Organization: Geneva,Switzerland, 2018; Volume 20, pp. 1–179.
9. Consejería de Sanidad de la Comunidad de Madrid. Memoria Anual de Actividad del Servicio Madrileño de Salud 2018.Technical Report. Consejería de Sanidad de la Comunidad de Madrid, 2019. Available online: http://www.madrid.org/bvirtual/BVCM020283.pdf (accessed on 10 September 2020).
10. The National Statistics Institute. The National Statistics Institute Data Base. Available online: https://www.ine.es (accessed on 3September 2020).
11. National Health Service (NHS). Bed Availability and Occupancy. Available online: https://www.england.nhs.uk/statistics/statistical-work-areas/bed-availability-and-occupancy/ (accessed on 24 January 2021).
12. Comunidad de Madrid. Díaz Ayuso Visita el Nuevo Centro de Control Permanente del Coronavirus de la Comunidad de Madrid.Available online: https://www.comunidad.madrid/noticias/2020/03/14/diaz-ayuso-visita-nuevo-centro-control-permanente-coronavirus-comunidad-madrid (accessed on 27 January 2021).
13. Yin, R. Case Study Research and Applications: Design and Methods; SAGE Publications: Thousand Oaks, CA, USA, 2017.14. Eisenhardt, K.M. Building Theories from Case Study Research. Acad. Manag. Rev. 1989, 14, 532–550. [CrossRef]15. Eisenhardt, K.M.; Graebner, M.E. Theory Building From Cases: Opportunities And Challenges. Acad. Manag. J. 2007, 50, 25–32.
[CrossRef]16. Green, L.V. How Many Hospital Beds? INQUIRY J. Health Care Organ. Provis. Financ. 2002, 39, 400–412. [CrossRef] [PubMed]17. Chase, F.; Jacobs, F.; Aquilano, N. Operations Management for Competitive Advantage; McGraw-Hill/Irwin Series; Tata McGraw-Hill:
New York, NY, USA, 2006.18. Gellman, M.; Turner, J. Encyclopedia of Behavioral Medicine; Springer: New York, NY, USA, 2019.19. Lannoye, E.; Flynn, D.; O’Malley, M. Evaluation of Power System Flexibility. IEEE Trans. Power Syst. 2012, 27, 922–931. [CrossRef]20. Mohandes, B.; Moursi, M.S.E.; Hatziargyriou, N.; Khatib, S.E. A Review of Power System Flexibility With High Penetration of
Renewables. IEEE Trans. Power Syst. 2019, 34, 3140–3155. [CrossRef]21. Sánchez-Úbeda, E.F.; Wehenkel, L. The Hinges model: A one-dimensional continuous piecewise polynomial model. In
Proceedings of the International Congress on Information Processing and Management of Uncertainty in Knowledge basedSystems, IPMU98, Paris, France, 6–10 July 1998.
22. MATLAB. 9.6.0.1114505 (R2019a) Update 2. Available online: https://www.mathworks.com/ (accessed on 16 March 2021).23. Sánchez-Úbeda, E.F. Models for data analysis: Contributions to automatic learning. Ph.D. Thesis, Universidad Pontificia Comillas
de Madrid, Madrid, Spain, 1999.24. European Centre for Disease Prevention and Control. Clinical Characteristics of COVID-19. Available online: https://www.ecdc.
europa.eu/en/covid-19/latest-evidence/clinical (accessed on 5 September 2020).

Int. J. Environ. Res. Public Health 2021, 18, 3510 22 of 22
25. Abril, G. La Paz: A Madrid Hospital at War against Covid-19. El Pais Semanal, 24 April 2020. Available online: https://english.elpais.com/eps/2020-04-24/la-paz-a-madrid-hospital-at-war-against-covid-19.html (accessed on 15 September 2020).
26. Anderson, R.; Heesterbeek, H.; Klinkenberg, D.; Déirdre Hollingsworth, T. How will country-based mitigation measures influencethe course of the COVID-19 epidemic? Lancet 2020, 395, 931–934. [CrossRef]
27. Casares, M.; Khan, H. The Timing and Intensity of Social Distancing to Flatten the COVID-19 Curve: The Case of Spain. Int. J.Environ. Res. Public Health 2020, 17, 7283. [CrossRef] [PubMed]
28. Kuntz, L.; Scholtes, S.; Vera, A. Incorporating efficiency in hospital-capacity planning in Germany. Eur. J. Health Econ. 2007,8, 213–223. [CrossRef] [PubMed]
29. National Audit Office. Inpatient Admissions and Bed Management in NHS Acute Hospitals; Technical Report; National Audit Office:London, UK, 2000.
30. Proudlove, N.; Brown, C. Winter planning. Seasonal cycles. Health Serv. J. 2002, 112, 24–25. [PubMed]31. Ravaghi, H.; Alidoost, S.; Mannion, R.; Bèlorgeot, V.D. Models and methods for determining the optimal number of beds in
hospitals and regions: A systematic scoping review. BMC Health Serv. Res. 2020, 20, 186. [CrossRef] [PubMed]32. da Costa Lino, D.O.; Barreto, R.; de Souza, F.D.; de Lima, C.J.M.M.; da Silva Junior, G.B. Impact of lockdown on bed occupancy
rate in a referral hospital during the COVID-19 pandemic in northeast Brazil. Braz. J. Infect. Dis. 2020, 24, 466–469. [CrossRef][PubMed]
33. Walford, S. Unexpected Medical Illness and the Hospital Response. Models of Emergency Care; University of Warwick: Coventry, UK,2002.
34. Condes, E.; Arribas, J.R. Impact of COVID-19 on Madrid hospital system. Enfermedades Infecc. Microbiol. Clin. 2020. [CrossRef][PubMed]
35. Fanelli, S.; Lanza, G.; Francesconi, A.; Zangrandi, A. Facing the Pandemic: The Italian Experience From Health ManagementExperts’ Perspective. Am. Rev. Public Adm. 2020, 50, 753–761. [CrossRef]
36. World Health Organization Regional Office for Europe. Hospital Readiness Checklist for COVID-19; Technical Report; World HealthOrganization Regional Office for Europe: Geneva, Switzerland, 2020. Available online: https://apps.who.int/iris/bitstream/handle/10665/333972/WHO-EURO-2020-1012-40758-54954-eng.pdf (accessed on 1 March 2020).
37. Wood, R.M.; McWilliams, C.J.; Thomas, M.J.; Bourdeaux, C.P.; Vasilakis, C. COVID-19 scenario modelling for the mitigation ofcapacity-dependent deaths in intensive care. Health Care Manag. Sci. 2020, 23, 315–324. [CrossRef] [PubMed]
38. Richards-Belle, A.; Orzechowska, I.; Gould, D.W.; Thomas, K.; Doidge, J.C.; Mouncey, P.R.; Christian, M.D.; Shankar-Hari, M.;Harrison, D.A.; Rowan, K.M.; et al. COVID-19 in critical care: epidemiology of the first epidemic wave across England, Walesand Northern Ireland. Intensive Care Med 2020, 11, 2035–2047. [CrossRef] [PubMed]