flexible capacity requirements for 2019 through 2021 capacity requirements for 2019 through 2021 ......
TRANSCRIPT
2018 CAISO - Public Page 12018 CAISO - Public
Flexible Capacity Requirements for 2019 through 2021
Clyde Loutan - Principal, Renewable energy Integration
Amber Motley - Manager, Short Term Forecasting
Stakeholder Conference Call
January 29th, 2018
2018 CAISO - Public Page 2
• Discuss the criteria, methodology, and assumptions used in calculating monthly flexible capacity requirement.
• Calculate system requirements within the ISO footprint for RA compliance year 2019 and advisory flexible capacity requirements for compliance years 2020 and 2021
• Discuss the input assumptions and methodology of the annual CAISO’s Availability Assessment Hour (AAH).
What’s the purpose of this call?
2018 CAISO - Public Page 3
Agenda / Overview
• Background
• Process review
- Expected build out from all LSEs (CPUC jurisdictional and non-Jurisdictional)
- Load wind and solar profiles
- Calculate 3-hour net-load ramps
- Calculate monthly Flexible Capacity requirement
- Add contingency reserves
- Next steps
2018 CAISO - Public Page 4
Flexible capacity requirements
CPUC decision on flexible capacity
2015 – The flexible capacity framework became mandatory starting with RA compliance year 2015. The adopted framework will be in effect through RA compliance year 2017
The CPUC’s Decision (13-06-024 June 27, 2013) defines “Flexible capacity need” as the quantity of resources needed by the California ISO to manage grid reliability during the greatest three-hour continuous ramp in each month.
2018 CAISO - Public Page 5
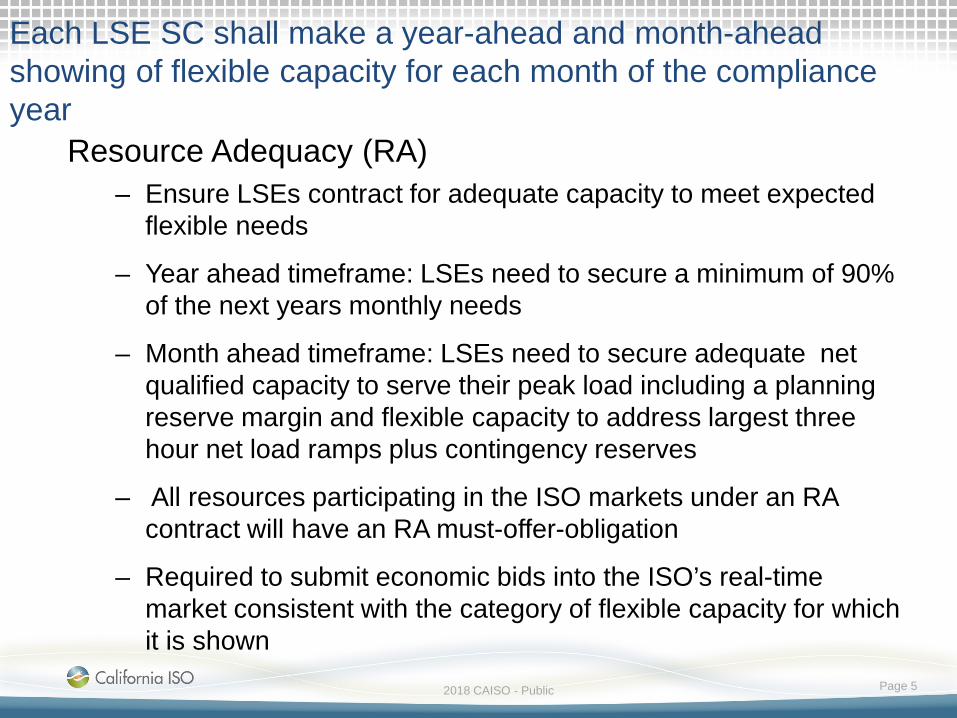
Each LSE SC shall make a year-ahead and month-ahead showing of flexible capacity for each month of the compliance year
Resource Adequacy (RA)– Ensure LSEs contract for adequate capacity to meet expected
flexible needs
– Year ahead timeframe: LSEs need to secure a minimum of 90% of the next years monthly needs
– Month ahead timeframe: LSEs need to secure adequate net qualified capacity to serve their peak load including a planning reserve margin and flexible capacity to address largest three hour net load ramps plus contingency reserves
– All resources participating in the ISO markets under an RA contract will have an RA must-offer-obligation
– Required to submit economic bids into the ISO’s real-time market consistent with the category of flexible capacity for which it is shown
2018 CAISO - Public Page 6
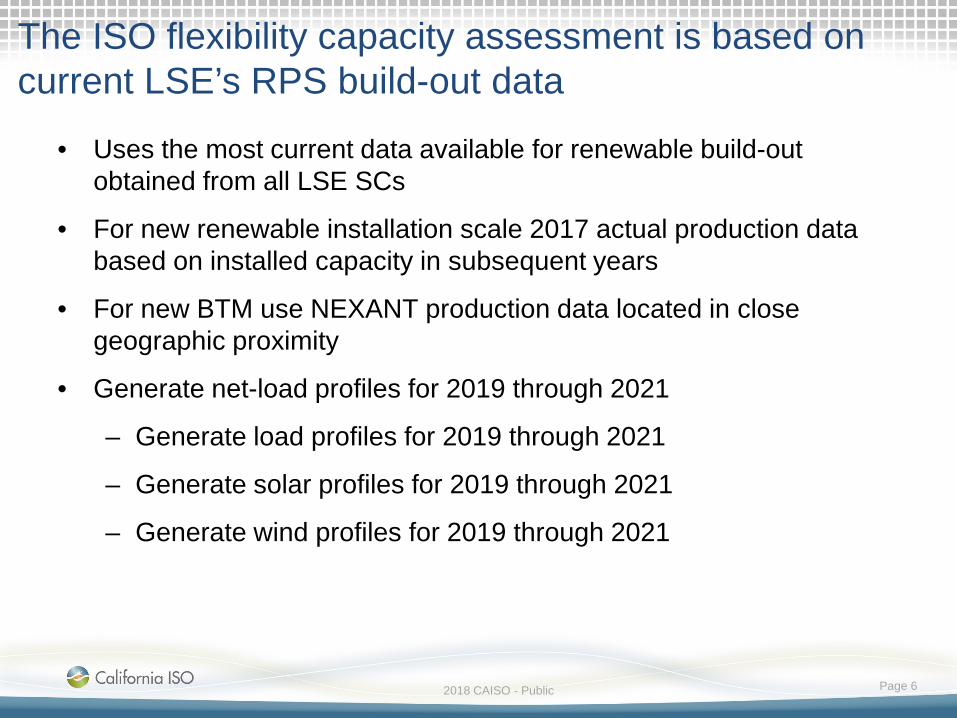
The ISO flexibility capacity assessment is based on current LSE’s RPS build-out data
• Uses the most current data available for renewable build-out obtained from all LSE SCs
• For new renewable installation scale 2017 actual production data based on installed capacity in subsequent years
• For new BTM use NEXANT production data located in close geographic proximity
• Generate net-load profiles for 2019 through 2021
– Generate load profiles for 2019 through 2021
– Generate solar profiles for 2019 through 2021
– Generate wind profiles for 2019 through 2021
2018 CAISO - Public Page 7
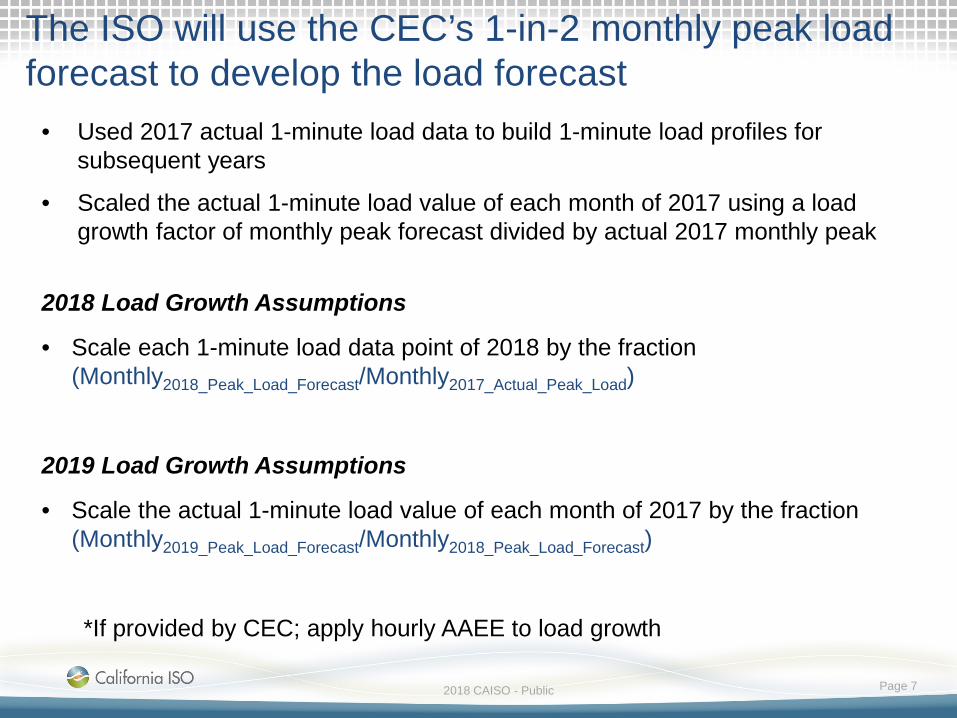
The ISO will use the CEC’s 1-in-2 monthly peak load forecast to develop the load forecast
• Used 2017 actual 1-minute load data to build 1-minute load profiles for subsequent years
• Scaled the actual 1-minute load value of each month of 2017 using a load growth factor of monthly peak forecast divided by actual 2017 monthly peak
2018 Load Growth Assumptions
• Scale each 1-minute load data point of 2018 by the fraction (Monthly2018_Peak_Load_Forecast/Monthly2017_Actual_Peak_Load)
2019 Load Growth Assumptions
• Scale the actual 1-minute load value of each month of 2017 by the fraction (Monthly2019_Peak_Load_Forecast/Monthly2018_Peak_Load_Forecast)
*If provided by CEC; apply hourly AAEE to load growth
2018 CAISO - Public Page 8
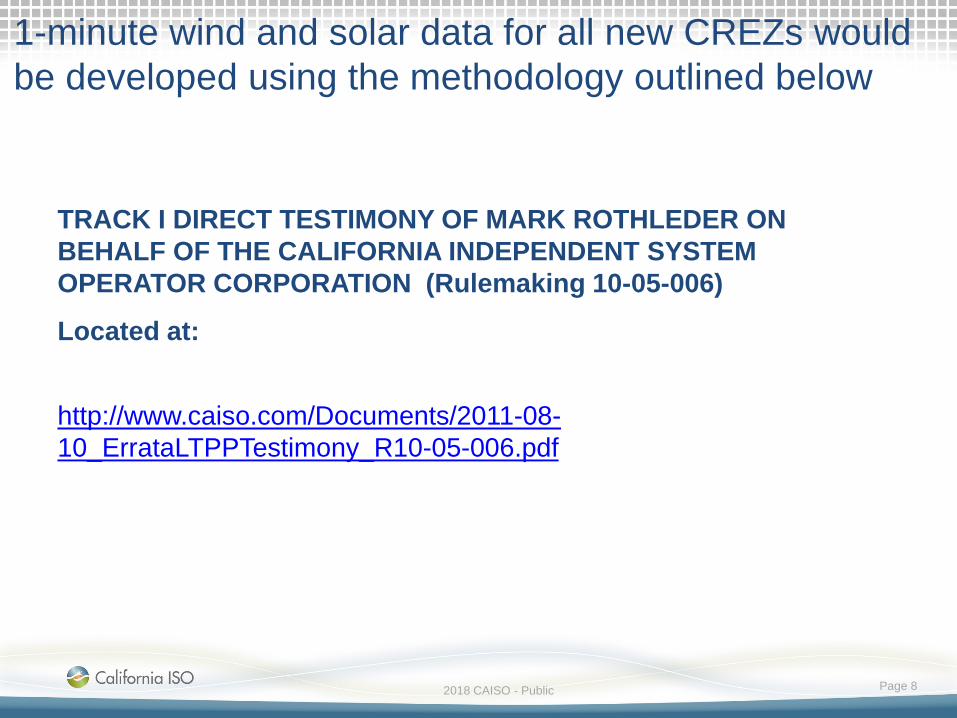
1-minute wind and solar data for all new CREZs would be developed using the methodology outlined below
TRACK I DIRECT TESTIMONY OF MARK ROTHLEDER ON BEHALF OF THE CALIFORNIA INDEPENDENT SYSTEM OPERATOR CORPORATION (Rulemaking 10-05-006)
Located at:
http://www.caiso.com/Documents/2011-08-10_ErrataLTPPTestimony_R10-05-006.pdf
2018 CAISO - Public Page 9
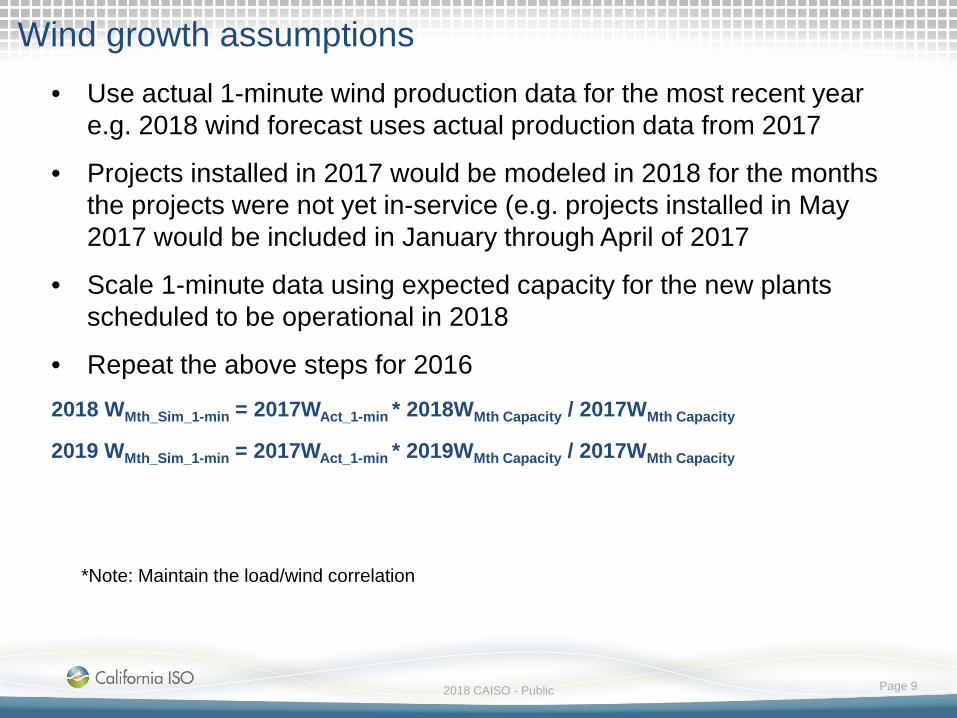
Wind growth assumptions• Use actual 1-minute wind production data for the most recent year
e.g. 2018 wind forecast uses actual production data from 2017
• Projects installed in 2017 would be modeled in 2018 for the months the projects were not yet in-service (e.g. projects installed in May 2017 would be included in January through April of 2017
• Scale 1-minute data using expected capacity for the new plants scheduled to be operational in 2018
• Repeat the above steps for 20162018 WMth_Sim_1-min = 2017WAct_1-min * 2018WMth Capacity / 2017WMth Capacity
2019 WMth_Sim_1-min = 2017WAct_1-min * 2019WMth Capacity / 2017WMth Capacity
*Note: Maintain the load/wind correlation
2018 CAISO - Public Page 10
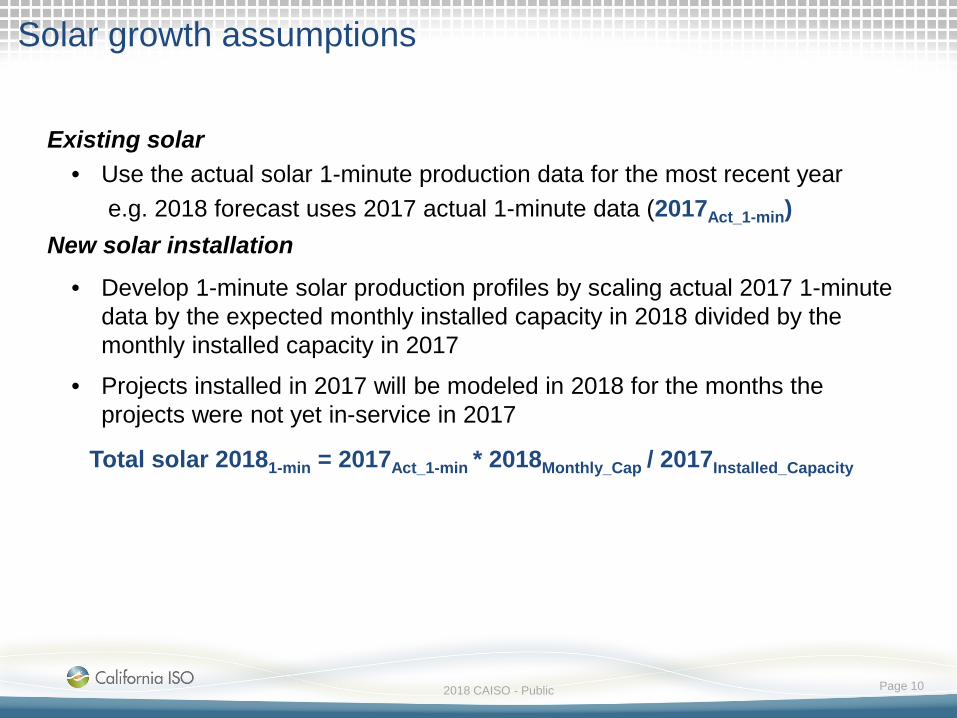
Solar growth assumptions
Existing solar• Use the actual solar 1-minute production data for the most recent year
e.g. 2018 forecast uses 2017 actual 1-minute data (2017Act_1-min)New solar installation
• Develop 1-minute solar production profiles by scaling actual 2017 1-minute data by the expected monthly installed capacity in 2018 divided by the monthly installed capacity in 2017
• Projects installed in 2017 will be modeled in 2018 for the months the projects were not yet in-service in 2017
Total solar 20181-min = 2017Act_1-min * 2018Monthly_Cap / 2017Installed_Capacity
2018 CAISO - Public Page 11
Net-load is a NERC accepted metric1 for evaluating additional flexibility needs to accommodate VERs
• Net load is the aggregate of customer demand reduced by variable generation power output
• Net-load is more variable than load itself and it increases as VER production increases
• The monthly three-hour flexible capacity need equates to the largest up-ward change in net-load when looking across a rolling three-hour evaluation window
• The ISO dispatches flexible resources to meet net-load
1 NERC Special Report Flexibility Report Requirements and metrics for Variable Generation: Implications for System Planning Studies, August 2010 . http://www.nerc.com/files/IVGTF_Task_1_4_Final.pdf
2018 CAISO - Public Page 12
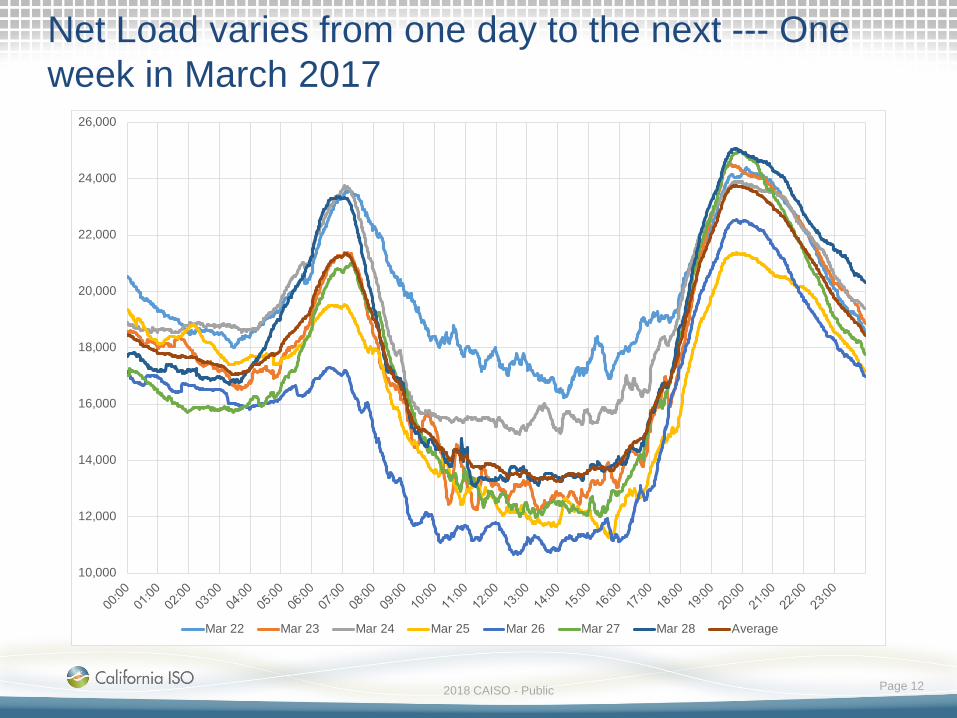
Net Load varies from one day to the next --- One week in March 2017
10,000
12,000
14,000
16,000
18,000
20,000
22,000
24,000
26,000
Mar 22 Mar 23 Mar 24 Mar 25 Mar 26 Mar 27 Mar 28 Average
2018 CAISO - Public Page 13
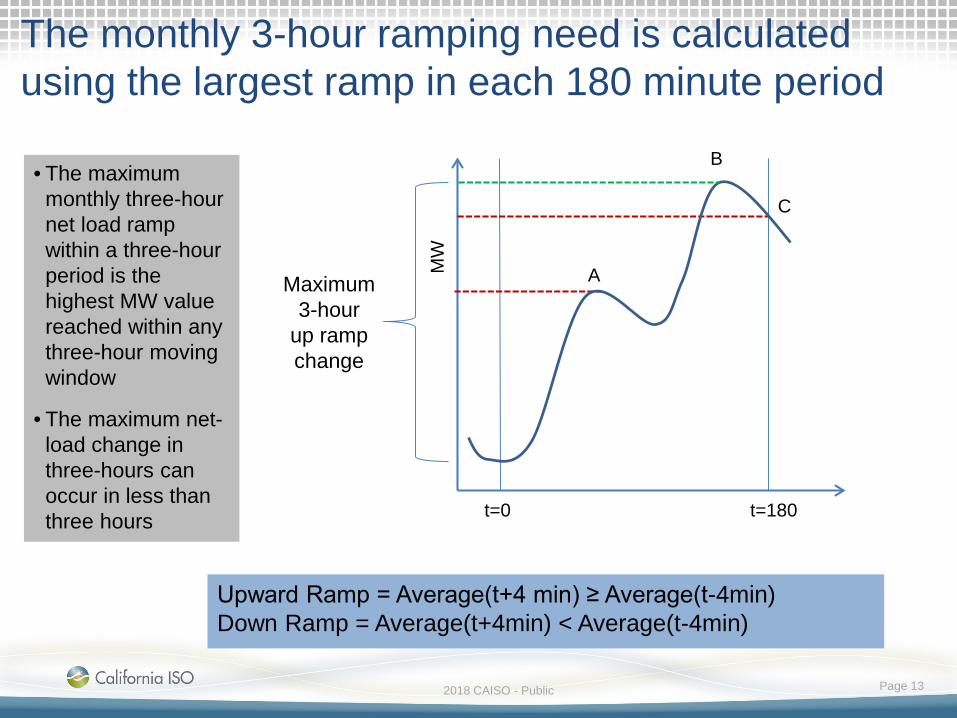
The monthly 3-hour ramping need is calculated using the largest ramp in each 180 minute period
Maximum 3-hour
up ramp change
• The maximum monthly three-hour net load ramp within a three-hour period is the highest MW value reached within any three-hour moving window
• The maximum net-load change in three-hours can occur in less than three hours
Upward Ramp = Average(t+4 min) ≥ Average(t-4min)Down Ramp = Average(t+4min) < Average(t-4min)
t=0
A
B
C
t=180
MW
2018 CAISO - Public Page 14
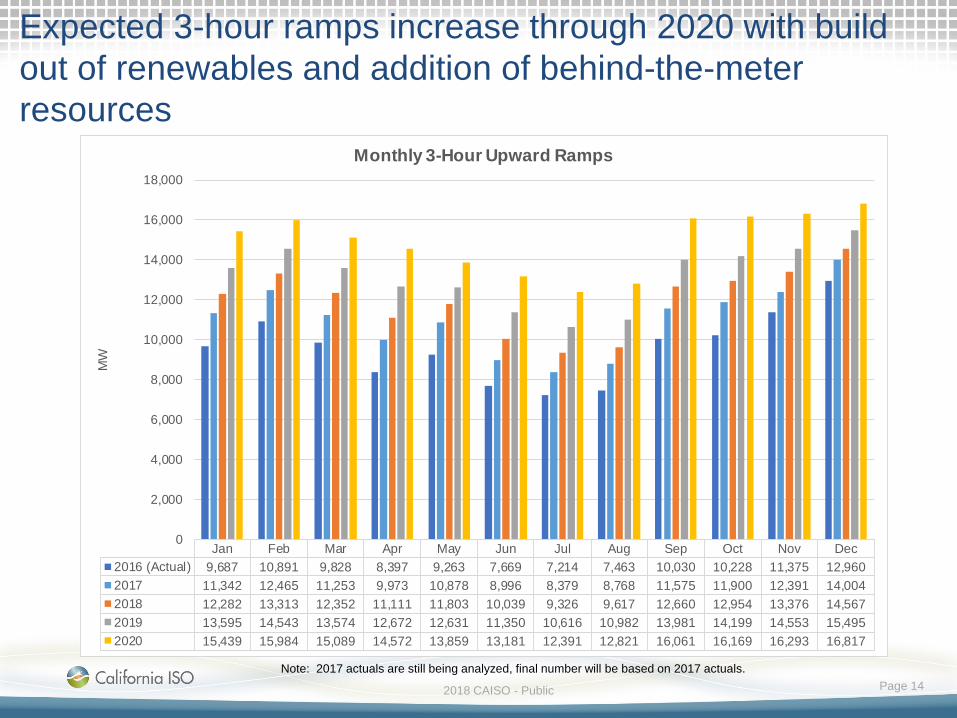
Expected 3-hour ramps increase through 2020 with build out of renewables and addition of behind-the-meter resources
Jan Feb Mar Apr May Jun Jul Aug Sep Oct Nov Dec2016 (Actual) 9,687 10,891 9,828 8,397 9,263 7,669 7,214 7,463 10,030 10,228 11,375 12,9602017 11,342 12,465 11,253 9,973 10,878 8,996 8,379 8,768 11,575 11,900 12,391 14,0042018 12,282 13,313 12,352 11,111 11,803 10,039 9,326 9,617 12,660 12,954 13,376 14,5672019 13,595 14,543 13,574 12,672 12,631 11,350 10,616 10,982 13,981 14,199 14,553 15,4952020 15,439 15,984 15,089 14,572 13,859 13,181 12,391 12,821 16,061 16,169 16,293 16,817
0
2,000
4,000
6,000
8,000
10,000
12,000
14,000
16,000
18,000
MW
Monthly 3-Hour Upward Ramps
Note: 2017 actuals are still being analyzed, final number will be based on 2017 actuals.
2018 CAISO - Public Page 15
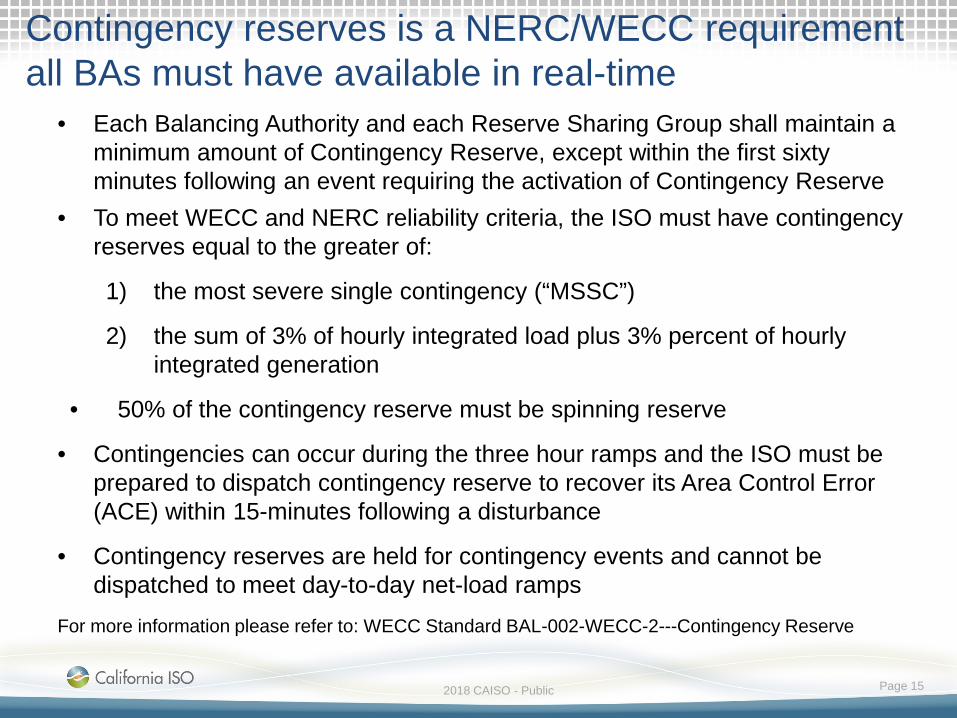
Contingency reserves is a NERC/WECC requirement all BAs must have available in real-time
• Each Balancing Authority and each Reserve Sharing Group shall maintain a minimum amount of Contingency Reserve, except within the first sixty minutes following an event requiring the activation of Contingency Reserve
• To meet WECC and NERC reliability criteria, the ISO must have contingency reserves equal to the greater of:
1) the most severe single contingency (“MSSC”)
2) the sum of 3% of hourly integrated load plus 3% percent of hourly integrated generation
• 50% of the contingency reserve must be spinning reserve
• Contingencies can occur during the three hour ramps and the ISO must be prepared to dispatch contingency reserve to recover its Area Control Error (ACE) within 15-minutes following a disturbance
• Contingency reserves are held for contingency events and cannot be dispatched to meet day-to-day net-load ramps
For more information please refer to: WECC Standard BAL-002-WECC-2---Contingency Reserve
2018 CAISO - Public Page 16
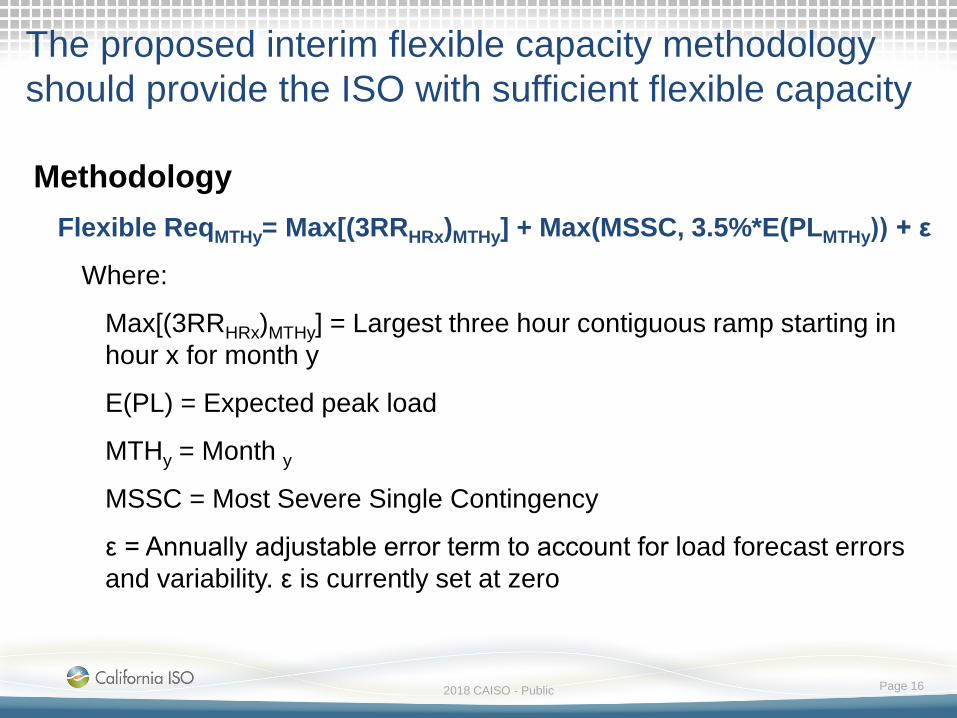
The proposed interim flexible capacity methodology should provide the ISO with sufficient flexible capacity
MethodologyFlexible ReqMTHy= Max[(3RRHRx)MTHy] + Max(MSSC, 3.5%*E(PLMTHy)) + ε
Where:
Max[(3RRHRx)MTHy] = Largest three hour contiguous ramp starting in hour x for month y
E(PL) = Expected peak load
MTHy = Month yMSSC = Most Severe Single Contingency
ε = Annually adjustable error term to account for load forecast errors and variability. ε is currently set at zero
2018 CAISO - Public Page 17
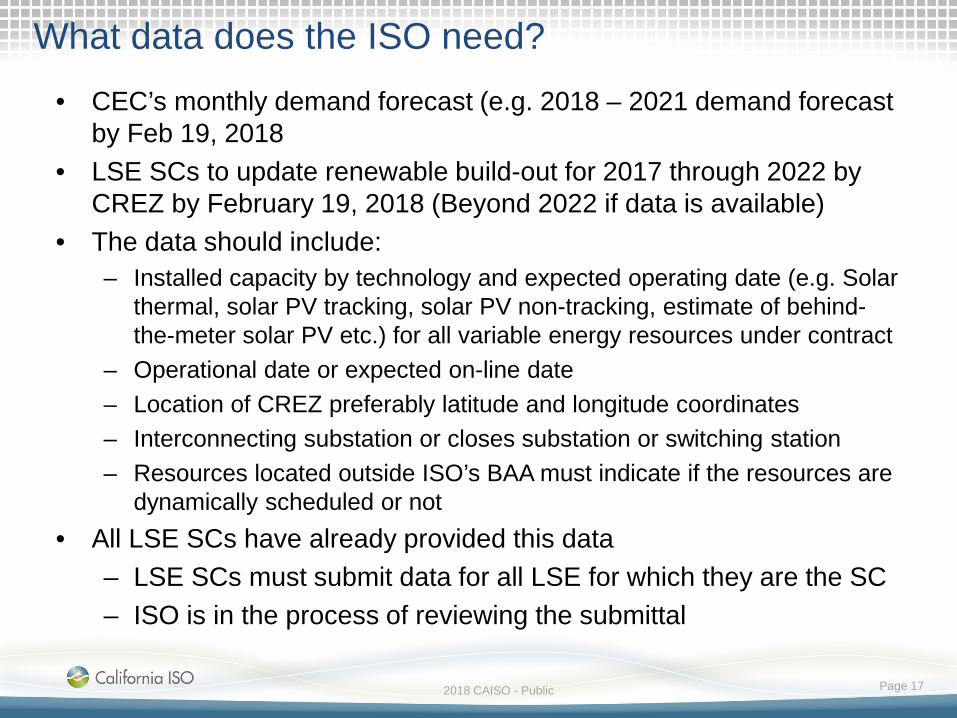
What data does the ISO need?• CEC’s monthly demand forecast (e.g. 2018 – 2021 demand forecast
by Feb 19, 2018• LSE SCs to update renewable build-out for 2017 through 2022 by
CREZ by February 19, 2018 (Beyond 2022 if data is available)• The data should include:
– Installed capacity by technology and expected operating date (e.g. Solar thermal, solar PV tracking, solar PV non-tracking, estimate of behind-the-meter solar PV etc.) for all variable energy resources under contract
– Operational date or expected on-line date– Location of CREZ preferably latitude and longitude coordinates– Interconnecting substation or closes substation or switching station – Resources located outside ISO’s BAA must indicate if the resources are
dynamically scheduled or not• All LSE SCs have already provided this data
– LSE SCs must submit data for all LSE for which they are the SC– ISO is in the process of reviewing the submittal
2018 CAISO - Public Page 18
ANNUAL REVIEW OF AVAILABILITY ASSESSMENT HOURS
2018 CAISO - Public Page 19
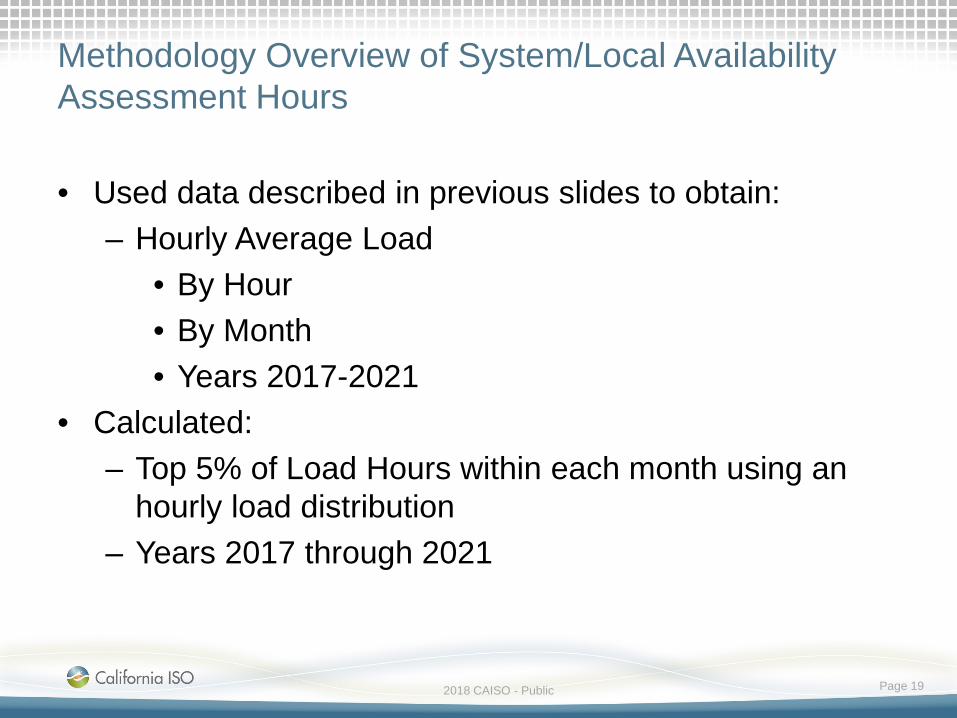
Methodology Overview of System/Local Availability Assessment Hours
• Used data described in previous slides to obtain:– Hourly Average Load
• By Hour• By Month• Years 2017-2021
• Calculated:– Top 5% of Load Hours within each month using an
hourly load distribution– Years 2017 through 2021
2018 CAISO - Public Page 20
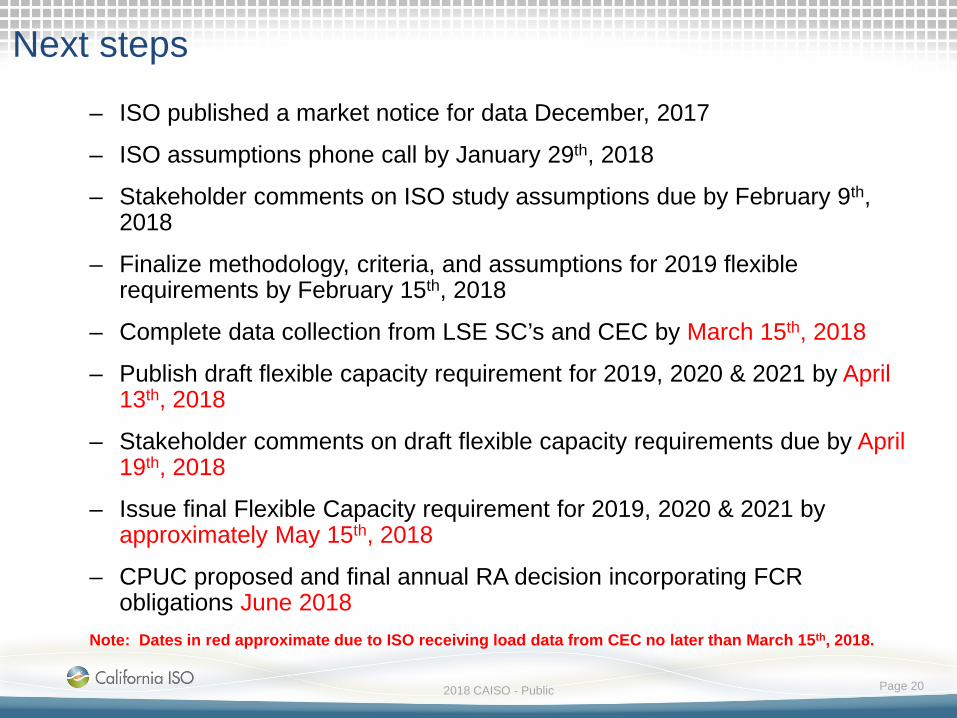
Next steps
– ISO published a market notice for data December, 2017
– ISO assumptions phone call by January 29th, 2018
– Stakeholder comments on ISO study assumptions due by February 9th, 2018
– Finalize methodology, criteria, and assumptions for 2019 flexible requirements by February 15th, 2018
– Complete data collection from LSE SC’s and CEC by March 15th, 2018
– Publish draft flexible capacity requirement for 2019, 2020 & 2021 by April 13th, 2018
– Stakeholder comments on draft flexible capacity requirements due by April 19th, 2018
– Issue final Flexible Capacity requirement for 2019, 2020 & 2021 by approximately May 15th, 2018
– CPUC proposed and final annual RA decision incorporating FCR obligations June 2018
Note: Dates in red approximate due to ISO receiving load data from CEC no later than March 15th, 2018.

2018 CAISO - Public Page 21
Questions?Please submit comments on the assumptions to
[email protected] February 9th, 2018
Thank you for your participation!

2018 CAISO - Public Page 22