flexible learning year application 2013-2016 … more high impact learning ... $10 per pupil x...
TRANSCRIPT

Flexible Learning Year Application2013-2016
Presentation at Public Hearings

What were the results?
What were the accomplishments?
Improve student achievement
Make systemic changes enabling improvement in
student achievement
Schedule more high impact learning time prior to high stakes assessments
Work collaboratively to improve teacher effectiveness
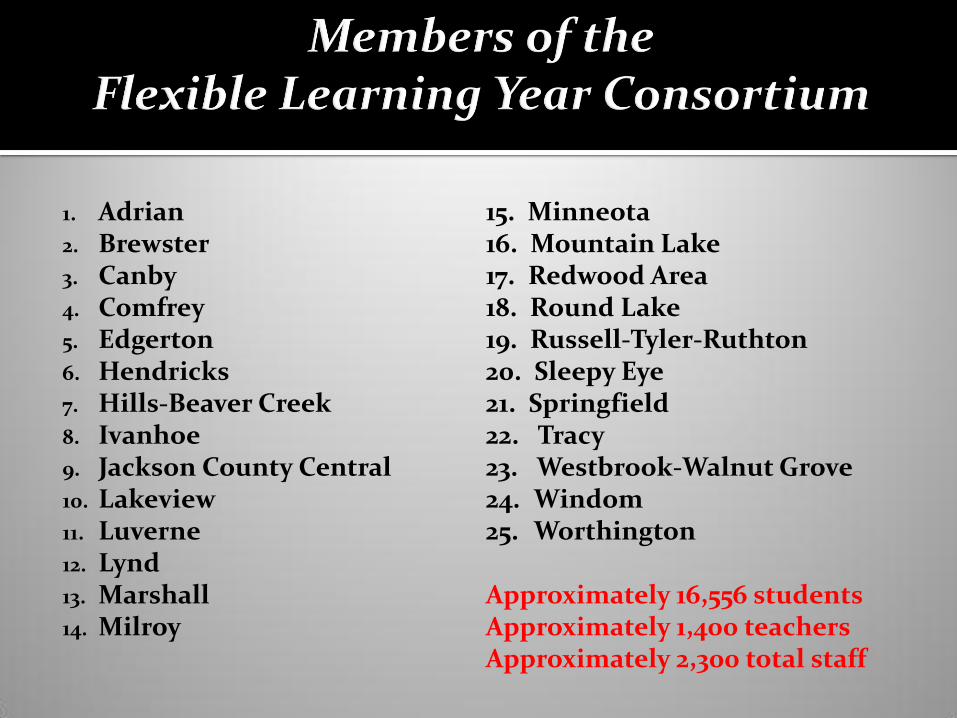
1. Adrian2. Brewster3. Canby4. Comfrey5. Edgerton6. Hendricks 7. Hills-Beaver Creek8. Ivanhoe9. Jackson County Central10. Lakeview11. Luverne12. Lynd13. Marshall14. Milroy
15. Minneota16. Mountain Lake17. Redwood Area18. Round Lake19. Russell-Tyler-Ruthton20. Sleepy Eye21. Springfield22. Tracy23. Westbrook-Walnut Grove24. Windom25. Worthington
Approximately 16,556 studentsApproximately 1,400 teachers Approximately 2,300 total staff

All 25 FLY Consortium school districts agreed to the following eight
membershiprequirements!

1. Schedule and conduct three (3) Public Hearings
2. Commit for three (3) years
3. Instructional time => instructional minutes in 09-10
4. Districts must adopt these common calendar dates
The first day of school – August 19, 2013
First semester will end—December 20, 2013
The first day of second semester --January 6 or 7, 2014
Three full Joint Staff Development days--TBD
Two “Early Out” professional development days--TBD
Eight Requirements of Participation
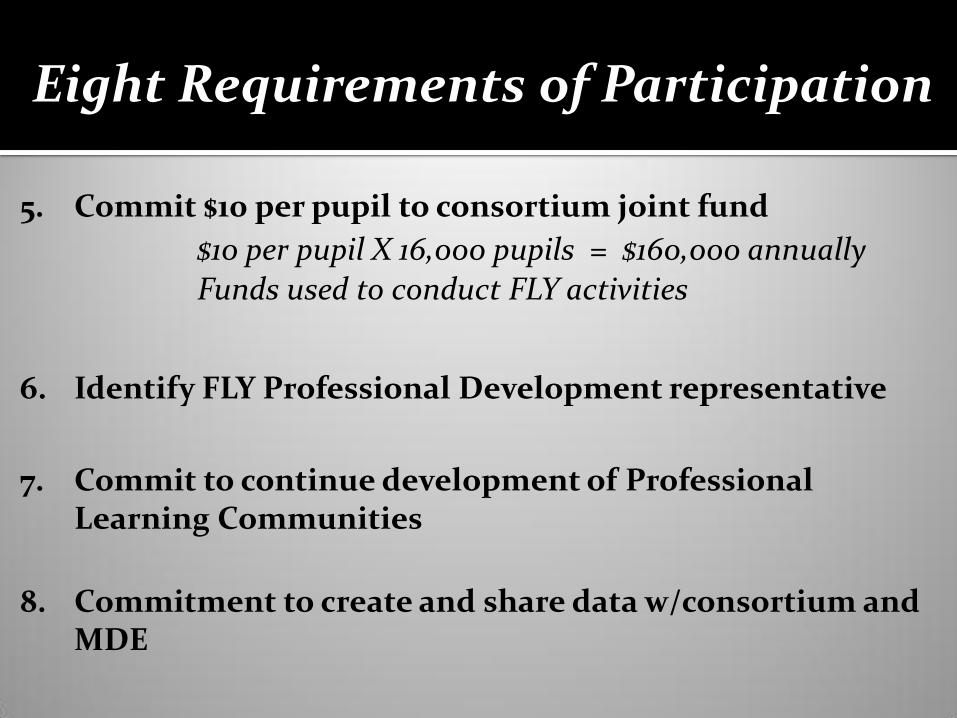
5. Commit $10 per pupil to consortium joint fund
$10 per pupil X 16,000 pupils = $160,000 annuallyFunds used to conduct FLY activities
6. Identify FLY Professional Development representative
7. Commit to continue development of Professional Learning Communities
8. Commitment to create and share data w/consortium and MDE
Eight Requirements of Participation

Schedule more high impact learning
time

Rescheduled Days on School Calendar
Create “Time” to prepare for State Assessments
Provide students additional time prior to state testing—move 7-10 instructional days from end of school calendar to beginning of calendar
Increase Student Motivation
Maximize “high impact instructional time”
Create a Sensible, Natural Semester Break Between the first and second semesters
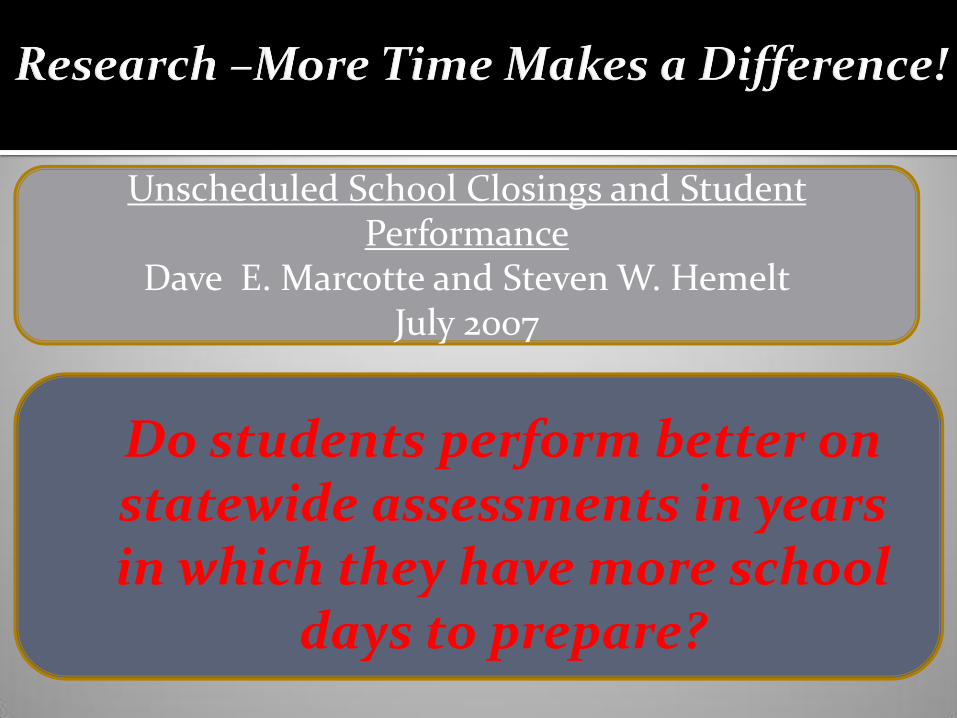
Do students perform better on statewide assessments in years in which they have more school
days to prepare?
Unscheduled School Closings and Student Performance
Dave E. Marcotte and Steven W. HemeltJuly 2007
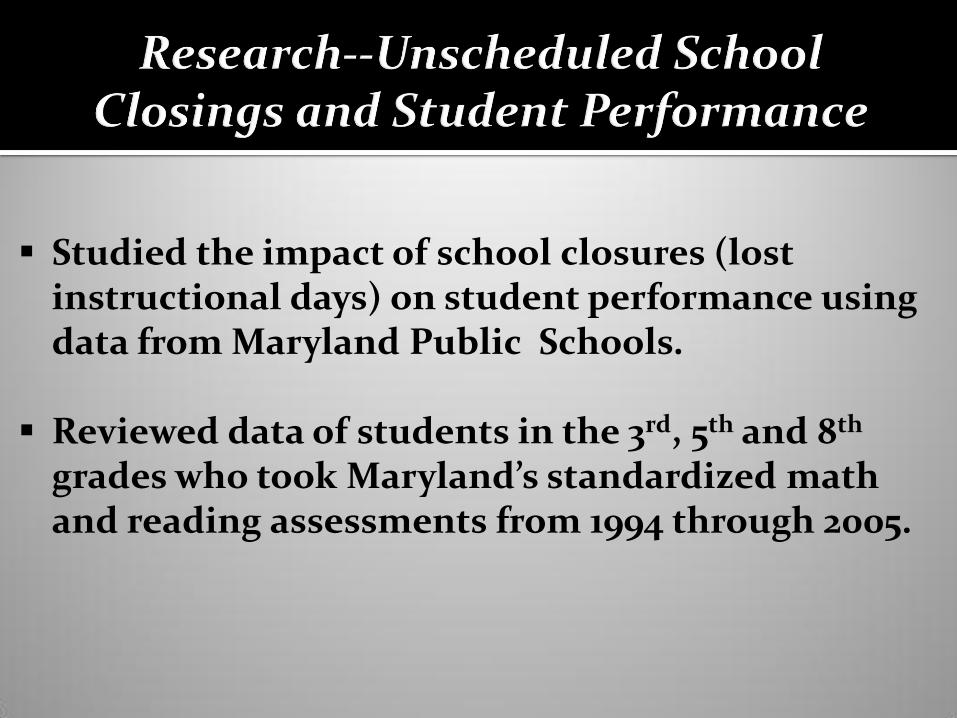
Studied the impact of school closures (lost instructional days) on student performance using data from Maryland Public Schools.
Reviewed data of students in the 3rd, 5th and 8th
grades who took Maryland’s standardized math and reading assessments from 1994 through 2005.

Findings— Each day lost reduced the percent of 3rd grade children performing
satisfactorily on the reading exam by 0.508 percent and on the math exam by 0.527 percent
In years with an average of :
five (5) unscheduled closings, nearly 3% fewer third graders performed satisfactorily on reading and math assessments than would have if there were no unscheduled closings at all.
ten (10) unscheduled closings, more than 5% fewer third graders performed satisfactorily on reading and math assessments.
The higher the concentration of low income students, the more profound the negative impact.
The negative impact on student achievement in reading and math at the 5th
and 8th grade levels was less profound than the impact for 3rd graders.

Implications of lost instructional days on likelihood of making AYP
If there had been no unscheduled school closures--
In 2003 in reading, 30 of 52 failing elementary schools would have surpassed the AYP threshold.
In 2003 in math, 34 of 56 failing elementary schools would have surpassed the AYP threshold.
The researcher’s concluded that additional days of instruction prior to testing do improve achievement on standardized tests.

Work collaboratively to improve teacher
effectiveness
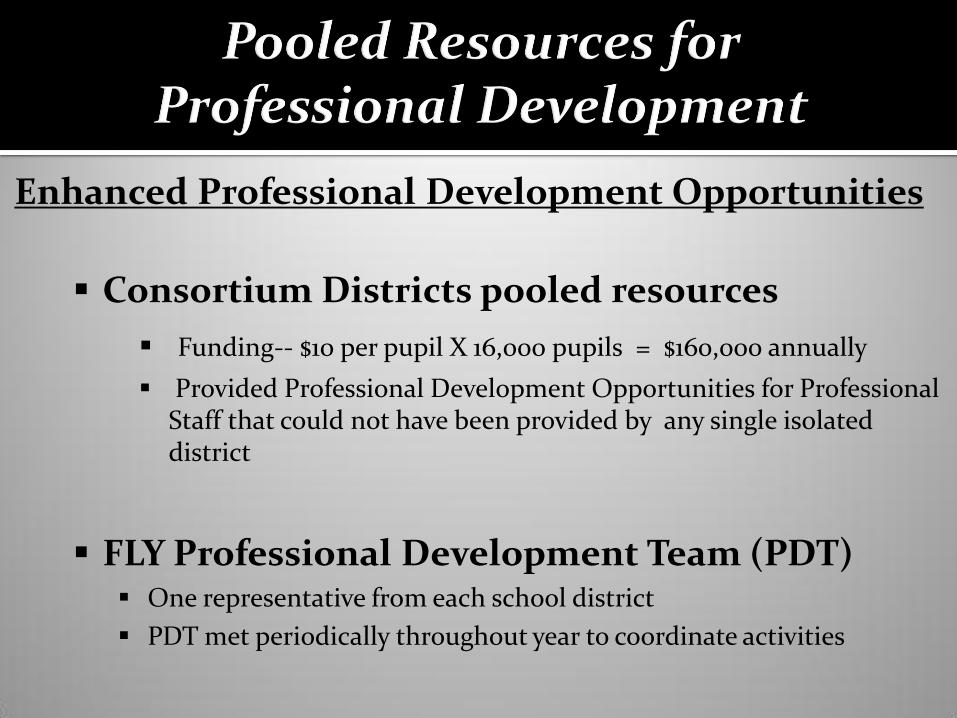
Enhanced Professional Development Opportunities
Consortium Districts pooled resources
Funding-- $10 per pupil X 16,000 pupils = $160,000 annually
Provided Professional Development Opportunities for Professional Staff that could not have been provided by any single isolated district
FLY Professional Development Team (PDT) One representative from each school district
PDT met periodically throughout year to coordinate activities

Research--Teacher Induction Programs
“The experiences of the first days and years in an educator’s career are crucial and can either positively or negatively impact his or her career, as well as student achievement.”
Minnesota Educator Induction Guidelines p. 6

The Minnesota Department of Education (2007) reported that for the first-year teachers hired in 2001, 68% were still teaching in Minnesota (but not necessarily in the same school district in which they started) and only 48% were still teaching in the same school district after five years.
With almost one third of the teaching force leaving teaching in Minnesota after five years and 20% changing districts in that same time, issues of teacher attrition and turnover are costing Minnesota schools resources and expertise.
Minnesota Educator Induction Guidelines, p. 5
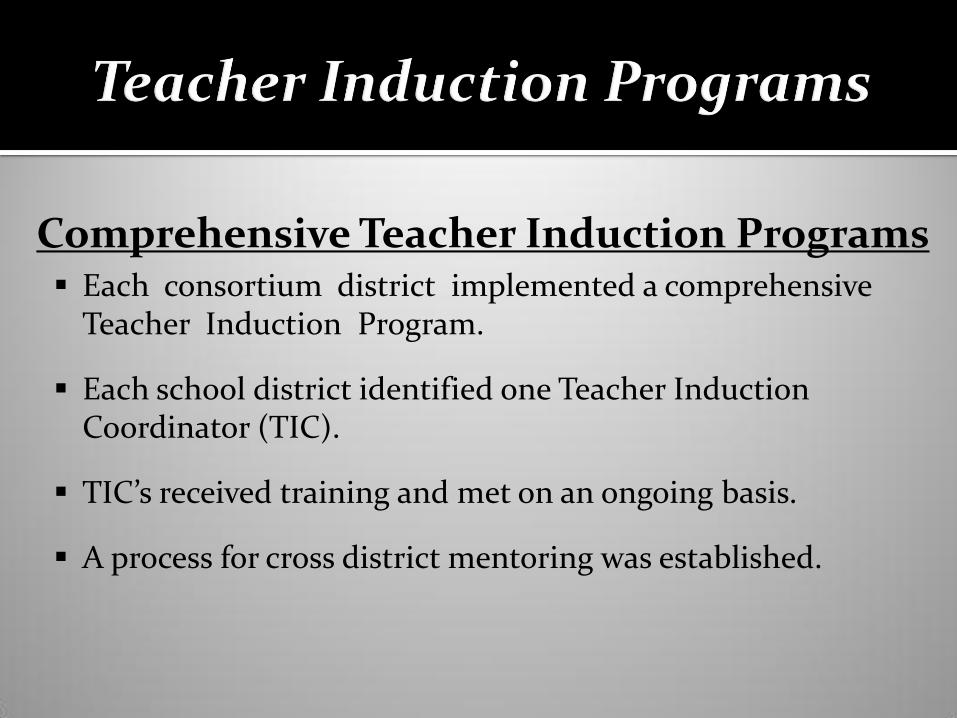
Comprehensive Teacher Induction Programs Each consortium district implemented a comprehensive
Teacher Induction Program.
Each school district identified one Teacher Induction Coordinator (TIC).
TIC’s received training and met on an ongoing basis.
A process for cross district mentoring was established.

By June 30, 2013, we stated the FLY 1 proposal would result in:
Increased student achievement
Professional Learning Communities and Teacher Induction Programs will be embedded in all consortium school districts
Favorable student, family and staff support of school calendar

We determined we would measure academic performance in math, reading and writing as follows:
Individual district math and reading index rate goals
Individual district subgroup index rate math and reading goals
Consortium-wide math and reading index rate goals
Written composition— percent proficient goals

FLY Consortium Wide ResultsAYP Index Rate Goals - READING
2009 Baseline Data Index
Rate
2010 DataIndex Rate
2011 DataIndex Rate
2012 DataIndex Rate
2013 DataIndex Rate
80.67 79.75 81.73 82.46
AYP Index Rate Goals - MATH2009 Baseline
Data Index Rate
2010 DataIndex Rate
2011 DataIndex Rate
2012 DataIndex Rate
2013 DataIndex Rate
73.99 74.93 68.49* 73.23
AYP Index Rate Goals – GRAD Writing2009 Baseline Data Percent
Proficient
2010 DataPercent
Proficient
2011 DataPercent
Proficient
2012 DataPercent
Proficient
2013 DataPercent
Proficient
91.0% 90.0% 89.0 % 91.0%
* First Year of MCA-III Math assessment so we are not able to compare to the previous year’s data.
Springfield School District #85
Student Achievement Results
(Next four slides)
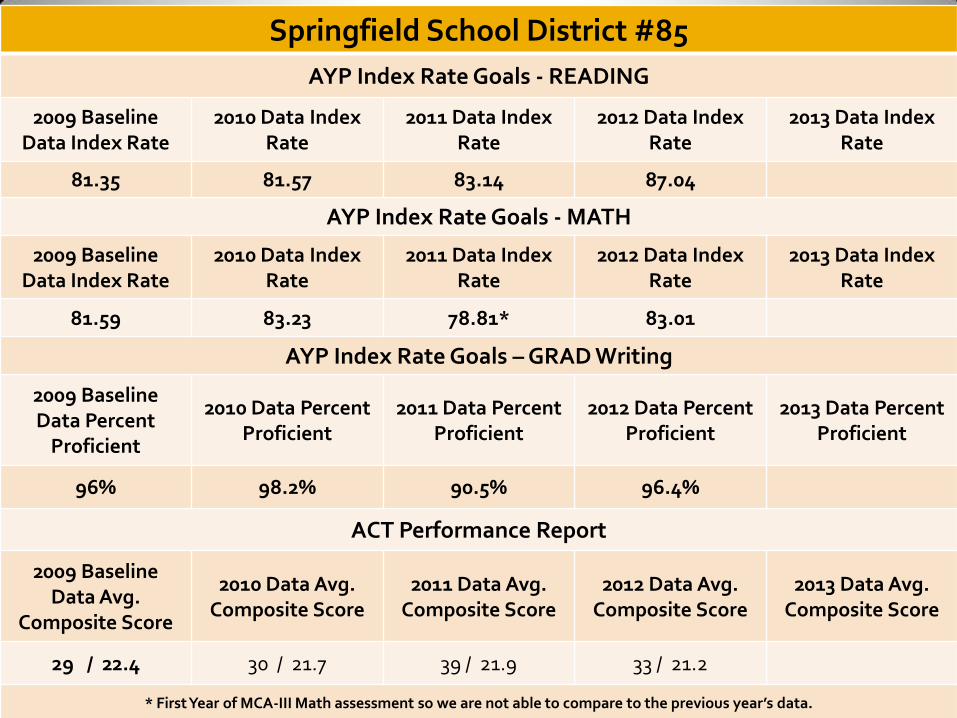
Springfield School District #85
AYP Index Rate Goals - READING
2009 Baseline Data Index Rate
2010 Data Index Rate
2011 Data Index Rate
2012 Data Index Rate
2013 Data Index Rate
81.35 81.57 83.14 87.04
AYP Index Rate Goals - MATH
2009 Baseline Data Index Rate
2010 Data Index Rate
2011 Data Index Rate
2012 Data Index Rate
2013 Data Index Rate
81.59 83.23 78.81* 83.01
AYP Index Rate Goals – GRAD Writing
2009 Baseline Data Percent
Proficient
2010 Data Percent Proficient
2011 Data Percent Proficient
2012 Data Percent Proficient
2013 Data Percent Proficient
96% 98.2% 90.5% 96.4%
ACT Performance Report
2009 Baseline Data Avg.
Composite Score
2010 Data Avg. Composite Score
2011 Data Avg. Composite Score
2012 Data Avg. Composite Score
2013 Data Avg. Composite Score
29 / 22.4 30 / 21.7 39 / 21.9 33 / 21.2
* First Year of MCA-III Math assessment so we are not able to compare to the previous year’s data.

Springfield School District #85
Special Education - READING
2009 Baseline Data Index Rate
2010 Data Index Rate
2011 Data Index Rate
2012 Data Index Rate
2013 Data Index Rate
50.00 48.72 54.17 67.02
Special Education - MATH
2009 Baseline Data Index Rate
2010 Data Index Rate
2011 Data Index Rate
2012 Data Index Rate
2013 Data Index Rate
55.00 58.14 57.78* 65.31
Free & Reduced Lunch Pricing - READING
2009 Baseline Data Index Rate
2010 Data Index Rate
2011 Data Index Rate
2012 Data Index Rate
2013 Data Index Rate
74.59 75.00 80.58 84.42
Free & Reduced Lunch Pricing - MATH
2009 Baseline Data Index Rate
2010 Data Index Rate
2011 Data Index Rate
2012 Data Index Rate
2013 Data Index Rate
76.83 78.26 73.66* 77.86
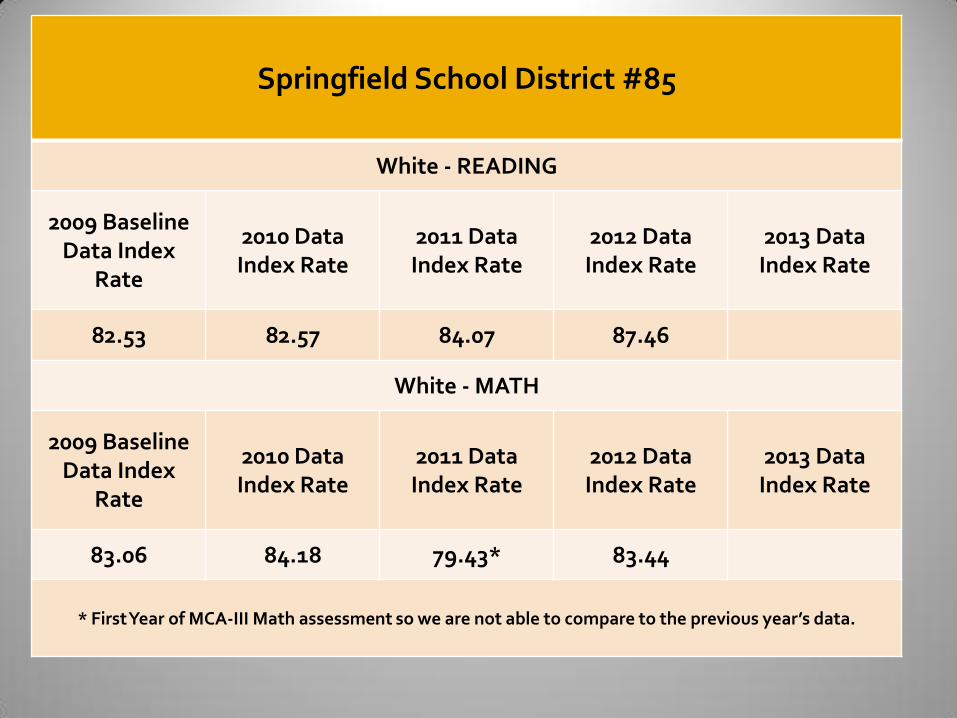
Springfield School District #85
White - READING
2009 Baseline Data Index
Rate
2010 DataIndex Rate
2011 DataIndex Rate
2012 DataIndex Rate
2013 DataIndex Rate
82.53 82.57 84.07 87.46
White - MATH
2009 Baseline Data Index
Rate
2010 DataIndex Rate
2011 DataIndex Rate
2012 DataIndex Rate
2013 DataIndex Rate
83.06 84.18 79.43* 83.44
* First Year of MCA-III Math assessment so we are not able to compare to the previous year’s data.

Consortium-wide
Year by Year
Accomplishments
(Next seven slides)

All FLY Staff
Dr. Thomas Many-one of the authors of “Leading by Doing” a Handbook for Professional Learning Communities at Work (a book all FLY PLC trainers and administrators read)
PLC Trainers
Solution Tree Trainers-Geri Parscale and Jack Baldermann
Teacher Induction Coordinator
Darla Harstad-Mentor Coordinator for Alexandria School District
Deb Luedtke-professional development supervisor from MDE
Superintendents
Trained by Darla Harstad in Teacher Induction Framework

Other
Paired with Southwest Initiative Foundation to offer classes from Children’s Museum of Minnesota for Early Childhood Teachers
Standards Based IEPs training
Mental Health Workshop
Paraprofessional
Training offered at three sites

PLC Trainers
Solution Tree Trainers-Chris Jakicic-contributor to several books and Eric Twadell-co-author “Leading by Design” An Action Framework for PLC at Work Leaders (a book all administrators and PLC trainers are reading) and contributor of several other articles
Teacher Induction Coordinator
Joint Mentor/New Teacher training at two sites
Cross-District PLCs
Met three times
Paraprofessionals
Training at one site
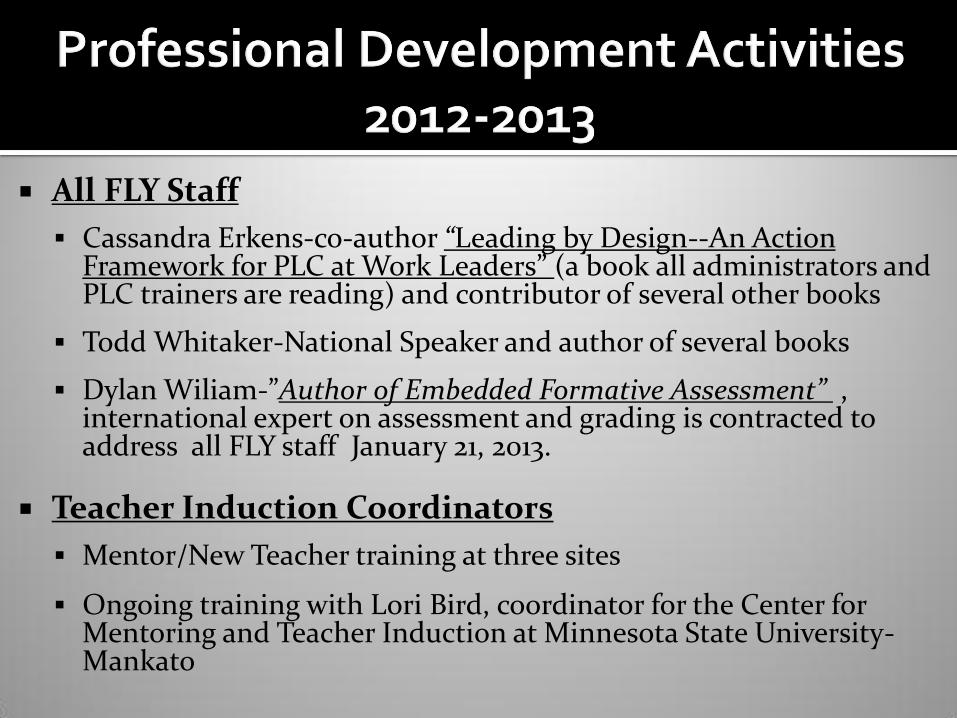
All FLY Staff
Cassandra Erkens-co-author “Leading by Design--An Action Framework for PLC at Work Leaders” (a book all administrators and PLC trainers are reading) and contributor of several other books
Todd Whitaker-National Speaker and author of several books
Dylan Wiliam-”Author of Embedded Formative Assessment” , international expert on assessment and grading is contracted to address all FLY staff January 21, 2013.
Teacher Induction Coordinators
Mentor/New Teacher training at three sites
Ongoing training with Lori Bird, coordinator for the Center for Mentoring and Teacher Induction at Minnesota State University-Mankato

PLC Trainers Cassandra Erkens Margaret Biggerstaff, MDE staff (planned)
Ongoing Networking sessions meeting in August and January-all FLY
staff
Other Nurses’ Training
Planned Paraprofessional Training MDE webinars
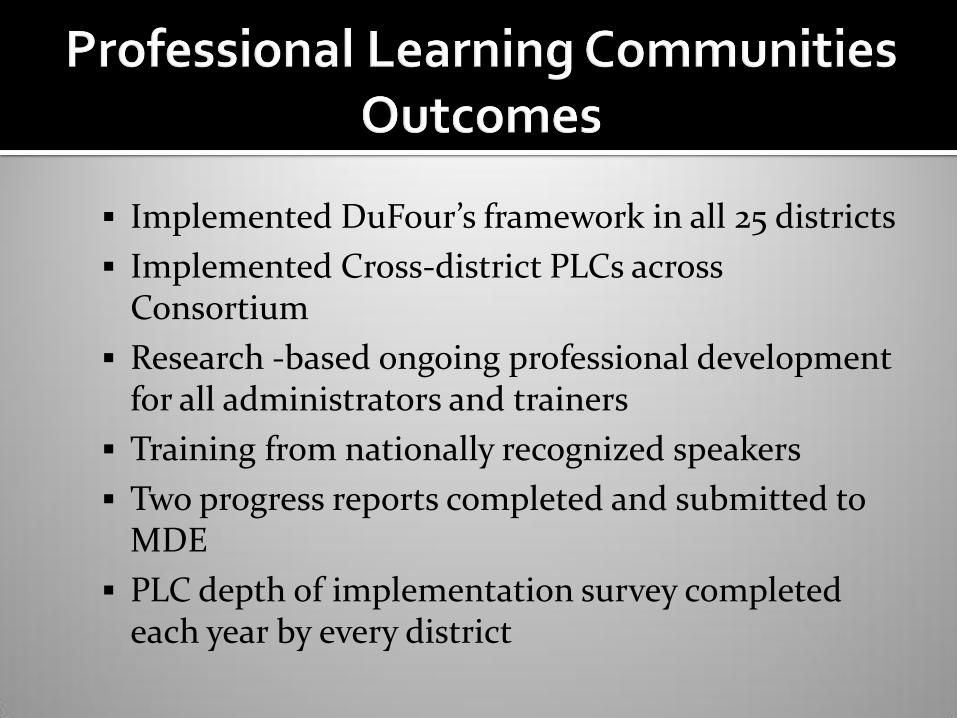
Implemented DuFour’s framework in all 25 districts
Implemented Cross-district PLCs across Consortium
Research -based ongoing professional development for all administrators and trainers
Training from nationally recognized speakers
Two progress reports completed and submitted to MDE
PLC depth of implementation survey completed each year by every district
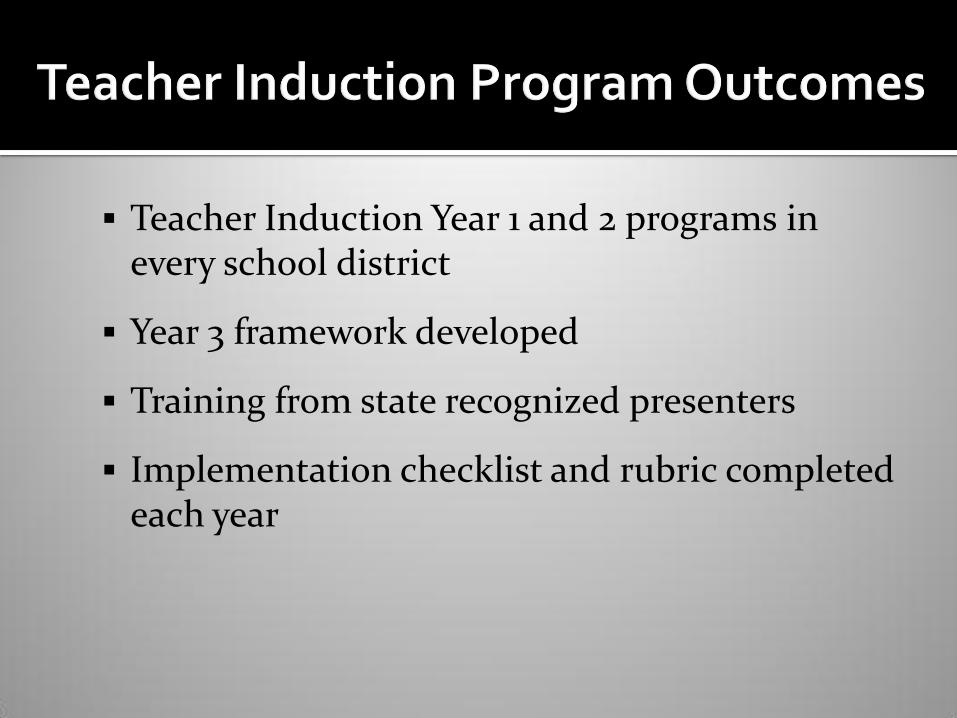
Teacher Induction Year 1 and 2 programs in every school district
Year 3 framework developed
Training from state recognized presenters
Implementation checklist and rubric completed each year
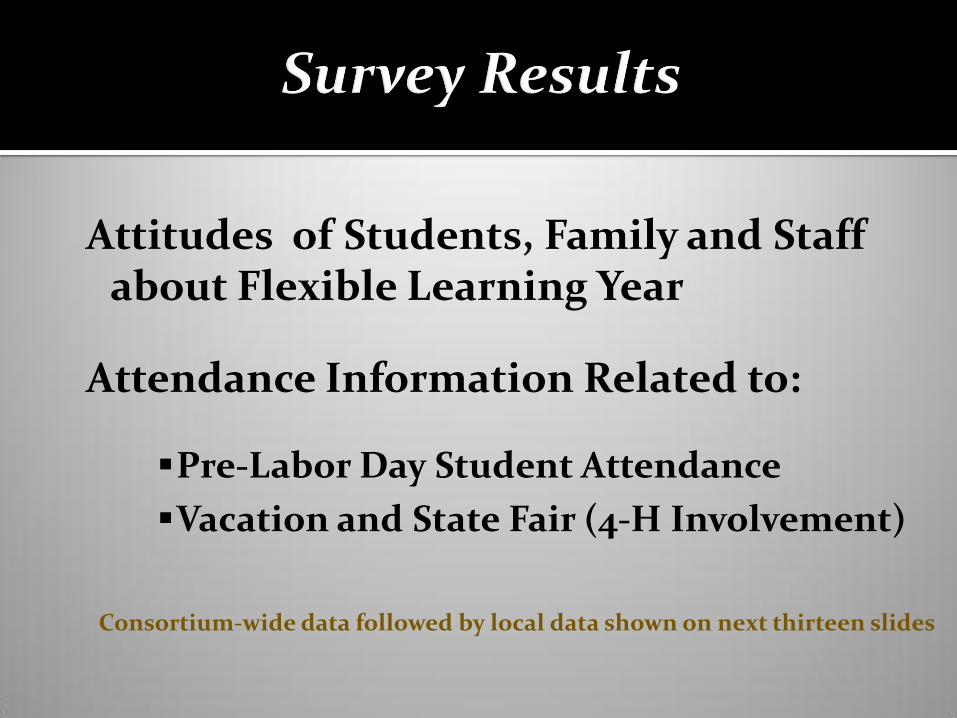
Attitudes of Students, Family and Staff about Flexible Learning Year
Attendance Information Related to:
Pre-Labor Day Student Attendance
Vacation and State Fair (4-H Involvement)
Consortium-wide data followed by local data shown on next thirteen slides

Attitudes of Students, Family and Staff about Flexible
Learning Year

StudentParent /
Guardian
Faculty / Staff
MemberTotal
Number of Respondents 3617 2122 1286 7025
Percent of Respondents 51.49% 30.21% 18.31% 100%
0
1000
2000
3000
4000
5000
6000
7000
8000
Nu
mb
er
of
Re
spo
nd
en
ts

Consortium-wide Survey Results—Spring 2012
I feel the flexible learning year will…Strongly Agree
or Agree Neutral
Strongly Disagree or Disagree
Improve education quality: 49% 33% 18%
Create a less stressful holiday break: 61% 20% 19%
Decrease focus in classroom: 24% 37% 39%
Improve test scores: 46% 32% 22%
Increase students’ comfort w/testing: 44% 32% 24%
Positively impact summer jobs: 47% 33% 20%
I don't like the concept of having homework or projects over holiday break:
75% 15% 10%
Scheduled breaks affect when my family plans vacation: 58% 27% 15%
I feel students and teachers are ready to go back to school in August (before Labor day):
40% 19% 41%
I feel there is less focus in the classroom right before the summer and Christmas Breaks:
71% 18% 11%
I don’t think school should be in session after the completion of state tests:
42% 36% 22%
I feel the five combined professional development days for teachers will improve the quality of teaching:
42% 32% 26%
I feel the five combined professional development day will improve test scores for the 25 involved school districts:
27% 38% 35%
I feel that each school district should set their own start/stop dates rather than collaborate on a uniform calendar:
40% 28% 32%
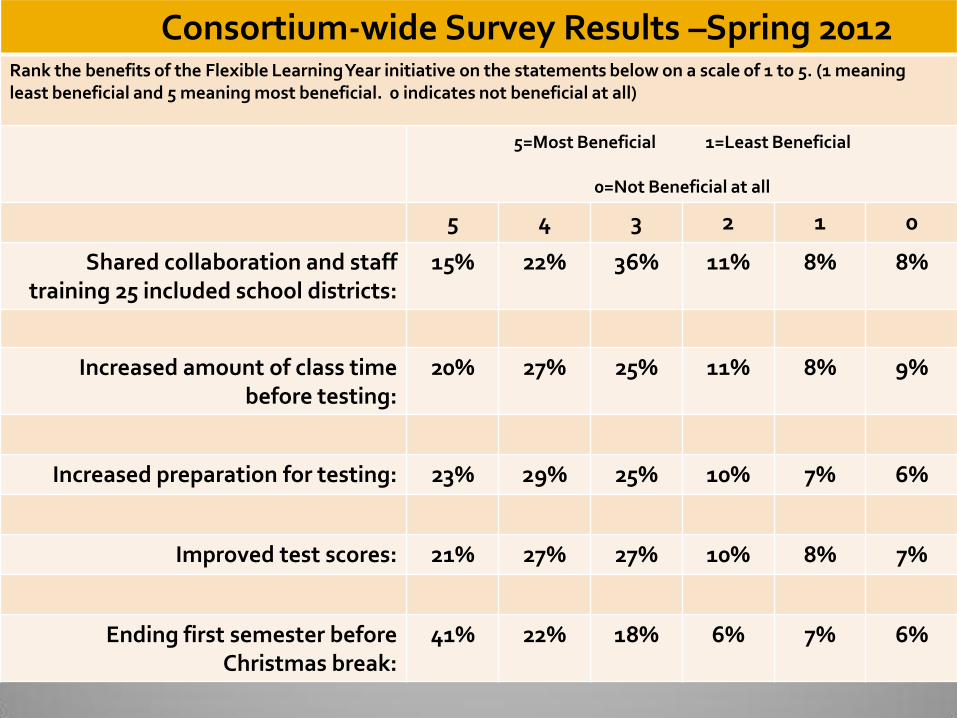
Consortium-wide Survey Results –Spring 2012Rank the benefits of the Flexible Learning Year initiative on the statements below on a scale of 1 to 5. (1 meaning least beneficial and 5 meaning most beneficial. 0 indicates not beneficial at all)
5=Most Beneficial 1=Least Beneficial
0=Not Beneficial at all
5 4 3 2 1 0
Shared collaboration and staff training 25 included school districts:
15% 22% 36% 11% 8% 8%
Increased amount of class time before testing:
20% 27% 25% 11% 8% 9%
Increased preparation for testing: 23% 29% 25% 10% 7% 6%
Improved test scores: 21% 27% 27% 10% 8% 7%
Ending first semester before Christmas break:
41% 22% 18% 6% 7% 6%
Attendance Information Related to:
Pre-Labor Day Student Attendance
Vacation and State Fair (4-H Involvement)
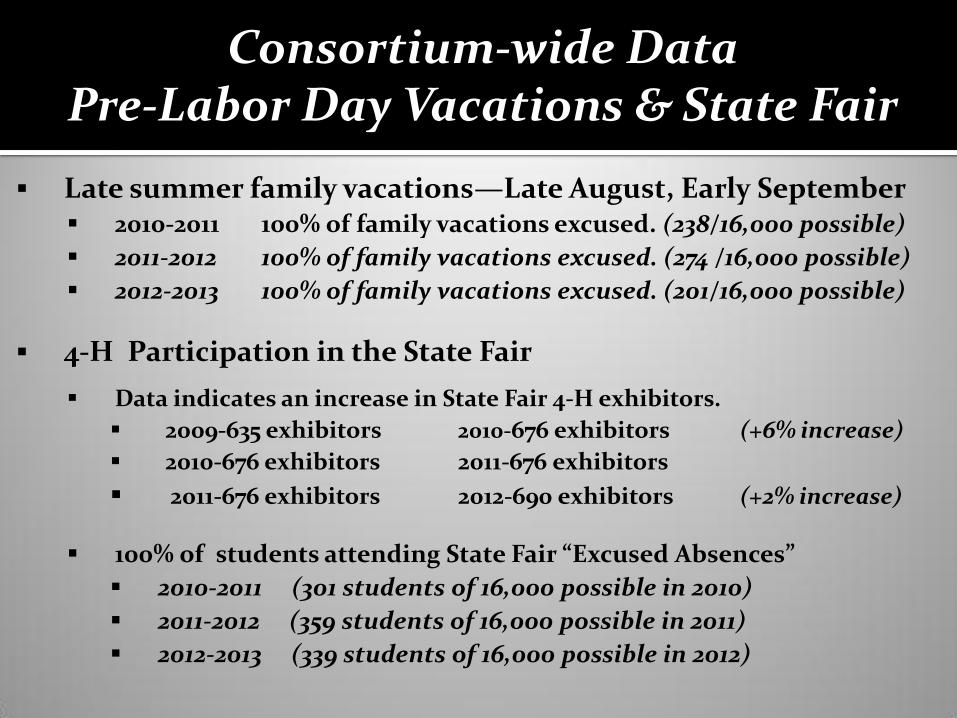
Late summer family vacations—Late August, Early September 2010-2011 100% of family vacations excused. (238/16,000 possible)
2011-2012 100% of family vacations excused. (274 /16,000 possible)
2012-2013 100% of family vacations excused. (201/16,000 possible)
4-H Participation in the State Fair
Data indicates an increase in State Fair 4-H exhibitors.
2009-635 exhibitors 2010-676 exhibitors (+6% increase)
2010-676 exhibitors 2011-676 exhibitors
2011-676 exhibitors 2012-690 exhibitors (+2% increase)
100% of students attending State Fair “Excused Absences”
2010-2011 (301 students of 16,000 possible in 2010)
2011-2012 (359 students of 16,000 possible in 2011)
2012-2013 (339 students of 16,000 possible in 2012)
Consortium-wide DataPre-Labor Day Vacations & State Fair

FLY Consortium—Vacations and State Fair
Vacation State Fair
Students Days
MissedStudent
DaysMissed
2010-2011 238 472 301 660
2011-2012 274 463 359 632
2012-2013 201 317 339 779

Attitudes of Students, Family and Staff about Flexible
Learning Year

StudentParent /
Guardian
Faculty / Staff
MemberTotal
Number of Respondents 231 111 17 359
Percent of Respondents 64.35% 30.92% 4.74% 100%
0
50
100
150
200
250
300
350
400
Nu
mb
er
of
Re
spo
nd
en
ts

Springfield School District #85 —Spring 2012
I feel the flexible learning year will…Strongly Agree
or Agree Neutral
Strongly Disagree or Disagree
Improve education quality: 52% 29% 19%
Create a less stressful holiday break: 59% 17% 24%
Decrease focus in classroom: 30% 35% 35%
Improve test scores: 49% 27% 24%
Increase students’ comfort w/testing: 46% 29% 25%
Positively impact summer jobs: 48% 32% 20%
I don't like the concept of having homework or projects over holiday break:
77% 12% 11%
Scheduled breaks affect when my family plans vacation: 60% 25% 15%
I feel students and teachers are ready to go back to school in August (before Labor day):
37% 21% 42%
I feel there is less focus in the classroom right before the summer and Christmas Breaks:
72% 18% 10%
I don’t think school should be in session after the completion of state tests:
54% 29% 17%
I feel the five combined professional development days for teachers will improve the quality of teaching:
38% 35% 27%
I feel the five combined professional development days will improve test scores for the 25 involved school districts:
25% 29% 37%
I feel that each school district should set their own start/stop dates rather than collaborate on a uniform calendar:
41% 23% 36%

Springfield School District #85 —Spring 2012Rank the benefits of the Flexible Learning Year initiative on the statements below on a scale of 1 to 5. (1 meaning least beneficial and 5 meaning most beneficial. 0 indicates not beneficial at all)
5=Most Beneficial 1=Least Beneficial
0=Not Beneficial at all
5 4 3 2 1 0
Shared collaboration and staff training 25 included school districts:
13% 22% 42% 7% 7% 9%
Increased amount of class time before testing:
23% 26% 25% 10% 7% 9%
Increased preparation for testing: 26% 26% 24% 9% 6% 9%
Improved test scores: 21% 27% 26% 10% 8% 8%
Ending first semester before Christmas break:
39% 22% 18% 6% 7% 8%
Attendance Information Related to:
Pre-Labor Day Student Attendance
Vacation and State Fair (4-H Involvement)

Springfield School District #85–Vacation and State Fairs
Vacation State Fair
Students Days
MissedStudents
Days Missed
2010-2011 13 44 10 27
2011-2012 7 8 10 27
2012-2013 4 2 7 3.5
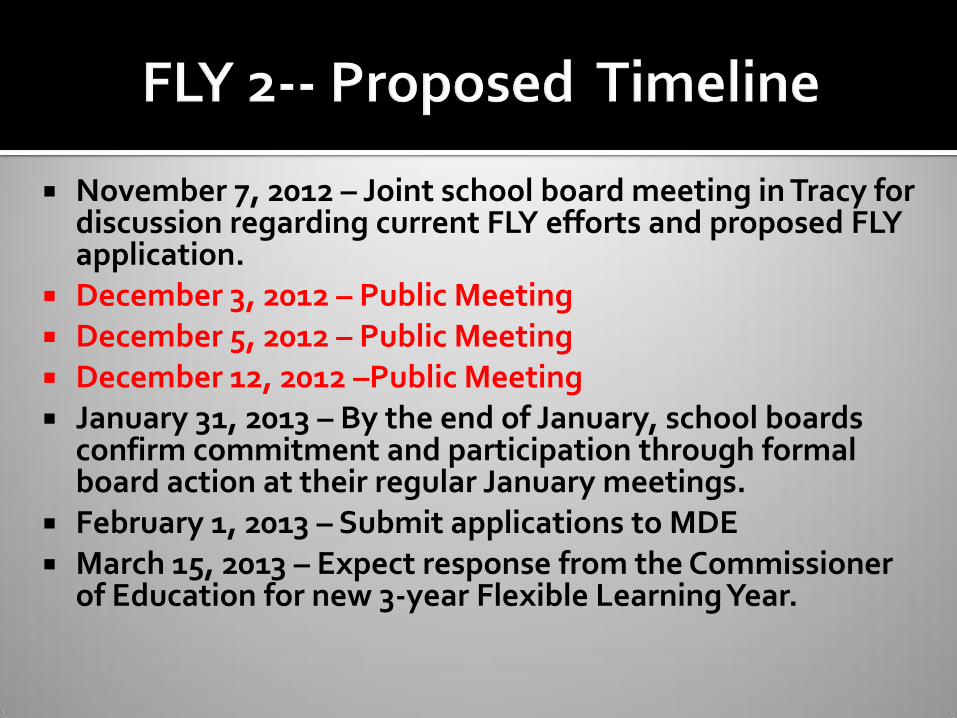
November 7, 2012 – Joint school board meeting in Tracy for discussion regarding current FLY efforts and proposed FLY application.
December 3, 2012 – Public Meeting December 5, 2012 – Public Meeting December 12, 2012 –Public Meeting January 31, 2013 – By the end of January, school boards
confirm commitment and participation through formal board action at their regular January meetings.
February 1, 2013 – Submit applications to MDE March 15, 2013 – Expect response from the Commissioner
of Education for new 3-year Flexible Learning Year.
Improve Student Achievement –(Continuation of FLY 1)
Continue with Calendar changes established in FLY 1—Continue to schedule high impact learning time (days) prior to high stakes assessments
Continue to work collaboratively to improve teacher effectiveness