flexible manufacturing in the north-american
TRANSCRIPT

Flexible Manufacturing in the North-American
Automobile Industry
Johannes Van Biesebroeck University of Toronto and NBER
September 28, 2004
[Preliminary and incomplete]
Abstract
I discuss three issues that have deeply influenced the North American automobile industry in the last decades. Proliferation of models and vehicle types has reduced the average sales per vehicle with important consequences on the manufacturing side. Manufacturers have responded by adopting flexible production technology in their assembly plants. One of the most important features of the flexible technology is the ability to build a variety of platforms and body styles on the same assembly line. They have also reorganized their supply chain. Increased outsourcing of components, even sharing the burden of research and development with preferred (tier 1) suppliers, and just-in-time inventory management are the most visible exponents of this transformation. These three trends are discussed with an eye to their interrelatedness, the impact on industrial performance, and policy options available to Canada. An attempt is made to develop a rigorous theoretical framework incorporating the different aspects of this industrial transformation and to check the importance of each trend using plant and firm-level data.
1 Motivation Three changes in the automobile industry are of obvious interest to economists. The most visible change is the tremendous increase in product differentiation. Differentiation is a now commonly-acknowledge source of market power and recently developed methods to analyze demand have provided us the tools to measure it. In the automobile industry, only a small fraction of the increase in variety is accounted for by imports or an increase in total market size. As a result, manufacturers were forced to produce a much greater number of products in roughly the same number of plants. Trading off economies of scale
and scope, the entire process from vehicle design to manufacturing has been overhauled, introducing terms like flexible manufacturing and lean technology into the business jargon. In the process, final manufacturers have grown smaller, both in terms of employment, sales, or market capitalization. Changed outsourcing patterns have completely overhauled the organization of the industry. This topic is widely debated in the press as well as in academic research. While the three trends—product differentiation, flexible manufacturing, and outsourcing—are interesting in their own right, they have far-reaching consequences for all firms in the industry. Some firms fared better than others introducing the changes and I will use productivity as the performance benchmark. Two exercises are performed. First, I investigate how large the productivity penalties associated with each of the three changes are and whether they are interrelated. Milgrom and Roberts (1990) show theoretically that different aspects of modern manufacturing display complementarities; the return of adopting one aspect is increasing in also adopting other aspects. I provide some empirical validity to their claims. Second, it is often argued that different plants in the industry operate with different technology. Flexible manufacturing is not necessarily the ideal model of operation for all firms and some might have stuck with the older technology. I characterize the evolution of productivity in the industry, allowing plants in the sample to operate with either technology—mass or lean. Three different approaches to deal with the unobserved state of technology at each plant are implemented. The simplest approach classifies plants exogenously as lean or mass and fixes the technology over time. The second approach allows plants to switch technology each year and estimates a switching probability. Finally, I estimate a technology adoption model. Based on initial characteristics the probability a plant is already operating with the lean technology at the start of the sample is estimated. In consequent years, mass plants have a probability to adopt the newer lean technology, and this probability is estimated as a function of covariates that differ by plant and year. In the next section, I take a closer look at each of the three trends. Section 5 provides arguments why the different changes are likely to interact. Effects of each change and their interactions on plant-level productivity are presented, together with the data in Section 6. In Section 7, productivity growth for the two technologies is characterized, using three different ways to control for the unobserved nature of the technology with which each plant operates.
2 Three trends
2.1 Increased product differentiation It will not come as a surprise to anyone who has been in the market for a new vehicle recently: the variety of models for sale has never been greater. The number of different cars for sale in the U.S. doubled from 72 in 1974 to 144 in 2003. Even more startling, nowadays cars only account for half of light motor vehicle sales as light trucks have proliferated. SUVs and pickup trucks have long since ceased to be mostly sold to businesses. New vehicle segments such as minivans, compact SUVs, and crossover

vehicles have been added. In addition, the number of varieties offered of each model—which captures different body styles and optional engines—increased as well. The total variety of vehicles offered to consumers, ballooned to 266 in 2003 and it is expected to keep rising in the near future. Table 1 illustrates the overall growth in model variety and the increased importance of light trucks. Importantly, many of these additional vehicles are produced domestically. The number of assembly plants in the US has not kept pace with this increase. The Big Three American companies have operated around 53 assembly plants in the US from 1975 till today.1 Over the same time period, operations in Canada decreased slightly with an offsetting increase in Mexico. Only the establishment of mostly Japanese-owned transplants raised the number of final assembly plants in North America from 68 in 1975 to 84 today. Note the trends in domestically and foreign owned operations cancelled out and between 1985 and 2004 the number of plants in operation declines slightly.
Table 1: Number of models for sale in the U.S.
1975 1985 1995 2000 2003All models for sale 133 195 238 250 266 Car models 96 140 164 147 144 Domestically produced 76 71 Imported 71 73 Available variations 443 482Light truck models 37 55 74 103 122 Domestically produced 78 84 Imported 25 38 Available variations 1180 1805Total assembly plants 68 83 86 84 84 US-owned 66 76 68 65 64 foreign-owned 2 7 18 19 20
The increase in models produced domestically without a corresponding increase in the number of assembly plants has reduced average production runs. Figure 1 illustrates the decline in average sales per model. As the U.S. is by far the most important market, accounting for XX% of North American sales, I use U.S. sales in the numerator.2 Production, on the other hand, is very integrated across the continent. Every assembly plant in Canada and Mexico exports most of its production to the U.S. A number of vehicles assembled in Mexico are not even sold locally. Hence, I use all North American plants in the denominator.
1 While they opened up a lot of new plants in the 1980s—in 1985 they operated 60 assembly plants in the U.S.—closures of older sites in the 1991 recession has reduced the level of active plants to 52 by 1995. 2 A small number of models is sold in Mexico (an even smaller number only Canada) and are excluded. As the sum of Mexican and Canadian sales is approximately constant over the time period, the trend is hardly influenced by this omission.

Figure 1: Number of car models and sales per model
40
60
80
100
120
140
160
2003199819931988198319781973
num
ber o
f mod
els
40
60
80
100
120
140
160
180
200
Thou
sand
s
sale
s/m
odel
Models sold in US
Models sold in US produced in NA
US sales per model
NA sales per domestic model
The message from Figure 1 is that most plants nowadays have to produce more than a single model. The minimum efficient scale in assembly is around 200,000 vehicles a year and this has not changed much over the years. The average capacity of plants nowadays is virtually unchanged. Pulling of this feat has forced manufacturers to change their method of operation, to which I turn now.
2.2 Adoption of lean technology Flexible technology—or modern manufacturing or lean technology, which I will all use as synonyms—is characterized by a number of attributes: team work, just-in-time inventory, flexible machinery, decentralization of decisions, emphasis on flow through the factory, zero-tolerance quality control, etc. A very accessible introduction to lean manufacturing is the bestseller by Womack et al. (1990), which summarizes the most important findings from the International Motor Vehicle Program at MIT.
From a researcher’s perspective, most of these aspects are not observable. Some exceptions exist; for example Helper (1995) conducted a survey of automobile suppliers to get insight into their human resource management practices. More evidence is gathered from detailed case studies. One interesting finding is that most new plants, even those in Mexico, are found to use the lean technology, see Carillo (1995)
One of the most important advantages of the lean technology is the ability to produce more than one vehicle-type on the same assembly line. The proliferation of vehicles described earlier forced manufacturers to adjust their assembly plants. Up till the early
1980s, almost all assembly plants produced a single vehicle. Exceptions were plants with multiple body welding and assembly lines that produced different vehicles, one on each line, or different guises of the same car that only differed in trim or available options, which was often offered by the different GM, Ford, or Chrysler brands. These plants operated with a high level of automation and standardization. Any disturbance of the production flow was avoided as much as possible. Discrete adjustment margins, such as adding or deleting a shift, working overtime shifts on Saturday, made for lumpy production (Bresnahan and Ramey, 1994). Large amounts of inventory, mostly held in the dealer network, provided a buffer stock to satisfy sales that followed a more smooth process.
Currently, a single plant often assembles many vehicles, and mastering this feat is becoming crucial for survival. In all but a few vehicle segments, a single vehicle sells at less than the minimum efficient scale of a production plant. One way of coping has been to sell production on several continents, which makes them vulnerable to the wide swings in exchange rate. Plants have also become smaller on average, see Van Biesebroeck (2003), which has resulted in some productivity gain as the flexible production does not enjoy the same economies of scale at the plant level. Obviously, there is a limit to both solutions, while the number of models for sale in the North American market keeps increasing.
The only viable long term solution is to produce multiple vehicles in the same plant. To help accomplish this feat, and at the same time reduce R&D costs, firms started to derive many different vehicles from the same platforms. Vehicles that share platform will share much of their underlying mechanics, which facilitates assembly on a single line. Figure 2 shows how many models firms produce from their different platforms.3 Observations are the different firms—or groups of firms in the case of the Europeans or Japanese, except for Toyota and Honda. Cars, trucks, and cars & trucks combined count as separate observations. The blue line is the predicted number of models from an ordinary least squares regression on the number of platforms. I find that models = -2.25 + 2.26*platforms, with an R2=0.89.4 On average, each platform allows a firm to produce 2 ¼ model. Observations above the line indicate ability to base more than the average number of models on each platform.
3 The data point for GM cars & trucks combined has been proportionally rescaled to fit on the graph. The true number of platforms is 21 for 54 models. 4 The constant term is not significantly different from zero and in the following graphs I force the line to go through the origin.

Figure 2: Platforms and models (2003)
GM is the only company that is consistently above the line. They have a reputation of sharing models between their different nameplates. It will have to be seen later whether they incur a productivity penalty for this practice. Another danger is that the distinction between brands gets blurred and each one becomes less attractive. An infamous (at least to GM) cover of Newsweek in 1987 shows five indistinguishable GM midsize sedans, which are all sold at the same time at very different prices. One fact to note is that Toyota and Honda are hardly above the line for cars and trucks separately, but clearly above for all vehicles combined (the red markers). They are the only two firms that manage to produce light trucks based on car platforms. Given the growth in the truck segment and the continuous introduction of new truck models, this positions them well for the future.
While basing vehicles on a single platform facilitates production on the same assembly line it is neither necessary nor sufficient. In Figure 3, I use plant level data assembled from the Harbour reports to investigate which firms have the most versatile assembly plants. The horizontal axis is the average number of body and assembly lines across all a firm’s North American assembly plants. On the horizontal axes, I plot the number of vehicle varieties that are produced in 1995 (green) and 2003 (red). Cars and trucks are combined, but plants producing medium or heavy trucks are omitted. The top left graph, for example, illustrates that firms hardly differ in their ability to manufacture different platforms on the same line. In Table 2, I report the results of OLS regressions with platforms (and other concepts) as dependent variable and assembly lines as explanatory

variable, without constant term.5 On average, firms assembly less than 1.1 platforms per assembly line and this has not changed from 1995 to 2003.
Another popular tendency is to offer cars in several body styles. The Ford Focus, for example, is offered as a 4 door sedan, a 3 or 5 door hatchback, or station wagon, which are all build in the Hermosillo, Mexico. The practice is even more common with pickup trucks which are often offered in several styles of cab, standard, crew, or king, with long or short bed, and with a myriad of engines, five different ones for the Chevrolet Silverado. Obviously, to produce all these variations on the same assembly line, requires smarter robots, smarter workers, smarter management, which the observers have dubbed lean production or modern manufacturing.
For the number of models, styles and variations produced per assembly line, there is a clear upward movement in the other three graphs of Figure 3. For each of the measures of vehicle variety I show the estimated regression slopes in Table 2. The ability to produce a greater variety per line went up for each of the measures, but differences are large. Producing different platforms on the same line remains a rare feat, even in 2003. On average, each line produces approximately two models, which tend to share their platform. In the next two measures, the technology seems to have changed from 1995 to 2003, which might be due to increased adoption of lean technology in the industry. The ability to produce more vehicle styles on the same line went up by almost 50% in a mere eight years.
Table 2: Regression slopes on lines with different measures of vehicle variety as dependent variable
1995 2003
Platforms 1.081 (.026) 1.090 (.025)
Models 1.874 (.167) 1.948 (.155)
Configurations 1.990 (.212) 2.579 (.156)
Styles 1.902 (.101) 2.800 (.133)
Contrary to accepted wisdom, it is not the Japanese or joint venture plants that build the greatest vehicle variety on their assembly lines. For most measures, the GM plants are furthest above the industry average, even more so in 2003 than in 1995.
5 None of the constant terms was significant so I omitted them all. Therefore I also omit the R2 statistic as it would be a misleading measure. From the different graphs it should be clear that the fit is at least as tight as in . Figure 2

Figure 3: Assembly lines and vehicle variety

Different aspects of lean production system are thought to be complementary, see Milgrom and Roberts (1990). If you want workers to perform several tasks, they need more training; if workers get more responsibilities, it would be only prudent to let them act on them and delegate tasks from supervisors to assembly line workers. In such an organization it makes sense to de-stress the hierarchical structure of the workforce. If workers are able to handle multiple tasks, they can rotate through the factory over time to break the repetitiveness of the job. To make better use of the knowledge the now empowered workers are gaining first-hand, firms set up a system of soliciting suggestions for improvements from their employees, with commensurate compensation. All these examples make a lot of sense, but they have an important consequence. The transition from mass to lean production will be sudden, not gradual (Van Biesebroeck 2003). If the marginal productivity of changing one aspect of the production system is increasing in the changeover of another task, they will be changed together. Plants will therefore be either lean or mass, with intermediary configurations rare. In Section 4 I investigate whether we can identify and characterize two technologies from the data, without classifying plants exogenously.
2.3 Increased outsourcing The third trend I discuss, an increased tendency to outsource activities or manufacture of intermediate inputs, is a hot topic in the press and academic articles in management and economics. In the automobile sector, the reorganization of the supply chain into layered tiers, the rise of just-in-time inventory management, and the subassembly of components in finished modules by suppliers have attracted a lot of attention. The higher productivity of Japanese transplants in North America is often explained as a greater degree of outsourcing. The American competitors have in recent years sold off most of their component manufacturing activities, creating Delphi and Visteon the world’s largest and third largest supplier firms.
Two types of outsourcing at the plant level will be analyzed. Using aggregate census data, I investigate whether the percentage of material inputs purchased from different plants has increased over time. Using detailed data from Harbour, I can also investigate whether plants are now outsourcing more activities, and which plants do least in-house. While the plant is the most natural unit of analysis to measure productivity, which I do afterwards, one generally thinks about the firm making the outsourcing decisions. The plant level analysis will allow us to discuss the technological aspects of outsourcing activities, while a firm level analysis would be more informative over control, incentive, and property right issues.
Of material inputs Using industry data aggregated from plant-level surveys, compiled by the OECD, we can track the evolution of the material cost/sales ratio for the motor vehicle industry. Figure 4 plots this statistic for each of the three North American countries. The Mexican and, especially, the Canadian industry outsource more of their material purchases than U.S. plants. This is good news for their domestic firms as both countries have hardly and final manufacturers, but a strong presence in the car part industry. In Canada, material
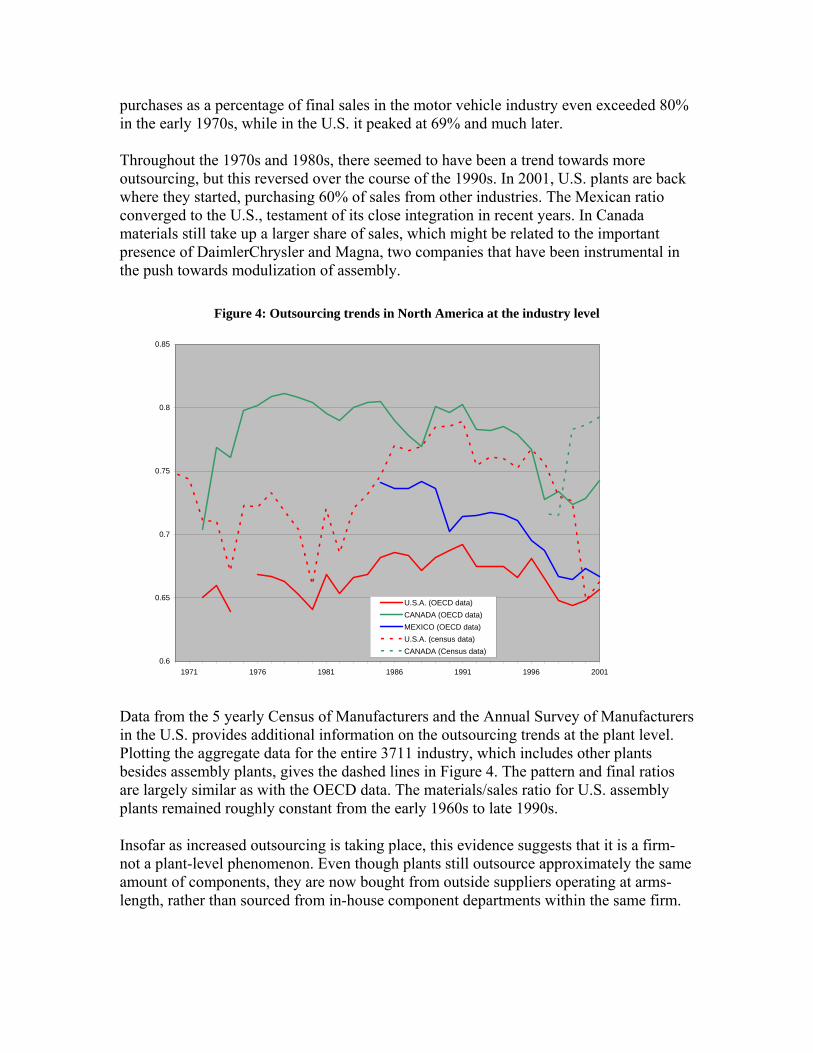
purchases as a percentage of final sales in the motor vehicle industry even exceedein the early 1970s, while in the U.S. it peaked at 69% and much later. Throughout the 1970s and 1980s, there seemed to have been a trend towards more outsourcing, but this reversed over the course of the 1990s. In 2001, U.S. plants are bawhere they started, purchasing 60% of sales from other industries. The Mexican ratio converged to the U.S., testament of its close integration in recent years. In Canadamaterials still take up a larger share of sales, which might be related to the important presence of DaimlerChrysler and Magna, two companies that have been instrumental ithe push towards modulization of assembly.
Figure 4: Outsourcing trends in North America at the industry level
d 80%
ck
n
0.85
0.8
0.65
0.7
0.75
0.62001199619911986198119761971
U.S.A. (OECD data)CANADA (OECD data)MEXICO (OECD data)U.S.A. (census data)CANADA (Census data)
Data from the 5 yearly Census of Manufacturers and the Annual Survey of Manufacturein the U.S. provides additional information on the outsourcing trends at the plant level.Plotting the aggregate data for the entire 3711 industry, which includes other plants besides assembly plants, gives the dashed lines in Figure 4. The pattern and final ratios are largely similar as with the OECD data.
rs
The materials/sales ratio for U.S. assembly ghly constant from the early 1960s to late 1990s. plants remained rou
Insofar as increased outsourcing is taking place, this evidence suggests that it is a firm- not a plant-level phenomenon. Even though plants still outsource approximately the same amount of components, they are now bought from outside suppliers operating at arms-length, rather than sourced from in-house component departments within the same firm.

Of activities
rom the Harbour reports, we obtained information on which activitiesF plants are ht
, increased to 71% by 1998, and decreased onsequently back to its original level in 2003. The same pattern shows up whether we
include all obsto plants that have been active throughout the entire nine year period, 64 plants. The former statistics are in red, while the latter are plotted in blue.
Figure 5: Outsourcing trends at the plant-level
performing on-site, which are sourced from in-house suppliers, and which are bougfrom other firms. Instead of looking at the dollar value of components, we now count actual steps in the assembly process, such as wheel assembly, stamping body panels, etc. that can be performed on-site in the assembly plant or outsourced.
The variation across plants is smaller than might have been expected and the same hump-shaped trend discovered earlier reappears. In Figure 5, I plot the percentage of activities
ot performed on-site. This was 63% in 1995nc
erved plants in the sample, on average 81, or whether we limit the sample
55.0%1995 1996 1997 1998 1999 2000 2001 2002 2003
0
57.0%
59.0%
61.0%
63.0%
65.0%
67.0%
69.0%
71.0%
73.0%
20
40
60
80
100
120
140
160
180
200
total number of plants number of continuous plants
outsoured activities (all plants) outsoured activities (continuous plants)
n
ct on outsourcing patterns. Plants located in the U.S., Canada, or Mexico outsource an average of 65% of
This data is available at the plant-level and we can take a look at different dimension thatime. Table 3 contains the share of outsourced activities by location or ownership of theplant.6 The far-right column indicates that location has very little impa
their activities.
Statistics are averages over the entire sample period, 1995-2003. 6
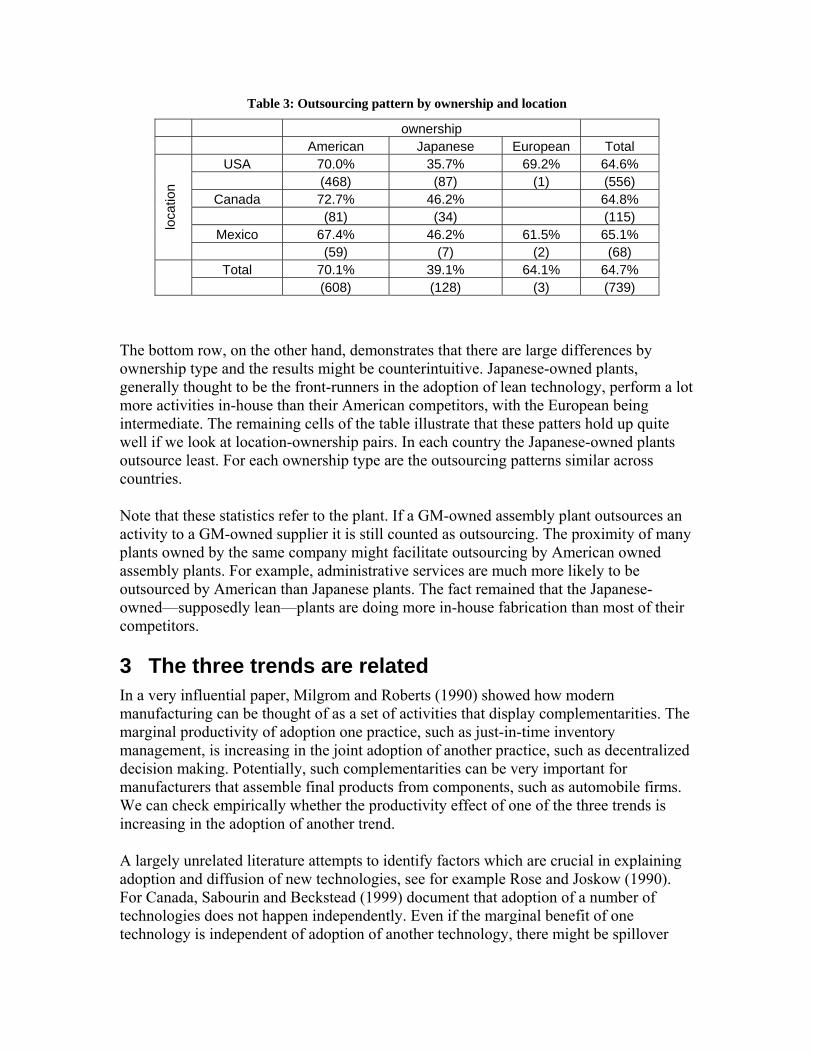
Table 3: Outsourcing pattern by ownership and location
ownership American Japanese European Total
USA 70.0% 35.7% 69.2% 64.6% (468) (87) (1) (556)
Canada 72.7% 46.2% 64.8% (81) (34) (115)
Mexico 67.4% 46.2% 61.5% 65.1%
loca
tion
(59) (7) (2) (68) Total 70.1% 39.1% 64.1% 64.7%
(608) (128) (3) (739)
The bottom row, on the other hand, demonstrates that there are large differences by ownership type and the results might be counterintuitive. Japanese-owned plants, generally thought to be hnology, perform a lot more activities in-house than their American competitors, with the European being intermediate. The remaining cells of the table illustrate that these patters hold up quite well if we look at location-ownership pairs. In each country the Japanese-owned plants outsource least. For each ownership type are the outsourcing patterns similar across countries.
Note that these statistics refer to the plant. If a GM-owned assembly plant outsources an activity to a GM-owned supplier it is still counted as outsourcing. The proximity of many plants owned by the same company might facilitate outsourcing by American owned assembly plants. For example, administrative services are much more likely to be outsourced by American than Japanese plants. The fact remained that the Japanese-owned—supposedly lean—plants are doing more in-house fabrication than most of their competitors.
3 The three trends are related In a very influential paper, Milgrom and Roberts (1990) showed how modern manufacturing can be thought of as a set of activities that display complementarities. The marginal productivity of adoption one practice, such as just-in-time inventory management, is increasing in the joint adoption of another practice, such as decentralized
ted literature attempts to identify factors which are crucial in explaining doption and diffusion of new technologies, see for example Rose and Joskow (1990).
document that adoption of a number of technologies does not happen independently. Even if the marginal benefit of one technology is independent of adoption of another technology, there might be spillover
the front-runners in the adoption of lean tec
decision making. Potentially, such complementarities can be very important for manufacturers that assemble final products from components, such as automobile firms. We can check empirically whether the productivity effect of one of the three trends is increasing in the adoption of another trend.
A largely unrelaaFor Canada, Sabourin and Beckstead (1999)
effects due to share sts of adjustment, etc. As a result we might expect different ch implemented together only as their joi fect on productiv ts it. B ng to ical nce, I present some ex s why w expect su plemen in th obile industry.
Flexible Technology and Outsourcing
d overhead, learning, lower transition costs, fixed coanges to be
nt ef ity warran efore turni the empir evideample e might ch com tarities e autom
If a plant starts ing mult orms on the same assem e, it that it takes a p oductiv an open question whether the prod cline is smaller if the change is accompanied b e toward lar prod nd moutsourcing. Outsourcing the production of comp t necessary the development)
r adopting module-based assembly techniques might lessen the space constraints and complexity on the assembly line and open the possibility to produce several models in the
produc iple platf bly lin is likelyr ity hit. It is u ity de
uc n activ
y v a mo s moduonents (no
tio ore
o
same plant.
Flexible Technology and Model Proliferation
The minimum efficient scale of an assembly plant is rather large, estimated at 200,000 t250,000 vehicles a year. Offering consumers more choice is likely to be very costly—interms of productivity lost—unless it is accompanied by a redesigned assembly plant sucthat multiple models can be manufactured on the same line. A flexible production structure is
o h
also likely to put the firm in a better position to change its mix of vehicles
ice
hese effects is investigated in Norman and Thisse (1999).
offered ex post. Flexibility has this real option component to it, as explored in Slade (2001).
A firm that offers a wider selection of models will, ceteris paribus, have more opportunities or have a greater necessity to build several vehicles in a single plant. Vversa, once a firm is able to produce several vehicles on each assembly line (flexible production) it might become profitable to expand its vehicle offerings. The direction of causation of t
Outsourcing and Model Proliferation
Producing more vehicles and allow for greater customization of the final produleads to a more complex assembly process, it also strains the development cycle. Another aspect of the move towards greater consumer choice is to put pressure on manuto redesign their existing vehicles more frequently. Without spinning off some of the component development to suppliers—one aspect of the drive towards increasedoutsourcing—it might make development prohibitively expensive.
If there are negative economies of scope in p
ct not only
facturers
roducing components in-house—eventually the system becomes too complex to manage, as Henry Ford experienced first-hand at the
e ight
sprawling Rouge complex with 100,000+ employees—there comes a point where a firm produces too many (final) products to handle the entire supply chain in-house. The drivto outsourcing might be gradually increasing in the number of models sold or there mbe discrete thresholds.
4 Productivity Effect…
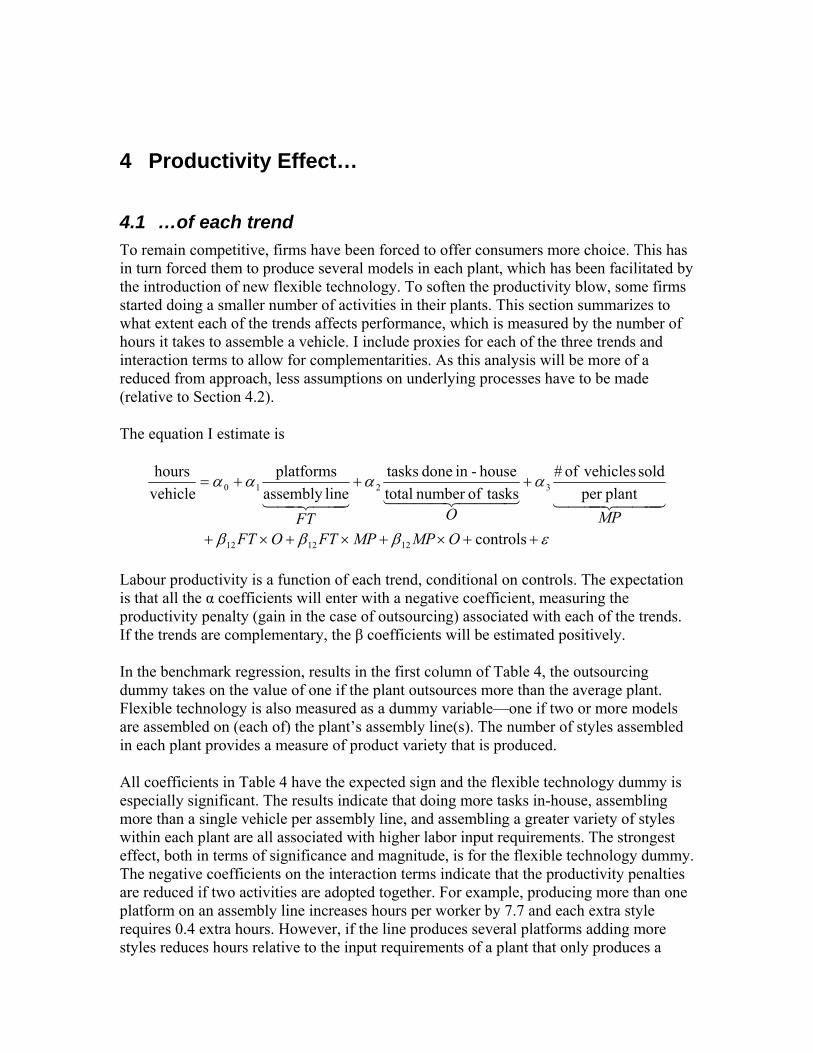
4.1 …of each trend To remain competitive, firms have been forced to offer consumers more choice. This has in turn forced them to produce several models in each plant, which has been facilitated bythe introduction of new flexible technology. To soften the productivity blow, some firms started doing a smaller number of activities in their plants. This section summarizes to what extent each of the trends affects performance, which is measured by the number of hours it takes to assemble a vehicle. I include proxies for each of the three trends and interaction te
rms to allow for complementarities. As this analysis will be more of a derlying processes have to be made reduced from approach, less assumptions on un
(relative to Section 4.2).
The equation I estimate is
εβββ
αααα +++=plantper
so vehiclesof # tasksofnumber totalhouse-in done tasks
lineassembly platforms
vehiclehours
3210
MPOFT444 3444 21444 3444 214434421
++×+×+×+ controls
ld
121212 OMPMPFTOFT
itively.
the first column of Table 4, the outsourcing
my is ouse, assembling
. However, if the line produces several platforms adding more styles reduces hours relative to the input requirements of a plant that only produces a
Labour productivity is a function of each trend, conditional on controls. The expectation is that all the α coefficients will enter with a negative coefficient, measuring the productivity penalty (gain in the case of outsourcing) associated with each of the trends. If the trends are complementary, the β coefficients will be estimated pos
In the benchmark regression, results indummy takes on the value of one if the plant outsources more than the average plant. Flexible technology is also measured as a dummy variable—one if two or more models are assembled on (each of) the plant’s assembly line(s). The number of styles assembled in each plant provides a measure of product variety that is produced.
All coefficients in Table 4 have the expected sign and the flexible technology dumespecially significant. The results indicate that doing more tasks in-hmore than a single vehicle per assembly line, and assembling a greater variety of styles within each plant are all associated with higher labor input requirements. The strongest effect, both in terms of significance and magnitude, is for the flexible technology dummy.The negative coefficients on the interaction terms indicate that the productivity penalties are reduced if two activities are adopted together. For example, producing more than one platform on an assembly line increases hours per worker by 7.7 and each extra style requires 0.4 extra hours
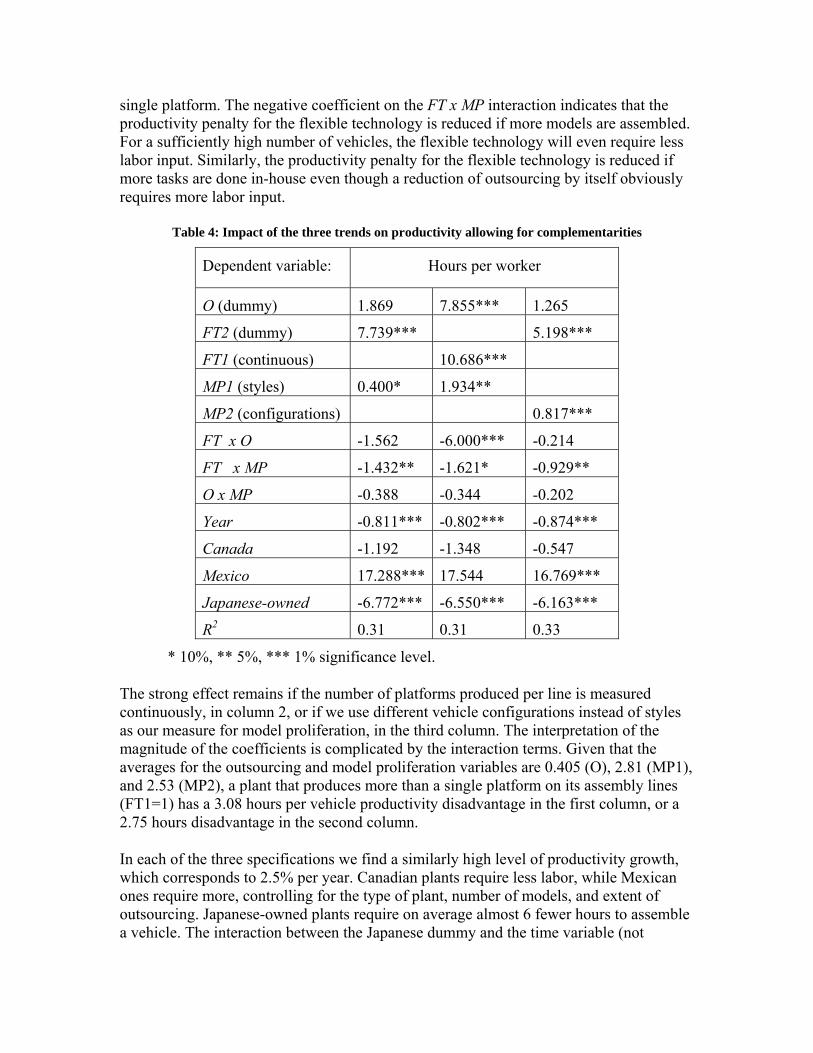
single platform. The negative coefficient on the FT x MP interaction indicates that the roductivity penalty for the flexible technology is reduced if more models are assembled.
For a sufficiently high number of vehicles, the flexible technology will even require less enalty for the flexible technology is reduced if h a reduction of outsourcing by itself obviously
quires more labor input.
three trends on productivity allowing for complementarities
p
labor input. Similarly, the productivity pore tasks are done in-house even thougm
re
Table 4: Impact of the
Dependent variable: Hours per worker
O (dummy) 1.869 7.855*** 1.265
FT2 (dummy) 7.739*** 5.198***
FT1 (continuous) 10.686***
MP1 (styles) 0.400* 1.934**
MP2 (configurations) 0.817***
FT x O -1.562 -6.000*** -0.214
FT x MP -1.432** -1.621* -0.929**
O x MP -0.388 -0.344 -0.202
Year -0.811*** -0.802*** -0.874***
Canada -1.192 -1.348 -0.547
Mexico 17.288*** 17.544 16.769***
Japanese-owned -6.772*** -6.550*** -6.163***
R2 0.31 0.31 0.33
* 10%, ** 5%, *** 1% significance level.
Given that the averages for the outsourcing and model proliferation variables are 0.405 (O), 2.81 (MP1),
ble
The strong effect remains if the number of platforms produced per line is measured continuously, in column 2, or if we use different vehicle configurations instead of styles as our measure for model proliferation, in the third column. The interpretation of the magnitude of the coefficients is complicated by the interaction terms.
and 2.53 (MP2), a plant that produces more than a single platform on its assembly lines (FT1=1) has a 3.08 hours per vehicle productivity disadvantage in the first column, or a2.75 hours disadvantage in the second column.
In each of the three specifications we find a similarly high level of productivity growth, which corresponds to 2.5% per year. Canadian plants require less labor, while Mexican ones require more, controlling for the type of plant, number of models, and extent of outsourcing. Japanese-owned plants require on average almost 6 fewer hours to assema vehicle. The interaction between the Japanese dummy and the time variable (not
reported) is negative, indicating that the Japanese advantage is quickly eroding. Japanesowned plants improve productivity by 1.2% per year on average, while this is 2.7% for American-owned plants.
4.2 …of each technology Given the importance of the flexible tec
e-
hnology variable in the previous section, I investig any advantages over traditional orare the abilit ducts in the s nce of diseconomies of scope, to operate plants of a smaller scale or at lower capacity utilization, i.e. absence of scale econ ster productivity growth ely to be labour-saving. The following equations capture each of these four effects
=∈
ate its importance further. Flexible or lean technology is claimed to have m mass manufacturing. Some of the most important benefits
y to produce more pro ame plant, i.e. abse
omies, and fa that is lik:
MassiLeanihpv
it
itit
∈+×+++++×++++ scscale 2it10=
if eemscope if em(ope
4it2
43it
ββ tim)plit( 3βscaleit10 ββtime)plit
ηεααααα
hpv is the nu o ssemble a vehicle; proxies for scale are total output or tot y; scope can be ed by r of platforms, styles, and configuration producing.
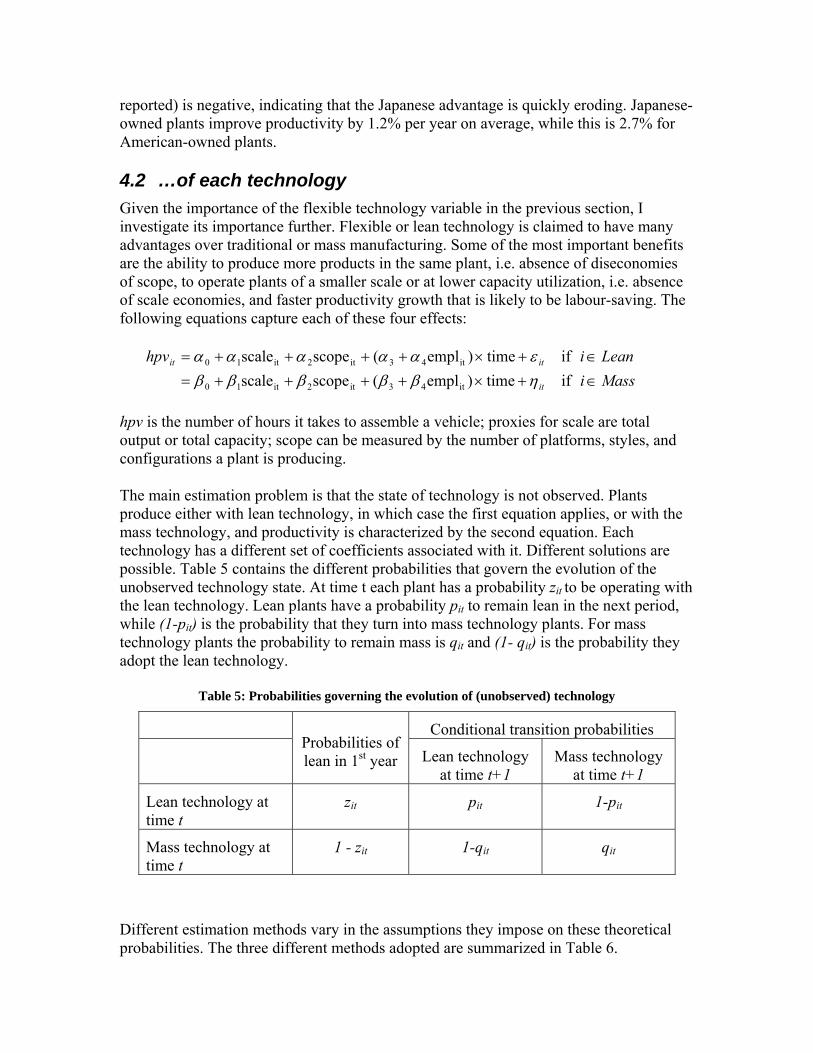
The main est roblem is that of te y is no ed. Plants produce either with lean technology, in which case the first equation applies, or with the mass technol nd productivity is ond ach technology has a different set of coefficients associated with it. Different solutions are possible. Tab ains the differe ti overn n of the unobserved technology state. At time ility the lean tech ts hav it in lean in the next period, while (1-pit) is the probability that they turn into m chnolog ts. For mass technology plants the probability to rem mass is it (1- qit ey adopt t
mber of hours it takes t aal capacit measur the numbes a plant is
imation p the state chnolog t observ
ogy, a characterized by the sec equation. E
le 5 cont nt probabilit each plant has a probab
es that g the evolutioz to be operating with it
nology. Lean plan e a probabil y pit to remaass teq and
y plan) is the probability thain
he lean technology.
Table 5: Probabilities governing the evolution of (unobserved) technology
Conditional transition probabilities
Probabilities of lean in 1st year Lean technology
at time t+1 Mass technology
at time t+1
Lean technology at time t
zit pit 1-pit
Mass technology at time t
1 - zit 1-qit qit
Different estimation methods vary in the assumptions they impose on these theoretical probabilities. The three different methods adopted are summarized in Table 6.

Table 6: Three ways to estimate the unobserved technology state
zit pit qit
Deterministic model 1 if 0
Xit γ > 0 otherwise 1 1
Technology switching p p (1-p)
Technology adoption )exp(1)exp(
0
0
γγ
i
i
XX
+ 1 )exp(1
)exp(λ
λ
it
it
ZZ
+
The simplest solution is to assign plants a technology deterministically based on an observable characteristic or a linear combination of characteristics. Plants are assigned to a technology once, without possibility of switching, or this assignment can be done in each period independently. For example, the results in Table 7 apply when Japanese-
ass and lean technology. Instead, the coefficient
owned plants are assumed to be lean producers and all other plants are mass. Other possibilities are to use the location of a plant or the type of vehicle it produces (cars or trucks) to assign groups, or any linear combination of these variables. The interpretationof the two groups is not necessarily mestimates will indicate in what dimensions the two groups differ.
Table 7: Results for a simple implementation of the deterministic model
Classified by ownership Japanese Other Log capacity
-12.77 (3.76)
-28.62 (1.74)
# of platforms
0.180 (2.5)
5.869 (0.84)
Time -0.582 (0.74)
-0.417 (0.35)
Time x 1.232 1.822 employment (1.018) (0.35) Const 8.8
.6ant 133
(1486 ) (699.0) 1196.8
The results above indicate that Japanese plants have a smaller productivity penalty of producing in a plant with low total capacity and similarly they do not incur a significant productivity penalty to produce several platforms in the same plant, which is very pronounced in the other plants. Japanese-owned plants also have a higher rate of productivity advance, but this is not significantly different.7
7 If groups are assigned by location, Canadian plants turn out to be better able to produce in smaller plantbut they do achieve lower productivity if they produce several model styles (the platform variab
s, le was

The determinist d implementation of the model, called technology switching, follows Porter (1983). Changes in technology can go either way, lean to mass or m to lean. To keep estimation tractable, we have to en obabilities are constant over time and across perio obabilit to produce with the lean technology and (1-p) to use the ma plementation, follow ld be to ma the probability of each technology a function of the technology in last period, but keeping the switching probabilities constant over time. As long as transitions between states have the same probability for each year and plant, estim atively with the EM algorith
third approach follows Van Biesebroeck (2003) and estimate the probability of lean
t of outsourcing might also be a sign robability for either technology is modeled sim ated jointly with the adoption probabilities. T o say whether outsourcing and flexible technology are s or com nts; whether the impact on adoption times or probabilities varies ownership or plant location.
The results for the last two models are in . The column headings “Lean” and “Mass” are arbitrary assigned labels in the technology switching model. For the technology adoption m the absorbin logy is The differences betwe o technolo e not ver unced if switching back and forth is allowed, i colu of obse operate with the first technology, dubbed “L s lower onomies, more severe diseconomies of scope, a larger intercept, but it experienced a higher rate l productivity growth,
s labor-using. Only the scale and scope coefficients are significantly 9
ic assignment of technology is clearly not ideal. The secon
assforce that the pr
plants.8 In every time d each plant has prss technology. An alternative im
y p
ing Ellison (1994) wou ke
ation can proceed iter m.
Atechnology switches using observable characteristics. If a plant is operating with the (newer) technology at time t-1, it is assumed to stay with the lean technology with probability 1. Regressing back to the older mass technology is ruled out. If a plant is operating with the mass technology at time t-1, there is a probability pit that the plant adopts the lean technology and a probability (1- pit) that the plant sticks with the masstechnology.
The probability of technology switches is modeled with the logit formula, see Table 6, where the Z matrix contains variables that make it less or more likely to adopt the new technology, ownership dummies are a natural candidate. The exten
ificant predictor for the adoption of lean technology. The initial pilarly as a function of variables in X and estim
his analysis will be able t substitute plemeby firm
Table 8
odel, g techno denominated by “Lean”.
en the twn the first two
gies ar y pronomns. 7% rvations
ean”. It ha scale ecof neutra
which was also lesdifferent between the two equations.
ductivity
s higher (less hpv). 8 Over nine years there are 29 different possible technology trajectories for each plant. Even assuming that they are independent for the 90 plants, this amounts to more than 46000 different possible states of the world.
dropped as all Canadian plants only produce on a single platform). Canadian plants have lower progrowth, but their base productivity level captured by the constant term, i
9 The numbers in brackets are the standard errors for the coefficient estimates, while the stars indicate whether the coefficients are significantly different between both equations.

Table 8: Results for the technology switching and technology adoption mod
Technology switching Technology adoption
els
Lean Mass Lean Mass Log capacity
-15.63 ( 1.24)
-18.54** ( 0.37)
-2.51 ( 0.93)
-12.96** ( 0.57)
# of platforms
7.48 ( 1.83)
3.72** (0.31)
0.39 ( 0.91)
2.37** ( 0.25)
Time -0.84 (0.34)
-0.65 ( 0.06)
-0.65 ( 0.14)
-0.47 ( 0.06)
Time x 11.09 13.35 1.57 employment ( 3.89) ( 1.10) ( 3.35) ( 1.68)
8.57**
Constant 1863.3 ( 694.9)
1540.9 ( 117.0)
1343.5 ( 277.3)
1121.5 ( 131.7)
p 0.069 ( ) X-variables: Constant Time
0.573 (0.39)
Canada -0.245 (0.91) 0.228 (0.24)
Z-variables: Constant Time Canada
3.749 (0.721) -0.112 (0.898) -19.68 (23.5)
** Lean and Mass coefficient differ at a 5% significance level Differences become more pronounced once we assume that the “Lean” technology is absorbing and that plants differ in initial probability for each technology and that some plants are more likely to adopt the new technology. The lean technology is now foundhave significantly lower scale economies, but no diseconomies to scope, while the mtechnology has very large scale economies, but suffers from diseconomies of scope
arger plants need less labor input to assemble a vehicle, but if they do not operate with
to ass
.
tion of the lean technology is creasing over time. The coefficients on the Canada dummy are estimated particularly
imprecisely. They suggest that Canadian-based plants were more likely to have started
Lthe lean technology there is a penalty for assembling more than a single platform. Productivity growth is substantial for both technologies and not significantly different. It is more labor-using for the mass technology. The variables in the starting and switching probability were estimated extremely imprecisely. They suggest that plants that enter the sample more recently are becoming
the lean technology, while adopless likely to start out with in
out with the lean technology and also more likely to adopt the lean technology in subsequent years.
5 Conclusions [To add]
References
Bresnahan, Timothy F erie A. 994), “O uctuation ant leve rly Jour conomics 09, No. 3 , pp. 593-
Bresnahan, Timothy F “Compe nd collusi American automobile industry: the 1955 price war,” Journal o trial Econ Vol. 35, N . 457-82.
Berry, Steven T., Jame ohn, and akes (199 tomobile Prices in Ma brium.” etrica, V uly), p. 8
Berry, Steven T., James Levinsohn, and Ariel Pakes (1999), “Voluntary Export Restraints on Automobiles: Evaluating a Trade Policy.” American Economic Review, Vol. 89 (June), p. 189–211. Berry, Steven T., James Levinsohn, and Ariel Pakes (2004), “Differentiated Products Dem tems from a Combination of Micro and Macro Da r Market,” Jou al Econ y, Vol. 112, No. 1, p. 68-105.
Carrillo V., Jorge (1995), “Flexible production in the auto sec01.
old economy collides with the new,”
rket aspects of flexible manufacturing,” Journal of Industrial Economics,
p. 345-372.
. and Vanal of E
l R 1amey (, Vol. 1
utput fl, August
s l at the p624 l,” Quarte
. (1987), tition a on in thef Indus omics, o. 4, pp
s Levins Ariel P 5), “Aurket Equili Econom ol. 63 (J 41–90.
Strategic
and Sys ta: The New Carnal of Politic om
tor: industrial . 1, pp. 87-1reorganization at Ford-Mexico,” World Development, Vol. 23, No
Goldberg, Pinelopi Koujianou (1995), “Product Differentiation and Oligopoly in International Markets: The Case of the U.S. Automobile Industry.” Econometrica Vol. 63 (July), p. 891–951.
Harbour and associates, The Harbour report, annually, 1980-2003
Helper, Susan (1995), “Supplier Relations and Adoption of New Technology: Results of Survey Research in the U.S. Auto Industry,” NBER Working Paper No. 2578.
woka, Jr. John E. (2001), “Automobiles: theKReview of Industrial Organization, Vol. 19, pp. 55-69.
Milgrom, Paul and John Roberts (1990), “The Economics of Modern Manufacturing: Technology, Strategy, and Organization,” American Economic Review, Vol. 80, No. 3, pp. 511-528.
Norman George and Jacques-François Thisse (1999), “Technology choice and mastructure: strategicVol. 47, No. 3, September, p

Porter, Rob (1983), “A Study of Cartel Stability: The Joint Executive Committee 1880- of Economics, 14(2), 301-14.
Petrin, Amil. 2002. “Quantifying the Benefits of New Products: The Case of the
ond Beckstead (1999), Technology adoption in Canadian
An Application to obile Assembly,” Review of Economic Studies, Vol. 70(1), pp. 167-198.
1886”, Bell Journal
Minivan,” Journal of Political Economy, Vol. 110 (August), p. 705–29.
Rose, Nancy L. and Paul J. Joskow (1990), “The diffusion of new technologies: evidence from the electric utility industry,” RAND Journal of Economics, Vol. 21, No. 3, Autumn,pp. 354-373.
Sabourin, David and Desmmanufacturing: survey of advanced technology in Canadian manufacturing, IndustryCanada, July.
Slade, Margaret E. (2001), “Valuing managerial flexibility: an application of real-option theory to mining investments,” Journal of Environmental Economics and Management, Vol. 41, No. , pp. 193-233.
Sutton, John (2004), “The Auto-Component Supply Chain in China and India: A benchmarking study”, report.
an Biesebroeck, J. (2003), “Productivity and Technology Choice: VAutom