flexible polyurethane foam manufacturing: waste reduction...
TRANSCRIPT
I
FLEXIBLE POLYURETHANE FOAM MANUFACTURING:
WASTE REDUCTION
FOR
AUXILLIARY BLOWING AGENTS
G. RAUMANN AND M.R. OVERCASH
CHEMICAL ENGINEERING DEPARTMENT
NORTH CAROLINA STATE UNIVERSITY
RALEIGH, NORTH CAROLINA
27695-7905
Funds Provided by the Pollution Prevention Program North Carolina Department of Natural Resources
and Community Development
December 9, 1988
TABLE OF CONTENTS
Page
1 . 0 2.0 3 . 0 4.0 5.0 6.0 7.0 8 . 0 9.0
1 0 . 0 11 .0 12.0 1 3 . 0
Introduction Objectives Project Approach Background Flexible Polyurethane Process & Experiments Laboratory Foam Preparation Types of Measurements And Objectives Qualitative Observations During Foaming Measurements And Discussions of Results-
Discussion of Results - Closed System Temperature Measurements During Foaming Conclusions And Future Plans References
Open System
1 1 2 3
11 1 3 2 0 2 0
2 1 2 9 4 0 4 6 4 9
ACKNOWLEDGEMENTS
The authors wish to recognize the excellent contributions made by Mr. Scott Blaha as a research student focusing on the temperature determinations. A vital element in this project has been the support by industry. Visit schedules, extensive personal time, and industrial chemicals for experiments were major contributions by those in industry. Three primary corporations and contacts are acknowledged,
Hickory Springs Manufacturing, Co. Mr. Edward Kozak Olympic Products, Company Mr. Frank Sasser Leggett & Platt, Inc. Mr. Jerry Pool
1.0 INTRODUCTION
The waste minimization program in Chemical Engineering at North Carolina State University is aimed at research, development, engineering, and implementation for waste minimization in industry. The program, first described in 1980, is focused on the technical and economic stages necessary to actually implement the lowering of waste emissions from industry. In order to make significant contributions'to the waste minimization field, a selection process has been developed to screen concepts or interests of industry through several levels in an attempt to clarify the actual feasibility of pollution prevention (Overcash 1986). This iterative screening process leads to a subset of industrial circumstances in which;
a) the emission magnitude or value is within a reasonable range for probable recovery or elimination,
b) the industry commitment to considering a waste minimization scheme is evident, and
c) there exist critical unavailable information which the the N.C.S.U. program could generate by laboratory and pilot-scale studies or by detailed engineering analysis and design.
An intermediate stage in this overall identification and screening process for waste minimization situations is a preliminary engineering assessment of a project. Following such an assessment a series of experiments are often necessary to provide missing critical information as is the case with this current project. The experimental investigation establishes a base by which a full-scale waste minimization can be implemented. This report is a part of the documentation and feedback necessary to accelerate the overall adoption of waste reduction technology.
2.0 OBJECTIVES
A preliminary engineering evaluation was conducted for waste reduction in the production of flexible polyurethane foam (Overcash et a1 1986a). That study identified that substantial quantities of the auxilliary blowing agent (methylene chloride or chlorofluorocarbon, CFC-11) could potentially be recovered as a means of reducing air emissions. However the recovery of auxilliary blowing agent is a complex problem coupled directly to another manufacturing requirement, the maintenance of safe plant working conditions in the presence of small quantities of toluene diisocyanate (TDI). Worker safety for TDI is maintained with adequate air flow to keep concentrations at safe levels.
This air flow lowers the auxilliary blowing agent concentrations to a range for which recovery technologies (carbon adsorption, condensation, etc.) are very impractical as an economic technology. The polyurethane plants had reached conclusions for recovery based on this coupled plant situation as long as three decades ago.
The current objective in this project has been to reexamine innovative means to maintain safe worker conditions while simultaneously recovering auxilliary blowing agent. Following the preliminary engineering assessment, this study is a typical next stage. An emphasis is placed on critical missing information, largely of a basic nature, which if present would potentially increase the opportunities for reducing plant air emissions. This basic informations is useable across the industry and do not necessarily define any particular recovery approach. For the flexible polyurethane it is first essential to establish the dynamics of auxilliary blowing agent l o s s in conjunction with other gases released (primarily CO 1. The role of an auxilliary blowing agent is also an impoltant study objective as a basis for possible substitution. It is anticipated that results from this investigation will expand possible waste minimization directions which can be explored for reduction of emissions from flexible polyurethane manufacturing. In addition, this basic information on organic volatilization is transferable to other manufacturing systems.
3 . 0 PROJECT APPROACH
A very productive effort was developed involving several flexible polyurethane manufacturers and the researchers at North Carolina State University. This plant-scale interaction with the laboratory-based studies was instrumental in simulating manufacturing conditions to assure greater transferability of the research results. In addition, the personnel of the three plants proved to be invaluable sources of information, support, and practical advice. The progress of this investigation consisted of four stages of activities.
In the first phase we sought to establish manufacturing conditions which would be the most relevant in controlling the dynamics of auxilliary blowing agent volatilization loss. These conditions include the chemistry and product specifications. In addition, the manufacturing equipment influences the rates of polyurethane foam production and thus the opportunities for auxilliary blowing agent recovery. While the facilities visited used either methlene chloride or CFC it was decided to conduct studies on only one system, the methylene chloride auxilliary blowing agent. From multiple plant visits a number of
2
parameters were verified for use in laboratory studies or in the mechanistic description of this process. The context of chemical changes, influences of product specifications and constraints of plant equipment in this continuous chemical manufacturing process were established. In addition, past investigations (often on particular facets of this process) were explored as important background information.
During the second stage of this project, techniques were developed in our laboratory to produce foam as a basis for evaluating the methylene chloride and other gas losses. This scale of foam production is used in the industry to test various formulations and has a direct empirical relation to the full-scale process. Laboratory procedures required a substantial investment to achieve reproducible results and foam in a defined range of product specification. The ability to modify procedures in accounting for less controlled conditions such as humidity and ambient temperature was developed to generate reproducible foam quality. A fixed "typical" formulation was adopted as representative of plant operations and this is described in later sections. In addition, the measurement techniques for chemical volatilization dynamics were developed to give successively more refined information on the dynamics of the process and emissions.
The experimental third stage consisted of various experiments to describe the foam manufacturing mechanisms which controlled the dynamics of methylene chloride loss. These detailed studies include overall gas loss, specific rates for the auxilliary blowing agent, and the foam temperature. Tests were designed to also gain insight into the timing and sequence of events in the foam reaction as well as the factors that influence these phenomena. Comparison of the dynamics with the production equipment constraints will allow development of options for recovery. In addition foam properties such as density, air flow resistance, pore shape and size, and mechanical properties of the foam and foam external surfaces were examined. These allow comparison to full scale manufacturing and offer further insight into alternatives for methylene chloride recovery. In the final stage recommendations are made for utilization of these information to advance the development of cost-effective auxilliary blowing agent recovery.
4 .0 BACKGROUND
4.1 HISTORICAL DEVELOPMENTS
Low density flexible foams play an essential part in present day furniture, bedding and automotive industries. The chemistry of polyurethanes was first studied in the 1 9 3 0 ' s by Otto Bayer and coworkers in Leverkusen. The final major patent
3
in 1 9 5 4 opened the way to commercial production in 1957 . The earlier polyurethane foams (PUF) were mainly polyester foams but are now largely superseded by polyethers. By 1 9 8 5 world manufacturing capacity for polyurethane foams had reached nearly 5 million metric tons mostly located in North America and Western Europe. The breakdown in the U.S. in 1 9 8 0 showed that 1 , 4 0 0 million lb. of flexible foams were produced and a total of 40 million pounds of CFC's from all sources were emitted to the atmosphere per year (Mooz and Quinn 1 9 8 0 ) .
While the CFC's were the predominant auxilliary blowing agents for a long period there has been a marked trend towards the use of methylene chloride (CH2C12) in the last 10 years.
4.2 HEALTH AND ENVIRONMENTAL CONCERNS
There are several aspects in which the manufacture of low density flexible PUF impacts health and environmental issues, but the main interest in this present report concerns the haaogenated hydrocarbons (HHC) used as auxilliary blowing agents. Other chemical species are involved e.g. primarily toluene diisocyanate (TDI), but to some extent also C 0 2 .
4.2.1 TDI
Toluene diisocyanate (TDI) is a reactant in PUF production. TDI is declared toxic by the Environmental Protection Agency and usage is regulated. TDI process line levels in the US are capped at 0.02 ppm. This regulation is met by extensive ventilation along the length of the line. There is pressure in the US to reduce levels to the European standard of 0.005 ppm. The PUF industry must begin to develop appropriate modifications to meet these probable restrictions. TDI is not an atmospheric emission hazard due to high reactivity and low concentration.
Any TDI remaining in the effluent gases can readily be eliminated because it is very reactive. A fine spray of water used in the effluent gas stream will react with the remaining TDI to give urea compounds and can then be treated and safely disposed.
4.2.2 Carbon Dioxide
The primary blowing agent in the foam formation is the C02 gas evolved in the reaction between TDI and water. Since the reaction is very exothermic the amount of water that can be added to a mixture needs to be kept within certain limits to prevent the formation of excessive temperatures on the foam. It is possible to have foam scorching, and also plant fires when the foam ignites. Technology exists to slow the foaming reaction and the heat evolution, and thus to use more water and
4
1
produce lighter foam. This alternative is not economically attractive at the moment. Moreover, the increased emission of C02 is not without environmental objections. C02 is a "Greenhouse" gas which contributes to the global warming phenomenon. Foam production is however not regarded as a major source in global C02.
4 . 3 HALOGENATED HYDROCARBONS IN THE ATMOSPHERE
This study was undertaken in response to the widespread concern of atmospheric contamination with halogenated hydrocarbons. These have been shown to be one of the factors connected with (and are widely held to be primarily responsible for) the depletion of the ozone layer in the upper atmosphere. Lowering of the ozone concentration results in greater penetration of ultraviolet radiation and a decrease in the energy allowed to escape from the lower atmosphere.
Trapping of solar energy is the principle of the common greenhouse and for this reason the global phenomenon is referred to as the "greenhouse effect". Carbon dioxide in the atmosphere plays an important part in the absorption process and is often referred to as the "greenhouse gas". This sequence of events is held to lead to a very undesirable, global warming trend in the lower atmosphere and the halogenated hydrocarbons being thus implicated in this well publicized greenhouse effect have become subject to various regulations.
4.3 .1 CFC Regulations
The EPA and many other concerned organizations world-wide have been collecting and analyzing data to identify the sources of, and major contributors to the emission of halogenated hydrocarbons. Many industries are heavy consumers of these relatively inexpensive industrial chemicals and regulations to limit the discharge to the atmosphere are either already present, are being revised to be more stringent or to include more substances, or new ones are in the course of being developed for future adoption.
The emission regulations of the CFC group of chemicals are becoming more stringent and are certainly a concern to the PUF industry. If ratified, the Montreal Protocol sponsored by the United Nations Environment Program (UNEP) and endorsed by the U.S. will:
freeze current CFC production at 1 9 8 6 levels, impose a 20% reduction by 1994 , impose a 5 0 % reduction by 1999 , and possible complete ban on CFC use if
climate makes it necessary.
5
I I
The industries affected by these regulations have reacted in a variety of ways. The manufacturers of the raw materials have put forward rebuttals to dispute the ozone depletion and the downstream effects. They have also pointed to the excellent thermal insulation properties of these materials in the use of closed cell foams as valuable "energy extenders".
Users of these CFC's have attempted to find materials which are not detrimental to the environment and that can be economically substituted in the manufacturing process. Others - usually as an interim step - have found means to substitute less harmful chemical species for the worst offenders. In yet other cases individual plants or whole industries have been able to find economical ways to prevent the discharge into the atmosphere of these materials by some means of entrapping these chemicals before emission. The latter method is particularly attractive when it can be combined with techniques for the economical recycling of these chemicals. Without ready methods of recovery, the solution of one problem may merely reappear in another form when the entrapped noxious waste material has to be safely disposed.
4.4 HALOGENATED HYDROCARBONS IN PUF MANUFACTURE
Traditionally, in the manufacture of low density polyurethane foam, large quantities of the halogenated hydrocarbons are used (as the auxilliary blowing agents) and discharged to the atmosphere. The emissions of these compounds at low concentrations are now being evaluated carefully. The reasons these materials were selected were ready availability at a low price, chemical inertness and the physical properties of boiling point range and high heat of evaporation. The thermal insulating qualities are also of importance in certain applications.
4.4.1 CFC'S
The first compounds used as auxilliary blowing agents were chlorofluorohydrocarbons (CFC's). These were readily available in a range of molecular weights and boiling points and were chemically inert during the reaction. Furthermore, CFC's were quite economical to use. The most used members of this group were CFC-11 (CFC13) or CFC-12 (CF2C1 1. These materials have now been largely been replaced 8 y methylene chloride ( CH2C12 1.
4.4.2 CH2C12
Methylene chloride as a blowing agent has been widely accepted for environmental as well as economical reasons.
6
The production is not included in the Montreal protocol nor do the emission regulations which affect CFC include the use of CH2C12. As a CFC substitute it meets the physical requirements and the price is about two-thirds that of CFC.
Whenever a new material is introduced into a well established, mature industry some disruptions of the long standing methods are to be expected. There may be capital expenditure for special storage, handling, or equipment requirements. There is also the human factor of training or retraining personnel and even of customers who for some reason or other may see the new product as inferior. A l s o production parameters like flow rate and temperature must be optimized for the new materials and the effects on the process and product. Before introducing a new parameter into a plant process it is not always possible to predict the exact effect of the change on economics or the critical properties of the final product (appearance, density, strength, resilience) as these may be plant, or even machine specific. Moreover, methylene chloride is not without safety concerns as it is a suspected carcinogen.
4.5 EFFECT ON NORTH CAROLINA PUF INDUSTRY
Polyurethane foam is used in many applications, but one of greatest commercial impact to the economy of the state of North Carolina is by use in the furniture industry. It has long been used for the cushioning in upholstered furniture, in bedding, and similar applications.
With the rest of the PUF industry, North Carolina manufacturers, until a few years ago, used predominantly CFC-11 (also sold under the name Fluon 11, and a variety of other trade names) a s the auxilliary blowing agent. This material was described as very "forgiving" because it tolerated significant deviations from optimum plant conditions without causing serious production problems or waste foam. For this reason it was also easy to train new plant operators and waste foam output could be held to a minimum.
Because of environmental regulations most of the North Carolina PUF manufacturing plants tried to change from CFC-11 to C H 2 C 1 2 , although some were unable to do so for plant-specific reasons. They all reported some problems at the time of the change over and all agreed that new operators now need longer training and tend to produce more waste before they become skilled. Even from experienced operators greater vigilance is required to prevent inferior or waste foam from being produced during the runs.
With the newer requlations now contemplated for methylene chloride, future reduction and replacements are being investigated - mainly by the suppliers of CH2C12.
7
Their solutions are predominantly in the direction of alternate chemicals rather than a drastic reduction of the use of auxilliary blowing agents by a recycling process.
4.6 OPTIONS FOR SOLVING THE PROBLEM
Possibilities that have been suggested as offering a solution to reduce the undesirable emissions have been of three kinds: hydrocarbon compounds, less stable CFC's, and entrapment. Each has some advantages and some drawbacks.
4.6.1 Hydrocarbon Substitutes
One option is using substitute hydrocarbons like pentane or butane as examples. Hydrocarbons are available with a wide range of molecular weights and boiling points that could be tailored to the plant requirements. These are reasonably inexpensive and are considered to be no threat to the ozone layer. However, there are various other potential hazards. These compounds (in the range of interest to the PUF manufacturer) are very flammable. In conjunction with the exothermic nature of the process, any minor mishap with the reaction may present a major fire hazard. The blowing process would need much greater additional control. The disposal of the waste hydrocarbons normally involves burning and may entail additional capital expenditure.
4.6.2 Halogenated Substitutes
Dupont and Pennwalt have both developed alternative CFC blowing agents containing more hydrogen and less chlorine than the traditional CFC-11 or CFC-12. Because these are also more chemically reactive, breakdown up in the lower atmosphere is expected, thus greatly reducing the effect on the ozone depletion. Substitutes will also be subject to regulation by the Montreal Protocol and the EPA regulations and may be controlled in a way similar to CFC-11 and CFC-12.
These new blowing agents will be at least twice the price of CFC-12 but the lower molecular weight indicates a reduction in the amount of blowing agent required. For that same reason there may also be diffusion out of the foam more rapidly, which will impact plant adjustments and may affect foam properties. One of these lower atomic weight materials is CFC-22 (CHC1F2). In one study CFC-22 was found to decompose in the lower atmosphere, leading to a twenty fold reduction in ozone depletion.
4 . 6 . 3 Entrapment
The idea of trapping the unreacted blowing agent has many attractive aspects. This is the central premise of this investigation.
a
The PUF process does not change the chemical nature of the HHC which are only used to expand the foam by vaporization. Thus, by merely reversing this process and cooling the effluent gases to below the boiling point of the blowing agents, one might anticipate that recovery should be comparatively easy. However, this facile view does not represent the true situation in the PUF manufacturing process.
The two major obstacles in the manufacturing process to this course of action are ( 1 ) the contamination of the effluent gases with the highly toxic TDI and ( 2 ) the very high dilution of the emitted gases with air. TDI, one of the chemical reactants in foam production, is a highly toxic, volatile, material. In the plant it is kept at safe concentrations by using very effective ventilation throughout the areas where it is evolved. The large air masses used, reduce not only the concentration of TDI but also all the other products emitted from the reaction - which includes the halogenated hydrocarbons.
4.6.4 Recycling - the Solution
The ideal solution is not only to stop the damaging emissions from leaving the plant area but also to achieve this so that chemicals can be processed and re-used. This would not only avoid polluting the atmosphere but reduce the amount of raw material needed and thus positively affect economies in running a plant. The ultimate goal is to efficiently collect and recycle the unreactive, auxilliary blowing agent.
Our basic premise is that it is easiest to collect a gas before it becomes diluted. This approach is not new and as the manufacturers of foaming machines became aware of the present day regulatory trends, so they have in part addressed this problem. Some new, fully enclosed systems are being put on the market. Most of this development is coming from Europe (where also most of the traditional machines originated). Such changes would certainly involve major capital expenditures and/or total replanning of plant operations.
In an industry where profit margins are slim and typical workdays involve 4 hours of output, there is a very understandable reluctance to make major changes in such a direction. Many of the smaller or less efficient plants would have to close under such constraints. Taking a very hard look at the total industry, which has significant overcapacity, this might bring about the sort of shake out and redu’ction in manufacturing capacity that might give the surviving industry a healthier footing.
9

4.7 CONTRIBUTIONS OF THE PRESENT STUDY
There may be less drastic solutions than a major equipment reorganization of the PUF manufacturing industry and all promising possibilities should be pursued to the limit. It is the improvement of the present process with economically viable solutions that is the primary goal of this investigation.
This study is being carried out under a grant from the North Carolina Board of Science and Technology and the Pollution Prevention Pays Program of NRCD. The research is specifically aimed at the North Carolina PUF manufacturing industry i.e. soft, flexible foams produced for furniture and bedding. Any general principles discovered or conclusions reached are also likely to affect a wider range of PUF manufacturing situations.
The primary aim was to generate information to better understand the various stages involved in the full scale process. Ideally, the process should be studied in the actual plant environment, but this had to be ruled out for the early stages as it would inevitably have caused disruptions to the production line. During the whole investigation laboratory conditions were kept similar to plant conditions and close contacts were maintained with production personnel in several North Carolina foam producers to learn from their plant background and extensive experience.
The laboratory experiments were designed to gain better insight into the processes occurring in the foaming tunnel and curing area of the plant. The steady state process of the plant was replaced by a batch process in this study. The events which take place as the foam travels down the tunnel are simulated in the laboratory-produced foam as a travel time. While the smaller scale introduced some limitations, it became clear that similar events occurred in the plant situations and the essential process was unchanged. Somewhat surprisingly this study brought to light some facts that appeared to have remained hidden in the larger, but less accessible, plant process.
In order to concentrate the research effort, it was decided to investigate only one type of foam and one type of auxilliary blowing agent. A formulation for a foam which could be considered as "typical" or "standard" upholstery foam with good (better grade) performance characteristics was selected. Since the majority of foam manufacturers had changed to CH2C1 as the predominant auxilliary blowing agent, it was declde3 to concentrate on this material.
10
5.0 FLEXIBLE POLYURETHANE PROCESS AND EXPERIMENTS
5.1 The Chemical Equations
The chemistry of polyurethane foam formation can be reduced to four major reactions. In the simplest and most general form there are three separate, concurrent, and competing processes:
( 1 ) primary foaming (blowing) reaction between water and TDI to produce C02 gas
(2) primary chain forming (polymerizing) reaction between polyol and TDI to produce the foam network
( 3 ) secondary crosslinking reactions of the polymer products from the above and TDI to strengthen the network produced in (2)
The chemistry of foam formation can be given in the simplest terms by the following reactions:
( 1 ) Gas Formation, Foaming:
R-N=C=O + H-0-H = R-NH2 + C02 (amine + C02) immediately followed by:
R-N=C=O + H2N-R" = R-NH-CO-NH-R" (urea 1
( 2 Chain Formation:
R-N=C=O + H-0-R' = R-NH-CO-0-R' (urethane)
( 3 ) Crosslink Formation:
R-N=C=O + RI-NH-CO-NH-R" = R-NH-CO-NR1-CO-NH-R" (biuret)
R-N=C=O + R1-NH-CO-O-Rtl = R-NH-CO-NR1-CO-O-R1' (allophanate)
where R, R1 and R" are the portions of the molecule attached to the reactive end groups. The actual configuration of the R, R' and R" will vary with the completeness of the various competing reactions.
These reactions all involve TDI and all are exothermic and reversible. The fastest and most exothermic are the reactions with primary OH- i.e. with water and with part of the polyol. The water reaction becomes essentially irreversible as soon as the foam cells open allowing the escape of the reaction product, C02. For this reason all of the available water is rapidly used as the C02 gas is generated.
11
The auxilliary foaming process involves no chemical reactions, but is merely a change of state for the methylene chloride, fluorochloro-hydrocarbon or other agent used. The volatilization from liquid to gas coincides with evolution of C02 and the polymerization to provide a positive increase in foam cell size and number. The increase in cells which eventually open produces the low density desired for foam product use. The heat of evaporation for the auxilliary blowing agent is an important contribution to decreasing the temperature of the foaming mass of polyurethane.
5.2 STAGES IN THE FOAMING PROCESS
The sequence of events in the foaming process as described in the literature or as explained by technical personnel in PUF foam manufacturing plants is typically as follows: As the ingredients are mixed together, the CO gas is at first generated in the liquid phase as very 2inely dispersed gas bubbles. While still too small to observe as individual bubbles, these appear as white coloration of the liquid. This is referred to as creaming and the time when it is first observed as the cream time. Further gas evolution causes a rapid increase in volume of the system and considerable generation of heat. This leads to the vaporization and finally to the boiling of the auxilliary blowing agent (methylene chloride). As the bubbles increase in number and size, the space between bubbles decreases, continuing until a 3-dimensional network is formed. The foam consists of gas filled cells with very thin membrane faces. At the common edges of these cells are thicker struts which will eventually be the sole support network of the foam.
With correctly adjusted foaming conditions the thin membranes break and drain to the remaining cell struts at the moment when the polymer network has just reached sufficient strength to support the polymer weight. This is the "blow off" event. The foam at this point becomes open-celled, the volatiles which had been under excess pressure escape and little increase of foam volume occurs. The chemical reactions will continue for some time with additional heat generation. These reactions involve the formation of additional volatiles and, more importantly, the crosslinks which are essential to the strength and resilience needed for a satisfactorily performing foam.
5.3 STOICHIOMETRIC RELATIONS
For calculations involving the amount of volatiles generated in a given formulation, it is necessary to know the basic molecular parameters of only four chemical species. For the primary foaming reaction:
12
TDI + HOH - CO, + urea -
Equivalent weights: 174 18 44
The auxilliary foaming agent, C H 2 C 1 2 , has a molecular weight of 8 5 .
5 . 4 STANDARD FORMULATION
A formulation for a "typical" polyurethane foam (of a type frequently used in furniture upholstery) was obtained from a PUF plant. It was designed to produce a foam designated as Type A-21. In this terminology "A" represents a foam density of 1 . 0 to 1 . 1 lb/cu ft and "21 'I a resilience (or firmness) given by the indentation load deflection (ILD) of 21 lb - the force required to compress a 4" thick slab to 3 " . The actual density achieved on the laboratory scale was somewhat higher ( 1 . 1 to 1 . 2 lb/cu ft) - a trend well recognized by manufacturing plant personnel when performing similar laboratory batch studies.
The ingredients and formulation for the lab mixes were supplied by the same plant and comparison tests were carried out to check the reproducibility between the two locations. After some initial trials to optimize the amounts of stannous octoate catalyst and silicone needed for our laboratory conditions, a final standard formulation was established. It is given in Table 1 .
From the stoichiometry of the ingredients utilized for the standard foam production, the losses of C 0 2 and methylene chloride can be calculated. As shown in Table 2 the total mass of ingredients for each laboratory pouring is 4 2 3 . 7 1 g of which 1 0 g is water which will yield 2 4 . 4 4 g (or 0 . 5 5 6 moles) of C 0 2 . The mix also contains 30 g (or 0 . 3 3 5 moles) of auxilliary blowing agent. These two ingredients yield 5 4 . 4 4 g ( 0 . 8 9 1 moles) of total volatiles. A very small amount of amine catalyst may also be lost during the reaction. Some of the relevant weights and percentages are shown in Table 2 .
6.0 LABORATORY FOAM PREPARATION
6.1 FOAM MIXTURE PREPARATION
The components of the formulations are all in the liquid state. Because of the toxic nature of some of the materials all operations were carried out in a well ventilated fume hood. The ingredients were weighed in tared beakers or syringes. The polyol was weighed out in the tared mixing vessel and the fixed portions of water and methylene chloride were added and mixing was started. To reduce the time needed to transfer the mixture to the mold, the procedure adopted was to hold the mixing vessel in one hand, while adding the ingredients, operating the stirrer, and starting the timer with the other hand.
13
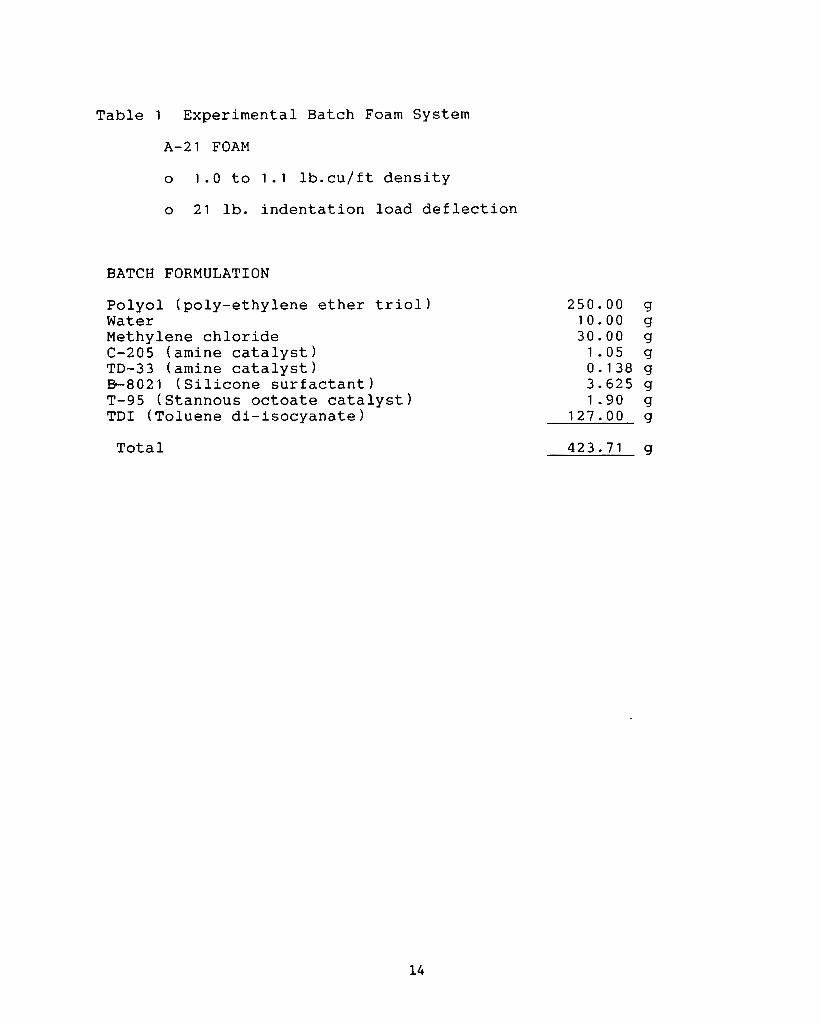
Table 1 Experimental Batch Foam System
A-21 FOAM
o 1.0 to 1 . 1 lb.cu/ft density
o 21 lb. indentation load deflection
BATCH FORMULATION
Polyol (poly-ethylene ether triol) Water Methylene chloride C-205 (amine catalyst) TD-33 (amine catalyst) B-8021 (Silicone surfactant) T-95 (Stannous octoate catalyst) TDI (Toluene di-isocyanate)
250.00 g 10.00 g 30.00 g 1.05 g 0.138 g 3.625 g 1.90 g
127.00 g
Total
14
423.71 g
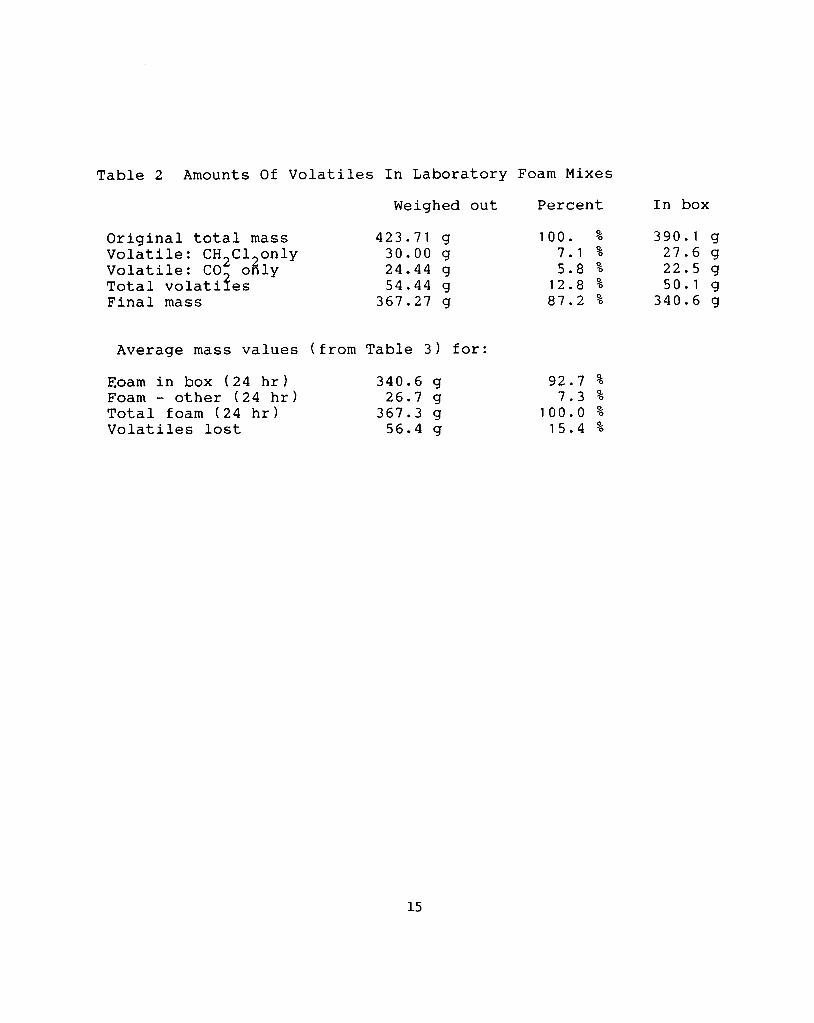
Table 2 Amounts Of Volatiles In Laboratory Foam Mixes
Weighed out Percent In box
Original total mass 423.71 g 100. % 390.1 g Volatile: CH2C120nly 30.00 g 7.1 % 27.6 g Volatile: CO only 24.44 g 5.8 % 22.5 g Total volatifes 54.44 g 12.8 % 50.1 g Final mass 367.27 g 87.2 % 340.6 g
Average mass values (from Table 3) for:
Foam in box (24 hr) 340.6 g 92.7 % Foam - other (24 hr) 26.7 g 7.3 % Total foam (24 hr) 367.3 g 100.0 % Volatiles lost 56.4 g 15.4 %
15
The ingredients were added to the mixture in the order listed in Table 1 while keeping the mixture vigorously stirred for about 1 5 to 20 seconds. The timer was started at the beginning of the addition of the TDI. Stirring of the mixture was then continued for another 12 to 16 seconds when the stirrer was stopped and the foaming, rapidly expanding liquid was quickly transferred to the foam mold. Creaming occurred during stirring. Typically, pouring was complete when the timer indicated 3 0 to 45 seconds, i.e. at t = 0.5 to t = 0.75 minutes (in the later tables all times will be given in minutes).
6.2 PREPARATION OF THE FOAM MOLDS
The foam is molded in 12"x12" cardboard cake boxes with 6" high sides. The boxes are originally unfolded and have the normal, brown appearance of cardboard on one side, while the other is white and has a thin surface coating of some polymeric fi.lm. The boxes were folded so that the smooth, polymer-coated side was facing inside towards the foam. Observations during the unmolding of the foam (described below) showed that some materials of the foam mix penetrated the polymeric film and into the boxes. This raised some doubts about the exact amount and composition of the original mix poured into the mold which actually took part in the reaction and remained in the foam taken out of the mold.
Another early concern was the difference in environment of the side and bottom surfaces in the laboratory- and plant-produced foams. In the plant the sides and bottom of the foam path are lined with polyethylene film (which is peeled off when the foam has set). A similar surface for the laboratory foaming box seemed an appropriate reason to use a liner. Laboratory foams, produced after the initial trials, were poured into molds lined with thin ( 0 . 0 0 2 polyethylene film. Thus, no materials were lost into the mold walls and all of the original mix poured into the mold was available to take part in the foaming reaction. After changing the procedure to line the boxes with polyethylene film it was noticed that an additional bonus with this new technique was the greatly facilitated unmolding of the foam. Only the very early runs were carried out in these unlined boxes and uninsulated molds. The majority of the mass loss versus time experiments were carried out in lined, insulated molds.
16
6.3 FOAM POURING
The prepared molds were placed on a balance and tared. The ingredients were then weighed out and added in the correct order to the mixing vessel. After completing the mixing, the foam was poured into the center of the box by quickly inverting the mixing vessel. Since the reactions in the box and in the mixing vessel progressed at different rates, and skins were being formed on exposed surfaces, no attempt was made to shake the last drops out of the mixing vessel. Such a procedure had been shown to produce uneven, streaky foam samples. Pouring a completely mixed and foaming mixture on to a solid surface is similar to the mixing head used in plants which discharge from a header on to the flat conveyor system.
As soon as the foam was poured, and while the balance was coming to a steady reading, the tared mixing container, tared drip tray (stationed under the stirrer) and tared stirrer were placed on a second balance to determine the mass loss of this l'other" foam. Mass readings were taken at intervals up to about 24 hr. The sum of the mass of this "other" foam and the mass in the mold was used for mass balance calculations relating to the final, set foam.
6.4 FOAM UNMOLDING
With unlined boxes the unmolding operation required some considerable force to separate the foam from the mold. A separation eventually occurred in the foam. The sides and bottom of the box were discolored from the material that had penetrated the polymeric lining and into the cardboard. With a normally unmolded foam, the box was 1 0 to 12 g heavier after unmolding than before the experiment started. Some of this mass (about 2 g) could be scraped off but most of it had penetrated into the sides and bottom of the box.
One test was carried out using waxed paper as a barrier between the foam and the mold, but although only minimal foam mix escaped to touch the mold; it was noted that the foam adjacent to the mold had partially collapsed. Consultation with a plant supervisor confirmed that similar effects had been noted in the plant (years previous to these tests) when similar paper was tried.
After some trial and error, a technique was perfected for lining the boxes with thin polyethylene film similar to, but thinner than, the film used in -the full scale plant. It had to be carefully placed and attached to the sides without introducing creases or folds in the film, so that the final foam came out in the rectangular shape of the box. If folding had occurred, the film tended to penetrate into the foam mass and thus reducing the volume of l'goodll foam available for density and other measurements.
17
After the introduction of the lining film, the unmolding of the set foam was very easy. The box showed no signs of contamination and the film came away from the foam quite easily and quite cleanly. The box and lining could have been used again, but normally were not, as it served as a convenient container to store the foam samples.
6.5 MASS BALANCE ON FOAM EXPERIMENTS
The total mass of the original ingredients is known, but the chemical reactions are so rapid that some mass loss occurs before the foam can be poured and be in place on the balance. Hence, the best way of obtaining a mass balance of this reaction is to use the total, final, set foam mass. This total mass is the sum of foam in the mold, the foam remaining in the mixing vessel, and a small adjustment for the foam remaining attached to the stirrer. Subtracting this final total from the original mass of the ingredients gives the total mass of volatiles lost in the reaction.
The total of the mass of the cured foam (age 2 4 hrs) in the box and in the mixing vessel were determined for each pouring. A constant mass of 2 g was added as the adjustment for foam left on the stirrer. This value (less than 0.5% of the total) had been determined for only a few tests, but gave very consistent results. Table 3 shows the collected data of the amounts of foam in the box, mixing vessel, and the volatiles calculated from these values. It shows good reproducibility of the percentage foam transferred to the box for each pouring: on average 92 to 93% of the original ingredients were transferred to the foam mold.
With regard to the total amount accounted for: the experiments showed a final ( 2 4 hr) mass of 367.3 g versus the theoretically calculated mass of 369.3 q for completion of the reaction. This small lost excess of experimental over calculated values was somewhat unexpected. It is larger than the experimental error or any reasonable estimate of atmospheric moisture accidentally introduced with the ingredients or adsorbed on the walls of the vessels - and at this stage remains unexplained.
18
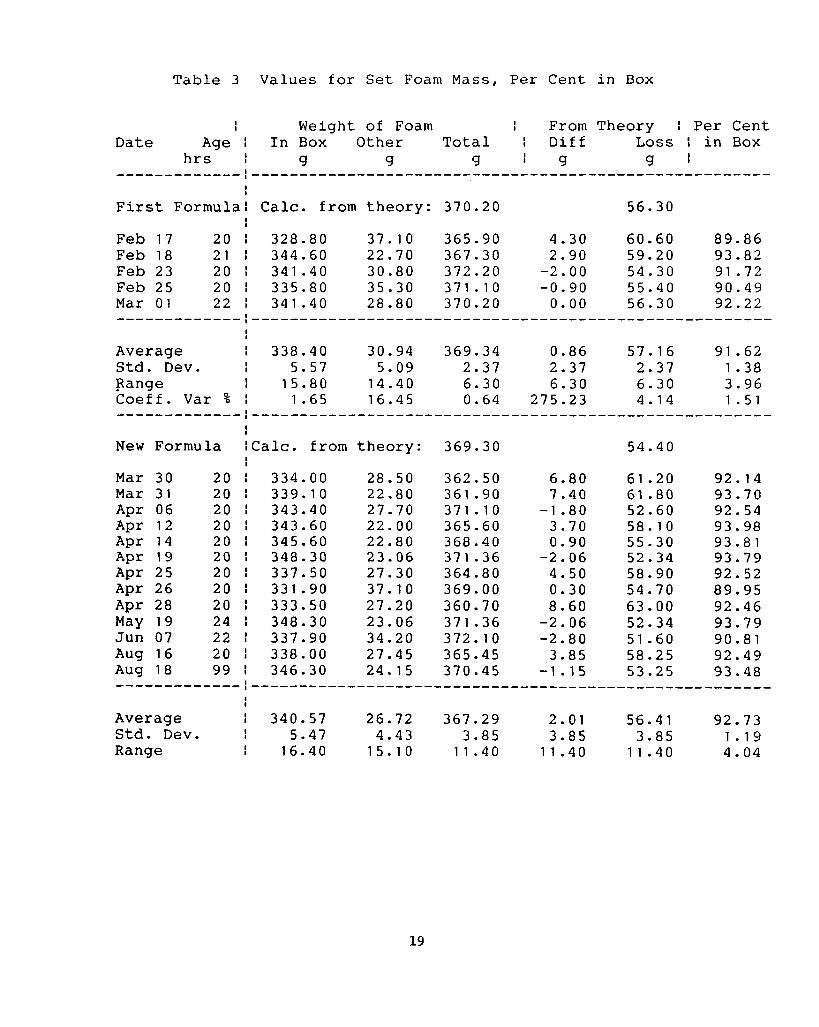
Table 3 V a l u e s fo r Set Foam Mass, P e r C e n t i n Box
I Weight of Foam I From Date Age I I n Box Other Total I D i f f
""""""-I""""""""""""""""-"
F i r s t F o r m u l a ! Calc. from t h e o r y : 370 .20
F e b 17 20 I 328 .80 37 .10 365 .90 4 .30 F e b 18 21 I 344 .60 2 2 . 7 0 3 6 7 . 3 0 2 .90 F e b 2 3 2 0 I 3 4 1 . 4 0 3 0 . 8 0 372 .20 - 2 . 0 0 F e b 25 20 I 335 .80 3 5 . 3 0 371 .10 -0 .90 Mar 01 22 I 341.40 28 .80 3 7 0 . 2 0 0 .00
h r s I 9 9 9 I 9
1
I
Theory I P e r C e n t Loss I i n Box g I """"""-"""
56 .30
60 .60 8 9 . 8 6 59 .20 9 3 . 8 2 54 .30 91 .72 55 .40 9 0 . 4 9 5 6 . 3 0 9 2 . 2 2
""""""~~"""""""-"""""""-""""""""""""
Average I 338 .40 30 .94 369 .34 0 .86 57 .16 91 .62 S t d . Dev. 5.57 5 .09 2 .37 2 .37 2 .37 1 .38 Range I 15 .80 14 .40 6 .30 6 .30 6 .30 3 .96 Coeff . Var % I 1 .65 16 .45 0 .64 275 .23 4 .14 1 .51 """"""-I"""""""""""""""""""""""""""
New Formula ICalc. from t h e o r y : 369 .30 54 .40
Mar 3 0 2 0 I 334 .00 28 .50 362 .50 6 .80 61 .20 92 .14 Mar 31 20 I 339 .10 22 .80 361.90 7 . 4 0 61 .80 9 3 . 7 0 Apr 0 6 2 0 I 3 4 3 . 4 0 27 .70 3 7 1 . 1 0 -1 .80 52 .60 9 2 . 5 4 Apr 12 20 I 343 .60 2 2 . 0 0 365.60 3 . 7 0 5 8 . 1 0 9 3 . 9 8 A p r 1 4 2 0 I 345.60 22 .80 368 .40 0 .90 55 .30 93 .81 Apr 1 9 2 0 I 3 4 8 . 3 0 23 .06 371 .36 -2 .06 52 .34 9 3 . 7 9 Apr 2 5 2 0 I 337 .50 2 7 . 3 0 364 .80 4 .50 58 .90 9 2 . 5 2 Apr 2 6 2 0 I 331 .90 37 .10 369 .00 0 .30 54 .70 8 9 . 9 5 Apr 2 8 2 0 I 333.50 27 .20 360 .70 8.60 6 3 . 0 0 9 2 . 4 6 May 19 24 I 348 .30 2 3 . 0 6 371 .36 -2 .06 52 .34 9 3 . 7 9 J u n 0 7 2 2 I 337 .90 34 .20 372 .10 -2 .80 51 .60 90 .81 Aug 1 6 2 0 I 338 .00 27 .45 365.45 3 .85 58 .25 9 2 . 4 9 Aug 1 8 99 I 346.30 24 .15 370 .45 - 1 . 1 5 5 3 . 2 5 9 3 . 4 8 """"""-I"""""""""""""""""""~"""""""-
Average I 340 .57 26 .72 367 .29 2 .01 56 .41 92 .73 Std. Dev. 5.47 4 .43 3 .85 3 .85 3 .85 1.19 Range I 16 .40 15 .10 11 .40 11 .40 11 .40 4 .04
I
I
I
I
I
I
19
7.0 TYPES OF MEASUREMENTS AND OBSERVATIONS
The exact measuring procedures after pouring depended on the nature of the experiments being conducted. Observations were both qualitative (visual, tactile, etc) and quantitative (time dependence, mass and temperature changes, density and absorption determinations, etc). The observations began as soon as mixing was started and were continued at intervals of up to about 2 4 hrs. The final, unmolded foam was inspected, the outsides trimmed off with a saw, and the density determined - as a rough guide as to whether the foaming process had proceeded satisfactorily.
8.0 QUALITATIVE OBSERVATIONS DURING FOAMING
Under normal conditions "cream time" (formation of miFroscopic bubbles as the mixture turns very white) occurs towards the end of mixing (about 8 seconds in the plant where this stage can be very clearly observed). In the laboratory studies the cream time was at about 5-7 seconds as estimated from the change of sound in the mixing vessel. The expansion of the foam mass starts prior to pouring, and "blow-off" (the visible escape of gases through the top of the foam) occurs between t=2.5 and t=3.0 min. At the time of blow-off a well formulated foam has risen to a maximum height (volume) and has just set (changed from the liquid to the gel state).
20
8 . 1 FOAM SURFACES
After set the foam is quite easily deformable, but it will not flow. The newly formed foam is very weak and friable and, if forces are applied at this stage, can break and form internal weak regions or even tear and form cavities. As it sets, the foam top surface starts to form a skin which, even after the set will reform when disturbed or removed. The skin remains quite tacky for a considerably longer period than the center of the foam. This top skin, when removed from the fully cured foam is very tough and has a high resistance to gas permeation. The total top skin weight of it depends on the pouring condition but typically weighed 40 to 5 0 g per sample.
The sides and bottom of the unmolded foam also had an outside layer different from the body of the foam, although the term skin is not very descriptive. The differences observed between lined and unlined boxes has already been described in se'ction 6.4. In the unlined molds this skin was actually inside the cardboard of the box and could not be observed. With the lined boxes a very thin skin is visible on unmolding. It could easily be peeled from the body of the foam and was approximately one foam cell diameter in thickness. One sample had this skin removed and it weighed approximately 9.5 g. It is interesting to note that this is approximately the increase in mass of the unlined box and suggests the equivalent of a one cell thick foam has penetrated into the cardboard and is firmly anchored there.
9.0 MEASUREMENTS AND DISCUSSION OF RESULTS - OPEN SYSTEM
9.1 MASS LOSS VERSUS TIME IN OPEN, UNINSULATED MOLD
For the mass loss as a function of time, the foam mixture was poured into tared molds placed on a balance. The earliest meaningful reading could be taken at t= 40 to t= 50 seconds - the time at which a steady balance reading could be obtained. The time intervals between readings were determined by the rate of mass change of the system. At first, readings were taken at 1 0 second intervals. As the rate gradually decreased, readings were taken less frequently. After 4 hours the rate was reduced to hourly or less frequent readings.
21
.
1
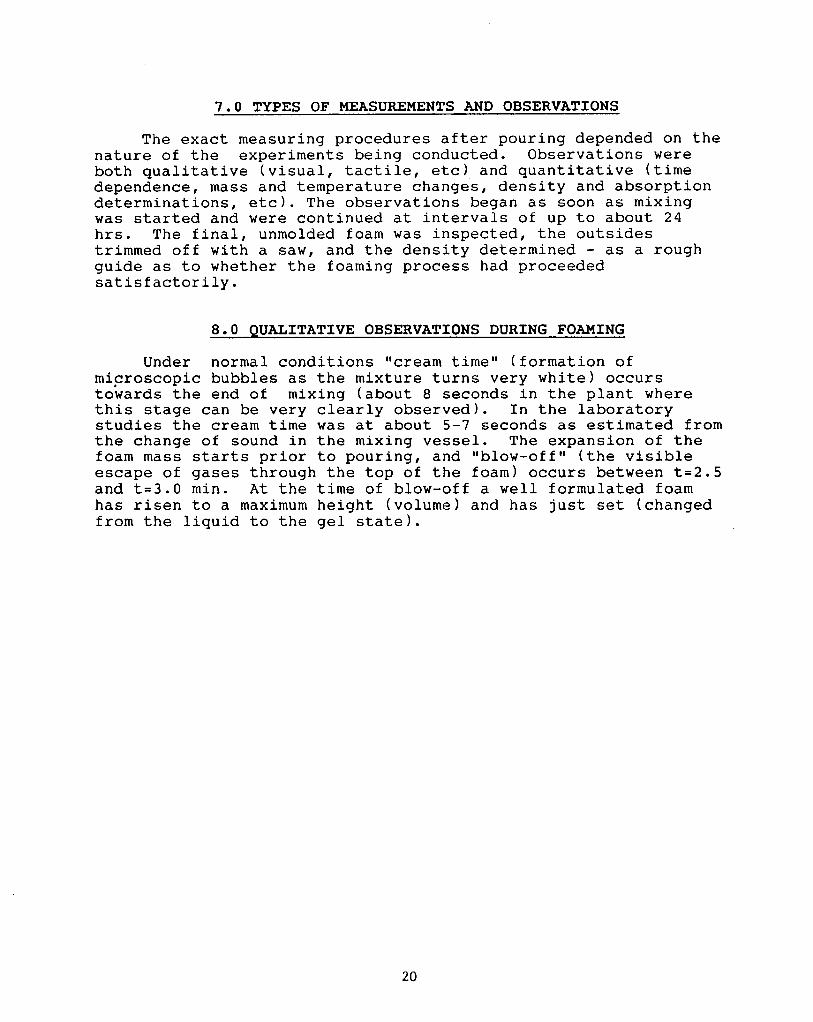
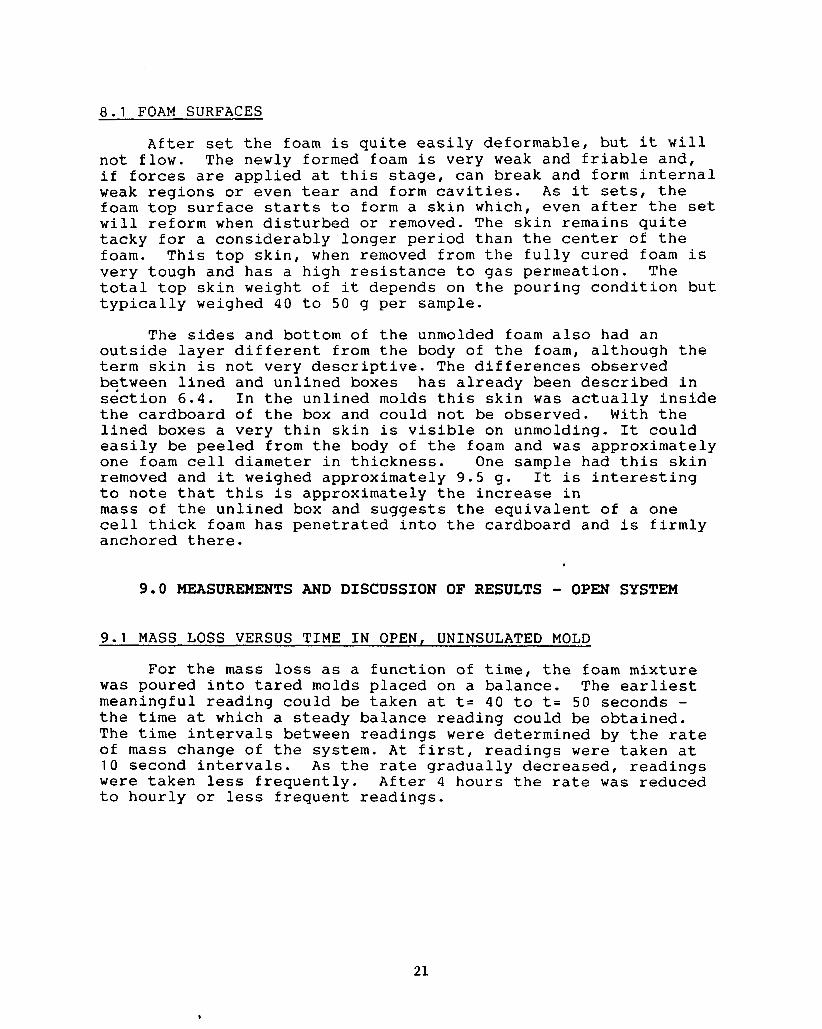
A s the formulations or test conditions were changed over the course of the experiments, small changes in the rate (particularly at early times) were observed. A typical curve showing mass loss with time over the first 1 ,000 minutes, approximately 1 6 hours (after the addition of the TDI to the ingredients) is shown in Figure 1 . The change in mass is more rapid at first than at longer times, hence, this plot is not suitable to show differences in behavior over the whole range of observations. A more useful plot to show the overall behavior - long term as well as the rapid early rise - is the semi-logarithmic plot of mass loss versus time shown in Figure 2.
This semi-logarithmic plot was not based on theoretical arguments but illustrates well the important features of the experimental observations. There are two different regimes of volatile emission represented by two essentially straight lines with different slopes. The slope at earlier times corresponding to the rapid expansion of the foam in the mold, followed by a mdch slower rate after the first few minutes. On this plot the changeover is very clearly defined (by the intersection of the two slopes) and occurs about 1 to 1.5 minutes after the visible blow off and the setting of the foam. The latter time occurred typically between 2 .5 and 3 minutes after the initial TDI addition to the other reactants.
The slopes of the initial period were affected to a small degree by several uncontrolled variables (e.g. temperature of the components, ambient humidity, and operator-caused I
variability). The procedure has to be carried out rapidly and depends considerably on the manual dexterity, speed, and consistency of technique by the operator.
9.2 DISCUSSION OF MASS VERSUS TIME CURVES
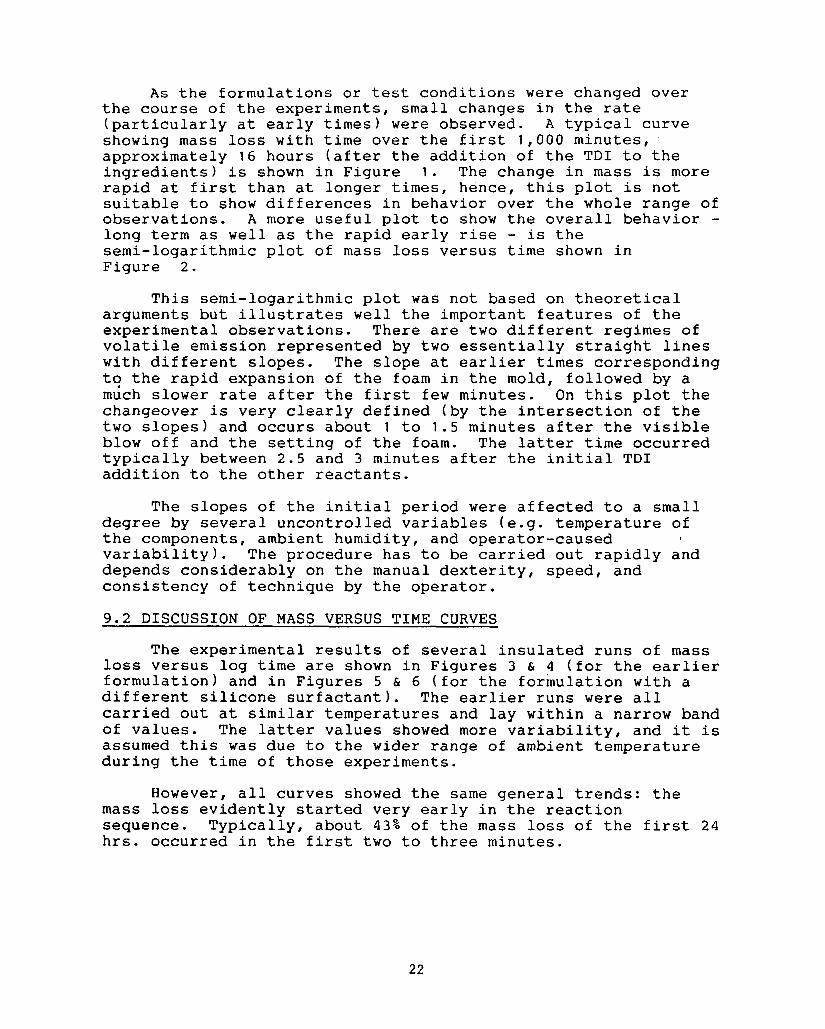
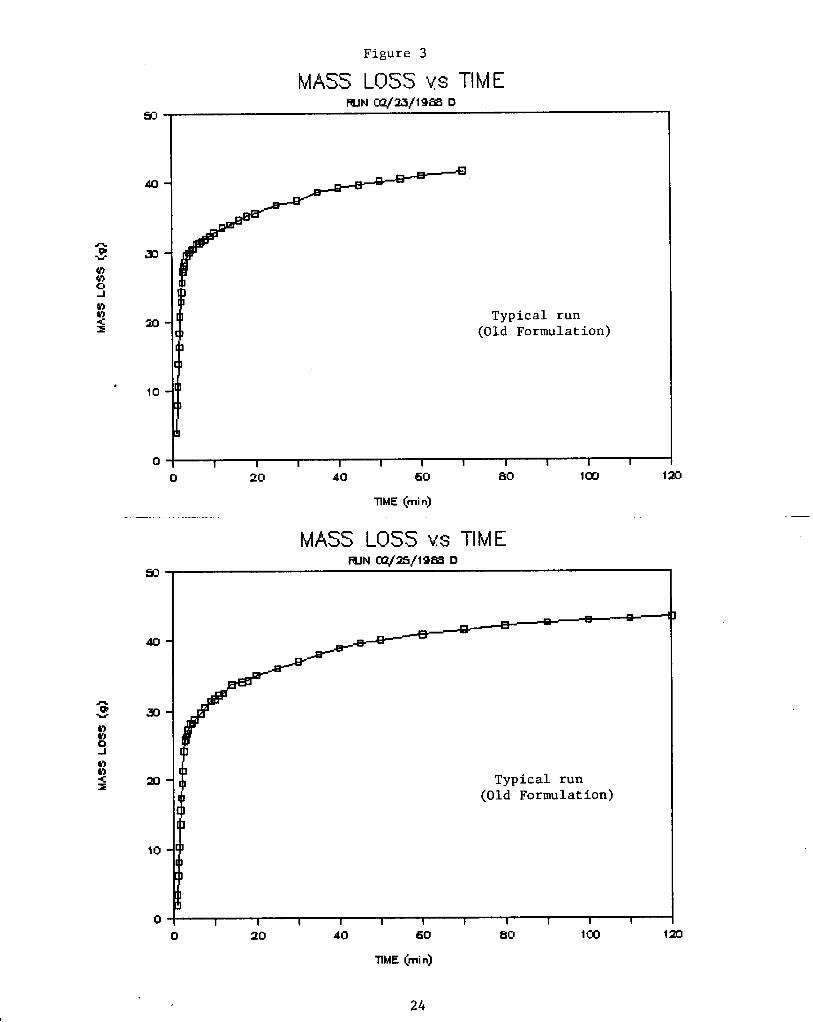
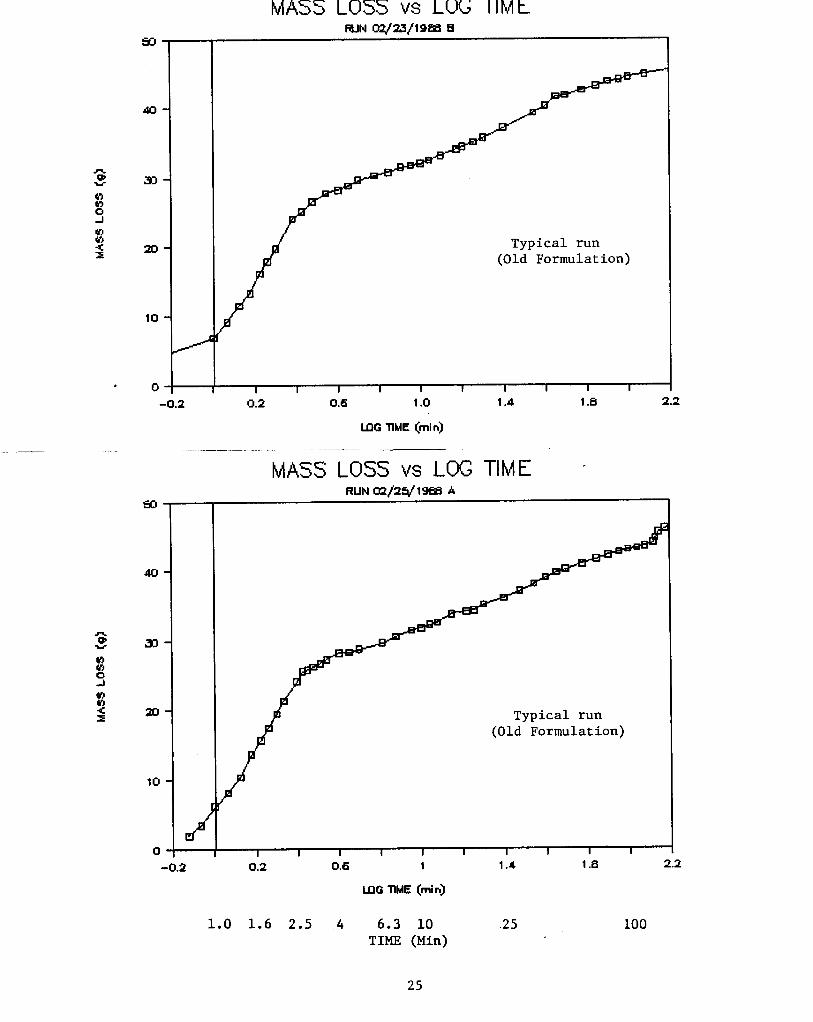
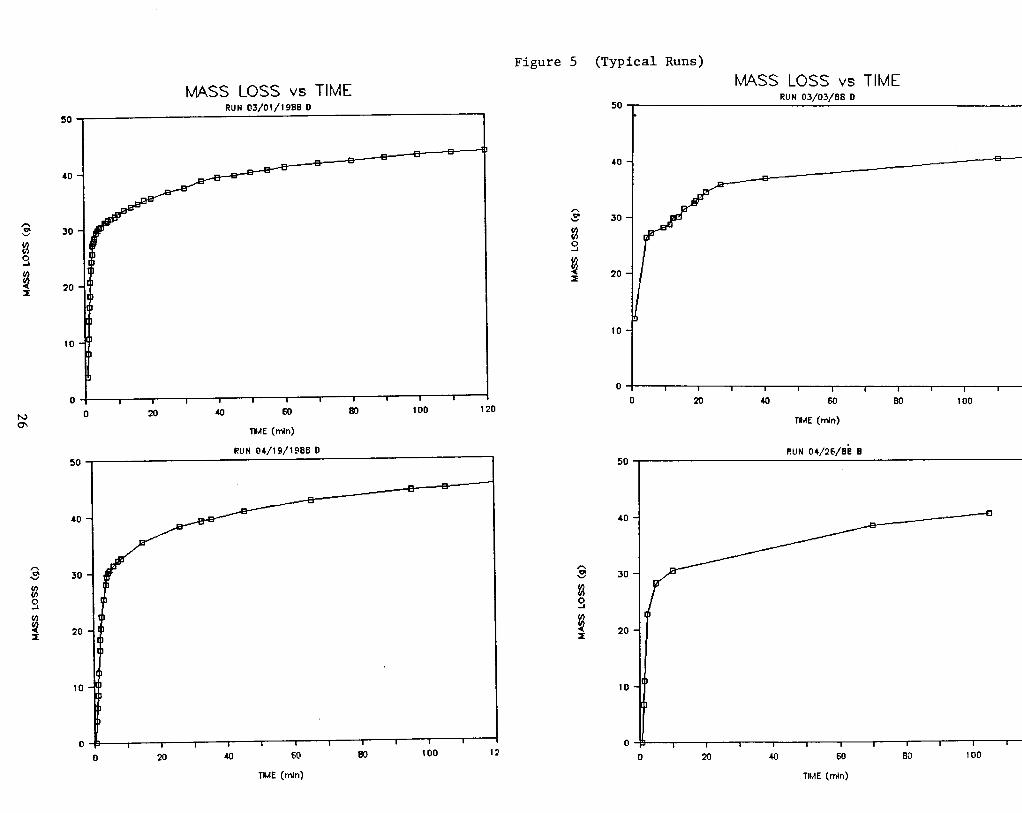
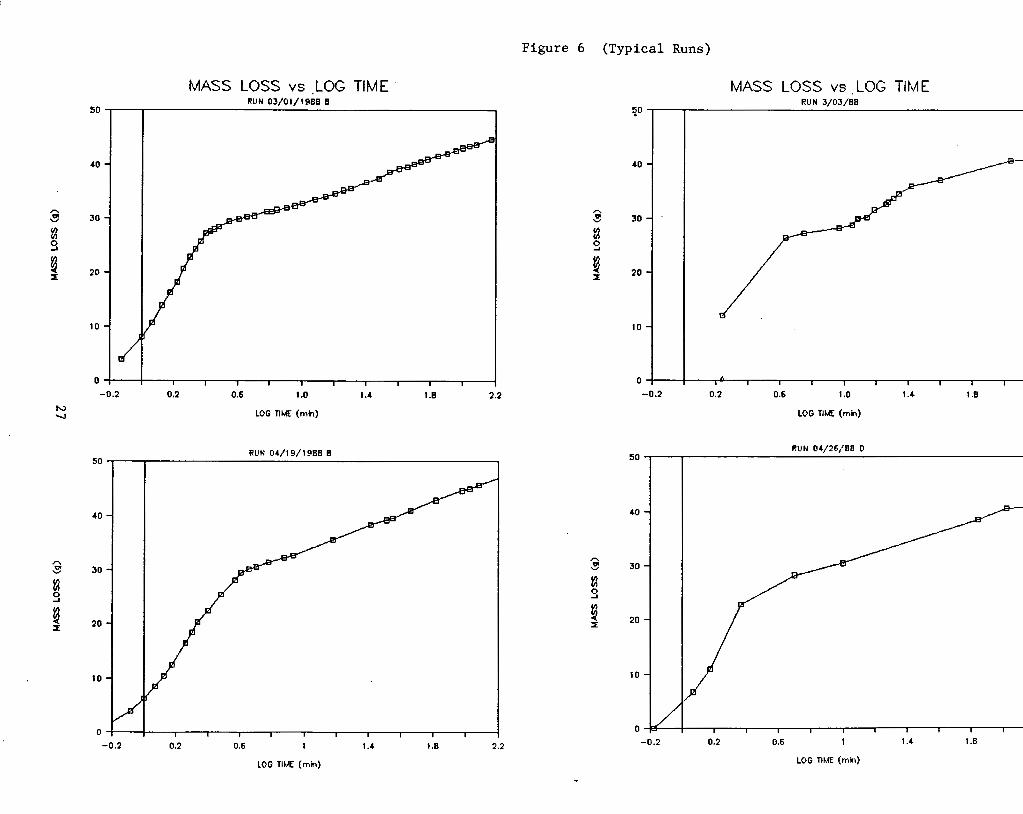
The experimental results of several insulated runs of mass loss versus log time are shown in Figures 3 & 4 (for the earlier formulation) and in Figures 5 & 6 (for the formulation with a different silicone surfactant). The earlier runs were all carried out at similar temperatures and lay within a narrow band of values. The latter values showed more variability, and it is assumed this was due to the wider range of ambient temperature during the time of those experiments.
However, all curves showed the same general trends: the mass loss evidently started very early in the reaction sequence. Typically, about 4 3 % of the mass loss of the first 24 hrs. occurred in the first two to three minutes.
22
40
A P U 30
10
MASS LOSS vs TIME W N Wi1'01/19ErS C
Figure 1
Typica l run
I I I 1 I I I I I I 0.0 0.2 0.4 0.6 0.8 1 .0
TIME (min. tkuwnh)
". .. . __ ~ "" ____ ~- ".
Ea
40
A 0 v 33
43 Y) 4 x #)
10
0 -0.2
MASS LOSS vs LOG TIME WN 03/01 /19= E
Typica l run
0.2 0.6 1 .0 1 . 4 1 . 8 2.2
LOG llME (min)
1.0 1.6 2.5 4 6.3 10 TIME (Min)
.25 100
Figure 2
23
M
40
30
10
0
Figure 3
MASS LOSS YS TIME MJN oa/U/l9Eer D
T y p i c a l run (Old Formulation)
I
I I I I 1 1 I I I I 1
M
40
A P
Y)
0 43 J
Y 30
Y) Y) 4 I m
10
0
MASS LOSS vs TIME MJN WS/l9= D
T y p i c a l run (Old Formulation)
"
I
20 40 60
llME (rnin)
80 1oD 1-20
24
40
10
0
40
A
Y Fp
-0.2
y1 Y) 4 I 20
10
0
Typica l run (Old Formulation)
I I I I I I I I I I
MASS LOSS vs LOG TIME RUN c#/ZEdlw A
Typica l run (Old Formulation)
0.2 0.6 1 1.4 1 .a 2.2
U G TIME (rnin)
1.0 1.6 2.5 4 6.3 10 TIME (Min)
2 5 100
25
0
I?
0
El
A
Y
f W
c
z
0
0
n
0 t
0 n
0
0
El
0
- (a)
so
1 S
SIW
0
n
0
0 t
0 n
0
El
0
- 0
IN
I I
I I
14
..
0
+ 0
r-l 0
N
0
h
I
Y
E
Y s I= 0
\
c.
D? - ?
-
A
-E
.E Y
s 0
'4 0
2 c! 0
27
c! N
D? c
?
c
A
.E .
-E
v
;
0
4 '4
0
c! 0
9
0
I
These observations were unexpected as "conventional wisdom" (statements found in the literature and views of plant personnel we had interviewed) held that the gases produced in the early stages of the reaction were trapped in the foam and responsible for the rapid, initial rise of the closed-cell foam and that "blow-off" (which also corresponds to maximum foam rise and visible emission of volatiles) occurred when the foam changed to an open-celled structure.
The above scenario should produce a slow mass loss at first as only the volatiles generated near the surface and those able to escape by diffusion would leave the system. The maximum rate of mass l o s s would be expected at blow-off time (or soon after) when bulk movement of the volatiles could first occur. This rate would be followed in the later stages of the reaction, with progressively slower, diffusion-controlled mass loss out of the main body of the foam.
As a result of our measurements this view would need revision to account for the most rapid loss of mass and the large amount of the total gas emission occurring during the rapid rise of the foam and before blow-off. The present results showed that a significant reduction in the rate of mass loss occurred soon after blow-off.
9.3 MASS LOSS VERSUS TIME IN A CLOSED VACUUM SYSTEM
An exploratory test was run to determine whether the application of vacuum to the freshly set foam would significantly accelerate the removal of volatiles from the foam. One foam was cast as usual, but after 5 minutes was unmolded, reweighed and transferred (at 8 minutes) to a vacuum oven kept at 1 0 0 C. After 1 hour the sample was withdrawn and again weighed. The mass loss while in the vacuum oven was (within experimental error) the same as would have been had the sample remained in the open and at room temperature.
This result, therefore leads to the conclusion that the transport mechanism applicable after foam set to remove the volatiles is not significantly affected by reducing the external pressure. This result confirmed the theory that the controlling mechanism at this stage is the (slow) diffusion out of the mass of the polymer and not a convective transfer of volatiles through the foam passages. No further exploration using this technique was carried out as it did not yield any significant improvement in the laboratory - and in any case was hardly applicable to plant conditions.
28
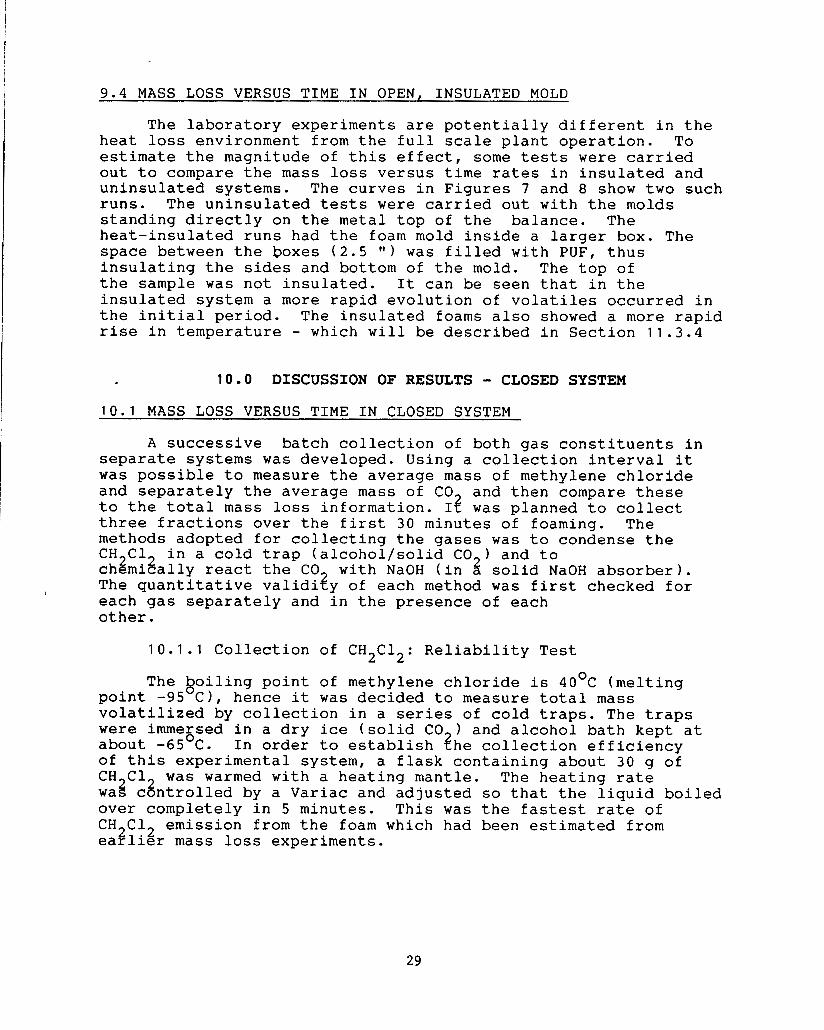
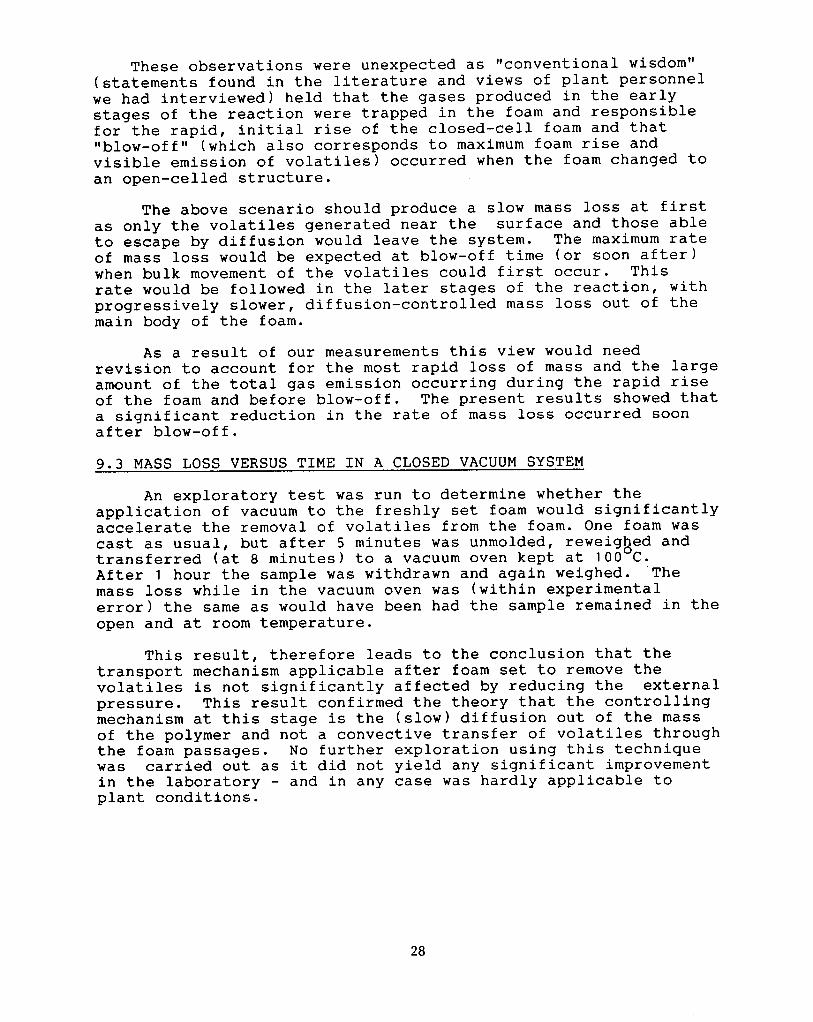
9.4 MASS LOSS VERSUS TIME IN OPEN, INSULATED MOLD
The laboratory experiments are potentially different in the heat loss environment from the full scale plant operation. To estimate the magnitude of this effect, some tests were carried out to compare the mass loss versus time rates in insulated and uninsulated systems. The curves in Figures 7 and 8 show two such runs. The uninsulated tests were carried out with the molds standing directly on the metal top of the balance. The heat-insulated runs had the foam mold inside a larger box. The space between the boxes (2.5 I t ) was filled with PUF, thus insulating the sides and bottom of the mold. The top of the sample was not insulated. It can be seen that in the insulated system a more rapid evolution of volatiles occurred in the initial period. The insulated foams also showed a more rapid rise in temperature - which will be described in Section 11.3.4
10.0 DISCUSSION OF RESULTS - CLOSED SYSTEM 10 .1 MASS LOSS VERSUS TIME IN CLOSED SYSTEM
A successive batch collection of both gas constituents in separate systems was developed. Using a collection interval it was possible to measure the average mass of methylene chloride and separately the average mass of CO and then compare these to the total mass loss information. I$ was planned to collect three fractions over the first 30 minutes of foaming. The methods adopted for collecting the gases was to condense the CH2C12 in a cold trap (alcohol/solid C02) and to chemically react the CO with NaOH (in a solid NaOH absorber). The quantitative validi$y of each method was first checked for each gas separately and in the presence of each other.
10.1.1 Collection of CH2C12: Reliability Test
The Boiling point of methylene chloride is 4OoC (melting point -95 C), hence it was decided to measure total mass volatilized by collection in a series of cold traps. The traps were immegsed in a dry ice (solid CO 1 and alcohol bath kept at about -65 C. In order to establish $he collection efficiency of this experimental system, a flask containing about 30 g of CH C1 was warmed with a heating mantle. The heating rate wag cgntrolled by a Variac and adjusted so that the liquid boiled over completely in 5 minutes. This was the fastest rate of CH C1 emission from the foam which had been estimated from earller mass loss experiments. 2 . 2
29
MASS LOSS vi~s TIME WN 04/18/- y
M M
45
40
33
a0 Noninsulated
15
10
El
o
a0 i t Noninsulated
10 I o f 1 I 1 I I I I I 1 I I
0
10
0
80
.. -
Figure 7
MASS LOSS vs TIME W N C4/35/19lB D
Insu la t ed
1 1
I 1
I I I I I I I I I I I
0 20 40 60
W E (min)
ao 100 l a 0
30
M
45
40
A P Y 33
15
10
5
0 -0.2
.
40
10
0 -0.2
MASS LOSS vs .LOG TIME PJJN 02/18/88 C
Noninsulated
0.2 0.6 1 .0
U3G TIME (min)
1.4 1.8
- z
- 2.2
Figure 8
MASS LOSS vs LOG TIME RUN 02/2ri/lm A
Insulated
0.2 0.6 1
LOG TIME (min)
1.0 1.6 2.5 ..4 6 . 3 10 TIME (Min)
1.4
2 5
1.8
100
31
A stream of dry air was used to transport the CH C 1 2 from the flask and heating mantle to the cold traps. It was found that 3 traps in series plus an additional back-up trap were needed to collect 92% of the mass originally in the flask. The values obtained from the experiments are shown in Table 4. The final run with adjusted flow rates and the standard run in combination with CO collection showed just over 2% unaccounted for. This loss coud arise from two sources: ( 1 1 evaporation of the condensed liquid due to the fast flowing air stream (in the foaming experiments the air flow rates were much slower) or ( 2 ) adsorption of the CH C12 on to the surfaces of the connecting tubes in ?he system. Whatever the cause, this level of agreement was considered adequate in typical variations found in the foaming experiments.
10.1.2 Collection of C02: Reliability Test
The collection of C02 involved the reaction of C02 with NaQH (the main ingredient of Soda Lime and Ascarite - a proprietory variant of the same material). The reaction of NaOH and C02 is quantitative but proceeds with the evolution of water:
c02 + 2NaOH = NaBHCo;I
+ H20 This water is partly absorbed y t e NaOH downstream in
the absorber and partly allowed to escape the absorber. Therefore, arangements were made to trap this free water in drying towers. The increase in mass of the combined absorbers is equal to the mass of CO absorbed. In the actual experiments most of the wager remained in the Soda Lime (Ascarite), but small amounts were carried on to the drying tubes.
To check the quantitative effectiveness of the C02 absorption by NaOH, experiments similar to the ones wlth CH C1 were carried out. A stream of dry air transported th8 C 6 gas given off from a weighed piece of Dry Ice. The C02-cogtaining air stream was passed through an CO -absorber of Soda Lime followed by an H20-absorber of Drierige (a drying agent based on anhydrous CaSOq). The amounts of CO were determined by weighing the assembly of absorbers be?ore and after the test run. The experimental results are recorded in Table 4. The percentages of C02 and CH2C12 recovered were similar.
32
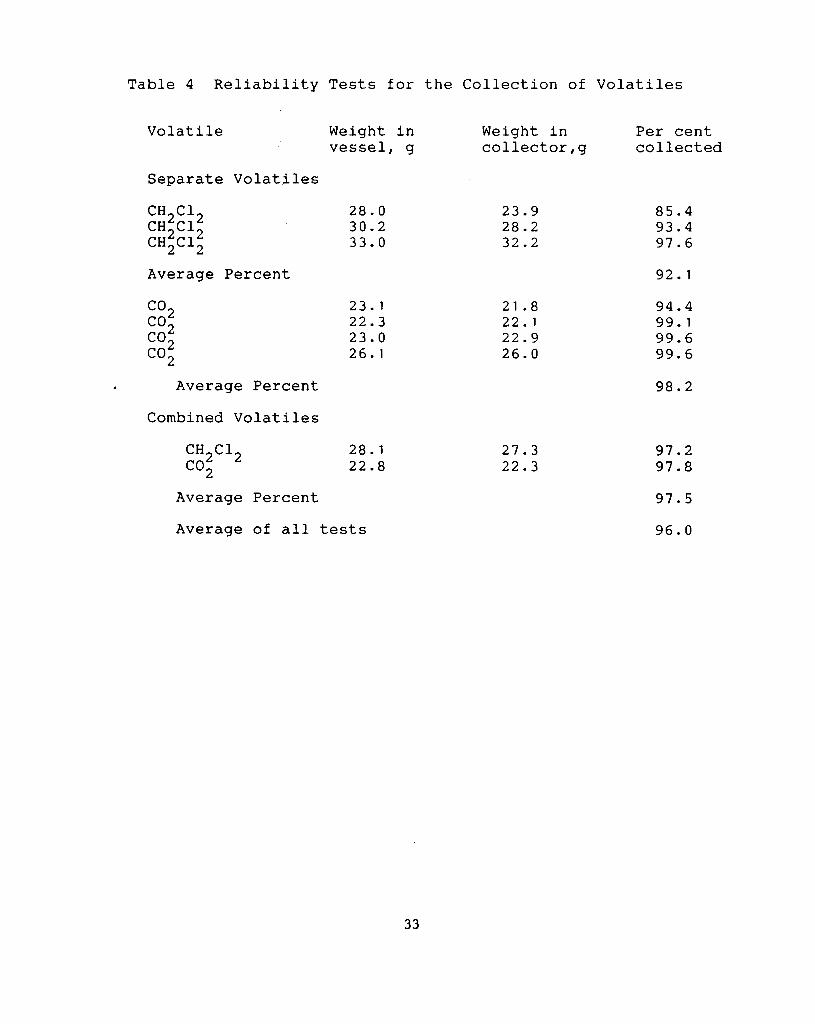
Table 4 Reliability Tests for the Collection of Volatiles
Volatile Weight in vessel, g
Separate Volatiles
C H 2 C 1 2 C H 2 C 1 2 C H 2 C 1 2
Average Percent
Average Percent
Combined Volatiles
C H 2 C 1 2
c02
Average Percent
2 8 . 0 3 0 . 2 3 3 . 0
23 .1 2 2 . 3 2 3 . 0 2 6 . 1
2 8 . 1 2 2 . 8
Average of all tests
Weight in Per cent collector,g collected
2 3 . 9 2 8 . 2 3 2 . 2
2 1 . 8 2 2 . 1 2 2 . 9 2 6 . 0
2 7 . 3 2 2 . 3
8 5 . 4 9 3 . 4 9 7 . 6
92.1
9 4 . 4 9 9 . 1 9 9 . 6 9 9 . 6
9 8 . 2
9 7 . 2 9 7 . 8
9 7 . 5
9 6 . 0
33
10 .1 .3 Collection of Both Volatiles: Reliability Test
Because of the known reaction (under certain conditions) between solid sodium hydroxide and chlorinated hydrocarbons, an additional calibration test was run when both gases were present in the same system. It was important to check that the 2% of CH2C12 not accounted for in the above tests would not produce erroneously high readings for the C02 absorption. It was realized that care must be taken to absorb all CH C12 in the system before passing the gas stream through the $0 absorbers. A final calibration trial using both CH C122and C02 was carried out. The dry air stream passed firs$ over the solid C02, then over heated CH2C1 . The absorption train consisted of the series 03 cold traps, followed by the Soda Lime and finally Drierite absorbers.
The amounts collected in the two absorption systems were weighed separately and showed a recovery rate of 98% CH C1 and 98% C02 of the original mass of the two emissions (?'able 4 ) . These experiments showed that no significant interference of the chemical species occurred, when trapped in the above sequence. For the present purpose the method was considered suitable for the quantitative recovery of the two chemical entities.
10.1 .4 . Modification of Method for a Closed System
Both the apparatus and the operator technique had to be modified in order to achieve foaming in a self contained system. The foaming box had to be prepared by enclosing the box and the pipes leading to it inside a large plastic bag.
The plastic-lined box was fitted with two inlet and two outlet tubes at about 50 mm above the bottom as in previous tests. The intent was to remove the volatiles at various rates by means of a suction pump. The box was positioned inside a wire cage which supported the tubes (plus an additional one located above the foam surface) and the wide-mouth (diameter = 60 mm) foam ingredients loading tube. This entire assembly was placed inside a large translucent plastic bag.
After several trials a technique was developed in which the Tygon tubes were led through the bag by making a small hole in the bag and stretching it over the tubing. An additional wrapping of this joint with plastic tape made it quite airtight. A similar technique for the much larger foam ingredients loading tube also worked very well. When the four openings had been sealed, the open end of the bag was then sealed with tape, repeated folding, and an additional final tape seal. The whole assembly was tested for airtightness by keeping it pressurized over night. Figure 9 shows a diagrammatic view of the details of the mold and enclosing bag.
34
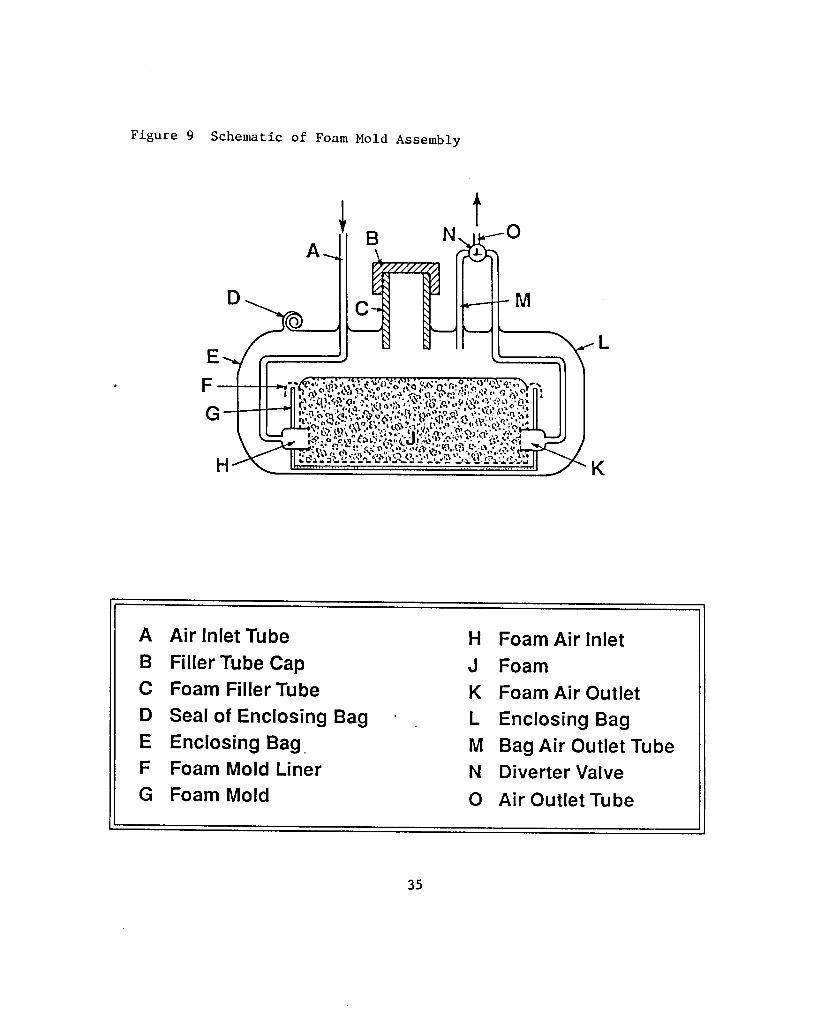
Figure 9 Schematic of Foam Mold Assembly
I t
A Air Inlet Tube H Foam Air Inlet B Filler Tube Cap J Foam C Foam Filler Tube K Foam Air Outlet D Seal of Enclosing Bag - , L Enclosing Bag E Enclosing Bag. M Bag Air Outlet Tube F Foam Mold Liner N Diverter Valve G Foam Mold 0 Air Outlet Tube
35
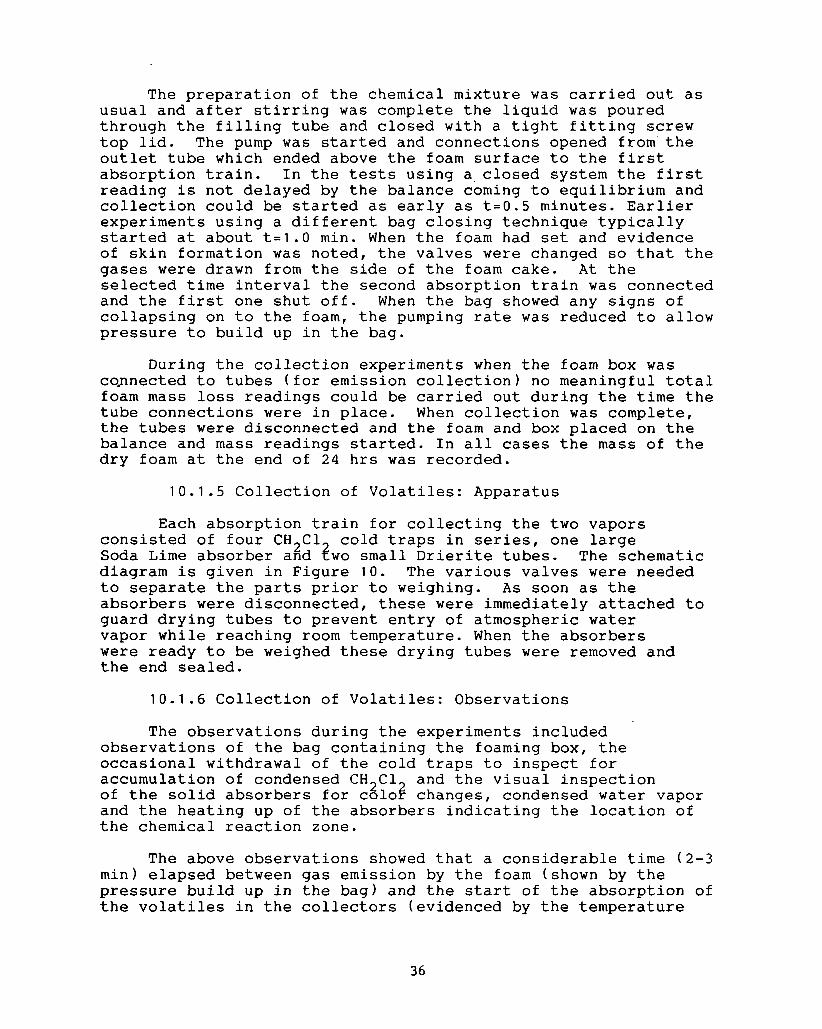
The preparation of the chemical mixture was carried out as usual and after stirring was complete the liquid was poured through the filling tube and closed with a tight fitting screw top lid. The pump was started and connections opened from the outlet tube which ended above the foam surface to the first absorption train. In the tests using a closed system the first reading is not delayed by the balance coming to equilibrium and collection could be started as early as t=0.5 minutes. Earlier experiments using a different bag closing technique typically started at about t=1.0 min. When the foam had set and evidence of skin formation was noted, the valves were changed so that the gases were drawn from the side of the foam cake. At the selected time interval the second absorption train was connected and the first one shut o f f . When the bag showed any signs of collapsing on to the foam, the pumping rate was reduced to allow pressure to build up in the bag.
During the collection experiments when the foam box was coflnected to tubes (for emission collection) no meaningful total foam mass loss readings could be carried out during the time the tube connections were in place. When collection was complete, the tubes were disconnected and the foam and box placed on the balance and mass readings started. In all cases the mass of the dry foam at the end of 24 hrs was recorded.
10.1.5 Collection of Volatiles: Apparatus
Each absorption train for collecting the two vapors consisted of four CH C1 cold traps in series, one large Soda Lime absorber a6d $wo small Drierite tubes. The schematic diagram is given in Figure 1 0 . The various valves were needed to separate the parts prior to weighing. As soon as the absorbers were disconnected, these were immediately attached to guard drying tubes to prevent entry of atmospheric water vapor while reaching room temperature. When the absorbers were ready to be weighed these drying tubes were removed and the end sealed.
10.1 .6 Collection of Volatiles: Observations
The observations during the experiments included observations of the bag containing the foaming box, the occasional withdrawal of the cold traps to inspect for accumulation of condensed CH2C12 and the visual inspection of the solid absorbers for color changes, condensed water vapor and the heating up of the absorbers indicating the location of the chemical reaction zone.
The above observations showed that a considerable time ( 2 - 3 min) elapsed between gas emission by the foam (shown by the pressure build up in the bag) and the start of the absorption of the volatiles in the collectors (evidenced by the temperature
36
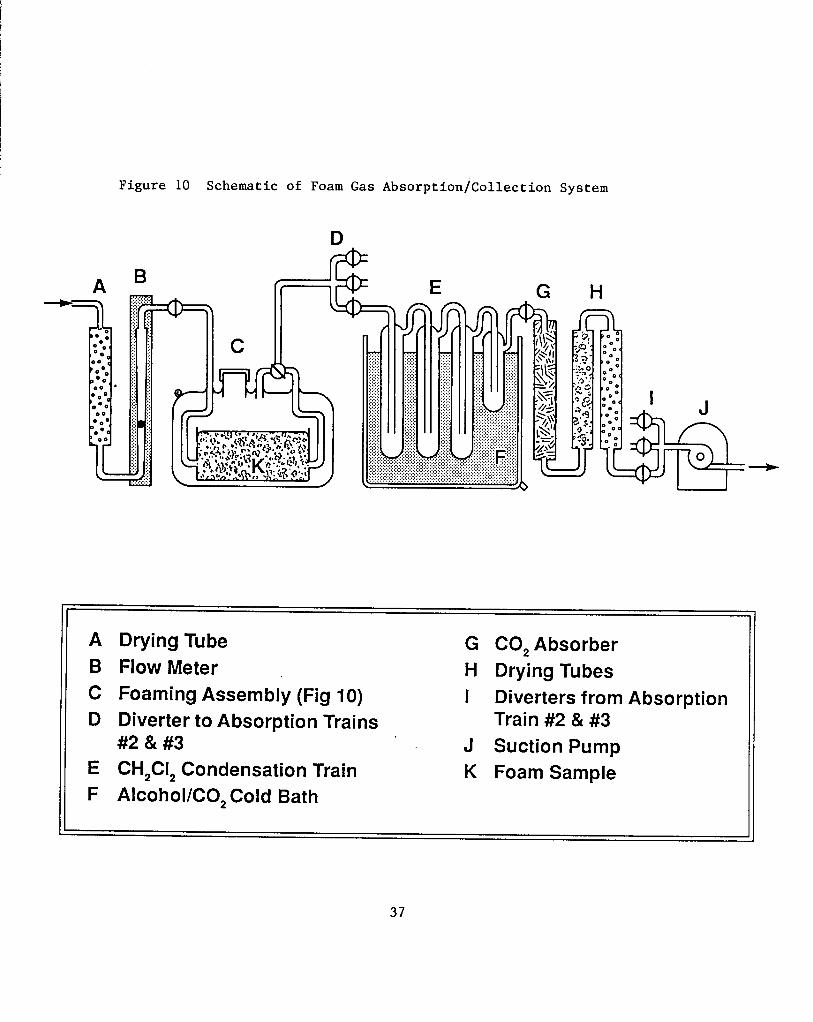
Figure 10 Schematic of Foam Gas Absorption/Collection System
d b E
A Drying Tube G CO, Absorber B Flow Meter H Drying Tubes C Foaming Assembly (Fig IO) I Diverters from Absorption D Diverter to Absorption Trains Train #2 & #3
E CH,CI, Condensation Train K Foam Sample F Alcohol/CO, Cold Bath
#2 & #3 J Suction Pump
I '
37
increase of the absorbers). In one instance the gas pressure in the bag became so high that it appeared close to bursting and the arrival of the gases in the absorbers was delayed by several minutes. The time difference between the arrival of the volatiles in the respective collectors appeared to be minor.
The reason for this time delay is attributed to the very high resistance to gas flow in the granular CO absorbers and the limited pumping power available. It was c3ear that during the early stages of foaming the pump could not transport the gases to the absorbers as fast as these were evolving from the foam.
10.1 .7 Collection of Volatiles: Techniques
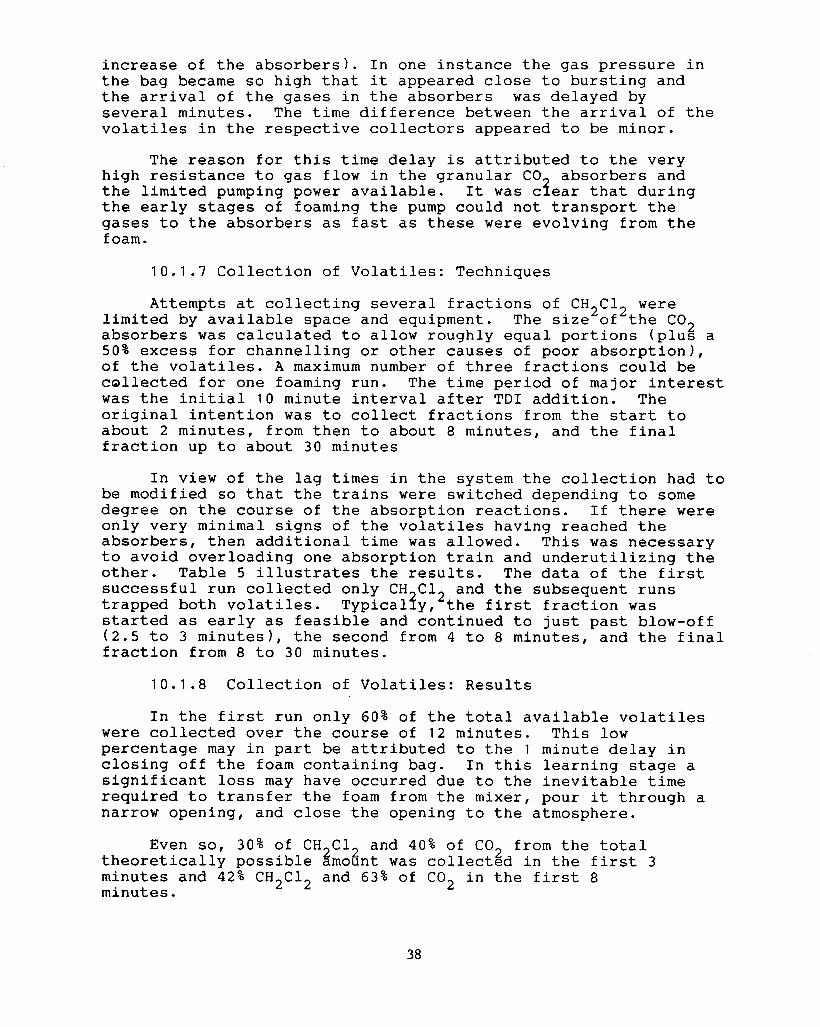
Attempts at collecting several fractions of CH2C12 were limited by available space and equipment. The size of the C 0 2 absorbers was calculated to allow roughly equal portions (plus a 50% excess for channelling or other causes of poor absorption), of the volatiles. A maximum number of three fractions could be collected for one foaming run. The time period of major interest was the initial 1 0 minute interval after TDI addition. The original intention was to collect fractions from the start to about 2 minutes, from then to about 8 minutes, and the final fraction up to about 30 minutes
In view of the lag times in the system the collection had to be modified so that the trains were switched depending to some degree on the course of the absorption reactions. If there were only very minimal signs of the volatiles having reached the absorbers, then additional time was allowed. This was necessary to avoid overloading one absorption train and underutilizing the other. Table 5 illustrates the results. The data of the first successful run collected only CH C 1 and the subsequent runs trapped both volatiles. Typical?yf2the first fraction was started as early as feasible and continued to just past blow-off (2.5 to 3 minutes), the second from 4 to 8 minutes, and the final fraction from 8 to 30 minutes.
10.1.8 Collection of Volatiles: Results
In the first run only 60% of the total available volatiles were collected over the course of 12 minutes. This low percentage may in part be attributed to the 1 minute delay in closing off the foam containing bag. In this learning stage a significant loss may have occurred due to the inevitable time required to transfer the foam from the mixer, pour it through a narrow opening, and close the opening to the atmosphere.
Even so, 30% of CH2C12 and 4 0 % of C 0 2 from the total theoretically possible amount was collected in the first 3 minutes and 42% CH2C12 and 63% of C 0 2 in the first 8 minutes.
38
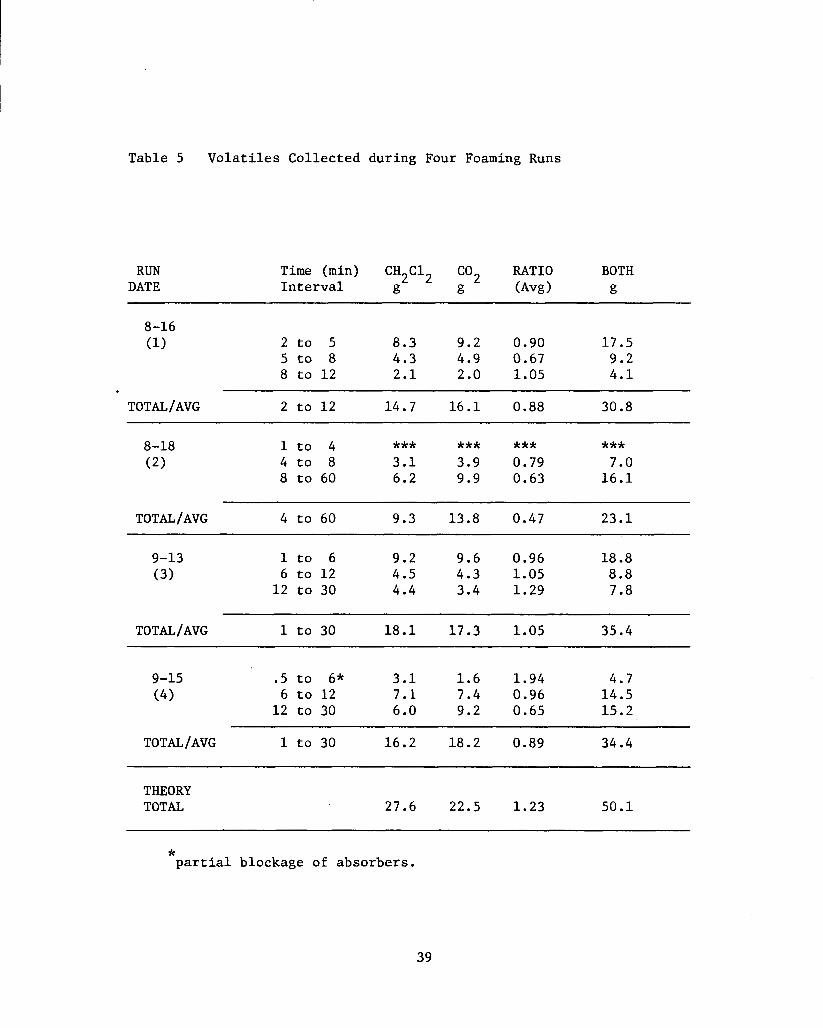
Table 5 Vola t i les Col lec ted dur ing Four Foaming Runs
RUN DATE
T ime (min) CH2C12 I n t e r v a l g g (Avg 1 g c02 RATIO BOTH
8-16 (1) 2 t o 5 8.3 9.2 0.90 1 7 . 5
5 t o 8 4.3 4.9 0.67 9.2 8 t o 1 2 2.1 2.0 1.05 4.1
TOTALIAVG 2 t o 1 2 14.7 16.1 0.88 30.8
8-18 (2)
1 t o 4 *** *** *** *** 4 t o 8 3 .1 3.9 0.79 7.0 8 t o 60 6.2 9.9 0.63 16 .1
TOTAL/AVG 4 t o 60 9.3 13.8 0.47 23.1
9-13 1 t o 6 9.2 9.6 0.96 18.8 (3) 6 t o 1 2 4.5 4.3 1.05 8.8
1 2 t o 30 4.4 3.4 1.29 7.8 ~~ ~~ ~~~
TOTAL/AVG 1 t o 30 18.1 17.3 1.05 35.4
9-15 . 5 t o 6* 3.1 1.6 1.94 4.7 (4) 6 t o 12 7.1 7.4 0.96 14.5
12 t o 30 6 .O 9.2 0.65 15.2 ~~~
TOTAL /AVG 1 t o 30 16.2 18.2 0.89 34.4 ~~~ ~~
THEORY TOTAL 27.6 22.5 1.23 50.1
* p a r t i a l b l o c k a g e of absorbers .
39
In the second run the closing of the bag occurred more rapidly, but the collection of the first fraction was invalidated by a blocked absorber tube and the excess pressure caused an overall leakage of gases. In the second fraction 1 4 % of the expected amount of CH C1 and C 0 2 were collected between 4 and 8 minutes, and an2ad&.tional 3 2 % over the next 52 minutes.
The last two runs shown in Table 5 gave much higher total yields (69% and 7 1 % ) of the two volatiles but showed discrepancies in detail of when the two species were evolved. The final run showed some evidence of early C 0 2 absorber blockage and is for this reason more suspect. It is evident that although the technique yields some valuable data it needs further development and additional refinement. The significant observations and conclusions that may be drawn are:
( 1 ) the total amounts of volatiles collected were roughly equal, although a higher percentage of theoretical amounts of CO was recovered in all runs. 2
( 2 ) the ratio of C H 2 C 1 2 to CO was roughly equal but the variations in the ratio range6 from 1 . 9 to 0.7.
( 3 ) the agreement between the runs showing no evidence of absorber blockage suggest at least 30%-35% of total emissions occur in the first 5 to 6 minutes, at least 6 0 % in the first 12 minutes and 7 0 % in 30 minutes.
( 4 ) the total amounts of volatiles collected over 3 0 minutes agreed well with the mass loss 'observed in the open system over that time period. This adds an internal verification of the experiments.
6 5 ) the temperatures of the gases in the bag reached about 4 0 C supporting the temperature measurements inside the foam; thus the C H 2 C 1 2 evolved by boiling, rather than simple evaporation.
11.0 TEMPERATURE MEASUREMENTS DURING FOAMING
11.1 OBJECTIVES FOR TEMPERATURE MEASUREMENTS
Since the reactions between TDI and the polyol, water and the amine linkages are all highly exothermic, it is necessary to establish the rate at which heat is generated in this system. The results are of use in the calculations for the solubility and rate of diffusion of methylene chloride (and possibly other chemical species) out of the polymer and through the foam. Any continuing chemical reactions (cross linking) during the curing period will also be affected by the way the heat generated by the reaction is conserved in the system or lost to the environment.
40
As expected, the observations of the laboratory tests did not exactly reproduce those found in the plant. Nevertheless, the general processes are similar but on different scale of temperature and time. Tests were carried out to determine the temperature profiles with time and to correlate these with observed mass losses in the same system. Readings were taken at different locations in insulated and uninsulated molds to determine the effect of heat losses due to convection and conduction.
11.2 FOAM TEST MODIFICATIONS FOR TEMPERATURE RUNS
11.2.1 Thermocouples and Multipoint Recorder:
Six calibrated copper-constantan thermocouples were supported on a laboratory stand and located in an empty mold box to correspond to the desired points to be measured. Three different levels and three different locations were measured in insulated and uninsulated molds (not all levels and all locations were determined for both insulation conditions). To improve reliablity the readings were carried out in duplicate.
11.2.2 Location of Thermocouples
The three levels investigates were 0.5", 2.5", and 4.5" from the bottom and the three locations were the center, 0.5" from a corner and 0.5'' away from the center of a side. Thus these were located at O", 5.5" and 8.5" from the center of the mold.
11.2.3 Method of Measuring the Temperatures
The six thermocouples were connected to a Leeds and Northrup Speedomax H Multipoint recorder and which was equipped with an internal temperature compensator. Readings were taken at the rate of 1 per second and the speed of the chart paper could be varied by a factor of 1O:l. The fast speed ( 0 . 0 9 6 in/min) was used for early readings (up to about 10 minutes) and the slow speed for bater on i8 the test. A range card to give readings between 20 F and 220 F was installed.
11.3 RESULTS OF TEMPERATURE MEASUREMENTS
The foam was produced by the standard method and poured into the mold box for which the thermocouples had previously been positioned. Special care was taken not to pour the foam on to the thermocouples or to disturb the positions. After completion of the test, the thermocouples were carefully cleaned to prevent the set foam from acting as an insulating layer for subsequent runs.
41

The original charts of the readings were not suitable for effective plotting and comparisons. Therefore, the chart traces were read at convenient distances and entered into a computer which converted the values to temperature versus time (min) tables. These could then be plotted in the normal manner.
11.3.1 Comparison of Mass Loss and Temperature Profiles
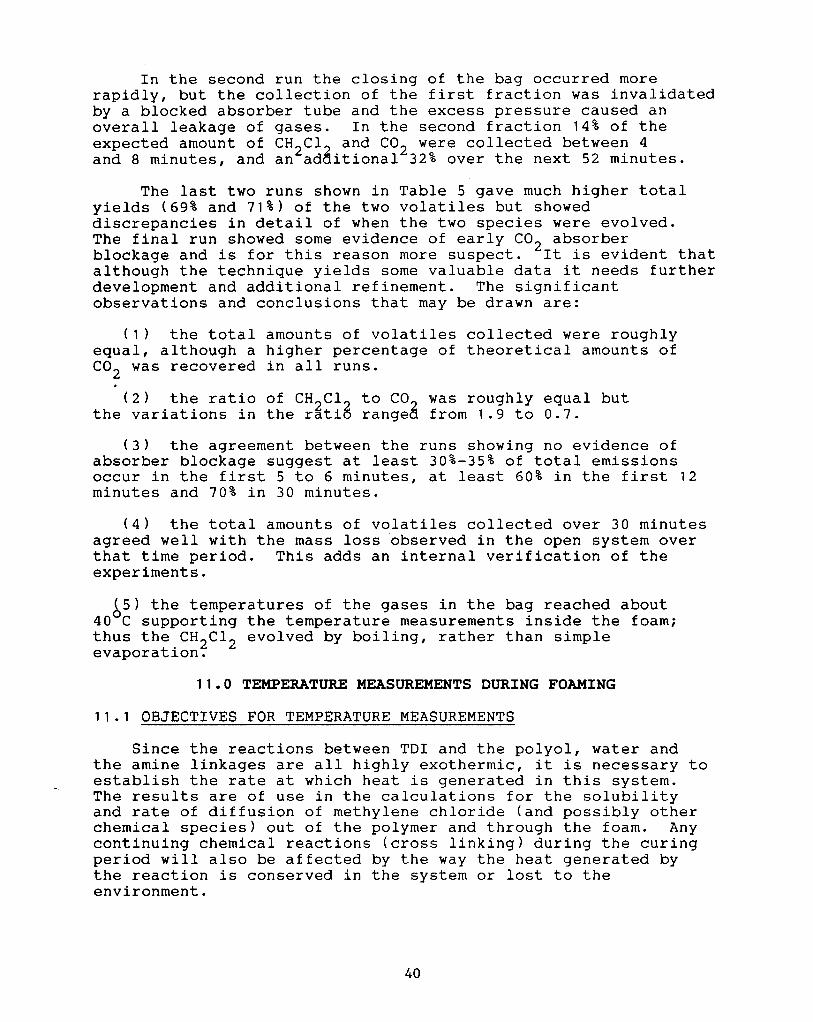
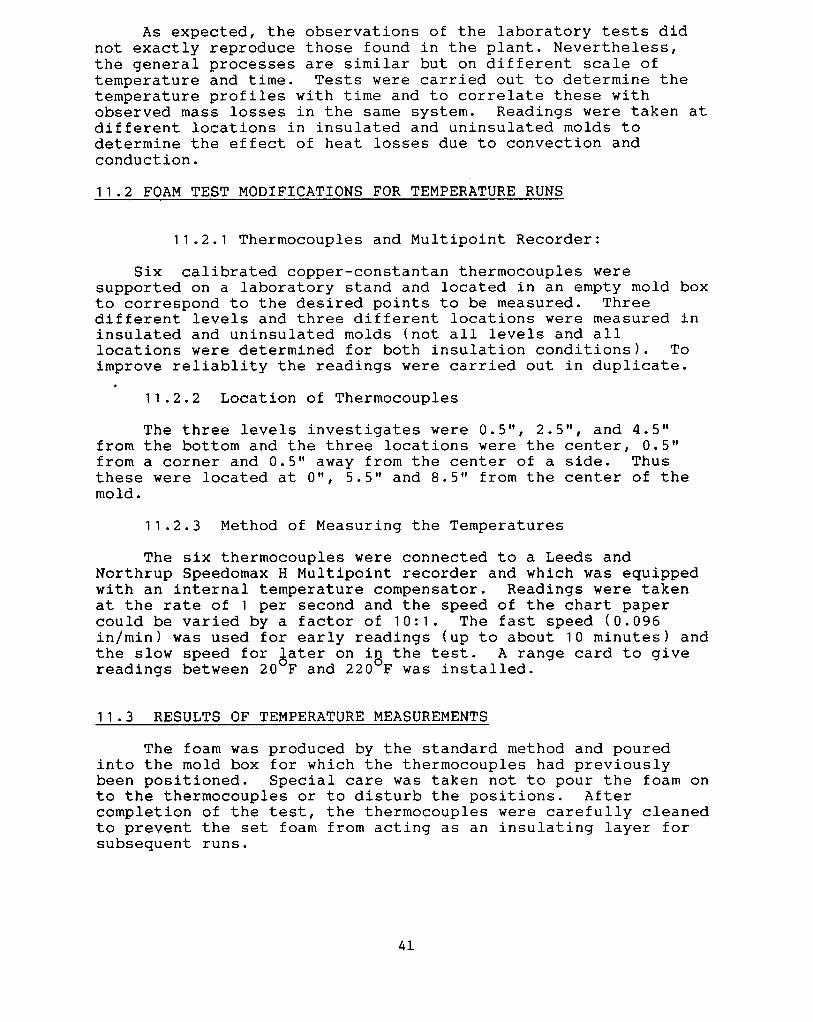
Figures 1 1 & 12 and Figure 13 & 14 show the comparisons between the mass loss and temperature profiles at the center on an insulated foam sample. Since the thermocouples and connections interfered with the mass loss measurements, these plots resulted from two separate runs. These were carried out under as nearly identical conditions as possible. The graphs are shown plotted versus time and log(time1 to show the differences over the whole time range more clearly and also allow conversions from log(time1 to time in minutes.
The temperature first rises at an almgst linear rate on the log time plot. It reaches a maximum of 150 F after about 15 minutes and then gradually decreases. Blow off occurred at abut 3.0 minutes and the break in the mass loss versus log(time1 curve occurred at about a minute after that. Thus, the temperature continued to rise well after the cell structure had opened and the volatile evolution had peaked. This would imply that the cooling effect of the gases evolved does not significantly contribute to the heat loss of the total system.
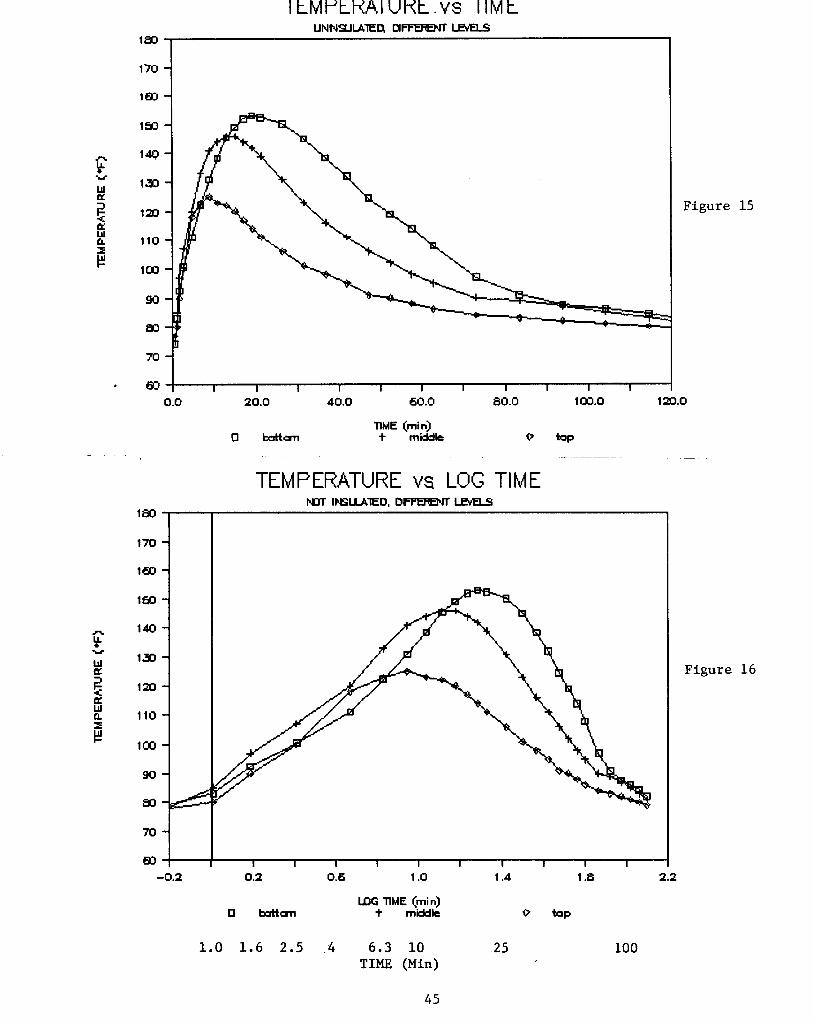
11.3.2 Temperature Profiles at Different Levels
Figures 15 & 16 show a comparison of the temperature profiles for different levels at the central location in an uninsulated foam. The thermocouple located near the bottom rose less rapidly thag the mid position but reached the highest temperature ( 1 6 5 F) at about time=2O min. The top thermocouple temperature rise was theoslowest at first and reached the lowest maximum temperature ( 1 2 5 F) at time=lOmin. The central thermocouple initially rose most rapidly and reached a maximum intermediate between the two others - in time and level. These results showed that in the uninsulated foam samples the temperature rise near the bottom was slower at first - compared to the other levels - as might be expected from the additional heat loss. However, as the reaction progressed the temperature near the bottom started to rise more rapidly and showed later and higher maxima. This indicates that heat conduction via the bottom is not a major factor, and that heat loss via mass transfer through the top surface is a major mechanism.
42
M
40
90
a0
10
0
TEMPERATURE.vs TIME RUN 7/1 0/= (Cenkr. rat insdated)
Figure 11
1 I I I I I 1 I I I I
0 20 40 60 530 1m l a 0
TIME (minutes)
MA55 LOSS vs TIME BJN 7./10/= C
Figure 1 2
I
0 20 40 60
TIME (minutes)
80 1133 l a 0
4 3
1 6 3 - im - 1 4 0 - 1m - 1 2 0 - 110 - 1 0 3 - 90-
m - t
70-
80 -0.2
m
Qo
33
a0
10
0 -0.2
TEMPERATURE VS LOG TIME
0.2 0.6 1 .0
UG TIME (rninhs)
1.4 1.8
-
2.2
MASS LOSS vs .LOG TIME R W 7110188 A
0.2 0.6 1 .0
UG TIME (minhs)
1.0 1.6 2.5 4 6.3 10 TIME (Min)
1.4
-
2.2
.25
1 .a
100
Figure 13
Figure 1 4
44
A
k
# 2
U
4 a W t3
1M
1 7 0
l B 3
1M
1Jw
1 3 0
1m 110
lI #
90
M
70
TEMPERATURE. vs TIM E
Figure 15
0.0 20.0 40.0 60.0 80.0 1m.0 1 m.0 TIME (rnin]
0 battun t rnijjk Q b P
1m
1M - l a 3 - 1M - l o o - 1 3 0 - l a 0 - 110 - l o o - 90-
"1 63 -0.2
TEMPERATURE vs LOG TIME hDT IWWlED, D m W
Figure 16
0.2 0.6 1 .0 1.4 1.8 2.2
u3G TIME (rnin) 0 battun t middle Q b P
1.0 1.6 2 . 5 4 6.3 10 TIME (Min)
25 100
45
11.3 .3 Temperature Profiles at Different Locations
Comparing the temperature profiles near the bottom of the sample but at different locations from the center, Figures 17 & 18 show the expected trend of lower maximum temperatures at earlier times the further away from the center. The initial rates of temperature rise were very similar and presumably controlled by the reaction in the immediate neighborhood. Only when the heat of the reaction was decreasing in magnitude, did the effects of the overall environment show differences in the temperature profiles.
11 .3 .4 Effect of Insulation on Temperature Profiles
Figures 1 9 & 20 which show comparisons of the temperature profiles for an insulated and an uninsulated system. The temperature readings were taken at the same location in the mold. The plots show the same general trends in the two systems. The expected trend of higher maximum temperatures reached in the presence of insulated sides and bottom can be noted. Other levels show the same general trend. The effect was most pronounced for the bottom and least for the top.
12 .0 CONCLUSIONS AND FUTURE PLANS
The main achievements to this point have been to gain new, and valuable insights into the process of volatiles evolution in the PUF foam production. The evidence suggests that the methylene chloride is evolved at approximately the same time as the CO and at a much earlier stage of the reaction than is normally suggested. Our experiments have covered the evolution over the first few minutes after pouring the foam when the commercial collection would be far easier to implement than in the later stages of the foam curing process.
Even though the methylene chloride boiling point is not exceeded until about 2.5 minutes and the blow off is observed at about 2.5-3 minutes the actual gas loss profile is smooth and rapid. It is unclear what mechanisms might give rise to the very early and rapid gas loss. These losses may be about equal for both methylene chloride and C02.
As tentative conclusions for auxilliary blowing agent recovery in full scale production systems it appears that nearly 50%-60% may be lost in the foaming tunnel ( 0 - 1 0 minutes). The diffusional mechanism for further loss and lack of evidence for substantial dissolution in the polyurethane polymer suggest that greater methylene chloride recovery might be achieved in the tunnel. The gases collected directly from the bun appear to be of sufficient methylene chloride concentration to be recovered, in this study, by condensation.
46
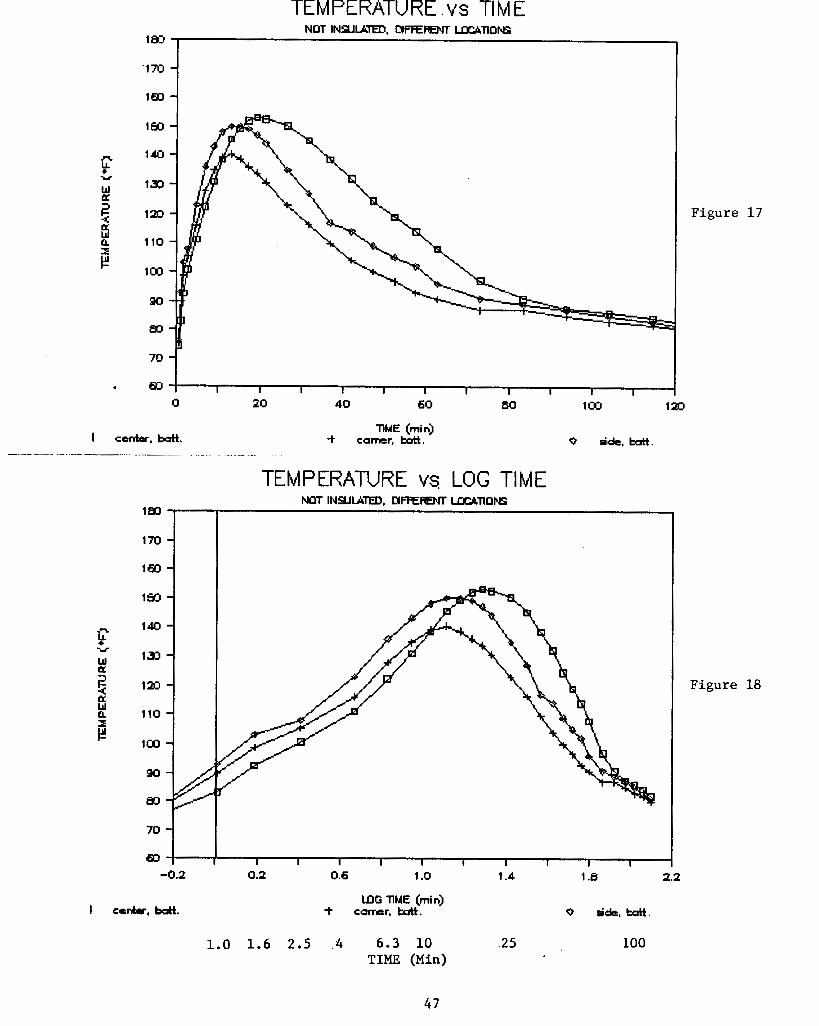
TEMPERATURE .vs TIME NOT INSULATED, u m m u3cQTIom
1M
-170 - 183 -
Q 10 40 6Q 80
1 7 0 l M 4" 1 8 3 - 1% - 140 - 1m - la - 110 - 1m -
70-
Bo -0.2
I c t n k , k r t t .
TIME (rnin) + comer, tntt.
TEMPERATURE vs LOG TIME NM INSULA,, UFRM m n o m
1m la0
Figure 1 7
0 ade,bdt.
Figure 18
I I I I I I I I I I
0.2 0.6 1 .Q 1.4 1.8 2.2
LOG TIME (rnin) + comer. tdt. 0 ride. tdt.
1.0 1.6 2.5 . .4 6.3 10 .25 100 TIME (Min)
47
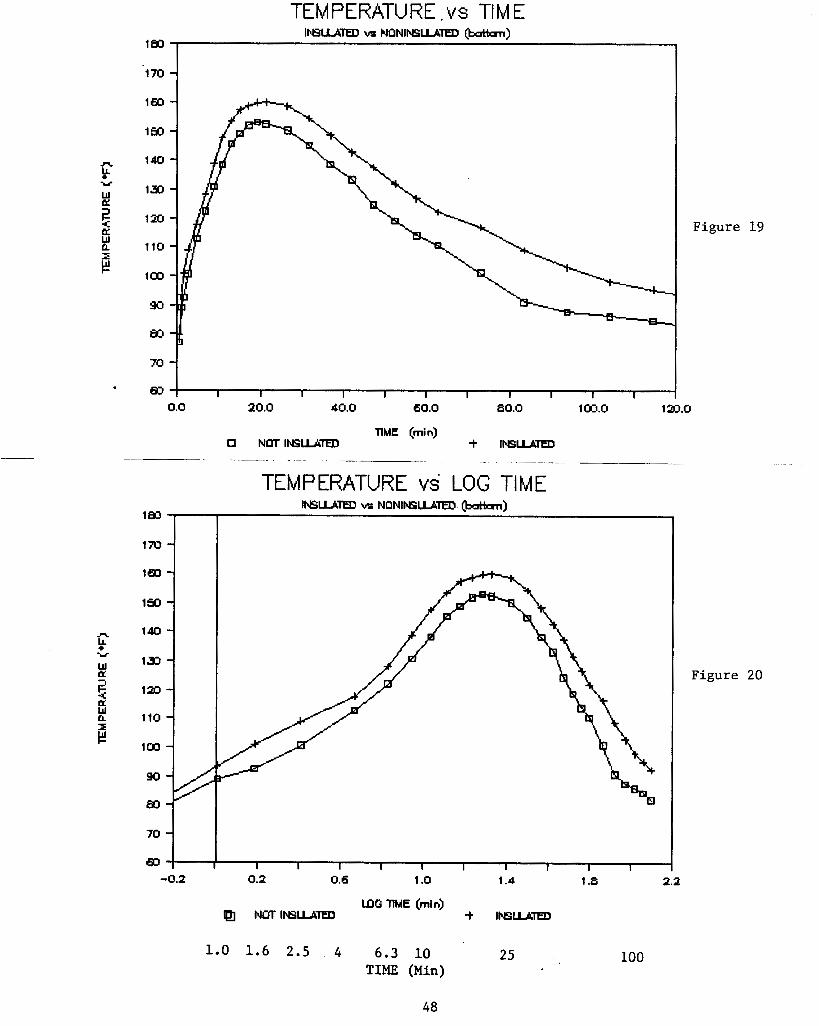
l a 0
170
1 B o
1 5 R
U
w 1 9 0
i 4 133 U W a 110
1#)
90
a0
70
Bo
TEMPERATURE.vs TIME INSLUTED vp NONIFIZ;ilLATED (t#un)
Figure 19
I 1 I I I I I 1 I I I 0.0 20.0 40.0 60.0 a m lcrD.0 133.0
0 NOTINSLUTED llME (min) + INSLUED
l a 0
170
160
1s
90
a0
70
Bo
TEMPERATURE vs' LOG TIME INSLUTED vs NONINSLUTED. (tattun)
0.2 0.6 1 .0 1.4 1 .a
100
-
2.2
NOTIWWTED u3G TlME (min) + INSLUTED
1.0 1.6 2.5 4 6 . 3 10 25 TIME (Min)
Figure 20
48
Further studies are important to translate these data to plant modifications. These are
1) Establish in the plant the mass loss versus time dynamics, probably by measurements at the bun cutting point (about 9-1 0 minutes 1.
recovery would be explored in the laboratory.
developed and
2) Alternates for enhanced percent methylene chloride
3 ) A more efficient experimental arrangement is to be
4) A descriptive model is to be developed as a tool to improved understanding of this process.
13.0 REFERENCES
MOOZ, W.E. and T. Quinn 1980, Flexible Urethene Foams and Chlorofluorocarbon Emissions, Rand Note N-1472-EPA, Santa Monica, CA, 65p.
Overcash, M.R., Development of a Program at North Carolina State University for Industry Assistance in Pollution Prevention, Report to North Carolina Board of Science and Technology and the Pollution Prevention Pays Program, North Carolina Department of Natural Resources and Community Development, Raleigh, N.C. 24 p., 1986.
Overcash, M.R. and M.A. Vancil, Preliminary Engineering Assessment of Volatile Chemical Minimization from Industrial Manufacturing, Report to North Carolina Board of Science and Technology and the Pollution Prevention Pays Program, North Carolina Department of Natural Resources and Community Development, Raleigh, N.C. 12 p., 1986a.
49