flexural behavior of composite slab benha/civil...el-sayed et al.; air, 5(3): 1-12, 2015; article...
TRANSCRIPT

_____________________________________________________________________________________________________ *Corresponding author: E-mail: [email protected];
Advances in Research 5(3): 1-12, 2015, Article no.AIR.18847
ISSN: 2348-0394
SCIENCEDOMAIN international www.sciencedomain.org
Flexural Behavior of Composite Slab
Khaled M. El-Sayed1, Nader Nabih1 and Ayat M. Taha1*
1Civil Engineering Department, Faculty of Engineering in Benha, Benha University, Benha, Egypt.
Authors’ contributions
This work was carried out in collaboration between all authors. Author KME-S proposed the research
plan, analyzed the results of the study and reviewed the manuscript. Author NN planed the experimental program and reviewed the obtained results. Author AMT carried out the experimental
program, processed the theoretical calculations and wrote the first draft of the manuscript. All authors read and approved the final manuscript.
Article Information
DOI: 10.9734/AIR/2015/18847
Editor(s): (1) Shi-Hai Dong, Professor of Department of Physics, School of Physics and Mathematics National Polytechnic Institute,
Building 9, Unit Professional Adolfo Lopez Mateos, Mexico. Reviewers:
(1) Anonymous, India. (2) K. Nirmalkumar, Civil Engineering, Kongu Engineering College, Tamilnadu, India. (3) Akaninyene Afangide Umoh, Department of Building, University of Uyo, Nigeria.
Complete Peer review History: http://sciencedomain.org/review-history/9958
Received 13th May 2015 Accepted 15
th June 2015
Published 29th
June 2015
ABSTRACT Aims: This study deals with the enhancement of the longitudinal shear interaction at the concrete-profiled steel sheeting interface of composite slab by using shear connectors. The push out and flexural tests are carried out with the same shear connection details. Place and Duration of Study: The test is carried out in RC laboratory at Faculty of Engineering in Benha, Benha University, Egypt, between May 2014 and March 2015. Methodology: Fourteen push out specimens with different configurations were built in, of which five specimens with steel deck thickness of 0.7 mm and nine specimens with steel deck thickness of 1.2 mm. For each profiled steel sheeting thickness one specimen is assigned as a control specimen and the other specimens were enhanced with different types of shear connectors such as self-drilling screws with different length and spacing, cold formed members with different shapes (U&C) and different spacing. Eleven large scale specimens with different configurations were prepared. Four specimens were prepared with profiled steel sheeting of 0.7 mm thickness and seven specimens with profiled steel sheeting thickness of 1.2 mm. One control specimen for each profiled steel sheeting thickness was also prepared. The other specimens were enhanced with different types of shear connectors: self-drilling screws with different length and spacing and cold formed
Original Research Article
El-Sayed et al.; AIR, 5(3): 1-12, 2015; Article no.AIR.18847
2
members with different shapes (U&C) with different spacing. Results: The test results show that the failure mode of composite slab can be improved to ductile type and the load carrying capacity can be increased by the presence of the shear connectors. The load performance of the slab is also affected by changing the profiled steel sheeting thickness.
Keywords: Composite slab; push out test; shear connectors.
1. INTRODUCTION Cold-formed steel decks have been widely used in composite slab systems in steel Structures. The knowledge about the interaction between the composite elements and its mechanical behavior has progressed rapidly during the past two decades. The composite slab system has proven to be very desirable to structural designers because of many advantages in comparison with conventional systems of reinforced concrete slabs such as high rate of construction, shallow construction, saving in weight, safe method of construction, saving in transport, sustainability as steel construction products can be either re-used or recycled upon demolition of a building and easy installation of services. Deck profile, thickness and strength of steel sheeting, span length and construction details affected the behavior and strength of composite slab. The composite slab under flexural has three modes of failure, as defined by Eurocode 4 [1]; the first mode is flexural failure which happened when interaction at the interface between concrete and steel is completely achieved. Flexural failure type is usually occurs in long thin slabs. Longitudinal shear failure, which is the second mode, and commonly referred to as shear bond failure, is the failure mode more likely to occur for most composite slab systems subjected to vertical loads. The vertical shear failure, which is the third mode, occurs when the slab is very short and thick with a high concentrated load near the supports. Shear bond strength can be divided into three components namely chemical bond, friction bond and mechanical bond as illustrated by Redzuan Abdullah [2]. Chemical bond exerts shear resistance with no slip at the interface. Once this bond is lost, slip is initiated and the chemical bond strength reduces to zero and does not restore. The frictional bond is a direct result from the application of normal forces, which act perpendicular to the steel-concrete interface. Friction bond is directly proportional to the normal force, so that if the normal force is zero then there is no frictional force. Mechanical bond exists due to physical interlocking between the steel sheeting and the concrete. The
interlocking is developed as a result of clamping action caused by the bending of steel deck, and forms the friction between the steel sheeting and the concrete due to surface roughness such as indentation or embossment on the steel surface. The interaction between the steel deck and the concrete is complex and difficult to model mathematically. So the design and analysis procedures available today have to pass on test data to account for the interaction parameter. The main objective of this study is to study the factors which affect the bond between steel sheeting and concrete by varying the spacing and types of shear connectors with different steel sheeting thickness.
2. EXPERIMENAL PROGRAM 2.1 Properties of Materials and
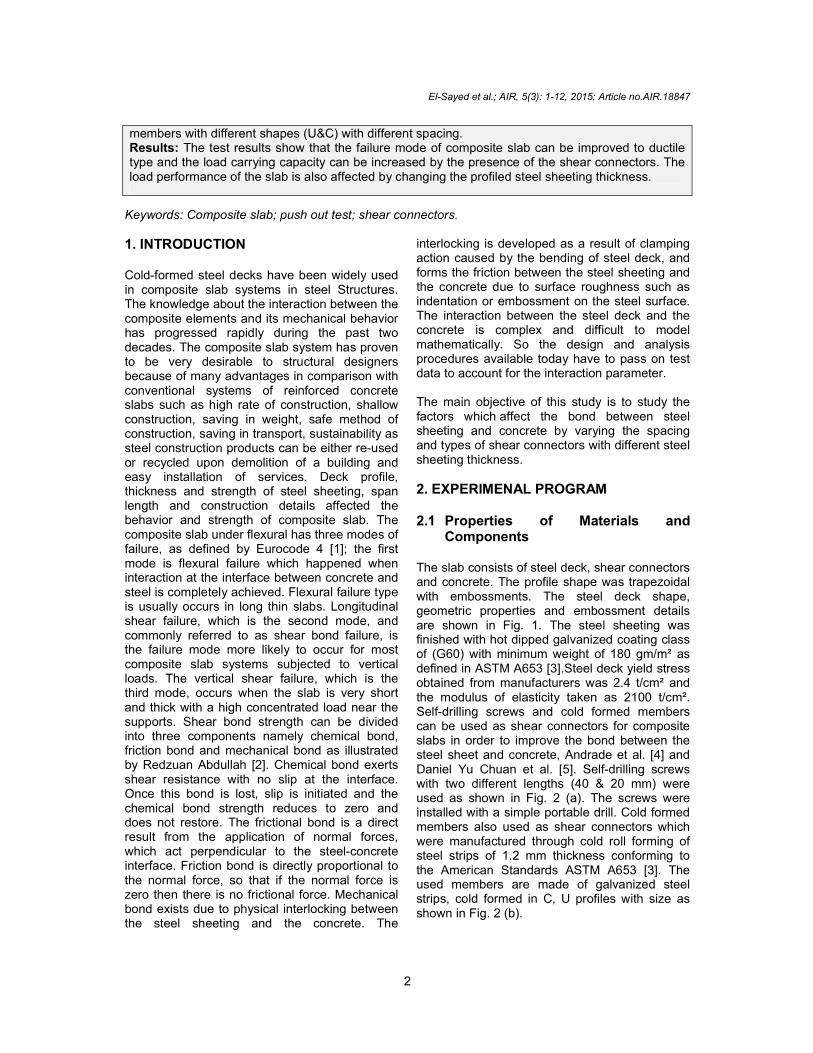
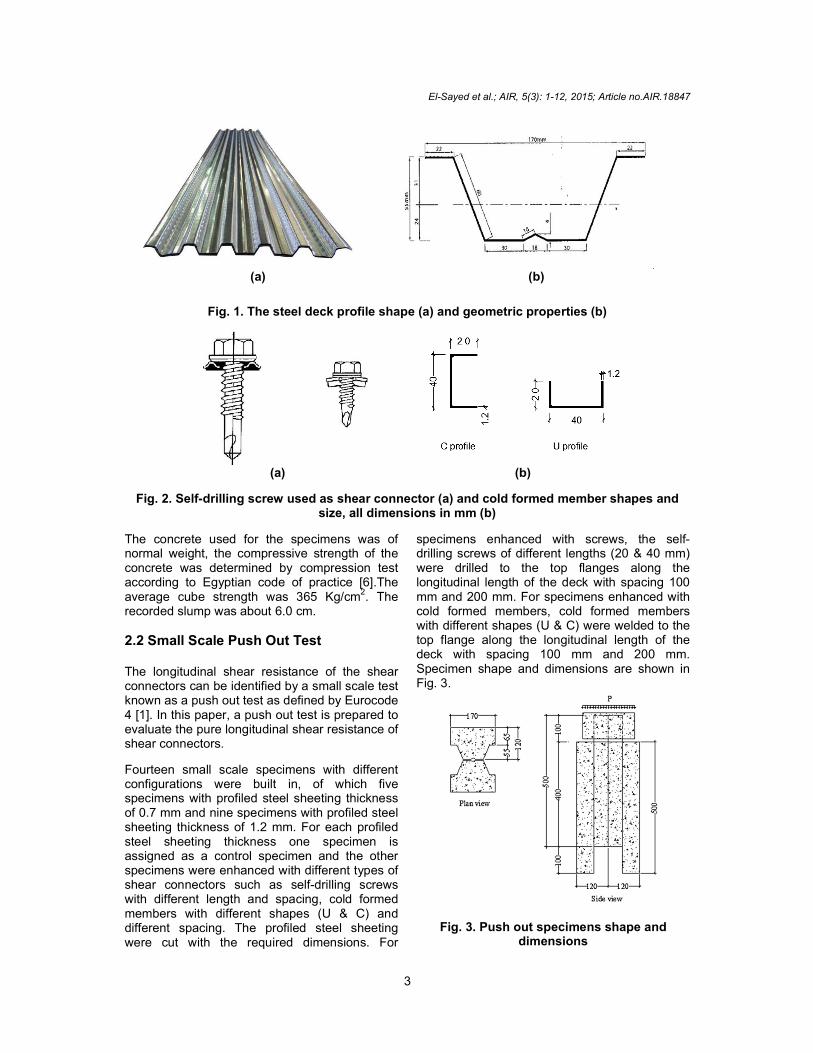
Components The slab consists of steel deck, shear connectors and concrete. The profile shape was trapezoidal with embossments. The steel deck shape, geometric properties and embossment details are shown in Fig. 1. The steel sheeting was finished with hot dipped galvanized coating class of (G60) with minimum weight of 180 gm/m² as defined in ASTM A653 [3].Steel deck yield stress obtained from manufacturers was 2.4 t/cm² and the modulus of elasticity taken as 2100 t/cm². Self-drilling screws and cold formed members can be used as shear connectors for composite slabs in order to improve the bond between the steel sheet and concrete, Andrade et al. [4] and Daniel Yu Chuan et al. [5]. Self-drilling screws with two different lengths (40 & 20 mm) were used as shown in Fig. 2 (a). The screws were installed with a simple portable drill. Cold formed members also used as shear connectors which were manufactured through cold roll forming of steel strips of 1.2 mm thickness conforming to the American Standards ASTM A653 [3]. The used members are made of galvanized steel strips, cold formed in C, U profiles with size as shown in Fig. 2 (b).
El-Sayed et al.; AIR, 5(3): 1-12, 2015; Article no.AIR.18847
3
(a)
(b)
Fig. 1. The steel deck profile shape (a) and geometric properties (b)
(a)
(b)
Fig. 2. Self-drilling screw used as shear connector (a) and cold formed member shapes and size, all dimensions in mm (b)
The concrete used for the specimens was of normal weight, the compressive strength of the concrete was determined by compression test according to Egyptian code of practice [6].The average cube strength was 365 Kg/cm
2. The
recorded slump was about 6.0 cm. 2.2 Small Scale Push Out Test The longitudinal shear resistance of the shear connectors can be identified by a small scale test known as a push out test as defined by Eurocode 4 [1]. In this paper, a push out test is prepared to evaluate the pure longitudinal shear resistance of shear connectors.
Fourteen small scale specimens with different configurations were built in, of which five specimens with profiled steel sheeting thickness of 0.7 mm and nine specimens with profiled steel sheeting thickness of 1.2 mm. For each profiled steel sheeting thickness one specimen is assigned as a control specimen and the other specimens were enhanced with different types of shear connectors such as self-drilling screws with different length and spacing, cold formed members with different shapes (U & C) and different spacing. The profiled steel sheeting were cut with the required dimensions. For
specimens enhanced with screws, the self-drilling screws of different lengths (20 & 40 mm) were drilled to the top flanges along the longitudinal length of the deck with spacing 100 mm and 200 mm. For specimens enhanced with cold formed members, cold formed members with different shapes (U & C) were welded to the top flange along the longitudinal length of the deck with spacing 100 mm and 200 mm. Specimen shape and dimensions are shown in Fig. 3.
Fig. 3. Push out specimens shape and dimensions

El-Sayed et al.; AIR, 5(3): 1-12, 2015; Article no.AIR.18847
4
Fig. 4 (a and b) show the interior side of different specimens before concrete placing where the steel sheets were enhanced by using cold formed members and self-drilling screws, respectively. A concrete block was placed later around the end of steel sheets in order to load push out specimen uniformly.
The test set-up for push out is described in Fig. 5. All the specimens were tested under vertical load which was applied using a hydraulic jack of 50-ton capacity and measured by using a proving ring of 10-ton capacity. Two Dial gauges of
0.01 mm accuracy and total range of 50 mm was installed on either side of the specimen to measure the longitudinal slip between concrete and steel sheets. All specimens were loaded incrementally every 1 ton until failure. Load value and the corresponding slip were recorded at each increment. As the load increased, the concrete slabs began to crack. A longitudinal crack occurred on the side of the concrete and further loading caused splitting of the concrete slab.
(a)
(b)
Fig. 4. Specimens enhanced with cold formed members (U, C) (a) and enhanced with Self-drilling screws (b)
Fig. 5. General view of push out setup
Proving ring
Hydraulic jack
Concrete end cap
Push out specimen Dial gauge

El-Sayed et al.; AIR, 5(3): 1-12, 2015; Article no.AIR.18847
5
The relationship between the shear strength and the ultimate load in push-out can be expressed as in equation 1 [7]:
Where, tpo is the longitudinal shear stress, Pu is the ultimate load, and Acon is the contact area between the steel sheet and the concrete.
2.3 Large Scale Slab Test Eleven large scale specimens with different configurations were prepared. Four specimens were prepared with profiled steel sheeting of 0.7 mm thickness and seven specimens with profiled steel sheeting thickness of 1.2 mm. Control specimen for each profiled steel sheeting
thickness was also prepared. The other specimens were enhanced with different types of shear connectors: self-drilling screws with different length and spacing and cold formed members with different shapes (U & C) with different spacing. The steel sheeting was cut with the required dimensions. Self-drilling screws were drilled to the top flanges along the length of the deck with spacing 100 mm and 200 mm in specimens enhanced with screws. Cold formed members were welded to the top flange along the longitudinal length of the deck with spacing 100 mm and 200 mm in specimens enhanced with cold formed members. Specimen shape and dimensions are shown in Fig. 6. The dimensions and test parameters of the large scale slab specimens are listed in Table 1. Fig. (7) shows some specimens with different types of shear connectors before concrete pouring.
Fig. 6. Large scale slab specimens shape and dimensions
Table 1. Large scale slab specimen's dimensions and details
Specimen ID Thickness of steel deck mm Shear dowels type Spacing mm 1.2 Control 1.2 Control - 1.2 U 200 1.2 U-cold formed 200 1.2 U 100 1.2 U-cold formed 100 1.2 C 100 1.2 C-cold formed 100 1.2 LS 200 1.2 Screws of 40 mm length 200 1.2 SS 200 1.2 Screws of 20 mm length 200 1.2 SS 100 1.2 Screws of 20 mm length 100 0.7 Control 0.7 Control - 0.7 U 200 0.7 U-cold formed 200 0.7 LS 200 0.7 Screws of 40 mm length 200 0.7 SS 200 0.7 Screws of 20 mm length 200
El-Sayed et al.; AIR, 5(3): 1-12, 2015; Article no.AIR.18847
6
(a)
(b)
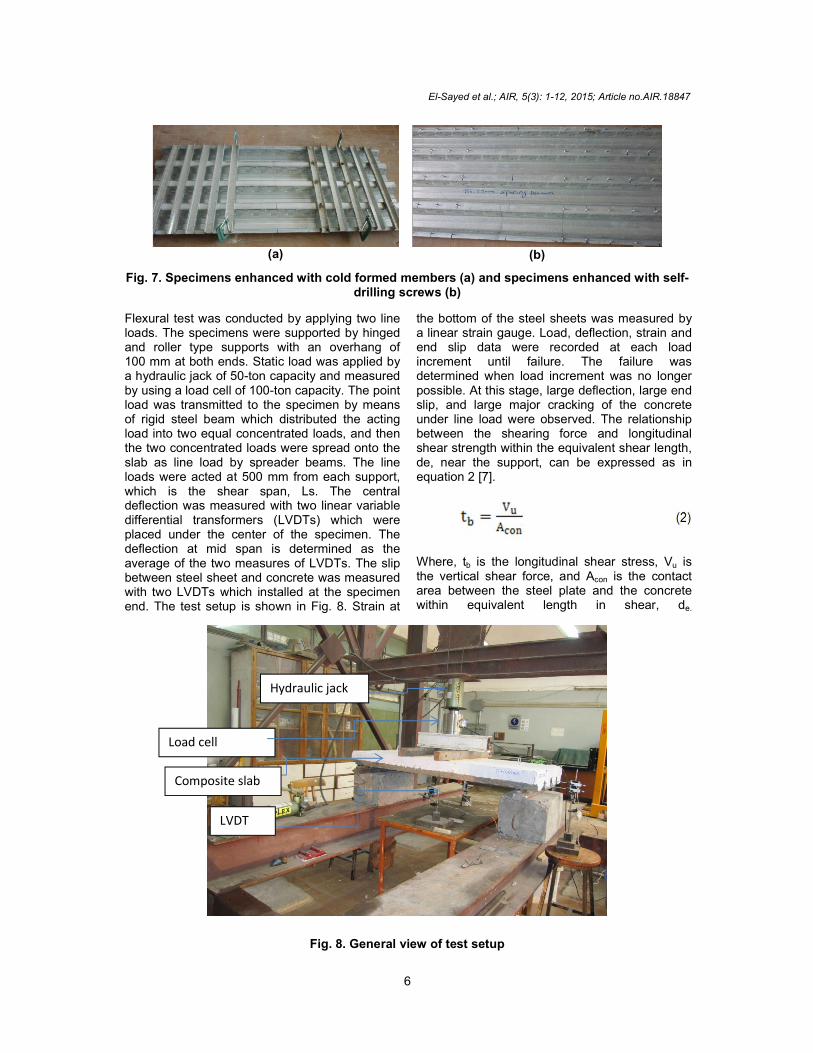
Fig. 7. Specimens enhanced with cold formed members (a) and specimens enhanced with self-drilling screws (b)
Flexural test was conducted by applying two line loads. The specimens were supported by hinged and roller type supports with an overhang of 100 mm at both ends. Static load was applied by a hydraulic jack of 50-ton capacity and measured by using a load cell of 100-ton capacity. The point load was transmitted to the specimen by means of rigid steel beam which distributed the acting load into two equal concentrated loads, and then the two concentrated loads were spread onto the slab as line load by spreader beams. The line loads were acted at 500 mm from each support, which is the shear span, Ls. The central deflection was measured with two linear variable differential transformers (LVDTs) which were placed under the center of the specimen. The deflection at mid span is determined as the average of the two measures of LVDTs. The slip between steel sheet and concrete was measured with two LVDTs which installed at the specimen end. The test setup is shown in Fig. 8. Strain at
the bottom of the steel sheets was measured by a linear strain gauge. Load, deflection, strain and end slip data were recorded at each load increment until failure. The failure was determined when load increment was no longer possible. At this stage, large deflection, large end slip, and large major cracking of the concrete under line load were observed. The relationship between the shearing force and longitudinal shear strength within the equivalent shear length, de, near the support, can be expressed as in equation 2 [7].
Where, tb is the longitudinal shear stress, Vu is the vertical shear force, and Acon is the contact area between the steel plate and the concrete within equivalent length in shear, de.
Fig. 8. General view of test setup
Hydraulic jack
Composite slab
Load cell
LVDT

El-Sayed et al.; AIR, 5(3): 1-12, 2015; Article no.AIR.18847
7
3. RESULTS AND DISCUSSION
3.1 Small Scale Push Out Test Results
The values of maximum load and corresponding slip of push-out test specimens are listed in Table 2. The pure longitudinal shear strength values computed from the push-out test results are, also, presented in Table 2.
3.2 Large Scale Slab Test Results
The maximum load and the corresponding deflection, strain and slip for large scale test specimens are listed in Table 3.
3.3 Effect of Steel Deck Thickness
For control specimens with steel deck of 0.7 mm and 1.2 mm thickness the two compared specimens were not enhanced with any type of shear connectors. It is shown that ultimate load for the specimen with profiled steel sheeting with thickness of 1.2 mm is increased by 52.33% than that of the specimen with profiled steel sheeting with thickness of 0.7 mm. The load-deflection curve in the two specimens behaved almost linearly prior to first end slip. After the end slip has initiated,
Table 2. Push out specimen test results
Specimen ID
Thickness of steel deck (mm)
Shear dowels type
Spacing (mm)
Pu. (ton)
slipx10² (mm)
Longitudinal shear strength (tpo) (kg/cm²)
1.2 Control 1.2 Control - 3.5 178 2.54 1.2 U 200 1.2 U-cold formed 200 11 100 6.74 1.2 U 100 1.2 U-cold formed 100 11 298 6.22 1.2 C 200 1.2 C-cold formed 200 7.5 197 4.8 1.2 C 100 1.2 C-cold formed 100 8.25 307 5.27 1.2 LS 200 1.2 Screws of 40 mm
length 200 6.5 149 4.78
1.2 LS 100 1.2 Screws of 40 mm length
100 8.5 336 6.25
1.2 SS 200 1.2 Screws of 20 mm length
200 7.5 126 5.51
1.2 SS 100 1.2 Screws of 20 mm length
100 5.5 173 4.04
0.7 Control 0.7 Control - 1 120 0.74 0.7 U 200 0.7 U-cold formed 200 5.5 271 3.37 0.7 C 200 0.7 C-cold formed 200 4 171 2.94 0.7 LS 200 0.7 Screws of 40 mm
length 200 3 111 2.21
0.7 SS 200 0.7 Screws of 20 mm length
200 3.75 545 2.76
Table 3. Flexural specimens test results
Specimen ID Maximum load (ton)
Average def. at mid-point at max. load, (mm)
Strain at max. load
Slip at max. load, mm
Longitudinal shear strength (tb) (kg/cm²)
1.2 Control 4.57 2.06 6.10E-04 0.34 3.5 1.2 U 200 5.56 6.76 1.38E-03 0.98 4.26 1.2 U 100 6.68 4.76 7.80E-04 0.21 5.12 1.2 C 100 4.7 8.84 6.73E-04 0.87 3.6 1.2 LS 200 5.54 41.09 4.83E-03 3.37 4.24 1.2 SS 200 5.63 3.21 8.88E-04 0.13 4.31 1.2 SS 100 5.68 12.86 2.89E-03 1.01 4.35 0.7 Control 3 2.56 3.75E-04 0.24 2.3 0.7 U 200 3.77 2.94 8.17E-04 0.11 2.89 0.7 LS 200 3.75 14.04 1.84E-03 2.58 2.87 0.7 SS 200 3.75 18.85 1.49E-03 2.68 2.87

El-Sayed et al.; AIR, 5(3): 1-12, 2015; Article no.AIR.18847
8
the load dropped drastically with a major crack occurred in the concrete below the acted line loads. Failure in this manner is classified as brittle. Such failure which is known as shear bond failure is principally occurred due to the large slippage between the steel sheeting and the concrete.
The two compared specimens were enhanced by using self-drilling screws with 40 mm length and 200 mm spacing as shear connectors. It is shown that ultimate load for the specimen with profiled steel sheeting with thickness of 1.2 mm is increased by 47.73% than that of the specimen with profiled steel sheeting with thickness of 0.7 mm. The failure mode of the tested specimens has been improved from brittle to ductile type where the failure was delayed.
The two compared specimens were enhanced by using self-drilling screws with 20 mm length and 200 mm spacing as shear connectors. It is shown that ultimate load for the specimen with profiled steel sheeting with thickness of 1.2 mm is increased by 50.13% than that of the specimen with profiled steel sheeting with thickness of 0.7 mm. Also using 20 mm length self-drilling screws as shear connectors improved the failure mode of the tested specimens, specially the specimen with 0.7 mm steel sheeting (0.7 SS 200), where a ductile behavior were observed.
The two compared specimens were enhanced by using horizontal channel (U) with 200 mm spacing as shear connectors. It is shown that ultimate load for the specimen with profiled steel sheeting with thickness of 1.2 mm is increased
by 47.48% than that of the specimen with profiled steel sheeting with thickness of 0.7 mm. Also using horizontal channel (U) as shear connectors improved the failure mode of the tested specimens where a ductile behavior was observed. 3.4 Effect of Shear Connector Type The effect of shear connector type for specimens with steel sheeting thickness of 0.7 mm and enhanced with shear connectors 200 mm spacing is shown in Fig. 9. It is shown that the ultimate load of the specimens with short screws (SS) or long screws (LS) increased by 25% than that of the control specimen which was not enhanced with any shear connector, so the length of screw does not affect the ultimate load value of the tested specimen. The ultimate load of specimen with horizontal channel (U) increased by 25.7% than that of the control specimen. The experimental results show also that the specimen with self-drilling screws is more ductile than the control specimen and the specimen enhanced with horizontal channels (U). The effect of shear connector type is not clear in case of 200 mm spacing. The specimens with long screws are more ductile than the specimens with other types of shear connectors. The length of self-drilling screws has not a clear effect on the ultimate load of the tested specimens. Also the results revealed that the ductility of the tested specimens was not affected by the length of the screws, where using long length or short length led to increase the ductility of the tested specimens.
Fig. 9. Load-deflection curves for specimens (0.7 U 200),(0.7 SS 200), (0.7 LS 200) and (0.7 control)

El-Sayed et al.; AIR, 5(3): 1-12, 2015; Article no.AIR.18847
9
The effect of shear connector type on the mechanical behavior of the tested specimens with the same steel sheeting thickness of 1.2 mm thickness and enhanced with shear connectors of 100 mm spacing is shown in Fig. 10. It is shown that the ultimate load of the specimen enhanced with short screws (SS) increased by 24.3% than the control specimen. However, the ultimate load of the specimen with vertical channels (C) and horizontal channels (U) increased by 2.8% and 46.2%, respectively, than the control specimen. The experimental results show also that the specimens with self-drilling screws and vertical channels (C) are more ductile than the control specimen and the specimen enhanced with horizontal channels (U). The effect of shear connector type on the ultimate load is very clear in case of steel sheeting of 1.2 mm thickness with shear connectors 100 mm spacing, in this case the horizontal channels was the best type. The specimens with short screws are more ductile than the specimens with other types of shear connectors. The experimental results revealed that the orientation of channels used as shear connectors is very important variable, where its effect on the ultimate load of the tested specimens was very strong, using horizontal
channel in place of vertical ones led to increase the ultimate load by 42.1%.
The effect of shear connector type on the mechanical behavior of the tested specimens with the same steel sheeting of 1.2 mm thickness and enhanced with shear connectors 200 mm spacing is shown in Fig. 11. It is shown that the ultimate load of the specimen enhanced with short screws (SS) increased by 23.2% than the control specimen. However, the ultimate load of the specimen with long screws (LS) increased by 21.2% than the control specimen, and the ultimate load of the specimen with horizontal channels (U) increased by 21.7% than the control specimen. The experimental results show also that the specimen with long screws is more ductile than the control specimen and the specimen enhanced with horizontal channels (U) and short screws (SS).
The length of self-drilling screws has not a clear effect on the ultimate load of the tested specimens. However, the results revealed that the ductility of the tested specimens was affected by the screws length where using long length in place of short length led to increase the ductility of the tested specimens.
Fig. 10. Load-deflection curves for specimens (1.2 U 100), (1.2 SS 100), (1.2 C 100) and (1.2 Control)
Fig. 11. Load-deflection curves for specimens (1.2 U 200), (1.2 LS 200), (1.2 SS 200) and (1.2 control)
El-Sayed et al.; AIR, 5(3): 1-12, 2015; Article no.AIR.18847
10
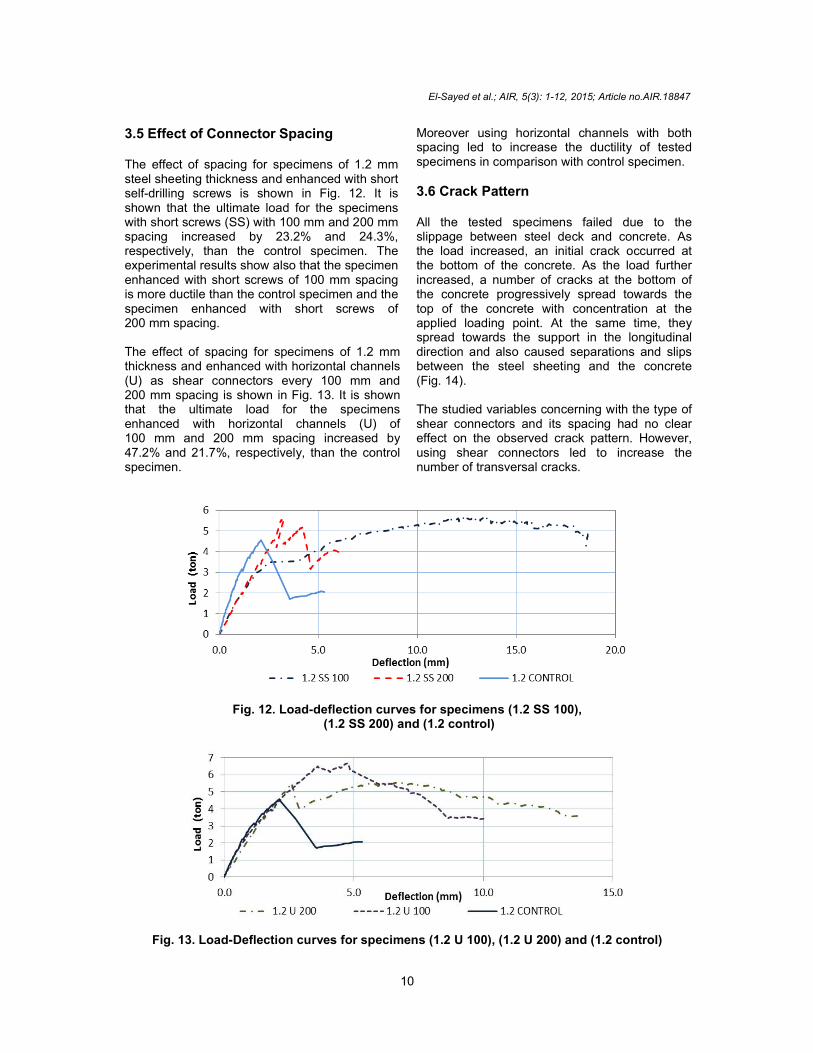
3.5 Effect of Connector Spacing The effect of spacing for specimens of 1.2 mm steel sheeting thickness and enhanced with short self-drilling screws is shown in Fig. 12. It is shown that the ultimate load for the specimens with short screws (SS) with 100 mm and 200 mm spacing increased by 23.2% and 24.3%, respectively, than the control specimen. The experimental results show also that the specimen enhanced with short screws of 100 mm spacing is more ductile than the control specimen and the specimen enhanced with short screws of 200 mm spacing. The effect of spacing for specimens of 1.2 mm thickness and enhanced with horizontal channels (U) as shear connectors every 100 mm and 200 mm spacing is shown in Fig. 13. It is shown that the ultimate load for the specimens enhanced with horizontal channels (U) of 100 mm and 200 mm spacing increased by 47.2% and 21.7%, respectively, than the control specimen.
Moreover using horizontal channels with both spacing led to increase the ductility of tested specimens in comparison with control specimen.
3.6 Crack Pattern All the tested specimens failed due to the slippage between steel deck and concrete. As the load increased, an initial crack occurred at the bottom of the concrete. As the load further increased, a number of cracks at the bottom of the concrete progressively spread towards the top of the concrete with concentration at the applied loading point. At the same time, they spread towards the support in the longitudinal direction and also caused separations and slips between the steel sheeting and the concrete (Fig. 14). The studied variables concerning with the type of shear connectors and its spacing had no clear effect on the observed crack pattern. However, using shear connectors led to increase the number of transversal cracks.
Fig. 12. Load-deflection curves for specimens (1.2 SS 100), (1.2 SS 200) and (1.2 control)
Fig. 13. Load-Deflection curves for specimens (1.2 U 100), (1.2 U 200) and (1.2 control)

El-Sayed et al.; AIR, 5(3): 1-12, 2015; Article no.AIR.18847
11
Fig. 14. Crack pattern for tested specimen (0.7 LS 200)
Table 4. Loads measured at yielding of steel sheets
Specimen ID
Experimental Load corresponding to yield strain Py (ton)
Experimental Ultimate load Pult (ton)
Pult/ Py
1.2 Control NA 4.57 NA 1.2 U 200 5.36 5.56 1.04 1.2 U 100 3.46 6.68 1.93 1.2 C 100 NA 4.7 NA 1.2 LS 200 3.31 5.54 1.67 1.2 SS 200 3.56 5.63 1.58 1.2 SS 100 4.06 5.68 1.40 0.7 Control NA 3 NA 0.7 U 200 3.69 3.77 1.02 0.7 LS 200 3.27 3.75 1.15 0.7 SS 200 3.5 3.75 1.07
Table 5. Ratio of longitudinal shear strength from push out test to the corresponding from
bending test
Specimen ID tPo/tB 0.7 Control 0.32 0.7 SS 200 0.96 0.7 LS 200 0.77 0.7 U 200 1.17 1.2 Control 0.74 1.2 SS 100 0.93 1.2 SS 200 1.28 1.2 U 100 1.22 1.2 U 200 1.58 1.2 C 100 1.47 1.2 LS 200 1.13 Mean= 1.05 Standard deviation= 0.36
3.7 Strain Gage Result
It was not possible to observe yielding during the test. For yielding measurement it was assumed that the steel decks began to yield at the strain, ɛy = fy / Es, where the steel deck yield stress (fy) is taken equal to 2.4 t/cm2 (according to the manufacture), and the modulus of elasticity (Es) is taken equal to 2100 t/cm². Therefore, the load corresponding to yield strain (Py) was obtained
from the Load-Strain plots. Above Table 4 presents the values of yield load and ultimate load for all tested specimens. As shown in Table 4. the steel deck for all specimens have reached the yield except the control specimens of 0.7 mm and 1.2 mm thickness and also, the specimen enhanced with vertical channel (C) of 100 mm spacing.
3.8 Longitudinal Shear Stress Comparison
The longitudinal shear strength deduced from push out test results was compared with the corresponding one deduced from bending test results. Above Table 5 shows the comparison between the results of push out test and flexural test. The mean for the ratio of push out test strength to bending test strength is 1.05 with standard deviation 0.36, which indicates that the bending test results are in good agreement with the push out values for the specimens. The comparison reveals good agreement between the ratio of push out test strength to bending test strength for tested specimens enhanced with self-drilling screws with steel sheet thickness of 0.7 mm and 1.2 mm, and enhanced with self-drilling screws of different length (20 mm & 40 mm) and different spacing (100 mm & 200 mm).
El-Sayed et al.; AIR, 5(3): 1-12, 2015; Article no.AIR.18847
12
4. CONCLUSION
From the present investigation, the conclusions can be deduced as follows:
1. The failure mode of composite slab can be improved from brittle to ductile, the load carrying capacity and the horizontal shear strength can be increased by installing shear connectors at the steel-concrete interface.
2. The steel deck thickness directly affected the ultimate load of the tested specimens.
3. The specimens with long screws are more ductile than the specimens with other types of shear connectors.
4. The effect of spacing between shear connectors was obvious in case of horizontal channels (U) where using spacing of 100 mm led to increase the ultimate load by 20.1% in comparison with specimens of 200 mm spacing.
5. The ultimate load has not been affected by changing the spacing between shear connectors in case of short self-drilling screws. However, the spacing between short self-drilling screws affected the ductility of the tested specimens which behaved more ductile as the spacing deceased.
6. The orientation of channels used as shear connectors is very important variable, where its effect on the ultimate load of the tested specimens was very strong.
7. The length of self-drilling screw has not a clear effect on the ultimate load of the tested specimens of 0.7 mm and 1.2 mm steel sheet thickness. However, the results revealed that the ductility of the tested specimens of 1.2 mm steel sheet thickness was affected by the screws length.
8. The steel deck for all specimens have reached the yield except the control specimens of 0.7 mm and 1.2 mm thickness and also the specimen enhanced with vertical channel (C) of 100 mm spacing.
9. The bending test results are in good agreement with the push out values
especially for the specimens enhanced with cold formed channels sections (C & U) as shear connectors.
COMPETING INTERESTS
Authors have declared that no competing interests exist.
REFERENCES
1. EN 1994-1-1. Eurocode 4, Design of composite steel and concrete structures. Part 1.1: general rules and rules for buildings. Brussels: European Committee for Standardization; 2004.
2. Redzuan Abdullah. Experimental evaluation and analytical modeling of shear bond in composite slabs. Phd Dissertation, Virginia Polytechnic Institute and State University, Blacksburg, Virginia; 2004.
3. ASTM A653 Standard specification for steel sheet, zinc-coated (galvanized) or zinc-iron alloy coated by the hot-dip process. Pennsylvania: ASTM International; 2008.
4. Andrade, et al. Standardized composite slab systems for building constructions. Journal of Constructional Steel Research. 2004;60:493–524.
5. Daniel Yu Chuan, Abdullah, Redzuan Bakar, Khairul Bariyah. Behaviour and load bearing capacity of composite slab enhanced with shear screws. Malaysian Journal of Civil Engineering. 2008;20(2): 284-294. ISSN 1823-7843.
6. Egyptian code of practice ECP203-2007. Egyptian Code for Design and Construction of Concrete Structures, Ministry of Building Construction, Research Center for Housing, Building and Physical Planning, Cairo, Egypt; 2007.
7. Youn-Ju Jeong, Hyeong-Yeol Kim, Hyun-Bon Koo. Longitudinal shear resistance of steel–concrete composite slabs with perfobond shear connectors. Journal of Constructional Steel Research.2009; 65:81–88.
_________________________________________________________________________________ © 2015 El-Sayed et al.; This is an Open Access article distributed under the terms of the Creative Commons Attribution License (http://creativecommons.org/licenses/by/4.0), which permits unrestricted use, distribution, and reproduction in any medium, provided the original work is properly cited.
Peer-review history: The peer review history for this paper can be accessed here:
http://sciencedomain.org/review-history/9958