flight behaviour of birds around a solitary wind turbine
TRANSCRIPT
1 /35
Flight behaviour of birds around a solitary wind turbine in a Swiss alpine valley
Master thesis
Faculty of Science, University of Bern
handed in by
Sandro Wanner
2017
Supervisor
Prof. Dr. R. Arlettaz
2 /35
Flight behaviour of birds around a solitary wind turbine in a
Swiss alpine valley
Sandro Wanner [1, 2]
, Janine Aschwanden [2]
, Felix Liechti [2]
, Raphael Arlettaz [1, 2]
Abstract
1. As the number of wind turbines in operation is rising, it becomes ever clearer that
wind turbines can have adverse effects on birds, and that research in this area is
needed. What is consistent throughout previous studies is that flight behaviour is
investigated but usually not linked to weather conditions such as wind speed or wind
speed variability. Additionally, flight behaviour is usually assessed using visual
estimations.
2. We investigated bird flight behaviour around a solitary wind turbine in the Swiss Alps
using a laser rangefinder to obtain data on bird flight behaviour in three dimensions.
Species identity of birds was assessed visually and environmental data was provided
by Callandawind AG. To analyse bird flight behaviour and the effect of wind
conditions on bird flight, we used GLMMs. Data were analysed stepwise by including
more and more data of an increasing spatial scale (radius) around the wind turbine.
3. Birds avoided approaching the nacelle of the wind turbine closer than 100 m although
they do not avoid crossing anthropogenic areas including the wind turbine in general.
This is a sign of macro-avoidance.
4. The effects of wind speed, wind speed variability and rotor speed on approaching
distances depend on the spatial scale of data included in the analyses.
5. We found that birds get generally closer to the wind turbine with increasing wind
speed. This effect gets weaker when more and more distant data are included into
the analysis. It seems that birds passively allow wind current to carry them closer to
the wind turbine when wind speed is high. However, in a close radius (< 150 m), there
3 /35
is an indication of an opposite effect: Approaching distances increased with
increasing wind speed variability and increasing speed of the rotor of the wind
turbine. This might show that close to the wind turbine birds actively keep distance
when wind is turbulent and rotor speed is high. But further away, approaching
distances decreased with increasing wind speed variability/rotor speed which is again
a sign for passive wind drift.
6. Synthesis and applications. In conclusion, we found evidence that birds do show
macro-avoidance around a wind turbine. The closest approaching distance is
depending on wind speed, wind speed variability and rotor speed in combination with
the spatial scale. This stresses the need for more studies linking bird flight behaviour
to weather conditions but also the need for weather-dependent mitigation measures,
such as curtailments. We also propose that laser range finders could be used serially
in assessing bird flight behaviour, especially in the context of studying the
environmental impact of wind turbines.
Keywords: bird flight behaviour, laser range finder, macro-avoidance, micro-avoidance,
wind energy impact on birds, wind turbine, wind turbine curtailments.
Introduction
Electricity production through wind energy use is associated with less carbon dioxide
production than fossil electricity production and is thus ecologically preferable (Huntley et al.
2006). Combined with economically interesting developments and widespread governmental
approval wind energy use has seen a rapid increase in production in recent years in 83
countries all over the world (Islam, Mekhilef & Saidur 2013). The number of wind farms and
solitary wind turbines is increasing fast. Although reducing carbon dioxide production, an
1 Conservation Biology Divison, Institute of Ecology and Evolution, University of Berne, Bern
2 Swiss Ornithological Insitute, Sempach
4 /35
thus carbon dioxide related impacts on birds , wind turbines have a negative impact on birds
offshore (Drewitt & Langston 2006; Hüppop et al. 2006), as well as onshore (de Lucas, Janss
& Ferrer 2005; de Lucas et al. 2012; Douglas et al. 2012). Apart from indirect hazards like
habitat loss, habitat fragmentation and acoustic intrusions (Leddy, Higgins & Naugle 1999;
Larsen & Guillemette 2007; Devereux, Denny & Whittingham 2008; Carrete et al. 2009;
Pruett, Patten & Wolfe 2009; Plonczkier & Simms 2012) direct effects such as fatal collisions
with wind turbines have been shown repeatedly (Hoover & Morrison 2005; Hüppop et al.
2006; Drewitt & Langston 2008; Douglas et al. 2012; Bellebaum et al. 2013; Loss, Will &
Marra 2013), but see (Stewart, Pullin & Coles 2007). While wind turbines and wind farms are
likely to differ strongly regarding their threat to birds (Osborn et al. 1998; Barrios & Rodriguez
2004; de Lucas, Janss & Ferrer 2004; Garthe & Hüppop 2004; Chamberlain et al. 2006;
Barclay, Baerwald & Gruver 2007; Pearce-Higgins et al. 2009; Johnston, Bradley & Otter
2014; Olea & Mateo-Tomás 2014) bird species differ in their susceptibility to wind turbine
related fatal collisions (Smallwood, Rugge & Morrison 2009; Winder et al. 2014) as well.
Fatal bird collisions, but also habitat loss (Farfán et al. 2009; Martínez et al. 2010; Dahl et al.
2012) , are especially problematic for long living species such as most raptors and other
large birds (Barrios & Rodriguez 2004; Carrete et al. 2009; García-Ripollés & López-López
2011; Garvin et al. 2011; Dahl et al. 2012; de Lucas et al. 2012; López-López, Sarà & Di
Vittorio 2012; Martínez-Abraín et al. 2012; Rushworth & Krüger 2014). Since studies have
shown that there is a large discrepancy between pre-construction assessments and actual
post-construction fatal collision rates (de Lucas et al. 2008; Carrete et al. 2012; Ferrer et al.
2012) it is important to investigate bird flight behaviour in the vicinity of wind turbines (Kunz
et al. 2007) and to develop methods to prevent birds from colliding with wind turbines
(Elphick 2008), especially as considerably few studies have investigated bird flight behaviour
changes linked to weather conditions such as visibility, temperature or wind conditions
(Marques et al. 2014), but there are studies that show an impact of wind speed on bird flight
behaviour around wind turbines (Barrios & Rodriguez 2004; Garvin et al. 2011).Of those,
even fewer, such as Garvin et al. (2011), analysed on what spatial scale wind speed had an
5 /35
effect on bird flight behaviour. To investigate the effect of wind turbines on the flight
behaviour of birds a reliable determination of flight trajectories of birds in three dimensions is
essential. In most studies performing environmental impact assessments bird flight behaviour
is only estimated visually without any measurement equipment. However, a qualitative
comparison of flight heights estimated by visual observers with flight heights measured using
a three dimensional tracking-radar showed that the visual estimation of flight heights is highly
prone to false estimations with increasing height and distance of a bird (Swiss Ornithological
Institute, unpublished). While there are different methods to protect birds from collisions such
as visual markings on wind turbines, acoustic signals and turbine shutdown, visual
approaches are likely to be ineffective to reduce fatal collisions (Drewitt & Langston 2008;
Martin & Shaw 2010) and repeated acoustic warning signals are likely to lead to habituation
(Drewitt & Langston 2008). On the other hand, wind turbine shutdown based on direct visual
observations conducted by humans to detect birds approaching a wind turbine has proved to
be an effective way to reduce bird mortality within wind farms (de Lucas et al. 2012). But
these observations are time intensive and economically not realistic.
In this study we recorded flight behaviour of birds in the surroundings of a solitary wind
turbine in a Swiss alpine valley using a military laser rangefinder to measure the three-
dimensional position of birds in the airspace. Based on the data we investigated whether
birds are actively avoiding close proximity of the wind turbine, what effect wind related
environmental factors have on this, possibly active, avoidance behaviour and on what spatial
scale those factors play a role.
Material and Methods
Study site
Our study site was located in the Chur Rhine Valley in Haldenstein, Switzerland, around the
solitary wind turbine “Calandawind” (Vestas V-112-3.0 MW, nave height 119 m, rotor radius

6 /35
56m) of Calandawind AG. Data collection occurred in an area within 1 km radius around the
wind turbine.
Study species
In our study we focused on midsized to large soaring birds because these are most sensitive
to wind turbines due to their flight behaviour and often slow reproduction cycle. Furthermore,
our measurement method cannot be applied to small birds (see below). The main species or
species groups in our study, in order of descending abundance, were Corvids (Corvus corax,
Linnaeus, 1758; Corvus frugilegus, Linnaeus, 1758; and Corvus corone, Linnaeus, 1758),
Buzzards (Buteo buteo, Linnaeus, 1758 and Pernis apivorus Linnaeus, 1758), Common
Kestrels (Falco tinnunculus, Linnaeus, 1758), Red Kites (Milvus milvus, Linnaeus, 1758),
Golden Eagles (Aquila chrysaetos, Linnaeus, 1758), Hawks (Accipiter gentilis, Linnaeus,
1758), Sparrow Hawks (Accipiter nisus, Linnaeus, 1758) and Black Kites (Milvus migrans,
Boddaert, 1783). All other observed species were pooled together into the category “others”.
Data collection
Data supplied by Calandawind AG, Haldenstein
Calandawind AG provided us with data, recorded by sensors integrated into the wind turbine,
on wind speed, wind speed standard deviation, as a measure of wind speed variability, wind
direction and wind turbine rotor speed, all measured over 10 minutes intervals for the entire
study period.
Manual data collection Bird flight trajectories were recorded in times of no precipitation from mid-August to October
2014 using laser powered rangefinder binoculars (Vector 21 Aero, Vectronix, (Desholm et al.
2006; Aschwanden, Wanner & Liechti 2015). Small objects (for example birds smaller than a
trush) cannot easily be measured using the Vector Aero 21 because it is difficult to strike a
7 /35
small object with the laser beam properly. Vector 21 Aero records and saves time, azimuth,
elevation angle and distance to the observer. For statistical analysis and graphical display,
data from Vector 21 Aero were converted to global positioning system (GPS) coordinates
and synchronised to a satellite map of the Haldenstein area using software developed by the
Swiss Ornithological Institute. For every bird sighting species identity was recorded by the
observer.
Analysis
General remarks
For model selection in statistical analyses we included the factors that made sense from a
biological point of view (Zuur et al. 2009). Where necessary we obtained p-values using
Markov-Chain-Monte-Carlo simulations and all significance tests use α = 0.05. We therefore
considered p-values < 0.05 as statistically significant and 0.05 < p-value < 0.1 as a trend
towards statistical significance. All analyses were carried out using R, version 3.2.2 (R
Development Core Team 2013).
Flight trajectories, closest points and direction change
To analyse bird flight behaviour for every observed bird we compiled individual position
measurements into a flight trajectory, assuming straight flight between two position
measurements. For analysis we only included flight trajectories with at least two position
measurements and calculated the point where the flight trajectory came closest to the wind
turbine (closest point) for each flight trajectory. For trajectories consisting of three or more
position measurements, where the position measured closest to the wind turbine was neither
the first nor the last measurement of a track, we calculated whether birds turned towards the
wind turbine or away from the wind turbine when they were at the position measured closest
to the wind turbine (direction change). To investigate that effect we calculated the difference
between the approaching angle from the position measurement before the closest position
8 /35
measurement to the closest position measurement and the leaving angle from the closest
position measurement to the next position measurement.
Relative detection probability
To analyse whether flight trajectories were evenly distributed within the study site we had to
define the detection probability first. We computed the distribution of distance to the observer
for all closest points and approximated the density distribution using a lognormal function.
This density distribution represents the relative detection probability in relation to the distance
to the observer, assuming detection probability decreases with increasing distance to the
observer.
GIS site mapping and habitat association
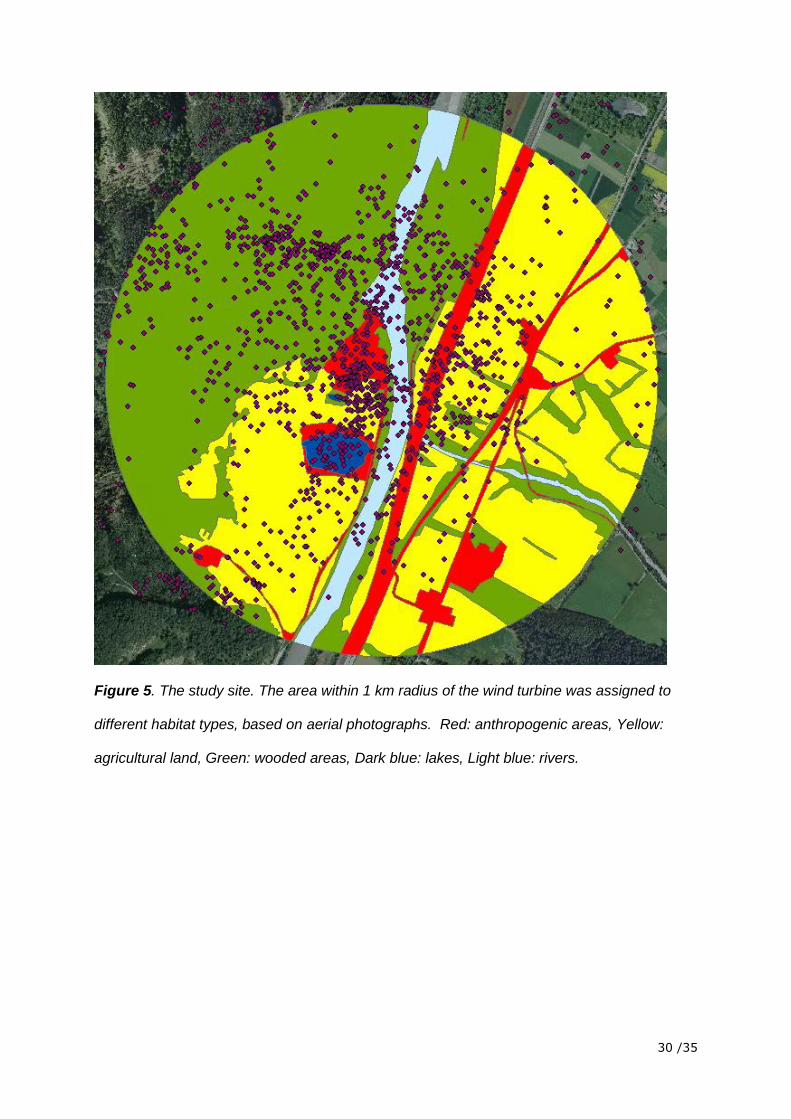
To investigate whether birds prefer to fly over certain types of habitat we used the
geographical information system (GIS) program ArcGIS to define the habitat within a 1 km
radius around the wind turbine. Based on aerial photographs we distinguished between
wooded areas, agricultural areas, lakes, rivers and anthropogenic areas (roads, building,
railway tracks and the wind turbine). We used a Chi2-test to test whether the position
measurements over a given habitat are distributed randomly according to that habitats
proportion within the 1 km radius around the turbine. Pearson residuals (P) of 2 < P < -2
were regarded as contributing extraordinarily to the violation of the assumption of
randomness. We also incorporated the relative detection probability by weighing each
measured position according to its relative detection probability.
Closest point and direction change modelling
We not only wanted to analyse what environmental factors determine how close birds fly to
the wind turbine but also within which distance to the wind turbine those factors have a
significant effect. We used closest point as our response variable and calculated three
9 /35
models (1) with wind speed (m/s, continuous, scaled) and wind direction (binomial), (2) with
wind speed standard deviation (m/s, scaled) and wind direction (binomial), (3) with rotor
speed (m/s, continuous, scaled) and wind direction (binomial) as explanatory variables,
respectively. We incorporated Julian day (d, discrete, scaled), time (min, continuous, scaled)
and species identity as random factors and performed a linear mixed model.
Secondly, we were interested in what environmental factors influence whether direction
changes close to a wind turbine lead birds closer to a wind turbine or further away from it.
Direction Change was used as response variable in three different models (1) with wind
speed (m/s, continuous, scaled)and wind direction (binomial), (2) wind speed standard
deviation (m/s, continuous, scaled) and wind direction (binomial), (3) with rotor speed (m/s,
continuous, scaled) and wind direction (binomial) as explanatory variables, respectively. We
incorporated Julian day (d, discrete, scaled) and species identity as random factors and
performed a generalised linear mixed model using a binomial distribution. Time was not
included as random factor because if included the models failed to converge due to the
sample size which was smaller than in the analysis of the closest point.
The fixed factors were chosen based on findings of previous studies (Barrios & Rodriguez
2004) and the possibility to use them to predict effective curtailments. In order to address the
question about the distance within which factors have a significant effect, we repeated each
model 40 times with different radii. The first model contained just data from the first 25
meters around the wind turbine and every further model contained data from 25 meters
more, up to model 40 which contained data from the entire 1 km radius. For every model we
reported mean and standard errors of the effect estimates, the significance level, marginal R2
(proportion of the variability explained by the fixed effects), conditional R2 (proportion of the
variability explained by the fixed and random effects) and the number of observations
included.
10 /35
Results
Flight height, relative detection probability and observation density
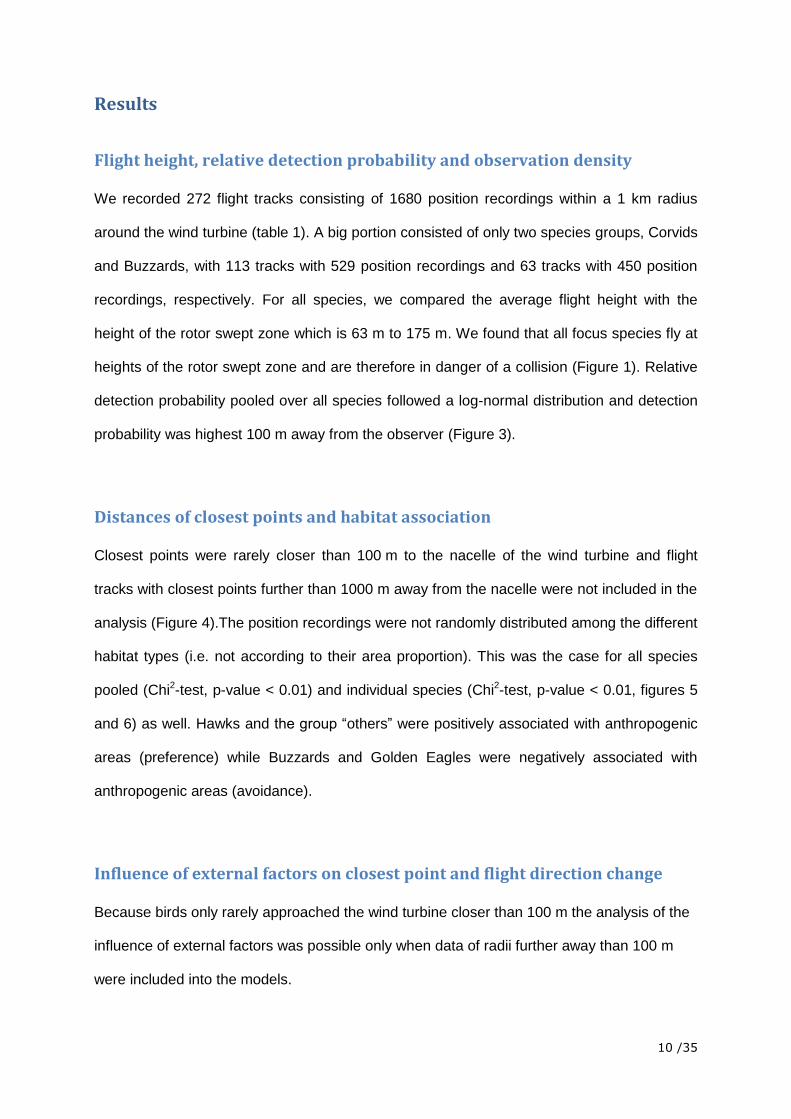
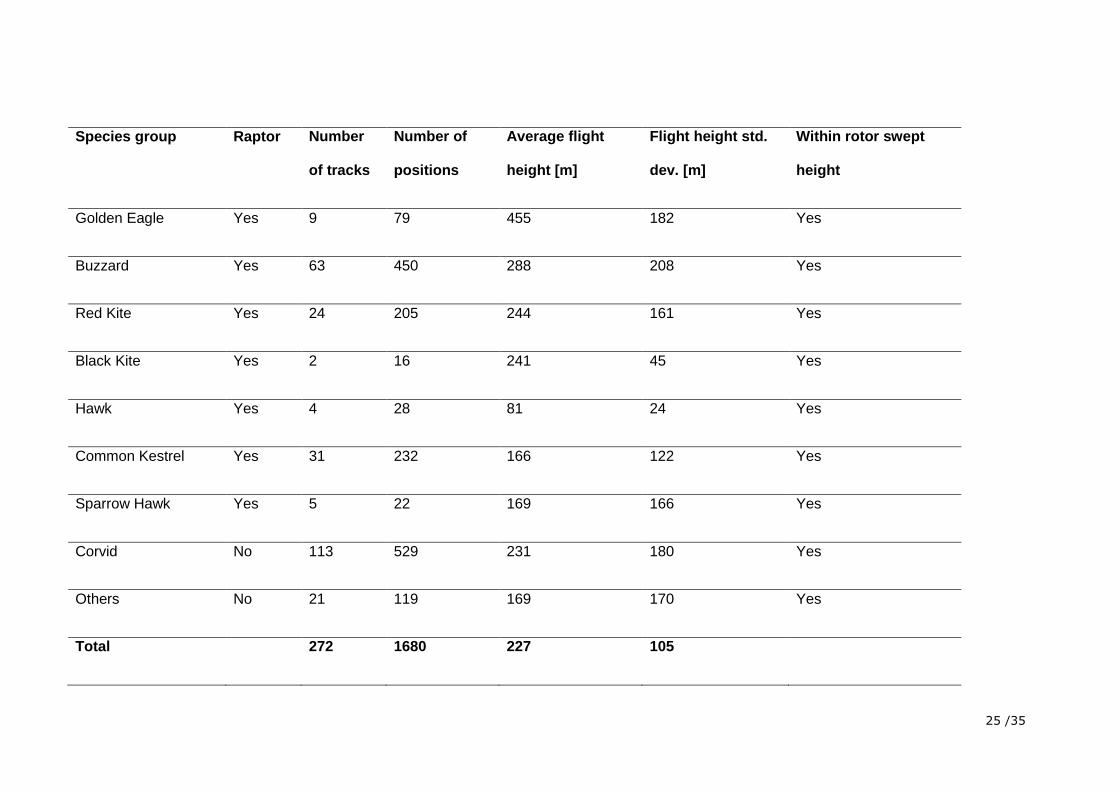
We recorded 272 flight tracks consisting of 1680 position recordings within a 1 km radius
around the wind turbine (table 1). A big portion consisted of only two species groups, Corvids
and Buzzards, with 113 tracks with 529 position recordings and 63 tracks with 450 position
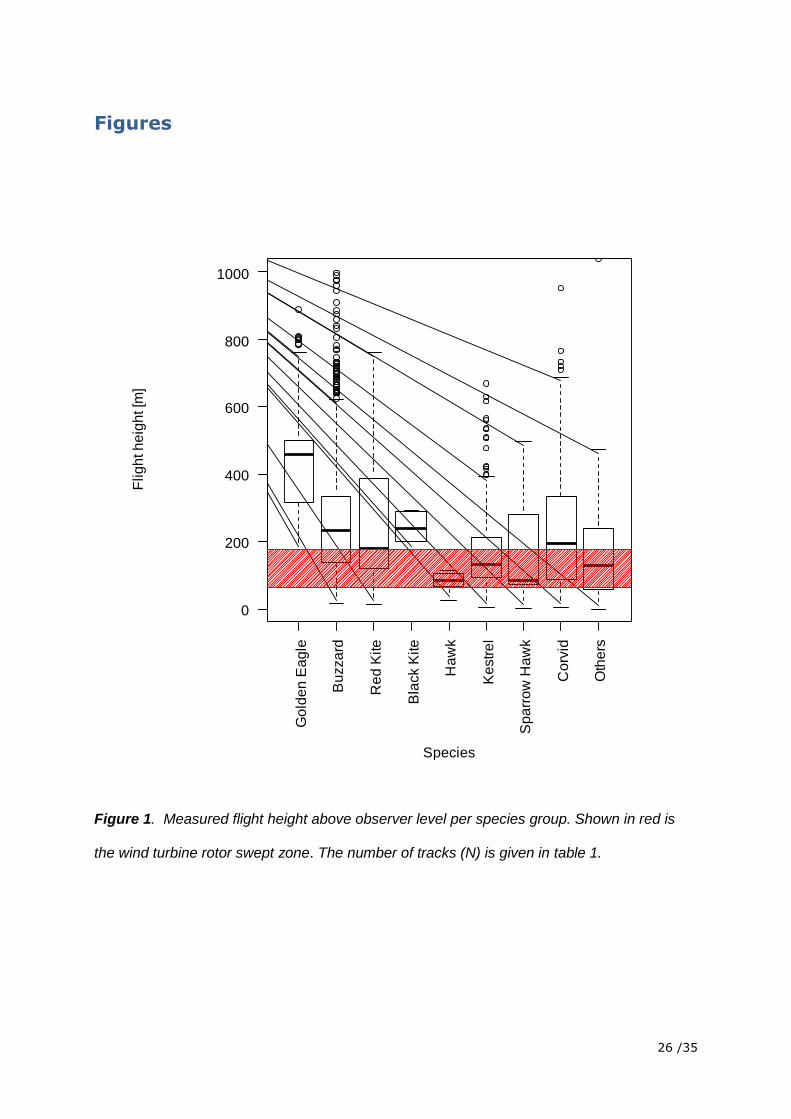
recordings, respectively. For all species, we compared the average flight height with the
height of the rotor swept zone which is 63 m to 175 m. We found that all focus species fly at
heights of the rotor swept zone and are therefore in danger of a collision (Figure 1). Relative
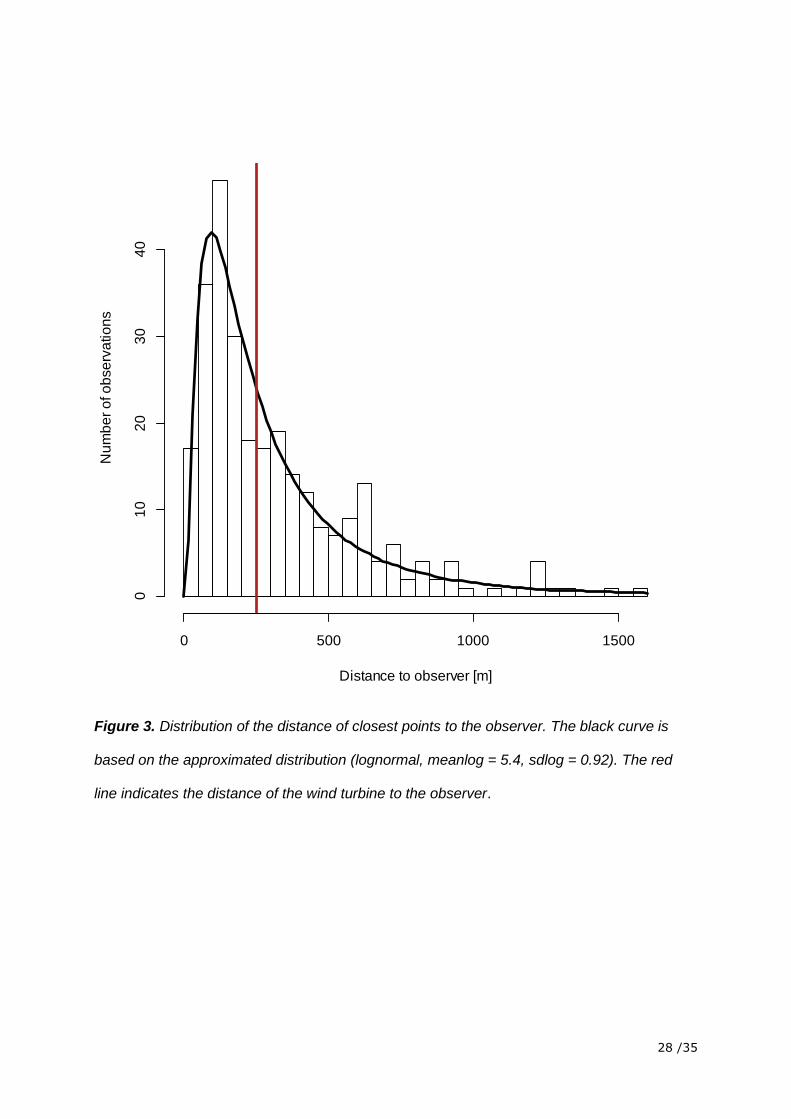
detection probability pooled over all species followed a log-normal distribution and detection
probability was highest 100 m away from the observer (Figure 3).
Distances of closest points and habitat association
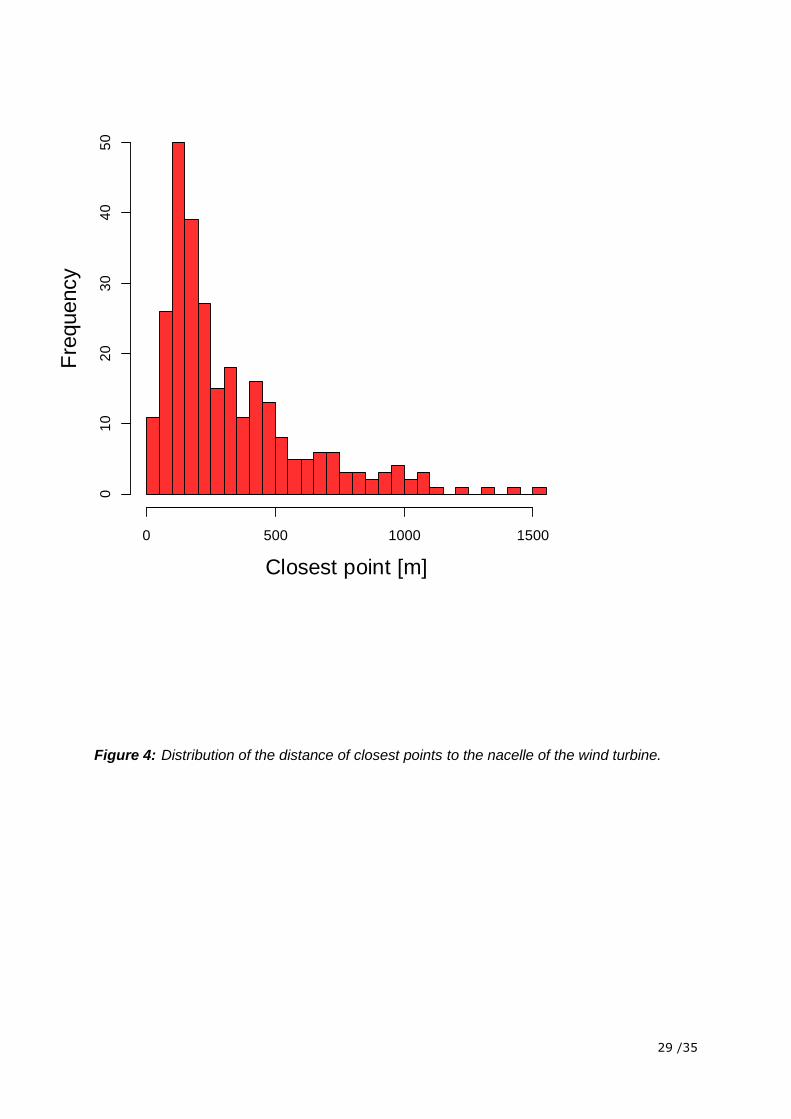
Closest points were rarely closer than 100 m to the nacelle of the wind turbine and flight
tracks with closest points further than 1000 m away from the nacelle were not included in the
analysis (Figure 4).The position recordings were not randomly distributed among the different
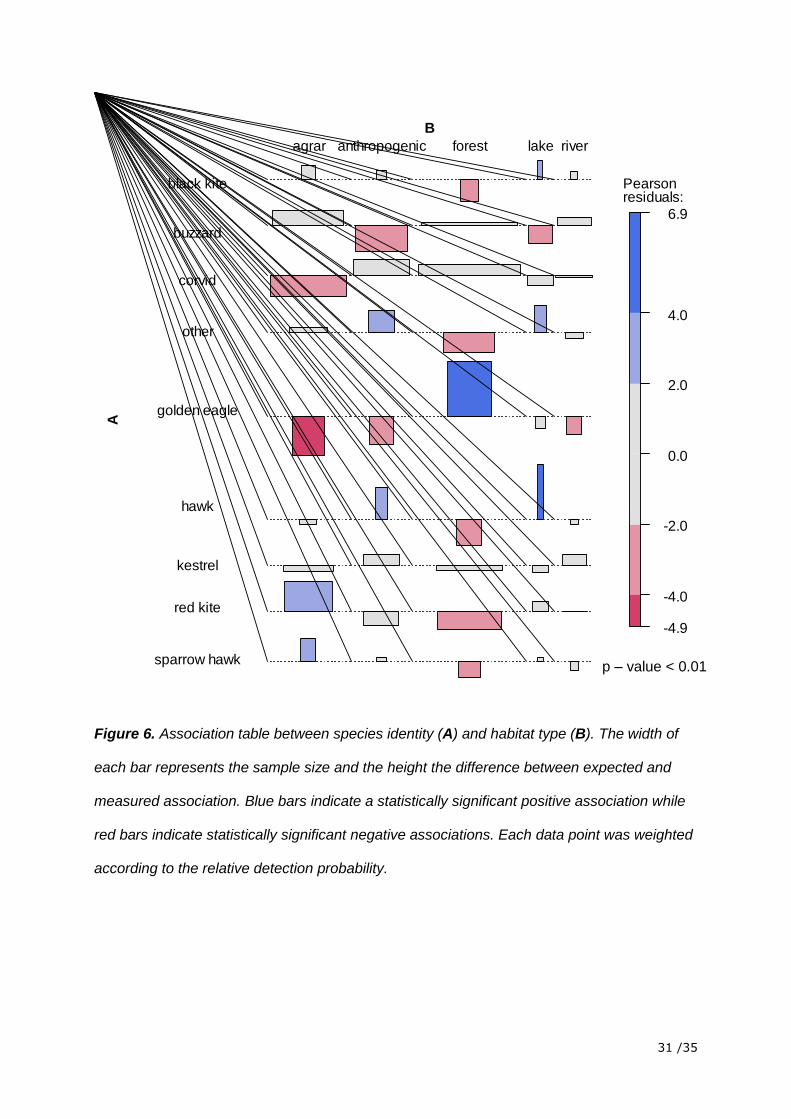
habitat types (i.e. not according to their area proportion). This was the case for all species
pooled (Chi2-test, p-value < 0.01) and individual species (Chi2-test, p-value < 0.01, figures 5
and 6) as well. Hawks and the group “others” were positively associated with anthropogenic
areas (preference) while Buzzards and Golden Eagles were negatively associated with
anthropogenic areas (avoidance).
Influence of external factors on closest point and flight direction change
Because birds only rarely approached the wind turbine closer than 100 m the analysis of the
influence of external factors was possible only when data of radii further away than 100 m
were included into the models.
11 /35
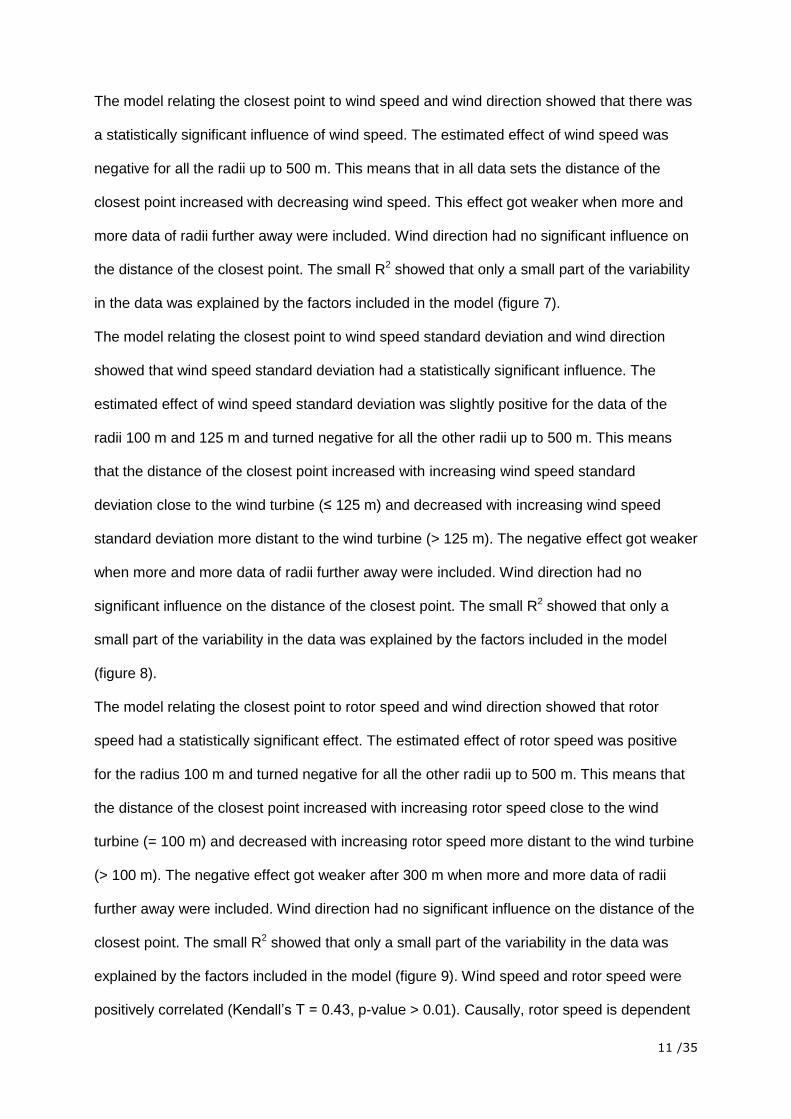
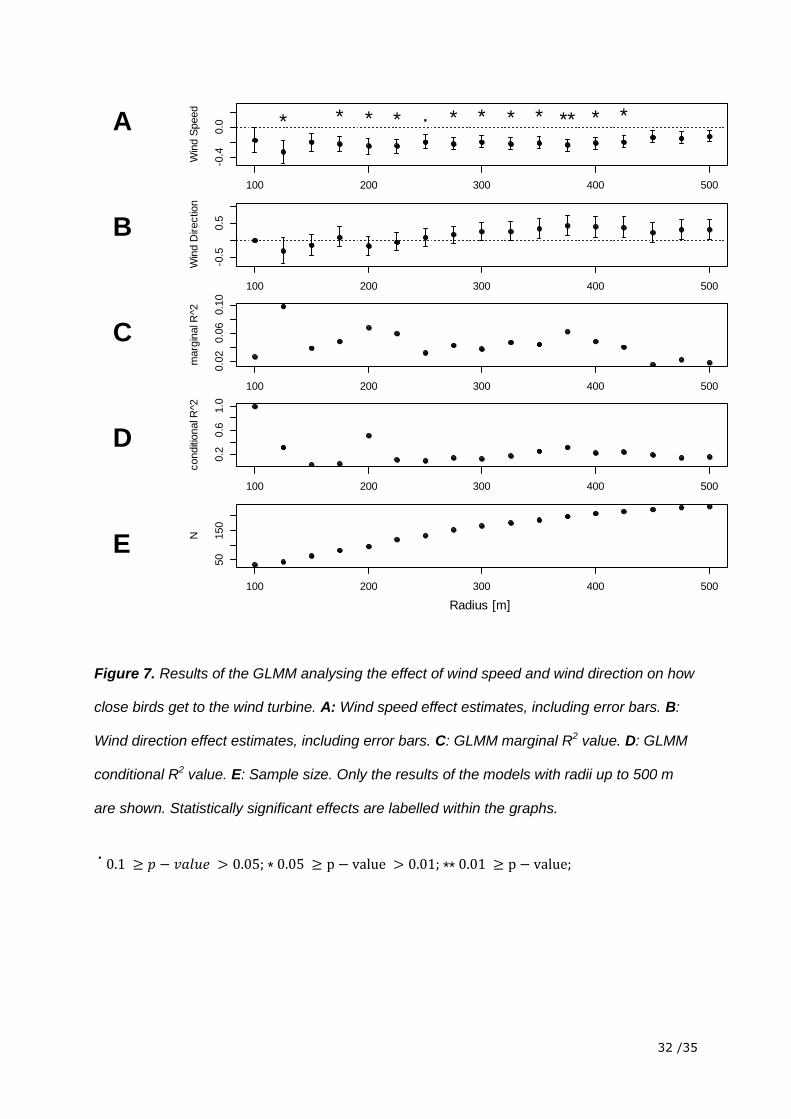
The model relating the closest point to wind speed and wind direction showed that there was
a statistically significant influence of wind speed. The estimated effect of wind speed was
negative for all the radii up to 500 m. This means that in all data sets the distance of the
closest point increased with decreasing wind speed. This effect got weaker when more and
more data of radii further away were included. Wind direction had no significant influence on
the distance of the closest point. The small R2 showed that only a small part of the variability
in the data was explained by the factors included in the model (figure 7).
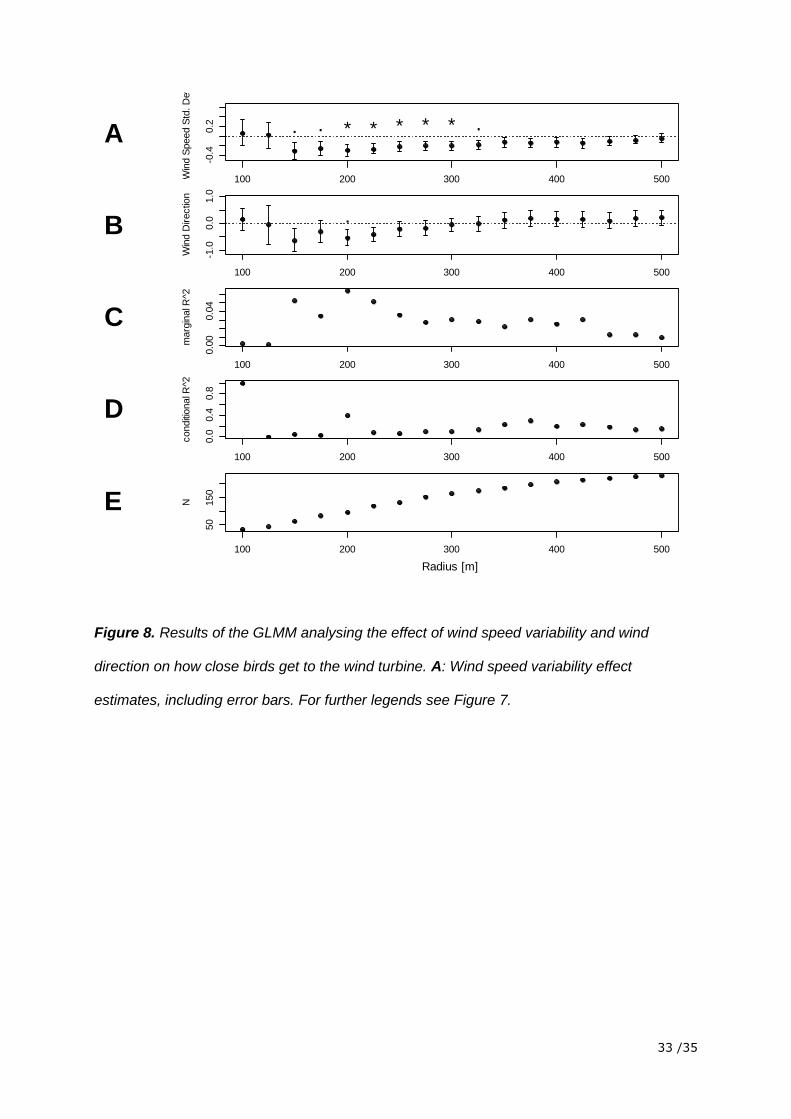
The model relating the closest point to wind speed standard deviation and wind direction
showed that wind speed standard deviation had a statistically significant influence. The
estimated effect of wind speed standard deviation was slightly positive for the data of the
radii 100 m and 125 m and turned negative for all the other radii up to 500 m. This means
that the distance of the closest point increased with increasing wind speed standard
deviation close to the wind turbine (≤ 125 m) and decreased with increasing wind speed
standard deviation more distant to the wind turbine (> 125 m). The negative effect got weaker
when more and more data of radii further away were included. Wind direction had no
significant influence on the distance of the closest point. The small R2 showed that only a
small part of the variability in the data was explained by the factors included in the model
(figure 8).
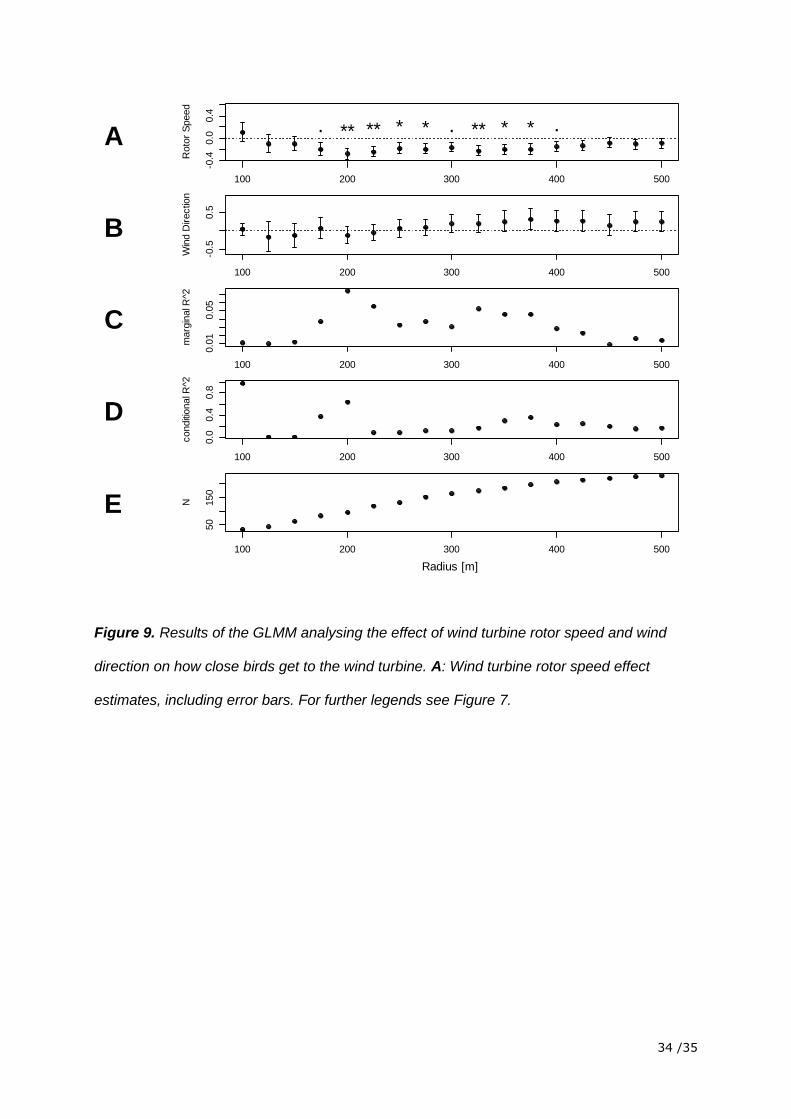
The model relating the closest point to rotor speed and wind direction showed that rotor
speed had a statistically significant effect. The estimated effect of rotor speed was positive
for the radius 100 m and turned negative for all the other radii up to 500 m. This means that
the distance of the closest point increased with increasing rotor speed close to the wind
turbine (= 100 m) and decreased with increasing rotor speed more distant to the wind turbine
(> 100 m). The negative effect got weaker after 300 m when more and more data of radii
further away were included. Wind direction had no significant influence on the distance of the
closest point. The small R2 showed that only a small part of the variability in the data was
explained by the factors included in the model (figure 9). Wind speed and rotor speed were
positively correlated (Kendall’s T = 0.43, p-value > 0.01). Causally, rotor speed is dependent
12 /35
on wind speed but the rotor does not turn at very low wind speed or at wind speed exceeding
12 m/s.
Meanwhile, wind speed, wind speed standard deviation, rotor speed and wind direction did
not have any statistically significant influence on flight direction change in all models over all
analysed radii. Because not all observed bird flight tracks could be included our sample size
for these models (N = 115) was considerably smaller than for the models investigating how
close birds came to the wind turbine (N = 272).
Discussion
We found that exceptionally few birds were found within a radius of 100 m around the wind
turbine but we did not find that fewer birds than expected were in close proximity of
anthropogenic structures in general. Our findings that birds were less often observed in close
proximity of wind turbines than expected (figure 3) falls in line with other studies, performed
over a wide range of taxa (Larsen & Guillemette 2007; Garvin et al. 2011; Dahl et al. 2012;
Plonczkier & Simms 2012; May et al. 2015). Birds not flying in close proximity to a wind
turbine have a reduced potential collision risk and May (2015) calls this behaviour avoidance
(Nathan 2008; Nathan et al. 2008). May distinguishes three categories, macro-, meso- and
micro-avoidance. Macro-avoidance describes birds avoiding an entire wind farm, meso-
avoidance avoiding a single wind turbine within a wind farm and micro-avoidance last-second
avoiding of wind turbine rotor blades. Since macro- and meso-avoidance cannot be
distinguished for a solitary wind turbine we classify the bird flight behaviour shown in our
study as macro-avoidance. Our finding that birds are not found less often in close proximity
to anthropogenic structures like roads, railway lines, buildings, including the wind turbine, in
general (figure 6) indicates that birds actively avoided the wind turbine in particular. On the
species level we did find that certain species, in our case Buzzards and Golden Eagles, are
found less often than expected in close proximity to anthropogenic structures in general
which has been shown in previous studies (e.g. Johnston et al. 2013; Johnston, Bradley &
Otter 2014). Wang, Wang and Smith (2015) hypothesised that not just species identity but
13 /35
also environmental factors such as wind speed influence how close birds fly to wind turbines
and wind speed is also included as a factor in some collision risk models, such as McAdam’s
or, Holmstrom et al’s. (Masden & Cook 2016). In this study, we found that wind speed and
two other wind related factors, wind speed variability and wind turbine rotor speed, can have
significant effects on the approaching distance of birds around a wind turbine. We also found
that the effects of wind speed, wind speed variability and wind turbine rotor speed depend on
the spatial scale (figures 7-9), a fact that has not been shown often before (but see Garvin et
al. 2011). Close to the wind turbine, approaching distances were increasing with increasing
variability of the wind and with increasing speed of the rotor. Further away, the effect turned
around and approaching distances decreased with increasing variability of the wind and
increasing speed of the rotor. It seems that birds passively allow wind to carry them closer to
the wind turbine when wind speed is high. But at a certain distance birds are actively
avoiding proximity of the wind turbine: The approaching distance gets larger when wind
speed is more and more variable (turbulent) or the rotor is turning faster and faster.
The influence of wind speed and wind speed variability on approaching distances weakens
with increasing radius. This is consistent with the findings of Garvin et al. (2011) that while 31
% of the birds observed in a 100 m radius around the wind turbine showed avoidance
behaviour, only 4 % of the birds observed within 500 m around the wind turbine showed
avoidance behaviour. Higher wind speed leading to smaller approaching distances seems to
contradict Barrios and Rodriguez (2004), who found that collision risk decreased with higher
wind speed. But the study by Barrios and Rodriguez covered a broader range of wind speed
than the data we discuss here. Furthermore, we have no data on closest approaching
distances during strong wind speed conditions as defined by Barrios and Rodriguez (wind
speed > 12 m/s). In fact, they found the collision risk to be highest at moderate wind speed
(wind speed 8.6 m/s – 12.5 m/s), a range that corresponds to the highest wind speed that
occurred in our data. Wind speed most likely affects the ability of birds to steer their flight
direction (Longcore et al. 2013; Marques et al. 2014) and therefore flight behaviour becomes
more random at higher wind speed. Carr and Lima (2010) experimentally showed that birds

14 /35
reactions to moving objects is weaker at higher wind speeds which helps explain our
findings, although the study was performed using passerines. The effect of wind speed
variability on approaching distances might have similar reasons. It is plausible that high wind
speed variability also impacts the ability of birds to steer their flight direction or their
reactiveness to moving objects, but experimental proof is surely needed. Since wind turbine
rotor speed is highly correlated with wind speed and, based on the R2, wind speed explains
changes in macro-avoidance better than wind turbine rotor speed, we assume that wind
speed influences both wind turbine rotor speed and macro-avoidance behaviour and that the
wind turbine itself has a minor effect on macro-avoidance, although further studies that look
explicitly into additive effects and interactions between these factors are needed.
One possible confounding factor could be that the proportion of migrating birds among all
observed birds is higher during times of higher wind speed (Johnston, Bradley & Otter 2014)
and this could lead to a weaker average macro-avoidance behaviour, assuming macro-
avoidance is more developed in resident birds. Since we do not have any information about
the migratory status of the observed birds we cannot draw any conclusion about the
importance of this factor. In contrast to Johnston et al. (2013) wind direction had no influence
on the approaching distance. This could be due to a weaker, and therefore harder to detect,
effect, the fact that there are basically just two wind directions around the observed wind
turbine, or the effect of wind direction could be mostly site specific. As a second proxy for
macro-avoidance, additionally to the approaching distance to the wind turbine, we
investigated flight direction change close to the wind turbine. The fact that none of the factors
we investigated had an effect on flight direction change might stem from a smaller sample
size or data not accurate enough. In a review of Schuster, Bulling and Koppel (2015)
discussing the issue they also found that there cannot be drawn any conclusions about that
issue yet. Perhaps a more comprehensive method to assess direction change, such as flight
tortuosity as discussed in Dahl et al. (2012), which takes into account multiple direction
changes instead of just one, would be better suited to address the issue. Other limitations of
our study are that we focused on certain species only and the methodology used is not very
15 /35
suitable for investigating smaller birds such as passerines. Like every optical approach the
use of laser rangefinders is mostly restricted to daylight use and decreases in accuracy
during bad weather. Therefore, nightly flight activity and bird distance to the turbine at night
cannot be measured this way. Furthermore, the data discussed here stems from one single
fall migration season and long-term effects can therefore not be addressed, although they
have been shown in other studies (for example Carr & Lima 2010). Relative detection
probability was highest 100 m away from the observer and not around the wind turbine. To
address this, further studies should be carried out in a way that the relative detection
probability is highest in the area around the wind turbine or even with the use of multiple
observers to improve overall detection. It is also important to stress that our findings stem
from observations at a single site and should not be overly generalised. On the other hand,
the methods we applied here can easily be used at other sites or in larger-scale projects.
Conservation implications and conclusion
In this study we found that birds show macro-avoidance around the solitary wind turbine
“Calanda Wind”. There is an indication that in a close radius approaching distances are
increasing with increasing wind speed variability and increasing rotor speed. Nevertheless,
approaching distances get generally smaller during times of higher wind speed which
increases the collision risk. Considering that weather conditions do not often feature in
studies on assessing wind turbine impacts on local wildlife (Marques et al. 2014), our findings
point towards the need of weather dependant mitigation measures, such as curtailments
(Marques et al. 2014), which have worked well for other taxa like bats (Arnett et al. 2011).
Based on existing studies (de Lucas, Ferrer & Janss 2012), curtailment parameters have to
be investigated to find ecologically desirable and economically applicable methods (Singh,
Baker & Lackner 2015).
On the method side, by using a laser rangefinder bird flight trajectories can be measured
reliably and reproducibly and no reliance on observer biased visual flight trajectory
estimations is needed. We also propose that laser rangefinders could be regularly used for
environmental impact assessments pre- and post-construction of wind turbines.

16 /35
Acknowledgements
This study was undertaken within the framework of the research project “Investigation of the
effectiveness of bat and bird detection at wind turbines”, SI/500974-01, which was launched
by the company Interwind AG and was financed by the Swiss Federal Office of Energy
(SFOE). The Swiss Ornithological Institute was a research partner of Interwind AG focusing
on the aspect of bird detection. We further would like to thank Baptiste Schmid who helped
greatly with the data analysis and the people of the Swiss Ornithological Institute and the
Conservation Biology division of the Institute of Ecology and Evolution, University of Berne,
for their contributions and advice, especially Olivier Roth who helped with the references.
References
Arnett, E.B., Huso, M.M.P., Schirmacher, M.R. & Hayes, J.P. (2011) Altering turbine speed
reduces bat mortality at wind-energy facilities. Frontiers in Ecology and the
Environment, 9, 209-214.
Aschwanden, J., Wanner, S. & Liechti, F. (2015) Investigation on the effectivity of bat and
bird detection at a wind turbine: Final Report Bird Detection. Schweizerische
Vogelwarte, Sempach.
Barclay, R.M.R., Baerwald, E.F. & Gruver, J.C. (2007) Variation in bat and bird fatalities at
wind energy facilities: assessing the effects of rotor size and tower height. Canadian
Journal of Zoology, 85, 381-387.
Barrios, L. & Rodriguez, A. (2004) Behavioural and environmental correlates of soaring-bird
mortality at on-shore wind turbines. Journal of Applied Ecology, 41, 72-81.
Bellebaum, J., Korner-Nievergelt, F., Dürr, T. & Mammen, U. (2013) Wind turbine fatalities
approach a level of concern in a raptor population. Journal for Nature Conservation,
21, 394-400.
17 /35
Carr, J.M. & Lima, S.L. (2010) High wind speeds decrease the responsiveness of birds to
potentially threatening moving stimuli. Animal Behaviour, 80, 215-220.
Carrete, M., Sánchez-Zapata, J.A., Benítez, J.R., Lobón, M. & Donázar, J.A. (2009) Large
scale risk-assessment of wind-farms on population viability of a globally endangered
long-lived raptor. Biological Conservation, 142, 2954-2961.
Carrete, M., Sánchez-Zapata, J.A., Benítez, J.R., Lobón, M., Montoya, F. & Donázar, J.A.
(2012) Mortality at wind-farms is positively related to large-scale distribution and
aggregation in griffon vultures. Biological Conservation, 145, 102-108.
Chamberlain, D.E., Rehfisch, M.R., Fox, A.D., Desholm, M. & Anthony, S.J. (2006) The
effect of avoidance rates on bird mortality predictions made by wind turbine collision
risk models. Ibis, 148, 198-202.
Dahl, E.L., Bevanger, K., Nygård, T., Røskaft, E. & Stokke, B.G. (2012) Reduced breeding
success in white-tailed eagles at Smøla windfarm, western Norway, is caused by
mortality and displacement. Biological Conservation, 145, 79-85.
de Lucas, M., Ferrer, M., Bechard, M.J. & Muñoz, A.R. (2012) Griffon vulture mortality at
wind farms in southern Spain: Distribution of fatalities and active mitigation measures.
Biological Conservation, 147, 184-189.
de Lucas, M., Ferrer, M. & Janss, G.F.E. (2012) Using wind tunnels to predict bird mortality
in wind farms: the case of griffon vultures. PLoS One, 7, e48092.
de Lucas, M., Janss, G.F.E. & Ferrer, M. (2004) The effects of a wind farm on birds in a
migration point: the Strait of Gibraltar. Biodiversity and Conservation, 13, 395-407.
de Lucas, M., Janss, G.F.E. & Ferrer, M. (2005) A bird and small mammal BACI and IG
design studies in a wind farm in Malpica (Spain). Biodiversity and Conservation, 14,
3289-3303.
18 /35
de Lucas, M., Janss, G.F.E., Whitfield, D.P. & Ferrer, M. (2008) Collision fatality of raptors in
wind farms does not depend on raptor abundance. Journal of Applied Ecology, 45,
1695-1703.
Desholm, M., Fox, A.D., Beasley, P.D.L. & Kahlert, J. (2006) Remote techniques for counting
and estimating the number of bird-wind turbine collisions at sea: a review. Ibis, 148,
76-89.
Devereux, C.L., Denny, M.J.H. & Whittingham, M.J. (2008) Minimal effects of wind turbines
on the distribution of wintering farmland birds. Journal of Applied Ecology, 45, 1689-
1694.
Douglas, D.J.T., Follestad, A., Langston, R.H.W. & Pearce-Higgins, J.W. (2012) Modelled
sensitivity of avian collision rate at wind turbines varies with number of hours of flight
activity input data. Ibis, 154, 858-861.
Drewitt, A.L. & Langston, R.H.W. (2006) Assessing the impacts of wind farms on birds. Ibis,
148, 29-42.
Drewitt, A.L. & Langston, R.H.W. (2008) Collision effects of wind-power generators and other
obstacles on birds. Annals of the New York Academy of Sciences, 1134, 233-266.
Elphick, C. (2008) Editor's choice: New research on wind farms. Journal of Applied Ecology,
45, 1840-1840.
Farfán, M.A., Vargas, J.M., Duarte, J. & Real, R. (2009) What is the impact of wind farms on
birds? A case study in southern Spain. Biodiversity and Conservation, 18, 3743-3758.
Ferrer, M., de Lucas, M., Janss, G.F.E., Casado, E., Muñoz, A.R., Bechard, M.J. & Calabuig,
C.P. (2012) Weak relationship between risk assesment studies and recorded
mortality in wind farms. Journal of Applied Ecology, 49, 38-46.
19 /35
García-Ripollés, C. & López-López, P. (2011) Integrating effects of supplementary feeding,
poisoning, pollutant ingestion and wind farms of two vulture species in Spain using a
population viability analysis. Journal of Ornithology, 152, 879-888.
Garthe, S. & Hüppop, O. (2004) Scaling possible adverse effects of marine wind farms on
seabirds: developing and applying a vulnerability index. Journal of Applied Ecology,
41, 724-734.
Garvin, J.C., Jennelle, C.S., Drake, D. & Grodsky, S.M. (2011) Response of raptors to a
windfarm. Journal of Applied Ecology, 48, 199-209.
Hoover, S.L. & Morrison, M.L. (2005) Behaviour of red-tailed hawks in a wind turbine
development. The Journal of Wildlife Management, 69, 150-159.
Huntley, B., Collingham, Y.C., Green, R.E., Hilton, G.M., Rahbek, C. & Willis, S.G. (2006)
Potential impacts of climatic change upon geographical distributions of birds. Ibis,
148, 8-28.
Hüppop, O., Dierschke, J., Exo, K.M., Fredrich, E. & Hill, R. (2006) Bird migration studies
and potential collision risk with offshore wind turbines. Ibis, 148, 90-109.
Islam, M.R., Mekhilef, S. & Saidur, R. (2013) Progress and recent trends of wind energy
technology. Renewable & Sustainable Energy Reviews, 21, 456-468.
Johnston, N.N., Bradley, J.E. & Otter, K.A. (2014) Increased flight altitudes among migrating
golden eagles suggest turbine avoidance at a Rocky Mountain wind installation. PLoS
One, 9, e93030.
Johnston, N.N., Bradley, J.E., Pomeroy, A.C. & Otter, K.A. (2013) Flight paths of migrating
golden eagles and the risk associated with wind energy development in the Rocky
Mountains. Avian Conservation and Ecology, 8, art. 12.
20 /35
Kunz, T.H., Arnett, E.B., Cooper, B.M., Erickson, W.P., Larkin, R.P., Mabee, T., Morrison,
M.L., Strickland, M.D. & Szewczak, J.M. (2007) Assessing impacts of wind-energy
development on nocturnally active birds and bats: a guidance document. Journal of
Wildlife Management, 71, 2449-2486.
Larsen, J.K. & Guillemette, M. (2007) Effects of wind turbines on flight behaviour of wintering
common eiders: implications for habitat use and collision risk Journal of Applied
Ecology, 44, 516-522.
Leddy, K.L., Higgins, K.F. & Naugle, D.E. (1999) Effects of wind turbines on upland nesting
birds in Conservation Reserve Program grasslands. The Wilson Bulletin, 111, 100-
104.
Longcore, T., Rich, C., Mineau, P., MacDonald, B., Bert, D.G., Sullivan, L.M., Mutrie, E.,
Gauthreaux, S.A. Jr., Avery, M.L., Crawford, R.L., Manville, A.M. II, Travis, E.R. &
Drake, D. (2013) Avian mortality at communication towers in the United States and
Canada: which species, how many, and where? Biological Conservation, 158, 410-
419.
López-López, P., Sarà, M. & Di Vittorio, M. (2012) Living on the edge: assessing the
extinction risk of critically endangered bonelli's eagle in Italy. PLoS ONE, 7, e37862.
Loss, S.R., Will, T. & Marra, P.P. (2013) Estimates of bird collision mortality at wind facilities
in the contiguous United States. Biological Conservation, 168, 201-209.
Marques, A.T., Batalha, H., Rodrigues, S., Costa, H., Ramos Pereira, M.J., Fonseca, C.,
Mascarenhas, M. & Bernardino, J. (2014) Understanding bird collisions at wind farms:
An updated review on the causes and possible mitigation strategies. Biological
Conservation, 179, 40-52.
Martin, G.R. & Shaw, J.M. (2010) Bird collisions with power lines: Failing to see the way
ahead? Biological Conservation, 143, 2695-2702.
21 /35
Martínez, J.E., Calvo, J.F., Martínez, J.A., Zuberogoitia, I., Cerezo, E., Manrique, J., Gómez,
G.J., Nevado, J.C., Sánchez, M., Sánchez, R., Bayo, J., Pallarés, A., González, C.,
Gómez, J.M., Pérez, P. & Motos, J. (2010) Potential impact of wind farms on
territories of large eagles in southeastern Spain. Biodiversity and Conservation, 19,
3757-3767.
Martínez-Abraín, A., Tavecchia, G., Regan, H.M., Jiménez, J., Surroca, M. & Oro, D. (2012)
Effects of wind farms and food scarcity on a large scavenging bird species following
an epidemic of bovine spongiform encephalopathy. Journal of Applied Ecology, 49,
109-117.
Masden, E.A. & Cook, A.S.C.P. (2016) Avian collision risk models for wind energy impact
assessments. Environmental Impact Assessment Review, 56, 43-49.
May, R.F. (2015) A unifying framework for the underlying mechanisms of avian avoidance of
wind turbines. Biological Conservation, 190, 179-187.
May, R.F., Reitan, O., Bevanger, K., Lorentsen, S.H. & Nygård, T. (2015) Mitigating wind-
turbine induced avian mortality: Sensory, aerodynamic and cognitive constraints and
options. Renewable & Sustainable Energy Reviews, 42, 170-181.
Nathan, R. (2008) An emerging movement ecology paradigm. Proceedings of the National
Academy of Sciences of the United States of America, 105, 19050-19051.
Nathan, R., Getz, W.M., Revilla, E., Holyoak, M., Kadmon, R., Saltz, D. & Smouse, P.E.
(2008) A movement ecology paradigm for unifying organismal movement research.
Proceedings of the National Academy of Sciences of the United States of America,
105, 19052-19059.
Olea, P.P. & Mateo-Tomás, P. (2014) Living in risky landscapes: delineating management
units in multithreat environments for effective species conservation. Journal of
Applied Ecology, 51, 42-52.
22 /35
Osborn, R.G., Dieter, C.D., Higgins, K.F. & Usgaard, R.E. (1998) Bird flight characteristics
near wind turbines in Minnesota. The American Midland Naturalist, 139, 29-38.
Pearce-Higgins, J.W., Stephen, L., Langston, R.H.W., Bainbridge, I.P. & Bullman, R. (2009)
The distribution of breeding birds around upland wind farms. Journal of Applied
Ecology, 46, 1323-1331.
Plonczkier, P. & Simms, I.C. (2012) Radar monitoring of migrating pink-footed geese:
behavioural responses to offshore wind farm development. Journal of Applied
Ecology, 49, 1187-1194.
Pruett, C.L., Patten, M.A. & Wolfe, D.H. (2009) Avoidance behavior by prairie grouse:
implications for development of wind energy. Conservation Biology, 23, 1253-1259.
R Development Core Team (2013) R: A language and environment for statistical computing.
Version 3.2.2. R Foundation for Statistical Computing, Vienna, Austria. https://www.r-
project.org/
Rushworth, I. & Krüger, S. (2014) Wind farms threaten southern Africa's cliff-nesting vultures.
Ostrich, 85, 13-23.
Schuster, E., Bulling, L. & Köppel, J. (2015) Consolidating the state of knowledge: a
synoptical review of wind energy's wildlife effects. Environmental Management, 56,
300-331.
Singh, K., Baker, E.D. & Lackner, M.A. (2015) Curtailing wind turbine operations to reduce
avian mortality. Renewable Energy, 78, 351-356.
Smallwood, K.S., Rugge, L. & Morrison, M.L. (2009) Influence of behavior on bird mortality in
wind energy developments. Journal of Wildlife Management, 73, 1082-1098.
Stewart, G.B., Pullin, A.S. & Coles, C.F. (2007) Poor evidence-base for assessment of
windfarm impacts on birds. Environmental Conservation, 34, 1-11.
23 /35
Wang, S., Wang, S. & Smith, P. (2015) Ecological impacts of wind farms on birds: Questions,
hypotheses, and research needs. Renewable & Sustainable Energy Reviews, 44,
599-607.
Winder, V.L., McNew, L.B., Gregory, A.J., Hunt, L.M., Wisely, S.M. & Sandercock, B.K.
(2014) Effects of wind energy development on survival of female greater prairie-
chickens. Journal of Applied Ecology, 51, 395-405.
Zuur, A.F., Ieno, E.N., Walker, N.J., Saveliev, A.A. & Smith, G.M. (2009) Mixed effects
models and extensions in ecology with R. Springer, New York.

24 /35
Tables
Table 1. Shown is if a species group is considered raptors, the number of recorded positions per species group, the number of tracks per species
group, the average flight height thereof, the variability of the flight height (standard deviation of the average flight height) and if a species group
was recorded as flying at heights of the wind turbine rotor swept zone.
25 /35
Species group Raptor Number
of tracks
Number of
positions
Average flight
height [m]
Flight height std.
dev. [m]
Within rotor swept
height
Golden Eagle Yes 9 79 455 182 Yes
Buzzard Yes 63 450 288 208 Yes
Red Kite Yes 24 205 244 161 Yes
Black Kite Yes 2 16 241 45 Yes
Hawk Yes 4 28 81 24 Yes
Common Kestrel Yes 31 232 166 122 Yes
Sparrow Hawk Yes 5 22 169 166 Yes
Corvid No 113 529 231 180 Yes
Others No 21 119 169 170 Yes
Total 272 1680 227 105
26 /35
Figures
Figure 1. Measured flight height above observer level per species group. Shown in red is
the wind turbine rotor swept zone. The number of tracks (N) is given in table 1.
Go
lde
n E
ag
le
Bu
zza
rd
Re
d K
ite
Bla
ck K
ite
Ha
wk
Ke
str
el
Sp
arr
ow
Ha
wk
Co
rvid
Oth
ers
0
200
400
600
800
1000
Species
Flig
ht h
eig
ht [m
]
27 /35
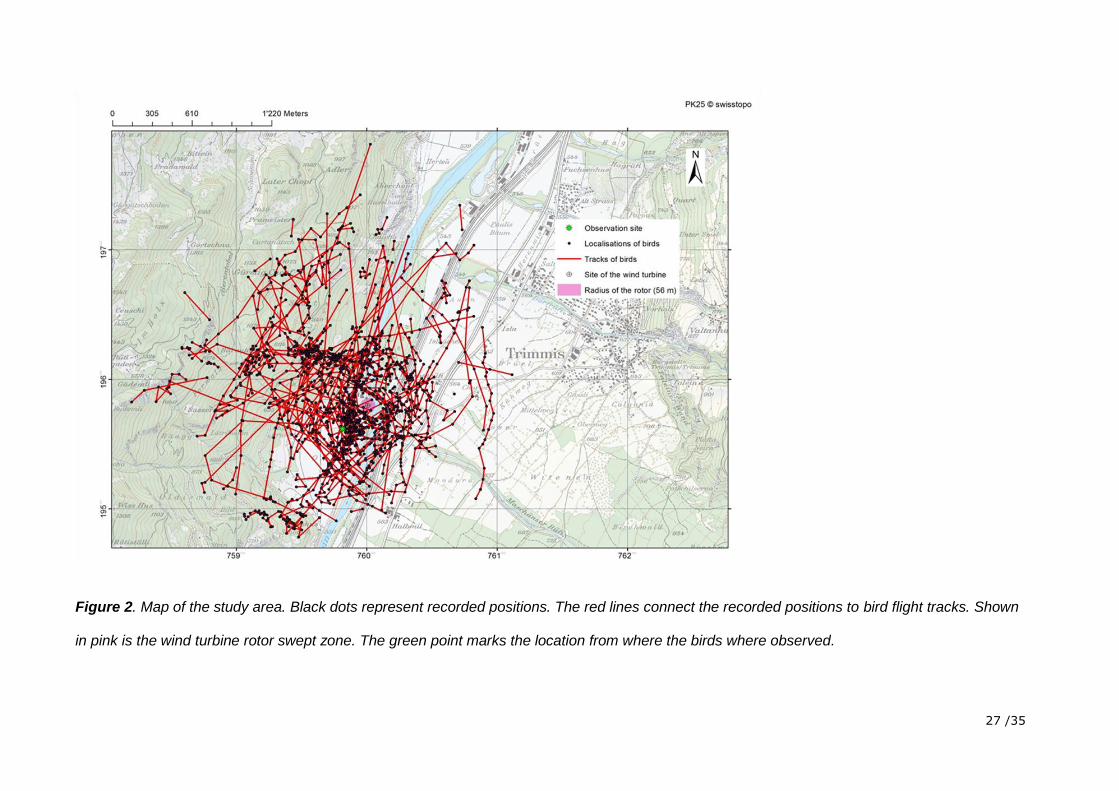
Figure 2. Map of the study area. Black dots represent recorded positions. The red lines connect the recorded positions to bird flight tracks. Shown
in pink is the wind turbine rotor swept zone. The green point marks the location from where the birds where observed.
28 /35
Figure 3. Distribution of the distance of closest points to the observer. The black curve is
based on the approximated distribution (lognormal, meanlog = 5.4, sdlog = 0.92). The red
line indicates the distance of the wind turbine to the observer.
Distance to observer [m]
Nu
mb
er
of o
bse
rva
tio
ns
0 500 1000 1500
01
02
03
04
0
29 /35
Figure 4: Distribution of the distance of closest points to the nacelle of the wind turbine.
B
Closest point [m]
Fre
quency
0 500 1000 1500
01
02
03
04
05
0
Bla
ck K
ite
Bu
zza
rd
Co
rvid
Do
ve
Go
lde
n E
ag
le
Ha
wk
Ke
str
el
Re
d K
ite
Sp
arr
ow
Ha
wk
0
500
1000
1500
Dis
tance [
m]
Species
north south
05
00
10
00
15
00
Wind direction
Dis
tance [
m]
30 /35
Figure 5. The study site. The area within 1 km radius of the wind turbine was assigned to
different habitat types, based on aerial photographs. Red: anthropogenic areas, Yellow:
agricultural land, Green: wooded areas, Dark blue: lakes, Light blue: rivers.
31 /35
Figure 6. Association table between species identity (A) and habitat type (B). The width of
each bar represents the sample size and the height the difference between expected and
measured association. Blue bars indicate a statistically significant positive association while
red bars indicate statistically significant negative associations. Each data point was weighted
according to the relative detection probability.
-4.9
-4.0
-2.0
0.0
2.0
4.0
6.9
Pearsonresiduals:
p-value =<0.0000000000000002
B
A
sparrow hawk
red kite
kestrel
hawk
golden eagle
other
corvid
buzzard
black kite
agrar anthropogenic forest lake river
p – value < 0.01
32 /35
Figure 7. Results of the GLMM analysing the effect of wind speed and wind direction on how
close birds get to the wind turbine. A: Wind speed effect estimates, including error bars. B:
Wind direction effect estimates, including error bars. C: GLMM marginal R2 value. D: GLMM
conditional R2 value. E: Sample size. Only the results of the models with radii up to 500 m
are shown. Statistically significant effects are labelled within the graphs.
. * **
100 200 300 400 500
-0.5
0.5
distance [m]
(Inte
rcept)
100 200 300 400 500
-0.4
0.0
distance [m]
Win
d S
peed
* * * * . * * * * ** * *
100 200 300 400 500
-0.5
0.5
distance [m]
Win
d D
irectio
n
100 200 300 400 500
0.0
20.0
60.1
0
marg
inal R
^2
100 200 300 400 500
0.2
0.6
1.0
conditi
onal R
^2
100 200 300 400 500
50
150
N
Radius [m]
A
B
C
D
E
33 /35
Figure 8. Results of the GLMM analysing the effect of wind speed variability and wind
direction on how close birds get to the wind turbine. A: Wind speed variability effect
estimates, including error bars. For further legends see Figure 7.
100 200 300 400 500
-0.5
0.5
distance [m]
(Inte
rcept)
100 200 300 400 500
-0.4
0.2
distance [m]
Win
d S
peed S
td. D
ev.
. . * * * * * .
100 200 300 400 500
-1.0
0.0
1.0
distance [m]
Win
d D
irectio
n
.
100 200 300 400 500
0.0
00.0
4
marg
inal R
^2
100 200 300 400 500
0.0
0.4
0.8
conditi
onal R
^2
100 200 300 400 500
50
150
N
Radius [m]
A B C D
E
34 /35
Figure 9. Results of the GLMM analysing the effect of wind turbine rotor speed and wind
direction on how close birds get to the wind turbine. A: Wind turbine rotor speed effect
estimates, including error bars. For further legends see Figure 7.
100 200 300 400 500
-0.5
0.5
distance [m]
(Inte
rcept)
100 200 300 400 500
-0.4
0.0
0.4
distance [m]
Roto
r S
peed
. ** ** * * . ** * * .
100 200 300 400 500
-0.5
0.5
distance [m]
Win
d D
irectio
n
100 200 300 400 500
0.0
10.0
5
marg
inal R
^2
100 200 300 400 500
0.0
0.4
0.8
conditi
onal R
^2
100 200 300 400 500
50
150
N
Radius [m]
A B C D
E
35 /35