flight planning plan the flight, fly the plan. techniquetechnique 1. plot course a. get true course...
TRANSCRIPT

Flight PlanningFlight PlanningFlight PlanningFlight PlanningPlan the flight, fly the planPlan the flight, fly the plan

TechniqueTechniqueTechniqueTechnique1. Plot Course
a. Get true courseb. Select checkpoints (9 – 22nm)c. Start nav log
2- Weather briefinga. Go/no-go decisionb. Adjust route if necessaryc. Select altitude
3- Performance Calculationsa. Wt/Balb. Takeoff/ldg distc. Time/fuel/dist to climbd. Time/fuel in cruisee. Complete nav log
4- File if desired and execute
1. Plot Coursea. Get true courseb. Select checkpoints (9 – 22nm)c. Start nav log
2- Weather briefinga. Go/no-go decisionb. Adjust route if necessaryc. Select altitude
3- Performance Calculationsa. Wt/Balb. Takeoff/ldg distc. Time/fuel/dist to climbd. Time/fuel in cruisee. Complete nav log
4- File if desired and execute

Plot CoursePlot CoursePlot CoursePlot Course
1. Using your plotter, draw a line from center of departure point to center of destination airport
1. Look for hazards along your route1. Special Use Airspace
2. Terrain
3. Large bodies of water
2. Adjust course if necessary
2. Find your true course1. Lay plotter down with top edge along route
2. Place center on a line of longitude
3. Read true course on East or West scale
3. Mark mileage in 5 or 10 mile intervals on your route
4. Example: SBN to SMD (Smith Field in Fort Wayne)

Checkpoint SelectionCheckpoint SelectionCheckpoint SelectionCheckpoint Selection
What makes a good checkpoint? Precision
An intersection of two roads is more precise than the point where your course is supposed to intersect a road
Visibility Radio towers make poor checkpoints because they are difficult to see from
the air Airports make great checkpoints because they are very easy to see from the
air
Distinctiveness Using a lake as a checkpoint when flying across New Mexico makes sense Using a lake as a checkpoint when flying across east Texas increases your
odds of mistakenly identifying your checkpoint
Checkpoint SelectionCheckpoint SelectionCheckpoint SelectionCheckpoint Selection
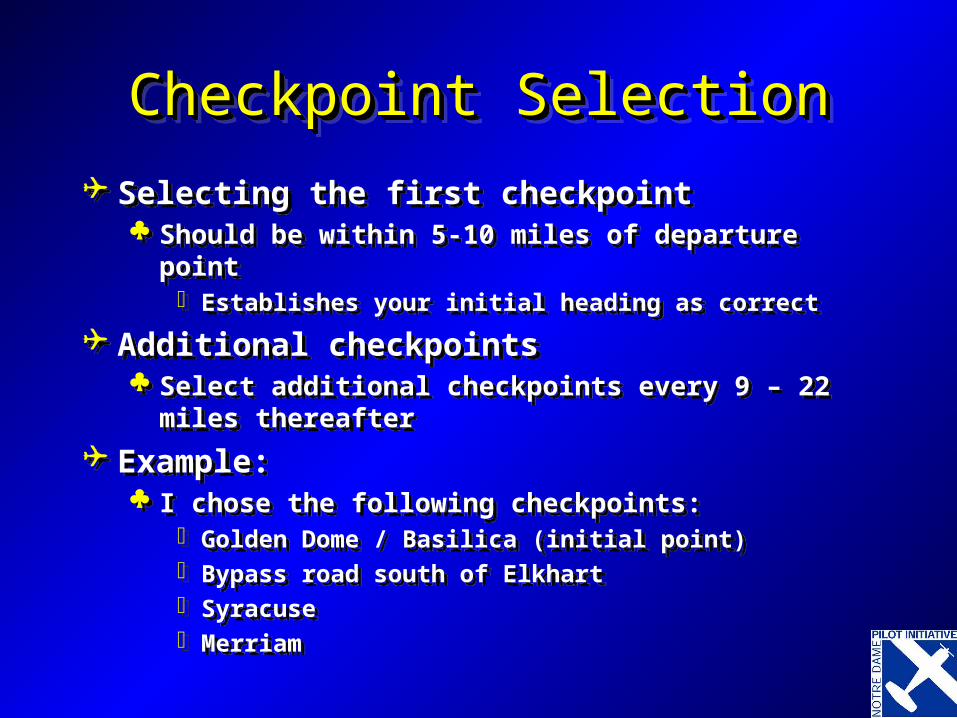
Selecting the first checkpoint Should be within 5-10 miles of departure point
Establishes your initial heading as correct
Additional checkpoints Select additional checkpoints every 9 – 22 miles
thereafter
Example: I chose the following checkpoints:
Golden Dome / Basilica (initial point) Bypass road south of Elkhart Syracuse Merriam

Weather BriefingWeather BriefingWeather BriefingWeather Briefing
Get a weather briefing from an official source 1-800-WX-BRIEF DUAT or DUATS
Make a go/no-go decision “VFR flight not recommended” Conditions beyond your ability
Winds MVFR or IFR clouds and weather Convective activity Precipitation
Adjust route if necessarySelect altitude
Winds Aloft will inform this decision

Performance CalculationsPerformance CalculationsPerformance CalculationsPerformance Calculations
Weight and BalanceWeight information will be required for
performance calculationsExample: Assume max gross weight
Takeoff / Landing distanceEnsure your aircraft is capable of
making it out of your departure airport and in/out of your destination airport
Weight and BalanceWeight information will be required for
performance calculationsExample: Assume max gross weight
Takeoff / Landing distanceEnsure your aircraft is capable of
making it out of your departure airport and in/out of your destination airport

Performance CalculationsPerformance CalculationsPerformance CalculationsPerformance Calculations
Time / Fuel / Distance to Climb Cessna charts make this
calculation very simple Take value at your cruise altitude
and subtract value from departure pressure altitude
Make approximations as appropriate
There is no need calculate to a level of precision beyond what is given in the chart
Therefore, find: Time to the nearest minute Fuel to the nearest tenth gallon Distance to the nearest mile

Performance CalculationsPerformance CalculationsPerformance CalculationsPerformance Calculations Time / Fuel / Distance to Climb Example
Climb from SBN (799 ft) to 4,500 ft Weather:
SBN 07010G15 10SM CLR 13/M02 A2997
Approximations Difference between pressure alt. & true alt is 50 feet,
negligible Difference between SBN elevation and 1000 foot
entries is negligible
Values for 4,500 feet (by interpolation) Time: 7 min Fuel: 1.7 (conservative estimates dictate rounding up) Distance: 10 miles (only valid in zero wind)
Values for 1,000 feet Time: 1 min Fuel: 0.4 gal Distance: 2 miles
Climb totals Time: (7 – 1) = 6 minutes Fuel (1.7 - .4 ) = 1.3 (+ 1.1 for tax & takeoff) = 2.4 gal Wind is nonzero, so note avg climb speed: 76 knots
Time / Fuel / Distance to Climb Example Climb from SBN (799 ft) to 4,500 ft Weather:
SBN 07010G15 10SM CLR 13/M02 A2997
Approximations Difference between pressure alt. & true alt is 50 feet,
negligible Difference between SBN elevation and 1000 foot
entries is negligible
Values for 4,500 feet (by interpolation) Time: 7 min Fuel: 1.7 (conservative estimates dictate rounding up) Distance: 10 miles (only valid in zero wind)
Values for 1,000 feet Time: 1 min Fuel: 0.4 gal Distance: 2 miles
Climb totals Time: (7 – 1) = 6 minutes Fuel (1.7 - .4 ) = 1.3 (+ 1.1 for tax & takeoff) = 2.4 gal Wind is nonzero, so note avg climb speed: 76 knots

Performance CalculationsPerformance CalculationsPerformance CalculationsPerformance Calculations
Before we can complete nav log, we need to find our top of climb (TOC) & top of descent (TOD) points
Procedure Use Winds Aloft to find groundspeed Use time-to-climb to find distance
Example Winds Aloft
3000 6000
FWA 0416 3615
For climb, use winds at 3000 Interpolate: winds at cruise altitude (4,500) are 020 at 16

Performance CalculationsPerformance CalculationsPerformance CalculationsPerformance Calculations
E6-B Turn to wind side Set wind direction (040) opposite true index Mark wind velocity (16) up from grommet Set true course (123) opposite true index Slide the TAS arc (76) under the wind dot Read ground speed under grommet (72) Read wind correction angle at wind dot (12 deg
left)
E6-B Turn to wind side Set wind direction (040) opposite true index Mark wind velocity (16) up from grommet Set true course (123) opposite true index Slide the TAS arc (76) under the wind dot Read ground speed under grommet (72) Read wind correction angle at wind dot (12 deg
left)

Performance CalculationsPerformance CalculationsPerformance CalculationsPerformance Calculations
Top of Climb pointTurn to computer side of E6-B
First question: How fast? 72 (our calculated groundspeed for the climb)
Earlier, we computed the climb would take 6 minutes
Read distance (7.2) above minute (6) scale For the mathematically astute, 6 minutes is 1/10
of an hour, so the TOC distance is a tenth of our groundspeed

Performance CalculationsPerformance CalculationsPerformance CalculationsPerformance Calculations
Top of Descent point Figure a 500 foot per minute descent
From 4500 to 1800 (Traffic Pattern Altitude at SMD) is a 2700 foot descent, or 5.4 minutes
130 knots is a good descent airspeed in the 172 Use same winds (040 at 16) Flip to wind side of E6-B
Wind dot is still valid; slide up to 130 knot TAS arc Read groundspeed under grommet (127) Read WCA under wind dot (7 deg left)
Flip to computer side of E6-B How fast?
127 knots
Read descent distance (11.5 miles) over descent time (5.4 minutes)
Performance CalculationsPerformance CalculationsPerformance CalculationsPerformance Calculations
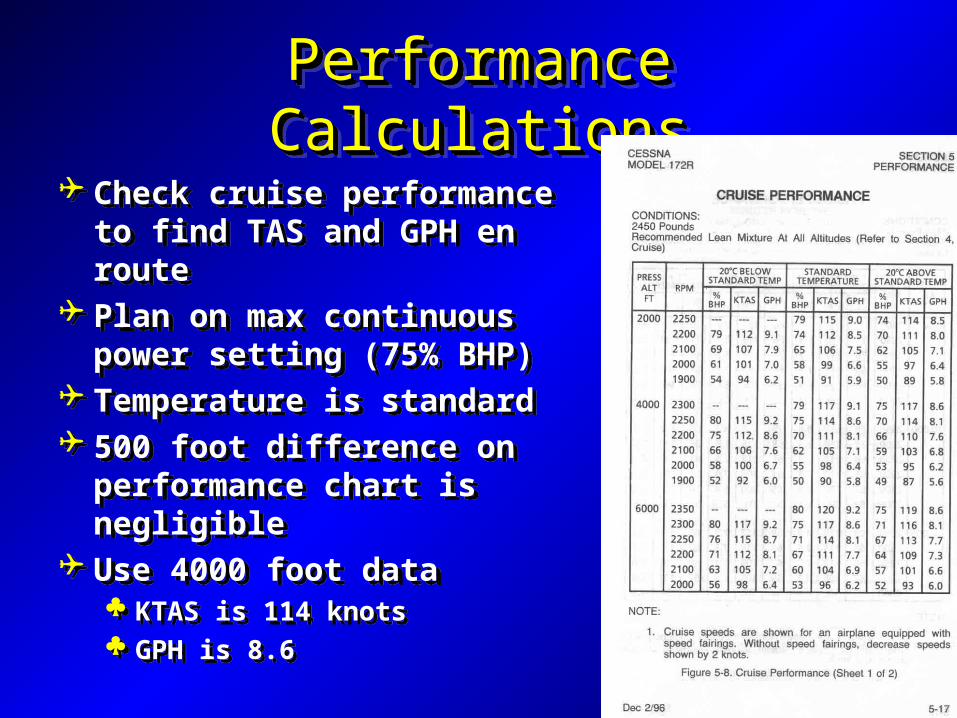
Check cruise performance to find TAS and GPH en route
Plan on max continuous power setting (75% BHP)
Temperature is standard 500 foot difference on
performance chart is negligible Use 4000 foot data
KTAS is 114 knots GPH is 8.6
Check cruise performance to find TAS and GPH en route
Plan on max continuous power setting (75% BHP)
Temperature is standard 500 foot difference on
performance chart is negligible Use 4000 foot data
KTAS is 114 knots GPH is 8.6

Complete Nav LogComplete Nav LogComplete Nav LogComplete Nav Log
Measure distances between each checkpoint Don’t forget to factor in your TOC and TOD points
Fill in each checkpoint and leg distance Compute cruising groundspeed Find cruising wind correction angle Apply magnetic variation Find ETE between checkpoints Find fuel consumption between checkpoints
Measure distances between each checkpoint Don’t forget to factor in your TOC and TOD points
Fill in each checkpoint and leg distance Compute cruising groundspeed Find cruising wind correction angle Apply magnetic variation Find ETE between checkpoints Find fuel consumption between checkpoints

Complete Nav LogComplete Nav LogComplete Nav LogComplete Nav Log
Example: Find cruising ground speed (Previously interpolated) winds are 020 at 16 Go to wind side of E6-B
Set wind direction (020) opposite true index Mark wind velocity (16) up from grommet Set true course (123) opposite true index Slide TAS arc (114) under wind dot Read groundspeed under grommet (116) Read WCA under wind dot (8 deg left)

Complete Nav LogComplete Nav LogComplete Nav LogComplete Nav Log
Apply WCA to True Course -L, +R
Apply magnetic variation A check of the sectional indicates one isogonic line
along route of flight, +5 deg W -E, +W (East is least, West is best)
Result is magnetic heading This is as far as we can go until we look at the compass
card in the aircraft
Apply WCA to True Course -L, +R
Apply magnetic variation A check of the sectional indicates one isogonic line
along route of flight, +5 deg W -E, +W (East is least, West is best)
Result is magnetic heading This is as far as we can go until we look at the compass
card in the aircraft

Complete Nav LogComplete Nav LogComplete Nav LogComplete Nav Log
Example (cont) Find ETE between checkpoints
Already computed ETE (6 min) and fuel consumption (2.4 gal) to TOC point
Fill values in on nav log
Flip to computer side of E6-B How fast? 116 knots Read ETE underneath distance
Round off to nearest minute
Find fuel consumption between checkpoints E6-B
How fast? 8.6 GPH Read fuel consumed over minutes scale Round to nearest tenth gallon
Subtract en route fuel from total Assume a full fuel load (53 gal)

File Flight PlanFile Flight PlanFile Flight PlanFile Flight Plan