flight test of a pseudo ranging signal compatible with...
TRANSCRIPT

1
Flight Test of a Pseudo Ranging Signal Compatible with Existing Distance Measuring
Equipment (DME) Ground Stations
Sherman Lo, Yu Hsuan Chen, Per Enge, Stanford University Wouter Pelgrum, Kuangmin Li, Ohio University
George Weida, Achim Soelter, Moog Inc.
1. INTRODUCTION
Distance measuring equipment (DME) and its military counterpart tactical air navigation (TACAN) has been a cornerstone of aviation navigation since its development in the 1950s. It is still one of the most commonly used aviation navigation aid. However, future airspace will need to accommodate increased traffic levels, more precise operations and autonomous air vehicles which will increase demands on aviation navigation systems. While global navigation satellite systems (GNSS) will provide many of these improvements, terrestrial navigation systems will continue to play an important role in a robust aviation navigation infrastructure. The Federal Aviation Administration (FAA) alternative positioning navigation and timing (APNT) program has been examining advanced concepts to improve on DME performance and capabilities while maintaining compatibility with existing equipment. One concept being developed is a DME based pseudolite that position modulates existing DME pulse pairs. Such a pseudolite can operate alongside current DME operations and can be generated using the currently fielded DME transponders with an external appliqué. The paper examines the implementation and on-air performance of DME pseudolite appliqué on a DME transponder. Specifically, it details the design and implementation of the DME pseudolite appliqué and its integration with an existing operational DME/TACAN. It also shows the design of preliminary test DME pseudolite signal that was transmitted. This paper examines the reception performance of the synchronization and data signal. 2. DME & DME PSEUDOLITE
The next generation airspace is being developed with GNSS taking a leading role in navigation. With GNSS
becoming the primary means navigation for many operations and a major source of surveillance, its susceptibility to interference is a concern. The FAA APNT group is developing terrestrial navigation to support future airspace operations. This capability will provide navigation should GNSS be unavailable or unadvisable. It will be robust to GNSS interference or degradation and provide operational capabilities similar to those gained from GNSS [1].
Figure 1. DME Infrastructure in the Conterminous United States (CONUS)
DME/TACAN is been long been the backbone of the aviation navigation infrastructure around the world. In the conterminous United States (CONUS), there are over 900 DME stations serving the en route and terminal regions. In addition, there are other DMEs that are used for approach only. This system is shown in Figure 1. Traditionally DME is used find range to the DME station allowing aircraft to fly from point-to-point (i.e. one station to another). Today, many commercial aircraft use scanning DME avionics capable of using multiple DMEs (DME/DME) for position solutions. Currently, DME/DME, when coupled with an inertial reference unit (IRU) to bridge gaps in DME coverage, can support area navigation with 1.0 nautical mile accuracy (RNAV 1.0). A build out of the DME infrastructure could eliminate such coverage gaps and allow use of DME/DME for en

2
route navigation in CONUS without the need for an IRU. The FAA is examining the possibility which would allow DME/DME to provide a near-term APNT capability. Given the existing investments in and worldwide adoption of DME, it seems sensible for APNT to further build upon DME to provide capabilities to support future airspaces. To gain these additional capabilities with DME, the APNT team has been developing enhanced DME (eDME) concepts.
DME Operations DME provides true range or distance to the DME ground station or transponder. To make this calculation, an aircraft interrogator initiates by transmitting pulse pairs on the interrogation frequency of the targeted DME transponder. The transponder, upon the reception of the first pulse of the pair, marks the time of arrival (TOA) of the first pulse. It then waits for a second pulse at the correct delay relative the first pulse to determine if the signal was a valid DME interrogation. After determining that it has received a valid interrogation, the DME transponder opens its dead time gate and becomes non- responsive to other interrogations. This allows the transponder to be dedicated to making the reply. The reply is transmitted after delay period, the reply delay, from the TOA of the first pulse of the interrogation. The reply is transmitted on the reply frequency which is offset from the interrogation frequency by 63 MHz. Figure 2 presents the operation of the DME transponder with the top and bottom show the reception and transmission side of its response, respectively. True range is calculated by the aircraft from the round trip time from the transmission of the interrogation to reception of the corresponding reply. The non-responsive typically lasts at least 10 microseconds (μs) beyond the transmission of the reply.
Figure 2. DME station response based on X channel reply delay & dead time. Depiction based on [2]
A transponder may not reply to a given interrogation for two reasons. The first is that it is in the process of replying to another interrogation. The process, as discussed above, can mean that the transponder may be non-responsive to interrogations for 70-100 μs. The second reason is that the DME is sending its Morse code identifier. The identifier is a sequence of dots and dashes that provides the 3 or 4 letter FAA designation for the
facility. These are generated by a series of DME pulse pairs transmitted on the reply frequency at a rate of 1350 Hz. The transmission period of a dot and dash are typically 100 and 300 μs, respectively. There is a gap of 100 and 300 μs between the character of each letter and between each letter, respectively. The Morse code transmissions can last over 6 seconds. The Morse code transmission has priority over interrogations and during its transmission period, the DME does not respond to any interrogations. On DME, this is sent every 30 seconds.
The DME system has several codes that can be used on the same frequency. Different DME codes have different values for the time between the first and second pulse of an interrogation and reply. Different codes also have different reply delays. Table 1 shows those values for DME X and Y code.
Table 1. Parameters for Interrogation and Reply for DME/N Codes
Code Interrogation Pulse
Pair Spacing (μs)
Reply Pulse Pair
Spacing (μs)
Reply Delay
(μs)
X 12 12 50
Y 36 30 56
DME has several limitations. The current specifications allow for deviations the reply delay and transmitted signals resulting in its specified range accuracy of approximately 0.2 nautical miles (nm). Inherent to the two-way interaction is a capacity limit as the transponder can only reply to a finite number of interrogations. Furthermore, a DME transponder typically is limited to transmitting 2700 reply pulse pairs per second (ppps) ±90 ppps. While some newer transponder can emit more, emitting more effectively reduces the reply efficiency – the percentage of interrogations that receive a reply [3]. Finally, DME signals do not provide data, with the exception of the Morse code. So there is no method of providing integrity warnings other than shutting down the station.
Enhanced DME Enhanced DME is designed to provide capabilities to address the limitations previously mentioned. Most critically, it adds pseudo ranging and data on top of traditional DME functionality. This capability is referred to as DME pseudolite and uses the same frequencies and pulse pairs normally used by the DME station. Pseudo ranging capability improves capacity and accuracy [4][5]. The APNT has been developing two concepts for DME pseudolites which are compatible. The first is “non-priority” pseudolite based on pulse pair position modulation (PPPM) and the second is “priority” pseudolite based on carrier phase modulation. Non-priority or PPPM pseudolite can operate on existing
60 μsec DEAD TIME
50 μsec REPLY DELAY MARGIN10 μsec
12 μsecbet. pulse
12 μsecbet. pulse
1st
PULSE2nd
PULSE
1st
PULSE2nd
PULSE
Request from aircraft
Reply from DME station
DME stationReception
DME stationTransmission
3
transponder without modifying the internals of the transponder [4]. This pseudolite is the topic of the paper. Priority provides greater capabilities but requires new or modified DME transponders [5]. The two forms developed are compatible and offer an evolutionary path to transition from traditional DME to a highly capable eDME. DME PPPM Pseudolite The concept of a DME PPPM pseudolite is to use the basic functionality of DME transponder to generate a pseudolite signal. Recall that a transponder sends replies in response to interrogations from an aircraft interrogator. Imagine if there is a static interrogator that sends a DME transponder a precise, pseudo-random sequence of interrogation pulse pairs. The interrogations would cause the DME transponder to transmit that same sequence with reply pulse pairs. The sequence can be used to provide a ranging and data signal. To the transponder, the static interrogator is just like another aircraft. The DME PPPM pseudolite generator is essentially this static interrogator. Figure 3 illustrates how DME PPPM uses the basic DME functionality with a static interrogator appliqué. The appliqué can exist external to the DME transponder and so is compatible with any existing DME transponders. It is also interoperable within today’s DME system as it behaves like an aircraft interrogator. It is non-priority because its interrogation is just like any other aircraft and does not have priority over other aircraft interrogations.
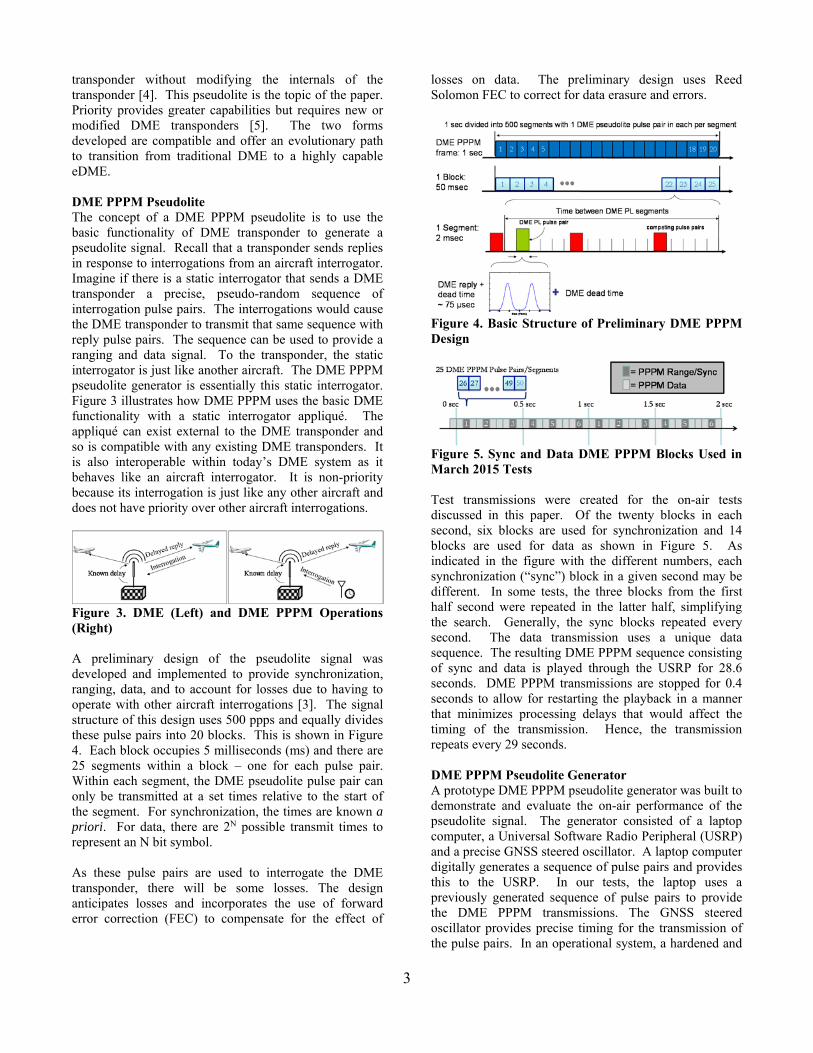
Figure 3. DME (Left) and DME PPPM Operations (Right) A preliminary design of the pseudolite signal was developed and implemented to provide synchronization, ranging, data, and to account for losses due to having to operate with other aircraft interrogations [3]. The signal structure of this design uses 500 ppps and equally divides these pulse pairs into 20 blocks. This is shown in Figure 4. Each block occupies 5 milliseconds (ms) and there are 25 segments within a block – one for each pulse pair. Within each segment, the DME pseudolite pulse pair can only be transmitted at a set times relative to the start of the segment. For synchronization, the times are known a priori. For data, there are 2N possible transmit times to represent an N bit symbol. As these pulse pairs are used to interrogate the DME transponder, there will be some losses. The design anticipates losses and incorporates the use of forward error correction (FEC) to compensate for the effect of
losses on data. The preliminary design uses Reed Solomon FEC to correct for data erasure and errors.
Figure 4. Basic Structure of Preliminary DME PPPM Design
Figure 5. Sync and Data DME PPPM Blocks Used in March 2015 Tests Test transmissions were created for the on-air tests discussed in this paper. Of the twenty blocks in each second, six blocks are used for synchronization and 14 blocks are used for data as shown in Figure 5. As indicated in the figure with the different numbers, each synchronization (“sync”) block in a given second may be different. In some tests, the three blocks from the first half second were repeated in the latter half, simplifying the search. Generally, the sync blocks repeated every second. The data transmission uses a unique data sequence. The resulting DME PPPM sequence consisting of sync and data is played through the USRP for 28.6 seconds. DME PPPM transmissions are stopped for 0.4 seconds to allow for restarting the playback in a manner that minimizes processing delays that would affect the timing of the transmission. Hence, the transmission repeats every 29 seconds. DME PPPM Pseudolite Generator A prototype DME PPPM pseudolite generator was built to demonstrate and evaluate the on-air performance of the pseudolite signal. The generator consisted of a laptop computer, a Universal Software Radio Peripheral (USRP) and a precise GNSS steered oscillator. A laptop computer digitally generates a sequence of pulse pairs and provides this to the USRP. In our tests, the laptop uses a previously generated sequence of pulse pairs to provide the DME PPPM transmissions. The GNSS steered oscillator provides precise timing for the transmission of the pulse pairs. In an operational system, a hardened and

4
interference resistant timing source should be used. The USRP converts the digitally generated pulses from the laptop to an analog signal that it transmits from its antenna out port. The antenna out port is then connected to the DME/TACAN via a series of protection circuitry. This is shown in Figure 6.
Figure 6. Laboratory test of DME PPPM Pseudolite Generator with playback computer (left) and receive computer (right) The DME PPPM pseudolite generator was installed on a recent model commercial DME/TACAN transponder, the Moog MM-7000. Rather than interrogating over-the-air, the system couples into the cable between the transponder and its antenna. Protection and isolation components (directional coupler, attenuator and isolator) were added to prevent high power DME transmissions from damaging the circuitry of the PPPM generator while allowing low power PPPM generator signals to interrogate the DME transponder. It also prevents the PPPM generator signals from going to the antenna and being transmitted out. To the DME transponder, the PPPM generator transmissions looks like that from any other aircraft. The block diagram of the coupling setup is shown in Figure 7 along with the approximate signal strength of the PPPM and DME transponder reply signal at each node.
Figure 7. Integration of DME PPPM Pseudolite Generator with Existing DME Transponder
The block diagram of the DME/TACAN is shown in Figure 8. The figure shows that the PPPM along with simulated traffic was injected via the standard radio frequency (RF) port. Ohio University made modifications to the unit which are described in more details in [6]. The modifications are not needed for PPPM. These modifications allows for the transmission of priority eDME and for test measurements. Both these eDME transmissions are tested simultaneously and can co-exist. On-Air Test The on-air test with the MM-7000 operating using a dB systems 510A omni-directional DME antenna was conducted at Ohio University airport outside Athens, Ohio. The system operates on DME channel 83Y which has interrogation and reply frequencies of 1107 MHz and 1044 MHz, respectively. It uses the designator “XJJ” and is operated experimentally. Hence, the only user of the transponder should be Ohio University test aircraft.
Figure 8. Modified Moog MM-7000 TACAN for enhanced DME tests [6] Since there was essentially no traffic using the transponder, it was loaded with interrogations to simulate a fully loaded DME with 100 aircraft [7]. Of the 100 aircraft, two are in search and the rest are in tracking mode. An aircraft interrogator in search mode interrogates at a much higher rate than one in tracking. The result is an average of 3007 interrogations per second with a minimum of 2520 and a maximum of 3579 with the simulated sequence repeated every 24.73 seconds. The air traffic is modeled as the flying in and out of coverage. This results in varying signal power of between -65 to -90 decibels relative to 1 milliWatt (dBm). Additionally MM-7000 transmitted pseudo random sequence at 250 ppps to test the carrier phase based pseudolite. This was triggered in the MM-7000 internally and has priority over other interrogations. This sequence was repeated every 30 seconds. Finally, the MM-7000 self-interrogates 100 ppps for monitoring purposes. When fully loaded, there is effectively 3100 to 4200 non-priority interrogation ppps.

5
On the reception side, data collection equipment was installed both on the ground and the Ohio University Beechcraft Baron used for the flight test. Raw intermediate frequency (IF) signal is collected on the ground and in the air by USRPs connected to data collection computers. The suite is part of the APNT flight test suite developed by Ohio University. This includes an equipment rack containing data servers, integrated GPS/INS truth system and precise time. This system has been developed and used for several flight tests [5][6]. The collected signals are time tagged using GNSS. These signals are later processed to determine the time of arrival (TOA) of the half amplitude point of the first pulse. Post-processing is also conducted to further refine the GNSS based time tag and hence the TOA.
Figure 9. DME antenna locations under Ohio University Baron aircraft The Baron carried two DME antennas as seen in Figure 9. One antenna was used for data collection and to feed a commercial DME interrogator (DME 2100). The other antenna fed into a DME signal analyzer (EDS-300). Data from one ground and five flight tests conducted in March 2015 are available for evaluating the performance of DME PPPM. The ground test provided data collected at the DME transponder. Table 2 shows the flights and their corresponding altitudes. Table 2. March 2015 flight altitudes
Date/Time Cruise Altitude (MSL) ft March 10 AM 6000-7000 March 10 PM 4000-5000 March 11 PM 10500 March 12 PM 10300 March 13 AM 3300
3. DME PPPM PROCESSING Processing DME PPPM takes several steps. First, it is necessary to align the receiver time with the one second DME PPPM frame using the synchronization transmission. After alignment, the data symbols can then be demodulated. Because of errors and erasures on the data symbols, the data is encoded with FEC. So error correction processing is employed to decode the data. Other steps may be employed to improve the processing performance. Estimating drift rates can help with data demodulation while conducting a coarse acquisition to refine the narrow space can help with processing speed. The overall DME PPPM synchronization and data processing flow is shown in Figure 10.
Figure 10. DME PPPM Processing Flowchart
Figure 11. Correlation of Interrogation with Reply Pulse Pairs to Acquire Initial Range Estimate The first step is alignment using the synchronization sequence. The basic synchronization process is similar to the acquisition/search process in a traditional DME interrogator. Traditional search starts with the interrogator transmitting a series of interrogations over a short period of time with a random time delay between each interrogation. At the same time, it receives the various replies from the transponder that it interrogates. As it knows the time offsets between its interrogations, it looks for a set of reply pulse pairs that have the same time offsets. The search can be accomplished by correlating the interrogation time series with the reply time series as shown in Figure 11. The search should account for error sources such as missing replies and variations in time of
Coarse Sync on Pulse Pair TOAs
(“Acquire”)
# Sync Pulses Found >
Threshold?
Get Set of Pulse Pair TOAs
Fine Alignment on Sync Pulse Pairs
(“Track”)
Calculate drift error?
Determine Data Symbol
Apply Error Correction
Determine Drift & Apply to TOA
Get Set of Pulse Pair TOAs
Alignment Verified?
NO
YES
NO
YES
NO
YES
Interrogation
Reply
Correlation
FoundFrom Replies
Interrogation
Pulse Pair
Pulse Pair
Flag/Boolean
Flag/Booelan
Reply
Interrogation
Legend

6
arrival. The variations are due to factors such as ground interrogator clock drift, aircraft clock drift, reply delay errors, etc. as well as aircraft motion. In DME PPPM, the synchronization sequence is used in place of the interrogation sequence. So, the aircraft acquires the synchronization frame by matching the received reply time series with the known synchronization time series. The processing employed for our analysis uses correlation to make the match. A segment of data, typically 1 to 2 seconds, is used to perform correlation for the initial alignment. The estimated TOA of each pulse pair is rounded to the nearest 100 nanosecond (ns). The result is used to create a uniformly sampled Boolean sequence with each sample spaced 100 ns apart that is large enough to encompass the first and last sample of the data segment. The sequence is Boolean with one representing a pulse pair arrival and zero representing anything else. A Boolean sequence using the same spacing and based on the ideal sync sequence is also generated. Because of the error sources, the correlation must allow for some variation in the times of arrival relative to the ideal sequence. We define acceptance tolerance as the allowed maximum deviation from the nominal time of arrival relative to the synchronization. The Boolean sync sequence is modified so that samples within the acceptance tolerance of the ideal sync TOA also are set to one. Once initial acquisition is accomplished, an alignment is performed over a shorter segment of data. In the paper, every half-second is used. For the alignment, the search span is narrowed to a smaller time window centered about the expected start of the sequence given the acquisition or previous alignment. The result of the alignment yields the number of presumed synchronization pulse pairs found as well as their deviation from the ideal. The alignment can be used to determine range and error may be used to estimate drift. Once the frame is established, the data can be demodulated since the allowable times for the PPPM transmissions will then be known. Data is demodulated by examining whether a reply pulse pair is received at an allowed time. While there should be only one PPPM data pulse pair in each segment, it is possible to have no or multiple pulse pairs arrive at an allowed time which results in an erasure. Data symbol errors are also possible. Factors Affecting PPPM Processing Different processing can affect performance of the DME PPPM. Identification of pulse pair TOA is a key first step. Traditional half amplitude methods can be employed. Other processing can also be used as long as it is consistent for all DME PPPM pulse pairs. That is
because the DME PPPM processing relies on the differential TOA between its pulse pairs. There are correlated errors that build up over time. These errors are due to aircraft velocity, aircraft clock drift and ground clock drift. The synchronization pulse pairs, which arrive at known time offsets relative to each other, can be used to estimate the cumulative effect and correct for some of the error. This can aid correct identification the data pulse pairs. Acceptance tolerance is another important parameter. It can significant effect the number of correct sync and data symbols found as well as errors and erasure rates. Acceptance tolerance affects the number of DME PPPM pulse pairs found as well as reply pulse pairs misidentified. For example, a larger acceptance tolerance will result in finding more DME PPPM pulse pairs. However, the larger acceptance tolerance will also result in more misidentifications where a DME reply is misidentified as a DME PPPM transmission. For synchronization, having larger acceptance tolerance leads to having more correctly identified pulse pairs which can lower pseudo range error as it increases the number of pulses averaged. However, misidentifications can increase pseudo range error and as well as cause errors in the drift estimate, which can then affect data. If the acceptance tolerance is small, the pseudo range error caused by a misidentification is small. For data, having a larger acceptance tolerance will lead to identifying more data pulse pairs but it will also lead to more errors and erasures. In both cases, we want to choose an acceptance tolerance where the gains from getting more correct DME PPPM pulse pairs outstrip the cost of errors or erasures. So while acceptance tolerance effects both sync and data, the optimal tradeoff between finding more DME PPPM and having more misidentification may be different. Hence different acceptance tolerances may be used for sync and for data. 4. SYNCHRONIZATION PERFORMANCE
We first examine the performance of the DME PPPM synchronization transmission. Synchronization in DME PPPM allows the user to establish the DME PPPM frame and determine the pseudo range. From the sync pulse pairs, the time of transmission indicated by the transponder is established. That along with the measured time of arrival yields pseudo range. In this section, the amount of synchronization pulse pairs received and the variation in their time of arrival is examined. The number of pulse pairs found drives ranging accuracy. The ranging accuracy of DME pulse pairs and the effects of averaging is discussed in other papers such as [8].

7
Synchronization Rate The ability to acquire and align was tested on data collected on the ground and in the air. We examine the reception rate which we define this paper as the number of DME PPPM pulse pairs received divided by the total number of DME PPPM interrogations to the transponder. Not all of these interrogations will result in a reply and so we will have missing DME PPPM pulse pairs just from interacting with the transponder. A comparison of received synchronization pulse pairs with theory indicates missing sync pulse pairs are likely not transmitted as other interrogations and transmission may have preempted them. The ground test provides the best-case, on-air scenario as the receiver is static and is at the transponder. So it gets the signal with high signal strength. Figure 12 shows the percentage of synchronization pulse pairs identified each second for the ground test. It initially starts at about 95% as there is the 250 ppps carrier phase pseudolite and the 100 monitor ppps. Afterwards, the simulated traffic load is added. With other traffic competing, about 75% of all possible sync pulse pairs are measured.
Figure 12. Percentage of Synchronization Pulse Pairs Received (Static Ground Test, March 9 2015)
Figure 13. Mean Reply Efficiency (Simulated)
This results can be compared to theory. The analysis uses the model for reply efficiency, the percentage of interrogations that are replied, developed in [3]. The analysis models the competing incoming pulse pairs and is modified to account for the priority 250 ppps which do not have to compete. However, the model is generic and does not account for any unique features of the MM-7000 that improve performance. It is important to note that while the DME is loaded with up to 4200 non-priority ppps, it will tune its receiver sensitivity so that it only responds to 2700 ppps. So interrogations received with very low power are ignored and only higher power interrogations like the DME PPPM that are above the sensitivity level may be replied to. As 250 replies per second are used by the priority eDME, the operating point to consider is 2450 ppps (2700 – 250 ppps). Figure 13 shows the comparison of mean number of reply pulse pairs and reply efficiency. At 2450 replies per second, a DME should issue replies to 71% interrogations that meet its sensitivity level with the losses due to competing interrogations. The result is an estimate as the model only estimates the number of interrogations the transponder is sensitive to. There are periods in Figure 12 where the reception rate was significantly worse. These reduced reception periods are anticipated. Most are due to the DME Morse code identification transmission (“ident”) which occurs every 30 seconds and lasts for about 5 seconds. During the transmission period of each Morse code dot or dash, the transponder will not transmit any replies. Other instances occur during the last second of the 29 second DME PPPM cycle used. During that second, the DME PPPM generator only interrogates for 0.6 seconds to allow for time to restart (“restart”). Hence these losses are not due to the PPPM scheme but rather our test set up. However, the design will have to handle DME ident as this is an inherent part of DME.
Figure 14. Percentage of Synchronization Pulse Pairs Received (Flight Test, March 10 2015, Afternoon) The performance of the synchronization transmissions in flight is similar to that on the ground. Figure 14 shows the percentage of synchronization pulse pairs identified each second for the flight test on the afternoon of March

8
10. Excluding the previously discussed ident and restart periods, about 70 - 75% of sync pulse pairs were received and acquired. However, there is more variation with flight data. There remain some periods where reception is noticeably poorer than the 75% level. The periods of lower reception are examined by comparing the sync reception rate with reception of all pulse pairs from the ground station. Figure 15 shows the comparison of sync pulse pair reception rate and total pulses received during a period of poorer reception. The plot shows that the receptions levels between the sync and overall pulse pairs match well and that the sync losses correspond to lower reception in general. The source of the lower reception is the poor signal strength during these periods. Figure 16 shows the mean signal strength and the total number of pulse pairs received over a period of poor reception. Again, there is good correlation indicating that the lower reception rates are caused by lower reception power.
Figure 15. Sync Pulse Reception Rate and Total Pulse Pair Reception during Period of Poor Reception
Figure 16. Total Pulse Pair Reception and Mean Signal Strength during Period of Poor Reception One cause for the lower signal strength is line of sight attenuation from aircraft maneuvers such as banking away from the transponder. Figure 17 shows the sync reception rates plotted along the paths of the various flights. At this level of resolution, the reception rates are generally at 70 - 80% level. Figure 18 shows a zoomed in view of one section to show more detail. This section was specifically chosen as it is one of the poorer sections for
reception. The sync reception rates are poorer at turns which bank the antenna, located on the bottom of the aircraft, away from the ground transponder. Another instance with poor reception rates are near the airport where we are at low altitudes and may have poor line of sight due to blockage from the ground or the airframe. Even with the lower reception rates, the worst case is no lower rates than 50%. This level is adequate for synchronization especially when using a half second to a full second worth of synchronization pulse pairs (75 and 150 pulse pairs, respectively). Current DME avionics use about 30 ppps for acquiring a transponder.
Figure 17. Synchronization Pulse Pair Reception Rate for All Flights
Figure 18. Synchronization Pulse Pair Reception Rate for All Flights (Zoomed) The statistics for sync reception rates for the ground and flight tests are provided in Table 3. These statistics exclude ident and restart periods. The table also shows the cruise altitudes of the flights. The worst performance occurs for flights at lower altitudes which is consistent with the results of the previous discussion. Again, this

9
suggests that at low altitudes there are some reception issues perhaps due to obstructions or multipath [8]. Table 3. Mean & Standard Deviation Synchronization Reception Rate for Each Test Conducted
Date Mean Sync Std Sync Cruise Altitude (MSL)
0309 Ground 75.8 % 6.36 % N/A
0310 AM 71.1 % 12.74 % 6000-7000 ft
0310 PM 68.9 % 15.22 % 4000-5000 ft
0311 PM 74.8 % 7.78 % 10500 ft
0312 PM 74.8 % 7.45 % 10300 ft
0313 AM 71.1 % 10.87% 3300 ft
Synchronization Error There are two possible mistakes that can be made with synchronization. One mistake is an erasure whereby the synchronization pulse pair is not transmitted (or not received). The non-transmission is usually due to the sync transmission being superseded by an earlier transponder transmission such as a reply to an aircraft. As seen previously, for the level of traffic experienced by our transponder, such an event occurs for about 25% of the sync pulse pairs. This event is not a problem and is anticipated. A potentially more problematic event is an error whereby a reply to an aircraft is misidentified as a synchronization pulse pair. This can occur if there is a reply that is transmitted slightly before a sync pulse pair transmission time. In the case, the receiver would accept the reply as the sync pulse pair if it is within the acceptance tolerance. If the synchronization pulse pairs are used to estimate the TOA measurement drift, this scenario can cause a faulty measurement that can bias the estimate. Fortunately, this scenario should not occur to often and significant deviations may be detected and excluded. Additionally, the deviation is already limited to the level of the acceptance tolerance.
Figure 19. Measured sync TOA variation relative to ideal (at different times from start – see legend), March 9, Ground test
Figure 19 shows the variation of the identified sync versus an ideal TOA for the ground test. Variations in the air are larger as shown in Figure 20. Note that in both cases, sync errors within the same second are consistent with some outliers, potentially from misidentification or poor measurement of TOA.
Figure 20. Measured sync TOA variation relative to ideal (at different times from start), March 10 PM 5. DATA DEMODULATION PERFORMANCE There are more forms of loss with PPPM data than with synchronization. The main erasure and error types associated with PPPM data are shown in Figure 21. There are several ways to have data erasure. An erasure can occur if the receiver cannot identify a DME PPPM data pulse pair or if it identifies multiple DME PPPM data pulse pairs in a segment. The former case occurs if the PPPM data pulse pair is not transmitted because an earlier transmission superseded it. Additionally, there should not be another pulse pair within the acceptance tolerance of an acceptable time. This is the Type 1 erasure shown in the figure. The latter case occurs because a receiver may not be able to decide on a correct symbol if it finds two or more acceptable pulse pairs in a segment. And so it declares an erasure. One way this occurs is if the PPPM data pulse pair is transmitted but there is also one or more reply pulse pairs that arrives within the acceptance tolerance of other acceptable times. This is a type 2 erasure as shown in the figure and it is a loss that would not occur with synchronization. Another way is if the PPPM data pulse pair is not transmitted but there are two or more reply pulse pairs arrive within the acceptance tolerance of acceptable times (Type 3). An error occurs if a PPPM data pulse pair is not transmitted and there is one reply pulse pair that arrives within the acceptance tolerance of acceptable times. With synchronization, this would be an erasure and not an error.

10
Figure 21. Types of Error and Erasures in DME PPPM Data (when there is overlap, only the early pulse pair is transmitted)
Data Reception As indicated previously, it is expected that data reception rates would be close to but not as good as sync as there are more ways to miss data pulse pairs. However, the actual performance will depends factors such as processing and acceptance tolerance. In the assessments shown, an acceptance tolerance of 600 ns is used as the baseline. Figure 22 shows the comparison of the data and sync reception rates for the ground test. As the true data symbols are known, the number of correct data symbols is calculated and shown. As expected, there is a strong relationship between the performance of sync and data on the ground with the sync performance being slightly better. The relationship between the two rates is shown in Figure 23 which plots the sync against correct data symbol reception rate. From the figure, one can see there is a linear relationship with a slope slightly less than one indicating that the data performance is slightly worse than sync.
Figure 22. Percentage of Correct Data (Top) and Synchronization Pulse Pairs Received (Bottom) (Static Ground Test, March 9 2015)
Figure 23. Correct Sync Symbol vs Correct Data Symbol Reception Rates The overall correct data reception rate for some of the tests is presented in Table 4. Compared to sync performance as shown in Table 3, the data reception is around 8-14 percent lower. The reduced reception rate from sync to data is worse in flight – 12 to 14% lower. As mentioned previously, processing and settings can affect performance and likely is one contributor. We are investigating the causes of the difference.
Table 4. Correct Data Reception Rate Statistics (600 ns acceptance tolerance) Test Mean (%) Standard Deviation (%) 0309, Ground 67.2% 3.7% 0310 AM, Air 59.2% 13.1% 0310 PM, Air 56.4% 15.3%
We can see the effect of acceptance tolerance by examining the data reception rate at two different values: 1000 ns and 600 ns. Table 5 shows the data reception performance for an acceptance tolerance of 1000 ns. Compared with Table 4, 600 ns has better reception performance by 5.5-6.5%. This is because the reduced misidentification outweighs the reduced detection. The error and erasure rate is larger than theory. This is understandable as theory does not account for variations in TOA that are experienced. Table 5. Correct Data Reception Rate Statistics (1000 ns acceptance tolerance) Test Mean (%) Standard Deviation (%) 0309, Ground 60.7% 4.4% 0310 AM, Air 53.9% 10.7% 0310 PM, Air 51.9% 12.5%
Data Erasure & Error Rate The erasure rate is presented in Table 6. We compare this result to the probability of symbol erasure calculated from analysis and simulation. The analysis and simulation uses
Segment
1st pulse pair start opportunity
Error Example:
Erasure Examples:
Type 1: No symbol
Type 2: 2 or more symbols (1 correct)
Type 3: 2 (or more) symbols (both incorrect)
DME PPPM & dead time
DME (from a/c) pulse pair & dead time

11
the models developed in [3]. The analytical model is statistical and more conservative while the simulation models the interaction. The theoretical erasure rates for acceptance tolerances of 600 and 1000 ns are shown in Figure 24. The erasure rates from our testing are higher than expected from theory. The flight results have larger mean and standard deviations than the ground results. However, even the ground test has about 30% higher erasure rate than expected from the simulation. It should be noted that theory does not account for all errors. Table 6. Erasure Rate Statistics (600 & 1000 ns) Test Mean (%) Standard Deviation (%) 0309, Ground 600 ns 29.3% 3.4% 0310 AM, Air 600 ns 36.4% 11.7% 0310 PM, Air 600 39.0% 14.0% 0309, Ground 1000 ns 34.1% 3.8% 0310 AM, Air 1000 ns 39.5% 8.7% 0310 PM, Air 1000 ns 41.4% 10.5%
Figure 24. Symbol Erasure Rates from Analytical (dashed) and Simulation (solid) Model for Two Acceptance Tolerances (600 and 1000 ns) The error rate is presented in Table 7. This can be compared to the results in Figure 25 which shows the probability of symbol error calculated from analysis and simulation [3]. Acceptance tolerance of 600 and 1000 ns is shown. As with the erasure rate, error rate is higher than expected from theory. The difference is even greater with error. The theory results helps suggest why an acceptance tolerance of 600 ns performs better as it has lower erasures and errors rates about 3 and 1.5%, respectively. Table 7. Error Rate Statistics (600 and 1000 ns) Test Mean (%) Standard Deviation 0309, Ground, 600 ns 3.5% 1.0% 0310 AM, Air, 600 ns 4.4% 1.9% 0310 PM, Air, 600 ns 4.6% 1.9% 0309, Ground, 1000 ns 5.2% 1.2% 0310 AM, Air, 1000 ns 6.6% 2.6% 0310 PM, Air, 1000 ns 6.8% 2.5%
Figure 25. Symbol Error Rates from Analytical (dashed) and Simulation (solid) Model for Two Acceptance Tolerances (600 and 1000 ns) These results suggest that using about 75% of the symbols for FEC should be adequate. Preliminary analysis of the data transmission which used about 50% of the symbols for FEC showed this was adequate for the ground but not for the air. 75% use for FEC should result in over 500 bits per second (bps) of data. This should be enough to provide regular updates of station information, integrity as well as additional services and authentication [4]. 6. CONCLUSIONS
The paper presents a field tested implementation of enhanced DME pseudolite using pulse pair position modulation. These tests show that PPPM pseudolite can bring eDME to existing DME without needing to modify the transponder hardware. A DME PPPM generator applique was created and integrated into a commercial DME transponder. On-air testing demonstrated the performance of DME PPPM. The performance of the DME PPPM synchronization and data transmission is assessed for ground and flight tests. The paper demonstrates that synchronization performance and availability is generally good and should be at least as good as the nominal availability of DME. Data reception is a little worse than synchronization. However, losses are anticipated and properly implemented FEC could result in high message demodulation probability with a reasonable data rate (~500 bps). Furthermore, some improvements may be possible as its performance is worse than previously developed theoretical results. Overall, the results are good especially since the performance was achieved under the presence of injected traffic representing a fully loaded DME, a condition that is currently rarely encountered [9].

12
Additional analysis on the data performance is still being conducted. This paper provided some basic error and erasure statistics. Detailed analysis will help with design and selection of optimal parameters for the design. Additional analysis on the performance of FEC implemented is also being conducted. ACKNOWLEDGMENTS The authors would like to thank the FAA Navigation Services Directorate for supporting this work. We would also like to acknowledge the rest of the APNT Team for their inputs. We would also like to thank Jaime Edwards and Adam Naab-Levy for their help in the flight tests.
DISCLAIMER The views expressed herein are those of the authors and are not to be construed as official or reflecting the views of the Federal Aviation Administration or Department of Transportation.
REFERENCES [1] L. Eldredge, et al., “Alternative Positioning, Navigation & Timing (PNT) Study,” International Civil Aviation Organisation Navigation Systems Panel (NSP), Working Group Meetings, Montreal, Canada, May 2010 [2] R. J. Kelly and D. R. Cusick, “Distance Measuring Equipment in Aviation,” Advances in Electronics and Electron Physics, Volume 68, Academic Press, New York, 1986 [3] S. Lo, P. Enge “Assessing the Capability of Distance Measuring Equipment (DME) to Support Future Air Traffic Capacity”, Navigation: The Journal of the Institute of Navigation, Vol. 59 No. 4, Winter 2012 [4] S. Lo, P. Enge, M. Narins, "Design of a Passive Ranging System Using Existing Distance Measuring Equipment (DME) Signals & Transmitters", Navigation: The Journal of the Institute of Navigation, Vol. 62, No. 2, Summer 2015 [5] K. Li, W. Pelgrum, "Enhanced DME Carrier Phase: Concepts, Implementation, and Flight-test Results", NAVIGATION, Journal of The Institute of Navigation, Vol. 60, No. 3, Fall 2013, pp. 209-220.
[6] W. Pelgrum, K. Li, A. Naab-Levy, A. Soelter, G. Weida, A. Helwig, "eDME On Air: Design, Implementation, and Flight-Test Demonstration," Proceedings of the 2015 International Technical Meeting of The Institute of Navigation, Dana Point, California, January 2015, pp. 40-61.
[7] International Civil Aviation Organization (ICAO), International Standards and Recommended Practices, Annex 10 to the Convention on International Civil Aviation, Volume I Radio Navigation Aids, 6th Edition, July 2006. [8] W. Pelgrum, K. Li, "An Investigation on the Contributing Factors of Enhanced DME Ranging Errors," Proceedings of the 28th International Technical Meeting of The Satellite Division of the Institute of Navigation (ION GNSS+ 2015), Tampa, Florida, September 2015, pp. 1333-1380.
[9] F. A. Alder, R. J. Thomas, C. C. Hawes, and M. F. DiBenedetto, “Distance Measuring Equipment (DME) – Interrogation Rate Measurements, Observations, and Results: Elyria, OH; Atlanta, GA; and Chicago, IL,” Technical Memorandum, OU/AEC 08-23TM0071/3,3-3, December 2008.