flodesign study design 042312 - altamontsrcarchive.org
TRANSCRIPT
P-238
1
DRAFT STUDY DESIGN FOR TESTING COLLISION RISK OF FLODESIGN WIND TURBINE IN FORMER AES SEAWEST WIND PROJECTS IN THE ALTAMONT
PASS WIND RESOURCE AREA (APWRA)
K. Shawn Smallwood
23 April 2012
To test whether the FloDesign mixer-ejector wind turbine (MEWT) will cause bird fatalities due to collisions, FloDesign purchased the wind power assets in the Altamont Pass that were formerly owned by AES Seawest. FloDesign acquired these assets to perform a Before-After, Control-Impact (BACI) study (Anderson et al. 1999) at a larger number of wind turbines than originally planned (SRC P223). FloDesign took this step because in September 2011 the SRC recommended a BACI design, and agreed with me that the original trial-level study could serve as an indicator of avian safety, but would likely not generate conclusive results (SRC P226). Hence, FloDesign and I agreed to expand the study for the purpose of obtaining more conclusive results. I also prepared a grant proposal to support the study, and was recently awarded a grant by the California Energy Commission’s Public Interest Energy Research (PIER) program. GOALS AND OBJECTIVES In addition to testing the avian safety of the MEWT, we proposed a methodology to PIER that was intended to produce behavior data that will improve collision risk models (Tucker 1996a,b; Smales 2005; Band et al. 2005; Chamberlain et al. 2006; Podolsky 2005; Whitfield 2009; Nations and Erickson 2010) and map-based collision hazard models (Smallwood and Neher 2009; Smallwood and Neher 2010a,b), the former of which is increasingly being used to predict impacts and the latter of which is being used to more carefully site wind turbines. We wanted to ensure that, even if the MEWT fails to reduce bird fatalities, our study will nevertheless contribute useful information for wind turbine siting and impact assessments. Our goals are to (1) test whether shrouded wind turbines are safer to birds than open-bladed turbines, and (2) develop the predictive tools needed to most safely and most quickly site both types of wind turbine in new projects. Our study objectives are the following: (1) Compare avian interactions with wind turbines between MEWTs and conventional turbines
at known high-fatality sites during day and night and various wind and terrain conditions; (2) Compare avian fatality rates between MEWTs and conventional turbines at known high-
fatality sites, using a short search interval and a BACI design; (3) Explain variation in fatality rates by turbine design, flight patterns, and avian interactions
with wind turbines, i.e., avoidance behaviors; and, (4) Provide field-tested behavior survey methods and data that inform avoidance rates in
collision risk models and map-based collision hazard models to guide wind turbine siting.
P-238
2
The study plan changed somewhat from the proposal the SRC reviewed in 2011. These changes were due principally to SRC comments and recommendations following its review of my 2011 study proposal. With FloDesign’s support, I followed the SRC’s recommendations and responded to comments and concerns. I prepared a study plan for a larger experiment, and subsequently transformed the study plan into a grant proposal, which I submitted to PIER. I won the PIER grant. At about the same time, FloDesign acquired the wind assets of AES SeaWest in the APWRA. The study increased in size from 10 MEWTs to 40 MEWTs. It shifted locations from Patterson Pass to four sites managed by AES SeaWest. It involves four types of old-generation wind turbines instead of one. It also includes both fatality searches and behavior surveys through the entire winter shutdown period, or year-round. Recent Developments Although the PIER funds will not be available until July 2012, FloDesign and I decided to begin the study prior to the availability of PIER funds. We had told the SRC in September 2011 that we intended to begin the trial-level study at the end of the winter shutdown, or on 15 February 2012. We believed the SRC expected us to begin by 15 February, so we decided to initiate the study as close to that date as possible. I began scouting for observation stations and working out logistical issues by late February, and we began fatality searches on 3 April 2012. We started with one searcher, and added two more a week later. We completed 3 rounds of searches as of 20 April 2012, but we had not begun behavior surveys as of 23 April. We decided to phase in the study elements as we develop proficiency, element by element. Another advantage of beginning the study ahead of the PIER funds is to implement the methods and collect data for presentation at the May 2012 SRC meeting. We wanted to be able to inform the SRC about which study elements are working, and which might need some feedback from the SRC. At the end of this report, I make specific suggestions and queries to the SRC. FATALITY STUDY DESIGN I designed an experiment intended to maximize the likelihood of detecting an effect of the MEWT on avian collisions. To do this, I relied on four years of fatality monitoring data to identify the wind turbines associated with the highest rates of found bird carcasses. I then assigned the high-fatality turbines to a MEWT replacement treatment and a control treatment, and I replicated and interspersed the treatments. The study area includes 403 wind turbines formerly owned by AES SeaWest (AES SeaWest continues to manage these turbines). These 403 turbines included 144 40-KW turbines in the Altech I project, 12 65-KW turbines in the Swamp (TV 11 & 12) project, 183 65-KW turbines in the Taxvest project at the Mountain House and Midway Road sites, 38 65-KW turbines in the Venture Winds project, and 26 65-KW turbines in the Viking project. The numbers of wind turbines in each project were derived from information gathered several years ago, but since then some wind turbines were removed due to attrition and due to the SRC’s ratings of turbines as posing greater collision hazard to raptors.

P-238
3
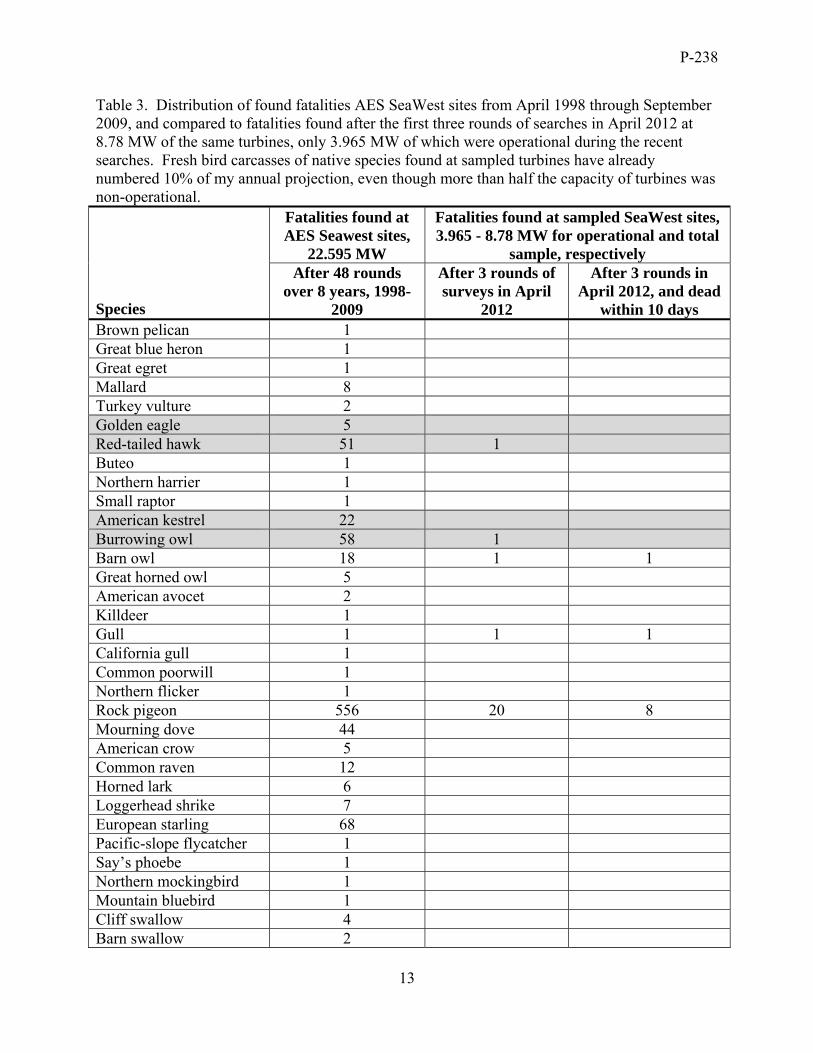
Clusters of wind turbines can be replaced by MEWTs to provide reasonable buffer space between MEWTs and other wind turbines. The buffer space minimizes experimental contamination caused by bird carcasses being thrown by the blades of adjacent turbines onto the search area of MEWTs, and vice versa. In longer turbine rows, MEWTs can replace high-fatality turbines while adding a buffer space by removing and not replacing one or more of the 65-KW turbines between the MEWTs and the remainder of the older turbines in the row. This buffer can be achieved without loss of power generation because the replacement ratio of 100-KW MEWTs for 65-KW old turbines is 1 for 2.5 in the case of 40-KW turbines, and 1 for 1.5 in the case of 65-KW turbines. I used four years of fatality monitoring data from the 2005 to 2009 period to calculate detected fatality rates per wind turbine. I did not adjust detected fatality rates for searcher detection error or scavenger removal rates, because I was attempting to characterize the numbers of bird carcasses actually found. I also omitted European starling and rock pigeon fatalities from fatality detection rates because these non-native species were killed in high numbers at AES SeaWest sites. Detected fatality rates represented the number of native birds found per MW per year. The four years of fatality monitoring I relied upon was based on an average of about 30 days between searches, but I would prefer to achieve two searches per week for the FloDesign study. A 48-hour search interval in an earlier study resulted in 2.4 times the detections of small bird fatalities than were expected by conventional scavenger removal rates applied to data concurrently collected at the same turbines using a 30 day search interval (Smallwood 2009b). Therefore, we can expect to find more fatalities per turbine with the proposed higher search interval. I identified 60 high-fatality clusters of wind turbines among the 403 examined. From these 60, I randomly selected clusters to be assigned to the FloDesign replacement treatment. For each randomly selected high-fatality cluster, I assigned the nearest, similar-sized cluster to the control treatment. This approach ensured interspersion of treatments. I assigned 40 FloDesign turbines to the high-fatality clusters randomly selected for the replacement treatment (Table 1). Some adjustments were necessary due to wind turbines having been removed per SRC recommendations. Where wind turbines were lost within a string, other turbines adjacent to the originally selected turbines were selected to replace the missing turbines. In one case, an entire string of wind turbines had been removed, so I selected the high-fatality cluster nearest to this string -- the next string to the west. The layout of the wind turbines to be searched is depicted in Appendix 1. Based on a two day search interval, I estimated 88 native birds would be found in a year at the wind turbines assigned to replacement and control groups prior to replacement at the AES sites (Table 2). I estimated that 41.5 birds would be found at the control turbines, and 46.5 would be found at the replacement turbines. Of course, once the turbines are replaced, my research hypothesis is that many fewer birds would be found than 46.5 at the replacement sites during the ensuing year. After 3 rounds of searches in April 2012, we found 28 fatalities (Table 3). Of these 28 fatalities, 20 were rock pigeons. Twelve of the 28 fatalities were sufficiently fresh for use in fatality rate estimates at the average search interval we hope to achieve. Four of the fatalities were recently

P-238
4
dead native birds. However, 55% of the capacity of the study turbines was non-operational during April 2012 due to a malfunctioning circuit at the substation. All 12 of the freshly killed birds were found at operational wind turbines, and four of these were native species. Adjusting for the capacity of wind turbines offline, we already found 10% of our projected annual number of freshly killed, native birds. Once the circuit is repaired and all the wind turbines in our study are operational, I predict that our fatality projections will be met. FATALITY SEARCH PROTOCOL Some details of the fatality search protocol are included in the following list:
1) All fatality searches are recorded on a search schedule data sheet;
2) The ground is searched within 50 m of wind turbines selected for membership in our treatment groups;
3) Transects average about 6-7 m apart;
4) Found fatalities are recorded on data sheets, including date, species, initials of discoverer,
whether a new or repeat find, whether standard search or incidental discovery, sex, age class, estimated days since death, checklist of possible causes of death, carcass condition, including a few diagnostics that can be used to support estimates of days since death, notes, and for each body part the nearest turbine, distance and bearing to turbine, and photo labels for photos taken of the carcass parts;
5) Known repeat fatality finds are recorded on data sheets, also, but including less information than new finds;
6) Found fatalities are not moved or removed by the fatality searchers in this study;
7) Eagles and endangered species are reported to GreenRidge Services without delay, and
all other fatality finds are reported by spreadsheet to GreenRidge Services on a weekly basis;
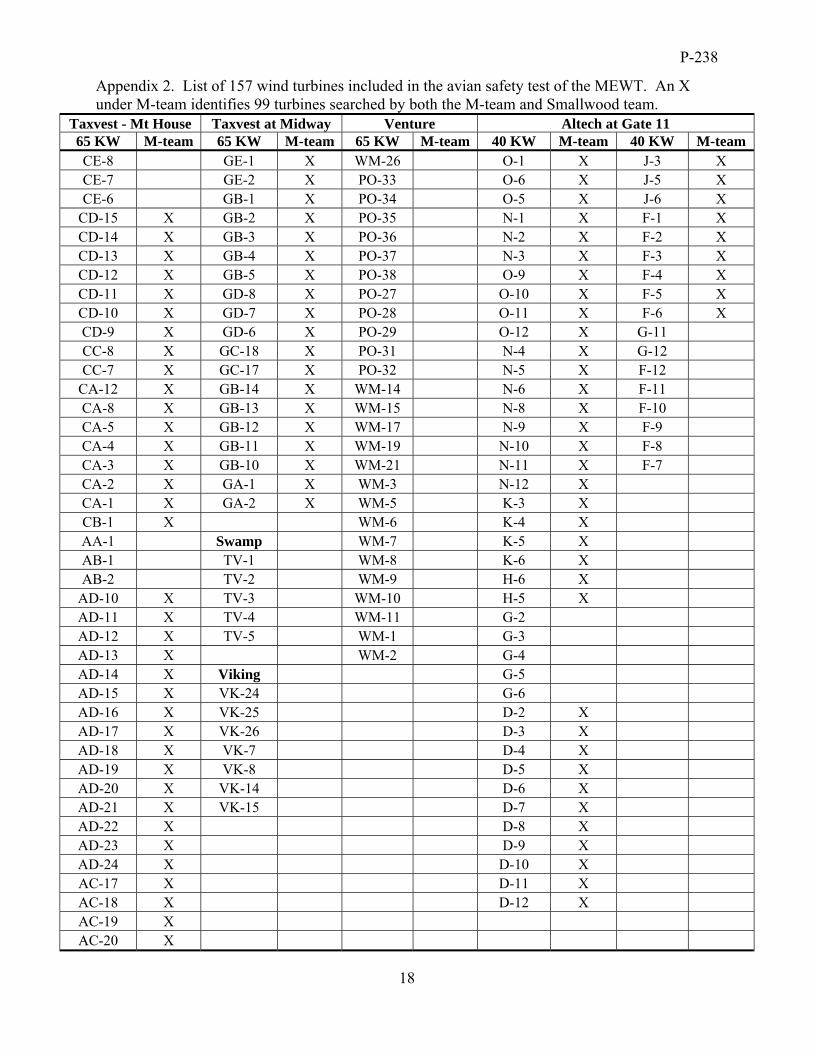
8) Because 99 of the 157 wind turbines in our study are also searched by the Alameda
County Avian Monitors (App. 1), at the end of each month, I enquire with the Alameda County Avian Monitors about any fatalities they found and removed from wind turbines included in our study; and,
9) A detection trial is performed using placed bird carcasses and a specific study design yet
to be determined. BEHAVIOR SURVEYS The standard survey methodology for avian impact assessment at wind projects has been utilization surveys, which are visual scans for birds performed by observers at prescribed stations
P-238
5
and extending out to a certain maximum distance. Over a certain time period, the number of birds is divided by the session time to arrive at a utilization rate, or use rate. Use rates are then used to test hypotheses and predict impacts. However, use rates have not always related to fatality rates, and have led to highly inaccurate predictions of fatality rates in some cases. Also, use rates contribute little toward siting of wind turbines to minimize collision risk. The rates at which certain behaviors are performed have been found to be more closely related to wind turbine collisions (Smallwood et al. 2009). Behavior rate metrics can include: Proportion of flights characterized as hovering, kiting, or contour-hunting within specific combinations of slope and wind conditions; Number of flights through the rotor zone during operating and non-operating periods; Flights within 20 m of rotors during operating and non-operating periods; Bird-minutes perched on wind turbines and specific parts of turbines; Proportion of approach vectors toward the turbine, e.g., from parallel or perpendicular to rotor plane, or from windward or leeward; Evasive behaviors exhibited by birds flying close to wind turbines; and, Reactions of birds flying across the rotor's intake or wake zones. Some of these behavior rates are useful for understanding how particular bird species interact with wind turbines in various conditions, and others are useful for predicting project impacts; all can help guide wind turbine siting in future projects. The survey approach I plan to implement is for characterizing avian behaviors that suggest how birds perceive closed-bladed versus open-bladed wind turbines, and that can facilitate the siting of wind turbines in new projects. It is for estimating behavior rates, or the relative frequency of specific flight and perching behaviors as factors vary, such as wind turbine operations, avian-encountered slope conditions, wind conditions, and the presence of other conspecifics or members of other species. This survey protocol is not intended for counting birds or for estimating relative abundance; it is not for estimating utilization rates. I selected observation stations where observers will have excellent views of existing or planned wind turbines, including of the landscape where the turbines are situated. Aerial images of the behavior plots were printed along with a radial line of 300 m near the maximum extent of the printed image (Appendix 3). Any airspace that is hidden from the observer, due to terrain occlusions or for other reasons, will be excluded from analysis by our GIS analyst using a digital elevation model (DEM) of the survey area. Whereas it is common practice in use surveys to locate observation stations on prominences such as hill peaks and ridge crests, our stations for behavior surveys were located where the observer will least influence the behaviors of the birds, as well as where views are superior of select wind turbines and the underlying landscape. I established stations next to infrastructure for use as partial blinds, usually anticipating the use a parked vehicle to augment the effectiveness of the blind. For use as partial blinds, I located stations within clusters of utility poles, next to a corral, at electrical collection boxes, under a transmission tower, next to wind turbines, next to a cement pylon, and next to a fence. During behavior surveys, I have asked that the observers take care to minimize their reactions to eagle detections, because eagles can detect attention directed their way and often will quickly move away as a result.
P-238
6
Observation sessions will last 30 min, and will be done during mornings and evenings. At the start and end of each session, the observer will record wind direction, average and maximum wind speed, temperature, percentage overcast, and whether the air is smoky or foggy or rainy. Throughout the session, the observer will record the operating status of all turbines in the surveyed area, noting cut-ins and cut-outs of each turbine. The session start time will be recorded, along with the date and observation station number, and the initials of the observer. Once the session starts, decision rules will be used to decide which bird will be tracked at any given time. Decision rules – Golden eagles will be given priority over other species. If golden eagles are not present, then visual tracking of birds will be directed in priority order to red-tailed hawks, other Buteo hawks, prairie falcon or peregrine falcon, American kestrel, burrowing owl, other owls, other native birds, and finally to non-native birds. Once a bird is being visually tracked, the observer will stay loyal to that bird as long as the bird is within the survey area, or unless a higher priority bird enters the survey area, such as a golden eagle. Priority will always be given to birds of special interest when those birds are flying within close proximity of wind turbines. Visual tracking of birds requires writing onto an image of the survey area. I hope to eventually have the observers record bird positions onto geo-referenced images on a notebook computer running ArcPad software, but for now the observations will be recorded onto paper copies of the survey areas. Points representing bird positions will be added at regular, sequential time intervals (e.g., 5 or 10 sec), and numbered sequentially. Corresponding with the point labels, the observer will record attributes of the observation into a handheld digital voice recorder: Point number, Height (above ground) and Behavior (e.g., flapping, hovering, kiting, contouring, soaring, column soaring, circling, gliding, diving, chasing, fleeing, fending off another bird, perching, displaying, carrying prey, eating, ground-hopping). When a bird is stationary, such as perching or hovering, then the observer will record the seconds into the observation when the stationary behavior begins and ends. If a hardcopy map gets too busy with points added during a particular session (this would not be a problem using a GPS or notebook computer with ArcPad), then the observer will produce another copy of the same map for further recordings. As birds approach wind turbines, additional attributes to record will include: Events (flying through rotor plane, landing on a turbine, taking off from a turbine, interacting with another bird within 50 m of a turbine) and Evasive actions (veering away; flapping hard to slow the approach or to gain lift over the turbine; flipping or banking or twisting to avoid blade collision; diving to duck under the rotor plane). If a bird is interacting with another bird, the observer will record how close the interaction puts the bird relative to the turbine, and whether the bird ever showed any awareness of the turbine’s blades. If a bird is hovering or kiting near a wind turbine, the observer will record whether and how often the bird looks back toward the turbines, and how close the bird drifts with the wind towards the turbine. If a bird flies nearby or through the wind turbine, the observer will record the angle of entry toward the rotor plane, ranging from perpendicular to parallel, and whether from the wake aspect or front aspect of the rotor. Distance from the turbine should be recorded as nearest distance from the center of the tower. All voice recordings will be transcribed to an electronic spreadsheet within 24 to 48 hours. In this way, omissions and errors related to the voice and map recordings will be corrected by fresh recall.
P-238
7
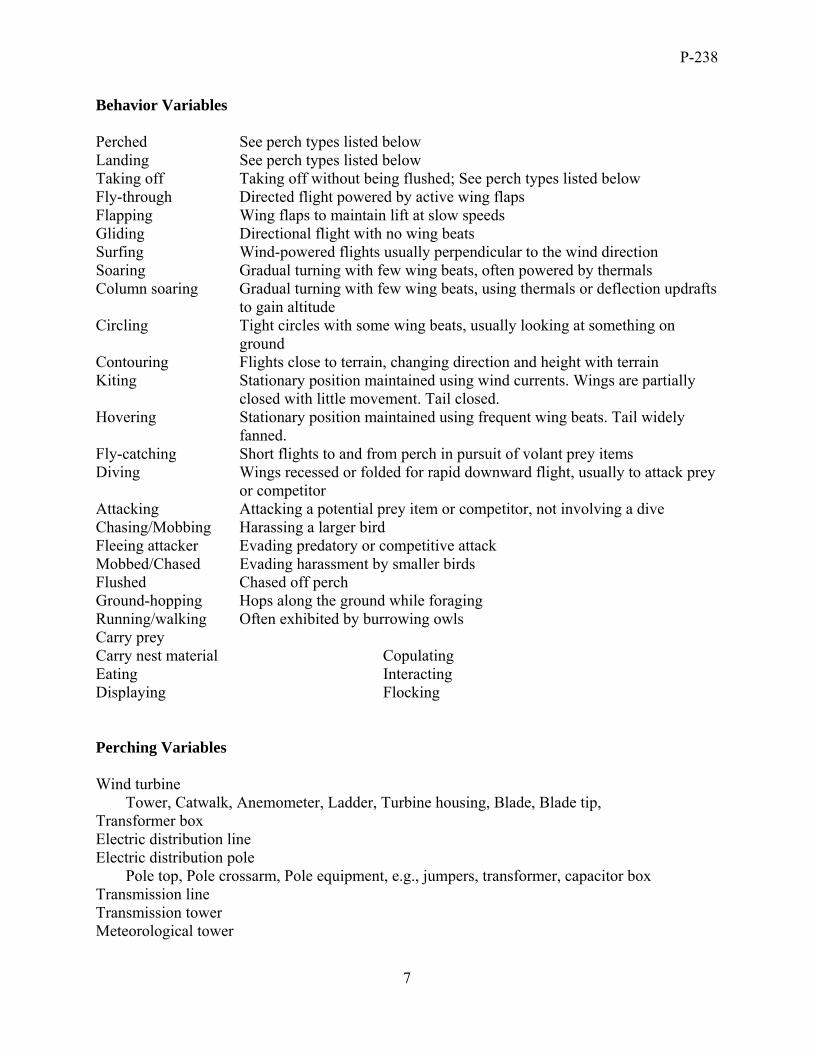
Behavior Variables Perched See perch types listed below Landing See perch types listed below Taking off Taking off without being flushed; See perch types listed below Fly-through Directed flight powered by active wing flaps Flapping Wing flaps to maintain lift at slow speeds Gliding Directional flight with no wing beats Surfing Wind-powered flights usually perpendicular to the wind direction Soaring Gradual turning with few wing beats, often powered by thermals Column soaring Gradual turning with few wing beats, using thermals or deflection updrafts
to gain altitude Circling Tight circles with some wing beats, usually looking at something on
ground Contouring Flights close to terrain, changing direction and height with terrain Kiting Stationary position maintained using wind currents. Wings are partially
closed with little movement. Tail closed. Hovering Stationary position maintained using frequent wing beats. Tail widely
fanned. Fly-catching Short flights to and from perch in pursuit of volant prey items Diving Wings recessed or folded for rapid downward flight, usually to attack prey
or competitor Attacking Attacking a potential prey item or competitor, not involving a dive Chasing/Mobbing Harassing a larger bird Fleeing attacker Evading predatory or competitive attack Mobbed/Chased Evading harassment by smaller birds Flushed Chased off perch Ground-hopping Hops along the ground while foraging Running/walking Often exhibited by burrowing owls Carry prey Carry nest material Copulating Eating Interacting Displaying Flocking Perching Variables Wind turbine Tower, Catwalk, Anemometer, Ladder, Turbine housing, Blade, Blade tip, Transformer box Electric distribution line Electric distribution pole Pole top, Pole crossarm, Pole equipment, e.g., jumpers, transformer, capacitor box Transmission line Transmission tower Meteorological tower

P-238
8
Communication tower Guy wire Terrain Water, Ground, Rock pile, Rock outcrop, Low vegetation, Tree Post, Fence, Sign Building Other landscape feature SUGGESTION AND QUERY TO SRC The following is a suggestion and a query to the SRC.
1) I request that the SRC recommend that the Alameda County Avian Monitors leave in the field all fatalities they find at wind turbines included in our study. Exceptions would be eagles and endangered species. Leaving carcasses in the field is not without precedent, and should not lead to confusion over possible double counting. If there is confusion, then one of the possible double counts can always be summarily omitted from fatality rate estimation. Not leaving carcasses in the field requires me to request the information from the Monitors, which creates more work for all of us. Furthermore, leaving carcasses in the field can serve as a built-in detection trial between the overlapping search teams.
2) The time it is taking our searchers to complete one search rotation is about 60 person-
hours. At this rate, we will not achieve all of our objectives, because this amount of time does not include behavior surveys and data entry. The time to complete a search rotation might diminish with experience on the project, but probably not by much because our searchers are already experienced. I think there are two options at this point. One option is to reduce the number of wind turbines we are searching. The second option is to reduce the number of searches per month from 8 to 6. I would like to obtain the SRC’s opinion on these options.
REFERENCES CITED Anderson, R., M., Morrison, K. Sinclair, D. Strickland. 1999. Studying wind energy and bird
interactions: a guidance document. National Wind Coordinating Committee. Washington, D.C.
Band, W., M. Madders, and D. P. Whitfield. 2005. Developing field and analytical methods to
assess avian collision risk at wind farms. In De Lucas, M., G. Janss, and M. Ferrer, eds. Birds and Wind Power. Barcelona., Spain: Lynx Edicions.
Chamberlain, D. E., M. R. Fehfisch, A. D. Fox, M. Desholm, and S. J. Anthony. 2006. The
effects of avoidance rates on bird mortality predictions made by wind turbine collision risk models. Ibis 148:198-202.

P-238
9
Nations, C. S., and W. P. Erickson. 2010. Marbled Murrelet − Wind Turbine Collision Model for the Radar Ridge Wind Resource Area. Report prepared for Energy Northwest, Richland, Washington.
Podolsky, R. 2005. Application of Risk Assessment Tools: Avian Risk of Collision Model.
Pages 86-87 in Schwartz, S. S. (RESOLVE, Inc.), ed. Proceedings of the Onshore Wildlife Interactions with Wind Developments: Research Meeting V. Lansdowne, VA. Wildlife Subcommittee of the National Wind Coordinating Committee, Washington, D.C.
Smales, I. 2005. Modelled Cumulative Impacts on the White-Bellied Sea Eagle across the
Species’ Australian Range. Report for the Department of Environment and Heritage. Project No. 5238. Biosis Research Pty Ltd., Melbourne.
Smallwood, K. S. 2010. Review of American Kestrel-Burrowing owl (KB) Scavenger Removal
Adjustments Reported in Alameda County Avian Monitoring Team’s M21 for the Altamont Pass Wind Resource Area. http://www.altamontsrc.org/alt_doc/p154_smallwood_ kb_removal_ rates_041610.pdf
Smallwood, K. S. and L. Neher. 2010a. Siting Repowered Wind Turbines to Minimize Raptor
Collisions at the Tres Vaqueros Wind Project, Contra Costa County, California. Draft Report to the East Bay Regional Park District, Oakland, California.
Smallwood, K. S. and L. Neher. 2010b. Siting Repowered Wind Turbines to Minimize Raptor
Collisions at Vasco Winds. Unpublished report to NextEra, Inc., Livermore, California. Smallwood, K. S., L. Rugge, and M. L. Morrison. 2009a. Influence of Behavior on Bird
Mortality in Wind Energy Developments: The Altamont Pass Wind Resource Area, California. Journal of Wildlife Management 73:1082-1098.
Smallwood, K. S., L. Neher, D. Bell, J. DiDonato, B. Karas, S. Snyder, and S. Lopez. 2009b.
Range Management Practices to Reduce Wind Turbine Impacts on Burrowing Owls and Other Raptors in the Altamont Pass Wind Resource Area, California. Final Report to the California Energy Commission, Public Interest Energy Research – Environmental Area, Contract No. CEC-500-2008-080. Sacramento, California. http://www.energy.ca.gov/2008publications/ CEC-500-2008-080/CEC-500-2008-080.PDF
Tucker, V.A, 1996a. A mathematical model of bird collisions with wind turbine rotors. J. Solar
Energy & Engineer. 118: 253-262. Tucker, V.A, 1996b. Using a collision model to design safer turbine rotors for birds. J. Solar
Energy & Engineer. 118: 263-269. Whitfield, D. P. 2009. Collision Avoidance of Golden Eagles at Wind Farms under the ‘Band’
Collision Risk Model. Report to Scottish Natural Heritage, Natural Research Ltd, Banchory, UK.

P-238
10
Table 1. Original experimental treatment design among the wind energy projects composing the AES SeaWest sites. The first 22 groups selected in random order would total 40 MEWT replacements, and the next 8 groups selected would total 50 MEWT replacements. We are planning to use 40 MEWTs.
Random order
Treatment
String
Turbine addresses
MW
MEWTs
Notes
1 Replace 191 GE-1, GE-2 0.130 1 2 Replace 204 WM-26, PO-33 to PO-38 0.455 5 3 Replace 165 H-5, H-6 0.080 1 4 Replace 199 WM-1, WM-2 0.130 1 5 Replace 164 F-5, F-6 0.080 1 6 Replace 182.2 CD-9 to CD-12 0.130 1 7 Replace 170 K-3 to K-6 0.160 2 8 Replace 201 WM-14 to WM-21 0.325 3 3 turbines removed 9 Replace 188 GD-6 to GD-8 0.195 2 10 Replace 178.2 CA-6 to CA-8 0.195 2 turbines removed 10A Replace 178.2 CA-3 to CA-8 0.260 3 Replaced group 10 11 Replace 182.1 AD-10 to AD-13 0.260 2 12 Replace 168 J-3 0.040 1 13 Replace 184 CF-6 and CF-7 0.130 Turbines removed 13A Replace 183.2 CE-6 to CE-8 0.195 1 Replaced group 13 14 Replace 153 VK-15 0.065 1 15 Replace 156 TV-1 to TV-5 0.325 3 16 Replace 174 O-5, O-6, N-1 to N-3 0.160 2 1 turbine removed 17 Replace 161 D-1 to D-3 0.080 1 1 turbine removed 18 Replace 181.1 AC-17 to AC-20 0.260 3 19 Replace 159 D-9 to D-12 0.160 2 20 Replace 187 GC-17 to GC-18 0.130 1 21 Replace 168 J-5 to J-6 0.080 1 22 Replace 178.2 AA-1, CA-1, CA-2 0.195 2 23 Replace 170 M-8 to M-10 0.120 1 24 Replace 170 L-10 to L-12 0.120 1 25 Replace 205 VK-1 to VK-2 0.130 1 26 Replace 181.2 CC-11 to CC-13 0.195 2 27 Replace 183.2 CE-1 to CE-3 0.195 2 28 Replace 157 VTR-10 to VTR-11 0.130 1 29 Replace 161 E-4 and E-5 0.080 1 30 Replace 171 M-6, L-1, L-2 0.120 1 1 Control 189 GB-2 to GB-5 2 Control 203 WM-25, PO-27 to PO-32 1 turbine removed 3 Control 162 G-2 to G-6 4 Control 162 F-7 5 Control 162 G-11, G-12, F-12 6 Control 182.2 CD-14, CD-15 7 Control 171 N-9 to N-12

P-238
11
8 Control 200 WM-3 to WM-10 1 turbine removed 9 Control 186 GB-9 to GB-14 1 turbine removed 10 Control 179 CA-12 11 Control 182.1 AD-20 to AD-24 12 Control 172 O-9 to O-12 13 Control 181.2 CC-7 and CC-8 14 Control 153 VK-7 15 Control 175 O-1 and O-2 16 Control 155 VK-24 to VK-26 17 Control 161 D-6 to D-8, E-1 18 Control 182.1 AD-15 to AD-17 19 Control 171 N-4 to N-6 20 Control 185 GA-1 and GA-2 21 Control 164 F-1 and F-2 22 Control 180.1 CB-1, AB-1, AB-2 23 Control 169 I-1 to I-3 24 Control 170 L-7 to L-9 25 Control 153 VK-5 and VK-6 26 Control 183.2 CE-6 to CE-8 27 Control 183.2 CC-15 and CC-16 28 Control 154 VK-22 and VK-23 29 Control 160 E-6 and E-7 30 Control 157 VTR-6

P-238
12
Table 2. Comparison of rates of found fatalities projected to a two day search interval, based on four years of fatality monitoring at three sites composing the FloDesign study area. Treatments
MW
Detection rate, birds/MW/year
Detected birds predicted over 1 year
Mean SE Total 90% CI Non-study turbines 14.250 2.45 0.32 Reference turbines 4.305 9.74 1.01 41.5 34.8-49.1 MEWT replacement 4.040 11.52 1.34 46.5 37.7-55.4
P-238
13
Table 3. Distribution of found fatalities AES SeaWest sites from April 1998 through September 2009, and compared to fatalities found after the first three rounds of searches in April 2012 at 8.78 MW of the same turbines, only 3.965 MW of which were operational during the recent searches. Fresh bird carcasses of native species found at sampled turbines have already numbered 10% of my annual projection, even though more than half the capacity of turbines was non-operational. Species
Fatalities found at AES Seawest sites,
22.595 MW
Fatalities found at sampled SeaWest sites, 3.965 - 8.78 MW for operational and total
sample, respectively After 48 rounds
over 8 years, 1998-2009
After 3 rounds of surveys in April
2012
After 3 rounds in April 2012, and dead
within 10 days Brown pelican 1 Great blue heron 1 Great egret 1 Mallard 8 Turkey vulture 2 Golden eagle 5 Red-tailed hawk 51 1 Buteo 1 Northern harrier 1 Small raptor 1 American kestrel 22 Burrowing owl 58 1 Barn owl 18 1 1 Great horned owl 5 American avocet 2 Killdeer 1 Gull 1 1 1 California gull 1 Common poorwill 1 Northern flicker 1 Rock pigeon 556 20 8 Mourning dove 44 American crow 5 Common raven 12 Horned lark 6 Loggerhead shrike 7 European starling 68 Pacific-slope flycatcher 1 Say’s phoebe 1 Northern mockingbird 1 Mountain bluebird 1 Cliff swallow 4 Barn swallow 2

P-238
14
Blackbird 5 Brewer’s blackbird 5 Brown-headed cowbird 1 Tricolored blackbird 1 Red-winged blackbird 8 Western meadowlark 36 1 1 Golden-crowned sparrow 1 Savanna sparrow 1 Sparrow 1 1 1 House sparrow 1 House finch 6 Cockatiel 1 Small bird 45 1 Large bird 2 Medium bird 24 1 Mexican free-tail bat 2 Western red bat 1 Total birds 1,028 28 12 Total birds/MW/search 0.95/MW 1.06 to 2.35 ---

P-238
15
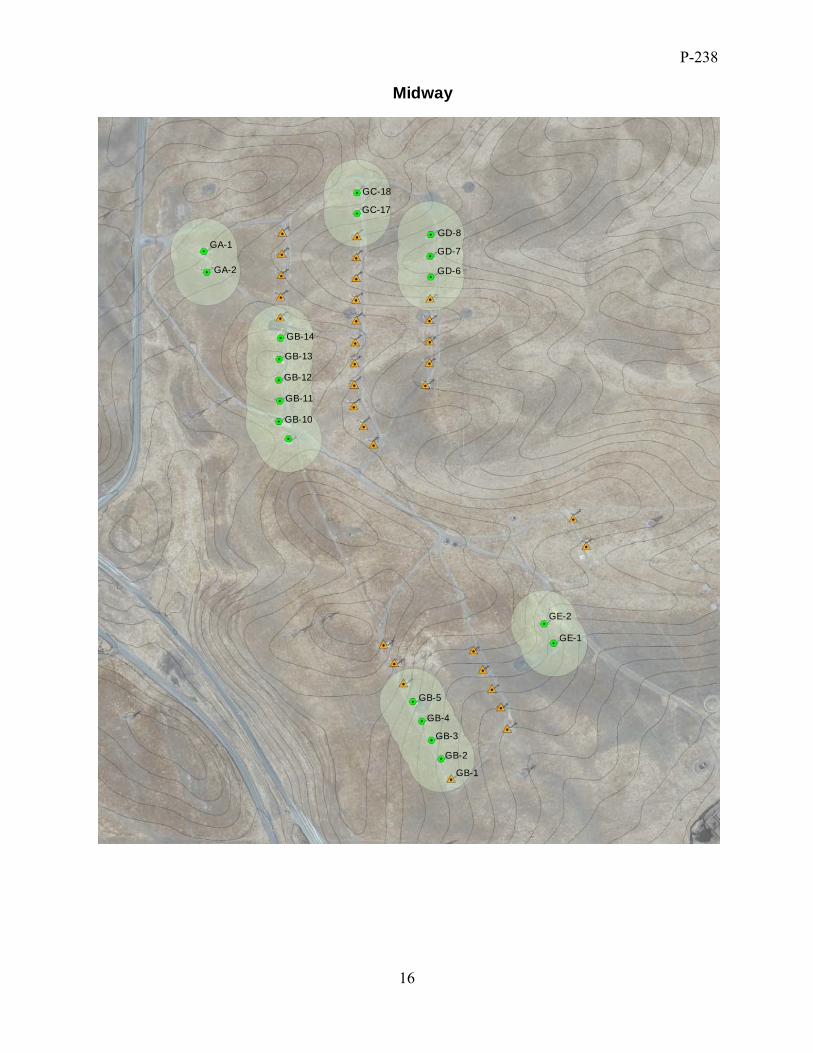
Appendix 1. Layout of the existing old-generation wind turbines in the study.
AD-10AD-11
AD-12
AD-13
AD-14
AD-15AD-16
AD-17
AD-18
AD-19
AD-20AD-21
AD-22
AD-23
AD-24
AC-17
AC-18
AC-19
AC-20
CA-8CC-8
CC-7
CD-15
CD-14
CB-1AB-1
AB-2
CA-12
CA-5
CA-4
CA-3
CA-2
CA-1
AA-1
CD-13
CD-12
CD-11
CD-10
CD-9CE-8
CE-7
CE-6
Mt. House
P-238
16
GA-2
GA-1GD-8
GD-7
GD-6
GB-14
GB-13
GB-12
GB-11
GB-10
GC-18
GC-17
GE-1
GE-2
GB-5
GB-4
GB-3
GB-2
GB-1
Midway

P-238
17
WM-2WM-1
WM-3
WM-5WM-6
WM-7WM-8
WM-9WM-10
WM-11
WM-14WM-15
WM-17
WM-19
WM-21
PO-27PO-28
PO-29
PO-31PO-32
PO-33PO-34
PO-35PO-36
PO-37PO-38
WM-26
F-1F-2
F-3F-4F-5F-6
J-3
J-5J-6
F-7F-8
F-9F-10
F-11F-12
G-12G-11
G-6G-5
G-4G-3
G-2
D-2D-3
D-4D-5
D-6D-7
D-8D-12
D-11D-10D-9
H-5H-6
K-6K-4
K-3
N-3N-2
N-1O-5
O-6
O-1
TV-1TV-2
TV-3TV-4
TV-5
O-12O-11
O-10O-9
N-4N-5
N-6N-8
VK-15VK-14
VK-7VK-8
VK-24VK-25
VK-26
Gate 11 and Venture
P-238
18
Appendix 2. List of 157 wind turbines included in the avian safety test of the MEWT. An X under M-team identifies 99 turbines searched by both the M-team and Smallwood team.
Taxvest - Mt House Taxvest at Midway Venture Altech at Gate 1165 KW M-team 65 KW M-team 65 KW M-team 40 KW M-team 40 KW M-teamCE-8 GE-1 X WM-26 O-1 X J-3 XCE-7 GE-2 X PO-33 O-6 X J-5 XCE-6 GB-1 X PO-34 O-5 X J-6 X
CD-15 X GB-2 X PO-35 N-1 X F-1 XCD-14 X GB-3 X PO-36 N-2 X F-2 XCD-13 X GB-4 X PO-37 N-3 X F-3 XCD-12 X GB-5 X PO-38 O-9 X F-4 XCD-11 X GD-8 X PO-27 O-10 X F-5 XCD-10 X GD-7 X PO-28 O-11 X F-6 XCD-9 X GD-6 X PO-29 O-12 X G-11 CC-8 X GC-18 X PO-31 N-4 X G-12 CC-7 X GC-17 X PO-32 N-5 X F-12
CA-12 X GB-14 X WM-14 N-6 X F-11 CA-8 X GB-13 X WM-15 N-8 X F-10 CA-5 X GB-12 X WM-17 N-9 X F-9 CA-4 X GB-11 X WM-19 N-10 X F-8 CA-3 X GB-10 X WM-21 N-11 X F-7 CA-2 X GA-1 X WM-3 N-12 X CA-1 X GA-2 X WM-5 K-3 X CB-1 X WM-6 K-4 X AA-1 Swamp WM-7 K-5 X AB-1 TV-1 WM-8 K-6 X AB-2 TV-2 WM-9 H-6 X
AD-10 X TV-3 WM-10 H-5 X AD-11 X TV-4 WM-11 G-2 AD-12 X TV-5 WM-1 G-3 AD-13 X WM-2 G-4 AD-14 X Viking G-5 AD-15 X VK-24 G-6 AD-16 X VK-25 D-2 X AD-17 X VK-26 D-3 X AD-18 X VK-7 D-4 X AD-19 X VK-8 D-5 X AD-20 X VK-14 D-6 X AD-21 X VK-15 D-7 X AD-22 X D-8 X AD-23 X D-9 X AD-24 X D-10 X AC-17 X D-11 X AC-18 X D-12 X AC-19 X AC-20 X
P-238
19
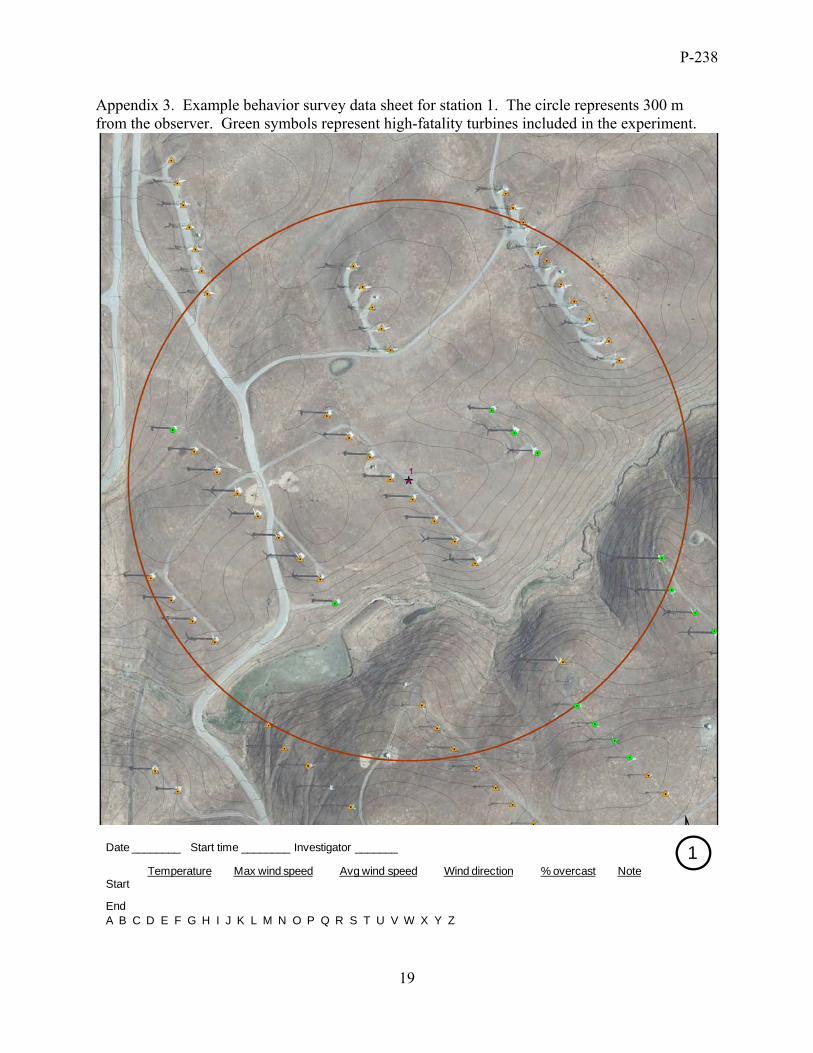
Appendix 3. Example behavior survey data sheet for station 1. The circle represents 300 m from the observer. Green symbols represent high-fatality turbines included in the experiment.
Date ________ Start time ________ Investigator _______
Temperature Max wind speed Avg wind speed Wind direction % overcast NoteStart
EndA B C D E F G H I J K L M N O P Q R S T U V W X Y Z
1