flood risk management project prioritization and decision
TRANSCRIPT
Flood Risk Management Project Prioritization and Decision Support
Tyler Fleagle, Lukas Strickler, Pierce Tarry, Jeffrey Vollenweider, and James Schreiner
United States Military Academy
Department of Systems Engineering
West Point, NY
Corresponding authors’ Email: [email protected]
Author Note: The authors would like to thank the Department of Systems Engineering at West Point, Dr. Mike Deegan, and
the Institute for Water Resources (IWR) United States Army Corps of Engineers (USACE) team for their aid in data collection
and analysis.
Abstract: USACE’s IWR develops Flood Risk Management (FRM) strategies which includes project work package
prioritization for annual budget requests. The current heuristic-centered strategy for prioritization reviews data but the process
does not employ data analytics which are predictive in nature and thus limits the fidelity of budget forecasting by project or
watershed. This research will present an alternative design and provide a recommendation to address current process
shortcomings with data use. The scalable methodology presented will consider value ratings and quantitative metrics to steer
current decision processes toward multi-year budget strategy approaches. Data analysis in Excel, R Studio, and Power BI
illustrate how new, project-oriented prioritization values can be generated through qualitative and quantitative scores using
criteria to rank work packages. These new prioritization values and generated risk scores helped develop a final ‘FRM Rank’
based on priority.
Keywords: Budget Forecasting, Dam/Levee Safety Action Classification (DLSAC) Score, FRM Rank
1. Introduction
1.1 Background
This report analyzes the project rank ordering and subsequent budgeting processes for USACE FRM and examines
how a multi-year, long-term strategy might be adopted. The fundamental problem is that single-year budgeting can limit
systemic watershed and project-based understanding and inhibit decision making quality due to an inability to visualize the
FRM relationships throughout a watershed. This report recommends that USACE adopts multi-year project prioritization
enabled budgeting based on predictive forecasting of FRM work package criteria, with an eventual intent of moving all inland
waterway business lines to a multi-year, watershed focused process. The team bounded the model around the Ohio River
Watershed as a proof of concept to show how a data driven process results in different work package prioritizations than the
current heuristic approach. Thus, the new approach creates an opportunity to adopt multi-year work package prioritization to
assist in budgetary decision-making. Once validated on the Ohio River Watershed- which spans fourteen states and seven
districts with unique FRM vulnerabilities- this scalable analytic and decision model can be utilized for budget rank-ordering of
work packages and work projects within or across USACE Divisions. The recommendation to USACE is to implement this
model for FRM project prioritization as the foundation to work alongside expert assessments in the FRM business line.
1.2 Literature Review
The Ohio River basin is an intricate watershed home to approximately 27 million people, encompassing 15 states and
over 204,000 square miles (USACE, 2009). USACE manages flood risk reduction systems consisting of 83 reservoirs and 97
local protection projects. These systems have produced an estimated $19.0 billion in flood risk reduction benefits through 70
years of continuous operation (USACE, 2009). Flood risk reduction benefits provide economic benefit not by revenue
generation, but asset protection. Flood prevention provides a monetary value calculated through preventative economic costs
in property damage protection, business value preservation, and associated infrastructure. The entirety of the Ohio River basin
consists of layers of protection, flood warning systems, local protection plans, dams, and levees. Each layer is a necessary part
of the system so that the entire basin can continue to effectively provide flood risk reduction benefits. Location of FRM
infrastructure in relation to each other is very important as well as watershed are considered. The Ohio River watershed within
Proceedings of the Annual General Donald R. Keith Memorial Conference West Point, New York, USA April 29, 2021
ISBN: 97819384962-0-2 087
A Regional Conference of the Society for Industrial and Systems Engineering
the Lakes and Rivers Division (LRD), includes dams, levees, and reservoir infrastructure. Dam failure often includes
overtopping which results from inadequate spillway design allowing debris to settle atop and block the dam (damsafety.org).
The USACE FRM program creates innovative alternative approaches to minimize loss of life, and economic
impacts, and natural environment enhancements (USACE Flood risk). Flood emergency response reduces the flood event's
impact on the local population and material infrastructure (Integrated, 2011, p.9). Recovery from a flood event includes
restoring vital lifelines such as water, electricity, roads, communications, and hospitals. After the baseline needs are met, the
focus of post-flood recovery shifts towards long-term care and prevention (Integrated, 2011, p.10).
USACE annually draws appropriations from Congress. Organization of the budget occurs in four areas:
investigations, construction, operations, and maintenance (Carter, i). FRM resides within USACE Civil Works’ water resource
authority (Carter, 1). Civil Works lists its individual projects in need of funding while describing the original authorization,
work performed, and previous and next year budget (USACE Operations and Maintenance, 15). It requests funding annually
due to the budget authorization and appropriation process as directed by Congress. This has created a construction backlog,
reaching $98 billion in fiscal year 2020 (Carter, 3). The Chief of Engineers expects this backlog to increase as the number of
authorizations consistently trails the amount of construction requests (Normand, 18). Alternative solutions captured in recent
NDAAs have opened the possibility of multi-year funding to solve this issue which presents an opportunity to implement this
paper’s approach.
2. Methodology
2.1 Model and Data Analysis Assumptions
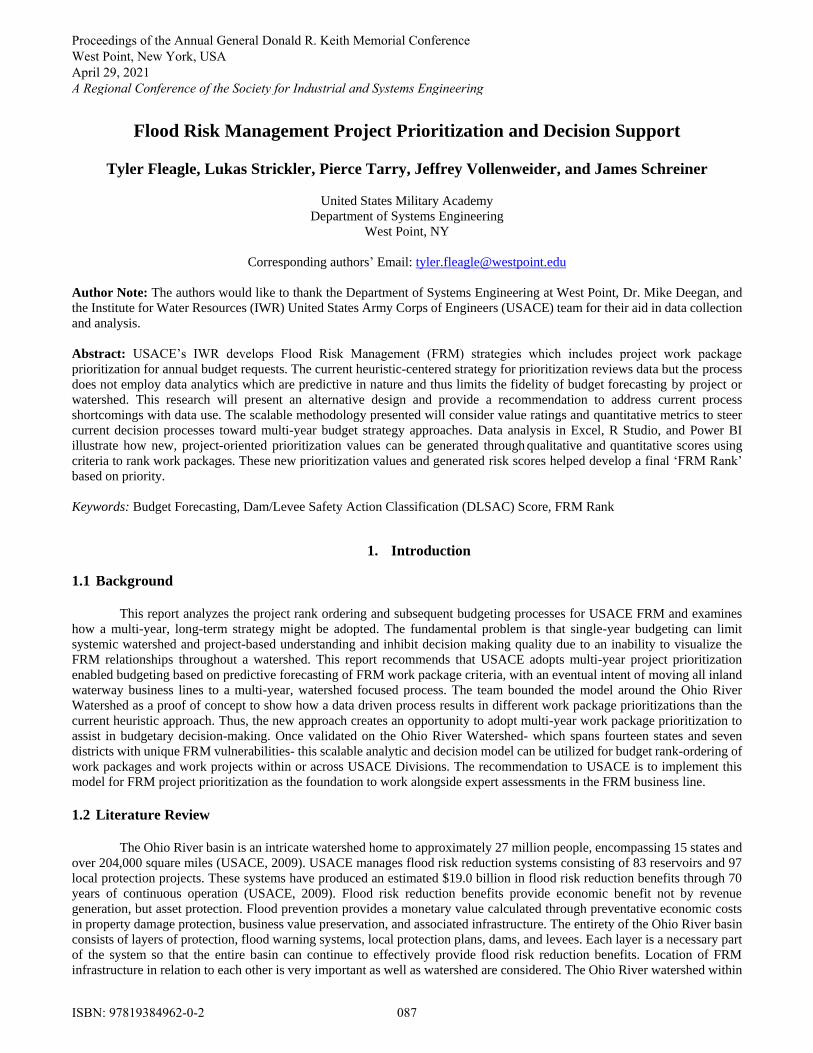
Framing for the proposed model displayed in Figure 1 outlines the functional responsibilities of FRM budget
prioritization (Robinson et al., 2). Several assumptions proved necessary in order to construct FRM work project ranks in the
‘to-be’ process. First, USACE appropriates projects on an annual timeframe. Second, USACE evaluates FRM projects by
project and watershed value regardless of district boundaries. Third, all primary feature codes have some relevance to flood
risk management budgeting. Additionally, the FRM Risk Score metric is a proxy metric derived from the data set. The last
assumption is that the Dam Safety Action Classification (DSAC) and the Levee Safety Action Classification (LSAC) ratings
are the most important FRM metrics.
Figure 1. Functional ‘Swim Lane’ Chart of FRM Process and ‘To-be’ Design (Robinson et al., 2)
Proceedings of the Annual General Donald R. Keith Memorial Conference West Point, New York, USA April 29, 2021
ISBN: 97819384962-0-2 088
A Regional Conference of the Society for Industrial and Systems Engineering

2.2 Systems Thinking
Systems Thinking involves looking at an overall cycle, process, or system to include what is not in the system. Rather
than focus on a specific component of FRM such as work packages, the team determined that any predictive model must be
scalable to the business line, the level of headquarters, and assist in holistic assessment from work packages to watershed. The
mental models developed helped in design of the ‘to-be’ framework. Understanding of FRM investment decision making
complexities across each holistic watershed system include relationships of health/safety, economic resilience, population
growth, and local/federal budget authorizations and appropriations.
2.3 Analysis of the ‘As-Is’ Processes
Prediction of future work package rankings (designated as the “Major Subordinate Command (MSC) Rank”) for
budgeting motivated the team to first determine how USACE determines its rankings, quantitatively or qualitatively. Within
USACE’s budget data for FRM from fiscal years 2016 to 2021, every work package was sorted “1-n” at both Division and
District levels primarily by district and state, then primary feature code as shown in Figure 3. The primary feature code describes
the type of project package such as land, reservoirs, dams, and levees. This accounted for and removed confounding variables.
Every quantitative metric USACE Civil Works records for budgeting within the Ohio River Watershed was compared to the
MSC Rank in order to determine causality. The finding was that none of the individual metrics, from Population at Risk (PAR)
to DSAC/LSAC held a significant correlation of work package prioritization. Then, the team evaluated whether a combination
of quantitative measures mattered in producing the MSC Rank to determine budgeting. Analysis of each quantitative measures
and the MSC Rank found no correlation. However, it became evident that the MSC Rank USACE has used as early as fiscal
year 2016 is merely a categorization by state. Across the Ohio watershed, the MSC Ranks are bracketed in groups rather than
a one-to-one relationship with any quantitative metrics. Upon closer inspection, the groups which have similar MSC Ranks are
all within the same state.
This led to the conclusion that Civil Works does not rank its work packages or projects based on quantitative metrics.
It is logical for USACE to not rank its work packages in priority solely based on FRM benefit, but even cost of the project
rendered no correlation with its ranking system. These findings shifted efforts from analysis of the preexisting ranking system
to designing a new ranking system for work projects which is named ‘FRM Rank’ and applying it from fiscal years 2016
through 2021. Projection onto the next three to five years then allows USACE to design multi-year budgeting decisions based
on quantitative measures.
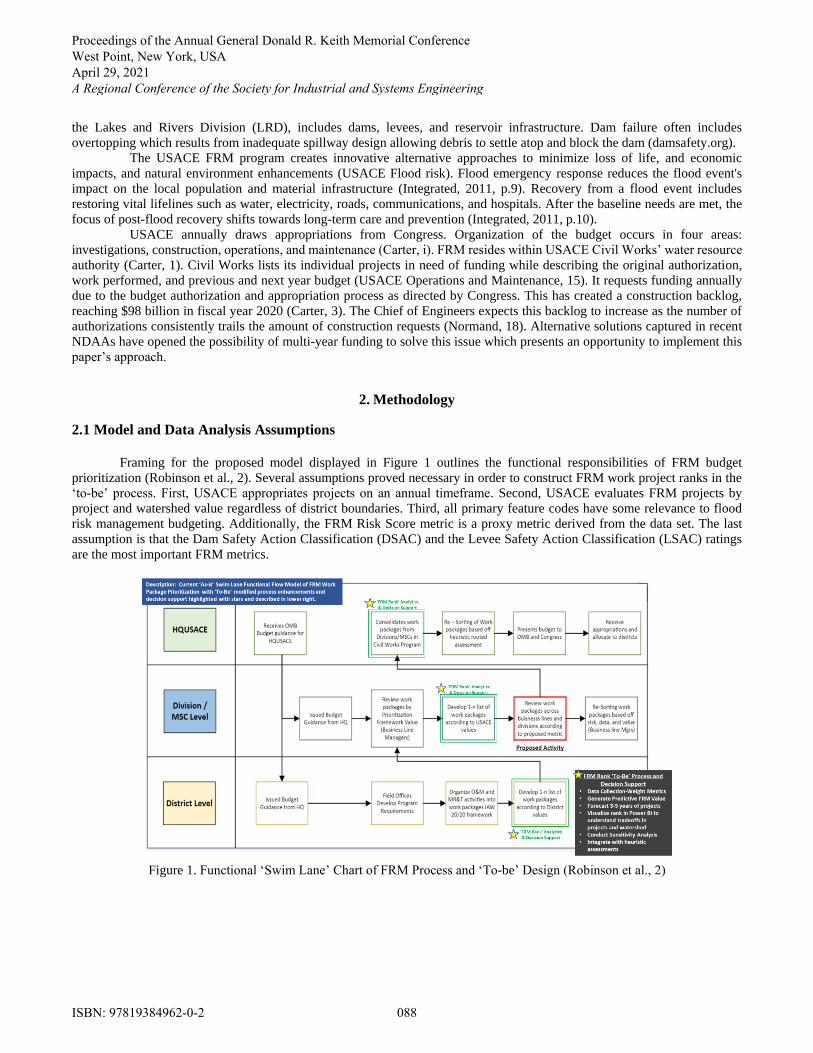
2.4.1 Value Modeling Value modeling within this project, consists of pairing stakeholder interests, data, and predictive analytics to assess
multi-year budgeting and rank ordering of FRM work packages. The first task in the value modeling process is generating a
qualitative value model. A qualitative value is a description of stakeholder values, the fundamental objective of the project,
functions, objectives, and value measures (Parnell, Driscoll, & Henderson, 2011, p. 326). All model components were derived
from the stakeholder’s values and interests. The fundamental objective of this project is to design and develop a scalable
predictive analytic and costing model for USACE’s Civil Works FRM work package portfolio which enables multi-year budget
decisions in support to congressional budget requests. The value measures used to evaluate the model are as follows: population
at risk, population trends, DSAC, LSAC, and econ score. The qualitative value model, mathematical model, and global relative
weights are depicted in Figure 2.
Proceedings of the Annual General Donald R. Keith Memorial Conference West Point, New York, USA April 29, 2021
ISBN: 97819384962-0-2 089
A Regional Conference of the Society for Industrial and Systems Engineering
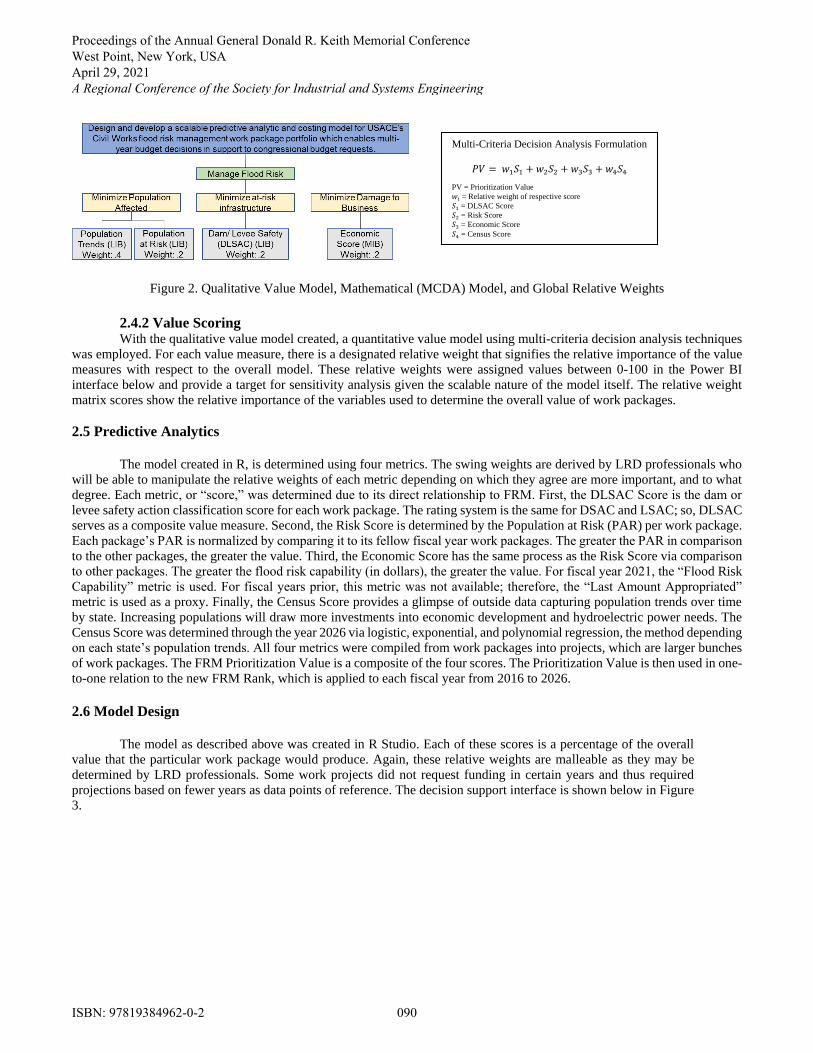
Figure 2. Qualitative Value Model, Mathematical (MCDA) Model, and Global Relative Weights
2.4.2 Value Scoring
With the qualitative value model created, a quantitative value model using multi-criteria decision analysis techniques
was employed. For each value measure, there is a designated relative weight that signifies the relative importance of the value
measures with respect to the overall model. These relative weights were assigned values between 0-100 in the Power BI
interface below and provide a target for sensitivity analysis given the scalable nature of the model itself. The relative weight
matrix scores show the relative importance of the variables used to determine the overall value of work packages.
2.5 Predictive Analytics
The model created in R, is determined using four metrics. The swing weights are derived by LRD professionals who
will be able to manipulate the relative weights of each metric depending on which they agree are more important, and to what
degree. Each metric, or “score,” was determined due to its direct relationship to FRM. First, the DLSAC Score is the dam or
levee safety action classification score for each work package. The rating system is the same for DSAC and LSAC; so, DLSAC
serves as a composite value measure. Second, the Risk Score is determined by the Population at Risk (PAR) per work package.
Each package’s PAR is normalized by comparing it to its fellow fiscal year work packages. The greater the PAR in comparison
to the other packages, the greater the value. Third, the Economic Score has the same process as the Risk Score via comparison
to other packages. The greater the flood risk capability (in dollars), the greater the value. For fiscal year 2021, the “Flood Risk
Capability” metric is used. For fiscal years prior, this metric was not available; therefore, the “Last Amount Appropriated”
metric is used as a proxy. Finally, the Census Score provides a glimpse of outside data capturing population trends over time
by state. Increasing populations will draw more investments into economic development and hydroelectric power needs. The
Census Score was determined through the year 2026 via logistic, exponential, and polynomial regression, the method depending
on each state’s population trends. All four metrics were compiled from work packages into projects, which are larger bunches
of work packages. The FRM Prioritization Value is a composite of the four scores. The Prioritization Value is then used in one-
to-one relation to the new FRM Rank, which is applied to each fiscal year from 2016 to 2026.
2.6 Model Design
The model as described above was created in R Studio. Each of these scores is a percentage of the overall
value that the particular work package would produce. Again, these relative weights are malleable as they may be
determined by LRD professionals. Some work projects did not request funding in certain years and thus required
projections based on fewer years as data points of reference. The decision support interface is shown below in Figure
3.
Multi-Criteria Decision Analysis Formulation
𝑃𝑉 = 𝑤1𝑆1 + 𝑤2𝑆2 + 𝑤3𝑆3 + 𝑤4𝑆4
PV = Prioritization Value
𝑤𝑖 = Relative weight of respective score
𝑆1 = DLSAC Score
𝑆2 = Risk Score
𝑆3 = Economic Score
𝑆4 = Census Score
Proceedings of the Annual General Donald R. Keith Memorial Conference West Point, New York, USA April 29, 2021
ISBN: 97819384962-0-2 090
A Regional Conference of the Society for Industrial and Systems Engineering
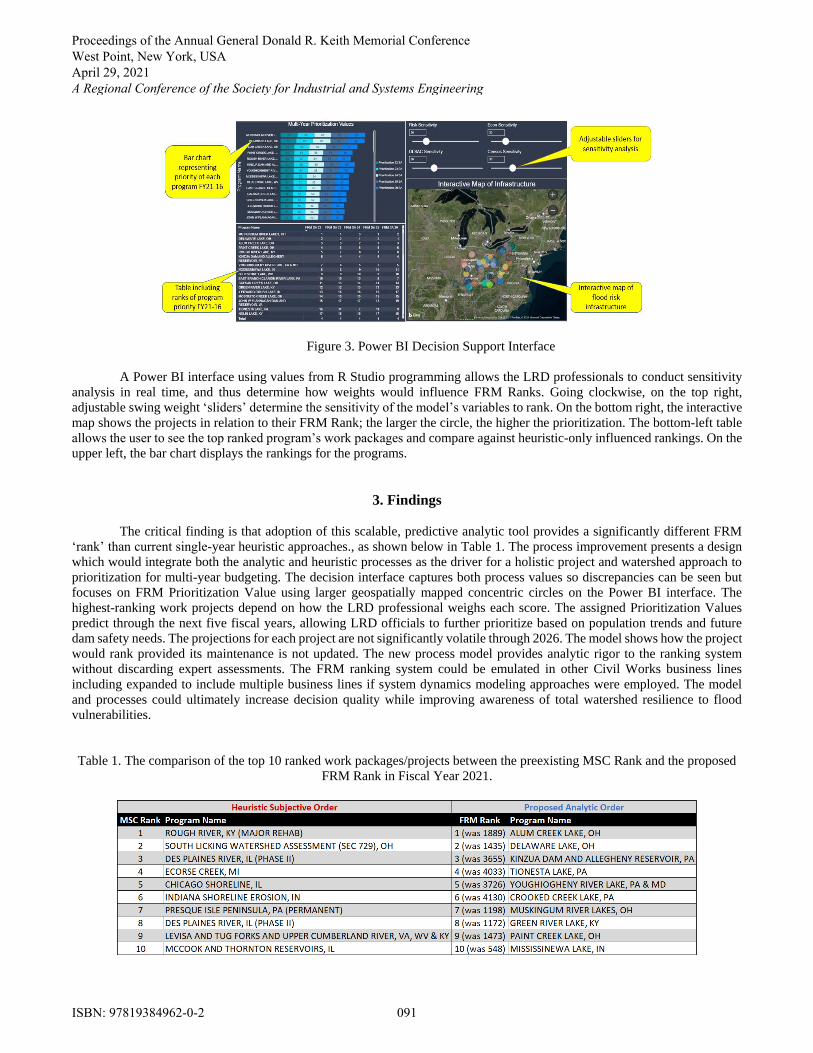
Figure 3. Power BI Decision Support Interface
A Power BI interface using values from R Studio programming allows the LRD professionals to conduct sensitivity
analysis in real time, and thus determine how weights would influence FRM Ranks. Going clockwise, on the top right,
adjustable swing weight ‘sliders’ determine the sensitivity of the model’s variables to rank. On the bottom right, the interactive
map shows the projects in relation to their FRM Rank; the larger the circle, the higher the prioritization. The bottom-left table
allows the user to see the top ranked program’s work packages and compare against heuristic-only influenced rankings. On the
upper left, the bar chart displays the rankings for the programs.
3. Findings
The critical finding is that adoption of this scalable, predictive analytic tool provides a significantly different FRM
‘rank’ than current single-year heuristic approaches., as shown below in Table 1. The process improvement presents a design
which would integrate both the analytic and heuristic processes as the driver for a holistic project and watershed approach to
prioritization for multi-year budgeting. The decision interface captures both process values so discrepancies can be seen but
focuses on FRM Prioritization Value using larger geospatially mapped concentric circles on the Power BI interface. The
highest-ranking work projects depend on how the LRD professional weighs each score. The assigned Prioritization Values
predict through the next five fiscal years, allowing LRD officials to further prioritize based on population trends and future
dam safety needs. The projections for each project are not significantly volatile through 2026. The model shows how the project
would rank provided its maintenance is not updated. The new process model provides analytic rigor to the ranking system
without discarding expert assessments. The FRM ranking system could be emulated in other Civil Works business lines
including expanded to include multiple business lines if system dynamics modeling approaches were employed. The model
and processes could ultimately increase decision quality while improving awareness of total watershed resilience to flood
vulnerabilities.
Table 1. The comparison of the top 10 ranked work packages/projects between the preexisting MSC Rank and the proposed
FRM Rank in Fiscal Year 2021.
Proceedings of the Annual General Donald R. Keith Memorial Conference West Point, New York, USA April 29, 2021
ISBN: 97819384962-0-2 091
A Regional Conference of the Society for Industrial and Systems Engineering
4. Conclusions and Future Work
Three key areas of future work were identified. First, the Power BI interface was tested to be useful and useable in
earning a 72.5 System Usability Scale (SUS) score from evaluation by systems engineering professionals at West Point
(Usability.gov), but further validation of the decision interface would be best served by using the SUS with practicing
professionals to develop future prototype designs. The interface was found helpful in deciding which work projects should be
prioritized for funding in future years, given its intuitive presentation of the projected FRM Rank in the next three to five years
as sensitivity ‘sliders’. Second, the results of the research provide insight into how work packages could be normatively ranked
for resources and spending to be allocated more efficiently. The model aids in quantitatively ranking work packages based on
the Ohio River Watershed data provided. However, cultural integration of the data-driven model might ensure that its
implementation is sustainable and enduring. Lastly, design of a multi-year budget tool might allow budget design to happen
across business lines including navigation and environmental. This paper’s analytic project prioritization framework could be
foundational to its design.
In all, understanding limitations of both normative and heuristic approaches in decision making is the key conclusion
of the work. Creative design of decision-making processes which integrate the approaches might provide a solution for USACE
and other DoD entities facing similar challenges.
5. References
Carter, T., & Normand, A. (2019). U.S. Army Corps of Engineers: Water Resource Authorization and Project Delivery
Processes. Retrieved from https://www.everycrsreport.com/files/20190419_R45185_70cb28581bb8fe5a6b9c232540
cc52a60b466ae0.pdf.
Damsafety.org. (n.d.). Dam Safety. Retrieved from https://damsafety.org/damfailures#:~:text=1.,of%20all%20U.S.%20dam
%20failures.
Normand, A. & Carter, T. (2020). U.S. Army Corps of Engineers annual appropriations process and issues for Congress.
Retrieved from https://www.everycrsreport.com/files/20200421_R46320_245bb680cd5481e4b2c13393b
d49c27a94d28ad6.pdf.
Parnell, G.S., Driscoll, P.J, & Henderson, D.L. (2011). Decision Making in Systems Engineering and Management. Hoboken,
NJ: Wiley, 326.
Robinson, M., Lefors, F., Capp, J., Laporte, G., & Schreiner, J. (2021). Multi-Year Inland Waterway Investment Model and
the Value/Consequence Ratio. Industrial and Systems Engineering Review, Vol 8, No. 1.
System Usability Scale. USGS Administration. Retrieved from https://www.usability.gov/how-to-and-tools/methods/system-
usability-scale.html.
US Army Corps of Engineers: Institute for Water Resources. Flood risk management program [Fact Sheet]. Retrieved from
https://www.iwr.usace.army.mil/Missions/Flood-Risk-Management/Flood-Risk-Management-Program/
US Army Corps of Engineers. (2009). Ohio river basin comprehensive reconnaissance report.
https://www.lrh.usace.army.mil/Portals/38/docs/orba/Ohio%20River%20Basin%20Comp%20Recon%20Study%20-
%20Dec%202009.pdf.
U.S. Army Corps of Engineers Institute for Water Resources (2020). Mission and Vision. Retrieved from
https://www.iwr.usace.army.mil /About/Mission-and-Vision.
U.S. Army Corps of Engineers. Operations and maintenance: Civil Works FY2021 budget request justification. Retrieved from
https://cdm16021.contentdm.oclc.org/digital/collection/p16021coll6/id/2135.
Proceedings of the Annual General Donald R. Keith Memorial Conference West Point, New York, USA April 29, 2021
ISBN: 97819384962-0-2 092
A Regional Conference of the Society for Industrial and Systems Engineering