floods in central texas, august 1978 - usgs · floods in central texas, august 1978 by e.e....
TRANSCRIPT

[ ~ ::;;: ?l 0.. 0.. (1)
:::: ~ I I
'Tl ~
0 0 0.. V>
1-'• ::s (") (1) ::s rt ., ?l ~
V> rt
Floods in Central Texas, August 1978
- rt • -r .- r .,.... ... :-< ~ i'f tit ""' • f:• .... .!..J ~ 'tc.J· ....
''.' t r
U.S. GEOLOGICAL SURVEY Open-File Report 79-682
(/) 20 w ~ u z
.~R_AI.!J}ALL _
Prepared in cooperation with the State of Texas and other agencia
... -
-!

Cover photograph, Brazos River in flood at Graham,
by Randy Black, Dallas, Texas.

Floods in Central Texas, August 1978
By E.E. Schroeder, B.C. Massey, and Kidd M. Waddell
U.S. GEOLOGICAL SURVEY Open-File Report 79-682
Prepared in cooperation with the State of Texas and other agencies
April 1979

Reproduced by the Texas Department of Water Resources as part of the continuing program of cooperation in water-resources investigations between the Department of Water Resources and the U.S. Geological Survey.
Copies of this report may be obtained from the U.S. Geological Survey
Federal Building 300 East 8th Street
Austin, TX 78701

CONTENTS Page
Abstract---------------------------------------------------------- 1 Introduction-----------------------------.------------------------- 2
Purpose and scope of this report----------------------------- 2 Definitions of terms and abbreviations----------------------- 2 Metric conversions------------------------------------------- 3
Description of the storm-----------~------------------------------ 3 Description of the floods----------------------------------------- 4
Nueces River basin------------------------------------------- 4 Guadalupe River basin---------------------------------------- 4
Medina River basin-------------------------------------- 6 Colorado River basin----------------------------------------- 11
Pedernales River------------------:_____________________ 11 Llano River-------~------------------------------------- 11
Brazos River basin----------~-----~----------------~--------- 11 Magnitude and frequency of the floods----------------------------- 12 Flood damage------------------------------------------------------ 14 -Water-quality changes in the Brazos River basin--~---------------- 18 Water-level changes in the Edwards aquifer------------------------ 26 Selected references----------------------------------------------- 29
iii

Figure 1. 2.
3.
4.
5.
6.
7.
8.
9.
10.
11.
12.
13.
14.
15.
16.
17.
ILLUSTRATIONS
Page
Map showing locations of streamflow-data sites--------- 5 Discharge hydrographs for Guadalupe River at
Comfort and Guadalupe River near Spring Branch------- 7 Log Pearson type III frequency curve for Medina
River near Pipe Creek-------------------------------- 8 Photograph showing cypress tree uprooted by
floodwaters on the Medina River---------------------- 9 Photographs showing Medina River near Pipe Creek,
before, during, and after the flood------------------ 10 Discharge hydrographs for Hubbard Creek below
Albany and Hubbard Creek near Breckenridge----------- 13 Photograph showing inundation of State Highway
173 and the Medina River bridge at Bandera----------- 15 Photograph showing State Highway 290 flooded by
Spring Creek near Fredericksburg--------------------- 16 Photograph showing aerial view of the Brazos River
in flood at Graham----------------------------------- 17 Map showing locations of water-quality data-
collection sites on Hubbard Creek Reservoir---------- 19 Map showing locations of water-quality data-
collection sites on Possum Kingdom Reservoir--------- 20 Map showing locations of water-quality data-
collection sites on Whitney Lake--------------------- 21 Map showing locations of water-quality data-
collection sites on the Brazos River----------------- 22 Profiles of specific conductance and density for
Hubbard Creek Reservoir during June and Aygust 1978------------------------------------------------- 23
Profiles of specific conductance and density for Possum Kingdom Reservoir during June and August 1978------------------------------------------------- 24
Profiles of specific conductance and density for Whitney Lake during June and September 1978---------- 25
Graphs showing daily specific conductance ~nd instantaneous discharge for five sites on the Brazos River downstream from Whitney Lake, July and August 1978-----------------------·--------------- 27
18. Water-level changes in wells in the Edwards aquifer, July 10-August 25, 1978--------------------- 28
iv

TABLES
Page
Table 1. Summary of flood stages and discharges------------------ 30 2. Locations of discontinued stream-gaging stations
and miscellaneous discharge-measurement sites--------- 35 3. Water-quality data for Hubbard Creek, June 9 and
August 29, 1978--------------------------------------- 36 4. Water-quality data for Possum Kingdom Reservoir,
June 13.and August 30, 1978--------------------------- 38 5. Water-quality data for Whitney Lake, June 23 and
September 5-6, 1978----------------------------------- 40 6. Station descriptions and discharge data----------------- 42
v

FLOODS IN CENTRAL TEXAS AUGUST 1978
By E. E~ Schroeder, B. C. Massey
and Kidd M. Waddell
ABSTRACT
Catastrophic floods, which resulted in millions of dollars in property damages and the loss of 33 lives, occurred in Central Texas during August 1-4, 1978, as a result of intense rainfall produced by the remnants of tropical storm Amelia. Rainfall in excess of 30 inches was unofficially reported at several locations, while the highest 24-hour amount recorded by the National·Weather Service was 29.05 inches at Albany in Shackelford County.
Major flooding occurred on the Medina River and triputaries above Medina Lake and on the Guadalupe River and tributaries above Canyon Lake. Minor to severe flooding occurred on the tributaries of the Nueces River, on the Clear Fork Brazos River and tributaries, and on the Llano and Pedernales Rivers, which are tributaries of the Colorado River.
Peak discharges at several streamflow stations exceeded the historic peaks, and the flood magnitude and frequency data for the Guadalupe River above Canyon Lake, the Medina River near Pipe Creek, and Clear Fork Brazos River indicate that the August 1978 flood had a recurrence interval in excess of 100 years. The highest unit discharge observed during this flood was 3,010 cubic feet per second from a 14.1-square-mil.e drainage area of Spring Creek, which is tributary to the Pedernales River.
-1-

INTRODUCTION Purpose and Scope of This Report
The purpose of this report, which was prepared in cooperation with the State of Texas and other agencies, is to present the available flood data in a form that should be of value in assessing the risks involved in developing the flood plains of streams that are subject to chronic flooding. The report presents a description of the storm, a description of the flood by basins, peak stages and discharges, discharge-hydrograDh data, flood-frequency estimates, damage estimates, a discussion of the changes in water quality in selected streams and reservoirs in the Brazos River basin, and a discussion of water-level changes in observa.tion wells in the Edwards aquifer.
Definitions of Terms and Abbreviations
Technical terms and abbreviations, as used in this report, are defined as follows: Gaging station is a particular site on a stream, canal, lake, or reservoir where systematic observations of gage height or discharge are obtained. When used in connection with a discharge record, the term is applied only to gaging stations where a continuous record of discharge is obtained. Crest-stage station is a particular site where limited streamflow data on peak stages are collected systematically over a period of years for use in hydrologic analyses. Cubic foot per second (ft 3/s) is the rate of discharge representing a volume of 1 cubic foot passing a given point during 1 second. This rate is equivalent to a 24-hour volume of 86,400 cubic feet, 1.983471 acre-feet, or 646,317 gallons. Cubic foot per second per square mile [(ft 3/s)/mi 2 ] is the average number of cubic feet of water flowing per second from each square mile of area drained, assuming that the runoff is distributed uniformly in time and area. Acre-foot is the quantity of water required to cover 1 acre to a depth of 1 foot and is equivalent to 43,560 cubic feet, or 325,851 gallons. The term is generally used in relation to storage and volume of runoff. Runoff, in inches, is the depth to which a drainage area would be covered if all the runoff for a given time period were uniformly distributed on its surface. Drainage area of a stream at a specified location is that area, measured in a horizontal plane, that is enclosed by a topographic divide so that direct surface runoff from precipitation normally would drain by gravity into the stream above the specified point. Drainage area is expressed in square miles. Contents is the volume of water in the reservoir or lake and is expressed in acre-feet. Volume is computed on the basis of a level pool and does not include bank storage. Time of day is expressed in 24-hour time; for example, 12:30 a.m. is 0030, 1:30 p.m. is 1330. All times noted are Central daylight time. Specific conductance is a measure of the ability of water to conduct an electrical current and is expressed in micromhos per centimeter at 25°C. Because the specific conductance is related to the number and chemical
-2-

types of ions in solution, it can be used to determine the approximate concentration of dissolved solids in the water. Commonly, the concentration of dissolved solids (in milligrams per liter) is about 65 percent of the specific conductance (in ~icromhos per centimeter at 25°C). This re1ation is not constant from stream to stream, and it may vary in the same stream with changes in the composition of the water. ~ of a solution is a measure of effective hydrogen-ion concentration and is expressed as the negative logarithm of the hydrogen-ion activity in moles per liter. The degree of acidity or alkalinity of water, as indicated by the pH, is related to the corrosive properties of water. A pH of 7.0 indicates that the water is neither acid or alkaline. pH readings progressively lower than 7.0 denote increasing acidity and those progressively higher than 7.0 denote increasing alkalinity. Dissolved oxygen (DO) content of water in equilibrium with air is a function of atmospheric pressure, dissolved-solids content, and temperature of the water. The ability of water to retain oxygen decreases with increasing temperature or dissolved-solids concentration. Photosynthesis and respiration may cause diurnal variations in dissolved-oxygen content in water from streams;
Metric Conversions
The "inch-pound system" units used in this report may be converted to metric units by the following factors:
From To obtain Unit Abbrevi- Multiply by Unit Abbrevi-
at ion at ion
acre-foot 1,233 cubic meter m3
cubic foot ft3 28.32 liter
cubic foot per ft3/s 28.32 liter per L/s second second
cubic foot per (ft3/s)/mi2 .01093" cubic meter per (m3 /s)/km2
second per second per square mile square kilometer
foot .3048 meter m
gallon 3.785 liter
inch 2.54 centimeter em
square mile 2.590 square kilometer km2
DESCRIPTION OF THE STORM
Tropical storm Amelia moved inland on the lower Texas coast during the early morning hours of Monday, July 31, 1978. The position of the poorly defined storm center was estimated at latitude 28.5°N and longitude 97.8°W at 0800 hours Monday. At 1100 hours, the position of the center
-3-

had moved one-half degree due north to 29.0°N. This was the last official position report issued.
The remnants of the storm drifted westward and northward across Bexar County and the Edwards Escarpment into south-central Texas, where torrential rains occurred in Bandera, Kendall, and Kerr Counties. With its upperlevel circulation apparently still intact, the storm system moved north~ ward across the Pedernales, Llano, San Saba, and Colorado River basins, where some small areas received as much as 20 inches of rainfall. The storm continued to move northward into north-central Texas, where it stalled in the upper Brazos River basin and produced rainfall amounts that were comparable to the amounts that occurred earlier in south-central Texas. The magnitude of the storm in north-central Texas was greater than that of any previously recorded storm.
A more comple+r. description of the storm will be presented in reports being prepared by tlle U.S. Geological Survey and the National Weather Service.
DESCRIPTION OF THE FLOODS
Flooding to some degree occurred in an area of approximately 25,000 square miles in parts of the Nueces, Guadalupe, Colorado, and Brazos River basins. A summary of flood stages and discharges for selected sites is given in table 1; the locations of the sites are shown on figure 1. The locations of discontinued stream-gaging stations and miscellaneous dischargemeasurement sites are given in table 2. Station descriptions and discharge data are given in table 6.
Nueces River Basin
During the early part of the storm on August 1, 1978, substantial . rain fell on the headwaters of the Sabinal River, Hondo Creek, and Seco Creek in the Nueces River basin. The greatest 24-hour amount recorded by the National Weather Service in this basin was at Vanderpool in Bandera
. County, where a total of 11.53 inches fell in the 24-hour period ending at 0700 hours on August 2, 1978. Sharp rises occurred on many streams, but flooding was minor.
Guadalupe River Basin
The drainage area of the Guadalupe River above Canyon Lake received the first of the heavy rainfall during the night of August 1 and the morning of August 2. The storm cell, which was centered just west of Kerrville in Kerr County, produced rainfall amounts that resulted in severe flooding on the Guadalupe River and all of its local tributaries. On August 2, the flood crest on the Guadalupe River at Comfort (map no. 75 on fig. 1) exceeded by 0.6 foot the previously known maximum, which occu~red in July 1869. When the crest reached the Spring Branch gaging station (no. 76) on August
-4-

0 200 MILES L...J__j
\ \ '-\
AMISTAD \ ·. RESERVOII? "-?
) -~
I t I I I
FIGURE 1.-Locations ot streamflow-data sites
ggo
EXPLANATION
A.78 DATA- COLLECTION SITE: Numbe-r corresponds to that in table I and in the report text
m jg COUNTIES DESIGNATED AS FLOOD
DISASTER AREAS
--- BASIN DIVIDE
0 20 40 60 80 100 MILES

3, the peak discharge had attenuated from 240,000 ft 3/s at Comfort to 158,000 ft 3/s at Spring Branch (fig. 2). Secondary peaks occurred at both stations as a result of inflow from tributary streams.
Canyon Lake contained all of the runoff from this flood, so no damage occurred below Canyon Lake. The contents of Canyon Lake increased from 362,200 acre-feet at 2400 hours on August 1 to 588,400 acre-feet at 2400 hours on August 4. This was the maximum storage since closure of the dam on July 21, 1962.
Medina River Basin
A second cell of the storm that caused flooding in the Guadalupe River basin was centered near Medina in Bandera County where the North Prong and the West Prong of the Medina River join. The unofficial total rainfall was in excess of 30 inches, which developed a catastrophic flood on the headwaters of the Medina River. A peak discharge of 123~000 ft 3/s from a drainage area of 67.5 square miles was recorded at a miscellaneous site (no. 80) on the North Prong Medina River about 10 miles upstream from Medina. Field inspection after the flood indicated that the maximum flood peak occurred a short distance downstream from the confluence of the North Prong and West Prong of the Medina River.
When the flood crest reached the stream-gaging station near Pipe Creek (no. 82) on August 2, it exceeded by more than 6 feet the previous~ ly known maximum stage since 1880, which occurred in 1919. The peak dis~ charge at the station near Pipe Creek was 281,000 ft 3/s. A reanalysis of the annual peak-flow data for this site shows that a discharge of 281,000 ft3/s has an apparent recurrence interval greatly in excess of 100 years (fig. 3). Red Bluff Creek (no. 83), which flows into the Medina. River just below the Pipe Creek station, received very little runoff and had a peak discharge of only 160 ft3/s on August 2.
Medina Lake near San Antonio (no. 84) reached a stage of 1,076.67 feet, with 4 feet of flow over the spillway at the maximum stage. Storage in Medina Lake increased from·l88,200 acre-feet at 0800 hours on August 1 to 281,000 acre-feet at 1900 hours on August 2.
One of the most striking indications of the severity of the flood was the destruction of the massive cypress trees that lined the low-water banks of the Guadalupe and Medina Rivers and many of the tributaries. These trees ranged in size up to 6 feet in.diameter, and the larger trees were estimated to be as much as 600 years old (oral commun., David Riskin, Botanist, Tex~s Parks and Wildlife Department, September 1978). Entire stands of these picturesque trees were either uprooted or snapped off and floated downstream. Hundreds were. left scattered along the flood plains (fig. 4) or lodged in huge piles of debris along the channel banks and beneath the highway bridges. Many of the trees that were not uprooted were left partially down and stripped of their bark and foliage (fig. 5).
-6-

250,000r---------.---------r---------.---------.---------~--------~
Cl z 0 (.) w C/)
a::: w a.. 1-w w LL
(.)
al :::::> (.)
z ~
w (!) a::: <{
:I: (.) C/)
0
200,000
150,000
100,000
50,000
..,.....-08167000 Guadalupe River / at Comfort (map No. ?5)
t 1\ I \ I Av-08167500 Guadalupe River I / near Spring Branch (map No. 76)
I \ I \ I \ I \ I \ I \ I \ I \ J I \ I I I j \\
I \ _,.1 '-...__ ---
oL-----~~--~~L-------~~~==±===~==~~====~ AUGUST I
Note: Map numbers refer to locations on figure I and in table I
2 3 4 5 AUGUST 6
1978
FIGURE 2.-Discharge hydrographs for Guadalupe River at Comfort and Guadalupe River near Spring Branch
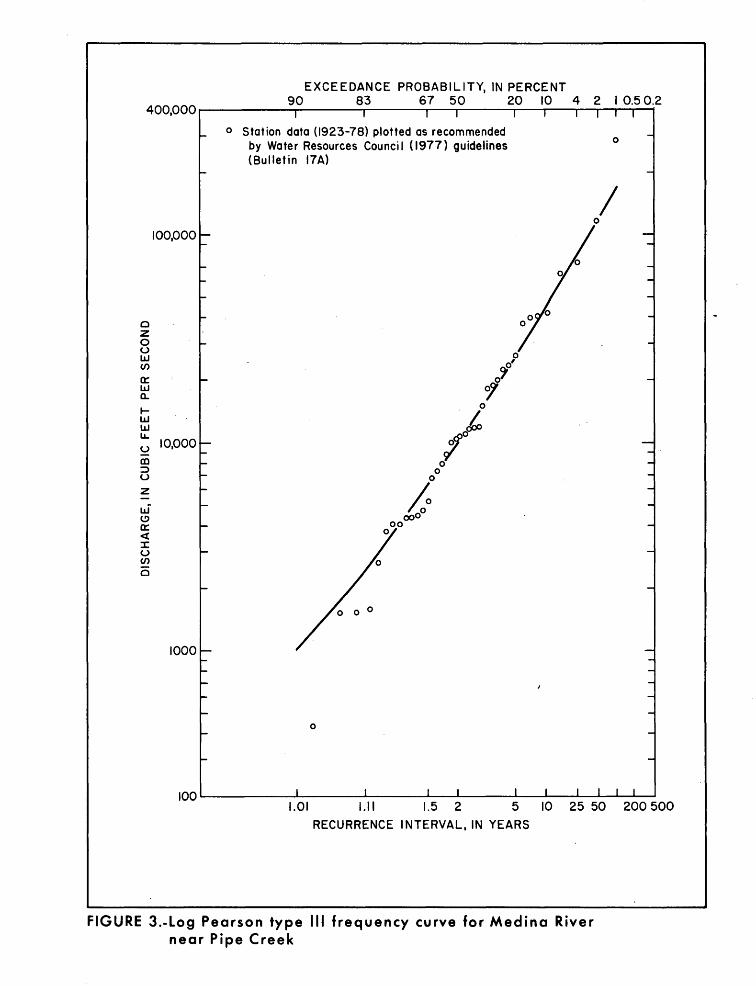
EXCEEDANCE PROBABILITY, IN PERCENT 90 83 67 50 20 10 4 2 I 0.5 0.2
400,000~--------~------~----~--~----~--~--~~-r~~
0 z 0 u lJJ en a:: lJJ a..
100,000
1-LJJ lJJ u.. u 10,000 CD ::J u z
w (.!) a:: ~ :I: u en 0
o Station data (1923-78) plotted as recommended by Water Resources Counci I ( 1977) guidelines (Bulletin 17A)
0
0
0
I
1.01 1.11 1.5 2 5 10 25 50 200 500
RECURRENCE INTERVAL, IN YEARS
FIGURE 3.-Log Pearson type Ill frequency curve for Medina River near Pipe Creek

Figure 4.--Cypress tree uprooted by floodwaters on the Medina River (Photograph by Susan Yost, Medina, Tex.)

Figure 5.--Medina River near Pipe Creek, before, during, and after the flood

In this area of Central Texas, older trees develop an extensive system of large lateral roots because tap roots cannot penetrate the limestone bedrock beneath the shallow topsoil. When the receeding floodwaters became too shallow to maintain free flotation of the uprooted trees, the lateral roots carved distinctive ruts in the soil as the trees were moved along the flood plain. In field investigations, these straight narrow ruts could be used as indicators of the direction of flow.
Colorado River Basin Pedernales River
Heavy rainfall was not as widespread in the Colorado River basin as in the Guadalupe and Medina River basins, but the highest unit runoff observed during this storm occurred on Spring Creek, which is tributary to the Pedernales River. Spring Creek, a short distance upstream from the station Spring Creek near Fredericksburg (no. 66), had a peak discharge of 42,500 ft 3/s from a 14.1-square-mile drainage area. The unit discharge was 3,010 ft 3/s/mi 2 , which is equivalent to 4.67 inches of runoff per hour at the time of the peak.
Overbank flooding occurred on the Pedernales River upstream from the gaging station near Johnson City (no. 68), but the flood crest was about 17 feet lower than the crest of the September 1952 flood.
Llano River
Rainfall in the Llano River basin was generally 5 inches or less except in several small areas near Junction. The peak discharge on Bear Creek (no. 59), which is tributary to the North Llano River just northwest of Junction, was 81,000 ft 3/s from a drainage area of 155 square miles. The floodwaters on Bear Creek inundated Interstate Highway 10, which was closed for several hours.
Brazos River Basin
As the storm moved northward into the Brazos River basin, the rainfall intensified. During the 24-hour period ending at 0700 hours on August 4, 1978, a total of 29.05 inches of rain was recorded by the National Weather Service at Albany in Shackelford County. Record-breaking floods occurred on the Clear Fork Brazos River and on Hubbard Creek and other tributaries of the Clear Fork Brazos River. A peak discharge of 103,000 ft 3/s from a drainage area of 39.3 square miles was recorded at North Fork Hubbard Creek near Albany (no. 18) on August 4. The unit discharge of 2,621 ft 3/s/mi2 was one of the highest ever recorded in Texas for a drainage area of this size. The streamflow station Hubbard Creek below Albany (no. 19) had a peak discharge of 330,000 ft3/s from a drainage area of 613 square miles.
The contents of Hubbard Creek Reservoir near Breckenridge (no. 21) increased from 185,800 acre-feet at 2400 hours on August 2 to a maximum of 401,500 acre-feet at 0800 hours on August 5. The reservoir effectively contained the floodwaters from the Hubbard Creek basin although it was not
-11-

designed for flood control. Sufficient storage capacity was available in the reservoir to contain the flood wave with only moderate releases, which prevented more serious flooding downstream on the Clear Fork Brazos River. The streamflow station Hubbard Creek near· Breckenridge (no. 22), downstream from the reservoir and about 11 miles upstream from the Clear Fork Brazos River, had a peak discharge of only 14,600 ft3/s (fig. 6).
Serious flooding developed.on the Clear Fork Brazos River as a result .of heavy runoff from tributaries upstream from Hubbard Creek. California Creek near Stamford (no. 14), which has a drainage area of 478 squa~e miles, had a peak discharge of 40,000 ft 3/s. The streamflow station on the Clear Fork Brazos River at Fort Griffin (no. 16) recorded a peak discharge of 149,000 ft 3/s, and the stage exceeded the previously known maximum stage by 0.88 foot. When the flood crest reached the gaging station at Eliasville (no. 23), 13.2 miles upstream from the main stern of the Brazos River, the peak discharge had attenuated to 68,000 ft3/s.
The streamflow station on the ·Brazos River near South Bend (no. 24), 1.8 miles downstream from the Clear Fork Brazos River, had a peak discharge of 78,100 ft 3/s. Although this discharge was exceeded by a flood that occurred in May 1941, the peak stage (41.5 feet) was the greatest to occur since at least 1876. Because of changes in the stage-discharge relationship, the peak stage of the August 1978 flood exceeded that of May 1941 by about 14 feet.
Major flooding occurred along the Brazos River from South Bend to Possum Kingdom Reservoir. Possum Kingdom Reservoir was 6.6 feet below the normal pool level, and releases from the reservoir by the Brazos River Authority, in anticipation of the approaching flood wave, reduced the crest of the flood artd effectively prevented a more serious flood
· from occurring downstream. Flood damages in the Brazos River basin downstream from Possum Kingdom Reservoir were minimal, and no flooding occurred on the Brazos River downstream from Lake Whitney, where sufficient storage capacity was available to contain the floodwaters.
MAGNITUDE AND FREQUENCY OF THE FLOODS
The relation of flood-peak magnitude to the proabability of occurrence, or recurrence interval, is generally referred to as a flood-frequency relation. The probability of occurrence is the percent chance of a given flood magnitude being exceeded in any 1 year~ The recurrence interval, which is the reciprocal of the probability of occurrence multiplied by 100, is the average number of years between exceedances. It is emphasized that the recurrence interval is an average interval and that the occurrence of floods is assumed to be random in time; no schedule of regularity is implied. The occurrence of a flood having a SO-year recurrence interval (2-percent chance of occurrence) is no guarantee, therefore, that a flood of equal or greater magnitude will not occur the following year, or even the following week.
-12-

0 z 0 u w (/)
a:: w a.. ..... w w LL.
u m ::::> u LL. 0 (/) 0 z <t (/) ::::> 0 I ..... z
w (!) a:: <t I u (/)
0
360~~------~--------~----------~--------~--------~----------~------~
320
280
240
200
160
120
80
40
...........--08086212 Hubbard Creek / below Albany (map No. IS,
above Hubbard Creek Reservoir)
r 08086500 Hubbard Creek near Breckenridge (map No. 22, below Hubbard Creek Reservoir)
OL-----~~~--~----~--~-----L--------~--------~~--------~------~ AUGUST 3 4 5 6
1978
7 8 AUGUST 9
FIGURE 6.-Discharge hydrographs for Hubbard Creek below Albany and Hubbard Creek near Breckenridge

Discharge computations show that the Clear Fork Brazos River, the Guadalupe River above Canyon Lake, and the Medina River above Medina Lake all had peak discharges in excess of the 100-year recurrence interval. The peak discharge for Spring Creek near Fredericksburg (no. 66) was 3.8 times the magnitude of the 100-year regional flood. Flood-frequency .data are indicated in table 1 for all stations in the flood area that experienced floods with frequencies of 10 years or more.
FLOOD DAMAGE
Seventeen counties in Central Texas sustained widespread damages from the floods associated with tropical storm Amelia (National Oceanic and Atmospheric Administration, 1978). Eight of these counties (Bandera, Kendall, and Kerr Counties in south-central Texas, and Haskell, Shackelford, Stephens, Throckmorton, and Young Counties in north-central Texas) were declared flood-disaster areas by the Federal government. Ironically, Bandera, Kendall, and Kerr Counties had been declared drought-disaster areas prior to the floods.
In Bandera, Kendall, and Kerr Counties, 25 people were drowned, about 150 people were injured, and property damages were estimated to be at least SO million dollars. About 175 homes were destroyed and about 650 were damaged. About 350 businesses were destroyed or damaged. Public utilities were disrupted in much of the area and many roadways and bridges were heavily damaged.· The bridge on State Highway 173 over the Medina River at Bandera, which was designed to withstand the 50-year flood, was inundated by 18 feet.of water (fig. 7). The damage to livestock and crops, to farm and ranch facilities, and to farm and pasture lands was extremely heavy.
A considerable amount of damage was also sustained in Gillespie and Kimble Counties in south-central Texas. Two people were drowned when Spring Creek inundated the bridge on State Highway 290 west of Fredericksburg (fig. 8), and many roadways, bridges, and farm and ranch lands were extensively damaged.
In Haskell, Shackelford, Stephens, Throckmorton, and Young Counties in the Brazos River basin in north-central Texas, the flood damage was comparable to the damage in south-central Texas. Six people were drowned, four were injured, and property damages were estimated to be at least 62 million dollars. About 750 homes and 75 businesses were destroyed or damaged (fig. 9), and the damages to livestock, crops, and farm and ranch lands were extremely severe. In Haskell County alone, these damages were estimated to be about 30 million dollars.
In the total area affected by the storm, 33 people were drowned, 154 were injured, and property damages were estimated to be more than 110 million dollars. The devastation resulting from tropical storm Amelia and the subsequent floods exceeded that of any storm in Central Texas in recent history.
-14-

Figure ?.--Inundation of State Highway 173 and the Medina River bridge at Bandera (Photograph by the Bandera, Tex., Bulletin)

Figure 8.--State Highway 290 flooded by Spring Creek near Fredericksburg (Photograph by the Fredericksburg, Tex., Standard)

-..
. '
. . L
....
~l
Figure 9.--Aerial view of the Brazos River in flood at Graham (Photograph by Randy Black, Dallas, Tex.)

WATER-QUALITY CHANGES IN THE BRAZOS RIVER BASIN
The large volume of runoff associated with the floods in the drainage area of the upper Brazos River had a considerable effect on the water quality of the streams and reservoirs. Selected water-quality data from sites on Hubbard Creek Reservoir (fig. 10), Possum Kingdom Reservoir (fig. 11), and Whitney Lake (fig. 12) and from five sites on the Brazos River downstream from Whitney Lake (fig. 13) were compiled to show the waterquality conditions before and after the storm.
The data used to represent water-quality conditions in the reservoirs prior to the flood were collected during June 9-23, 1978, and the data used to represent conditions after the floods were collected during August 29-September 6, 1978. The water-quality data for the reservoirs are given in tables 3--5 ..
Profiles of.specific conductance and density for Hubbard-Creek Reservoir, Possum Kingdom Reservoir, and Whitney Lake are shown on figures 14, 15, and 16, respectively. These profiles, which show the water-quality effects of the flooding and subsequent reservoir releases, were prepared from data collected along the centerlines of the drowned river channels upstream from the dams and from data collected at deep sites near the dams of each reservoir. The density profiles were computed from 'the water temperature and the dissolved-solids concentration as estimated from the specific conductance.
The following table shows the variations, before and after the floods,. in the average specific conductance along the centerline section of the three reservoirs and the range of specific conductance at site 08092600 on the Brazos River below Whitney Lake.
Before flood After flood Date Specific 1 Date Specific 1 (1978) conductance_/ (1978) conductance_/
Hubbard Creek June· 9 1450 Aug. 29 700 Reservoir
Possum Kingdom June 13 4000 Aug. 30 1600 Reservoir
Whitney Lake June 23 1600 Sept. 5 3000
Brazos River below July 1-Aug. 1 1300-1600 Aug. 2-31 1600-3700 Whitney Lake
y In micromhos per centimeter at 25°C.
After the flood in the Hubbard Creek area, the average specific conductance of the water in Hubbard Creek and Possum Kingdom Reservoirs was
.diluted from 1450 to 700 and from 4000 to 1600 micromhos, respectively (figs. 14 and 15). In Whitney Lake, the most downstream reservoir of the three, the specific conductance increased from 1600 to 3000 micromhos (fig. 16).
-18-

EXPLANATION
PI
• Reservoir data-collection site
Stream channel
0 2 MILES ~----~~----~
Bose from Texas General Highway map
99°
FIGURE 10.-Locations of water-quality data-collection sites on Hubbard Creek Reservoir

STEPHENS
COUNTY
0
EXPLANATION
Reservoir troverse ond doto·collection sites
-----Stream channel
Base from Texas G enerot Hiohwoy mop
98"30'
YOUNG l PALO- PINTO ____ CoUNTY ----
1
I
.. / r/'' J
v·· <t 98°30'
2 MILES
\ ,b
~~ ,. ~)
~,·
f . 'f/
FIGURE 11 .-Loc.ations of water-quality data -collection sites on Possum Kingdom Reservoir
COUNTY

EXPLANATION
Reservo.r tr averse and dolo -collection s1tes
St ream channel
O'---~---_j2 MILES
Bose from Texas General Highway mop
FIGURE 12.-locations of water-quality data-collection srte > on Whitney lake
I -v
FM 17/J
22

POSSUM KINGDOM RESERVOIR
----~----+------ 31°
College • station
08114000 ~ ~
Roshar~.q r • ., ,co
~f,'f.. of
EXPLANATION
A Streamflow or reservoir- content station and station number
• Chemical- quality or sediment station
0 tOO MILES
·FIGURE 13.-Locations of water-quality data-collection sites on the Brazos River

1150
1125
1100 0 > (!)
z IJJ > 1075 0 CD <1:
1-IJJ IJJ IJ...
z 1200
w 0 :::::> 1-
~ 1175 <1:
1150
1125
1100
average specific conductance profile = 1450
MILES UPSTREAM FROM DAM ALONG DROWNED RIVER CANNEL
\PII
PIO \_Approximate reservoir-bottom profile, 1978
Approximate average specific conductance for centerline profile= 1450
MILES UPSTREAM FROM HUBBARD CREEK ARM
DENSITY, IN GRAMS PER MILLILITER .996 .997 .998 .999
0 1000 2000 3000
SPECIFIC CONDUCTANCE ( micromhos per centimeter at 25° Celsius)
FIGURE 14.-Specific conductance and density for Hubbard Creek Res·ervoir during June and August 1978
0
DENSITY, IN GRAMS PER MILLILITER .996 .997 .998 .999
Hubbard Creek arm
Approximate average specific conductance for centerline profile, section= 700
MILES UPSTREAM FROM DAM ALONG DROWNED RIVER CHANNEL
reservoir- bottom
Approximate average specific conductance for centerline profile section= 700
5 MILES UPSTREAM FROM HUBBARD CREEK ARM
0 1000 2000 3000 SPECIFIC CONDUCTANCE
( micromhos per centimeter at 2 5° Celsius)
EXPLANATION
PIG SAMPLING SITE--See figure IOfor location
-1500- APPROXIMATE LINE OF EQUAL SPECIFIC CONDUCTANCE--Interval 100 micromhos per centimeter at 25 o
Celsius

Q
> (.!)
z w > 0 aJ <t 1-w w I.L
z
1000
975
950
925
900
875
975
900
875
POSSUM KINGDOM RESERVOIR, JUNE 13, 1978
Reservoir surface
Approximate reservoir-bottom profile, 1946
Approximate average specific conductance for centerline-profile section
of reservoir= 4000
POSSUM KINGDOM RESERVOIR AUGUST 30, 1978
Approximate reservoir-bottom profile, 1946
Approximate average speific conductance for centerline-profile section of reservoir= 1600
DENSITY, IN GRAMS .PER MILLILITER
.996 .998
SITE Ac
Specific
conductance
1.000 1.002
850~~~~~~~~~~~~~~~~~~~~~~~~~~~~~
0 10 20 30 40 50 60 70 0 2000 4000 6000
MILES UPSTREAM FROM DAM ALONG DROWNED RIVER CHANNEL SPECIFIC CONDUCTANCE
( micromhos per centimeter at 25° celsius)
EXPLANATION
Ac SAMPLING SITE-- See figure II for location
-1500- APPROXIMATE LINE OF EQUAL SPECIFIC CONDUCTANCE --Intervals are either 100 or 500 micromhos per centimeter at 25° Celsius
FIGURE 15.-Specific conductance and density for Possum Kingdom Reservoir during June and August 1978

0 > (.!)
z
550
525
500
475
450
425
WHITNEY LAKE JUNE 23, 1978
/ /
Lake surface
11~ Approximate reservoir bottom profile
Approximate average specific conductance
for centerline-profile section of Whitney lake= 1600
DENSITY, IN GRAMS PER MILL I LITER
.996 .998 1.000 1.002
SITE Ac
Specific conductance
~ 400 ~~-L~~~~~~~~~~~~-L~~L-~~-L-L~~~~-L-L~ 0 m <!
1-L&..I LL.I ~ 575 ro-.-.,-,-,-.,-,-,-,.-,-.,~-.-.-.~~~-.~~~~~~~~~ z
550
525
475
450
WHITNEY LAKE SEPTEMBER 5-6,1978
/ /
/
/ /
Lake surface
/ . . /~Approximate reservoir bottom
r profile
Approximate average specific conductance for centerline- profile section of Whitney Ia ke = 3000
SITE Ac
Specific conductance
400 ~~~~~~~~~~~~-L~~~~-L~~~~-L-L~~~~~~ 0 10 20 30 40 50 60 70 1000 2000 3000 4000
MILES UPSTREAM FROM DAM ALONG DROWNED RIVER CHANNEL SPECIFIC CONDUCTANCE
( micromhos per centimeter at 25° Celsius}
EXPLANATION
Ac SAMPLING SITE --See figure 12 for location
-1500- APPROXIMATE LINE OF EQUAL SPECIFIC CONDUCTANCE --lnterva Is are either 100 or 500 micromhos per centimeter at 2 5° Celsius
fiGURE 16.-Specific conducrance and density for Whitney Lake during .lune and September 1978

The daily specific conductance of water at five sites on the Brazos River (fig. 13) below Whitney Lake ranged from about 500 to 1500 rnicrornhos for about a month prior to the flood (fig. 17). A few days after the flood and the increased releases from the upstream reservoirs, the specific conductance increased at each of the five sites and reached a maximum of about 3700 rnicrornhos at site 08092600 below Whitney Darn. The releases from Whitney Lake (as indicated by the data for site 08092600 on the Brazos River) caused two distinct inflections in the specific~conductance curves at the four downstream sampling sites (fig. 17).
WATER-LEVEL CHANGES IN THE EDWARDS AQUIFER
Water-level hydrographs for selected ground-water observation wells in the artesian zone of the Edwards aquifer in south-central Texas (fig. 18) indicate that the water levels rose substantially between July 10-and August 25, 1978. The water levels in these observation wells, which are located near pumping centers, are influenced by changes in the pumping rates .. The water-level rises reflect a reduction in pumping and(or) recharge to the aquifer. · ·
-26-

6000 6000 4000 4000
BRAZOS RIVER AT WHITNEY DAM
(STATION 08092600) BRAZOS RIVER NEAR COLLEGE STATION,
5000 [ 5000 3000 TEXAS (STATION 08109500) . l )(43000
Discharge
4000 Discharge............. 1'\. 4000 2000 2000
en :J u; ...J w a
3000 3000 ~ 1000 1000 ~ ~ u
en N w :J en u; ~ ~ ...J w w ~ ~ 0 2000 2000 a w 0 o ~ ~ t;j 10 20 30 10 20 30 ti N ~ ~ JULY AUGUST ~ ~ ~ ~ !.!
15 1000 1000 ~ ~ 4000 4000 ~ t;j 1- w z ~ ~ ~ BRAZOS RIVER AT RICH~OND, TEXAS ;j !z LL o (STAT ION 08114000) 0 w u :J: ~
u 0 iii ;:,;: 3000 3000 ~ ::; 10 20 30 10 20 a ~ ~ ~ JULY AUGUST ~ ~ 0 2 w" z en :J: C) - ::J
;:,;: ~ w 2000 2000 ~ ~ :J: ~ ~ ~ 4000 4000 ~ ~ . !z ;:,;: 0 u ~ ~ ~ en ~ !;; w ~ 0 1000 - 1000 ~ u w u ~ 3000 3000 ~ ~ 1- 1- LL u z -5 <t tl ~ ~ ::; 0 0 u -
~ 2000 Specific conductance
2000 ~ <>tnaOill~ ~UllUU~IUll\Ot>\ 4000 4000
~ ~ BRAZOS RIVER AT ROSHARON, TEXAS 1000 1000 (STATION 08116650)
3ooo . I \ ~ 3ooo L Discharge\ J 1 0 '---. I I \ ....... , I I 0
2000 2000
1000 1000
0 0
FIGURE 17.-Daily specific conductance and. instantaneous discharge for five sites on the Brazos River downstream from Whitney Lake, July and August 1978

MONTELL, TEXAS
JULY AUG 10 15 2025 31 5 10 15 2025 31
28
24
20
16
12
890 H- 5-I
886
882
878
874 ~~~~~-L~~ I 0 10 2020 31 0 10 10 2020 31
JULY AUG WELL NO. YP-69-50·30Z
ACCUMULATED RAINFALL IN INCHES, JULY 10-AUGUST 15,1978
VANDERPOOL,TEXAS
JULY AUG 10 15 2025 31 5 1015 20 25 31
28
24
784 l-4-4
780
776
772
768 '-'-'--'-'-...._.L......L_._....._..L......J
10 15 2025 31 5 1015 2025 31 JULY AUG
WELL NO. YP-69-45-401
..r > 23.5 in
7 I 2 '--'--'--'--'-.J.....J'-'--'-......__.
1015202531 51015202531 JULY AUG
WELL NO. TD-69-47·302
8mi. N.E. OF BOERNE,TEX JULY AUG
10152025315 1015202531
28
24
20
16
12
681 ~-L-'-~~1.-1--L~ 1015 202531 5 10.15202531
JULY AUG WELL' NO. TD-68·41-301
WIMBERLY, TEXAS JULY AUG
10 15 2025 31 5 10 152025 31
665
661
657
653
649'--'-'--'-...._.L......I--'--'-......__.
10 15 2025 31 5 10 15 20 25 31 JULY AUG
WELL NO. AY-68-37-203
ALTITUDE OF WATER LEVELS IN WELLS IN FEET ABOVE NGVD, JULY 10- AUGUST 25,1978
0 10 20 30 MILES
FIGURE 18.-Water-level changes in wells 1n the Edwards aquifer, July 10-August 25, 1978
98°
661
657
/) 653 I
I
H- 36 649
645~-L~~~-L-L~
1015 2025 31 5 10 15 2025 31
wELCu~'b. ox-ae!'~8-zo9
/

SELECTED REFERENCES
Ellsworth, C. E., 1923, The floods in central Texas in September 1921: U.S. Geological Survey Water-Supply Paper 488, 56 p.
National Oceanic and Atmospheric Administration, 1978, Storm dat~, August 1978: Environmental Data and Information Service, National Climatic Center; 24 p.
Schroeder~ E. E., Grozier, R .. U., Hahl, D. C., and Hulme, A. E., 1974, Floods of September~October 1967 in .south Texas and ·northeastern Mexico: U.S. Geolog_ic.al Survey Water-Supply Paper 1880-B, 111 p.
Schroeder, E. E., and Massey, B. C., 1977, Techniques for estimating the magnitude and frequency of floods in Texas: U.S. Geological Survey Water-Resources Investigations 77-110, 22 p.
U.S. Water Resources Council, 1977, Guidelines for determining flood flow frequency: Hydrology Committee, Bulletin 17A, 26 p., 14 apps.
Yost, I. D., 1963, Floods of April-June 1957 in Texas and adjacent states: U.S. Geological Survey Water-Supply·Paper 1652-B, 321 p.
-29-

I Vol 0 I
Map WRD num- station Stream and place of
ber number determination
BRAZOS RIVER BASIN
1 08082500 Brazos River at Seymour
2 08082700 Millers Creek near Munday
3 08082800 Millers Creek Reservoir near Bomar ton
4 08082900 North Elm Creek near Throckmorton y
5 08083240 Clear Fork Brazos River at Hawley
6 08083245 Mulberry Creek near Hawley
7 08083300 Elm Creek near Abilene
8 08083400 Little Elm Creek near Abilene
9 08083420 Cat Claw Creek at Abilene
10 08083470 Cedar Creek at Abilene
11 08083500 Fort Phantom Hill Reservoir near Nugent
12 08084000 Clear Fork Brazos River at Nugent
13 08084500 Lake Stamford near Haskell
14 08084800 California Creek near Stamford
15 08085300 Humphries Draw near Haskell Y
16 08085500 Clear Fork Brazos River at Fort Griffin
17 08086050 Deep Creek at Moran y
18 08086150 North Fork Hubbard Cr~ek near Albany
19 08086212 Hubbard Creek below Albany
See footnotes at end of table.
Table I.--Summary of flood stages and discharges
Contribut Period Maximum flood ing drain of previously known age·area known Date Stage Discharge
(mi 2l floods (feet) (ft 3/s)
5,972 1906-78 Sept. 28, 1955 23.00 71,200
104 1883-1978 June 13' 1930 >18.0 y 240 1974 June 3' 1977 1,309.89 Y3,44o
3.58 1966 Apr. 30' 1966 26.28 1,350
1,416 1915 1932 y y
205 1932 1957 16.0 y
133 1963 Sept. 18, 1974 18.68 4,570
39.1 1903 1913 15.0 y
13.0 1970 Sept. 18, 1974 6.41 1,200
119 1970 Sept. 18, 1974 12.54 4,670
470 1940 May 25' 1957 58.7 Y89~910
2,199 1876 1876 30.0 y
368 1953 Sept. 9-10, 1962 1,416.6 y74,100
478 1897 June 10' 1962 29.6 y
3.51 1966 Aug. 5' 1971 19.41 1~840
3,988 1876 Sept. 1900 38.0 y
228 1888 June 6, 1961 25.6 y
39.3 1940 June 10' 1940 21.0 y July 18, 1953
613 1966 Jan. 21' 1968 25.10 27,200
Maximum during Recur-present flood renee
Date Stage Discharge interval (1978) (feet) (ft3/s) (years)
Aug. 5 14.20 28,200 --Aug. 4 17.53 34,600 >100
Aug. 6 1,335.30 y34,480 --
Aug. 4 30.6 . 5,000 >100
Aug. 4 14.64 2,540 .. --
Aug. 4 13.98 1,770 --..
Aug. 3 13 .20' 1,830 --
Aug. 3 9.50 .1,340 --Aug. 3 6".60. 1,310 --Aug. 3 .. 11.93 3,830 --
Aug. 6-10 48.4 . Y5o,37o --
Aug. 4 9.97 2,840 --
Aug. 5 1,422.18 y 103,6.00 --
Aug. 4 31.00 40,000 >100
Aug. 4 19.36 1,830 10 I
Aug. 4 38.88 149,000 . >100
-- 21.80 13,000 10
Aug. 4 . 23.3" 103,000 >100
Aug. 4 41.41 330,000 >100

I VI .... I
Map WRD num- station Stream and place of
ber number determination
20 08086290 Big Sandy Creek above Breckenridge
21 08086400 Hubbard Creek Reservoir near Breckenridge
22 08086500 Hubbard Creek near Breckenridge
23 08087300 Clear Fork Brazos River at Eliasvi11e
24 08088000 Brazos River at South Bend
25 08088300 Briar Creek near Graham
26 08088400 Lake Graham near Graham
27 08088450 Big Cedar Creek near Ivan
28 08088500 Possum Kingdom Reservoir near Graford
29 . 08089000 Brazos River near Palo Pinto
30 08092600 Brazos River at Whitney Dam near Whitney
31 08098290 Brazos River near Highbank
32 08099000 Leon Reservoir near Ranger
33 08099100 Leon River near De Leon
34 08099300 Sabana River near De Leon
35 08099400 Proctor Lake near Proctor
36 08109500 Brazos River near College Station
37 08114000 Brazos River at Richmond
38 08116650 Brazos River near Rosharon
See footnotes at end of table.
Table I.--Summary of flood stages and discharges--Continued
Contribut Period Maximum flood ing drain of previously known
age ·area known Date Stage Discharge (mi 2 ) floods (feet) (ft3/s)
280 1949 May 16, 1949 24.6 y July 20' 1953 Apr. 29' 1957
1,085 1962 Feb. 3' 1975 1,183.61 ?!327,200
1,089 1925 July 20' 1953 34.2 y
5,697 1877 Sept. 1900 35.0 y May 1' 1957
13' 107 1876 1876 36.2 y
24.2 1900 Sept. 1955 15.2 y
221 1958 Apr. 30, 1970 1,077. 77 ?!61,120
97.0 1964 July 8, 1968 22.39 9,590
14,030 1941 Oct. 5' 1941 1 ,001. 0 ?!743,700
14,245 1876 1876 ~ y
16,950 1853 May 9' 1922 45.0 y
20,870 1909 Dec. 1913 42.0 y
259 1955 June 13, 1967 1,382.2 ?!~40,640
479 1908 May 1908 19.3 y
264 1890 May 1908 24.0 y
1,259 1963 Jan. 26, 1968 1,174.84 ?! 137,500
30,033 -- -- -- --
35,441 1852 Dec. 10' 1913 51.2 y
35 '773 1884 Dec. 11' 1913 56.4 y
Maximum during Recur-present flood renee
Date Stage Discharge interval (1978) (feet) (ft3/s) (years)
Aug. 4 21.86 5,140 --
Aug. 5 1,188.06 ?! 401,500 --
Aug. 5 30.66 14,600 --Aug. 6 37.04 68,000 >100
Aug. 6 41.50 78,100 25
Aug. 5 .78 1.6 --
Aug. 5 1,067.61 ?!36,090 --Aug. 5 4.11 3.0 --Aug. 12 999.69 ?!564,800 --
I
Aug. 8 22.93 54,500 --Aug. 10 12.81 0'5,710 --
Aug. 13 5.90 4,000 --
Aug. 6-8 1,369.80 Y2o,ooo --
Aug. 4 2.47 17 --
Aug. 4 8.80 617 --
Aug. 4-7 1,154.48 ?!31,170 --
Aug. 18 -- I.l4,12o --
Aug. 20 6.90 3,850 --Aug. 21 13.29 3,270 --

I VI N I
Map WRD num- station Stream and place of
ber number determination
COLORADO RIVER BASIN
39 08126500 Colorado River at Ballinger
40 08127000 Elm Creek at Ballinger
41 08136500 Concho River at Paint Rock
. 42 08136700 Colorado River near Stacy
43 ·08138000 Colorado River at Winchell
44 08140600 Lake Clyde near Clyde
45 08140700 Pecan Bayou near Cross Cut
46 08140800 Jim Ned Creek near Coleman
47 08141000 Hords Creek Lake near Valera
48 08141500 Hords Creek near Valera
49 08143000 Lake Brownwood near Brownwood
so 08143500 Pecan Bayou at Brownwood
51 08143600 Pecan Bayou near Mullin
52 08144500 San Saba River at Menard
53 08144800 Brady Creek near Eden
54 08144900 Brady Creek Reservoir near Brady
55 08145000 Brady Creek at Brady
56 08146000 San Saba River at San Saba
57 08147000 Colorado River near San Saba
58 08148000 Lake Buchanan near Burnet
I
See footnotes at end of table.
Table I.--Summary of flood stages and discharges--Continued
Contribut- Period Maximum flood ing drain- of previously known age. area known Stage Discharge Date (mi~) floods (feet) (ft 3/s)
5,240 1882 1884 36.0 ij
471 1904 Aug. 1906 yl4.50 1/ Oct. 13, 1957 14.20 so,ooo
5,132 1853 Sept. 17, 1936 43.4 301,000
11,160 1882 Sept. 18, 1936 64.59 356,000
11,700 1882 Sept. 19, 1936 62.20 ij
37.9 1970 May 28, 1975 1,873.4 ?.16,370
532 1900 1908 26.5 ij
333 1961 May 6, 1969 9.08 5,020
48 1948 May 1, 1956 1,906.86 ?.112,790
53 1900 July 3, 1932 23.0 y
1,535 1933 May 2, 1956 1,431.4 ?.1192,300
1,614 1900 July 3, 1932 -- ry235,000
2,034 1967 Jan. 23, 1968 29.26 13,700
1,151 1880 June 6, 1899 23.3 ij
97 1884 July 1938 15.8 ij
513 1963 Sept. 24, 1971 1,747.7 ?.140,880
575 1882 July 23, 1938 29.1 86,000
3,042 1899 July 23, 1938 39.3 203,000
17,720 1878 July 23, 1938 63.2 224,000
18,370 1937 Jan. 24, 1968 1,020.8 YI,OIO,OOO
Maximum during Recur-present flood renee
Date Stage Discharge interval (1978) (feet) (ft 3/s) (years)
Aug. 3 23.95 16,600 --
Aug. 3 9.17 23,400 15
Aug. 3 19.11 12,700 --
Aug. 4 22.50 35,700 --
Aug. 5 31.88 29,600 --
Aug. 4 1,875.50 ?.17,420 --
Aug. 4 24.90 16,200
Aug. 4 5. 77 1,830 --
Aug. 5 1,887.90 ?.13,570 --
Aug. 3 11.06 2,360 --
Aug. 16-24, 1,424.4 y 138,500 --29, 30
Aug. 4 LOS 47 --I
Aug. 3 6.50 1,690 --
Aug. 2 17.36 35,400 25
Aug. 3 1.3 2.1 --
Aug. 3 1,738.12 ?.121,570 --
Aug. 2 8.31 536 --
Aug. 3 28.38 27,000 --
Aug. 4 22.59 28,100 --
Aug. 8 1,011.94 ?.!814,700

I (.,.J (.,.J I
Map WRD station Stream and place of num- determination her number
59 -- Bear Creek at Interstate High-way 10 near Junction 10/
60 08148500 North Llano River near Junction y
61 08150000 Llano River near Junction
62 08150700 Llano River near Mason
63 08150800 Beaver Creek near Mason
64 08151500 . Llano River at Llano
65 08152000 Sandy Creek near Kingsland
66 08152800 Spring Creek near Fredericks-burg y
67 08153100 Cane Branch at Stonewall ~
68 081S3soo Pedernales River near Johnson City
69 08154500 Lake Travis near Austin
GUADALUPE RIVER BASIN
70 08165300 North Fork Guadalupe River near Hunt
71 08165500 Guadalupe River at Hunt
72 08166000 Johnson Creek near Ingram
73 -- Turtle Creek at State Highway 16 near Kerrville 10/
74 08166300 Turtle Creek tributary near Kerrville y
75 08167000 Guadalupe River at Comfort
76 08167500 Guadalupe River near Spring Branch
See footnotes at end of table.
Table 1.--Summary of flood stages and discharges--Continued
Contribut Period Maximum flood Maximum dur1ng Recur-ing drain of previously known present flood renee
known Stage Discharge Date Stage Discharge interval age area Date (mi2_l floods (feet) (ft3/s) (1978) (feet) (ft3/s) (years)
155 1936 Sept. 16, 1936 -- 31,300 Aug. 3 -- 81,000 --
914 1875 Sept. 16, 1936 29.2 94,800 Aug. 2 23.50 64,800 10
1,874 1875 June 14' 1935 43.3 319,000 Aug. 2 22.14 76,700 --
3,280 1875 June 14' 1935 -- !.!./388,000 Aug. 3 21.35 92,500 --218 1963 May 16' 1965 13.58 23,200 Aug. 3 24.00 66,900 >100
4,233 1879 June 14' 1935 41.5 380,000 Aug. 3 25.61 139,000 15
327 1881 Sept. 11, 1952 34.2 163,000 Aug. 2 8.89 3,610 --
15.2 1967 Aug. 28, 1974 8.42 7,530 Aug. 3 17.0 42,500 >100
1.37 -- -- -- -- Aug. 3 -- <10 --
947 1859 Sept. 11, 1952 42.5 441,000 Aug. 3 24.9 127,000 25
25,250 1940 May 18, 1957 707.4 .Y 1 '770' 000 Aug. 4 662.9 .Y868,2oo --
168 1900 July 1, 1932 37.3 140,000 Aug. 3 26.8 39,300 --
288 1900 July 2' 1932 36.6 206,000 Aug. 2 23.5 62,900 1.0
114 1852 July 2' 1932 35.0 138,000 Aug. 3 21.4 73,900 60
26.5 -- -- -- -- Aug. 2 -- . 32,700 --
.46 -- -- -- -- -- 11.2 605 --
838 1848 July 1869 40.3 !I Aug, 2 40.9 240,000~ >100
1,315 1859 1869 53.0 !I Aug. 3 45.25 158,000 >100

I ~ +:-1
Table 1.--Summary of flood stages and discharges--Continued
Map WRD Contribut Period Maximum flood Maximum during Stream and place of ing drain of previously known present flood num- station
ber number determination age area known Date Stage Discharge Date Stage Discharge
_(_mi 2_1 (ft3/s)
77 08167600 Rebecca Creek near Spring Branch
78 08167700 Canyon Lake near New Braunfels
79 08167800 Guadalupe River at Sattler
80 -- North Prong Medina River near Medina 10/
81 08178900 Bandera Creek tributary near Bandera Y
82 08179000 Medina River near Pipe Creek
83 08179100 Red Bluff Creek near Pipe Creek
84 08179500 Medina Lake near San Antonio
85 08180500 Medina River near Rio Medina y 86 08180800 Medina River near Somerset
87 08181500 Medina River at San Antonio
88 08183900 Cibolo Creek near Boerne
NUECES RIVER BASIN
89 08195000 Frio River at Concan
90 08196000 Dry Frio River near Reagan Wells
91 08198000 Sabinal -River near Sabinal
92 08200000 Hondo Creek near Tarpley
93 08201500 Seco Creek at Miller Ranch near Utopia
1/ Discharge not determined. 2! Contents in acre-feet. 3! Discontinued site, see table 2.
floods
10.9 1885 Sept. 1952
1,432 1962 Apr. 22, 1977
1,436 1962 Feb. 11, 1975
67.5 1932 July 1, 1932
.27 -- --
474 1880 1919
56.3 1905 Sept. 27, 1964
634 1913 Sept. 16, 1919
650 1922 July 15, 1973
967 1890 July 17, 1973
1,317 1939 July 17, 1973
68.4 1892 Sept. 27, 1964
405 1869 July 1, 1932
117 1875 1880
206. 1892 July 2, 1932
86.2 1907 June 17, 1958
"43.1 1901 June 17, 1958
----- ----
4! The maximum stage since 1915 occurred in 1932 and the second highest - stage occurred in 1959, 2,510 feet.
8/ 9!
10/ IT! IT! 13/ 14/
5/ The maximum stage occurred in 1876 and was several feet higher than - flood of June 16, 1930, 30 feet, 95,600 ft 3/s. 6/ Stage.and discharge data at site 08093100. ZJ At site 6.5 miles downstream.
(feet) (1978) (feet) (ft3/s)
25.5 y Aug. 1 2.06 1.5
·917.96 ?:!460,400 Aug. 4 121930.61
8.18 1315,390 Aug. 5 8.31
-- 40,200 Aug. 2 --
-- -- Aug. 2 10.9
43.0 141115,000 Aug. 2 49.6
22.64 46,900 Aug. 2 3.7
1,078.0 ?1288,000 Aug. 2 1,076.67
23.2 28,600 Aug. 2 20.0
29.39 30,500 Aug,, 4 22.35
43.59 31,900 Aug. 4. 29.95
19.15 36,400 Aug. 2 3.65
34.44 162,000 Aug. 2 6.9
33.0 y Aug. 1 5.23 ..
33.0 y Aug. 2 19.43 ;
28.2 69·,800 Aug. 2 13.10
16.4 52,600 Aug. 2 8.40
---- ---- ---
Backwater from Colorado River. Prior to completion of Lake Brownwood. Miscellaneous site, see table 2. At site 17 miles downstream. Elevation at 2400 hours.
?1588,400
5,850
123,000
120
281,000
160
?1281,000
20,100
12,800
1,030
462
3,350
1,500
23,200
13,200
10,600
Maximum since closure of Canyon Dam on July 21, 1962. From rating extended above 32,000 ft 3/s on basis of slope-area measurement of 64,000 ft3/s.
~ '
Recur-renee
interval (years)
--
--
--
--
--
>100
--
--
----
--
--
--
--
--
--
--

Map number
4
15
17
59
60
66
67
73
74
80
81
85
Station number
08082900
08085300
08086050
08148500
08152800
08153100
08166300
08178900
08180500
Table 2.--Locations of discontinued stream-gaging stations and miscellaneous discharge-measurement sites
Name and location
BRAZOS RIVER BASIN
North Elm Creek near Throckmorton. Lat 33°10 1 50", long 99°22 1 05, Throckmorton County, Hydrologic Unit 12060101, at culvert on State Highway 24, and 11.3 miles (18.2 kilometers) west of Throckmorton.
Humphries Draw near Haskell. Lat 33°10 1 40", long 99°34 1 30", Haskell County, Hydrologic Unit 12060101, at culvert on State Highway 24, and 9.3 miles (15.0 kilometers) east of Haskell.
Deep Creek at Moran. Lat 32°33 1 33", long 99°l0 1 ll", Shackelford County, Hydrologic Unit 12060105, at downstream side of bridge on U.S. Highway 380, 0.8 mile (1.3 kilometer) north of Moran, and 10.8 miles (17.4 kilometers) upstream from Hubbard Creek.
COLORADO RIVER BASIN
Bear Creek at Interstate Highway 10 near Junction. Lat 30°31 1 57", long 99°50 1 ll", Kimble County, Hydrologic Unit 12090202, 1.3 miles (2.1 kilometers) upstream from Interstate Highway 10, 1.5 miles (2.4 kilometers) upstream from mouth, and 3.4 miles cs~s kilometers) west of Junction.
North Llano River near Junction. Lat 30°31 1 06", long 99°48 1 39", Kimble County, Hydrologic Unit 12090202, 1,000 feet (305 meters) upstream from remains of old Wilson Dam, 2.1 miles (3.4 kilometers) northwest of Junction, and 4 miles (6 kilometers) upstream from confluence with South Llano River.
Spring Creek near Fredericksburg. Lat 30°18 1 10", long 99°03 1 20", Gillespie County, Hydrologic Unit 12090206, downstream· side of bridge on U.S. Highway 290, and ll miles (18 kilometers) west of Fredericksburg.
Cane Branch at Stonewall. Lat 30°14 1 07 11, long 98°39 1 21", Gillespie County, Hydrologic
Unit 12090206, at culvert on U.S. Highway 290 at Stonewall, and 0.6 mile (1.0 kilometer) upstream from Pedernales River.
GUADALUPE RIVER BASIN
Turtle Creek at State Highway 16 near Kerrville. Lat 29°57 1 41", long 99°12 1 35", Kerr County, Hydrologic Unit 12100201, 0.1 mile (0.2 kilometer) upstream from Lambs Creek, at State Highway 16 and 9.0 miles (14.5 kilometers) southwest of Kerrville.
Turtle Creek tributary near Kerrville. Lat 29°58 1 11", long 99°ll 1 02", Kerr County, Hydrologic Unit 12100201, at culvert on Farm Road 2771, and 5.9 miles (9.5 kilometers) south of Kerrville.
North Prong Medina River near Medina. Lat 29°51 1 49", long 99°22 1 18", Bandera County, Hydrologic Unit 12100302, 0.5 mile (0.8 kilometer) upstream from Lima School, and 12.0 miles (19.3 kilometers) upstream from mouth.
Bandera Creek tributary near Bandera. Lat 29°50 1 51", long 99°06 1 12", Bandera County, Hydrologic Unit 12100302, at culvert on Farm Road 689, and 10 miles (16 kilometers) north of Bandera.
Medir.a River near Rio Medina. Lat 29°:29 1 53", long 98°54 1 16", Medina County, Hydrologic Unit 12100302, on left bank 233 feet (71 meters) upstream from bridge at Haby 1s crossing, 4.2 miles (6.8 kilometers) northwest of Rio Medina, and 10.4 miles (16.7 kilometers) upstream from San Geronimo Creek.
-35-

Table 3.--Water-quality data for Hubbard Creek, June 9 and August 29, 1978
June 9; 1978 August 29, 1978 Elevation: 1174 .13 feet Elevation: 1181.80 feet Contents: 201,200 acre-feet Contents: 299,900 acre-feet
Site Specific Tern- Dis- Per- Specific Tern- Dis- Per-
conduct- conduct-Depth pH per a- solved cent Depth pH per a- solved cent (feet) ance (units) ture satu- (feet) ance (units) ture satu-(micro- oxygen (micro-
oxygen
mhos) (oC) (mg/L) ration mhos)
(oC) (mg/L) ration
pl 1 1510 8.1 25.0 7.0 90 1 894 8.0 27.0 5.8 73 10 1510 8.1 25.0 7.0 90 10 894 8.0 27.0 5.2 66 20 1510 8.1 25.0 6.9 88 20 894 7.9 26.5 5.1 65 30 1510 8.1 24.5 6.8 87 30 860 7.4 26.0 2.0 38 40 1510 7.3 22.5 1.9 23 40 700 7.3 24.5 1.0 12 so 1510 7.2 21.5 .7 8 so 333 7.4 23.0 .5 6 60 1530 7.2 21.0 . 2 2 60 333 7.3 23.0 .4 5
65 333 7.3 23.0 .3 4
p4 1 1520 8.1 25.5 7.1 92 1 894 8.4 28.0 6.7 86 13 1520 8.1 25.0 7.0 90 10 894 8.2 27.5 6.3 81
20 894 7.6 26.0 3.2 40 25 840 7.5 26.0 2.7 34
p6 1 1510 8.1 27.5 7.3 97 1 890 8.3 28.0 6.5 83 10 1510 8.1 26.5 7.4 97 10 880 8.3 28.0 6.2 79 20 1510 8.1 26.0 7.0 91 20 850 8.1 27.5 5.9 76 30 1510 7.9 25.0 6.1 78 30 820 7.8 27.0 5.1 65 40 1510 7.2 23.5 1.4 18 40 730 7.4 25.0 1.9 23 so 1510 7.2 22.5 .3 4 so 390 7.4 24.0 .3 4 59 1510 7.2 22.0 .3 4 60 380 7.4 24.0 .3 4
67 370 7.3 24.0 .3 4
pg 1 1500 8.1 27.5 7.3 97 1 831 8.3 28.5 7.1 92 10 1500 8.1 26.5 7.2 95 10 831 8.2 28.0 6.7 86 20 1500 8.1 26.5 6.9 91 20 821 8.1 28.0 6.2 79 30 1500 8.0 26.0 6.3 82 30 754 7.3 26.5 1.8 23 42 1500 7.4 25.5 3.0 39 40 754 7.3 26.5 1.2 15
47 754 7.3 26.5 1.2 15
plO 1 1490 8.1 26.0 7.1 92 1 793 8.1 27.5 6.5 83 10 1490 8.0 25.5 6.6 86 10 780 8.0 27.0 6.0 76 20 1490 8.0 25.5 6.3 82 20 740 7.7 27.0 5.1 65 33 1490 7.8 25.5 5.2 68 30 740 7.6 27.0 4.2 53
41 740 7.3 27.0 1.9 24
pll 1 1470 8.1 28.0 7.0 93 1 750 7.9 28.0 6.1 78 10 1470 8.0 26.5 6.5 86 10 739 7.7 27.5 5.3 68 23 1470 8.0 26.5 6.3 83 20 725 7.4 27.5 3.3 42
32 720 7.3 27.5 1.8 23
pl2 1 1160 8.1 27.5 8.2 109 1 661 7.5 28.0 4.6 59 12 1210 7.7 26.5 5.6 74 10 640 7.3 27.0 3.2 41
21 625 7.0 26.5 .3 4
pl3 1 1510 8.1 25.5 7.2 94 1 890 8.3 28.0 6.6 85 10 1510 8.1 25.0 7.0 90 10 890 8.2 28.0 6.3 81 20 1510 8.1 25.0 6.8 87 20 886 8.1 27.5 5.8 74 30 1510 8.0 24.5 6.2 79 30 841 7.4 26.5 1.8 23 40 1510 7.3 23.0 2.1 26 40 635 7.3 25.0 .4 5 55 1510 7.2 22.0 1.1 13 so 350 7.3 26.0 .3 4
58 280 7.4 26.5 .4 5
p15 1 1510 8.0 26.5 6.8 89 1 870 8.1 28.0 6.0 77 10 1510 8.0 26.0 6.4 83 10 865 7.9 27;5 5.5 71 20 1510 7.9 26.0 5.8 75 20 856 7.7 27.5 4.6 59 33 1510 7.5 25.5 3.3 43 30 850 7.6 28.0 4.1 53
36 845 7.4 28.0 3.4 44
pl6 1 1510 8.1 26.5 7.1 93 1 851 7.6 28.0 5.0 64 10 1510 8.0 25.5 6.4 83 10 845 7.6 27.5 4.5 58 22 1510 7.9 25.0 6.1 78 20 840 7.5 27.5 4.1 53
31 793 7.2 27.5 .5 6
-36-

Table 3.--Water-quality data for Hubbard Creek, June 9 and August 29, 1978--Continued
June 9, 1978 August 29, 1978 Elevation: 1174.13. feet Elevation: 1181.80 feet Contents: 201,200 acre-feet . Contents: 299,900 acre-feet
Site Specific Tern- Dis- Per- Specific Tern- Dis- Per-conduct- conduct-Depth pH per a- solved cent Depth pH per a- solved cent ance ance (feet) (micro- (units) ture oxygen satu- (feet) (micro- (units) ture oxygen satu-
mhos) (oC) (mg/L) rati.,n mhos)
(oC) {mg/L) ration
pl7 1 1180 8.1 27.0 7.1 93 1 801 7.4 28.0 4.7 60 10 1200 7.4 26.0 3.1 40 10 797 7.1 27.5 1.2 15 18 1310 7.2 26.0 .6 8 24 725 7.1 27.0 .4 5
pl8 1 978 7.7 26.0 5.8 75 1 858 7.4 28.0 3.9 so 11 987 7.3 25.5 2.7 35 10 858 7.2 28.0 .9 12
22 804 7.1 26.5 .3 4
-37-
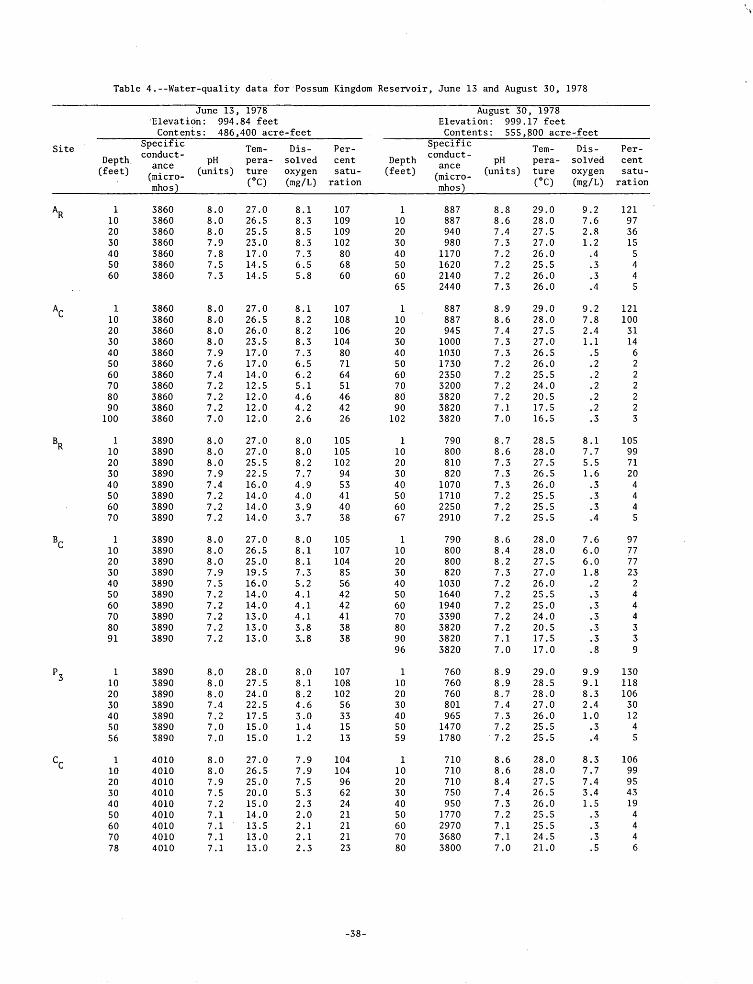
Table 4.--Water-quality data for·Possum Kingdom Reservoir, June 13 and August 30, 1978
June 13, 1978 August 30, 1978 ·Elevation: 994.84 feet Elevation: 999.17 feet
Contents: 486,400 acre-feet Contents: 555,~00 acre-feet
Site Specific Tern- Dis- Per- Specific Tern- Dis- Per-conduct- conduct-Depth. pH per a- solved cent Depth pH pera- solved cent ance ance (feet) (micro- (units) ture oxygen satu- (feet) (micro- (units) ture oxygen satu-
mhos) (oC) (mg/L) ration mhos)
(oC) (mg/L) ration
AR 1 3860 8.0 27.0 8.1 107 1 887 8.8 29.0 9.2 121 10 3860 8.0 26.5 8.3 109 10 887 8.6 28.0 7.6 97 20 3860 8.0 25.5 8.5 109 20 940 7.4 27.5 2.8 36 30 3860 7.9 23.0 8.3 102 30 980 7.3 27.0 1.2 15 40 3860 7.8 17.0 7.3 80 40 1170 7.2 26.0 .4 5 so 3860 7.5 14.5 6.5 68 so 1620 7.2 25.5 .3 4 60 3860 7.3 14.5 5.8 60 60 2140 7.2 26.0 .3 4
65 2440 7.3 26.0 .4 5
Ac 1 3860 8.0 27.0 8.1 107 1 887 8.9 29.0 9.2 121 10 3860 8.0 26.5 8.2 108 10 887 8.6 28.0 7.8 100 20 3860 8.0 26.0 8.2 106 20 945 7.4 27.5 2.4 31 30 3860 8.0 23.5 8.3 104 30 1000 7.3 27.0 1.1 14 40 3860 7.9 17.0 7.3 80 40 1030 7.3 26.5 .5 6 so 3860 7.6 17.0 6.5 71 so 1730 7.2 26.0 .2 2 60 3860 7.4 14.0 6.2 64 60 2350 7.2 25.5 . 2 2 70 3860 7.2 12.5 5.1 51 70 3200 7.2 24.0 .2 2 80 3860 7.2 12.0 4.6 46 80 3820 7.2 20.5 . 2 2 90 3860 7.2 12.0 4.2 42 90 3820 7.1 17.5 .2 2
100 3860 7.0 12.0 2.6 26 102 3820 7.0 16.5 .3 3
BR 1 3890 8.0 27.0 8.0 105 1 790 8.7 28.5 8.1 105 10 3890 8.0 27.0 8.0 105 10 800 8.6 28.0 7.7 99 20 3890 8.0 25.5 8.2 102 20 810 7.3 27.5 5.5 71 30 3890 7.9 22.5 7.7 94 30 820 7.3 26.5 1.6 20 40 3890 7.4 16.0 4.9 53 40 1070 7.3 26.0 .3 4 so 3890 7.2 14.0 4.0 41 so 1710 7.2 25.5 .3 4 60 3890 7.2 14.0 3.9 40 60 2250 7.2 25.5 .3 4 70 3890 7.2 14.0 3.7 38 67 2910 7.2 25.5 .4 5
Be 1 3890 8.0 27.0 8.0 105 1 790 8.6 28.0 7.6 97 10 3890 8.0 26.5 8.1 107 10 800 8.4 28.0 6.0 77 20 3890 8.0 25.0 8.1 104 20 800 8.2 27.5 6.0 77 30 3890 7.9 19.5 7.3 85 30 820 7.3 27.0 1.8 23 40 3890 7.5 16.0 5.2 56 40 1030 7.2 26.0 . 2 2 so 3890 7.2 14.0 4.1 42 so 1640 7.2 25.5 .3 4 60 3890 7.2 14.0 4.1 42 60 1940 7.2 25.0 .3 4 70 3890 7.2 13.0 4.1 41 70 3390 7.2 24.0 .3 4 80 3890 7.2 13.0 3.8 38 80 3820 7.2 20.5 .3 3 91 3890 7.2 13.0 3 .. 8 38 90 3820 7.1 17.5 .3 3
96 3820 7.0 17.0 .8 9
p3 1 3890 8.0 28.0 8.0 107 1 760 8.9 29.0 9.9 130 10 3890 8.0 27.5 8.1 108 10 760 8.9 28.5 9.1 118 20 3890 8.0 24.0 8.2 102 20 760 8.7 28.0 8.3 106 30 3890 7.4 22.5 4.6 56 30 801 7.4 27.0 2.4 30 40 3890 7.2 17.5 3.0 33 40 965 7.3 26.0 1.0 12 so 3890 7.0 15.0 1.4 15 so 1470 7.2 25.5 .3 4 56 3890 7.0 15.0 1.2 13 59 1780 7.2 25.5 .4 5
cc 1 4010 8.0 27.0 7.9 104 1 710 8.6 28.0 8.3 106 10 4010 8.0 26.5 7.9 104 10 710 8.6 28.0 7.7 99 20 4010 7.9 25.0 7.5 96 20 710 8.4 27.5 7.4 95 30 4010 7.5 20.0 5.3 62 30 750 7.4 26.5 3.4 43 40 4010 7.2 15.0 2.3 24 40 950 7.3 26.0 1.5 19 so 4010 7.1 14.0 2.0 21 so 1770 7.2 25.5 .3 4 60 4010 7.1 13.5 2.1 21 60 2970 7.1 25.5 .3 4 70 4010 7.1 13.0 2.1 21 70 3680 7'.1 24.5 .3 4 78 4010 7.1 13.0 2.3 23 80 3800 7.0 21.0 .5 6
-38-

Table 4~--Water-quality data for Possum Kingdom Reservoir, June 13 and August 30, 1978--Continued
June 13, 1978 August 30, 1978 Elevation: 994.84 feet Elevation: 999.17 feet Contents: 486,400 acre-feet Contents: 555,800 acre-feet
Site Specific Tern- Dis- Per- Specific Tern- Dis- Per-conduct- conduct-Depth pH per a- solved cent Depth pH per a- solved cent (feet) ance (units) ture satu- (feet) ance (units) ture satu-(micro-
oxygen (micro- oxygen
mhos) (oC) (mg/1) ration mhos)
(oC) (mg/1) ration
P5 1 3940 8.0 27.5 7.7 103 1 720 8.6 28.0 8.2 105 10 3940 8.0 27.0 7.7 101 10 720 8.5 28.0 8.1 104 20 3940 7.8 26.5 7.2 95 20 720 8.5 28.0 8.0 103 30 3940 7.8 25.5 5.0 64 30 720 8.5 27.5 8.1 104 34 3940 7.7 25.5 6.1 78 40 830 7.3 27.0 2.3 29
p7 1 3930 8.0 27.5 7.6 101 1 770 8.6 28.0 7.6 97 10 3930 8.0 27.0 7.5 99 10 770 8.6 28.0 7.2 92 20 3930 7.8 26.0 7.4 96 20 770 8.4 27.0 6.6 84 30 3930 7.6 23.0 5.1 63 30 870 7.2 27.0 1.0 13 40 3930 7.0 23.0 1.7 21 40 1130 7.2 26.0 .3 4 50 3930 7.0 22.0 .9 11 54 770 7.2 26.0 .5 6 60 3930 7.0 22.0 .9 11
DC 1 3970 8.0 27.5 7.7 103 1 732 8.4 27.5 7.1 91 10 3970 8.0 27.5 7.7 103 10 742 8.4 27.5 6 .. 9 88 20 3970 8.0 26.5 7.7 101 20 742 8.3 27.5 6.8 87 30 3970 7.2 23.0 3.4 42 30 762 7.5 27.0 3.6 46 40 3970 7.2 16.0 1.1 12 40 970 7.2 25.5 1.2 15 50 4030 7.2 i4.5 .9 9 50 1740 7.2 25.5 .2 2 60 4030 7.2 14.5 .8 8 60 3180 7.1 25.5 .3 4 65 4030 7.2 14.5 1.1 11 72 3440 7.0 24.5 .3 4
Ec 1 4150 8.0 27.0 7.9 104 1 779 8.5 29.5 7.8 103 10 4150 8.0 26.5 7.7 101 10 779 8.4 29.0 7.5 99 20 4150 7.8 25.5 7.0 90 20 779 8.0 28.0 5.7 73 30 4380 7.0 23.0 1.0 12 30 810 7.3 27.0 1.4 18 40 4380 7.0 18.0 .3 3 40 1020 7.2 26.5 .5 6 50 4380 7.0 16.5 .4 4 50 2170 7.2 26.0 .3 4
58 2430 7.2 26.0 .4 5
Fe 1 4250 8.1 28.0 8.0 107 1 770 8.5 29.0 8.0 105 10 4250 8.0 27.0 7.5 99 10 840 8.3 29.0 7.0 92 20 4250 7.8 26.5 6.9 91 20 960 7.9 28.0 4.4 5.6 30 4320 7.2 24.5 3.8 48 30 1410 7.2 27.0 .3 4 43 4420 6.9 20.0 .3 3 42 1570 7.2 27.0 .3 4
Gc 1 4210 8.0 28.0 8.0 107 1080 8.5 29.5 8.1 107 10 4240 8.0 27.0 7.5 99 10 1030 8.0 28.5 5.6 73 20 4240 7.7 26.5 6.0 79 20 1030 7.8 28.0 4.5 58 34 4440 7.4 25.8 4.7 61 30 1420 7.2 27.0 .3 4
40 1640 7.2 26.5 .3 4
p9 1 4240 8.1 28.0 9.1 121 1 1300 7.9 29.0 5.8 76 10 4240 8.1 27.5 8.6 115 10 1300 7.6 28.5 4.2 55 20 4290 7.2 26.5 3.3 43 20 1480 7.2 27.5 .9 12 30 4290 7.2 26.5 3.0 39 33 1480 7.2 27.5 .5 6
plO 1 4110. 8.1 29.5 9.8 132 1 1120 8.7 30.0 8.7 116 10 3960 7.9 28.0 8.3 111 10 1330 8.5 29.0 7.3 96 14 3960 7.9 28.0 7.8 104 19 3350 7.8 29.0 ·4 .8 63
-39-

Table 5.--Water-quality data for Whitney Lake, June 23 and September S-6, 1978
June 23, 1978 September S-6, 1978 Elevation: 521.69 feet Elevation: 532.44 feet Contents: 406,100 acre-feet Contents: 615,000 acre-feet
Specific Tern- Dis- Per- Specific Tern- Dis- Per-Site conduct- conduct-Depth pH per a- solved cent Depth pH pera- solved cent (feet) ance (units) ture satu- (feet) ance (units) ture
(micro- oxygen (micro- oxygen satu-
mhos) (oC) (mg/L) ration mhos)
(oC) (mg/L) ration
AL 1 1410 8.0 26.6 6.3 82 1 2240 8.3 30.0 7.9 lOS 10 1410 8.0 26.6 6.3 82 10 2240 8.3 29.5 7.9 105 20 1410 8.0 26.5 5.9 77 20 2240 8.2 29.0 7.3 96 34 1410 7.4 24.8 1.0 13 30 2240 7.8 28.0 5.3 69
42 3130 7.2 28.0 .5 6
Ac 1 1410 8.1 26.7 6.8 88 1 2240 8.3 30.0 7.8 105 10 1410 8.1 26.6 6.7 87 10 2240 8.3 29.0 7.8 103 20 1410 8.0 26.3 5.4 70 20 2240 8.2 29.0 7.4 97 30 1410 7.6 25.3 2.4 31 30 2290 7.6 28.0 4.0 53 40 1410 7.4 22.8 .2 2 40 2950 7.2 28.0 .3 4 so 1400 7.4 20.7 . 2 2 so 3490 7.1 26.5 .3 4 60 1400 7.4 19.6 .2 2 60 3500 7.1 25.5 .3 4 70 1390 7.4 18.7 .2 2 70 3320 7.1 25.5 .3 4 80 1380 7.4 17.4 .2 2 80 3060 7.1 24.0 .4 5 89 1370 7.4 16.6 . 2 2 90 2360 7.1 21.0 .4 5
101 2240 7.1 20.0 .6 7
Be 1 1450 8.2 27.4 6.8 89 1 2220 8.3 29.5 7.8 100 10 1450 8.3 27.2 6.8 89 10 2220 8.3 29.0 7.6 100 20 1480 8.0 26.8 5.2 68 20 2220 8.2 28.5 6.7 87 30 1460 7.9 26.5 4.5 58 30 2270 7.7 28.0 4.4 57 40 1410 7.4 22.8 .2 2 40 3210 7.2 27.5 . 2 3 so 1400 7.4 20.9 .2 2 so 3520 7.1 26.5 .2 3 60 1390 7.4 20.0 .2 2 60 3600 7.1 26.0 .3 4 70 1390 7.4 19.2 .2 2 70 3500 7.1 25.0 .3 4 80 1380 7.2 18.3 .2 2 80 3190 7.1 24.0 .3 4 85 1370 7.4 17.5 .2 2 90 2640 7.1 21.5 .4 5
96 2470 7.1 21.0 .5 6
cc 1 1460 8.2 28.0 6.8 91 1 2200 8.3 29.5 7.7 101 10 1460 8.3 28.0 6.8 91 10 2200 8.3 28.5 7.2 94 20 1460 8.2 27.9 6.7 88 20 2200 8.1 28.5 6.2 81 30 1460 8.2 27.6 6.6 87 30 2260 7.8 28.0 4.9 63 40 1520 7.5 25.9 1.3 17 40 3240 7.2 27.5 .2 3 so 1390 7.4 21.3 .2 2 so 3560 7.1 26.5 .3 4 60 1380 7.4 20.1 .2 2 60 3580 7.1 26.0 .3 4 70 1370 7.4 19.0 .2 2 70 3520 7.1 25.5 .3 4 78 1360 7.4 19.0 .2 2 80 3300 7.1 24.5 .3 4
90 3000 7.1 22.5 .s 6
DC 1 1470 8.2 28.4 6.8 88 1 2180 8.4 29.5 7.9 107 10 1470 8.3 28.5 6.8 88 10 2210 8.2 28.5 6.4 86 20 1480 8.3 28.6 6.7 87 20 2280 7.6 28.0 3.6 48 30 1510 8.2 28.3 6.3 84 30 2930 7.2 28.0 .2 3 40 1660 7.6 27.4 2.8 37 40 3510 7.2 27;0 .3 4 so 1500 7.4 22.5 .1 1 so 3670 7.1 26.5 .3 4 60 1440 7.4 20.9 .1 1 60 3720 7.1 26.0 .3 4 66 1430 7.4 20.9 .1 1 70 3680 7.1 25.5 .3 4
76 3660 7.1 25.5 .4 5
Ec 1 1510 8.1 29.2 6.7 91 1 2210 8.3 29.0 7.5 99 10 1510 8.2 29.1 6.7 91 10 2220 8.1 28.5 6.5 86 20 1510 8.2 29.0 6.7 91 20 2230 7.9 28.5 5.2 69 30 1510 8.2 28.9 6.7 91 30 3290 7.2 28.0 .2 3 40 1540 8.1 28.2 5.9 79 40 3590 7.1 27.0 .2 3 45 1740 7.6 28.1 2.6 35 so 3680 7.1 26.5 .2 3 so 1470 7.4 24.0 . 2 2 60 3680 7.1 26.0 .3 4 54 1450 7.4 22.5 .2 2 67 3680 7.1 26.0 .s 6
-40-

Table 5.--Water-quality data for Whitney Lake, June 23 and September S-6, 1978--Continued
June 23, 1978 S~ptember S-6, 1978 Elevation: 521.69 feet Elevation: 532.44 feet Contents: 406,100 acre-feet Contents: 615,000 acre-feet
Specific Tern- Dis- Per- Specific Tern- Dis- Per-Site conduct- conduct-
Depth pH per a- solved cent Depth pH per a- solved cent (feet) ance (units) ture satu- (feet) ance (units) ture ·satu-
(micro-oxygen (micro- oxygen
mhos) (oC) (mg/L) ration mhos)
(OC) (mg/L) ration
Ps 1 1450 8.3 29.6 7.2 97 1 2120 8.0 29.5 7.0 92 10 1450 8.3 29.4 7.2 97 10 2240 7.8 28.5 5.3 69 16 1450 8.1 28.8 5.7 77 20 2280 7.6 28.5 4.0 52
27 2360 7.2 28.5 .8 10
p 1 1480 8.3 30.1 7.1 96 1 2200 8.3 29.5 7.7 lOS 7 10 1480 8.3 29.4 6.9 93 10 2210 7.8 28.5 4.8 64
20 1480 8.2 29.0 6.7 91 20 2270 7.4 28.0 2.9 39 30 1480 7.9 28.9 4.2 57 30 3260 7.2 28.0 .2 3 36 1480 7.5 28.5 1.3 17 40 .3480 7.1 27.0 .3 4
49 3620 7.1 27.0 .4 5
Fe 1 1510- 8.2 29.5 6.9 93 1 2220 8.2 29.5 6. 7· 91 10 1510 8.2 29.4 6.9 93 10 2240 7.9 29.0 5.5 72 20 1510 8.2 29.2 6.8 92 20 2360 7.3 28.5 2.5 34 30 1510 8.2 28.8 6.7 91 30 2640 7.1 28.0 .2 3 40 1510 8.2 28.6 6.7 89 40 3540 7.1 27.0 .2 3 46 1510 8.2 28.4 6.4 85 55 3650 7.0 26.5 .3 4
Gc 1 1580 8.2 29.2 6.6 89 1 2290 7.8 29.0 6.0 79 10 1610 8.0. 29.0 5.4 73 10 2320 7.7 29.0 5.6 74 20 1640 8.0 28.7 5.3 71 20 2480 7.2 28.5 1.7 22 30 1730 7.8 28.7 4.2 56 30 2870 7.1 28.5 .2 3 41 2000 7.4 28.5 1.6 21 40 3490 7.1 27.5 .2 3
50 3660 7.0 27.5 .4 5
p8 1 1510 8.2 29.1 6.9 93 1 2200 8.2 29.0 7.2 95 10 1510 8.3 28.9 6.9 93 10 2200 8.1 28.5 6.8 87 20 1510 8.2 28.8 6.8 92 20 2210 7.4 28.0 2.8 37 30 1510 8.2 28.7 6.4 85 30 3050 7.1 28.0 .4 5
42 3470 7.0 27.0 .5 6
pl2 1 2490 8.4 30.8 8.4 115 1 2740 7.8 30.0 6.1 82 10 2480 8.1 29.7 5.6 76 10 2740 7.6 29.5 4.5 61 16 2430 7.7 29.5 3.7 so 20 2980 7.1 29.0 .2 3
27 3050 7.0 29.0 .3 4
pl4 1 2650 8.3 30.3 7.4 100 1 3030 7.9 29.5 6.6 89 10 2720 8.1 29.8 6.3 85., 10 3030 7.6 ·29.0 4.8 63 20 2770 8.0 29.6 5.5 74 20 3040 7.1 28.5 .2 3 27 2770 7.9 29.6 5.0 68 27 3050 7.1 28.5 .2 3
-41-

Table 6.--Station descriptions and discharge data
-42-

BRAZOS RIVER BASIN
(1) 08082500 BRAZOS RIVER AT SEYMOUR, TX (National stream-quality accounting network)
LOCATION.--Lat 33°34'51", long 99°16'02", Baylor County, Hydrologic Unit 12060101, on left bank at upstream side of bridge on U.S. Highways 277 and 283, 0.8 mi (1.3 km) upstream from Wichita Valley Railway bridge, 1.0 mi (1.6 km) southwest of courthouse in Seymour, and at mile 847.4 (1 ,363.5 km). \ ·
DRAINAGE AREA.--15,538 mil (40,243 km2 ), approximately, of which 9,566 mil (24,776 km2 ) probably is noncontributing.
PERIOD OF RECORD.--November 1923 to August 1978.
GAGE.--Water-stage recorder. Datum of gage is 1,238.97 ft (377.638 m) National Geodetic Vertical Datum of 1929. Prior to Apr. 6, 1972, at datum 2.00 ft {0.610 m) higher.
REMAR.KS.--Small diversions above station for irrigation and oilfield operation. National Weather Service gage-height telemeter at station.
MAXIMA: FOR AUGUST 1978.--Discharge, 28,200 ft 3 /s (799 m3 /s) Aug. 5, 1978, gage height, 14.20 ft (4.328 m). FOR PERIOD 1923 to July 1978.--Maximum discharge, 95,400 ft 3 /s (2,700 m3 /s) Oct. 16, 1926, gage height, 17.16 ft (5.230 m),
from fl oodmark s, present datum, from rating curve extended above 48,000 ft 3 /s ( 1 ,360 m3 /s) on basis of slope-area measurement of 95,400 ft 3 /s (2,700 m3 /s); maximum gage height, 23.00 ft (7.010 m), present datum, Sept. 28, 1955, discharge 71,200 ft 3 /s (2,020 m3 /s).
HISTORIC.--Maximum stage since 1906 was that of Sept. 28, 1955, and the maximum discharge was that of Oct. 16, 1926. A flood in 1906 reached about the same stage as flood in 1955.
MEAN DISCHARGE, IN CUBIC FEET PER SECOND, AUGUST 1978
DAY DISCHARGE !JAY DISCHARGE DAY DISCHARGE DAY
1 •••• .oo 8 •••• 923 16 ... 94 24 ••• 2 .... .00 9 .... 575 17 ... 85 25 ... 3 •••• .42 10 ••• 412 18 ... 72 26 ••• 4 .... 3, 590 11 ... 500 19 ... 58 27 ... 5 •••• 19,200 12 ••• 543 20 ••• 47 28 ••• 6 .... 4, 380 13 ... 286 21 ••• 50 29 ••• 7 •••• 1,940 14 ••• 19 3 22 .•• 62 30 •••
15 ... 139 23 ••• 83 31 •••
MONTHLY MEAN DISCHARGE, IN CUBIC FEET PER SECOND •••••••••••••••••••••••••••••••• MONTHLY TOTAL ACRE-FEET •••••••••••.••••••••••••••••••••••••••••••••••••••••••••• RUNOFF, IN INCHES.~ •••••••••••••••••••••••••••••••••••••••••••••••••••••••••••••
Gage height, in feet, and disaharge, in aubia feet per seaond, at indiaated time, 1978
DISCHARGE
73 58 51 47 42 38 37 36
1,080 66,700
.08
Date Hour Gage Discharge Date Hour Gage Discharge Date Hour Gage Discharge height height height
Aug. 3 - ·o6oo 1.80 22 1200 2.31 110 2400 2.23 92
Aug. 4 - 0200 2.17 79 0400 2.32 113 0600 2.62 200 0800 3.24 437 1200 4.00 792 1400 5.75 2,280 1600 7.15 4,270
Period
August 1978--------------------
1925 to July 1978--------------
Aug. 4 - 2000 9.00 9,000 Aug. 6 - 0600 7.85 2400 10.75 14,700 1200 7.16
1800 6.69 Aug. 5 - 0200 12.10 19,800 2400 6.31
0400 13.50 25,400 0600 14.20 28,200 Aug. 7 - 1200 5.56 0800 14.00 27,400 2400 4.93 1200 12.50 21,400 1800 10.60 14,200 Aug. 8 - 1200 4.47 2400 8.92 8,750 2400 4.14
Highest mean disaharge, in aubia feet per seaond for the indiaated nwnber of aonseautive days
19,200
62,600
-43-
3 7
9,060
35,200
4,430
17,800
5,810 4,250 3,450 2,860
1,900 1,260
907 711

BRAZOS RIVER BASIN
{2} 08082700 MILLERS CREEK NEAR MUNDAY, TX
LOCATION.--Lat 33°19'45", long 99°27'53", Throckmorton County, Hydrologic Unit 12060101, near right bank on downstream side of bridge on Farm Road 1720, 12.7 mi {20.4 km} southeast of Munday, and 24.6 mi {39.6 km} upstream from Brazos River.
DRAINAGE AREA.--104 mP (269 km2 }.
PERIOD OF RECORD.--July 1963 to August 1978.
GAGE.--Water-stage recorder. Altitude of gage is 1,350 ft {411 m}, from topographic map.
REMARKS.--No diversion above station.
MAXIMA: FOR AUGUST 1978.--Discharge, 34,600 ft 3 /s {980 m3 /s} Aug. 4, 1978, gage height, 17.53 ft (5.343 m}. FOR PERIOD 1963 to July 1978.--Maximum discharge, 1,040 ft 3 /s (29.5 m3 /s} Aug. 26, 1971, gage height, 14.75 ft (4.496 m}. HISTORIC.--Maximum stage since at least 1883 occurred June 13, 1930, and exceeded 18.0 ft (5.49 m}; maximum stage since
1930, 18.0 ft (5.49 m} in October 1962, fran information by local resident.
MEAN DISCHARGE, IN CUBIC FE~T PER SECOND, AUGUST 1978
DAY DISCHARGE DAY DISCHARGE DAY DISCHARGE DAY DISCHARGE
-------------------------------------------------------------------·---------------------------1 •••• .oo 8 •••• 6.5 16 ••• • 01 24 ••• 2 •••• .00 9 •••• 4.0 17 ••• • 01 25 ••• 3 •••• • 00 10 ••• 2.3 18 ••• • 00 26 ••• 4 •••• 8,730 11 ••• 4.5 19 ••• • 00 27 •• 5 •••• 3,370 12 ••• 1.4 20 ••• • 00 28 ••• 6 •••• 369 13 ••• • 22 21 ••• • 00 29 ••• 7 •••• 20 14 ••• • 09 22 ••• • 00 30 •••
15 ••• • 03 23 ••• • oo 31 •••
MONTHLY MEAN DISCHARGE, IN CUBIC FEET PER SECOND •••••••••••••••••••••••••••••••• MONTHLY TOTAL ACRE-FEET ••••••••••••••••••••••••••••••••••••••••••••••••••••••••• RUNOFF, IN INCHES ••••••••••••••••••• ; ••••••••.•••••••••••••••••••••••••••••••••••
Gage height, in feet, and discharge, in cubic feet per second, at indicated time, 19?8
Date Hour Gage Discharge height
Aug. 4 - 0300 0.52 0 0400 .52 1.0 0500 1.01 2.0 0600 2. 76. 32 0800 3.96 82 0900 5.84 216 1000 8.45 372 1100 10.94 555 1200 13.86 2,080 1300 17.07 25.700
Period
August 1978--------------------
1964 to July 1978--------------
Date Hour Gage Discharge Date Hour Gage height height
Aug. 4 - 1400 17.53 34,600 Aug. 5 - 2400 12.63 1500 17.34 30,600 1600 17.05 25,400 Aug. 6 - 0600 11.27 1800 16.32 15,600 1200 8.35 2200 15.58 8,910 1800 4.49 2400 15,.40 7,690 2400 3.08
Aug. 5 - 0600 14.95 5,280 Aug. 7 - 0600 2.53 1200 14.18 2,750 1800 1.99 1800 13.52 1,530 2400 1.78
Highest mean discharge, in cubic feet per second for the indicated number of consecutive days
8,730
973
-44-
3 7
4,1!50
802
1,790
376
.00
.00
.00 .00
.00
.00
.00
.00
403 24,800
4.47
Discharge
790
589 366 114
42
25 13 9.9

BRAZOS RIVER BASIN
( 3) 08082800 MILLERS CREEK RESERVOIR NEAR BflMARTON, TX
LOCATION.--Lat 33°24'32", long 99°23'19'· Baylor County, Hydrologic Unit 12060101, at intake tower on left bank of Millers Creek, 1.1 mi (1.8 km) upstream from dam, 7.1 mi (11.4 km) southeast of Bomarton, and 13.2 mi (21.2 km) upstream from mouth.
ORAl NAGE AREA. --240 mil ( 622 km1 ).
PERIOD OF RECORD.--August 1974 to August 1978.
GAGE.--Water-stage recorder. Datum of gage is National Geodetic Vertical Datum of 1929 (Freese, Nichols, & Endress Consulting Engineers bench mark).
REMARKS.--The reservoir is formed by an earthfill dam 9,250 ft (2,820 m) long. The dam was completed in 1974 and storage began in July 1974. The reservoir is used for municipal, mining, and industrial water supply. The uncontrolled emergency spillway is an open cut 3,000 ft (910 m) wide located on left bank about 800 ft (240 m) upstream from leveel. The service spillway is an uncontrolled morning-glory-type drop inlet 16.5 ft (5.0 m) square that discharges through a 5.0-foot-square (1.5 m) concrete conduit. Low-flow releases are made by valves in the outlet vault of the drop inlet. Figures given herein represent total contents ~_r~_a_r:9_i_n.9.. J;_h~ _c!a_fl! _a_n_d _ _r:,e,s_e_r_v_o_i_r __ a_!:,e, __ gi _v_e,n __ i_~ the fo !_1 owi f!g_J:ab 1 e: -------.";-::"::::-:;::-::.::::-----"";<"';:=::-n:::-:--
Elevatlon Capac1ty (feet) (acre-feet)
Top of dam.-.--:.-:.-.-:-:.-:-:::~-.--.-~-.-.-:.-.-::::::::::.-::::.-:.-::·:.--:-:.-:-:-:::.-:-:.-........ 1, 355 .n o Crest of spillway.......................................................... 1,340.1 49,080 Crest of spillway.......................................................... 1,331.2 25,180 Lowest gated outlet (invert)............................................... 1,305.0 1,660 Dead stor'!.\l_e...!..!...!...~·~-·-•_!.!,__._._._._·_~-=-·-·-·-·-·-·-·-· .. ·.·-·.·-· .. ·~-·--·-·-·-·-·-~-·-·-~-~!..~-!.!.L'c..:.'..:...'::..:''~''-'-'-=-·:....:··:.... _____ --=1c.o.:::.:30~3:...:: • ..:..4 _____ -=.1.z.:2=--4:.::0_
COOPERATION.--The area-capacity tables, prepared from data of Sept. 17, 1965, were furnished by Freese, Nichols, and Endress, Consulting Engineers. Record of diversions furnished by North Central Texas Municipal Water Authority.
MAXIMA: FOR AUGUST 1978.--Contents, 34,480 acre..:ft (42.5 hm 3 ) Aug. 6, 1978, elevation, 1,335.30 ft (406.99 m). FOR PERIOD 1974 to July 1978.--Maximum contents, 3,440 acre-ft (4.24 hm") June 3, 1977, elevation, 1,309.89 ft (399.254 m).
CONTENTS, IN ACRE-FEET, AUGUST 1978 INSTANTANEOUS OBSERVATIONS AT 2400
-----------------------------------------------------------------------------------------------DAY CONTENTS DAY CONTENTS DAY CONTENTS DAY CONTENTS -----------------------------------------------------------------------------------------------1 •••• 1 '100 8 •••• 30,480 16 ... 26,060 24 ••• 24,950 2 •••• 1,100 9 •••• 29,180 17 ••• 25,900 25 ••• 24,80() 3 •••• 1,160 10 ••• 28,210 18 ... 25,760 26 ••• 24,690 4 •••• 27,250 11 ••• 27,590 19 ••• 25,560 27 .. 24,57() 5 •••• 27,340 12 ••• '27, 130 20 ••• 25,460 28 ... 24,420 6 •••• '33, 760 13 ••• 26,710 21.. •• 25,300 29 ••• 24,310 7 •••• 31,760 14 ... 26,480 22 ••• 25,260 30 ••• 24,190
15 ••• 26,240 23 ••• 25,180 31 ••• 24,060 -----------------------------------------------------------------------------------------------CHANGE IN CONTENTS, IN ACRE-FEET ••••••••••••••••••••••••••••• ,.................. 22,960
-----------------------------------------------------------------------------------------------
-45-

BRAZOS RIVER BAS IN
(5) 08083240 CLEAR FORK BRAZOS RIVER AT HAWLEY, TX
LOCATION.--Lat 32"35'53", long 99°48'53", Jones County Hydrologic Unit 12060102, on right bank 90ft (27m) upstream from upstream bridge on u.s. Highways 83 and 277, 0.8 mi (1.3 km) south of Hawley, 7.4 mi (11.9 km) upstream from Mulberry Creek, and 188.6 mi (303.5 km) upstream from mouth.
DRAINAGE AREA.--1 ,416 mP (3 ,667 km 2 ).
PERIOD OF RECORD .--October 1967 to August 1978.
GAGE.--Water-stage recorder. Datum of gage is 1,612.45 ft (491.475 m) National Geodetic Vertical Datum of 1929. Prior to Dec. 21, 1973, at datum 0.80 ft (0.244 m) higher.
REMARKS.--Lake Sweetwater, capacity 11,900 acre-ft (14.7 hm 3 ) is located on a tributary upstream from gage.
MAXIMA: FOR AUGUST 1978.--Discharge 2,540 ft 3 /s (71.9 m3 /s) Aug. 4, 1978, gage height, 14.64 ft (4.462 m). FOR PERIOD 1967 to July 1978.--Maximum discharge, 6,170 ft;,/s (175 m3 /s) Sept. 11, 1969, gage height, 19.31 ft (5.886 m),
present datum. HISTORIC.--Maximum stage since at least 1915 occurred in 1932; second highest stage in 1957, 25.0 ft (7.62 m), present
datum, fr001 information by local residents.
MEAN DISCHARGE, IN CUBIC FEET PER SECOND, AUGUST 1978
DAY DISCHARGE DAY DISCHARGE DAY ,DISCHARGE DAY DISCHARGE
1 •••• • 03 8 •••• 12 16 ••• 3.3 24 ••• 2.2 2 •••• .02 9 •••• 9.2 17 ••• 3.0 25 ••• 2.2 3 •••• 428 10 ••• 7.6 18 ••• 2.8 26 ••• 2.4 4 •••• 2,010 11 ••• 6.3 19 ••• 2.6 27 ••• 3.0 5 •••• 350 12 ••• 5.3 20 ••• 2.5 28 ••• 2.3 6 •••• 49 13 ••• 4.7 21 ••• 2.4 29 ••• 2.3 7 •••• 19 .14 ••• 4.1 22 ••• 2.3 30 ••• 2.2
15 ••• 3.7 23 ••• 2.2 31. •• 2.2 -----------------------------------------------------------------------------------------------MONTHLY MEAN DISCHARGE, IN CUBIC FEET PER SECOND •••••••••••••••••••••••••••••••• MONTHLY TOTAL ACRE-FEET ••••••••••••••••••••••••••••••••••••••••••••••••••••••••• RUNOFF, IN INCHES •••••••••••••••••••••••••••••••••••••••••••••••••••••••••••••••
Period
August 1978-------------,-------
1968 to July 1978--------------
2,010
4,860
Highest mean discharge, in cubic feet per second for the indicated nwnber of consecutive days
-46-
3
929
3,530
411
1,690
95.1 5,850
.08

BRAZOS RIVER BASIN
( 6) 08083245 MULBERRY CREEK NEAR HAWLEY, TX
LOCATION.--Lat 32°34'04", long 99°47'32", Jones County, Hydrologic Unit 12060102, on right bank at downstream side of downstream bridge on U.S. Highways 83 and 277, 3.3 mi (5.3 km) south of Hawley, and 5.8 mi (9.3 km) upstream from Clear Fork Brazos River.
DRAINAGE AREA.--205 mil (531 km2 ).
PERIOD OF RECORD.--December 1967 to August 1978.
GAGE.--Water-stage recorder. Datum of gage is 1,615.98 ft (492.551 m) National Geodetic Vertical Datum of 1929.
REMARKS.--No known diversion above station.
MAXIMA: FOR AUGUST 1978.--Dischar:-ge, 1,770 ft 3 /s (50.1 m3 /s) Aug. 4, 1978, gage height, 13.98 ft (4.261 m). FOR PERIOD 1967 to July 1978.--Maximurh discharge, 2,500 ftl/s (70.8 m3 /s) July 21, 1975, gage height, 15.53 ft (4.734 m). HISTORlC.--Maximum stage since at least 1932,. about 16.0 ft (4.88 m) in 1957, from floodmarks.
MEAN DISCHARGE, IN CUBIC FEET PER SECOND, AUGUST 1978
DAY DISCHARGE DAY DISCHARGE DAY DISCHARGE DAY DISCHARGE
-----------------------------------------------------------------------------------------------1 •••• • 00 8 •••• 9 .1 16 ••• 2.0 24 ••• .00 2 •••• • 00 9 •••• 7.5 17 ••• 1.2 25 ••• .00 3 •••• 513 1 0 ••• 6.8 18 ••• • 71 26 ••• .00 4 •••• 1,330 11. •• 6.2 19 ••• • 37 27 ••• .00 5 •••• 76 12 ••• 5.4 20 ••• .19 28 ••• .00 6 •••• 23. 13 ••• 4.4 21 ••• • 09 29 ••• .oo 7 •••• . 12 14 ••• 3.6 22 ••• • 04 30 ••• .·00
15 ••• 2.7 23 ••• • 01 31 ••• .00
~oNrHLv-~EAN-oiscHARGE:-rN-cusic-FEEr-PER-sEcoNo~~~~~~~~~~~~~~~~~~~~~~~~~~~~~~~~----------64~7-MoNTHLY TOTAL ACRE-FEET ••••••••••••••••••••••••••••••••••••••• ; ••••••••• ."....... 3,980 RUNOFF, IN INCHES............................................................... .36
-----------------------------------------------------------------------------~-----------------
Period
August 1978--------------------
1969 to July 1978--------------
1,330
Highest mean discharge, in aubic feet per second for the indicated nwnber of consecutive days
3
1,630
640
922
-4 7-
282
537

BRAZOS RIVER .BAS IN
(7) 08083300 ELM CREEK NEAR ABILENE, TX
LOCATION.--Lat 32°21'08", long 99°48'27", Taylor County, Hydrologic Unit 12060102·, on right bank at upstream side of bridge on Farm Road 707, 2.8 mi (4.5 km) southeast of Caps, 7.5 mi (12.1 km) southwest of Abilene, and 35.1 mi (56.5 km) upstream from mouth.
DRAINAGE AREA.--133 mil (344 km2 ).
PERIOD OF RECORD.--September 1963 to August 1978.
GAGE.--Water-stage recorder. Datum of gage is 1,804.15 ft (549.90 m) National Geodetic Vertical Datum of 1929 (Texas Department of Highways and Public Transportation bridge plans).
REMARKS.--Since 1921, flow largely regulated by Lake Abilene, capacity 7,900 acre-ft (9.74 hm 3 ), 12 mi (19 km) upstream. Rain gage located at station.
MAXIMA: FOR AUGUST 1978.--Discharge, 1,830 fV/s (51.8 m3 /s) Aug. 3, 1978, gage height, 13.26 ft (4.042 m). FOR PERIOD 1963 to July 1978.--Maximum discharge, 4,570 ft 3 /s (129 m3 /s) Sept. 18, 1974, gage height, 18.68 ft (5.694 m).
MEAN DISCHARGE, IN CUBIC FEET PER SECOND, AUGUST 1978
DAY DISCHARGE DAY DISCHARGE DAY DISCHARGE DAY DISCHARGE
-----------------------------------------------------------------------------------------------1 •••• • 00 8 •••• .00 16 ••• .00 24 ••• 2 •••• • 00 9 •••• • 00 17 ••• • 00 25 ••• 3 •••• 1,050 10 ••• • 00 18 ••• • 00 26 ••• 4 •••• 177 11 ••• .oo 19 ••• • 00 27· ••• 5 •••• 1.9 12 ••• .00 ·20 ••• • 00 28 ••• 6 •••• • 10 13 ••• • 00 21. •• .00 29 ••• 7 •••• • 00 14 ••• • 00 22 ••• 4.6 30 •••
15 ••• • 00 23 ••• • 35 31 •••
MONTHLY MEAN DISCHARGE, IN CUBIC FEET PER SECOND •••••••••••••••••••••••••••••••• MONTHLY TOTAL ACRE-FEET ••••• ~ •••••••••••••••••••••••••••••••••••••••••••• ; •••••• RUNOFF, IN INCHES •••••••••••••••••••••••••••••••••••••••••••••••••••••••••••••••
Period Highest mean discharge, in cubic feet per second
for the indicated number of consecutive days 3 7
August 1978--------------------
1965 to July 1978--------------
1,050
1,630
-48-
410
1,030
176
566
.oo
.00
.00
.00
.00
.00
.00
.00
39.8 2,450
.35

BRAZOS RIVER BASIN
(8) 08083400 LITTLE ELM CREEK NEAR ABILENE, TX
LOCATION.--Lat 32°23'29", long 99°51'08", Taylor County, Hydrologic Unit 12060102, on right bank at downstream side of bridge on Farm Road 707, 1.2 mi (1.9 km) north of Caps, 4.6 mi (7 .4 km) southwest of intersection of U.S. Highways 277 and 83 in Abilene, and 10.3 mi (16.6 km) upstream from mouth.
DRAINAGE AREA.--39.1 mil (101.3 km2 ).
PERIOD OF RECORD .--September 1963 to August 1978.
GAGE.--Water-stage recorder. Datum of gage is 1,786.12 ft (544.409 m) National Geodetic Vertical Datum of 1929.
REMARKS.--No known diversion above station. Rain gage located at station.
MAXIMA: FOR AUGUST 1978.--Discharge, 1,340 ft 3 /s (37.9 m3 /s) Aug. 3 1978, gage height, 9.50. ft (2.896 m). FOR PERIOD 1963 to July 1978.--Maximum discharge, 2,180 ft 3 /s (61.7 m3 /s) Sept. 18, 1974, gage height, 11.52 ft
(3.511 m). . HISTORIC.--Maximum stage since at least 1903, about 15 ft (4.6 m) in 1913, from information by local resid~nts.
MEAN DISCHARGE, IN CUBIC FEET PER SECOND, AUGUST 1978
DAY DISCHARGE DAY DISCHARGE DAY DISCHARGE DAY
1 •••• .00 8 •••• • 00 16 ••• • 00 24 ••• 2 •••• .00 9 •••• • 00 17 ••• • 00 25 ••• 3 •••• 698 10 ••• • 00 18 ••• • 00 26 ••• 4 •••• 96 11. •• • 00 19 ••• • 00 27 ••• 5 •••• 1.4 12 ••• . oo 20 ••• • 00 28 ••• 6 •••• .05 13 ••• • 00 21. •• • 00 29 ••• 7 •••• .oo 14 ••• • 00 22 ••• • 00 30 •••
15 ••• • 00 23 ••• • 00 31 •••
MONTHLY MEAN DISCHARGE, IN CUBIC FEET PER SECOND •••••• ~ ••••••••••••••••••••••••• MONTHLY TOTAL ACRE-FEET ••••••••••••••••••••••••••••••••••••••••••••••••••••••••• RUNOFF, IN INCHES •••••••••••••••••••••••••••••••••••••••••••••••••••••••••••••••
Period Highest mean discharge, in cubic feet per second
for the indicated number of consecutive days 3 7
August 1978--------------------
1965 to July 1978--------------
698
948
-49-
265
421
114
189
DISCHARGE
.00
.oo
.00
.00
.00
.00
.00
.00
25.7 1,580
.76

BRAZOS RIVER BASIN
(9) 08083420 CAT CLAW CREEK AT ABI~ENE, TX
LOCATION.--Lat 32°28'31", long 99°44'56", Taylor County, Hydrologic Unit 12060102, in Sears Park 320ft (98 m) downstream from bridge on Ambler Street in Abilene and 1.8 mi ·(2.9 km) upstream ·from mouth.
DRAINAGE AREA.--13.0 mil (33.7 km2 ).
PERIOD OF RECORD.--October 1970 to August 1978.
GAGE.--Water-stage recorder. Datum of gage is 1,682.32 ft (512.77 m), Corps of Engineers bench mark.
MAXIMA: FOR AUGUST 1978.--Discharge, 1,310 ft3/s (37.1 m3 /s) Aug. 3, 1978, gage height, 6.60 ft (2.012 ril). FOR PERIOD 1970 to July 1978.--Maximum discharge, 1,200 ft3/s (34.0 m3 /s) Sept. 18, 1974, gage height, 6.41 ft (1.954 m).
MEAN DISCHARGE, IN CUBIC FEET PER SECOND, AUGUST 1978 -----------------------------------------------------------------------------------------------
DAY DISCHARGE DAY DISCHARGE DAY DISCHARGE DAY DISCHARGE
-----------------------------------------------------------------------------------------------1.... .00 8.... .00 16... .oo 24... .oo 2.... .00 9.... .74 17... .oo 25... .oo 3.... 431 10... .06 18... .00 26... .oo 4.... 115 11... .00 19... .00 27... .00 5.... 5.9 12... .00 20... .00 28... 1.9 6.·... .43 13... .00 21... .73 29... .06 7. ••• .00 14... .oo 22... .13 30... .00
15... .00 23... .00 31... .00
-----------------------------------------------------------------------------------------------MONTHLY MEAN DISCHARGE, IN CUBIC FEET ~ER SECOND •••••••••••••••••••••••••••••••• MONTHLY TOTAL ACRE-FEET ••••••••••••••.••••••••••••••••••••••••••••••••••••••••••• RUNOFF, IN INCHES •••••••••••••••••••••••••••••••••••••••••••••••••••• •• •• •••••••
17.9 1,100
1. 59
---------------·-------------------------------------------------------------------------------. .
Period
August 1978--------------------
1971 to July 1978--------------
431
480
Highest mean discharge, in aubia feet per second for the indicated number of aonseautive days
-50-
3
184
221
79
11.7

BRAZOS RIVER BASIN
(10) 08083470 CEDAR CREEK AT ABILENE, TX
LOCATION.--Lat 32°26'56", long 99°43'13", Taylor County, Hydrologic Unit 12060102, on right bank at upstream side of North Second Street Bridge and State Highway 355 at Abilene, 0.2 mi (0.3) downstream from Lytle Creek, 4.1 mi (6.6 km) downstream from Buttonwillow Creek, 5.9 mi (9.5 km) upstream from Rainy Creek, 7.2 mi (11.6 km) downstream from Kirby Lake, and 9.8 mi (15.8 km), upstream from mouth.
DRAINAGE AREA.--119 mP (308 km2 ).
PERIOD OF RECORD.--October 1970 to August 1978.
GAGE.--Water-stage recorder. Datum of gage is 1,677.67 ft (511.354 m) National Geodetic Vertical Datum of 1929.
REMARKS.--Flow is partly regulated by Ltyle Lake, capacity of 1,200 acre-ft (1.48 hm 3 ), and Lake Kirby, capacity 7,620 acre-ft (9.40 hm 3 ).
MAXIMA: FOR AUGUST 1978.--Discharge, 3,830 ft 3 /s (108 m3 /s) Aug. 3, 1978, gage height, 11.93 ft (3.636 m). FOR PERIOD 1970 to July 1978.--Maximum discha.rge, 4,670 ft 3 /s (132 m3 /s) Sept. 18, 1974, gage height, 12.54 ft (3.822 m).
MEAN DISCHARGE, IN CUBIC FEET PER SECOND, AUGUST 1978
DAY
1 •••• 2 •••• 3 •••• 4 •••• 5 •••• 6 •••• 7 ••••
DISCHARGE
• 76 • 94
931 882
55 9.6 4.7
DAY
8 •••• 9 •••• 10 ••• 11 ••• 12 ••• 13 ••• 14 ••• 15 •••
DISCHARGE
2.3 5.6 1.3 1.1 1.7 1.2 2.0 1.9
DAY
16 ••• 17 ••• 18 ••• 19 ••• 20 ••• 21. •• 22 ••• 23 •••
DISCHARGE
• 62 • 53 • 85 • 54 • 32
2.2 1.1
• 22
DAY
24 ••• 25 ••• 26 ••• 27 ••• 28 ••• 29 ••• 30 ••• 31 •••
MONTHLY MEAN DISCHARGE, IN CUBIC FEET PER SECOND •••••••••••••••••••••••••••••••• MONTHLY TOTAL ACRE-FEET ••••••••••••••••••••••••••••••••••••••••••••••••••••••••• RUNOFF, IN INCHES •••••••••••••••••••••••••••••••••••••••••••••••••••••••••••••••
Period
August 1978--------------------
1971 to July 1978--------------
931
1,710
Highest mean discharge, in cubic feet per second for the indicated number of consecutive days
-51-
3
623
937
270
531
DISCHARGE
.21
.20
.28
.30 1.5
.32
.66
.64
61.7 3,790
.60

BRAZOS RIVER BASIN
(11) 08083500 FORT PHANTOM HILL RESERVOIR NEAR NUGENT, TX
LOCATION.--Lat 32°36'58", long 99°40'05", Jones County, Hydrologic Unit 12060102, at outlet gate tower near right bank, 120 ft (37 m) upstream from dam on Elm Creek, 4.3 mi (6.9 km) upstream from mouth, and 5.4 mi (8.7 km) south of Nugent.
DRAINAGE AREA.--470 mP (1,217 km2 ).
PERIOD OF RECORD.--July 1940 to August 1978. Prior to October 1965, monthend contents only.
GAGE.--Nonrecording gage. Datum of gage is 1,580.78 ft (481.822 m) National Geodetic Vertical Datum of 1929.
REMARKS.--The reservoir is formed by a rock-faced earthfill dam 3,740 ft (1,140 m) long. The dam was completed and storage began in October 1938. The uncontrolled service spillwi\}' is a cut channel through natural ground with a concrete ogee weir located 0.7 mi (1.1 km) from right end of dam. The service outlet works consist of a concrete tower with a 4.0- by 7.0-foot (1.2 by 2.1 m) conduit. The service tower contains five gated openings at various e 1 evat ions. The dam and 1 ake are owned by the city of Abilene and were built to impound water for municipal use. Since July 1974, the West Texas Utility Co. has operated a steam generating powerplant on the reservoir. During the year, the city of Abilene diverted 4,400 acre-ft (5.43 hm 3 ) from Clear Fork Brazos River into Fort Phantom Hill Reservoir and an undetermined amount of fl oodfl ow was diverted by gravity ditch from Deadman Creek into the reservoir. The capacity table was based on a survey of Oct. 2, 1953. Figures given herein represent total contents. Data regarding the dam and reservoir are given in the following table:
Top of dam ••••••••••••••••••••••••••••••••••••••••••••••••••••••••••••••••• Crest of spill way ••••••••••••••••••••••••••••••••••••••••••••••• , •••••••••• Highest gated out 1 et (invert) •••••••••••••••••••••••••••••••••••••••••••••• Lowest gated outlet (invert) •••••••••••••••••••••••••••••••••••••••••••••••
Gage height (feet) 69.2 55.1 28.0 1.6
Capac1ty (acre-feet)
74,310 10,330
COOPERATION. --Records of gage heights and diversions furnished by the city of Abilene. Capacity tab 1 e furnished by Soi 1 Conservation Service.
MAXIMA (at 0800): FOR AUGUST 1978.--Contents, 50,370 acre-ft (62.1 hm 3 ) Aug. 6-10, 1978, gage height, 48.4 ft (14.75 m). FOR PERIOD 1940 to July 1978.--Maximum contents observed, 89,910 acre-ft (111 tim 3 ) May 25, 1957, gage height,
58.7 ft (17.89m).
DAY CONTENTS DAY
CONTENTS, IN ACRE-FEET, AUGUST 1978 INSTANTANEOUS OBSERVATIONS AT 0800
CONTENTS DAY CONTENTS DAY CONTENTS
-----------------------------------------------------------------------------~-----------------1 •••• 26,780 8 •••• 50,370 16 ••• 49,750 2.4 ••• 48,530 2 •••• 26,590 9 •••• 50,370 17 ••• 49,440 25 ••• 48,530 3 •••• 26,780 10 ••• 50,370 18 ••• 49,440 26 ••• 48,530 4 •••• 38,590 11. •• 50,060 19 ••• 49,440 27 •• 48,230 5 •••• 49.130 12 ••• 50,060 20 ••• 49,130 28 ••• 48,230 6 •••• 50,370 13 ••• 50,060 21. •• 48,830 29 ••• 48,230 7 •••• 50,370 14 ••• 49,750 22 ••• 48,830 30 ••• 47,940
15 ••• 49,750 23 ••• 48,830 31 ••• 47,940
CHANGE IN CONTENTS, IN ACRE-FEET •••••••••••••••••••••••••••••••••••••••••••••••• 20,970
-52-

BRAZOS RIVER BASIN
(12) 08084000 CLEAR FORK BRAZOS RIVER AT NUGENT, TX
LOCATION.--Lat 32°41'24", long 99°40'09", Jones County, Hydrologic Unit 12060102, on right bank 33ft (10m) downstream from bridge on Farm Road 600 at Nugent, 2 mi (3 km) downstream from Elm Creek, 4 mi (6 km) upstream from Deadman Creek, and 167.8 mi (270.0 km) upstream from mouth.
DRAINAGE AREA.--2,199 mP (5,695 km 2 ).
PERIOD OF RECORD.--February 1924 to August 1978.
GAGE.--Water-stage recorder. Datum of gage is 1,531.91 ft (466.926 m) National Geodetic Vertical Datum of 1929 (levels by Brazos River Authority). Prior to Dec. 12, 1933, nonrecording gage at site 575 ft (175 m) downstream at same datum.
REMARKS.--Flow affected by four reservoirs with a capacity of 103,600 acre-ft (128 hm 3 ). Numerous diversions above station for municipal supply and oilfield operation materially affect low flow.
MAXIMA: FOR AUGUST 1978.--Discharge, 2,840 ft3/s (80.4 m3 /S) Aug. 4, 1978, gage height, 9.97 ft (3.039 m). FOR PERIOD 1924 to July 1978.--Maximum discharge observed, 47,000 ft 3 /s (1,330 (m 3 /s) Sept. 8, 1932, gage height, 27.05
ft (8.245 m), site then in use, from rating curve extended above 25,000 ft3/s (708 m3 /s). HISTORIC.--Maximum stage, 30ft (9.1 m) in 1876; floods in 1900 and May 1923 reached stages of 24 and 24.5 ft (7.3 and 7.47
m), respectively, from information by local residents.
MEAN DISCHARGE, IN CUBIC FEET PER SECOND, AUGUST 1978
DAY
1 •.•• 2 •••• 3 •••• 4 •••• 5 •••• 6 •••• 7 ••••
DISCHARGE
• 01 • 02
537 2,370 1, 010
145 42
DAY
8 •••• 9 •••• 10 ••• 11 ••• 12 ••• 13 ••• 14 ••• 15 •••
DISCHARGE
20 26 26 8.2 6.8 5.5 5.7 5.0
DAY
16 ••• 17 ••• 18 ••• 19 ••• 20 ••• 21. •• 22 ••• 23 •••
DISCHARGE
4.7 4.5 4.6 4.5 4.0 4.5
11 3.3
DAY
24 ••• 25 ••• 26 ••• 27 •••
"28 ••• 29 ••• 30 ••• 31 •••
MONTHLY MEAN DISCHARGE, IN CUBIC FEET PER SECOND •••••••••••••••••••••••••••••••• MONTHLY TOTAL ACRE-FEET •••••••••••••••••••••••••••••••••••••••••••••••••••••••••
Pe-riod
~ugust 1978--------------------
1938 to July 1978--------------
2,370
18,800
Highest mean discharge, in cubic feet per second for the indicated number of consecutive days
-53-
3
1,310
15,100
593
8,710
DISCHARGE
2.5 2.3 2.6 3.0 3.1 3.2 2.8 2.7
138 8,470

BRAZOS RIVER BASIN
(13) 08084500 LAKE STAMFORD NEAR HASKELL, TX
LOCATION.--Lat 33°04'44", long 99°34'52", Haskell County, Hydrologic Unit 12060103, on left bank at intake structure of West Texas Utilities Co. steam powerplant at Lake Stamford on Paint Creek, 1.0 mi {1.6 km) upstream fran dam, 1. 7 mi (2.7 km) upstream from California Creek, 10 mi (16 km) southeast of Haskell, and 21.8 mi {35.1 km) upstream from mouth.
DRAINAGE AREA.--368 mP {953 km 2 ).
PERIOD OF RECORD.--July 1953 to August 1978.
GAGE.--Nonrecording gage read once daily. Datum of gage is 2.77 ft {0.84 m) National Geodetic Vertical Datum of 1929 {levels by Freese, Nichols, and Endress, Consulting Engineers).
REMARKS.--The lake is formed by a rolled-fill earthen dam 3,600 ft (1,097 m) long. The dam was completed in March 1953, and deliberate impoundment began in June 1953. The emergency spill way is an uncontrolled natural channel 1 ocated near right end of dam. The service spillway is an uncontrolled channel excavated through natural ground, 169ft {52 m) wide, located 900ft (270m) to left of left end of dam. The service outlet is a controlled 24-inch-diameter {610 mm) concrete pipe that is used for low-flow releases. During the current year, the cities of Stamford and Hamlin diverted 1,840 acre-ft {2.27 hm 3 ) for municipal use. The capacity table is based on sedimentation survey of 1966. Gage-height record was furnished by West Texas Utilities Co. fran their powerplant 1.0 mi {1.6 km) upstream from dam. Figures given herein represent total contents. Data regarding the dam and lake are given in the following table:
Top of dam ••••••••••••••••••••••••••••••••••••••••••••••••••••••••••••••••• Crest of spillway •••••••••••••••••••••••••••••••••••••••••••••••••••••••••• Crest of spillway •••••••••••••••••••••••••••••••••••••••••••••••••••••••••• Lowest gated outlet (invert) •• ·.···········································;
Gage height (feet)
Capac1ty (acre-feet)
53,070 358
COOPERATION.--The capacity table furnished by the Soil Conservation Service. The diversions furnished by city of Stamford.
MAXIMA (at 0800): FOR AUGUST 1978.--Contents, 103,600 acre-ft (128 hm 3 ) Aug. 5, 1978, gage height, 1,422.18 ft {433.480 m). FOR PERIOD 1953 to July 1978.--Maximum contents, 74,100 acre-ft (91.4 hm 3 ) Sept. 9, 10, 1962, gage height,
1,416.6 ft (431.78 m).
CONTENTS, IN ACRE-FEET, AUGUST 1978 INSTANTANEOUS OBSERVATIONS AT 0800
-----------------------------------------------------------·------------------------------------DAY CONTENTS DAY CONTENTS DAY CONTE~TS DAY CONTENTS
1 •••• 16,800 8 •••• 80,640 16 ••• 62,020 24 ••• 57,920 2 •••• 16,800 9 •••• 75,610 17 ••• 61.500 25 ••• 57,420 3 •••• 16.610. 10 ••• 72,020 18 ••• 60,460 26 ••• 56,920 4 •••• 75,610 11 ••• 69,700 19 ••• 58,930 2 7 •• 56,430 5 •••• 102.100 12 ••• 66,880 20 ••• 58,930 28. ~. 56,430 6 •••• 94,460 13 ••• 64,690 21 •••. 58,420 29 ••• 56,430 7 •••• 86,620 14 ••• 64,150 22 ••• 58,420 30 ••• 55,940
15 ••• 63,080 23 ••• 57,920 31 ••• 55,940
CHANGE IN CONTENTS, IN ACRE-FEET •••••••••••••••••••••••••••••••••••••••••••••••• 39,140
-54-

BRAZOS RIVER BASIN
( 14) 08084800 CALIFORNIA CREEK NEAR STAMFORD, TX
LOCATION.--Lat 32°55'51", long 99°38'32", Jones County, Hydrologic Unit 12060103, near right bank at downstream side of bridge on Farm Road 142, 9 mi (14 km) east of Stamford, and 19.4 mi (31.2 km) upstream from Paint Creek.
DRAINAGE AREA.--478 mil (1,238 km2 ).
PERIOD OF RECORD. --October 1962 to August 1978.
GAGE.--Water-stage recorder. Altitude of gage is 1,470 ft (448 m), from topographic map.
REMARKS.--Three small diversions above station.
MAXIMA: FOR AUGUST 1978.--Discharge, 40,000 ftl/s (1,130 m3 /s) Aug. 4, 1978, gage height, 31.00 ft (9.449 m). FOR PERIOD 1962 to July 1978.--Maximum discharge, 7,420 ft 3 /s (210 m3 /s) May 6, 1969, gage height, 27.12 ft (8.266 m), from
rating curve extended above 21.0 ft (6.40 m) on basis of indirect discharge measurement of peak flow. HISTORIC.--Maxumum stage since at least 1897, 31.00 ft (9.449 m) Aug. 4, 1978. Other large floods occurred June 10, 1962,
gage height 29.6 ft (9.02 m), and July 1961 (stage unknown).
MEAN DISCHARGE, IN CUBIC FEET PER SECOND, AUGUST 1978
DAY
1 •••• 2 •••• 3 ••.. 4 •••• 5 •••• 6 •••• 7 ••••
DISCHARGE
.00
.00 895
20,400 2,280
84 28
DAY
8 •••• 9 •••• 10 ••• 11 ••• 12 ••• 13 ••• 14 ••• 15 •••
DISCHARGE
11 8.2 5.7 4.6 4.1 3.5 3.4 3.4
DAY
16 ••• 17 ••• 18 ••• 19 ••• 20 ••• 21 ••• 22 ••• 23 •••
DISCHARGE
3.7 3.5 3.3 3 .1 2.9 2.7 2.8 2.7
DAY
24 ••• 25 ••• 26 ••• 27 ••• 28 ••• 29 ••• 30 ••• 31 •••
MONTHLY MEAN DISCHARGE, IN CUBIC FEET PER SECOND •••••••••••••••••••••••••••••••• MONTHLY TOTAL ACRE-FEET ••••••••••••••••••••••••••••••••••••••••••••••••••••••••• RUNOFF, IN INCHES •••••••••••••••••••••••••••••••••••••••••••••••••••••••••••••••
Gage height, in feet, and disaharge, in aubia feet per seaond, at indiaated time, 1978
Date Hour Gage Discharg.e height
Aug. 3 - 1000 6.38 0.44 1100 6.67 6.3 1200 7.38 44 1400 8.40 107 1600 10.33 270 1800 13.14 600 2000 16.31 1 '190 2200 24.38 4,260 2400 27.90 9,670
Period
August 1978--------------------
1963 to July 1978--------------
Date Hour Gage. Discharge Date Hour Gage height height
Aug. 4 - 0200 29.25 15,700 Aug. 5 - 0600 24.82 0400 30.20 24,800 0900 21.00 0600 30.94 38,600 1200 15.20 0700 31.00 40,000 1500 12.25 0800 30.92 38,200 2000 10.13 1200 30.07 23,000 2400 9.38 1500 29.34 16,400 2000 28.14 10,500 Aug. 6 - 0400 8.37 2400 27.17 7,550 0800 7.73
1200 7.33 2400 7.30
Highest mean disaharge, in aubia feet per seaond for the indiaated number of aonseautive days
20,400
5,820
-55-
3
7,860
4,950
3,380
3,040
DISCHARGE
2.5 2.5 2.4 2.4 2.3 2.2 2.2 2 .1
767 47,200
1. 85
Discharge
4,640 2,500
941 485 251 1A5
105 64 40 38

BRAZOS RIVER BAS IN
(16) 08085500 CLEAR FORK BRAZOS RIVER AT FORT GRIFFIN, TX
LOCATION.--Lat 32°56'04", long 99°13'27", Shackelford County, Hydrologic Unit 12060104, on right bank just downstream from pier of bridge on old Fort Griffin-Throckmorton Road, 0.4 mi (0.6 km) northeast of Fort Griffin, 1.0 mi (1.6 km) upstream from bridge on U.S. Highway 283, 1.7 mi (2.7 km) upstream from Mill Creek, and 74.6 mi (120.0 km) upstream from mouth.
DRAINAGE AREA.--3,988 mP (10,329 km1 ).
PERIOD OF RECORD.--December 1923 to August 1978.
GAGE.--Water-stage recorder. Datum of gage is 1,174.09 ft (357;863 m) National Geodetic Vertical Datum of 1929. Prior to June 23, 1932, nonrecordi ng gage at same site and datum.
REMARKS.--Diversions above station for irrigation, municipal supply and oilfield operations materially affect low flow. Gage-height telemeter at station. ·
MAXIMA: FOR AUGUST 1978.--Discharge, 149,000 fto/s (4,220 m3 /s) Aug. 4, 1978, gage height, 38.88 ft (11.851 m). FOR PERIOD 1923 to July 1978.--Maximum discharge, 33,600 ft 3 /s (952 m3 /s) Sept. 10, 1932, gage height, 35.09 ft (10.695 m). HISTORIC.--Maximum stage since at least 1876,.38.88 ft (11.851 m) Aug. 4, 1978. Flood in September 1900 reached a stage
of 38.0 ft (11.58 m); flood in July 1876 was probably higher; from information by local residents.
MEAN DISCHARGE, IN CUBIC FEET PER SECOND, AUGUST 1978
DAY DISCHARGE DAY DISCHARGE DAY DISCHARGE DAY DISCHARGE
1 •••• • 00 8 •••• 4,090 16 ••• 601 24 ••• 177 2 •••• • 00 9 •••• 2,880 17 ••• 484 25 ••• 166 3 •••• 988 10 ••• 2,240 18 ••• 395 26 ••• 154 4 •••• 72,800 11 ••• 2,240 19 ••• 326 27 ••• 64 5 •••• 67,900 12 ••• 1,440 20 ••• 272 28 ••• 2.7 6 •••• 19,800 13 ••• 1,110 21 ••• 235 29 ••• 65 7 •••• 7,430 14 ••• 762 22 ••• 206 30 ••• 101
15 ••• 730 23 ••• 192 31. •• 94
~-----------------------------------------------------------~----------------------------------~ONTHLY MEAN DISCHARGE, IN CUBIC FEET PER SECOND................................ 6,060 MONTHLY TOTAL ACRE-FEET......................................................... 373,000
Gage height, in feet, and discharge, in cubic feet per second, at indicated time, 19'?8
Date Hour Gage Discharge height
Aug. 3 - 2100 1.54 0 2200 6.28 1,360 2300 19.20 13,900 2400 25.20 16,900
Aug. 4 - 0100 28.81 20,800 0500 35.66 43,200 0800 36.56 57,000 1200 35.58 39,500 1500 36.32 52,000
Period
August 1978--------------------
1925 to July 1978--------------
Date Hour Gage Discharge Date Hour Gage height height
Aug. 4 - 1700 38.10 108,000 Aug. 6 - 2400 28.05 1900 38.81 142,000 2100 38.88 149,000 Aug. 7 - 1200 21.55 2400 38.76 141,000 2400 16.15
Aug. 5 - 0400 38.18 107,000 Aug. 8 - 1200 13.17 1200 36.75 59,600 2400 11.48 2400 34.40 28,600
Aug. 9 - 1200 10.18 Aug. 6· - 1200 32.80 20,800 2400 9.19
Highest mean discharge, in eubic feet per second for the indicated number of consecutive days
72,800
30,800
-56-
3
53,500
24,000
25,400
15,300
Discharge
10,400
7,340 5,160
4,040 3,360
2,850 2,500

BRAZOS Rl VER BASIN
(18) 08086150 NORTH FORK HUBBARD CREEK NEAR ALBANY, TX
LOCATION.--Lat 32°42'27", long 99°16'29", Shackelford County, Hydrologic Unit 12060105, on downstream side of bridge on U.S. Highway 380, 1.7 mi (2.7 km) southeast of Albany, and 2.0 mi (3.2 km) upstream from Salt Prong Hubbard Creek.
DRAINAGE AREA.--39.3 mP (101.8 km2 ).
PERIOD OF RECORD.--November 1962 to August 1978.
GAGE.--Water-stage recorder. Datum of gage is 1,340.54 ft (408.597 m) National Geodetic Vertical Datum of 1929.
REMARKS.--No diversion above station. Rain gage located at station.
MAXIMA: FOR AUGUST 1978.--Discharge, 103,000 ft 3 /s (2,920 m3 /s) Aug. 4, 1978, gage height, 23.3 ft (7.10 m). FOR PERIOD 1962 to July 1978.--Maximum discharge, 9,520 ft 3 /s (270 m3 /s) May 5, 1969, gage height, 19.22 ft (5.858 m), from
rating curve extended above 1,500 ft 3 /s (42.5 m3 /s) on basis of slope-area measurement of 4,570 ft 3 /s (129 m3 /s) and contracted-opening measurement of 9,520 ft 3 /s (270 m3 /s).
HISTORIC.--Flood information begins in 1940. Maximum flood since 1940, 23.3 ft (7.10 m) Aug. 4, 1978. Floods of June 10, 1940, and July 18, 1953, reached stages of about 21 ft (6.4 m), fran information by local residents.
MEAN DISCHARGE, IN CUBIC FElT PER SECOND, AUGUST 1978
DAY DISCHARGE DAY DISCHARGE DAY DISCHARGE DAY DISCHARGE -----------------------------------------------------------------------------------------------1 •••• .00 8 •••• 7.4 16 ••• 1.9 24 ••• 2 •••• .00 9 •••• 6.6 17 ••• 2.0 25 ••• 3 •••• 6,760 10 ••• 5.6 18 ••• 1.9 26 ••• 4 •••• 13,100 11. •• 8.3 19 ••• 1.6 27 ••• 5 •••• 67 12 ••• 6.2 20 ••• 1.2 28 ••• 6 •••• 31 13 ••• 4.1 21 ••• 1.2 29 ••• 7 •••• 15 14 ••• 3.1 22 ••• 1.2 30 •••
15 ••• 2.2 23 ••• 1.2 31. ••
MONTHLY MEAN DISCHARGE, IN CUBIC FEET PER SECOND •••••••••••••••••••••••••••••••• MONTHLY TOTAL ACRE-FEET ••••••••••••••••••••••••••••••••••••••••••••••••••••••••• RUNOFF, IN INCHES ••••••••••••••••••••••••••••••••••••••••••••••••••••••••••••••
Gage height, in feet, and discharge, in cubic feet per second, at indicated time, 1978
Date Hour Gage Discharge height
Aug. 3 - 1100 1.95 0.00 1300 2.74 9.2 1400 2.93 25 1600 2.98 31 1800 3.18 58 1900 6.60 1,360 2000 12.00 4,780 2100 19.60 10,100 2200 22.70 48,600 2300 23.05 70,200
Period
August 1978--------------------
1964 to July 1978--------------
Date
Aug.
Aug.
Hour Gage Discharge Date Hour Gage height height
3 - 2400 22.80 53,600 Aug. 4 - 1000 11.00 1100 7.20
4 - 0100 22.55 42,000 1200 5.40 0200 23.30 103,000 1300 4.50 0300 22.70 48,600 1800 3.73 0400 21.20 13,000 2400 3.38 0500 21.10 12,800 0600 22.30 30,700 Aug. 5 - 0600 3.24 0700 21.50 13,600 1200 3.13 0800 16.00 7,460 2400 3.01
Highest mean discharge, in cubic feet per second for the indicated number of consecutive days
3
13,100
1,570
6,640 2,860
754 361
-57-
1.2 1.2 1.1 1.1 1.1
.97
.97 1.1
646 39,700
18.97
Discharge
4,080 1,670
816 456 207 115
82 63 42

BRAZOS RIVER BASIN
(19) 08086212 HUBBARD CREEK BELOW ALBANY, TX
LOCATION.--Lat 32°43'58", long 99°08'25", Shackelford County, Hydrologic Unit 12060105, on left bank 0.5 mi (0.8 km) downstream from Salt Prong Hubbard Creek, 2.8 mi (4.5 km) upstream from Newco~r.b Creek, 4.5 mi (7.2 km) upstream from U.S. Highway 180, 9.1 mi (14.6 km) east of Albany, and 35.2 mi (56.6 km) upstream from mouth. Water-quality sampling site on left bank 0.5 mi (0.8 km) downstream. ·
DRAINAGE AREA.--613 mP (1,588 km1 ).
PERIOD OF RECORD.--October 1966 to August 1978.
GAGE.--Water-stage recorder. Datum of gage is 1,184.99 ft (361.185 m) National Geodetic Vertical Datum of 1929. Prior to June 12, 1968, water-stage recorder at site 2.1 mi (3.4 km) downstream at datum 7.63 ft (2.326 m) lower.
MAXIMA: FOR AUGUST 1978.--Discharge, 330,000 ft 3 /s (9,350 m3 /s) Aug. 4, 1978, gage height, 41.41 ft (12.622 m). FOR PERIOD 1966 to July 1978.--Maximum discharge, 27,200 fP/s (770 m3 /s) Jan. 21, 1968, gage height, 25.10 ft (7.650 m),
at former site and datum, from rating curve extended above 150 ft 3 /s (4.25 m3 /s) on basis of slope-area measurement of peak flow.
MEAN DISCHARGE, IN CUBIC FEET PER SECOND, AUGUST 1978
DAY
1 •••• 2 •••• 3 •••• 4 .... 5 •••• 6 •••• 7 ••••
DISCHARGE
.00
.oo 2,150
94,700 6,400
333 175
DAY
8 •••• 9 •••• 10 ••• 11 ••• 12 ••• 13 ••• 14 ••• 15 •••
DISCHARGE
98 64 91 64 52 36 27 20
DAY
16 ••• 17 ••• 18 ••• 19 ••• 20 ••• 21 ••• 22 ••• 23 •••
DISCHARGE
17 14 12 10 8.5 7.2 6.6 6 .1
DAY
24 ••• 25 ••• 26 ••• 27 ••• 28 ••• 29 ••• 30 ••• 31. .•
MONTHLY MEAN DISCHARGE, IN CUBIC FEET PER SECOND •••••••••••••••••••••••••••••••• MONTHLY TOTAL ACRE-FEET ••••••••••••••••••••••••••••••••••••••••••••••••••••••••• RUNOFF, IN INCHES •••••••••••••••••••••••••••••••••••••••••••••••••••••••••••••••
Gage height, in feet, and dischaPge, in cubic feet per second, at indicated time, 1978
Date Hour Gage Discharge height
Aug. 3 - 0400 3.31 0.00 0600 3.81 3.8 1200 4.04 6.g 1300 7.37 681 1500 8.13 1,020 1800 g.74 l,g8o 2100 12.72 3,760 2200 18.01 7 ,8go 2300 23.88 15,300 2400 30.17 26,300
Aug. 4 - 0100 35. 7g 56,700 0200 38.2g 118,000
Period
August lg78-------------------
lg67 to July lg78--------------
Date Hour Gage Discharge Date Hour Gage height height
Aug. 4 - 0300 39.89 189,000 Aug. 5 - 0600 23.30
g4,700
20,100
0400 41.41 330,000 0800 i8.oo 0430 41.15 300,000 1000 11.40 0500 40.2g 218,000 1200 g.40 0600 40.33 221,000 1800 7.80 0700 40.lg 210,000 2400 7 .lg 0730 40.3g 226,000 0800 40.01 196,000 Aug. 6 - 1200 6.52 1000 38.11 112,000 2400 6.04 1200 35.72 56,000 1500 32.44 33,700 Aug. 7 - 1200 5.65 1800 2g_g4 25 ,goo 2400 5.40 2400 27.67 21 ,600
Highest mean discharge, in cubic feet per second for the indicated nwnber of consecutive days
-58-
3
34,400
14,600
14;800
6,670
DISCHARGE
5.7 5.3 5.0 4.8 4.6 4.4 4.2 4.0
3,370 207,000
6.33
Discharge
14,400 7,920 2,g7o 1,840
g42 657
3gl 250
164 122

BRAZOS RIVER BAS IN
{20} 08086290 BIG SANDY CREEK ABOVE BRECKENRIDGE, TX
LOCATION.--Lat 32°38'54", long 99°00'15", Stephens County, Hydrologic Unit 12060105, on left bank 600 ft {180 m) downstream from Battle Creek, 1.6 mi {2.6 km) upstream fran bridge on Farm Road 576, 9.8 mi (15.8 km) southwest of Breckenridge, and about 14.6 mi {23.5 km) upstream from Hubbard Creek Dam.
DRAINAGE AREA.--280 mP {725 km 2 ).
PERIOD OF RECORD.--February 1962 to August 1978. Prior to October 1975, published as "near Breckenridge."
GAGE.--Water-stage recorder. Datum of gage is 1,185.83 ft {361.441 m) National Geodetic Vertical Datum of 1929. Prior to Oct. 1, 1975, at site 1.6 mi (2.6 km) downstream at datum 7.41 ft (2.259 m) lower.
REMARKS.--Flow is affected by Lake Cisco, capacity, 25,600 acre-ft {31.6 hm 3 ).
MAXIMA: FOR AUGUST 1978.--Discharge, 5,140 ft 3 /s {146 m3 /s) Aug. 4, 1978, gage height, 21.86 ft {6.663 m). FOR PERIOD 1962 to July 1978.--Maximum discharge, 8,170 ft 3 /s {231 m3 /s) May 13, 1965, gage height, 23.30 ft (7.102 m). HISTORIC.--According to information from State Highway Department, the floods of May 16, 1949, July 20, 1953, and Apr. 29,
1957, each reached a stage of 24.6 ft (7.50 m).
DAY
1 •••• 2 •••• 3 •••• 4 •••• 5 •••• 6 •••• 7 ••••
DISCHARGE
• 00 • 55
2. 710 3,290
334 128
40
MEAN DISCHARGE, IN CUBIC FEET PER SECOND, AUGUST 1978
DAY
8 •••• 9 •••• 10 ••• 11. .. 12 ••• 13 ••• 14 ••• 15 •••
DISCHARGE
18 9.5 4.2 1.6
.52 • 21 .13 .09
DAY
16 ••• 17 ••• 18 ••• 19 ••• 20 ••• 21 ••• 22 ••• 23 •••
DISCHARGE
.07 • 06 .06 • 04 .04 .04 .04 • 03
DAY
24 ••• 25 ••• 26 •••. 27 ••• 28 ••• 29 ••• 30 ••• 31. ..
MONTHLY MEAN DISCHARGE, IN CUBIC FEET PER SECOND •••••••••••••••••••••••••••••••• MONTHLY TOTAL ACRE-FEET ••••••••••••••••••••••••••••••••••••••••••••••••••••••••• RUNOFF, IN INCHES •••••••••••••••••••••••••••••••••••••••••••••••••••••••••••••••
Gage height, in feet, and disaharge, in aubia feet per seaond, at indiaated time, 1978
Date Hour Gage Discharge height
Aug. 3 - 0100 1.60 41 0200 2.35 124 0300 3.35 253 0500 5.15 550 0700 8. 75 1,260 1000 13.70 2,430 1600 18.90 3,940
Period
August 1978--------------------
1963 to July 1978--------------
Date
Aug.
Aug.
Hour Gage Discharge Date Hour Gage height height
3 - 2400 20.95 4,760 Aug. 4 - 2400 6.40
4 - 0500 21.60 5,030 Aug. 5 - 0600 5.10 0700 21.86 5,140 1200 4.25 0900 21.55 5,010 2400 3.09 1400 15.90 3,010 1800 10.10 1,560 Aug. 6 - 1200 2.35
2400 1.82
Highest mean disaharge, in aubia feet per seaond for the indiaated number of aonseautive days
3
2,110 933 3,290
5,610 4,720 2,380
-59-
DISCHARGE
211 13,000
Discharge
788
541 394 217
124 63
.03
.03
.03
.02
.01
.01
.00
.00
.87

BRAZOS RIVER BASIN
( 21) 08086400 HUBBARD CREEK RESERVOIR NEAR BRECKENRIDGE, TX
LOCATION.--Lat 32n49'53", long 98°58'03", Stephens County. Hydrologi:: Unit 12060105, on left bank just upstream from dam on Hubbard Creek, 1.4 mi (2.3 km) upstream fran U.S. Highway 183, 6.5 mi (10.5 km) norti!West of Breckenridge, and 12.6 mi (20.3 km) upstream from mouth.
DRAINAGE AREA. --1 ,085 mP (2 ,810 km2 ).
PERIOD OF RECORD.--October 1962 to August 1978.
GAGE.--Water-stage recorder. Datum of gage is National Geodetic Vertical Datum of 1929.
REMARKS.--The reservoir is formed by a rolled earthfill dam 5,630 ft (1,720 m) long. There are two additional levees, the north and south, making an overall length of 3.5 mi (5.6 km). Storage began September 1962 and the dam was completed in necember 1962. The emergency spillway is a 2,000-foot-wide (610 m) cut through natural ground near the left end of dam. The service spillway is a partially controlled morning-glory type with 12 lift gates designed to discharge 30,000 ft"/s (850 m3 /s) with a 17.5-foot (5.3 m) head through a 22.0-foot-diameter (6.7 m) concrete conduit. The dam is the property of the West Central Texas Municipal Water District. The District has a permit to divert 56,000 acre-ft (69.0 hm 3 ) annually for municipal, mining, and industrial uses. Diversions during the current year are as foilows: 842 acre-ft (1.04 hon 3 ) for municipal use, 3,870 acre-ft (4.77 hm 3 ) for oilfield operation, and 1.250 acre-ft (1.54 hm 3 ) for irrigation and domestic uses. Figures given herein represent total contents. Data regarding the dam and reservoir are given in the following table:
Top uf dam ••••••••••••••••••••••••••••••••••••••••••••••••••••••••••••••••• Crest of spill way •••••••••••••.•••.••.•.••••••••••••••••••••••••••••••••••• Top of gates ••••••••••••••••••••••••••••••••••••••••••••••••••••••••••••••• Top of conservation pool ......................................... ~ ••••••••• Crest of spillway •••••••••••••••••••••••••••••••••••••••••••••••••••••••••• Sill of gate ••••••••••••••..••••••••••••••••••••••••••••••••••••••••••••••• Lo~1est gated outlet (invert) ............................................... .
Elevat1on (feet)
1,208.0 1,194.0 1,185.1 1,183.0 1,176.6 1,138.0 1 '136 .0
MAXIMA: FOR AUGUST 1978.--Contents, 401,500 acre-ft (495 hm 3 ) Aug. 5, 1978, elevation, 1,188.06 ft (362.121 m).
Capac1ty (acre-feet)
515,800 350,900 317 ,800 230,100
5,580 3,470
FOR PERIOD 1962 to July 1978.--Maximum contents, 327,200 acre-ft (403 hm 3 ) Feb. 3, 1975, elevation, 1,183.61 ft (360.764 m).
DAY CONTENTS DAY
CONTENTS, IN ACRE-FEET, AUGUST 1978 INSTANTANEOUS OBSERVATIONS AT 2400
CONTENTS DAY CONTENTS DAY CONTENTS
-----------------------------------------------------------------------------------------------1 •••• 186 'l 00 8 •••• 339,300 16 ••• 303,800 24 ••• 301 ,300 2 •••• 185,900 9 •••• 323,500 17 ••• 303,100 25 ••• 301 ,000 3 •••• 196,800 10 ••• 311 ,000 18 ••• 302,600 26 ••• 300,700 4 •••• 399,000 11. •• 305,600 19 ••• 301,700 27 .. 300,300 5 •••• 389,300 12 ••• 305,300 20 ••• 302,200 28 ••• 299,700 6 •••• 371,000 13 ••• 304,600 21 ••• 301 '700 29 ••• 299,100 7 •••• 355,400 14 ... 304,100 22 ... 301 '900 30 ... 298,800
15 ••• 304,000 2 3 ••• 301 ,600 31 ••• 298,700
CHANGE IN CONTENTS, IN ACRE-FEET. .............................................. . 112 '500
E7,evation, in feet, and contents, in acre-feet, at indicated time • 19'18
Date Hour Eleva- Contents Date Hour Eleva- Contents Date Hour Eleva- Contents tion tion tion
Aug. 3 - 0400 1172.72 185,800 Aug. 4 - 1800 1187.53 392,100 Aug. 6 - 1200 1186.84 380,100 1200 1172.89 187,600 2400 1187.92 399,000 2400 1186.31 371,000 2400 1173.74 196,800
Aug. 5 - 0400 1188.02 400,800 Aug. 7 - 1200 1185.84 363~100
Aug. 4 - 0300 1174.47 205,000 0800 1188.06 401 ,500 2400 1185.37 355,400 0600 1178.40 252,800 1200 1187.94 399,400 0900 1182.96 317,200 2400 1187.37 389,300 Aug. 8 - 1200 1184.98 348,900 1200 1185.60 359,200 2400 1184.38 339,300
-60-

BRAZOS RIVER BASIN
(22) 08086500 HUBBARD CREEK NEAR BRECKENRIDGE, TX
LOCATION.--Lat 32°50'13", long 98°56'52", Stephens County, Hydrologic Unit 12060105, on downstream side of pier of bridge on u.s. Highway 183, 1.4 mi (2.3 km) downstream from Hubbard Creek Reservoir, 6.8 mi (10.9 km) northwest of Breckenridge, 8.2 mi (13.2 km) upstream from Gonzales Creek, and 11.2 mi (18.0 km) upstream from Clear Fork Brazos River.
DRAINAGE AREA.--1,089 mP (2,821 km 3 ), of which 1,085 mil (2,810 km 2 ) is above Hubbard Creek Dam.
PERIOD OF RECORD.--April 1955 to August 1978.
GAGE.--Water-stage recorder. Datum of gage is 1,092.10 ft (332.872 m) National Geodetic Vertical Datum of 1929. Prior to July 16, 1959, at site 300 ft ( 91 m) upstream at same datum.
REMARKS.--Flow is regulated by Hubbard Creek Reservoir (station 08086400).
MAXIMA: FOR AUGUST 1978.--Discharge, 14,600 ft 3 /s (413 m3 /s) Aug. 5, 1978, gage height, 30.66 ft (9.345 m). FOR PERIOD 1955 to July 1978.--Maximum discharge, 34,500 ftl/s (977 m3 /s) May 26, 1957, gage height, 34.00 ft (10.363 m). HISTORIC.--Maximum stage since at least 1925, 34.2 ft (10.42 m) July 20, 1953, from information by local resident and
Texas Department of Highways and Pub 1 i c Transportation.
MEAN D.ISCHARGE, IN CUBIC FEET PER SECOND, AUGUST 1978
-----------------------------------------------------------------------------------------------DAY DISCHARGE DAY DISCHARGE DAY DISCHARGE DAY DISCHARGE -----------------------------------------------------------------------------------------------1 •••• . oo 8 •••• 9,250 16 ••• 2.3 24 ••• .89 2 •••• • 00 9 •••• 8,760 17 ••• 1.5 25 ••• 1.3 3 •••• • 40 10 ••• 7,260 18 ••• 1.6 26 ••• .83 4 •••• 5,740 11. •• 3,690 19 ••• • 77 27 ••• .64 5 •••• 13,800 12 ••• 121 20 ••• .91 28 ••• .92 6 •••• 12,000 13 ••• 206 21. •• 1.3 29 ••• .52 7 •••• 9,950 14 ••• 89 22 ••• 1.3 30 ••• .35
15 ••• 3.3 23 ••• • 98 31 ••• .32 -----------------------------------------------------------------------------------------------MONTHLY MEAN DISCHARGE, IN CUBIC FEET PER SECOND •••••••••••••••••••••••••••••••• MONTHLY TOTAL ACRE-FEET •••••••••••••••••••••••••••••••••••••••••••••••••••••••••
Gage height, in feet. and discharge, in cubic feet per second, at indicated time, 1978
2,290 140,600
Date Hour Gage Discharge Date Hour Gage Discharge Date Hour Gage Discharge height height height
Aug. 4 - 0100 4.63 11 0400 4.73 14 0700 5.03 27 0900 5.02 26 1000 12.74 1,240 1100 19.01 3,180 1200 22.50 4,760
. 1400 25.99 7,580 1800 29.07 11 ,700 2400 30.41 14,000
Aug. 5 - 0400 30.59 14,400 0800 30.66 14,600
Period
August 1978--------------------
1963 to July 1978--------------
Aug. 5 - 1200 30.62 14,500 Aug. 9 - 2400 28.12 1800 30.40 14,000 2400 30.21 13,000 Aug. 10- 1200 27.39
2400 26.46· Aug. 6 - 1200 29.73 12,000
2400 29.25 10,800 Aug." 11- 1200 25.10 1400 19.77
Aug. 7 - 1200 28.75 9,990 1600 14.92 2400 28.21 8,910 1800 10.06
1900 7.88 Aug. 8 - 1200 27.67 8,250 2000 6.42
2400 29.48 9,850 2100 5. 70 2200 5.33
Aug. 9 - 1200 28.79 8,680 2400 4.92
Highest mean discharge. in cubic feet per second for the indicated number of consecutive days
13,800
4,910
-61-
3
11,900
4,270
9,540
3,330
7,990
7,280 6,470
5,400 3,070 1 ,630
655 315 122
60 37 18

BRAZOS RIVER BASIN
( 23) 08087300 . CLEAR FORK BRAZOS RIVER AT ELIASV ILLE, TX
LOCATION.--Lat 32°57'36", long 98°45'59", Young County, Hydrologic Unit 12060104, on right bank 5 ft (2m) upstream from old mill dam 180ft (55 m) upstream fran bridge on Farm Road 1974, 400ft (122m) northwest of U.S •. Post Office at Eliasville, and 13.2 mi (21.2 km) upstream from mouth.
DRAINAGE AREA.--5,697 mP (14,755 krn 2 ).
PERIOD OF RECORD.--November 1915 to April 1920, December 1923 to August 1925, July 1928 to September 1951, October 1961 to August 1978. Monthly discharge only for some periods published in WSP 1312 as "near Crystal Falls".
GAGE.--Water-stage recorder and concrete control. Datum of gage is 1,027.77 ft (313.264 m) National Geodetic Vertical Datum of. 1929. See WSP 1922 for history of changes prior to Dec. 18, 1961.
REMARKS.--Many small diversions above station for municipal supply and oilfield operations.
MAXIMA: FOR AUGUST 1978.--Discharge, 68,000 ft3 /s (1,930 m3 /s) Aug. 6, 1978, gage height, 37.04 ft (11.290 m). FOR PERIOD 1915 to July 1978.--Maximum discharge, 35,800 ·ft 3 /s (1,010 m3 /s) June 11, 1941, gage height, 33.45 ft (10.196
m), site and datum then in use, fran rating curve extended above 23,000 ft 3 /s (651 m3 /s). HISTORIC.-Maximum stage since 1877, 37.04 ft (11.290 m) Aug. 5, 1978. Flood in May 1, 1957 reached a stage of 35ft (11
m), present site and datum; flood in September 1900 reached the same stage, fran information by Texas Department of Highways and Public Transportation and local residents. Other floods are reported to have occurred in 1876, Apr. 27, 1890, 1932, 1941, and 1955.
MEAN DISCHARGE, IN CUBIC FEET PER SECOND, AUGUST 1978
DAY DISCHARGE DAY DISCHARGE DAY DISCHARGE DAY DISCHARGE -----------------------------------------------------------------------------------------------1 •••• .08 8 •••• 31,300 16 ••• 707 24 ••• 2 •••• .08 9 •••• 21,900 17 ••• 590 25 ••• 3 •••• .06 10 ••• 13,000 18 ••• 505 26 ••• 4 •••• 4,180 11 ••• 9,670 19 ••• 441 27 ••• 5 •••• 46,000 12 ••• 3,220 20 ••• 387 28 ••• 6 •••• 55,200 13 ... 1,780 21 ••• 327 29 ••• 7 •••• 38,100 14 ••• 1,310 22 ••• 296 30 •••
15 ••• 885 23 ••• 270 31 •••
MONTHLY MEAN DISCHARGE, IN CUBIC FEET PER SECOND •••••••••••••••••••••••••••••••• MONTHLY TOTAL ACRE-FEET •••••••••••••••••••••••••••••••••••••••••••••••••••••••••
Gage height, in feet, and discharge, in cubic feet per second, at indicated time, 1978
Date Hour Gage Discharge Date Hour Gage Discharge Date Hour "Gage height height height
Aug. 4 - 0030 7.56 0.04 Aug. 5 - 1800 36.63 61,900 Aug. 8 - 2400 30.51 0500 7.84 .93 2400 36.98 67,100
254 227 217 194 166 152 145 129
7,470 459,000
Discharge
27,500
0600 7.98 4.3 Aug. 9 - 1200 27.83 21,900 0700 8.25 29 0900 8. 72 132 1000 9.10 289 1100 10.25 1,160 1200 11.29 2,920 1400 12.40 4,570 1900 16.90 8,650 2400 24.19 15,600
Aug. 5 - 0600 31.70 30,200 1200 35.44 47,100
Period
August 1978--------------------
1917 to July 1978--------------
Aug. 6 - 0100 37.04 68,000 2400 24.53 0200 36.93 66,300 0600 36.71 63,100 Aug. 10- 1200 22.01 1200 36.08 54,500 2400 20.37 1800 35.48 47,400 2400 34.92 43,300 Aug. 11- 1200 18.22
2400 15.20 Aug. 7 - 1200 34.05 37,600
2400 33.24 34,800 Aug. 12- 0400 12.28 1200 11.23
Aug. 8 - 1200 32.10 31,300 2400 10.83
Highest mean discharge, in cubic feet per second for the indicated number of consecutive days
55,200
32,400
-62-
3
46,400
23,200
30,700
16,600
16,100
12,700 11,300
9,630 7,310
4,420 2,820 2,040

BRAZOS RIVER BASIN
( 24) 08088000 ARAZOS RIVER NEAR SOUTH BEND, TX
LOCATION.--Lat 33°01'27", long 98°38'37", Young County, Hydrologic Unit 12060201, on left bank 225ft (69 m) downstream from bridge on State Highway 67, 1.8 mi (2.9 km) downstream from Clear Fork Brazos River, 2.0 mi (3.2 km) northeast of South Bend, and at mile 758.2 (1,219.9 km).
DRAINAGE AREA.--22,673 mil (58,723 km1 ), of which 9,566 mil (24,776 km1 ) probably is noncontributing.
PERIOD OF RECORD.--September 1938 to August 1978.
GAGE.--Water-stage recorder. Datum of gage is 1,002.98 ft (305.708 m) National Geodetic Vertical Datum of 1929. Prior to Feb. 23, 1939, nonrecording gage at site 225ft (69 m) upstream. Feb. 23, 1939, to Mar. 9, 1969, water-stage recorder at site 225ft {69 m) upstream.
REMARKS.--National Weather Service gage-height telemeter at station.
MAXIMA: FOR AUGUST 1978.--Discharge, 78,100 ft 3 /s (2,210 m3 /s) at 1200 hours Aug. 6, 1978; maximum gage height, 41.50 ft (12.649 m) at 1800 hours Aug. 6, 1978.
FOR PERIOD 1938 to July 1978.--Maximum discharge, 87,400 ft 3 /s (2,480 m3 /s) May 4, 1941, gage height, 27.35 ft (8.336 m); maximum gage height, 32.70 ft (9.967 m) Aug. 29, 1957.
HISTORIC.--Maximum stage since at least 1876, 41.50 ft (12.649 m) Aug. 6, 1978.
MEAN DISCHARGE, IN CUBIC FEET PER SECOND, AUGUST 1978
DAY DISCHARGE DAY DISCHARGE DAY DISCHARGE DAY
1 •••• 1.2 8 •••• 43,000 16 ••• 1 '490 24 ••• 2 •••• 1.2 9 •••• 29,700 17 ... 1 '290 25 ••• 3 •••• 3.2 10 ••• 18,200 18 ••• 1 '120 26 ••• 4 .... 1 '460 11 ••• 11 '2 00 19 ... 996 27 ... 5 •••• 29,500 12 ••• 4,210 20 ••• 886 28 ••• 6 •••• 74,700 13 ••• 2,600 21 ... 768 29 ••• 7 •••• 61,000 14 ••• 2,260 22 ••• 676 30 •••
15 ••• 1,780 23 ... 5"82 31 ...
MONTHLY MEAN DISCHARGE, IN CUBIC FEET PER SECOND •••••••••••••••••••••••••••••••• MONTHLY TOTAL ACRE-FEET ••••••••••••••••••••••••••••••••••••••••••••••••••••••••• RUNOFF, IN INCHES •••••••••••••••••••••••••••••••••••••••••••••••••••••••••••••••
Gage height, in feet, and dischaPge, in cubic fee~ peP second, at indicated time, 1978
DISCHARGE
524 4 72 450 379 295 259 235 223
9,360 576,000
.48
Date Hour Gage Discharge Date Hour Gage Discharge Date Hour Gage Discharge height height height
Aug. 4 - 0200 5.28 9.5 1200 5.47 16 1400 5.45 16 1600 8.76 1,450 1800 10.88 3,160 2000 12.20 4,440 2400 14.10 6,440
Aug. 5 - 0600 18.19 12,600 1200 23.76 22,600 1800 31.06 48,000 2400 36.91 63,800
PePiod.
August 1978--------------------
1940 to July 1978--------------
Aug. 6 - 0800 40.50 76,300 Aug. 9 - 1200 28.92 1200 41.20 78,100 2400 26.14 1800 41.50 77,000 2400 41.12 72,700 Aug. 10- 1200 23.17
2400 20.67 Aug. 7 - 1200 39.05 61,700
2400 36.40 50,100 Aug. 11- 1200 18.83 2400 17.19
Aug. 8 - 1200 33.90 42,900 2400 31.46 35,700 Aug. 12- 1200 12.40
2400 10.73
Highest mean dischaPge, in cubic feet peP second for the indicated numbeP of consecutive days
74,700
84,300
-63-
3 7
59,600
64,800
38,200
46,000
29,500 23,300
18,000 14,100
11,300 8,300
3,380 2,610

BRAZOS RIVER BASIN
(25) 08088300 BRIAR CREEK NEAR GRAHAM, TX
LOCATION.--Lat 33°12'43", long 98°37'06", Young County, Hydrologic Unit 12060201, near right bank on downstream side of bridge on Farm Road 1769, 3.7 mi (6.0 km) upstream from mouth, and 7.0 mi (11.3 km) northwest of Graham.
DRAINAGE AREA.--24.2 mil (62.7 km1 ).
PERIOD OF RE~RD.--April 1958 to August 1978. Prior to October 1965, published as Oak Creek near Graham.
GAGE.--Water-stagE! recorder. Altitude of gage is 1,090 ft (332 m), from topographic map.
REMARKS.--No diversion above station.
MAXIMA: FOR AUGUST 1978.--Discharge, 1.6 ft 3 /s (0.045 m3 /s) Aug. 5, 1978, gage height, 0.78 ft (0.238 m). FOR PERIOD 1958 to July 1978.--Maximum discharge, 2,730 ft 3 /s (77.3 m3 /s) Sept. 19, 1976, gage height, 12.31 ft (3.752 m). HISTORIC.--Maximum stage since at least 1900, 15.2 ft (4.63 m) in September 1955. Flood in May 1957 reached a stage of
15.0 ft (4.57 m), from infonnation by local resident.
MEAN DISCHARGE, IN CUBIC FEET PER SECOND, AUGUST 1978
DAY DISCHARGE DAY DISCHARGE DAY DISCHARGE DAY DISCHARGE
-----------------------------------------------------------------------------------------------1 •••• • oo 8 •••• .00 16 ••• .oo 24 ••• 2 •••• . oo 9 •••• .00 17 ••• • 00 25 ••• 3 •••• .00 10 ••• 1.4 18 ••• .00 26 ••• 4 ••• ; • 00 11 ••• 1.1 19 ••• 24 27 ... 5 •••• 1.6 12 ••• .02 20 ••• 2.3 28 ••• 6 •••• • 61 13 ... .00 21 ••• .46 29 ••• 7 •••• • 04 14 ••• .00 22 ••• .04 30 •••
15 ... .00 23 ••• • 00 31 •••
MONTHLY MEAN DISCHARGE, IN CUBIC'FEET PER SECOND •••••••••••••••••••••••••••••••• MONTHLY TOTAL ACRE-FEET ••••••••••••••••••••••••••••••••••••••••••••••••••••••••• RUNOFF, IN INCHES ••••••••••••••••••••••••••••••••••••••••••••••••••••••••••.•••••
Period
August 1978--------------------
1959 to July 1978--------------
24
1,190
Highest mean discharge, in cubic feet per second for the indicated number of consecutive days
-64-
3
8.9
877
6.6
38()
.oo
.00
.00
.00
.00
.00
.00
.00
1. 02 62.6
.05

BRAZOS RIVER BASIN
( 26) 08088400 LAKE GRAHAM NEAR GRAHAM, TX
LOCATION.··Lat 33°08'04", long 98°36'48", Young County, Hydrologic Unit 12060201, near left end of earthen dam on Salt Creek, 2.2 mi (3.5 km) northwest of Graham, 5 mi (8 km) downstream from Briar Creek, and 9.5 mi (15.3 km) upstream from mouth.
DRAINAGE AREA.-·221 mil (572 km2 ).
PERIOD OF RECORD.··March 1958 to September 1963 (unpublished record), October 1963 to August 1978. Prior to October 1965, monthend contents only.
GAGE.·-Water-stage recorder. Datum of gage (Salt Creek datum) is 1.30 ft (0.396 m) National Geodetic Vertical Datum of 1929. Prior to October 1963, nonrecording gage at same site and datum.
REMARKS.-·The lake is formed by a rolled earthfill dam 5,000 ft (1,500 m) long. Lake Graham was connected with Lake Eddleman in 1959 by a cut channel at a gage height of 1,050.0 ft (320.04 m). Deliberate impoundment began Apr. 28, 1958, and the dam was completed in July 1958. The uncontrolled emergency spillway is a 1,050-foot-wide (320 m) cut at the right end of dam. The spillway is designed to discharge 136,500 ft 3 /s (3,870 m3 /s) at a gage height of 1,087.5 ft (331.47 m). The dam is the property of the city of Graham and was built to impound water for municipal and industrial uses. In addition, water is used by Texas Electric Service Co. for operation of their steam generating powerplant. The capacity table is based on an original survey of Lake Eddleman in 1928 and a Salt Creek survey of 1953. Figures given herein represent tot a 1 contents. Data regarding the dam a~ lake are ~venin the follo~~ ta~~l~e~=~~~~~~~~~~~~~~~~~~~~~~~~~~~~~~-
Gage height Capacity
Top of dam ••••••••••••••••••••••••••••••••••••••••••••••••••••••••••••••••• Crest of spillway •••••••••••••••••••••••••••••••••••••••••••••••••••••••••• Bottom of interconnecting channe 1 •••••••••••••••••••••••••••••••••••••••••• Lowest gated outlet (invert) ............................................. ..
(feet) (acre-feet) 1 ,092 .0 1,075.0 1,050.0 1,050.0
53,680 8,670 8,670
COOPERATION.-·Capacity table was furnished by Freese, Nichols, and Endress, Consulting Engineers. Record of diversions furnished by the city of Graham and Texas Electric Service Co.
MAXIMA: FOR AUGUST 1978.--Contents, 36,090 acre-ft (44.5 hm 3 ) Aug. 5, 1978, gage height, 1,067.61 ft (325.408 m). FOR PERIOD 1958 to July 1978.--Maximum contents, 61,120 acre-ft (75.4 hm 3 ) Apr. 30, 1970, gage height, 1,077.77 ft (328.504
m).
CONTENTS, IN ACRE·FEET, AUGUST 1978 INSTANTANEOUS OBSERVATIONS AT 2400
···------·~·---··------·-··----···-----·-·---------·--·---------·----·-·-----··----··---------· DAY CONTENTS DAY CONTENTS DAY CONTENTS DAY CONTENTS
1 •••• 2 •••• 3 •••• 4 •••• 5 •••• 6 •••• 7 ••••
35,200 35 '11 0 35,440 35,540 36,090 36,090 36,070
8 •••• 9 •••• 10 ••• 11. •• 12 ••• 13 ••• 14 ••• 15 •••
36,000 35,960 35,940 35,890 35,830 35,740 35,700 35,610
16 ••• 17 ••• 18 ••• 19 ••• 20 ••• 21 ••• 22 ••• 23 •••
35,500 35,370 35,300 35,300 35,280 35,260 35,200 35,130
24 ••• 25 ••• 26 ... 27 .. 28 ••• 29 ••• 30 ••• 31 •••
CHANGE IN CONTENTS, IN ACRE-FEET ••••••••••••••••••••••••••••••••••••••••••••••••
-65-
35,090 35,070 35,020 34,glo 34,800 34,760 34,720 34,590
-690

BRAZOS RIVER BASIN
(27} 08088450 BIG CEDAR CREEK NEAR IVAN, TX
LOCATION.--Lat 32°49'39", long 98°43'25", Stephens County, Hydrologic Unit 12060201, on left bank at downstream side of bridge on Farm Road 717, 3.2 mi (5.1 km) south of Ivan, 8.2 mi (13.2 km) northwest of Caddo, and 11.6 mi (18.7 km) northeast of Breckenridge.
DRAINAGE AREA.--97.0 mil (251.2 km2).
PERIOD OF RECORD .--December 1964 to August 1978.
GAGE.--Water-stage recorder. Altitude of gage is 1,090 ft (332m), from topographic map.
REMARKS.--No regulation or diversion above station.
MAXIf~A: FOR AUGUST 1978.--Discharge, 3.0 ft 3 /s (0.085 m3 /s) Aug. 5, 1978, gage height, 4.11 ft (1.253). FOR PERIOD 1964 to July 1978.--Maximum discharge, 9,590 ft 3 /s (272 m3 /s) July 8, 1968, gage height, 22.39 ft (6.824 m),
from rating curve extended above 1,000 ft 3 /s (28.3 m3 /s) on basis of slope-area measurement of 7,980 ft 3 /s (226 m3 /s).
MEAN DISCHARGE, IN CUBIC FEET PER SECOND, AUGUST 1978
DAY DISCHARGE DAY DISCHARGE DAY DISCHARGE DAY
1 •••• .00 8 •••• • 10 16 ••• • 01 24 ••• 2 •••• .00 9 •••• • 02 17 ••• • 01 25 ••• 3 •••• .00 10 ••• .02 18 ••• • 01 26 ••• 4 •••• .00 11. •• .02 19 ••• • 01 27 ••• 5 •••• .88 12 ••• • 02 20 ••• • 01 28 ••• 6 •••• .81 13 ••• • 02 21 ••• • 04 29 ••• 7 •••• .25 14 ••• .03 22 ••• • 02 30 •••
15 ••• • 02 23 ••• • 01 31. ••
MONTHLY MEAN DISCHARGE, IN CUBIC FEET PER SECOND •••••••••••••••••••••••••••••••• MONTHLY TOTAL ACRE-FEET ••••••••••••••••••••••••••••••••••••••••••••••••••••••••• RUNOFF, IN INCHES •••••••••••••••••••••••••••••••••••••••••••••••••••••••••••••••
Period Highest mean discharge, in cubic feet per second
for the indicated number of consecutive days
DISCHARGE.
•
.01
.01
.02
.02
.02
.03
.04
.04
.08 4.95
.00
3 7
August 1978--------------------
1966 to July 1978--------------
0.9
3,160
-66-
0.6
1 '120
0.3
571

BRAZOS RIVER BASIN
( 28) 08088500 POSSUM KINGDOM RESERVOIR NEAR GRAFORD, TX
lOCATION.--lat 32°52'20", long 98°25'32", Palo Pinto County, Hydrologic Unit 12060201, at dam on Brazos River, 2.6 mi (4.2 km) upstream frcxn loving Creek, 11.3 mi {18.2 km) southwest of Graford, and at mile 687.5 (1,106.2 km).
DRAINAGE AREA.--23,596 mil {61,114 km 2 ), approximately, of which 9,566 mil {24,776 km 2 ) probably is noncontributing.
PERIOD OF RECO.RD.--March 1941 to August 1978.
GAGE.--Water-stage recorder. Datum of gage is 0.10 ft (0.030 m) National Geodetic Vertical Datum of 1929 {levels by Brazos River Authority). Prior to Mar. 19, 1968, mercury U-tube in powerhouse at present site and datum.
REMARKS.--The reservoir is formed by reinforced concrete dam, Ambursen-type, massive buttress with flat-slab deck, a controlled spillway, two bulkhead sections, and an earthen-dike section. Total length of dam is 2,740 ft (835 m) long. The dam was completed and storage began Mar. 21, 1941. The spillway has nine roof-weir gates (modified bear-trap type) that are 73.66- by 13-foot (22.45 by 4 m) each and are designed to discharge about 100,000 ft 3 /s {2,830 m3 /s) at a gage height of 1,000.0 ft {304.80 m). The outlet works consist of one controlled 54-inch-diameter {1,372 mm) conduit. Water is used for power development, municipal, industrial, irrigation, and recreational purpo'ses. Two generators located in the powerhouse at dam can produce 22,500 kilowatts at a 1,000 ft {305m) gage height. Eleven major reservoirs, with a combined capacity of 607,800 acre-ft (749 hm 3 ),
largely regulate the inflow. The capacity curve is based on recomputation of survey made in 1974. Figures given herein represent total contents. Data r~a rdi ng the dam and reservoir are given in the following table:
Top of dam •••••••••••••••••••••••• -.-•••••••••••••••••••••••••••••••••••••••• Design flood (top of gates) •••••••••••••••••••••••••••••••••••••••••••••••• Crest of spi 11 way •••••••••••••••••••••••••••••••••••••••••••••••••••••••••• Invert of penstock ••••••••••••••••••••••••••••••••••••••••••••••••••••••••• lowest gated outlet (invert) •••••••••••••••••••••••••••••••••••••••••••••••
COOPERATION.--Capacity table 3-C furnished by Brazos River Authority.
Gage height (feet)
1,024.0 1,000.0
987.0 911.5 874.8
Capacity (acre-feet)
570,200 383,300
4,560 0
MAXIMA: FOR AUGUST 1978.--Contents, 564,800 acre-ft {696 hm 3 ) Aug. 12, 1978, gage height, 999.69 ft {304.706 m). FOR PERIOD 1941 to July 1978.--Maximum contents observed, 743,700 acre-ft {917 hm 3 ) Oct. 5, 1941, gage height, 1,001.0 ft
{305.10m).
DAY CONTENTS DAY
1 •••• 465,900 8 •••• 2 •••• 465,800 9 •••• 3 •••• 468,600 10 ••• 4 •••• 466,200 11. •• 5 •••• 464,900 12 ••• 6 •••• 493,800 13 ••• 7 •••• 534,700 14 •••
15 •••
CONTENTS, IN ACRE-FEET, AUGUST 1978 INSTANTANEOUS OBSERVATIONS AT 2400
CONTENTS DAY CONTENTS
541 '400 16 ••• 552,800 547,600 1 7 ••• 550,300 549,600 18 ••• 548,300 560,400 19 ••• 549,300 554,700 20 ••• 550,500 556,100 21 ••• 551 ,000 557,200 22 ••• 552,500 555,400 23 ••• 553,400
DAY CONTENTS
24 ••• 553,900 2 5 ••• 554,600 26 ••• 554,700 27 •• 555,400 28 ••• 555,300 29 ••• 555,600 30 ••• 555,600 31 ••• 555,300
-----------------------------------------------------------------------------------------------CHANGE IN CONTENTS, IN ACRE-FEET •••••••••••••••••••••••••••••••••••••••••••••••• 88,800
-67-

BRAZOS RIVER BASIN
(29) 08089000 BRAZOS RIVER NEAR PALO PINTO, TX
LOCATION.--Lat 32°51'45", long 98°18'08", Palo Pinto County, Hydrologic Unit 12060201, on right bank 100ft (30m) upstream from bridge on Farm Road 4, 300 ft (91 m) downstream from Dark Valley Creek, 6.5 mi (10.5 km) north of Palo Pinto, and at mile 667.3 (1,073.7 km).
DRAINAGE AREA.--23,811 mil (61,670 km 2 ), of which 9,566 mil (24,776 km 2 ) probably is noncontributing.
PERIOD OF RECORD.--January 1924 to August 1978. Monthly discharge only for some periods, published in WSP 1312. Published as "near Mineral Wells" 1924-33.
GAGE.--Water-stage recorder. Datum of gage is 831.23 ft (253.359 m) National Geodetic Vertical Datum of 1929. Prior to Nov. 15, 1933, nonrecording gage at site 19 mi (31 km) downstream at datum 38.19 ft (11.640 m) lower.
REMARKS.--Since 1941, flow largely regulated by Possum Kingdom Reservoir (station 08088500) 20 mi (32 km) upstream.
MAXIMA: FOR AUGUST 1978.--Discharge, 54,500 ft 3 /s (1,540 m3 /s) Aug. 8, 1978, gage height, 22.93 ft (6.989 m). FOR PERIOD 1924 to July 1978.--Maximum discharge, 95,600 ft 3 /s (2,710 m3 /s) June 16, 1930, at site 19 mi (31 km) downstream
from Mineral Wells, gage height, 30ft (9.1 m), present site and datum. HI STORI C.--Maximum stage occurred in 1876, from da:ta by Corps of Engineers, and was severa 1 feet higher than the flood of
June 16, 1930, which reached a stage of about 30ft (9.1 m) and was the highest since 1876.
MEAN DISCHARGE, IN CUBIC FEET PER SECOND, AUGUST 1978
DAY DISCHARGE DAY DISCHARGE DAY DISCHARGE DAY
1 •••• 7.8 8 •••• 52,800 16 ••• 3,000 24 ••• 2 •••• 7.8 9 •••• .39, ~00 17 ••• 2,530 25 ••• 3 •••• 54 10 ••• 30,000 18 ••• 2,570 26 ••• 4 •••• 62 11. •• 21,700 19 ••• 921 27 ••• 5 •••• 2,580 12 ••• 12,500 20 ••• 123 28 ••• 6 •••• 6, 280 13 ••• 9,340 21. .. 73 29 ••• 7 •••• 34,400 14 ••• 2,930 22 ••• 62 30 •••
15 ••• 2,970 23 ••• 55 31. ••
MONTHLY MEAN DISCHARGE, IN CUBIC FEET PER SECOND •••••••••••••••••••••••••••••••• MONTHLY TOTAL ACRE-FEET •••••••••••••••••••••••••••••••••••••••••••••••••••••••••
Gage height, in feet, and disaharge, in aubia feet per seaond, at indiaated time, 1978
Date Hour Gage Discharge height
Aug. 5 - 0100 0.27 47 0200 .95 176 0300 3.40 1,360 0400 4.22 2,200 0800 4.69 2,940 1300 4. 78 3,100 2400 4.74 3,030
Aug. 6 - 0400 4. 73 3,010 1600 4.74 3,030 1700 4.89 3,300 1800 6.36 6,380
Period
August 1978--------------------
1940 to July 1978--------------
Date Hour Gage Discharge Date Hour ~age height height
Aug. 6 - 2000 9.17 13,600 Aug. 9 - 2400 15.72 2400 12.13 22,400
Aug. 10- 0400 15.30 Aug. 7 - 1200 15.05 31,000 1600 15.61
1800 19.44 43,800 2400 15.60 2300 21.23 49,200
Aug. ll- 1200 14.66 Aug. 8 - 1200 22.51 53,200 1600 11.23
2400 22.93 54,500 1900 8.23 2100 6.59
Aug. 9 - 1200 21.99 51' 100 2400 5.44
Highest mean disaharge, in aubia feet per seaond for the indiaated number of aonseautive days
52,800
81,700
-68-
3
42,400
76,700
28,700
62,700
DISCHARGE
48 46 43 39 35 34 33 32
7,260 447,000
Discharge
30,700
29,300 30,300 30,300
27,800 17,400 9,080 5,170 2,900

ARAZOS RIVER RASH!
(30} 08092600 P.RAZOS RIVER AT WHITNEY flAM NEAR WHITNEY, TX
LOCATION.--lat 31n52'0U", long 97°22'00'', Hill County, Hydrologic Unit 12060202, immediately helow \~hitney !'lam, 3.4 mi (5.5 km) upstream fran gaging station near Whitney, 4.0 mi (6.4 km) upstream from Iron Creek, anc1 7.4 mi (11.9 km) southwest of Whitney.
DRAINAGE AREA.--26,190 mP (67 ,830 km1 ), of which 9,240 mP (23,930 km 2 ) prohahly is noncontrihuting.
PERIOD OF RECORD. --Chemical analysis: Octoher 1947 to August 1978.
REMARKS.--Records of discharge are available for gaging station 08093100, located 9.0 mi (14.5 km) downstream, for period Octoher 1938 to August 1978 in other reports of the Geological Survey.
MAXIMA: FOR AUGUST 1978.--Maximum daily specific conductance, 3,620 micromhos Aug. 24. FOR PERIOD 1947 to July 1978.--Maximum daily specific conductance, 2,660 micromhos Oct. 1, 1948.
( 31} 08098290 BRAZOS RIVER NEAR HIGHBANK, TX (National stream-quality accounting network)
LOCATION.--lat 31°08'02", long 96°49'29", Falls County, Hydrologic Unit 12070101, near right hank 45ft (14m) downstream from bridge on Farm Road 413, 1.4 mi (2.3 km) downstream from Highhank Slough and Spring Aranch, 2.6 mi (4.2 km) south of Highhank, and at mile 346.6 (557.7 km).
DRAINAGE AREA.--30,436 mP (78,829 km1 ), of which 9,566 mP (24,776 km 2 ) prohahly is noncontri!'luting.
PERIOD OF RECORD.--Chemical analysis: November 1967 to August 1978. flischarge records: October 1965 to llul')ust 1978.
GAGE.--Water-stage recorder. Datum of gage is 279.29 ft (85.128 m) National r,eodetic Vertical l'latum of 1929.
REMARKS.--Many diversions for municipal supply, irrigation, and industrial uses above gage. Flow affected !'ly 20 upstream reservoirs with a canbined capacity of 4,181,000 acre-ft (5.16 km 3 ).
MAXIMA: FOR AUGUST 1978.--Maximum daily specific conductance, 3,000 micromhos Aug. 24. FOR PERIOD 1967 to July 1978.--Maximum ~aily specific conductance, 2,170 micromhos nee. 8, 1972.
-69-

BRAZOS RIVER BASIN
{32) 08099000 LEON RESERVOIR NEAR RANGER, TX
LOCATION.--Lat 32°21'46", long 98°40'32", Eastland County, Hydrologic Unit 12070201, at outlet works near left end of dam on Leon River, 7.4 mi (11.9 km) south of Ranger, 8.7 mi (14.0 km) southeast of Eastland, and 274.1 mi (441.1 km) upstream from mouth.
DRAINAGE AREA.--259 mil {671 km2 ).
PERIOD OF RECORD.--January 1955 to August 1978. Prior to October 1965, monthend contents only.
GAGE.--Nonrecording gage. Datum of gage is National Geodetic Vertical Datum of 1929.
REMARKS.--The reservoir is formed by a rolled earthfill dam 3,700 ft (1,130 m) long. Storage· began in April 1954 and dam was completed in June 1954. The emergency spillway is a 1,200-foot-wide {366m) cut through natural ground near the left end of dam. The service spillway is an uncontrolled circular concrete drop inlet designed for a maximum discharge of 5,000 ftl/s (142 m3 /s) through an 11-foot-di ameter ( 3 m) concrete conduit. The dam is the property of East 1 and County Water Supply District and was built to impound water for municipal use by the cities of Ranger, Olden, and Eastland. The capacity table is based on a survey made in 1952. Figures given herein represent total contents. Data regarding the dam and reservoir are given in the following table:
Top of dam ••••••••••••••••••••••••••••••••••••••••••••••••••••••••••••••••• Crest of spillway •••••••••••••••••••••••••••••••••••••••••••••••••••••••••• Crest of spillway (top of conservation pool) .............................. . Lowest gated outlet (invert for water supply) ............................. .
El evat1on (feet)
1,398.0 1,382.0 1,375.0 1,335.0
COOPERATION.--Elevation and diversion records furnished by Eastland County Water Supply District.
Capac1ty (acre:-feet)
40,210 27,290
869
MAXIMA (at 1000): FOR AUGUST 1978.--Contents, 20,000 acre-ft {24.7 hm 3 ) Aug. 6-8, 1978; elevation, 1,369.80 ft (417.515 m).
DAY
FOR PERIOD 1955 to July 1978.--Maximum contents observed, 40,640 acre-ft (50.1 hm 3 ) Jun~ 13, 1967, elevation, 1,382.2 ft {421.29 m).
CONTENTS DAY
CONTENTS, IN ACRE-FEET, AUGUST 1978 INSTANTANEOUS OBSERVATIONS AT 1000
CONTENTS DAY CONTENTS DAY. CONTENTS -----------------------------------------------------------------------------------------------1 •••• 16,850 8 •••• 20,000 16 ••• 19,640 24 ••• 19,390 2 •••• 16,850 9 •••• 19,880 17 ••• 19,640 25 ••• 19,390 3 •••• 17,300 10 ••• 19,880 18 ••• 19,640 26 ••• 19,390 4 •••• 18,210 11 ••• 19,880 19 ••• 19,510 27 .. 19,270 5 •••• 19,880 12 ••• 19,880 20 ••• 19,510 28 ••• 19,270 6 •••• 20,000 13 ••• 19,760 21. •• 19,510 29 ••• 19,270 7 •••• 20,000 14 ••• 19,760 22 ••• 19,510 30 ••• 19,270
15 ••• 19,760 23 ••• 19,390 31 ••• 19 '150
CHANGE IN CONTENTS, IN ACRE-FEET •••••••••••••••••••••••••••••••••••••••••••••••• 2,190
-70-

BRAZOS RIVER BASIN
(33) 08099100 LEON RIVER NEAR DE LEON, TX
LOCATION.--Lat 32°10'25", long 98°31'58", Comanche County, Hydrologic Unit 12070201, on left bank at downstream end of bridge on State Highway 16, 1.5 mi (2.4 km) upstream from Flat Creek, 4.4 mi (7.1 km) northeast of De Leon, 6 mi (10 km) downstream from Hog Creek, and 250.1 mi (402.4 km) upstream from mouth.
DRAINAGE AREA.--479 mP (1,241 km 2 ).
PERIOD OF RECORD .--September 1960 to August 1978.
GAGE.--Water-stage recorder. Datum of gage is 1,209.93 ft (368.787 m) National Geodetic Vertical Datum of 1929. Prior to Nov. 22, 1960, nonrecordi ng gage at same site and datum.
REMARKS.--Flow partly regulated by Leon Reservoir (station 08099000). Numerous diversions above station for municipal, steam powerplant operation, and other uses. Recording rain gage located at station.
MAXIMA: FOR AUGUST 1978.--Discharge, 17 ft 3 /s (0.48 m3 /s) Aug. 4, 1978, gage height, 2.47 ft (0.753 m). FOR PERIOD 1960 to July 1978.--Maximum discharge, 7,540 ft 3 /s (214 m3 /s) Jan. 21, 1968, gage height, 15.50 ft (4.724 m). HISTORIC.--A stage of 19.3 ft (5.88 m) occurred in May 1908 at a point 2,000 ft (610 m) downstream from gage site and is
the highest since that time, from information by local resident.
MEAN DISCHARGE, IN CUBIC FEET PER SECOND, AUGUST 1978
DAY DISCHARGE DAY DISCHARGE DAY DISCHARGE DAY
1 •••• .00 8 •••• .00 16 ••• • 00 24 ••• 2 •••• .00 9 •••• .00 17 ••• • 00 25 ••• 3 •••• .49 10 ••• .00 18 ••• • 00 26 ••• 4 •••• 14 11. •• .00 19 ••• • 00 27 ••• 5 •••• 2.3 12 ••• .00 20 ••• • 00 28 ••• 6 •••• .00 13 ••• • 00 21 ••• • 00 29 ••• 7 •••• .00 14 ••• .00 22 ••• • 00 30 •••
15 ••• .00 23 ••• • 00 31. ••
MONTHLY MEAN DISCHARGE, IN CUBIC FEET PER SECOND •••••••••••••••••••••••••••••••• MONTHLY TOTAL ACRE-FEET •••••••••••••••••••••••••••••••••••••••••••••••••••••••••
Per>iod
August 1978--------------------
1961 to July 1978--------------
14
. 6,970
Highest mean dischar>ge, in cubic feet per> second for> the indicated number> of consecutive days
-71-
3
5.6
6,420
DISCHARGE
2.4
4, 10()
.00
.00
.00
.00
.00
.00
.00
.00
.54 33.3

BRAZOS RIVER BASIN
{34} 08099300 SABANA RIVER NEAR DE LEON, TX
LOCATION.--Lat 32°06'50", long 98°36'19", Comanche County, Hydrologic Unit 12070201, on left bank at downstream end of bridge on Farm Road 587, 0.6 mi {1.0 km) downstream from Spring Branch, 4.0 mi (6.4 km) west of De Leon, 4.2 mi (6.8 km) upstream from Turkey Creek, and 12.2 mi {19.6 km) upstream from mouth.
DRAINAGE AREA.--264 mP {684 km 2 }.
PERIOD OF REffiRD.--September 1960 to August 1978.
GAGE.--Water-stage recorder. Datum of gage is 1,209.59 ft (368.683 m) National Geodetic Vertical Datum of 1929. Prior to Nov. 22, 1960, nonrecordi ng gage at present site and datum.
REMARKS.--Flow is affected by Nabors Lake (capacity unknown) on Spring Branch. Recording rain gage located at station.
MAXIMA: FOR AUGUST 1978.--Discharge, 617 ft 3 /s (17.5 m3 /s) Aug. 4, 1978, gage height, 8.80 ft {2.682 m). FOR PERIOD 1960 to July 1978.--Maximum discharge, 10,800 ft 3 /s (306 m3 /s) June 12, 1967, gage height, 22.05 ft {6.721 m). HISTORIC.--Maximum stage since at least 1890, 24ft (7.3 m) in May 1908, fr001 information by local resident.
MEAN DISCHARGE, IN CUBIC FEET PER SECOND, AUGUST 1978 -oAv ______ oiscHARGE _______ oAv ______ oiscHARGE _______ oAv ______ oiscHARGE _______ oAv ______ oiscHARGE-i~~~~------------~oo-----8~~~~------------~i9 _____ i6~~~------------~oo _____ 24~~~------------~3i 2.... .00 9.... .00 17... .00 25... .00 3.... .00 10... .00 18... .00 26... .00 4.... 333 11... .00 19... .00 27... .00 5.... 36 12... .00 20... .00 28... .oo 6.... 9.1 13... .oo 21... .00 29... .00 7. ••• 2.2 14. •• .00 22... 15 30. •• .00
15... .00 23... 4.8 31... .00
MoNrHLv-MEAN-orscHARGE~-iN-cu8ic-FEEr-rER-sEcoNo~~~~~~~~~~~~~~~~~~~~~~~~~~~~~~~~----------i2~9-MoNTHLv TOTAL ACRE-FEET......................................................... 795 RUNOFF, IN INCHES............................................................... • 06
PeY'iod
August 1978--------------------
1961 to July 1978--------------
333
6,310
Highest mean discharge, in cubic feet per second for the indicated number of consecutive days
-72-
3
126
5,060
54
2,450

BRAZOS RIVER BASIN
( 35) 08099400 PROCTOR LAKE NEAR PROCTOR, TX
LOCATION.--Lat 31°58'07", long 98°29'09", Comanche County, Hydrologic Unit 12070201, in intake structure at Proctor Lake on Leon River, 2.0 mi (3.2 km) upstream from U.S. Highways 67 and 377, 3.5 mi (5.6 km) west of Proctor, and 228.1 mi (367.0 km) upstream from mouth.
DRAINAGE AREA.--1,259 mP (3,261 km2 ).
PERIOD OF RECORD.--January 1963 to August 1978. Prior to October 1970, published as Proctor Reservoir.
GAGE.--Water-stage recorder. Datum of gage is National Geodetic Vertical Datum of 1929. Prior to May 28, 1963, nonrecording gage at same site and datum.
REMARKS.--The lake is formed by a reinforced concrete gated structure and rolled earthfill section, total length 13,460 ft (4,103 m). The lake was operated as a detention basin from Jan. 30 to July 5, 1963. The gates were closed July 6, 1963, but lake was operated to elevation 1,156.0 ft (352.35 m) until construction was completed. Deliberate impoundment began Sept. 30, 1963. The spillway is a gated concrete gravity structure located on the left bank, with an agee weir section and stilling basin. The spillway is controlled by eleven 40.0- by 35.0-foot (12.2 by 10.7 m) tainter gates. The spillway was designed to discharge 431,800 ftl/s (12,200 m3 /s) at an elevation of 1,201.0 ft (366.06 m). The lake is operated for flood control and water conservation. One major reservoir partly regulates the inflow (see station 08099000). Inflow is affected at times by discharge from the flood-detention pools of 21 floodwater-retarding structures with combined detention capacity of 32,950 acre-ft (40.6 hm 3 ). These structures control runoff from 131 mi 2 (339 km2 ) in the Leon River and Rush Creek watersheds. The capacity table is based on a survey made in 1946. Borrow is not included in capacity totals. Figures given herein represent total contents. Data regarding the dam and lake are given in the following table:
Top of dam ••••••••••••••••••••• ; ••••••••••••••••••••••••••••••••••••••••••• Design flood ••••••••••••••••••••••••••••••••••••••••••••••••••••••••••••••• Top of gates ••••••••••••••••••••••••••••••••••••••••••••••••••••••••••••••• Crest of spillway (top of conservation pool) ••••••••••••••••••••••••••••••• Lowest gated outlet (invert) •••• _ .......................................... .
COOPERATION. --Records furnished by Corps of Engineers and reviewed by Geo 1 ogi ca 1 Survey.
El evat 10n (feet)
1,206 .o 1,201.0 1,197.0 1,162.0 11128 oO
Capac1ty (acre-feet)
427,500 374,200
59,400 68
MAXIMA: FOR AUGUST 1978.--Contents, 31,170 acre-ft (38.4 hm 3 ) Aug. 4-7, 1978, elevation, 1,154.48 ft (351.886 m). FOR PERIOD 1963 to July 1978.--Maximum contents, 137,500 acre-ft (170 hm 3 ) Jan. 26, 1968, elevation, 1,174.84 ft (358.091
m).
DAY CONTENTS DAY
1 •••• 30,960 8 •••• 2 •••• 30,850 9 •••• 3 •••• 31,340 10 ... 4 •••• 31,170 11. .. 5 •••• 31,170 12 ••• 6 •••• 31,170 13 ••• 7 •••• 31 '170 14 ...
15 •••
CONTENTS, IN ACRE-FEET, AUGUST 1978 INSTANTANEOUS OBSERVATIONS AT 2400
CONTENTS DAY CONTENTS
31 '11 0 16 ••• 29,850 31 ,050 17 ••• 29,600 30,990 18 ••• 29,430 30,880 19 ••• 29,290 30,700 20 ... 29,210 30,500 21 ••• 29,070 30,300 22 ••• 28,960 30,050 23 ••• 28,850
DAY CONTENTS
24 ... 28,710 25 ••• 28,550 26 ••• 28,410 27 .. 28,220 28 ••• 28,060 29 ••• 28,010 30 ••• 27,880 31 ••• 27,720
---------------------------------------------------------------------~-------------------------CHANGE IN CONTENTS, IN ACRE-FEET •••••••••••••••••••••••••••••••••••••••••••••••• -3,510 -----------------------------------------------------------------------------------------------
-73-

BRAZOS RIVER. BASIN
(36) 08109500 BRAZOS RIVER NEAR COLLEGE STATION, TX
LOCATION.--Lat 30°32'33", long 96°25'21", Brazos County, Hydrologic Unit 12070101, at bridge on Farm Road 60, 6.5 mi (10.5 km) south of College Station, 9 mi (14 km) downstream from gaging station near Bryan, and at mile 271.9 (437.6 km).
DRAINAGE AREA.--39,599 mil (102,561 km 2 }, of 1'/hich 9,566 mil (24,776 km 2 ) prohahly is noncontrihuting.
PERIOD OF RECORD.--Chemical analysis: August 1961 to August 1978.
REMARKS.--Records of discharge are available for gaging station 08109000, located 9 mi (14 km) upstream, for period June 1926 to August 1978 in other reports of the Geo 1 ogi ca 1 Survey.
MAXIMA: FOR AUGUST 1978.--Maximum daily specific conductance, 2,810 micromhos Aug. 27. FOR PERIOD 1g61 to July 1978.--Maximum daily specific conductance, 2,030 micromhos Oct. 1, 1963.
( 37) 08114000 BRAZOS RIVER AT RI CHMONI1, TX
LOCATIO~l.--Lat 29°34'56", long 95°45'27", Fort Bend County, Hydrologic Unit 12070104, on right bank at downstream side of downstream bridge on U.S. Highway 59 in Richmond, 925ft (282m) d01-mstream from Texas and Ne11 Orleans Railroad Co. bridge, and at mile 92.0 · (148.0 km).
DRAINAGE AREA.--45,007 mil (116,568 km 2 ), approximately, of 1'/hich 9,566 mil (24,776, km 2 ) prohahly is noncontributing.
PERIOD OF RECORD.--Chemical analysis: October 1945 to August 1978. 11ischarge records: October 1922 to August 1978.
GAGE.--Water-stage recorder. Datum of gage is 37.94 ft (11.564 m) National Geodetic Vertical 11atum of 1929.
REMARKS.--Considerable water diverted above station for irrigation and municipal supply.
MAXIMA: FOR AUGUST 1978.--Maximum daily specific conductance, 2,480 micromhos Aug. 30. FOR PERIOD 1945 to July 1978.--Maximum daily specific conductance, 2,540 micromhos Sept. 4, 1951.
( 38) 08116650 BRAZOS RIVER NEAR ROSHARON, TX (Nation a 1 stream-qua 1 i ty accounting network)
LOCATION.--Lat 29°20'58", long 95°34'56", Fort Rend-Brazoria County line, Hydrologic Unit 12070104, on right hank at downstream side of bridge on Farm Road 1462, 2.0 mi (3.2 km) do~mstream from Big Creek, 2.1 mi (3.4 km) upstream from Cow Creek, 7.3 mi (11.7 km) west of Rosharon, and at mile 56.7 (91.2 km).
DRAINAGE AREA.--45,339 mil (117 ,428 km 2 ), approximately, of which 9,566 mil (24,776 km 2 ) prohahly is noncontrihuting.
PERIOD OF RECORD.--Chemical analysis: October 1967 to August 1978. Discharge records: April 1967 to August 1978.
GAGE.--Water-stage recorder. Datum of gage is National Geodetic Vertical Datum of 1929.
REMARKS.--Water diverted above station for irrigation, ·industrial, and municipal use.
MAXIMA: FOR AUGUST 1978.--Maximum daily specific conductance, 2,400 micromhos Aug. 29, 30. FOR PERIOD 1967 to July 1978.--Maximum daily specific conductance, 4,430 micromhos Aug. 8, 1971.
-74-

COLORADO RIVER BASIN
(39) 08126500 COLORADO RIVER AT BALLINGER, TX
LOCATION.--Lat 31°43'58", long 99°57'13", Runnels County, Hydrologic Unit 12090101, on left bank at downstream side of bridge on U.S. Highway 67 in Ballinger, 1.3 mi (2.1 km) upstream from Elm Creek, and at mile 660.2 {1,062.3 km).
DRAINAGE AREA.--16,840 mP (43,620 km2 ), approximately, of which 11,600 mi2 {30,040 km 2 ) probably is noncontributing.
PERIOD OF RECORD.--June 1907 to August 1978. Monthly discharge only for some periods published in WSP 1312. Gage-height records collected in this vicinity from 1903-29 are contained in reports of the National Weather Service.
GAGE.--Water-stage recorder. Datum of gage is 1,593.74 ft {485.772 m) National Geodetic Vertical Datum of 1929. Prior to Nov. 29, 1930, nonrecording gages at several sites near present site at various datums. Nov. 29, 1930, to May 1, 1975, water-stage recorder at site 0. 8 mi ( 1. 3 km) downstream at same datum.
REMARKS.--Diversions above station for irrigation, municipal supplies, and oilfield operation. Flow is affected by E. V. Spence and Oak Creek Reservoirs (see stations 08123950 and 08125500) and at times by discharge from the flood-detention pools of 25 fl·oodwater-retarding structures with a combined detention capacity of 26,640 acre-ft {32.8 hm 3 ). These structures control runoff from 133 mP {344 km 2
) in the Kickapoo and Valley Creeks drainage basins.
MAXIMA: FOR AUGUST 1978.--Discharge, 16,600 ft 3 /s (470 m3 /s) Aug. 3, 1978, gage height, 23.95 ft (7.300 m). FOR PERIOD 1907 to July 1978.--Maximum discharge, 75,400 ft 3 /s (2,140 m3 /s) Sept. 18, 1936, gage height, 28.6 ft (8.72 m). HISTORIC.--Maximum stage since at least 1882, about 36ft (11.0 m) sometime in 1884, at former site and datum, from infor
mation by local residents. Flood of Aug. 6, 1906, reached a stage of about 32.0 ft {9.75 m), at former site and datum, from floodmarks (backwater from Elm Creek).
DAY
1 .••• 2 •••• 3 •••• 4 •••• 5 •••• 6 •••• 7 ••••
DISCHARGE
• 00 3.3
9,850 4,180
190 86 37
MEAN DISCHARGE, IN CUBIC FEET PER SECOND, AUGUST 1978
DAY
8 •••• 9 •••• 10 ••• 11. •• 12 ••• 13 ••• 14 ••• 15 •••
DISCHARGE
23 18 16 16 28 15 12 9.8
DAY
16 ••• 17 ••• 18 ••• 19 ••• 20 ••• 21 ••• 22 ••• 23 •••
DISCHARGE
9.6 9.1 8.3 7.6 7.5 7.2 7. 1 6.9
DAY
24 ••• 25 ••• 26 ••• 27 ••• 28 ••• 29 ••• 30 ••• 31 •••
MONTHLY MEAN DISCHARGE, IN CUBIC FEET PER SECOND •••••••••••••••••••••••••••••••• MONTHLY TOTAL ACRE-FEET •••••••••••••••••••••••••••••••••••••••••••••••••••••••••
Period Highest mean discharge, in cubic feet per second
for the indicated number of consecutive days
DISCHARGE
7. 1 7.2 6.8 7.0 7.4 6.8 6.9 7 .1
471 29,000
3 7
August 1978--------------------
1968 to July 1978--------------
9,850
6,150
-75-
4,740
4,410
2 ,o5n
2,260

COLORADO RIVER BASIN
(40) 08127000 ELM CREEK AT BALLINGER, TX
LOCATION.--Lat 31°44'57", long 99°56'51", Runnels County, Hydrologic Unit 12090101, on right bank 1,000 ft (305m) upstream from storage dam at Ballinger and 1.9 mi (3.1 km) upsream from mouth.
DRAINAGE AREA.--471 mP (1,220 km2 ).
PERIOD OF RECORD.--April 1932 to August 1978.
GAGE.--Water-stage recorder and masonry dam control. Datum of gage is 1,617.72 ft (493.081 m) National Geodetic Vertical Datum of 1929.
MAXIMA: FOR AUGUST 1978.--Discharge, 23,400 ft 3 /s (663 m3 /s) Aug. 3, 1978, gage height, 9.17 ft (2.795 m). FOR PERIOD 1932 to July 1978.--Maximum discharge, 50,000 ft 3 /s (1,420 m3 /s) Oct. 13, 1957, gage height, 14.20 ft (4.328 m},
from fl oodma rk. HISTORIC.--Flood in August 1906 reached a stage of 14.5 ft (4.42 m); affected by backwater from Colorado River; highest
stage not affected by backwater from Colorado River since at least 1904 was that of Oct. 13, 1957, from information by local residents.
DAY
1 ••.• 2 •••• 3 •••• 4 •••• 5 •••• 6 •••• 7 ••••
DISCHARGE
• 00 • 00
8,760 12,200 1,270
230 108
MEAN DISCHARGE, IN CUBIC FEET PER SECOND, AUGUST 1978
DAY
8 •••• 9 •••• 10 ••• 11. •• 12 ••• 13 ••• 14 ••• 15 •••
DISCHARGE
71 58 49 41 32 25 20 16
DAY
16 ••• 17 ••• 18 ••• 19 •• -. 20 ••• 21 ••• 22 ••• 23 •••
DISCHARGE
13 11 9.2 7.2 4.7 3.3 2.5 1.9
DAY
24 ••• 25 ••• 26 ••• 27 ••• 28 ••• 29 ••• 30 ••• 31. ••
MONTHLY MEAN DISCHARGE, IN CUBIC FEET PER SECOND •••••••••••••••••••••••••••••••• MONTHLY TOTAL ACRE-FEET •••••••••••••••••.•••••••••••••••••••••••••••••••••••••••• RUNOFF, IN INCHES •••••••••••••••••••••••••••••••••••••••••••••••••••••••••••••••
Gage height,
Date Hour Gage height
Aug. 3 - 0500 3.51 0515 4.37 0530 4.76 0600 5.06 0700 5.52 1100 5.80 1200 6.79 1500 7.86 1800 8.48 2100 8.95 2200 9.17
Period
in feet, and discharge, in cubic feet per second, at indicated time, 1978
Discharge Date
0.00 Aug. 361
1,050 1,590 Aug. 2,520 3,160 6,000
10,900 15,900 21,400 23,400
Hour Gage Discharge Date Hour Gage height height
3 - 2300 9.16 23,300 Aug. 5 - 0300 5.53 2400 9.03 22,200 0800 4.92
1400 4.61 4 - 0300 8.31 14,300 2400 4.37
1200 7.68 9,700 1300 7.96 11 ,600 Aug. 6 - 1200 4.26 1500 8.47 15,800 2400 4.19 1545 8.48 15,900 1700 8.35 14,600 Aug. 7 - 1200 4.15 2100 7.50 8,760 2400 4.11 2400 6.32 4,540
Highest mean discharge, in aubic feet per second for the indicated number of consecutive days
3
DISCHARGE
1.8 1.7 1.6 2.0 1.9 1.6 1.1
.80
740 45,500
1. 81
Discharge
2,540 1 ,320
761 361
215 141
109 83
August 1978--------------------
1933 to July 1978--------------
12,200
21,400
7,410
8,800
3,240
4,870
-76-

COLORADO RIVER BASIN
(41) 08136500 CONCHO RIVER AT PAINT ROCK, TX
LOCATION.--Lat 31 °30'57", long 99°55'09", Concho County, Hydrologic Unit 12090105, near left bank on downstream end of pier of bridge on U.S. Highway 83, 0.5 mi (0.8 km) north of Concho County Courthouse in Paint Rock, 2.7 mi (4.3 km) downstream from Kickapoo Creek, and 19.6 mi (31.5 km) upstream from station.
DRAINAGE AREA.--6,415 mP (16,615 km 2 ), of which 1,283 mP (3,323 km 2 ) probably is noncontributing.
PER I OD OF RECORD .--September 1915 to August 1978. Prior to October 1970, pub 1 i shed as "near Paint Rock".
GAGE.--Water-stage recorder with masonry dam control. Datum of gage is 1,574.36 ft (479.865 m) National Geodetic Vertical Datum of 1929. See WSP 1922 for history of changes prior to Jan. 15, 1940.
REMARKS.--Many diversions above station for irrigation and municipal supply. Flow is regulated by Twin Buttes Reservoir (station 08131200) on the South Concho River and by 0. c. Fisher Lake (station 08134500) on the North Concho River.
MAXIMA: FOR AUGUST 1978.--Discharge, 12,700 ft 3 /s (360 m3 /s) Aug. 3, 1978, gage height, 19.11 ft (5.825 m). FOR PERIOD 1915 to July 1978.--Maximum discharge, 301,000 ft 3 /s (8,520 m3 /s) Sept. 17, 1936, gage height, 43.4 ft (13.23
m), fran floodmarks, fran rating curve extended above 98,000 ft 3 /s (2,780 m3 /s) on basis of slope-area measurements of 144,000 and 301,000 ft 3 /s (4,080 and 8,520 m3 /s).
HISTORIC.--Maximum stage since at least 1853, that of Sept. 17, 1936. Flood in August 1882 reached a stage of about 39.9 ft (12.16 m), and flood in August 1906 reached a stage of 39.5 ft (12.04 m), from information by local resident.
MEAN DISCHARGE, IN CUBIC FEET PER SECOND, AUGUST 1978
DAY DISCHARGE DAY DISCHARGE DAY DISCHARGE DAY DISCHARGE i~~~~----------22--------8~~~~----------58 ________ i6~~~----------28 ________ 24~~~----------i8 __ _ 2.... 28 9.... 46 17... 27 25... 26 3.... 4,350 10. •• 39 18... 25 26... 27 4.... 1,750 11... 35 19... 23 27... 34 5.... 306 12... 53 20... 24 28... 36 6.... 143 13... 39 21... 23 29... 62 7.... 82 14... 35 22... 23 30... 52
15... 31 23... 21 31... 42
------------------------------MONTHLY MEAN DISCHARGE, IN cusic-FEET-PER-SECONo~:~:::::~:::~::::::::~:~:::::::~---------242 __ _ MONTHLY TOTAL ACRE-FEET......................................................... 14,900
-----------------------------------------------------------------------------------------------
Period
August 1978--------------------
1962 to July 1978--------------
4,350
5,630
Highest mean disaharge, in aubia feet per seaond for the indiaated number of aonseautive days
3
2,140
3,880
-77-
962
3,220

COLORADO RiVER BASIN
{42) 08136700 COLORADO RIVER NEAR STACY, TX {National stream-quality accounting network)
LOCATION.--Lat 31°29'37", long 99°34'25", Coleman-McCulloch County line, Hydrologic Unit 12090106, on left bank at downstream side of bridge on Farm Road 503, 1.2 mi {1.9 km) upstream from Bois d'Arc Creek, 1.8 mi {2.9 km) northeast of Stacy, 24 mi {39 km) downstream from Concho River, and at mile 604.8 {973.1 km).
DRAINAGE AREA.--24,040 mil {62,260 km1 ), approximately, of which 12,880 mil {33,360 km1 ) probably is noncontributing.
PERIOD OF RECORD.--March 1968 to August 1978. Prior to October 1970, published as "at Stacy".
GAGE.--Water-stage recorder. Datum of gage is 1,394.66 ft {425.092 m) National Geodetic Vertical Datum of 1929 {Texas Department of Highways and Public Transportation bridge plans).
REMARKS.--Many diversions above station for municipal, irrigation, and oilfield operation uses. Effluent from numerous sewage plants is returned to the river. Flow is affected by reservoirs upstream {see station 08126500) and at times by discharge from the flood-detention pools of 40 floodwater-retarding structures with a combined detention capacity of 54,040 acre-ft {66.6 hm 3 ).
These structures control runoff from 260 mil {673 km 1 ).
MAXIMA: FOR AUGUST 1978.--Discharge, 35,700 fP/s {1,010 m3 /s) Aug. 4, 1978, gage height, 22.50 ft {6.858 m). FOR PERIOD 1968 to July 1978.--Maximum discharge, 22,200 ft 3 /s {629 m3 /s) Sept. 19, 1974, gage height, 16.68 ft (5.084 m). HISTORIC.--Maximum stage since since at least 1882, 356,000 ft 3 /s {10,100 m3 /s) Sept. 18, 1936, gage height, 64.59 ft
{19.687 m), by slope-area measurement of peak flow •. The flood, of Sept. 18, 1936, was 4ft {1.2 m) higher than the 1906 flood and 7 to 8 ft {2.1 to 2.4 m) higher than the 1882 flood, from information by local resident. ·
MEAN DISCHARGE, IN CUBIC FEET PER SECOND, AUGUST 1978
DAY DISCHARGE DAY DISCHARGE. DAY DISCHARGE DAY
1 •••• . 14 8 •••• 406 16 ••• 120 24 ••• 2 •••• 34 9 •••• 300 17 ••• 106 25 ••• 3 •••• 6,250 10 ••• 239 18 ••• 98 26 ••• 4 •••• 28,000 11 ••• 196 19 ••• 90 27 ••• 5 •••• 7,540 12 ••• 172 20 ••• . 86 28 ••• 6 •••• 1 '460 13 ••• 155 21 ••• 82 29 ••• 7 •••• 625 14 ••• 162 22 ••• 78 30 •••
15 ••• 138 23 ••• 76 31. ••
MONTHLY MEAN DISCHARGE, IN CUBIC FEET PER SECOND •••••••••••••••••••••••••••••••• MONTHLY TOTAL ACRE-FEET •••••••••••••••••••••••••••••••••••••••••••••••••••••••••
Period
August 1978--------------------
1969 to July 1978--------------
28,000
14,490
Highest mean disaharge in aubia feet per seaond for the indiaated number of aonseautive days
3
-78-
13,900
7,330
6,370
4,480
DISCHARGE
72 69 64 58 62 75 81 97
1,520 93,200

COLORADO RIVER BAS IN
( 43) 08138000 COLORADO RIVER AT WINCHELL, TX
LOCATION:--Lat 31°28'04", long 99°09'43", McCulloch-Brown County line, Hydrologic Unit 12090106, near left bank on downstream end of pier of bridge on U.S. Highway 377, 0.3 mi (0.5 km) south of Winchell, 5.9 mi (9.5 km) downstream from Home Creek, and at mile 560.7 (902.2 km).
DRAINAGE AREA.--24,580 mil (63,660 km2 ), approximately, of which 12,880 mil (33,360 km2 ) probably is noncontributing.
PERIOD OF RECORD.--November 1923 to September 1934 (published as "near Milburn"), January 1939 to August 1978.
GAGE.--Water-stage recorder. Datum of gage is 1,264.86 ft (385.529 m) National Geodetic Vertical Datum of 1929. November 1923 to September 1934, nonrecording gage at site 4.2 mi (6.8 km) downstream at datum 10.14 ft (3.091 m) lower. Jan. 13, 1939, to Mar. 24, 1940, nonrecordi ng gage at present site and datum.
REMARKS.--Many diversions above station for irrigation, municipal supply, and oilfield operation. Flow is affected by reservoirs upstream (see station 08126500) and at times by discharge from flood-dentention pools of 85 floodwater-retarding structures with canbi ned detention capacity of 100,320 acre-ft ( 124 hm 3 ). These structures contro 1 runoff from 486 mil (1 ,259 km 2 ).
MAXIMA: FOR AUGUST 1978.--Discharge, 29,600 ft 3 /s (838 m3 /s) Aug. 5, 1978, gage height, 31.88 ft (9.717 m). FOR PERIOD 1923 to July 1978.--Maximum discharge, 76,100 ft 3 /s (2,160 m3 /s) Oct. 15, 1930, gage height, 51.8 ft (15.79 m),
present site and datum. HISTORIC.--Maximum stage since at least 1882, 62.2 ft (18.96 m) Sept. 19, 1936.
MEAN DISCHARGE, IN CUBIC FEET PER SECOND, AUGUST 1978
DAY DISCHARGE DAY DISCHARGE DAY DISCHARGE DAY
1 •••• .01 8 •••• 621 16 ••• 94 24 ••• 2 •••• 16 9 •••• 422 17 ••• 77 25 ••• 3 •••• 1,060 10 ••• 389 18 ••• 63 26 ••• 4 •••• 18,100 11 ••• 336 19 ••• 55 27 ••• 5 •••• 19,500 12 ••• 163 20 ••• 49 28 ••• 6 •••• 2' 770 13 ••• 131 21 ••• 45 29 ••• 7 •••• 1,020 14 ••• 108 22 ••• 42 30 •••
15 ••• 105 23 ••• 39 31. ••
MONTHLY MEAN DISCHARGE, IN CUBIC FEET PER SECOND •••••••••••••••••••••••••••••••• MONTHLY TOTAL ACRE-FEET •••••••••••••••••••••••••••••••••••••••••••••••••••••••••
Period
August 1978--------------------
1925 to July 1978--------------
19,500
67,000
Highest mean discharge, in cubic feet per second for the indicated nwnber of consecutive days
-79-
3
13,500
55,100
6,210
33,600
DISCHARGE
36 33 32 31 31 93 77 60
1,470 90,400

COLORADO RIVER BASIN
( 44) 08140600 LAKE CLYDE NEAR CLYDE, TX
LOCATION.--Lat 32°19'05" long 99°28'43" Callahan County, Hydrologic Unit 12090107, at Clyde pump station, 0.6 mi (1.0 km) west of dam on North Prong Pe~an Bayou, 2.1 mi (3.4 km) downstream fran bridge on Farm Road 604, and 7.0 mi (11.3 km) southeast of Clyde.
DRAINAGE AREA.--37.9 mil (98.2 km2 ).
PERIOD OF RECORD.--January 1970 to August 1978.
GAGE.--Nonrecordi ng gage. Datum of gage is National Geodetic Vertical Datum of 1929.
REMARKS.--The lake is formed by a rolled-fill earthen dam 3,950 ft (1,204 m) long. Appreciable storage began in April 1970, and the dam was canpleted in May 1970. The emergency spillways are two 200-foot-wide (61 m) cut channels through natural ground located at left end of dam. The service spillway is an uncontrolled 3.5- by 10.5-foot (1.1 by 3.2 m) reinforced concrete drop inlet that is connected to a 42-inch (1,067 mm) concrete outlet pipe. A 14-inch (356 mm) controlled drain pipe is connected to the drop inlet. There are four 4.83- by 3.50-foot (1.47 by 1.07 m) rectangular slots, two on each side, divided by a 10-inch (254 mm) concrete web. Figures given herein represent total contents. Data regarding the dam and lake are given in the following table:
Elevat1on Capac1ty
Top of dam ••••••••••••••••••••••••••••••••••••••••••••••••••••••••••••••••• Crest of spi 11 way •••••••••••••••••••••••••••••••••••••••••••••••••••••••••• Crest of spillway (invert of drop inlet) ••••••••••••••••••••••••••••••••••• Lowest gated outlet (invert) •••••••••••••••••••••••••••••••••••••••••••••••
COOPERATION .--Capacity table furnished by the Soil Conservation Service.
(feet) (acre-feet) 1,888.9 16,530 1,881.4 10,840 1,872.0 5,720 1,842.2 60
MAXIMA (at 0900): FOR AUGUST 1978.--Contents, 7,420 acre-ft (9.15 hm 3 ) Aug. 4, 1978, elevation, 1,875.50 ft (571.652 m).
DAY
1 •••• 2 •••• 3 •••• 4 •••• 5 •••• 6 •••• 7 ••••
FOR PERIOD 1970 to July 1978.--Maximum contents, 6,370 acre-ft (7.85 hm 3 ) May 28, 1975, elevation, 1,873.4 ft (571.01 m).
CONTENTS
1 ,460 1 ,460 2,740 7,420 6,660 6,320 6,230
DAY
8 •••• 9 •••• 10 ••• 11 ••• 12 ••• 13 ••• 14 ••• 15 •••
CONTENTS, IN ACRE-FEET, AUGUST 1978 INSTANTANEOUS OBSERVATIONS AT 0700
CONTENTS
5,990 5,900 5,860 5,810 5,760 5,720 5,720 5,720
DAY
16 ••• 17 ••• "!8 ••• 19 ••• 20 ••• 21. •• 22 ••• 23 •••
CONTENTS
5,720 5,670 5,670 5,670 5,670 5,670 5,760 5,760
DAY
24 ••• 25 ••• 26 ••• 27 •• 28 ••• 29 ••• 30 ••• 31. ••
CONTENTS
5,760 5,760 5,760 5,720 5,720 5,720 5,720 5,720
CHANGE IN CONTENTS, IN ACRE-FEET •••••••••••••••••••••••••••••••••••••••••••••••• 4,240
-80-

COLORADO RIVER BASIN
( 45) 08140700 PECAN BAYOU NEAR CROSS CUT, TX
LOCATION.--Lat 31°58'21", long 99°07'48", Brown County, Hydrologic Unit 12090107, on right bank at downstream side of bridge on State Highway 279, 1.2 mi (1.9 km) downstream from Turkey Creek, and 4.2 mi (6.8 km) south of Cross Cut.
DRAINAGE AREA.--532 mP (1,378 km2 ).
PERIOD OF RECORD.--April 1968 to August 1978.
GAGE.--Water-stage recorder. Datum of gage is 1,453.35 ft (442.981 m) National Geodetic Vertical Datum of 1929.
REMARKS.--Several small diversions above station. Flow is affected at times by discharge from flood-detention pools of 32 floodwater-retarding structures with combined detention capacity of 39,200 acre-ft (48.3 hm 3
). These structures control runoff from 200 mil ( 518 km 2 ) in the Turkey Creek and upper Pecan Bayou drainage basins. National Weather Service gage-height telemeter and rain gage at station.
MAXIMA: FOR AUGUST 1978.--Discharge, 16,200 ft 3 /s (459 ms/s) Aug. 4, 1978, gage height, 24.90 ft (7.590 m). FOR PERIOD 1968 to July 1978.--Maximum discharge, 7,330 ft 3 /s (208 m3 /s) Oct. 19, 1971, gage height, 19.68 ft (5.998 m). HISTORIC.--Flood in 1908 reached a stage of 26.5 ft (8.08 m) and was exceeded by a flood in 1900, fran information by local
resident.
MEAN DISCHARGE, IN CUBIC FEET PER SECOND, AUGUST 1978 -o;;------oiscHARGE _______ o;;------oiscHARGE _______ oAv ______ oiscHARGE _______ oAv ______ oiscHARGE-i::::------------:oo _____ a::::-------i:o2o ________ i6:::---------ioi ________ 24:::-----------8:6-2.... 79 9.... 899 17... 45 25... 6.3 3.... 3,840 10... 822 18... 27 26... 4.6 4.... 5,700 11... 741 19... 21 27... 3.6 5.... 6,160 12... 626 20... 18 28... 7.0 6.... 1,620 13... 390 21... 14 29... 18 7.... 1,210 14... 190 22... 14 30... 5.0
15... 134 23... 12 31... 2.7
MoNrHLY-MEAN-oiscHARGE:-iN-cusic-FEEr-rER-sEcoNo:::::::::::::::::::::::::::::::~---------766 __ _ MONTHLY TOTAL ACRE-FEET......................................................... 47,100 RUNOFF, IN INCHES............................................................... 1. 66
Gage height# in feet# and dischaPge# in cubic feet per second# at indicated time# 19'18
Date Hour Gage Discharge height
Aug. 2 - 1800 1.36 0.00 1830 3.02 135 1930 3.23 184 2000 2.99 129 2200 2.40 35 2230 4.15 534 2300 4.93 905 2400 5.07 977
Aug. 3 - 0300 3.99 466 0400 4.97 925 0500 5.88 1,380 0700 8.31 ·2,310
Period
August 1978--------------------
1969 to July 1978--------------
Date Hour Gage Discharge Date Hour Gage Discharge height height
Aug. 3 - 0800 8.59 2,390 Aug. 4 - 2330 24.90 16,200 1000 8.24 2,290 2400 24.83 16,000 1200 11.57 3,200 1600 17.31 5,450 Aug. 5 - 0100 24.81 15,900 2100 20.37 7,480 0600 22.14 9,630 2400 19.42 6,720 0900 18.02 5,840
1200 12.75 3,590 Aug. 4 - 0600 13.68 3,900 1800 7.71 2,140"
1100 9.21 2,560 2400 7.18 1,970 1600 14.61 4,200 2000 20.60 7,670 Aug. 6 - 1200 6.32 1,600 2100 22.85 10,800 2400 5.79 1,330 2300 24.66 15,400
Highest mean dischaPge# in cubic feet per second for the indicated number of consecutive days
6,160
5,680
-81-
3 7
5,230
2,940
2,920
"1,450

COLORADO RIVER BASIN
{46) 08140800 JIM NED CREEK NEAR COLEMAN, TX
LOCATION.--Lat 31°58'59", long 99°24'52", Coleman County, Hydrologic Unit 12090108, on right bank 77ft {23m) downstream from centerline of u.s. Highway 283, 1.4 mi {2.3 km) downstream from Turtle Bayou, 7.4 mi {11.9 km) downstream from Lake Coleman, and 10.8 mi (17 .4 km) north of Coleman.
DRAINAGE AREA.--333 mP (862 km2 ), of which 299 mP {774 km 2 ) is above Lake Coleman.
PERIOD OF RECORD.--October 1961 to September 1964 (miscellaneous measurements only), March 1965 to August 1978.
GAGE.--Water~stage recorder. Datum of gage is 1,592.31 ft (485.336 m) National Geodetic Vertical Datum of 1929.
REMARKS.--s·ince March 1966 when deliberate impoundment began, flow has been largely controlled by Lake Coleman, capacity, 40,000 acre-ft {49.3 hm 3 ) at service spillway; elevation, 1,717.5 ft (523.49 m).
MAXIMA: FOR AUGUST 1978.--Discharge, 1,830 ft 3 /s {51.8 m3 /s) Aug. 4, 1978, gage height, 5.77 ft {1.759 m) • . FOR PERIOD 1961 to July 1978.--Maximum discharge, 5,020 ft3/s (142 m3 /s) May 6, 1969, gage height, 9.08 ft (2.768 m).
MEAN DISCHARGE, IN CUBI~ FEET PER SECOND, AUGUST 1978
DAY
1 •••• 2 •••• 3 •••• 4 •••• 5 •••• 6· •••• 7 .....
DISCHARGE
.00
.00 31
967 1 '770 1,740 1 '7 30
DAY
8 •••• 9 •••• 10 ••• 11 ••• 12 ••• 13 ••• 14 ••• 15 •••
DISCHARGE
1,540 ·994 719 577 469 364 278 220
DAY
16 ••• 17 ••• 18 ••• 19 ••• 20 ••• 21 ••• 22 ••• 23 •••
DISCHARGE
176 144 109
82 64 49 39 31
DAY
24 ••• 25 ••• 26 ••• 27 ••• 28 ••• 29 ••• 30 ••• 31 •••
MONTHLY MEAN DISCHARGE, IN CUBIC FEET PER SECOND •••••••••••••••••••••••••••••••• MONTHLY TOTAL ACRE-FEET ••••••••••••••••••••••••••••••••••••••••••••••••••••••••• RUNOFF, IN INCHES •••••••••••••••••••••••••••••••••••••••••••••••••••••••••••••••
Period
August 1978--------------------
1966 to July 1978--------------
Highest mean discharge, in cubic feet per second for the indicated nwnber of consecutive days
.3
1,770 1 ,750
2,420 3,000
-82-
1,350
1,680
DISCHARGE
23 17 12 8.4 5.6 6.8 6.1 2.7
393 24,100
1. 36

COLORADO RIVER BASIN
(47) 08141000 . HORnS CREEK LAKE NEAR VALERA, TX
LOCATION.--Lat 31°49'58", long 99°33'38", Coleman County, Hydrologic Unit 12090108, at outlet-1~orks structure near right end of dam on Hords Creek, 5.6 mi (9.0 km) north of Valera, and 8.8 mi (14.2 km) west of Coleman.
DRAINAGE AREA.--48 mil (124 km2 ), approximately.
PERIOD OF RECORD .--April 1948 to August 1978. Prior to October 1970, pub 1 i shed as Hords Creek Reservoir.
GAGE.--Water-stage recorder. Datum of gage is National Geodetic Vertical natum of 1929.
REMARKS.--The lake is formed by a rolled earthfill dam 6,800 ft (2,070 m) long, including spillway. The deliberate impoundment of water began Apr. 7, 1948, and the dam was completed in June 1948. The emergency spillway is an excavatec1 channel through natural ground, 500ft (150m) wide, located about 600ft (180m) from the right erid of dam. The service spilhtay consists of three concrete conduits; two controlled by slide gates 5.0 by 6.0 ft (1.5 by 1.8 m), and the third an uncontrolled ogee spillway 4.0 ft 0.2 m) wide and 19.5 ft (5.9 m) high. The lake is operated for flood control and municipal water supply for the city of Coleman. The capacity table of August 1974 is based on a sedimentatieon survey made in 1968. Figures given herein represent total contents. Dat_~-e_g_~d_ing the dam and lake ar_E£Jliven in the follo~.i.:..;n.;..g"--"-ta::.:b~l..::.e . .:_.: ___ -r:;;-::-:-:::-=.-=-------,=~,..,..,,--
Elevation Capac1ty (feet) (acre-feet)
Top of dam ••••••••• -;:-.-~-.-:-••••••••••••••••••••••••••••••••••••••••• ~........ 1,939.0 Design flood............................................................... 1,933.6 Crest of spillway........................................................... 1,920.0 24,730 Crest of spillway (top of conservation pool)............................... 1,900.0 8,110 Lowest gated outle~ _ _(inv_e_rt_)_•..:.•.!-·.·~-~-~-·-~·-·-·..!..!.,!_•..!..!..!.!..•:..:c•..:...•.=...;••o...:•..:.•..:...•:..;• •;...:•..:...•.:..:• •o...:•..:.•..:...•.:..;••:.=•..:.•.:..c••::..:•..:.• _____ -=-1'-'8..:.5..::.6.:..c.o.:__ ______ ....;3;;__
COOPERATION.--Records furnished by Corps of Engineers and reviewed by Geological Survey.
MAXIMA: FOR AUGUST 1978.--Contents, 3,570 acre-ft (4.40 hm 3 ) Aug. 5, 1978, elevation, 1,887.90 ft (575.432 m). FOR PERIOD 1948 to July 1978.--Maximum contents, 12,790 acre-ft (15.8 hm 3 ) May 1, 1956, elevation, 1,906.86 ft (581.211 m).
CONTENTS, IN ACRE-FEET, AUGUST 1978 INSTANTANEOUS OBSERVATIONS AT 2400 -oAv ________ coNrENrs ______ oAv ________ coNrENrs ______ oAv ________ coNrENrs _______ oAv _______ coNrENrs
-----------------------------------------------------------------------------------------------1.... 2,540 8.... 3,540 16... 3,470 24... 3,410 2.... 2,550 9.... 3,530 17... 3,460 25... 3,400 3.... 3,490 10... 3,520 18... 3,460 26... 3,390 4.... 3,550 11... 3,520 19... 3,450 27.. 3,390 5.... 3,570 12... 3,510 20... 3,440 28... 3,380 6.... 3,550 13... 3,500 21... 3,430 29... 3,380 7. ••• 3,550 14... 3,490 22... 3,420 30... 3,370
. 15... 3,480 23~.. 3,410 31... 3,360
cHANGE-iN-coNrENrs:-iN-ACRE:FEEr::::::::::::::::::::::::::::::::::::::::::::::::-----------~;~------------------------------------------------------------------------------------------------
-83-

COLORADO RIVER BAS IN
{48} 08141500 HORDS CREEK NEAR VALF.P.I\, TX
LOCATION.--Lat 31°50'03", long 99°32'04", Coleman County, Hydrologic Uni~ 12090108, on left bank 2,500 ft {762 m) downstream from Farm Road 503, 1.6 mi (2.6 km) downstream from Hords Creek Dam, 5.7 mi {9.2 km) north of Valera, 7.0 mi {11.3 km) west of Coleman, and 21.8 mi {35.1 km) upstream from mouth. ·
ORAl NAGE AREA. --53 mil ( 137 km 2 ), approximately, of which 48 mil ( 124 km 2 ) is above Hords Creek Dam.
PERIOD OF RECORD.--April 1947 to August 1978.
GAGE.--Water-stage recorder. Datum of gage is 1,819.88 ft (554.699 m) National Geodetic Vertical Datum of 1929 {Corps of Engineers bench mark). ·
REMARKS.--Flow regulated by Hords Creek Lake (station 08141000}.
MAXIMA: FOR AUGUST 1978.--Discharge, 2,360 ft 3 /s {66.8 m3 /s) Aug. 3, 1978, gage height, 11.06 ft (3.371 m). FOR PERIOD 1947 to July 1978.--Maximum discharge, 3,860 ft 3 /s (109 m3 /s) Apr. 30, 1956, gage height, 14.73 ft. (4.490 m),
fran rating curve extended above 1,900 ft 3 /s (53.8 m3 /s). HISTORIC.--Maximum stage since at least 1900, 23.0 ft (7.01 m) July 3, 1932.
MEAN DISCHARGE, IN CUBIC FEET PER SECOND, AUGUST 1978
DAY
1 •••• 2 •••• 3 •••• 4 •••• 5 •••• 6 •••• 7 ••••
DISCHARGE
.00
.00 417 169 119
83 54
DAY
8 •••• 9 •••• 10 ••• 11 ••• 12 ••• 13 ••• 14 ••• 15 •••
DISCHARGE
32 18 9.1 3.9 1.2
• 12 • 00 • 00
DAY
16 ••• 17 ••• 18 ••• 19 ••• 20 ••• 21 ••• 22 ••• 23 •••
DISCHARGE
.00 • 00 .00 .00 • 00 .00 .00 • 00
DAY
24 ••• 25 ••• 26 ••• 27 ••• 28 ••• 29 ••• 30 ••• 31. ••
MONTHLY MEAN DISCHARGE, IN CUBIC FEET PER SECOND •••••••••••••••••••••••••••••••• MONTHLY TOTAL ACRE-FEET •••••••••••••••••••••••••••••••••••••••••••••••••••••••••
Period
August 1978--------------------
1948 to July 1978--------------
417
864
Highest mean discharge, in cubic feet per second for the indicated number of consecutive days
-84-
3
235
469
127
385
DISCHARGE
.oo
.oo
.00
.00
.oo
.oo
.oo
.00
29.2 1,800

COLORADO RIVER BAS IN
( 49) 08143000 LAKE BROWNWOOD NEAR BROWNWOOD, TX
LOCATION.--Lat 31°50'13", long 99°00'13", Brown County, Hydrologic Unit 12090107, at outlet structure for irrigation canal just upstream fran right end of dam on Pecan Bayou, 0.2 mi (0.4 km) downstream from Jim Ned Creek, 8 mi (13 km) north of Brownwood, and 57.1 mi (91.9 km) upstream from mouth.
DRAINAGE AREA.--1,535 mP (3,976 km 2 ).
PERIOD OF RECORD.--July 1933 to June 1934, April 1935 to September 1940, November 1944 to August 1978. Prior to October 1970, pub-1 i shed as Brownwood Reservoir.
GAGE.--Nonrecording gage read once daily. Datum of gage is 0.50 ft (0.152 m) below National Geodetic Vertical Datum of 1929. Prior to November 1944, nonrecording gages or water-stage recorder at various sites at dam at same datum.
REMARKS.--The lake is formed by a rolled earthfill dam, 1,580 ft (482 m) long. The dam was completed in 1933 and deliberate impoundment began in July 1933. Capacity table is based on 1959 survey. The uncontrolled spillway is a broad-crested weir 479 ft (146m) long located 800ft (240m) to the left of dam. The controlled spillway consists of two 12-foot (4 m) horseshoe-shaped concrete conduits. Water is released into Brown County canal through a 5-foot (2 m) circular conduit that is controlled by a slide gate in a service structure located near the right end of dam. Water is used for irrigation and for municipal and industrial supply by the city of Brownwood (see station 08142500). Flow is affected at times by discharge from flood-detention pools of 59 floodwater-retarding structures with combined capacity of 73,310 acre-ft (90.4 hm 3 ). These structures control runoff from 353 mP (914 km 2 ) in the Jim Ned Creek and Pecan Bayou drainage basins. Figures given herein represent total contents. Data regarding the dam and lake are given in the following table:
Capaclty (acre-feet)
Gage height (feet)
Top of dam ••••••••••••••••••••••••••••••••••••••••••••••••••••••••••••••••• Crest of spillway ••••••••••••••.•••••••••••••••••••••••••••••••••••••••••••
1,450.0 1,425.1 1,406.0 1,330.0
143,400 46,510 Lowest gated outlet to irrigation canal (invert) .......................... .
Lowest gated outlet (invert) •••••••••••••••••••••••••••••••••••••••••••••••
COOPERATION .--Capacity table furnished by Corps of Engineers and Soil Conservation Service.
MAXIMA (at 1800): FOR AUGUST 1978.--Contents, 138,500 acre-ft (171 hm 3 ) Aug. 16-24, 29, 30, 1978, gage height, 1,424.4 ft (434.16 m).
DAY
1 •••• 2 •••• 3 .••• 4 •••• 5 •••• 6 •••• 7 ••••
FOR PERIOD 1933 to July 1978.--Maximum contents, 192,300 acre-ft (237 hm 3 ) May 2, 1956, gage height, 1,431.4 ft (436.29 m).
CONTENTS
59,500 59,120 62,980 79,880
100,700 110,300 116,300
DAY
CONTENTS, IN ACRE-FEET, AUGUST 1978 INSTANTANEOUS OBSERVATIONS AT 1800
CONTENTS DAY CONTENTS DAY CONTENTS
8.\.. 121,700 16... 138,500 24... 138,500 9.... 126,600 17... 138,500 25... 137,800 10... 130,800 18... 138,500 26... 137,800 11... 132,900 19... 138,500 27.. 137,800 12... 135,000 20... 138,500 28... 137,800 13... 137,100 21... 138,500 29... 138,500 14... 137,800 22... 138,500 30... 138,500 15... 137,800 23... 138,500 31... 138,500
-----------------------------------------------------------------------------------------------CHANGE IN CONTENTS, IN ACRE-FEET................................................ 79,000
-85-

COLORADO RIVER BAS IN
{50) 08143500 PECAN BAYOU AT BROWNWOOD, •TX
LOCATION.--Lat 31°43'54", long 98°58'25", Brown County, Hydrologic Unit 12090107, on right bank at Brownwood, 502ft {153m) upstream fran city dam, 6.3 mi {10.1 km) downstream from Salt Creek, 10 mi (16 km) downstream from Lake Brownwood, and 47.5 mi {76.4 km} upstream from mouth.
DRAINAGE AREA.--1,614 mP {4,180 km 2 }.
PERIOD OF RECORD .--May 1917 to June 1918, October 1923 to August 1978.
GAGE.--Water-stage recorder. Datum of gage is 1,318.58 ft {401.903 m) National Geodetic Vertical Datum of 1929. See WSP 1922 for history of changes prior to Apr< 2, 1962.
REMARKS.--Flow regulated by Lake Brownwood (station 08143000}. Brown County Water Improvement District No. 1 canal (station 08142500} diverts water from Lake Brownwood 10 mi {16 km) upstream. Flow from 20.8 mP (53.9 km 2
) above this station and below Lake Brownwood is partly controlled by nine floodwater-retarding structures wit.h a combined detention capacity of 4,720 acre-ft (5.82 hm 3 ). National Weather Service gage-height telemeter at station.
MAXIMA: FOR AUGUST 1978.--Discharge, 47 fP/s {1.33 m3 /s) Aug. 4, 1978, gage height, 1.05 ft {0.320 m). FOR PERIOD 1923 to July 1978.--Maximum discharge, 31,600 ft 3 /s {895 m3 /s) Oct. 14, 1930, gage height, 16.92 ft {5.157 m). HISTORIC.--Maximum stage, 21.7 ft (6.61 m) in September 1900, from information by Gulf, Colorado, and Santa Fe Railway Co.
Flood of July 3, 1932, probably the greatest, reached. a discharge of about 235,000 ft 3 /s {6,660 m3 /s) as it entered Lake Brownwood ( canputed from rate of change of contents in 1 ake; data furnished by engineers of Brown County Water Improvement District No. 1).
MEAN DISCHARGE, IN CUBIC FEET PER SECOND, A~GUST 1978 -oAv ______ oiscHA~GE _______ oAv ______ oiscHA~GE _______ oAv ______ oiscHARGE _______ oAv ______ oiscHARGE-1~~~~------------~oo _____ 8~~~~-----------i~6------i6~~~------------~54 _____ 24~~~------------~oo 3. ••• .oo 9. ••• 1.2 17... .31 25... .00
•••• .00 10... 1.2 18... .19 26... .00 4.... 21 11... 1.1 19... .16 27... .oo ~-··· 6.0 12... .93 20... .10 28... .00
•••• 3.3 13... .82 21... .06 29... .oo 7.... 2.2 14... .77 22... .06 30... .oo
15... .63 23... ,01 31... .00
~oNrHLv-~EAN-oiscHARGE:-iN-t~8ic-~EEr-~E~-sEcoNo---------------------------------------------;MONTHLv TOTAL ACRE-FEET. •••••••••••••••••••••••• :::::::::::::::::::::::::::::::: 8 j: 7
6
Period
August 1978--------------------
1934 to July 1978--------------
21
22,600
Highest mean discharge, in cubic feet per second for the indicated number of consecutive days
-86-
3
10
15,000
5.2
7,820

COLORADO RIVER BASIN
{51) 08143600 PECAN BAYOU NEAR MULLIN, TX
LOCATION.--Lat 31°31'02", long 98°44'25", Mills County, Hydrologic Unit 12090107, on right bank 44ft {13m) downstream from bridge on Farm Road 573, 0.6 mi {1.0 km) downstream from Blanket Creek, 5.5 mi {8.8 km) southwest of Mullin, and 10 mi {16 km) upstream from Colorado River.
DRAINAGE AREA. --2,034 mP { 5, 268 km1 ).
PERIOD OF RECORD.--October 1967 to August 1978.
GAGE.--Water-stage recorder. Datl.lm of gage is 1,202.93 ft {366.653 m) National Geodetic Vertical Datum of 1929.
REMARKS.--Flow is affected by Lake Brownwood 47 mi {76 km) upstream {see station 08143000). Flow from 139 mil {360 km1 ) above this station and below Lake Brownwood is partly controlled by 38 floodwater-retarding structures with a combined detention capacity of 30,690 acre-ft {37.8 hm 3 ) below the flood-spillway crests.
MAXIMA: FOR AUGUST 1978.--Discharge, 1,690 ft 3 /s {47.9 m3 /s) Aug. 3, 1978, gage height, 6.50 ft {1.981 m). FOR PERIOD 1967 to July 1978.--Maximum discharge, 13,700 ft 3 /s {388 m3 /s) Jan. 23, 1968, gage height, 29.26 ft {8.918 m).
MEAN DISCHARGE, IN CUBIC FEET PER SECOND, AUGUST 1978
DAY
1 •••• 2 •••• 3 •••• 4 •••• 5 •••• 6 •••• 7 ••••
DISCHARGE
• 00 .00
958 225
72 32 14
DAY
8 •••• 9 •••• 10 ••• 11 ... 12 ••• 13 ••• 14 ••• 15 •••
DISCHARGE
7.4 5.4 4.0 3.7 3.0 2 .1 1.6 1.4
DAY
16 ••• 17 ••• 18 ••• 19 ••• 20 ••• 21 ••• 22 ••• 23 •••
DISCHARGE
1.4 1.2 1.1 1.1 1.2 1.3
22 6.0
DAY
24 ••• 25 ... 26 ••• 27 ••• 28 ••• 29 ••• 30 ••• 31 •••
MONTHLY MEAN DISCHARGE, IN CUBIC FEET PER SECOND •••••••••••••••••••••••••••••••• MONTHLY TOTAL ACRE-FEET •••••••••••••••• · •••••••••••••••••••••••••••••••••••••••••
Period
August 1978--------------------
1968 to July 1978--------------
958
12,700
Highest mean discharge, in aubic feet per second for the indicated number of consecutive days
-87-
3
418
11,000
188
7,450
DISCHARGE
8.5 7.0 5.3 4.5 3.8
26 23 4.8
46.7 2,870

COLORADO RIVER BASIN
(52) .08144500 SAN SABA RIVER AT MENARD, TX
LOCATION.--Lat 30°55'08", long 99°47'07", Menard County, Hydrologic Unit 12090109, on downstream side of bridge on U.S. Highway 83 in Menard, 1.1 mi (1.8 km) downstream from Las Moras Creek, 1.9 mi (3.1 km) upstream from Volkmann Draw, and 110.4 mi (177.6 km) upstream from mouth.
DRAINAGE AREA.--1,151 mP (2,981 km 2).
PERIOD OF RECORD .--September 1915 to August 1978.
GAGE.--Water-stage recorder. Datum of gage is 1,863.05 ft (567.858 m) National Geodetic Vertical Datum of 1929. Sept. 14, 1915, to Mar. 12, 1924, nonrecording gage at site 635ft (194m) downstream at datum 2.20 ft (0,671 m) lower. Mar. 13, 1924, to Feb. 21, 1939, nonrecording gage at site 1,000 ft (305m) upstream at datum 2.00 ft (0.610 m) higher. Feb. 22, 1939, to Jan. 25, 1940 nonrecording gage at present site and datum. Jan·. 26, 1940, to Sept. 19, 1957, water-stage recorder at site 240ft (73 m) to right at present datum. Feb. 8, 1962, to Jan. 22, 1963, nonrecordi ng gage at site 600 ft (180 m) downstream at present datum.
REMARKS.--Since about 1890, low flow duringf irrigation season regulated by diversions to Noyes Canal 4.5 mi (7.2 km) upstream and diversions by pumping at several locations upstream. Records of the Texas Water Rights Commission show permits have been granted to irrigate 3,338 acres (1,400 hm 2 ) above station.
MAXIMA: FOR AUGUST 1978.--Discharge, 35,400 ftl/s (1,000 m3 /s) Aug. 2, 197B, gage height, 17.36 ft (5.291 m). ·FOR PERIOD 1915 to July 1978.--Maximum discharge, 130,000 ft 3 /s (3,680 m3 /s) July 23, 1938, gage height, 22.2 ft (6.77 m),
present site and datum, from floodmark, from rating curve extended above 56,000 ft 3 /s (1,590 m3 /s) on basis of slope-area measurement of peak flow.
HISTORIC.--Maximum stage since at least 1880, 23.3 ft (7.10 m) June 6, 1899, present site and datum, from information by local resident.
MEAN DISCHARGE, IN CUBIC FEET PER SECOND, AUGUST 1978 -o;v ______ oiscHA~GE-------~;v ______ oiscHA~GE-------~;v ______ oiscHA~GE _______ oAv ______ oiscHA~GE-i~~~~----------25 ________ 8~~~~------.----97 ________ 16~~~----------54 ________ 24~~~----------;;---2.... 5,240 9.... 97 17... 49 25... 38 3.... 5,460 10... 87 18... 46 26... 38 4.... 315 11... 82 19 •• ~ 42 27... 40 5.... 151 12... 210 20... 40 28... 44 6. ••• 113 13. •• 250 21. •• 39 29. •• 51 7.... 103 14... 111 22:.. 41 30... 47
15... 76 23... 36 31... 45
MoNrHL;-MEAN-orscHA~GE:-rN-cusic-;EEr-PE~-sEcoNo~::~:::::::::::::::::::::::::::~-----~---423 __ _ MONTHLY TOTAL ACRE-FEET •••••••.••••••••••••••••••••••••••••• ,, ••••••••••••• ,, •• ,, 26,000 RUNOFF, IN INCHES............................................................... .42
-----------------------------------------------------------------------------------------------
Gage height, in feet, and discharge, in cubic feet per second, at indicated time, 1978
Date Hour Gage Discharge height
Aug. 2 - 0500 3.63 26 1745 3.83 44 1800 8.06 2,240 1845 9.16 3,780 1900 10.41 5,870 1930 12.58 10,500 2000 13.69. 14,200 2200 16.57 29,700 2230 17.14 33,700 2300 17.36 35,400
Period
August 1978--------------------
1917 to July 1978--------------
Date Hour Gage Discharge Date Hour Gage Discharge height height
Aug. 2 - 2330 17.09 33,300 Aug. 3 - 1300 7.42 2400 16.34 28,100 1700 6.61
2400 5.96 Aug. 3 - 0100 14.43 17,400
0300 12.48 11 '100 Aug. 4 - 1200 5.45 0500 12.89 12,200 2400 5.08 0600 12.37 10,900 0900 9.39 5,470 Aug. 5 - 1200 4.89 1100 8.23 3,210 2400 4.77
Highest mean discharge, in cubic feet per second for the indicated number of consecutive days
3 7
5,460
53,300
-88-
3,670
41 ,200
1,640
22,400
1,840 958 526
304 190
147 124

COLORADO RIVER BAS IN
(53) 08144800 BRADY CREEK NEAR EDEN, TX
LOCATION.--Lat 31°ll'05", long 99°50'29", Concho County, Hydrologic Unit 12090ll0, on right bank at upstream side of bridge on U.S. Highway 83, 0.8 mi (1.3 km) downstream from Fitzgerald Creek, 2.2 mi (3.5 km) south of Eden, 2.4-mi (3.9 km) upstream from Hardin Branch, and 69.3 mi (1ll.5 km) upstream from mouth.
DRAINAGE AREA.--97 mP (251 km1).
PERIOD OF RECORD.--April 1962 to August 1978.
GAGE.--Water-stage recorder. Datum of gage is 2,000.99 ft (609.902 m) National Geodetic Vertical Datum of 1929.
REMARKS.--Flow is affected at times by discharge frcm the flood-detention pools of five floodwater-retarding structures with comhi ned detention capacity of 22,190 acre-ft (27 .4 hm 3 ). These structures control runoff from 65.0 mP (168.4 km1
) above this station.
MAXIMA: FOR AUGUST 1978.--Discharge, 2.1 ft 3 /s (0.059 m3 /s) Aug. 3, 1978, gage height, 1.30 ft (0.396 m). FOR PERIOD 1962 to July 1978.--Maximum discharge, 5,110 ft 3 /s (145 m3 /s) Apr. 28, 1966, gage height, 7.08 ft (2.158 m). HISTORIC.--Maximum stage since at least 1884, 15.8 ft (4.82 m) in July 1938, from information by local resident.
MEAN DISCHARGE, IN CUBIC FEET PER SECOND, AUGUST 1978 -----------------------------------------------------------------------------------------------
DAY DISCHARGE DAY DISCHARGE DAY DISCHARGE DAY DISCHARGE
1 •••• • 16 8 •••• .71 16 ••• .19 24 ••• .18 2 •••• .73 9 •••• • 57 17 ••• • 15 25 ••• .17 3 •••• 1.7 10 ••• .53 18 ••• .19 26 ••• • 21 4 •••• 1.0 11. •• .42 19 ••• • 19 27 ••• .22 5 •••• .71 12 ••• .47 20 ••• .23 28 ••• .22 6 •••• .98 13 ••• .51 21 ••• • 18 29 ••• .22 7 •••• .93 14 ••• .36 22 ••• • 16 30 ••• .17
15 ••• .35 23 ••• • 17 31. •• .13 -----------------------------------------------------------------------------------------------MONTHLY MEAN DISCHARGE, IN CUBIC FEET PER SECOND................................ .42 MONTHLY TOTAL ACRE-FEET......................................................... 26.0 RUNOFF, IN INCHES............................................................... .01
Period
August 1978--------------------
1963 to July 1978--------------
Highest mean discharge, in cubic feet per second for the indicated number of consecutive days
1.7
485
-89-
3
1.1
254
1.0
111

COLORADO Rl VER BAS IN
(54) 08144900 BRADY CREEK RESERVOIR NEAR BRADY, TX
LOCATION.--Lat 31°08'17", long 99°23'07", McCulloch County, Hydrologic Unit 12090110, at mouth of Bear Creek on Brady Creek, 280ft (85 m) upstream from Farm Road 3022 over Brady Creek Dam, 3.0 mi (4.8 km) west of Brady, and 34.1 mi (54.9 km) upstream from mouth.
ORAl NAGE AREA.--513 mP (1 ,329 km 2 ).
PERIOD OF RECORD.--May 1963 to August 1978.
GAGE.--Water-stage recorder. Datum of gage is National Geodetic Vertical Datum of 1929.
REMARKS.--The reservoir is formed by a compacted earthfill dam 8,400 ft (2,560 m) long. The dam was completed and storage began in May 1963. The dam was built by the city of Brady in cooperation with the Soil Conservation Service and the Farmers Home Administration for flood control, municipal, and industrial water supply. The spillway is a cut channel through natural ground 1,000 ft (305m) wide located at right end of dam. The top of conservation pool is an uncontrolled concrete drop-inlet structure that discharges through a 7.0- by 7.0-foot (2.1 by 2.1 m) concrete box conduit and is designed to discharge 4,000 ft 3 /s (113 m3 /s) at a 19.4-foot (5.9 m) head. The gated outlet is a 36-inch (915 mm) pipe that extends through the embankment and is equipped with three s 1 uice gates for contra ll ed re 1 eases downstream. Flow into reservoir is affected at times by discharge from the flooddetention pools of 35 floodwater-retarding structures with combined detention capacity of 82,180 acre-ft (101 hm 3 ). These structures were built during the period February 1955 to July 1962 and control runoff from 263 mP (681 km 2
) in the Brady Creek watershed above this station. Capacity curve is based on Geological Survey topographic map (1960 edition) and was not adjusted for borrow. Figures given herein represent total contents. Data regarding the dam and reservoir are given in the following table:
Top of dam ••••••••••••••••••••••••••••••••••••••••••••••••••••••••••••••••• Crest of spillway •••••••••••••••••••••••••••••••••••••••••••••••••••••• ··•. Crest of spillway (top of conservation pool) ••••••••••••••••••••••••••••••• Lowest gated outlet (invert) •••••••••••••••••••••••••••••••••••••••••••••••
COOPERATION .--Capacity curve furnished by the city of Brady.
Elevation Capacity (feet6 (acre..:feet)
1,7$3. 1,762.4 1,743.0 1,712.0
90,310 30,430
1,320
MAXIMA: FOR AUGUST 1978.--Contents, 21,570 acre-ft (26.6 hm 3 ) Aug. 3, 1978, elevation, 1,738.12 ft (529.779 m). FOR PERIOD 1963 to July 1978.--Maximum contents, 40,880 acre-ft (50.4 hm 3 ) Sept. 24, 1971, elevation, 1,747.70 ft (532.669
m).
DAY
1 •••• 2 •••• 3 •••• 4. · ••• 5 •••• 6 •••• 7 ••••
CONTENTS
19,970 21,180 21,570 21,570 21,540 21,550 21,540
DAY
8 •••• 9 •••• 10 ••• 11 ••• 12 ••• 13 ••• 14 ••• 15 •••
CONTENTS, IN ACRE-FEET, AUGUST 1978 INSTANTANEOUS OBSERVATIONS AT 240a
CONTENTS
21,500 21.,490 21 ,450 21 ,440 21 ,400 21 ,350 21 ,320 21 ,280
DAY
16 ••• 1 7 ••• 18 ••• 19 ••• 20 ••• 21 ••• 22 ••• 23 •••
CONTENTS
21 ,230 21,1.80 21,150 21,120 21 ,090 21 ,040 21 ,010 20,980
DAY
24 ••• 2 5 ••• 26 ••• 2 7 •• 28 ••• 29 ••• 30 ••• 31 •••
CHANGE IN CONTENTS, IN ACRE-FEET ••••••••••••••••••••••••••••••••••••••••••••••••
-90-
CONTENTS
20,950 20,920 20,870 20,840 20,780 20,810 20,790 20,790
810

COLORADO RIVER BASIN
(55) 08145000 BRADY CREEK AT BRADY, TX
LOCATION.--Lat 31 °08'17", long 99°20'05", McCulloch County, Hydrologic Unit 12090110, on left bank just upstream from bridge on U.S. Highway 377 on North Bridge Street in Brady, 0.4 mi (0.6 km) downstream from Live Oak Creek, and 29.5 mi (47.5 km) upstream from mouth.
ORAl NAGE AREA. --57 5 mP ( 1, 489 km1 ).
PERIOD OF RECORD.--Ma,y 1939 to August 1978.
GAGE.--Water-stage recorder. Datum of gage is 1,646.50 ft (501.853 m) National Geodetic Vertical Datum of 1929. Prior to July 9, 1940, nonrecording gage at site 3,600 ft (1,100 m) upstream at datum 8.24 ft (2.512 m) higher.
REMARKS.--The city of Brady, \'11 i ch obtains its water supply from ground-water sources, reported that 505 acre-ft ( 623,000 m3 ) of sewage effluent was returned to Brady Creek downstream from the gage during the current year. Flow largely controled since May 22, 1962, by Brady Creek Reservoir (station 08144900). Flow from 24.2 mP (62.7 km1 ) above this station and below Brady Creek Reservoir is partly controlled by six floodwater-retarding structures with a combined capacity of 6,440 acre-ft (7.94 hm 3
) below flood-spillway crests.
MAXIMA: FOR AUGUST 1978.--Discharge, 536 ft 3 /s (15.2 m3 /s) Aug. 2, 1978, gage height, 8.31 ft (2.533 m). FOR PERIOD 1939 to July 1978.--Maximum discharge, 39,100 ft 3 /s (1,110 m3 /s) Sept. 10, 1952, gage height, 24.80 ft (7.559
m). HISTORIC.--Maximum stage since at least 1882, 29.1 ft (8.87 m) July 23, 1938, present site and datum, discharge at site
5 mi (8 km) downstream, 86,000 ft 3 /s (2,440 m3 /s) by slope-area measurement. Flood of Oct. 6, 1930 (second highest since 1882), reached a stage of 25.9 ft (7.89 m), discharge 50,300 ftl/s (1,420 m3 /s), present site and datum, from information by local residents.
MEAN DISCHARGE, IN CUBIC FEET PER SECOND, AUGUST 1978
DAY DISCHARGE DAY DISCHARGE DAY DISCHARGE DAY
1 •••• .00 8 •••• 1. 2- 16 ••• .04 24 ••• 2 •••• 153 9 •••• • 53 17 ••• • 03 25 ••• 3 •••• 261 10 ••• • 29 18 ••• .02 26 ••• 4 •••• 36 11 ••• • 18 19 ••• .02 27 ••• 5 •••• 16 12 ••• • 13 20 ••• .02 28 ••• 6 •••• 5.8 13 ••• .10 21. •• • 02 29 ••• 7 •••• 2.8 14 ••• .07 22 ••• .02 30 •••
15 ••• .05 23 ••• • 02 31 •••
MONTHLY MEAN DISCHARGE, IN CUBIC FEET PER SECOND •••••••••••••••••••••••••••••••• MONTHLY TOTAL ACRE-FEET •••••••••••••••••••••••••••••••••••••••••••••••••••••••••
Period
August 1978--------------------
1940 to July 1978--------------
Highest mean disaharge, in aubia feet per seaond for the indiaated number of aonseautive days
261
21,100
-91-
3
150
9,450
68
4,160
DISCHARGE
.02
.02
.02
.01
.34 2.5
.35
.12
15.5 954

COLORADO RIVER BASIN
{56) 08146000 SAN SABA RIVER AT SAN SABA, TX
LOCATION.--Lat 31°12'47", long 98°43'09", San Saba County County, Hydrologic Unit 12090109, on right bank at downstream side of bridge on State Highway 16, 1.2 mi {1.9 km) north of San Saba, 2.7 mi (4.3 km) upstream from Mill Creek, 4.8 mi {7.7 km) downstream from China Creek, and 16.6 mi {26.7 km) upstream form mouth.
DRAINAGE AREA.--3,042 mP (7 ,879 km 2 ).
PERIOD OF RECORD.--December 1904 to December 1906 (gage heights only), September 1915 to August 1978. Published as "near San Saba" December 1904 to December 1906 and September 1915 to August 1930.
GAGE.--Water-stage recorder. Datum of gage is 1,162.16 ft {354.226 m) National Geodetic Vertical Datum of 1929. See WSP 1922 for history of changes prior to July 8, 1953. Since Oct. 1, 1956, supplementary water-stage recorder 2,780 ft {847 m) to right of main-channel gage used for floodflows. ·
REMARKS.--Many diversions above station for. irrigation and municipal use affect low flow; Flow partly affected by Brady Creek Reservoir (see station 08144900), capacity 90,300 acre-ft {111 hm 3 ).
MAXIMA: FOR AUGUST 1978.--Discharge, 27,000 ft 3 /s (765 m3 /s) Aug. 3, 1978, gage height, 28.38 ft (8.650 m). FOR PERIOD 1915 to July 1978.--Maximum discharge, 203,000 ftl/s (5,750 m3 /s) July 23, 1938, gage height, 39.3 ft {11.98 m),
present site and datum, from rating curve extended above 41,000 ft 3 /s {1,160 m3 /s) on basis of slope-area measurement of peak flow.
HISTORIC.--Maximum stage since at least 1899, that of July 23, 1938. Flood of June 6, 1899, reached a stage of 36.7 ft (11.19 m), present site and datum, from information by by local resident. ·
MEAN DISCHARGE, IN CUBIC FEET PER SECOND, AUGUST 1978
DAY DISCHARGE DAY DISCHARGE DAY DISCHARGE DAY DISCHARGE -----------------------------------------------------------------------------------------------1 •••• 21 8 •••• 376 16 ••• 264 24 ••• 2 •••• 34 9 •••• 298 17 ••• 213 25 ••• 3 •••• 8,620 10 ••• 256 18 ••• 183 26 ••• 4 •••• 8,520 11. •• 242 19 ••• 160 27 •• 5 •••• 1 '020 12 ••• 261 20 ••• 148 28 ••• 6 •••• 601 13 ••• 212 21 ••• 142 29 ••• 7 •••• 470 14 ••• 295 22 ••• 140 30 •••
15 ••• 367 23 ••• 141 31 •••
MONTHLY MEAN DISCHARGE, IN CUBIC FEET PER SECOND •••••••••••••••••••••••••••••••• MONTHLY TOTAL ACRE-FEET ••••••••••••••••••••••••••••••••••••••••••••••••••••••••• · RUNOFF, IN INCHES ••••••••••••••••••••••••••••••••• · ••••••••••••••••••••••••••••••
Period
August 1978
1917 to July 1978--------------
Highest mean discharge, in cubic feet per second for the indicated number of consecutive days
8,620
117,000
-92-
3
6,050
99,200
2,840
51 ,700
136 127 124
124 117 126 148 134
775 47,600
.29

COLORADO RIVER BASIN
{57) 08147000 COLORADO RIVER NEAR SAN SABA, TX
LOCATION.--Lat 31°13'04", long 98°33'51", San Saba-Lampasas County, Hydrologic Unit 12090201, near left bank at downstream side of pier of bridge on U.S. Highway 190, 5.2 mi {8.4 km) dowstream from San Saba River, 9.2 mi {14.8 km) east of San Saba, and at mile 474.3 {763.1 km).
DRAINAGE AREA.--30,600 mP {79,250 km1 ), approximately, of which 12,880 mil {33,360 km1 ) probably is noncontributing.
PERIOD OF RECORD.--October 1915 to October 1922 {published as "near Chadwick") October 1923 to August 1930 {published as "nea!" Tow"), September 1930 to August 1978. Monthly discharge only for some periods, published in WSP 1312.
GAGE.--Water-stage recorder. Datum of gage is 1,096.22 ft {334.128 m) National Geodetic Vertical Datum of 1929. See WSP 1922 for history of changes prior to May 23, 1940.
REMARKS.--Many diversion above station for irrigation, municipal use, and oilfield operation. Flow is affected by f.:>ur reservoirs upstream from Winchell and one reservoir in the San Saba River and Pecan Bayou basins; combined capacity, 1,973,000 acre-ft {2.43 km 3 ). Flow is affected at times by discharge from the flood-detention pools of 181 floodwater-retarding structures with combined detention capacity of 194,770 acre-ft {240 hm 3 ). These structures control runoff from 891 mP {2,308 km 1 ).
MAXIMA: FOR AUGUST 1978.--Discharge, 28,100 ft 3 /s {796 m3 /s) Aug. 4, 1978, gage height, 22.59 ft {6.685 m). FOR PERIOD 1930 to July 1978.--Maximum discharge, 224,000 ft 3 /s {6,340 m3 /s) July 23, 1938, gage height, 63.2 ft {19.26 m),
present site, based on floodmarks at site then in use. HISTORIC.--Maximum stage during period 1878 to July 22, 1938, 58.4 ft {17.80 m) Sept. 25, 1900, discharge, 184,000 ftl/s
{5,210 m3 /s), present site, fran floodmarks at former site.
DAY
1 •••• 2 •••• 3 •••• 4 •••• 5 •••• 6 •••• 7 ••••
DISCHARGE
30 41
3,020 19,700 11,400 17,700 9,060
MEAN DISCHARGE, IN CUBIC FEET PER SECOND, AUGUST 1978
DAY
8 •••• 9 •••• 10 ••• 11. •. 12 ••• 13 ••• 14 ••• 15 •••
DISCHARGE
1,820 1, 160
836 635 547 439 357 520
DAY
16 ••• 17 ••• 18 ••• 19 ••• 20 ••• 21 ••• 22 ••• 23 •••
DISCHARGE
393 307 266 224 198 178 167 156
DAY
24 ••• 25 ••• 26 ••• 27 ••• 28 ••• 29 ••• 30 ••• 31 •••
MONTHLY MEAN DISCHARGE, IN CUBIC FEET PER SECOND •••••••••••••••••••••••••••••••• MONTHLY TOTAL ACRE-FEET •••••••••••••••••••••••••••• ~ ••••••••••••••••••••••••••••
Period
DISCHARGE
150 143 130 127 124 121 127 162
2,270 139,000
Highest mean discharge, in cubic feet per second for the indicated number of consecutive days
3 7
August 1978--------------------
1931 to July 1978--------------
19,700
191 ,000
-93-
16,300
184,000
7,950
130,000

COLORADO RIVER BASIN
(58) 08148000 LAKE BUCHANAN NEAR BURNET, TX
LOCATION.--Lat 30°45'04", long 98°25'06", Burnet County, Hydrologic Unit 12090201, in powerhouse at Buchanan Dam on Colorado River, 1.3 mi (2.1 km) upstream fran bridge on State Highway 29, 11 mi (18 km) west of Burnet, and at mile 413.6 (665.6 km).
DRAINAGE AREA.--31,250 mil (80,940 km2 ), approximately, of which 12,880 mil (33,360 km 2 ) probably is noncontributing.
PERIOD OF RECORD.--May 1937 to August 1978. Prior to Oct. 1, 1968, published as Buchanan Reservoir.
GAGE.--Nonrecording gage. Datum of gage is 0.48 ft (0.146 m) National Geodetic Vertical Datum of 1929 (levels by Lower Colorado River Authority). Prior to July 1938, temporary staff and float gages at same site and datum.
REMARKS.--The lake is formed by two reinforced concrete multiple-arch sections, three banks of tainter gates, a 1,100-foot (335m) uncontrolled concrete spillway section, and natural ground. A net opening of 1,270 ft (387m) is controlled by thirty 33- by 15-foot (10 by 5 m) and by seven 40- by 15-foot (12 by 5 m) tainter gates. The dam was canpleted and storage began May 20, 1937. Water is used for power development and for irrigation below Columbus. The power generating features consist of three generating units, each with a 12,677 kilowatt capacity. A pump-back unit (capacity, 840 ft 3 /s or 23.8 m3 /s) returns water from Inks Lake to Lake Buchanan during off-peak power demand periods. Inflow is largely regulated by twelve major reservoirs· with a combined capacity of 2,438,000 acre-ft (3.01 km 3 ), of which 1,091,000 acre-ft (1.35 km 3 ) is for flood control. For statement regarding regulation by Soil Conservation Service floodwater-retarding structures, see Colorado River near San Saba (station 08147000). The capacity table is based on a 1925 survey. Figures given herein represent total contents. Data regarding the dam and lake are given in the following table: ··
Top of dam ••••••••••••••••••••••••••••••••••••••••••••••••••••••••••••••••• Crest of gravity overflow spill way (top of conservation storage) ••••••••••• Crest of spillway (15-foot gates) •••••••••••••••••••••••••••••••••••••••••• Crest of spillway (25-foot gates) •••••••••••••••••••••••••••••••••••••••••• Invert of three 12-foot-di ameter penstocks ................................ .
COOPERATION.--Gage-height record furnished by Lower Colorado River Authority.
Gage height (feet)
Capac1ty (acre-feet)
992,000 678,000 505,000
36,800
MAXIMA (at 2400): FOR AUGUST 1978.--Contents, 814,700 acre-ft (1,000 hm 3 ) Aug. 8, 1978, gage height, 1,011.94 ft (308.439 m).
DAY
1 ..•. 2 •••• 3 •••• 4 •••• 5 •••• 6 •••• 7 ••••
FOR PERIOD 1937 to July 1978.--Maximum contents, 1,010,000 acre-ft (1.25 km 3 ) Jan. 24, 1968, gage height, 1,020.8 ft (311.14 m).
CONTENTS
698,900 700,800 700,800 733,100 755,000 787,000 811 ,800
DAY
8 •••• 9 •••• 10 ••• 11 •.• 12 ... 13 ••• 14 ... 15 •••
CONTENTS, IN ACRE-FEET, AUGUST 1978 INSTANTANEOUS OBSERVATIONS AT 2400
CONTENTS
813,900 813,900 813,900 811 ,800 807,600 801,300 799,200 795,000
DAY
16 ••• 17 .. . 18 .. . 19 ••• 20 ••• 21 .. . 22 .. . 23 •••
CONTENTS
791 ,000 787,000 783,000 779,000 775,000 773,000 769,000 765,000
DAY
24 ... 2 5 ••• 26 ••• 27 .. 28 ••• 29 ••• 30 ••• 31 •••
CONTENTS
761 ,000 757,000 757,000 755,000 751 ,000 751 ,000 751 ,000 751 ,000
CHANGE IN CONTENTS, IN ACRE-FEET •••••••••••••••••••••••••••••••••••••••••••••••• 52,100
~94-

COLORADO RIVER BASIN
(60) 08148500 NORTH LLANO RIVER NEAR JUNCTION, TX
LOCATION.--Lat 30°31'06", long 99°48'39", Kimble County, Hydrologic Unit 12090202, on left bank 1,000 ft (305m) upstream from remains of old Wilson Dam, 2.1 mi (3.4 km) northwest of Junction, and 4.1 mi (6.6 km) upstream fran confluence with South Llano River.
DRAINAGE AREA.--914 mil (2,367 km1 ).
PERIOD OF RECORD.--September 1915 to September 1977, August 1978.
GAGE.--Water-stage recorder. Datum of gage is 1,699.92 ft (518.136 m) National Geodetic Vertical Datum of 1929. Prior to Aug. 1, 1925, nonrecording gage at site 550ft (168m) downstream at same datum. Aug. 1, 1925, to Sept. 15, 1936, water-stage recorder 520ft (158m) downstream at same datum. Sept. 16, 1936, to June 22, 1940, nonrecording gages at various sites at same datum.
REMARKS.--Diversions for irrigation of about 500 acres (202 hm 1 ) will materially affect low flow.
MAXIMA: FOR AUGUST 1978.--Discharge, 64,800 ft 3 /s (1,840.m 3 /s) Aug. 2, 1978, gage height, 23.50 ft (7.163 m). FOR PERIOD 1915 to 1977.--Maximum discharge, 94,800 ft 3 /s (2,680 m3 /s) Sept. 16, 1936, gage height, 29.2 ft (8.90 m),
present site, based on gage-height relation curve, from rating curve extended above 68,000 ft 3 /s (1,930 m3 /s) on basis of slope-area measurement of peak flow.
HISTORIC.--Maximum stage since at least 1875, that of Sept. 16, 1936; maximum stage during period 1875 to Sept. 15, 1936, 27 ft (8.2 m) in 1889, fran information by local resident.
-95-

COLORADO Rl VER BAS IN
(61) 08150000 LLANO RIVER NEAR JUNCTION, TX
LOCATION.--Lat 30.0 29'45", long 99°43'19", Kimble County, Hydrologic Unit 12090204, on right bank 600ft (180m) north of Farm Road 2169, 1.4 mi (2.3 km) east of Junction, 3.6 mi (5.8 km) downstream fran bridge on Interstate Highway 10, 3.9 mi (6.3 km) downstream from confluence of North and South Llano Rivers, 4.3 mi (6.9 km) upstream from Johnson Fork, and 106.7 mi (171.7 km) upstream fran mouth.
DRAINAGE AREA.--1,874 mil (4,854 km2 ).
PERIOD OF RECORD.--September 1915 to August 1978.
GAGE.--Water-stage recorder. Datum of gage is 1,630.32 ft (496.922 m) National Geodetic Vertical Datum of 1929. Prior to Aug. 14, 1925, nonrecording gage, and Aug. 14, 1925, to May 17, 1940, water-stage recorder at present site and datum. May 18, 1940, to Aug. 17, 1944, water-stage· recorder at site 5,330 ft (1,620 m) upstream at datum 6.0 ft (1.83 m) higher. Since Aug. 18, 1944, gage at site 5,330 ft (1,620 m) upstream has been used as a supplementary gage.
R~MARKS.--Diversions above station for irrigation
MAXIMA: FOR AUGUST 1978.--Discharge, 76,700 ft 3 /s (2,170 m3 /s) Aug. 2, 1978, gage height, 22.14 ft (6.748 m). FOR PERIOD 1915 to July 1978.--Maximum discharge, 319,000 ft 3 /s (9,030 m3 /s) June 14, 1935, gage height, 43.3 ft (13.20 m)
at regular gage, '41.4 ft (12.62 m) at supplementary gage, from floodmarks, from curve extended above .54,000 ftl/s (1,530 m3 /s) on basis of slope-area rating measurements of 154,000 and 319,000 ft 3 /s (4,360 and 9,030 m3 /s).
HISTORIC.--Maximum stage since at least 1875, that of June 14, 1935. There was a major flood in 1889 which was the highest known prior to June 14, 1935.
MEAN DISCHARGE, IN CUBIC FEET PER SECOND, AUGUST 1978 -nAv ______ oi~cH;RGE _______ oAv ______ oi~cHARGE _______ oAv ______ ni~cHARGE _______ oAv ______ ni~cHARGE-i::::----------93 ________ 8::::---------2oo ________ i6:::---------i34 ________ 24:::---------ii2 __ _ 2.... 14,800 9.... 173 17... 131 25... 111 3.... 6,030 10... 160 18... 128 26... 109 4.... 610 11... 177 19... 124 27... 108 5.... 338 12... 172 20... 123 28... 107 6.... 258 13... 151 21... 120 29... 113 7. ••• 226 14... 143 22... 116 30... 115
15... 138 23... 113 31... 118 -----------------------------------------------------------------------------------------------MONTHLY MEAN DISCHARGE, IN CUBIC FEET PER SECOND................................ 824 MONTHLY TOTAL ACRE-FEET......................................................... 50,700 RUNOFF, IN INCHES............................................................... • 51
Gage height, in feet, and disahar'ge, in aubia feet per seaond, at indiaated time, 19 7 8
Date Hour Gage Discharge height
Aug. 2 - 0200 1.38 94 1200 1.51 132 1400 1.54 141 1430 12.68 27,600 1500 15.95 42,500 1600 20.56 67,400 1630 22.14 76,700 1700 21.76 74,400 1800 18.29 54,800
Period
August 1978--------------------
1917 to July 1978--------------
Date Hour Gage Discharge Date Hour Gage height height
Aug. 2 - 1900 12.40 26,600 Aug. 3 - 0200 9.17 2000 7.63 10,200 0400 7.13 2100 6.08 6,440 1000 5.56 2130 8.95 13,900 1400 4.07 2200 11.11 21,400 1800 3.30 2300 12.97 28,900 2400 2.72 2400 13.43 30,900
Aug. 4 - 1200 2.26 Aug. 3 - 0100 11.92 24,600 2400 2.05
Highest mean disaharge, in aubia feet per seaond for the indiaated number of aonseautive days
14,800
124,000
-96-
3
7,150
47,700
3,210
21 ,200
Discharge
14,600 8,870 5,330 2,620 1 ,550
956
574 427

COLORADO RIVER BASIN
(62) 08150700 LLANO RIVER NEAR MASON, TX
LOCATION.--Lat 30°39'35", long 99°06'29", Mason County, Hydrologic Unit 12090204, on right bank 98ft (30m) downstream from downstream bridge on U.S. Highway 87, 1.0 mi (1.6 km) upstream from Beaver Creek, 9.1 mi (14.6 km) southeast of Mason, 10.2 mi (16.4 km) downstream from James River, and 54.5 mi (87.7 km) upstream from mouth.
DRAINAGE AREA.--3,280 mil (8,500 km1 ),
PERIOD OF RECORD.--March 1968 to August 1978.
GAGE.--Water-stage recorder. Datum of gage is 1,230.36 ft (375.014 m) National Geodetic Vertical Datum of 1929. Prior to Jan. 19, 1971, at site 190 ft (58 m) upstream at same datum.
MAXIMA: FOR AUGUST 1978.--Discharge, 92,500 ft 3 /s (2,620 m3 /s) Aug. 3, 1978, gage height, 21.35 ft (6.507 m). FOR PERIOD 1968 to July 1978.--Maximum discharge, 151,000 ft 3 /s (4,280 m3 /s) Oct. 13, 1973, gage height, 26.30 ft (8.016
m), from rating curve extended above 59,000 ft 3 /s (1,670 m3 /s) on basis of slope-area measurement of peak flow. HISTORIC.--Maximum flood since at least 1875 occurred June 14, 1935, discharge 388,000 ft 3 /s (11,000 m3 /s), by slope
area measurement of peak flow at site 17.0 mi (27 .4 km) downstream.
DAY
1 •••• 2 •••• 3 •••• 4 •••• 5 •••• 6 •••• 7 ••••
DISCHARGE
95 4,430
30,300 2,240
947 647 526
MEAN DISCHARGE, IN CUBIC FEET PER SECOND, AUGUST 1978
DAY
8 •••• 9 •••• 10 ••• 11 ... 12 ••• 13 ... 14 ••• 15 •••
DISCHARGE
362 295 255 221 201 188 177 155
DAY
16 ••• 17 ••• 18 ••• 19 ••• 20 ••• 21 ••• 22 ••• 23 ...
DISCHARGE
138 128 120 115 110 106 105 101
DAY
24 ••• 25 ... 26 ••• 27 ... 28 ••• 29 ••• 30 ••• 31 ...
MONTHLY MEAN DISCHARGE, IN CUBIC FEET PER SECOND •••••••••••••••••••••••••••••••• MONTHLY TOTAL ACRE-FEET ••••••••••••••••••••••••••••••••••••••••••••••••••••••••• RUNOFF, IN INCHES •••••••••••••••••••••••••••••••••••••••••••••••••••••••••••••••
Gage height, in feet, and discharge, in cubic feet per second, at indicated time, 1978
DISCHARGE
95 90 86 85 82 77 75 73
1,380 84,500
.48
Date Hour Gage Discharge Date Hour Gage Discharge Date Hour Gage Discharge height height height
Aug. 2 - 0100 1.68 96 0600 1.87 143 0900 2.19 260 1200 2.81 640 1300 2.91 712 1400 4.13 1,490 1430 4.81 2,270 1500 6.22 4,620 2000 7.61 7,900 2100 7.64 7,980 2200 7.23 6,910 2230 6.86 6,010
Period
August 1978--------------------
1969 to July 1978--------------
Aug. 2 - 2300 10.98 19,900 Aug. 3 - 0800 17.53 2330 15.63 45,100 1200 11.52 2400 17.26 56,600 1800 9.03
2400 6.96 Aug. 3 - 0100 17.67 59,800
0300 14.89 40,400 Aug. 4 - 0400 5.84 0400 14.46 37,700 1200 4.74 0500 16.60 51,700 2400 4.06 0530 19.09 71,500 0600 21.35 92,500 Aug. 5 - 1200 3.41 0630 21.07 89,700 2400 3.17 0700 19.75 77,300
Highest mean discharge, in cubic feet per second for the indicated nwnber of consecutive days
30,300
56,800
-97-
3 7
12,300
28,300
5,640
13,500
38,800 21,100 11,400
5,630
3,370 1,860 1,160
906 749

COLORADO RIVER BASIN
{63) 08150800 BEAVER CREEK NEAR MASON, TX
LOCATION (revised).--Lat 30°38'36", long 99°05'44", Mason County, Hydrologic Unit 12090204, on left bank at upstream side of bridge on U.S. Highway 87, 1.4 mi (2.3 km) upstream from Llano River, 6.4 mi {10.3 km) downstream from Spring Creek, and 11.1 mi (17.9 km) southeast of Mason.
DRAINAGE AREA.--218 mil {565 km 2 ).
PERIOD OF RECORD .--July 1963 to August 1978.
GAGE.--Water-star · r.rder. Datum of gage is 1,253.24 ft {381.988 m) National Geodetic Vertical Datum of 1929. Prior to Aug. 3, 1978, at sit< ' {91 m) upstream at same datum.
REMARKS.--No kno~.... lation or diversion above station.
MAXIMA: FOR AUGUST 1978.--Discharge, 66,900 ft 3 /s {1,890 m3 /s) Aug. 3, 1978, gage .~eight, 24.0 ft (7.315 m). FOR PERIOD 1963 to July 1978.--Maximum discharge, 23,200 ft 3 /s {657 m3 /s) May 16, 1965, gage height, 13.58 ft (4.139 m),
frOTI rating curve extended above 7,400 ft 3 /s (210 m3 /s) on basis of slope-area measurement of 20,100 ft 3 /s {569 m3 /s).
MEAN DISCHARGE, IN CUBIC FEET PER SECOND, AUGUST 1978
DAY DISCHARGE DAY DISCHARGE DAY DISCHARGE DAY DISCHARGE. -----------------------------------------------------------------------------------------------1 •••• .89 8 •••• 22 16 ••• 5.0 24 ••• 2 •••• 616 9 •••• 18 17 ••• 3.4 25 ••• 3 •••• 12,800 10 ••• 16 18 ••• 2.7 26 ••• 4 •••• 73 11 ••• 14 19 ••• 2.5 27 ••• 5 •••• 35 12 ••• 13 20 ••• 2.2 28 ••• 6 •••• 29 13 ••• 11 21 ••• 2 .1 29 ••• 7 •••• 25 14 ••• 9.7 22 ••• 1.9 30 •••
15 ••• 7 .1 23 ••• 1.5 31 •••
MONTHLY MEAN DISCHARGE, IN CUBIC FEET PER SECOND •••••••••••••••••••••••••••••••• MONTHLY TOTAL ACRE-FEET •••••••••••••••••••••••.•••••••••••••••••••••••••••••••••• RUNOFF, IN INCHES •••••••••••••••••••••••••••••••••••••••••••••••••••••••••••••••
Gage height, in feet, a•ui discharge, in cubic feet per aecond, at indicated time, 1978
1.4 1.3 1.2 1.1 1.0 1.4 3.8 3.4
443 27,200
2.34
Date Hour Gage Discharge Date Hour Gage Discharge Date Hour Gage Discharge height height height
Aug. 2 - 0100 1.85 1.2 0300 1.98 3.8 0500 2.10 7. 7 0800 2.30 18 1000 2.72 58 1100 4.54 590 1200 5.54 1,360 1300 6.22 2,310 1500 6.07 2,070 1800 5.07 912 2100 4.23 440
Period
August 1978--------------------
1964 to July 1978--------------
Aug. 2 - 2400 3.76 270 Aug. 3 - 1300 5.97 1400 5.25
Aug. 3 - 0200 3.82 281 1600 4.35 0300 5.29 1 '100 1800 3.76 0400 13.37 23,500 2000 3.35 0500 18.91 43,600 2200 3.03 0600 24.00 66,900 2400 2. 77 070() 20.00 48,200 0900 13.90 25,200 Aug. 4 - 0200 2.56 1100 11.10 16,700 0600 2.28 1200 9.00 10,900 1200 2.00
2400 1.68
Highest mean discharge, in cubic feet per second for the indicated number of consecutive days
12,800
5,040
-98-
3
4,500
2,090
1,940
919
4,060 2,840 1,420
770 470 308 211
151 93 59 40

COLORADO RIVER BASIN
{64) 08151500 LLANO RIVER AT LLANO, TX
LOCATION.--Lat 30°45'10", long 98°40'10", Llano County, Hydrologic Unit 12090204, on right bank in Llano, 0.4 mi {0.6 km) downstream fran bridge on State· Highway 16, 7 mi (11 km) upstream from Little Llana River, and 24.2 mi (38.9 km) upstream from mouth.
DRAINAGE AREA.--4,233 mP {10,963 km1).
PERIOD OF RECORD.--September 1939 to August 1978.
GAGE.--Water-stage recorder. Datum of gage is 970.01 ft (295.659 m) National Geodetic Vertical Datum of 1929.
REMARKS.--Many small diversions above station. Part of low flow of Llano River disappears into various formations, many of which are faulted, between stations near Junction and Llano. National Weather Service gage-height telemeter at station.
MAXIMA: FOR AUGUST 1978.--Discharge, 139,000 ft 3 /s {3,940 m3 /s) Aug. 3, 1978, gage height, 25.61 ft (7.806 m). FOR PERIOD 1939 to July 1978.--Maximum discharge, 232,000 ft 3 /s {6,570 m3 /s) Sept. 10, 1952, gage height, 32.6 ft (9.94 m),
from rating curve extended above 129,000 ft 3 /s (3,650 m3 /s) on basis of slope-area measurement of peak flow. HISTORIC.--Maximum stage since at least 1879, 41.5 ft (12.65 m) June 14, 1935, discharge, 380,000 ft 3 /s (10,800 m3 /s), from
information by local resident.
MEAN DISCHARGE, IN CUBIC FEET PER SECOND, AUGUST 1978
-----------------------------------------------------------------------------------------------DAY DISCHARGE DAY DISCHARGE DAY DISCHARGE DAY DISCHARGE
-----------------------------------------------------------------------------------------------1.... 107 8.... 618 16... 189 24... 115 2. ••• 233 9.... 399 17... 175 25... 105 3.... 54,300 10... 314 18... 161 26... 104 4.... .6,000 11... 268 19... 147 27... 101 5.... 2,090 12... 225 20... 141 28... 101 6.... 1,760 13... 210 21... 141 29... 106 7.... 949 14... 215 22... 132 30... 101
15... 217 23... 117 31... 95
~o~r~Lv-MEAN-oisc~ARGE~-iN-c~aic-FEEr-PER-sEco~o~~~~~~~~~~~~~~~~~~~~~~~~~~~~~::~-------2:26o __ _ MONTHLY TOTAL ACRE-FEET......................................................... 139,000 RUNOFF, IN INCHES............................................................... .61
Gage height, in feet, and discharge, in cubic f,eet per- second, at indicated time, 1978
Date Hour Gage Discharge height
Aug. 2 - 1200 1.93 219 2400 2.38 377
Aug. 3 - 0100 6.05 4,570 0300 7.00 6,560 0400 10.00 15,700 0500 17.60 59,100 0600 21.00 88,400
Period
August 1978--------------------
1941 to July 1978--------------
Date Hour Gage Discharge Date Hour
Gage Discharge height height
Aug. 3 - 0700 24.50 126,000 Aug. 3 - 2400 9.14 0800 25.00 132,000 0900 25.61 139,000 Aug. 4 - 0600 7.63 1000 24.50 126,000 1200 6.92 1200 21.40 92,400 2400 5.93 1500 17.00 54,600 1700 14.20 36,100 Aug. 5 - 1200 5.25 2000 10.65 18,300 2400 4.82
Highest mean discharge, in cubic feet per second for the indicated number of consecutive days
3
54,300 20,800 9,450
54,900 35,500 15,500
-99-
12,600
7,290 5,300 3,100
2,000 1,420

COLORADO RIVER BASIN
(65) 08152000 SANDY CREEK NEAR KINGSLAND, TX
LOCATION.--Lat 30°33'30", long 98°28'19", Llano County, Hydrologic Unit 12090201, on left bank at downstream side of bridge on State Highway 71, 3.9 mi (6.3 km) upstream from Lake Lyndon B. Johnson, and 7.3 mi (11.7 km) south of kingsland.
DRAINAGE AREA.--327 mil (847 km2 ).
PERIOD OF RECORD.--October 1966 to August 1978.
GAGE.--Water-stage recorder. Datum of gage is 862.31 ft (262.832 m) National Geodetic Vertical Datum of 1929.
REMARKS.--Some diversions above station for irrigation, amount unknown.
MAXIMA: FOR AUGUST 1978.--D(scharge, 3,610 ft 3 /s (102 m3 /s) Aug. 2, 1978, gage height, 8.89 ft (2.710 m). FOR PERIOD 1966 to July 1978.--Maximum discharge, 21,200 ftl/s (600 m3 /s) Apr. 15, 1977, gage height, 15.86 ft (4.834 m). HISTORIC.--The flood of Sept. 11, 1952, which was the highest since at least 18~1, reached a .stage of 34.~ ft (10.42 m),
discharge 163,000 ft 3 /s (4,620 m3 s), from slope-area measurement at gage site.
MEAN DISCHARGE, IN CUBIC FEET PER SECOND, AUGUST 1978 -oAv ______ oisc~ARGE _______ oAv ______ oisc~ARGE _______ oAv ______ oisc~ARGE _______ oAv ______ oisc~ARGE-
i~~~~----------22--------8~~~~-----------9~3------i6~~~-----------i~3------24~~~------------~63
2.... 1,140 9.... 7.4 17... 1.1 25... .63 3.... 498 10... 5.9 18... .66 26... .63 4.... 212 11... 5.0 19... .46 27... .55 5.... 55 12... 4.0 20... .46 28... .61 6.... 30 13... 3.2 21... .60 29... .34 7.... 17 14... 2.5 22... .71 30... .34
15... 1.8 23... .63 31... .34
------------------------------------------------------------MONTHLY MEAN DISCHARGE, IN CUBIC FEET PER SECOND •••••••••••••••• ~~~~~~~~~~~~~~~~----------~;~3-MONTHLY TOTAL ACRE-FEET ••••••••••••••••••••••••••••••••••••••••••••••••.•••••••• -. 4,010 RUNOFF, IN INCHES ••••••••••••••••••••••••••••••••••••••••••••••••••••••••••••• ,. .23
---------------------------------------------------------------------~-------------------------
Period
August 1978--------------------
1967 to July 1978--------------
1 '140
6,670
Highest mean discharge, in cubic feet per second for the indicated number of consecutive days
-100-
3
617
3,810
282
1 ,990

COLORADO RIVER BASIN
{68) 08153500 PEDERNALES RIVER NEAR JOHNSON CITY, TX
LOCATION.--Lat 30°17'27", long g8°24'01", Blanco County, Hydrologic Unit 12090206, near center of span at downstream side of bridge on U.S. Highway 281, 0.2 mi (0.3 km) downstream from Towhead Creek, 1.1 mi {1.8 km) northeast of Johnston City, 3.4 mi (5.5 krn) downstream from Buffalo Creek, and 48.2 mi (77 .6 km) upstream from mouth.
DRAINAGE AREA.--947 mP (2,453 km1).
PER I OD OF RECORD .--May 1939 to August 19 78.
GAGE.--Water-stage recorder and concrete control. Datum of gage is 1,096. 70 ft {334.274 m) National Geodetic Vertical Datum of 1929. May 4 to Sept. 13, 1939, nonrecording gage, and Sept. 14, 1939, to Sept. 10, 1952, water-stage recorder at upstream side of bridge at same datum. Sept. 11, 1952, to June 2g, 1953, nonrecording gage, and June 30, 1953, to Oct. 7, 1954, water-stage recorder at site 360 ft {110 m) downstream at same datum.
MAXIMA: FOR AUGUST 1978.--Discharge, 127,000 ft 3 /s {3,597 m3 /s) Aug. 3, 1978, gage height, 24.9 ft {7.59 m). FOR PERIOD 1939 to July 1978.--Maximum discharge, 441,000 ft 3 /s {12,500 m3 /s) Sept. 11, 1952, gage height, 42.5 ft
(12.95 m), from floodmark, from rating curve extended above 116,000 ftl/s {3,290 m3 /s) on basis of slope-area measurement of 441,000 ft 3 /s {12,500 m3 /s).
HISTORIC.--Maximum stage since at least 1859, 42.5 ft (12.95 m) Sept. 11, 1952; flood of July 1869 reached a stage of 33 ft {10.1 m), from information by local residents.
MEAN DISCHARGE, IN CUBIC FEET PER SECOND, AUGUST 1978
DAY DISCHARGE DAY DISCHARGE DAY DISCHARGE DAY DISCHARGE
-----------------------------------------------------------------------------------------------1 •••• 123 8 •••• 455 16 ••• 113 24 ••• 2 •••• 22,400 9 •••• 277 17 ... 102 25 ... 3 •••• 30,100 10 ••• 220 18 ••• 96 26 ••• 4 •••• 2' 580 11 ••• 191 19 ... 88 27 ••• 5 •••• 743 12 ••• 166 20 ••• 87 28 ••• 6 •••• 451 13 ••• 148 21 ... 83 29 ••• 7 •••• 1 '230 14 ••• 133 22 ••• 76 30 •••
15 ••• 123 23 ... 72 31 •••
MONTHLY MEAN DISCHARGE, IN CUBIC FEET PER SECOND •••••••••••••••••••••••••••••••• MONTHLY TOTAL ACRE-FEET ••••••••••••••••••••••••••••••••••••••••••••••••••••••••• RUNOFF, IN INCHES •••••••••••••••••••••••••••••••••••••••••••••••••••••••••••••••
Gage height,
Date Hour Gage height
Aug. 1 - 0800 10.44 1200 10.48 1700 10.52 1800 10.63 1900 10.72 2300 10.67 2330 10.69 2400 11.01
Aug. 2 - 0100 11.15 0500 10.99 0515 11.62 0530 12.29 0600 12.79. 0700 13.13 1000 12.69 1200 13.54
Period
in feet, and disaharge, in aubia feet per seaond, at indiaated time, 1978
Discharge
40 64 96
202 327 252 280 994
1,380 935
2,850 5,100 6,970 8,370 6,580
10,200
Date Hour Gage Discharge Date Hour Gage height height
Aug. 2 - 1230 14.62 16,500 Aug. 3 1230 22.77 1300 16.43 30,200 1300 23.17 1400 19.05 56,500 1315 24.90 1500 19.86 65,500 1330 24.50 1600 20.20 69,400 1400 24.00 1700 19.42 60,600 1500 21.79 1900 17.64 41,400 1700 19.27 2100 15.70 24,200 1900 16.48 2400 14.30 14,500 2100 14.69
2400 13.02 Aug. 3 - 0200 13.42 9,640
0600 12.00 4,130 Aug. 4 - 0400 11.94 1100 11.38 2,070 0800 11.51 1130 11.35 1 ,970 1200 11.32 1145 18.30 48,200 1800 11.15 1200 20.79 76,400 2400 11.03
Highest mean disaharge, in aubia feet per seaond for the indiaated number of aonseautive days
3
30,100 8,280
70 64 64 57 57 54 51 54
1 '950 120,000
2.38
Discharge
100,000 105,000 127,000 122,000 115,000 88,200 58,900 30,600 17,000
7,900
3,910 2,500 1,880 1,380 1,060
August 1978--------------------
1940 to July 1978-------------- 129,000
18,400
61,800 26,700
-101-

COLORADO RIVER BASIN
(69) 08154500 LAKE TRAVIS NEAR AUSTIN, TX
t..nurr·•rJ.--Li!t 30°23'29", long 97°54'24", Trilvis Co11nty, Hydrologic Unit 12090205, in powerhouse at Mansfield Dam on Colorado River, 1. ~ , ... ; 1 '!.7 km) downstream from Sandy Creek, 1?. mi ( 10 '-'m) northwest of Austin, and at mile 318.0 (511.7 km).
=:A.--38,130 mP (98,760 km2 ), "~-nroximately, of ~1hich 12,880 r;1i2 (33,360 km 2 ) probably is noncontributing.
rp:nr. ·J· RECORD.--Septer.1her 1940 to Aug1•c,t 1~78. P~"ior to October 1948, published as Marshi111 Ford Reservoir near Austin.
·,.:,GI:.--Nonrecording oaq~. ;-:.1t.u~1 of q~~~ ·:. 0.12 ft (0.037 m) National Geodetic Vertical Datum of 1929 (levels by Bureau of Reclamation). Prior tr- --.-. ?6, 1'?40, staff •PTS rr left bank near dam, datum is NGVD. Dec. 26, 1940, to February 1942, mercury ma na-11eter in po ·I !'.e, da tur.J is NGVD.
REMARKS.--The lnke •s +"armed by a 7,098-foot-long (2,163 m) concrete gravity, earth, and rockfill dam. Storage began Sept. 9, 1940, and dam was comoletP.d in early 1942. Capacity curve is based •>n O,ctober 1939 survey. Capacity between gage heights 681.0 and 714.0 ft (207~57 and 217.63 m) is 778,000 acre-ft (959 hm 3 ) and is reserved for flood control. Water is used for power development and for irrigation below Co1umbus. Figures given herein represent total contents. Data regarding the dam and lake are given in the foll011ing table:
Gage height (feet)
Top of dam (roadway) ....... -.~;-::-:::.-.-..................................... 750.1
Capacity (acre-feet)
Design flood............................................................... 748.9 3,223,000 Crest of spillway.......................................................... 714.0 1,950,000 Top of power storage....................................................... 681.0 1,172,000 Lowest gated out 1 tiiJ!Yert )~. _ ... : ·:...:·...:.·~· ·:...:·..:.·...:.· .:...• ':....:'..:.'.:..' :...:· ':...:'...:.'.:..' :...:' •..:.·.:..· .:...• ·:...:·..:.·.:..· :...:· ·:...:·...:.·.:..· :...:· ·:...:·...:.· .:...· ·=--------..:.5.=..35:...:·:..:8'--------=-27-'''""9..:..0-'-0
COCJPERATION.--Records of daily gage heights and capacity curve furnished by Lower Colorado River Authority.
MAXI:tA (at 2400): FOR AUGUST 1978.--Contents, 868,200 acre-ft (1.07 km 3 ) Aug. 4, 1978, gage height, 662.90 ft (202.052 m).
DAY
FOR PERIOD 1940 to July 1978.--Maximum contents, 1,770,000 acre-ft (2.18 km 3 ) May 18, 1957, gage height, 707,4 ft (215.62 m).
CONTENTS DAY
CONTENTS, IN ACRE-FEET, AUGUST 1978 INSTANTANEOUS OBSERVATIONS AT 2400
CONTENTS DAY CONTENTS DAY CONTENTS
-----------------------------------------------------------------------------------------------I .... 652,500 8 •••• 862,200 16 ... 866,700 24 ... 857,400 2 •••• 682,400 9 •••• 864,000 17 ... 865,800 2 5 ••• 855,000 3 •••• 814,600 10 ... 865,200 18 ... 865,800 26 ... 852,200 4 •••• 868,200 11. .. 866,600 19 ••• 864,600 27 .. 848,000 5 •••• 863,900 12 ... 867,500 20 ... 862,800 28 ••• ' 846,200 6 •••• 861,900 13 ••• 865,500 21 ••• 862,100 29 •.• 840,000 7 •••• 860,900 14 ... 865,800 22 ... 861 ,000 30 ••• 834,200
15 ••• 866,000 23 ••• 858,500 31 ••• 828,900
CHANGE IN CONTENTS, IN ACRE-FEET .............................................. .. 181 ,200
-102-

GUADALUPE RIVER BASIN
( 70) 08165300 NORTH FORK GUADALUPE RIVER NEAR HUNT, TX
LOCATION.--Lat 30°03'36", long 99°23'40", Kerr County, Hydrologic Unit 12100201, on right bank 410ft (125m) downstream from Ranch Road 1340, 1.3 mi (2.1 km) downstream from Bear Creek, 3.7 mi (6.0 km) west of Hunt, and 4.1 mi (6.6 km) upsteam from Honey Creek.
DRAINAGE AREA.--168 mil ( 435 km1 ).
PERIOD OF RECORD.--August 1967 to August 1978.
GAGE.--Water-stage recorder and crest-stage gages. Datum of gage is 1,800.10 ft (548.670 m) National Geodetic Vertical Datum of 1929.
REMARKS--There is a permit upstream from station issued by the Texas Department of Water Resources to impound and use 20.33 acre-ft (25, 100 m3 ) of water on a game preserve.
MAXIMA: FOR AUGUST 1978.--Discharge, 39,300 ftl/s (1,110 m3 /s) Aug. 3, 1978, gage height, 26.8 ft (8.17 m). FOR PERIOD 1967 to July 1978.--Maximum discharge, 38,400 ft 3 /s (1,090 m3 /s) Oct 13, 1973, gage height, 26.55 ft (8.092 m),
from rating curve extended above 170 ft 3 /s (4.81 m3/s) on basis of slope-area measurements of 7,460 and 38,400 ft 3 /s (211 and 1,090 m3 /s).
HISTORIC.--Maximum stage since at least 1900 occured July 1, 1932, gage height, 37.3 ft (11.37 m), discharge, 140,000 ft 3 /s (3,960 m
3/s), by slope-area measurements, combined flow of North Fork Guadalupe River 5 mi (8 km) upstream and Bear
Creek 2 mi ( 3 km) upstream from mouth, and adjusted for difference in drainage area.
MEAN DISCHARGE, IN CUBIC FEET PER SECOND, AUGUST 1978 -oAv ______ oiscHARGE _______ oAv ______ oiscHARGE _______ oAv ______ oiscHARGE _______ oAv ______ oiscHARGE-i ______________ 44 ________ 8::::----------95 ________ i6:::----------46 ________ 24~::----------35 __ _ 2:::: 6,370 9. ••• 86 17... 44 25... 35 3.... 5,870 10. •• 79 18... 43 26... 34 4.... 194 11... 72 19... 41 27... 33 5.... 135 12... 65 20... 39 28... 32 6.... 120 13. •• 60 21... 38 29... 32 7.... 109 14... 59 22... 37 30... 33
15... 52 23... 36 31... 32
-----------------------------------------------------------------------------------------452 __ _ MONTHLY MEAN DISCHARGE, lN CUBIC FEET PER SECOND •••••••••••••••••••••••••••••••• MONTHLY TOTAL ACRE-FEET......................................................... 27,800 RUNOFF, IN INCHES............................................................... 3.10
-----------------------------------------------------------------------------------------------
Gage height, in feet, and disaha:l'ge, in aubia feet per seaond, at indiaated time, 1978
Hour Gage Discharge Date height
Aug. 1 - 0100 4.14 15 0800 4.43 26 1200 4. 70 41 2400 5.06 76
Aug. 2 - 0100 5.81 234 0200 6.15 333 0300 8.31 1,530 0400 9.30 2,390 0500 15.47 10,000 0600 14.43 8,560 0700 16.36 11,400 0800 24.80 31,900
Period
August 1978--------------------
1968 to July 1978--------------
Date Hour Gage Discharge Date Hour Gage Discharge height height
Aug. 2 - 0900' 22.07 23 '100 Aug. 3 - 0400 19.03 1000 18.34 14,800 0500 20.82 1200 15.45 10,000 0700 15.70 1400 11.43 4,660 0800 12.31 1600 9.46 2,550 1000 9.37 1800 8.29 1,520 1200 8.05 2100 7.12 755 1500 6.96 2400 6.66 527 1800 6.45
2400 5.94 Aug. 3 - 0100 8.20 1 ,450
0200 20.24 18,700 Aug. 4 - 1200 5 .6~ 0300 26.80 39,300 2400 5.44
Highest mean disaha:l'ge, in aubia feet per seaond for the indiaated number of aonsecutive days
6,370
8,640
-103-
3
4,140
3,120
1,840
1 ,390
16,100 20,100 10,400
5,720 2,460 1,340
670 440 269
187 152

GUADALUPE RIVER BASIN
( 71) 08165500 GUADALUPE RIVER AT HUNT, TX
LOCATION.--Lat 30°04'08", long 99°19'23", Kerr County, Hydrologic Unit 12100201, on right bank 56ft (17m) upstream and 137ft (42 m) right of right end of bridge on State Highway 39, 0.6 mi (1.0 km) downstream fran confluence of North and South Forks, 0.8 mi (1.3 km) east of Hunt, and at mile 430.9 (693.3 km),
DRAINAGE AREA.--288 mP (746 km 2 ).
PERIOD OF RECORD.--October 1941 to September 1949, discharge not computed above 600 ft 3 /s (17.0 m3 /s), and April 1965 to August 1978. Occasional discharge measurements made 1950 to 1964.
GAGE.--Water-stage recorder and crest-stage gages. Datum of gage is 1,722.7 ft (525.08 m) National Geodetic Vertical Datum of 1929.
REMARKS.--Numerous diversions for irrigation above station, amounts unknown.
MAXIMA: FOR AUGUST 1978.--Discharge, 62,900 ft 3 /s (1,780 m3 /s) Aug. 2, 1978, gage height, 23.50 ft {7.163 m). FOR PERIOD 1965 to July 1978.--Maximum discharge, 47,000 ft 3 /s (1,330 m3 /s) Aug. 13, 1966, gage height, 21.4 ft (6.52 mJ,
from f1 oodma rk, from rating curve extended above 3, 700 ft 3 /s ( 105 m3 /s) on basis of channe 1 geometry and flow-over-dam measurement of peak flow.
HISTORIC.--Maximum stage since 1900, 36.6 ft (11.16 m) July 2, 1932, from information by local resident, discharge 206,000 ftl/s {5,830 m3 /s), determined by slope-area measurement 4.5 mi {7.2 km) downstream fran gage.
MEAN DISCHARGE, IN CUBIC FEET PER SECOND, AUGUST 1978
DAY DISCHARGE DAY DISCHARGE DAY DISCHARGE DAY DISCHARGE -----------------------------------------------------------------------------------------------1 •••• 621 8 •••• 234 16 ••• 111 24 ••• 2 •••• 16,300 9 •••• 189 17 ••• 106 25 ... 3 •••• 9,460 1 0 ••• 171 18 ... 102 26 ••• 4 •••• 687 11 ••• 151 19 ••• 97 27 ••• 5 •••• 424 12 ••• 141 20 ••• 94 28 ••• 6 •••• 342 13 ••• 129 21 ••• 95 29 ••• 7 •••• 324 14 ••• 116 22 ••• 85 30 •••
15 ••• 117 23 ••• 82 31 •••
MONTHLY MEAN DISCHARGE, IN CUBIC FEET PER SECOND •••••••••••••••••••••••••••••••• MONTHLY TOTAL ACRE-FEET ••••••••••••••••••••••••••••••••••••••••••••••••••••••••• RUNOFF, IN INCHES •••••••••••••••••••••••••••••• : ••••••••••••••••••••••••••••••••
Gage height, in feet; and discharge, in cubic feet per second, at indicated time, 1978
Date Hour Gage Discharge height
Aug. 1 - 0700 1.02 23 0800 1.16 36 0900 1.63 99 1000 2.03 174 1030 4.33 757 1100 7.82 1,960 1130 9.73 3,420 1200 9.58 3,270 1300 7. 71 1,910 1500 5.j7 1,050 1900 3.51 543 2300 2.91 380 2400 3.35 498
Aug. 2 - 0100 5.47 1,080 0200 9.85 3,540
Period
August 1978--------------------
1966 to July 1978--------------
Date Hour Gage Discharge Date Hour Gage height height
Aug. 2 - 0300 11.00 5,050 Aug. 3 - 0200 11.00 0400 13.62 9,760 0300 16.00 0500 14.79 13,100 0400 20.00 0600 20.81 42,800 0500 22.25 0700 23.50 6?.,900 0600 20.20 0800 21.16 45,300 0700 16.60 1000 22.25 52,800 0800 14.70 1100 20.20 38,800 1000 11.20 1200 16.60 19,900 1200 9.60 1300 14.70 12,800 1600 7. 75 1400 12.90 8.150 2400 5.70 1500 11.20 5,310 1800 9.20 2,910 Aug. 4 - 0600 4.55 2400 6.70 1,510 1200 3.83
2400 3.40 Aug. 3 - 0100 6.13 1,310
Highest mean discharge, in cubic feet per second for the indicated nwnber of consecutive days
16,300
15,700
-104-
. 3
8,820
6,090
4,020
2,710
76 70 71 73 71 69 84 74
992 61,000
3.97
Discharge
5,050. 17,500 37,600 52,800 38,800 19,900 12,800
5,310 3,290 1,930 1 '160
813 628 512

GUADALUPE RIVER BASIN
( 72} 08166000 JOHNSON CREEK NEAR INGRAM, TX
LOCATION.--Lat 30°06'00", long 99°16'58", Kerr County, Hydrologic Unit 12100201, on right bank 1.6 mi (2.6 km) upstream from Henderson Branch, 3.4 mi (5.5 km) northwest of Ingram, 3.8 mi (6.1 km) upstream from mouth, and 9.2 mi (14.8 km) northwest of
Kerrville.
DRAINAGE AREA.--114 mP (295 km2).
PERIOD OF RECORD.--September 1941 to November 1959, October 1961 to August 1978.
GAGE.--Water-stage recorder. Datum of gage is 1,721.30 ft (524.652 m) National Geodetic Vertical Datum of 1929.
REMARKS.--Numerous small diversions above station for irrigati:-Jn.
MAXIMA: FOR AUGUST 1978.--Discharge, 73,900 ft 3 /s (2,090 m3 /s) Aug. 3, 1978, gage height, 21.4 ft (6.52 m). FOR PERIOD 1941 to July 1978.--Maximum discharge, 95,900 ft 3 /s (2,720 m3 /s) Oct. 4, 1959, gage height, 24.25 ft (7.391 m),
fran rating curve extended above 4,400 ft 3 /s (125 m3 /s) on basis of slope-area measurements of 9,100 and 16,000 ftl/s
(258 and 453 m3 /s) and conveyance study. HISTORIC.--Maximum stage since at least 1852, 35ft (10.7 m) July 2, 1932, from information by local resident; discharge,
138,000 ft 3 /s (3,910 m3 /s), by slope-area measurement at point 0.5 mi (0.8 km) downstream from State fish hatchery and 6 or 7 mi (10 or 11m) upstream from gage. Flood of June 14,1935, reached a stage of 31 or 32ft (9.4 or 9.8 m), from
information by local resident.
MEAN DISCHARGE, IN CUBIC FEET PER SECOND, AUGUST 1978 ~oAv ______ oiscHARGE _______ oAv ______ oiscHARGE _______ oAv ______ oiscHARGE _______ oAv ______ oiscHARGE-
1~~~~----------;o--------8~~~~----------87 ________ 16-------------------------------------------2.... 3,710 9. ••• 79 17... 41 24... 29 3.... 17,200 10... 73 18:::
39 25... 1!8
4.... 215 11... 66 19... 37 26... 25 5.... 130 12... 61 20... 36 27... 24 6.... 106 13... 58 21... 34 28... 24 7. • • • g 7 14. • • 53 2 2. • • ~~ 2 9. • • 2 2
15 6 30... 27
• • • 4 23... 29 31 MoNrHLY-MEAN-orscHARGE:-iN-cusic-Frrr-rrR-srcoNo _____________________________ ::: __________ :~---MoNTHLv TOTAL ACRE-FEET •••••••••••••••••••••••·•••••·•• 726 RUNOFF IN INCHES ••••••·•••••••••·••••·••••••·•·•••••••••••••••••••••••••• 44,600 ______ : __________ :::::::::::::::::~~~~~~~~~~~~~~~~~~~~~~~~~~~~~~~~~~~~~~~~~~~~~:-----------~~=~
Gage height, in feet, and discharge, in cubic feet per second, at indicated time, 19?8
Date Hour Gage Discharge height
Aug. 1 - 0600 1.43 7.9 0800 1.44 9.2 0900 1.50 19 1000 1.60 42 1400 1.65 56 1800 1.59 40 2200 1.57 33 2400 1.64 53
Aug. 2 - 0100 2.05 188 0200 5.00 1,590 0300 6.17 2,830 0400 6.36 3,070 0600 5.56 2,140 0700 6. 70 3,510
Period
August 1978--------------------
1943 to July 1978--------------
Date Hour Gage
Discharge Gage
height Date Hour height Discharge
Aug. 2 - 0800 8.30 6,080 Aug. 3 - 0300 17.98 50,100 0900 10.00 10,000 0400 18.42 53,000 1000 11.08 13,500 0600 18.04 50,500 1100 10.00 10,000 0700 20.32 66,200 1300 8.80 7,120 0800 14.39 28,300 1400 7.30 4,370 0900 10.50 11 ,500 1500 6.00 2,630 1000 8.12 5,730 1700 4.30 1,120 1200 5.79 2,390 2000 3.13 !:,82 1400 4.46 1,190 2200 2.80 457 1800 3.36 597 2300 2.90 496 2400 2.78 348 2400 7.20 4,220
Aug. 4 - 1200 2.42 205 Aug. 3 - 0100 10.00 10,000 2400 2.26 148
0200 21.40 73,900
llighest me~ ~ischarge, in cubic feet per second for the ~nd~cated number of consecutive days
17,200
4,050
-105-
3
7,040
1,710
3,080
845

GUADALUPE RIVER BASIN
( 75} 08167000 GUADALUPE RIVER AT COMFORT, TX
LOCATION.--Lat 29°57'55", long 98°53'49", Kendall County, Hydrologic Unit 12100201, on left bank at downstream side of pier of bridge on U.S. Highway 87, 0.1 mi (0.2 km) downstream from Cypress Creek, and at mile 396.6 (638.1 km).
DRAINAGE AREA.--838 mil (2,170 km 2 ).
PERIOD OF RECORD.--May 1939 to August 1978.
GAGE.--Water-stage recorder. Datum of gage is 1,372.05 ft (418.201 m) National Geodetic Vertical Datum of 1929. Prior to Nov. 27, 1939, nonrecordi ng gage.
REMARKS.--Many small diversions above station for irrigation.
MAXIMA: FOR AUGUST 1978.--Discharge, 240,000 ft 3 /s (6,800 m3 /s) Aug. 2, 1978, gage height, 40.SO ft (12.466 m). FOR PERIOD 1939 to July 1978.--Maximum discharge, 111,000 ft3/s (3,140 m3 /s) Oct. 4, 1SI59, g:t~~ height, 33.15 ft (10.104
m), fran rating curve extended above 65,000 ft 3 /s (1,840 m3 /s) on basis of slope-area measurement of 182,000 ft 3 /s (5,150 m3 /s), gage height, 38.4 ft (11.70 m), made at former gaging station "near Comfort" 5 mi (8 km) upstrea:n.
HISTORIC.--Maximum stage since at least 1848, 40.90 ft (12.466 m) Aug. 2, 1978, discharge 240,000 ft 3 /s (6,800 m3 /s). Flood of July HlG9 reac:1ed a stage of 40.3 ft (12.28 m) from report by Corps of Engineers.
MEAN DISCHARGE, IN CUBIC FEET PER SECOND, AUGUST 1978
DAY
1 •••• 2 •••• 3 •••• 4 •••• 5 •••• 6 •••• 7 ••••
DISCHARGE
873 74,200 55,100
3,820 1,800 1,270 1 '3 30
DAY
8 •••• 9 •••• 10 ••• 11. .• 12 ••• 13 ••• 14 ••• 15 •••
DISCHARGE
936 772 695 619 561 519 480 450
DAY
16 ••• 17 ••• 18 ••• 19 ••• 20 ••• 21 ••• 22 ••• 23 •••
DISCHARGE
416 398 371 357 341 326 311 292
DAY
24 ••• 25 ••• 26 .•• 27 ••• 28 ••• 29 ••• 30 ••• 31 •••
MONTHLY MEAN DISCHARGE, IN CUBIC FEET PER SECOND •••••••••••••••••••••••••••••••• MONTHLY TOTAL ACRE-FEET ••••••••••••••••••••••••••••••••••••••••••••••••••••••••• RUNOFF, IN INCHES •••••••••••••••••••••••••••••••••••••••••••••••••••••••••••••••
Gage height, in feet, and discharge; in cubic feet per second, at indicated time, 1978
Date Hour Gage Discharge height
Aug. l - 0900 4.10. 50 1500 4.14 56 1600 4.36 103 1700 6.12 l ,040 1800 8.25 1,990 1900 9.85 2,760 2400 11.26 3,580
Aug. 2 - 0300 ll. 74 3,960 0400 13.24 5,710 0500 15.85 10,700 0600 22.97 36,000 0700 30.~8 99,500 0800 37.55 183,000 0900 40.90 240,000
Period
August 1978--------------------
1940 to July 1978--------------
Date Hour Gage Discharge Date Hour Gage height height
Aug. 2 - 1000 38.82 203,000 Aug. 3 - 1400 27.83 1100 36.07 161,000 1600 23.67 1200 34.19 137,000 1800 19.87 1500 30.89 98,600 2100 16.45 1800 26.23 56,400 2400 14.52 2100 21.36 28,000 2400 17.58 14,600 Aug. 4 - 0600 12.31
1200 10.88 Aug. 3 - 0300 15.20 9,260 2400 9.00
74,200
27,300
0500 19.38 20,100 0600 30.76 97,200 Aug. 5 - 1200 8.00 0700 33.98 134,000 2400 7.49 0800 35.08 148,000 0900 34.87 145,000 Aug. 6 - 1200 7.18 1100 33.00 122,000 2400 7.04
Highest mean discharge, in cubic feet per second for the indicated number of consecutive days
-106-
3
44,400
13,700
19,800
6,840
DI.SCHARGE
274 257 250 241 235 234 249 259
4,780 294,000
6.58
Discharge
69,200 39,900 21 ,700 12,000 7,870
4,520 3,330 2,340
l ,770 l ,450
l ,260 l '170

GUADALUPE RIVER BASIN
{76) 08167500 GUADALUPE RIVER NEAR SPRING BRANCH, TX
LOCATION.--Lat 29°51'38", long 98°22'58", Carnal County, Hydrologic Unit 12100201, on right bank at downstream side of bridge on county road, 226 ft ( 69 m), downstream from bridge on Ranch Road 311, 1. 9 mi ( 3.1 km) southeast of Spring Branch Post Office, 7.' mi (12.1 km) downstream from Curry Creek, and at mile 334.4 {538.0 km).
DRAINAGE AREA.--1,315 mP {3,406 km 2 ).
PERIOD OF RECORD.--June 1922 to August 1978.
GAGE.--Water-stage recorder and crest-stage gages. Datum of gage is 948.10 ft {288.981 m) National Geodetic Vertical Datum of 1929.
REMARKS.--Several small diversions above station for irrigation. Guadalupe-Blanco River Authority gage-height telemeter at station.
MAXIMA: FOR AUGUST 1978.--Discharge, 158,000 ft 3 /s {4,470 m3 /s) Aug. 3, 1978, gage height, 45.25 ft {13.792 m). FOR PERIOD 1922 to July 1978.--Maximum discharge, 121,000 ft 3 /s {3,430 m3 /s) July 3, 1932 (gage height, 42.10 ft or 12.832
m), from rating curve extended above 70,000 ft 3 /s {1,980 m3 /s). HISTORIC.--Maximum stage since at least 1859, about 53 ft {16.2 m) in 1869; flood in July 1900 reached a stage of about 49
ft {14.9 m), from information by local resident.
DAY
1 •••• 2 •••• 3 •••• 4 •••• 5 •••• 6 •••• 7 ••••
DISCHARGE
62 6,730
76,500 46,300 4,290 2,550 2,280
MEAN DISCHARGE, IN CUBIC FEET PER SECOND, AUGUST 1978
DAY
8 •••• 9 •••• 10 ••• 11 ••• 12 ••• 13 ••• 14 ••• 15 •••
DISCHARGE
2,020 1,500 1,240 1,020
881 806 735 664
DAY
16 ••• 17 ••• 18 ••• 19 ••• 20 ••• 21 ••• 22 ••• 23 •••
DISCHARGE
608 569 545 508 483 456 438 421
DAY
24 ••• 25 ••• 26 ••• 27 ••• 28 ••• 29 ••• 30 ••• 31. •.
MONTHLY MEAN DISCHARGE, IN CUBIC FEET PER SECOND •••••••••••••••••••••••••••••••• MONTHLY TOTAL ACRE-FEET ••••••••••••••••••••••••••••••••••••••••••••••••••••••••• RUNOFF, IN INCHES •••••••••••••••••••••••••••••••••••••••••••••••••••••••••••••••
Gage height, in feet, and discharge, in cubic feet per second, at indicated time, 1978
DISCHARGE
396 375 356 344 332 322 326 332
4,980 306,000
4.37
Date Hour Gage Discharge Date Hour Gage Discharge Date Hour Gage Discharge height height height
Aug. 1 - 0300 2.20 40 1200 2.37 64 2400 2.55 95
Aug. 2 - 0300 2.57 99 0600 2.77 144 1000 3.07 232 1100 3.90 611 1200 5.10 1,290 1400 6.60 2,320 1600 8.25 3,580 1800 10.95 6,050 2000 17.70 14,400 2200 25.30 27,600
Period
August 1978--------------------
1923 to July 1978--------------
Aug. 2 - 2400 34.00 54,400 Aug. 4 - 0200 40.60 0300 39.40
Aug. 3 - 0100 37.80 94,500 0800 32.30 0200 42.00 130,000 1200 27.80 0300 45.25 158,000 1600 21.40 0400 44.40 152,000 2000 14.00 0800 38.00 96,100 2400 11.00 1200 32.70 58,800 1900 25.60 30,100 Aug. 5 - 0400 9.40 2000 28.00 37,000 1200 8.00 2200 32.60 58,100 2400 6.90 2400 37.00 88,300
Aug. 6 - 1200 5.87 Aug. 4 - 0100 39.20 106,0PO 2400 5.85
Highest mean discharge, in cubic feet per second for the indicated number of consecutive days
76,500
66,100
-107-
3
43,200
32,700
20,100
14,900
118,000 108,000
56,300 36,400 21 ,300 10,400 6,920
5,340 4,100 3,240
2,420 2,400

GUADALUPE RIVER BASIN
(77) 08167600 REBECCA CREEK NEAR SPRING BRANCH, TX
LOCATION.--Lat 29°55'06", long 98°22'10", Comal County, Hydrologic Unit 12100201, on right bank 72ft (22m) upstream from private road crossing, 2.9 mi (4.7 km) upstream fran mouth, 3.7 mi (6.0 km) northeast of Spring Branch Post Office, and 6.3 mi (10.1 km) south of Twin Sisters.
DRAINAGE AREA.--10.9 mil (28.2 km1 ).
PERIOD OF RECORD.--January 1960 to August 1978.
GAGE.--Water-stage recorder and concrete control. Datum of gage is 985.55 ft (300.396 m) National Geodetic Vertical Datum of 1929 (Corps of Engineers bench mark).
REMARKS.--Six dams forming recreational lakes at housing developments upstream control runoff from 3.13 mil (8.11 km1 ) drainage area. Amount of impoundment unknown. Recording rain gage located at station.
MAXIMA: FOR AUGUST 1978.--Discharge, 1.5 ft 3 /s (0.042 m3 /s) Aug. 1, 1978, gage height, 2.06 ft (0.628 m). FOR PERIOD 1960 to July 1978.--Maximum discharge, 9,300 ft 3/s (263 m3/s) Oct. 18, 1965, gage height, 7.97 ft (2.429 m),
from rating curve extended above 420 ftl/s (11.9 m3/s) on basis of critical-depth measurement of 4,340 ftl/s (123 m3fs). HISTORIC.--Maximum stage since at least 1885, 25.5 ft (7.77 m) in September 1952. Flood in 1947 or 1948 was about 4.5 ft
(1.4 m) lower than flood in 1952, from infromation by local residents.
MEAN DISCHARGE, IN CUBIC FEET PER SECOND, AUGUST 1978
DAY
1 •••• 2 •••• 3 •.•• 4 •••• 5 •••• 6 •••• 7 ••••
DISCHARGE
.54 1.4
.95
.93
.69
.40
.40
DAY
8 •••• 9 •••• 10 ••• 11. •• 12 ••• 13 ..• 14 ••• 15 •••
DISCHARGE
• 40 • 40 • 40 • 40· • 60 • 59 • 56 • 54
DAY
16 ••• 17 ••• 18 ••• 19 ••• 20 ••• 21 ••• 22 ••• 23 •••
DISCHARGE
• 47 • 40 • 40 • 40 • 40 • 40 • 40 • 40
DAY
24 ••• 25 ••• 26 ••• 27 ••• 28 ••• 29 ••• 30 ••• 31. ••
MONTHLY MEAN DISCHARGE, IN CUBIC FEET PER SECOND •••••••••••••••••••••••••••••••• MONTHLY TOTAL ACRE-FEET ••••••••••••••••••••••••••••••••••••••••••••••••••••••••• RUNOFF, IN INCHES •••••••••••••••••••••••••••••••••••••••••••••••••••••••••••••••
Period
August 1978--------------------
1961 to July 1978--------------
Highest mean discharge, in cubic feet per second for the indicated number of consecutive days
1.4
637
-108-
3
1.1
337
DISCHARGE
0.8
206
.40
.40
.40
.40
.40
.40
.40
.40
• 51 31.1
.05

GUADALUPE RIVER BASIN
{78) 08167700 CANYON LAKE NEAR NEW BRAUNFELS, TX
LOCATION.--Lat 29°52'07", long 98°11'55", Comal County, Hydrologic Unit 12100201, in intake structure of Canyon Dam on Guadalupe River, 12 mi {19 km) northwest of New Braunfels, and at mile 303.0 {487.5 km).
DRAINAGE AREA.--1 ,432 mP (3, 709 km2 ).
PERIOD OF RECORD .--July 1962 to August 1978. Prior to October 1970, published as Canyon Reservoir.
GAGE.--Water-stage recorder. Datum of gage is National Geodetic Vertical Datum of 1929 (levels by Corps of Engineers). Prior to Sept. 24, 1964, nonrecordi ng gage at present site and datum.
REMARKS.--The lake is formed by a rolled earthfill dam 6,830 ft (2,082 m) long, consisting of the main dam 4,410 ft (1,344 m) long, an earthen dike 210 ft (64 m) long, a 1,260-foot (384m) long uncontrolled broad-crested type spillway, and a 950-foot {290m) concrete and earthen nonoverfl ow section. Deli berate impoundment of water began June 16, 1964, and rna in part of dam was completed in August 1964. The flood-control outlet works consist of a 10.0-foot-diameter {3.0 m) conduit controlled by two 5. 7- by 10.0-foot (1.7 by 3.0 m) hydraulically operated slide gates. The lake was built for water conservation and flood control. Capacity. table beginning Oct. 1, 1974, is based on a sedimentation survey of August 1972. Small diversions above the lake for irrigation. Figures given herein represent total contents. Data regarding the dam and lake are given in the following table:
Elevat1on Capac1ty (feet) (acre-feet)
Top of dam... • • • • • • • • • • • • • • • • • • • • • • • • • • • • • • • • • • • • • • • • • • • • • • • • • • • • • • • • • • • • • • 974 .0 Crest of spillway.......................................................... 943.0 736,700 Top of conservation pool................................................... 909.0 382,000 Lo~st gated outlet (invert) ••••••••••• ~·~·~·~··~·~·~··~·~·~·~··~·~·~·~··~·~·~··~·~·~·~··~·~·~··~·~·~·~·~~~~~~~7~75~·~0~~~~~~~2~4~0~
COOPERATION.--Records furnished by Corps of Engineers and reviewed by Geological Survey.
MAXIMA: FOR AUGUST 1978.--Contents, 588,400 acre-ft (725 hm 3 ) Aug. 4, 1978, elevation, 930.61 ft (283.650 m). FOR PERIOD 1962 to July 1978.--Maximum contents, 460,400 acre-ft {568 hm 3 ) Apr. 22, 1977, elevation, 917.96 ft (279.794 m).
DAY CONTENTS DAY
CONTENTS, IN ACRE-FEET, AUGUST 1978 INSTANTANEOUS OBSERVATIONS AT 2400
CONTENTS DAY CONTENTS DAY CONTENTS -----------------------------------------------------------------------------------------------1 •••• 362,200 8 •••• 563,600 16 ••• 494,500 24 ••• 422,700 2 •••• 369,800 9 •••• 555,600 17 ... 485,300 25 ••• 416,600 3 •••• 500,800 10 ••• 547,300 18 ... 475,500 26 ••• 415,400 4 •••• 588,400 11 ... 538,300 19 ••• 467,500 27 .. 414,200 5 •••• 583,400 12 ... 530,100 20 ••• 458,400 28 ••• 413,000 6 •••• 577,600 13 ••• 520,700 21 ••• 449,500 29 ••• 411 '500 7 •••• 570,500 14 ••• 512,400 22 ... 441 '1 00 30 ••• 410,100
15 ••• 503,500 23 ••• 431 'l 00 31. .. 409,100
CHANGE IN CONTENTS, IN ACRE-FEET •••••••••••••••••••••••••••••••••••••••••••••••• 48,600 -----------------------------------------------------------------------------------------------
-109-

GUADALUPE Rl VER BASIN
(79) 08167800 GUADALUPE RIVER ·AT SATTLER, TX
LOCATION.--Lat 29°51'32", long 98°10'47", Comal County, Hydrologic Unit 12100202, on right bank 200ft ·(61 m) upstream from Horseshoe Falls, 0.8 mi (1.3 km) north of Sattler, 1.8 mi (2.9 km) downstream from Canyon Dam, 2.3 mi (3.7 km) upstream from Heiser Hollow, 11.2 mi (18.0 km) north of New Braunfels, and at mile 301.2 (484.6 km).
DRAINAGE AREA.--1,436 mP (3,719 km 1 ), 1,432 mP (3,709 km1 ) is above Canyon Dam.
PERIOD OF RECORD .--March 1960 to August 19 78.
GAGE.--Water-stage recorder and concrete control. Datum of gage is 742.24 ft (226.235 m) National Ge.odetic Vertical Datum of 1929 (Corps of Engineers bench mark).
REMARKS.--Flow completely regulated since July 21, 1962, by Canyon Lake (station 08167700) 1~8 mi (?.~ km) upstream. Small diversions above station fcir ·irrigation.
MAXIMA: FOR AUGUST 1978.--Discharge, 5,850 ft 3"/s (166 m3 /s) Aug. 5, 1978, gage height, 8.31 ft (2.533 m). FOR PERIOD.1960 to July 1978.--Maximum discharge, 20,800 ft 3 /s (589 m3 /s) Oct. 29, 1960, gage height, 12.20 ft (3.719 m).
Maximum discharge since closure of Canyon Dam on July 21, 1962, 5,390 ft 3 /s (153 m3 /s) Feb. 11, 1975, gage height, 8.18 ft (2 .493 m).
HISTORIC.--Maximum stage since closure of Canyon Dam, 8.31 ft (2.533 m) Aug. 5, 1978, discharge 5,850 ft 3 /s (166 m3 /s).
MEAN DISCHARGE, IN CUBIC FEET PER SECOND, AUGUST 1978 -----------------------------------------------------------------------------------------------
DAY DISCHARGE DAY DISCHARGE DAY DISCHARGE DAY DISCHARGE
1 •••• 2 •••• 3 •••• 4 •••• 5 •••• 6 •••• 7 ••••
123 99 98
1,820 5,680 5,620 5,570
8 •••• 9 •••• 10 ••• 11 ••• 12 ••• 13 ••• 14 ••• 15 •••
5,550 5,520 5,390 5,380 5,410 5,420 5,440 5,420
16 ••• 17 ••• 18 ••• 19 ••• 20 ••• 21 ••• 22 ••• 23 ...
5,390 5,360 5,330 5,320 5,290 5,260 5,260 5,240
24 ••• 25 ••• 26 ••• 27 ••• 28 ••• 29 ••• 30 ••• 31 •••
MONTHLY MEAN DISCHARGE, IN CUBIC FEET PER SECOND •• ~ ••••••••••••••••••••••••••••• MONTHLY TOTAL ACRE-FEET •••••••••••••••••••••••••••••••••••••••••••••••••••••••••
5,210 3,610
939 936 939 946 946 946
3,850 237,000
-----------------------------------------------------------------------------------------------
Period
August 1978--------------------
1961 to July 1978--------------
5,680
10,000
Highest mean discharge, in cubic feet per second for the indicated nwnber of consecutive days
-110-
3
5,620
6,380
5,530
5,220

GUADALUPE RIVER BASIN
(82) 08179000 MEDINA RIVER NEAR PIPE CREEK, TX
LOCATION.--Lat 29°40'31", long 98°58'33", Bandera County, Hydrologic Unit 12100302, on right bank 500ft (150m) upstream from Bandera Falls, 0.6 mi (1.0 km) upstream from Red Bluff Creek, and 4.1 mi (6.6 km) southwest of Pipe Creek.
ORAl NAGE AREA.--474 mP (1 ,228 km1 ).
PERIOD OF RECORD.--October 1922 to June 1935, October 1952 to August 1978. Monthly discharge only for some periods, published in WSP 1312 and 1732.
GAGE.--Water-stage recorder. Datum of gage is 1,067.37 ft (325.334 m) National Geodetic Vertical Datum of 1929. December 1922 to June 1935, water-stage recorder at site 1.9 mi (3.1 km) upstream at different datum.
REMARKS.--Small diversion above station.
MAXIMA: FOR AUGUST 1978.--Discharge, 281,000 ft 3 /s (7,960 m3 /s) Aug. 2, 1978, gage height, 49.6 ft (15.118 m). FOR PERIOD 1922 to July 1978.--Maximum discharge, 72,900 ft 3 /s (2,060 m3 /s) July 15, 1973, gage height, 37.3 ft (11.37
m), from floodmark, from rating curve extended above 32,000 ft 3 /s (906 m3 /s) on basis of slope-area measurement of 64,000 ft 3 /s (1,810 m3 /s).
HISTORIC.--Maximum stage since at least 1880, 49.6 ft (15.118 m) Aug. 2, 1978, discharge, 281,000 ft 3 /s (7,960 m3 /s).
MEAN DISCHARGE, IN CUBIC FEET PER SECOND, AUGUST 1978
DAY DISCHARGE DAY DISCHARGE DAY DISCHARGE DAY DISCHARGE
-----------------------------------------------------------------------------~-----------------1 •••• 27 8 •••• 776 16 ••• 336 24 ••• 2 •••• 41;700 9 •••• 816 17 ••• 321 25 ••• 3 •••• 15,000 10 ••• 581 18 ••• 304 26 ••• 4 •••• 3,680 11. •• 478 19 ••• 288 27 ••• 5 •••• 2,870 12 ••• 449 20 ••• 274 28 ••• 6 •••• 2,030 13 ••• 413 21. •• 266 29 ••• 7 •••• 1 ,420 14 ••• 387 22 ••• 254 30 •••
15 ••• 356 23 ••• 244 31. ••
MONTHLY MEAN DISCHARGE, IN CUBIC FEET PER SECOND •••••••••••••••••••••••••••••••• MONTHLY TOTAL ACRE-FEET ••••••••••••••••••••••••••••••••••••••••••••••••••••••••• RUNOFF, IN INCHES •••••••••••••••••••••••••••••••••••••••••••••••••••••••••••••••
Gage height, in feet, and dischaztge, in cubic feet pe1' second, at indicated time, 1978
236 227 221 214 207 202 205 205
2,420 149,000
5.89
Date Hour Gage Discharge Date Hour Gage Discharge Date Hour Gage Discharge height height height
Aug. 1 - 0600 3.88 16 1200 3.96 26 1900 3.96 26 2400 4.22 60
Aug. 2 - 0300 4.20 57 0400 7.10 1,060 0500 8.20 1,810 0700 9.75 3,230 0800 11.65 5,360 0900 27.95 39,000 1000 43.60 119,000 1100 49.60 281,000
Pe1'iod
August 1978--------------------
1g24 to July 1978--------------
Aug. 2 - 1200 45.00 160,000 Aug. 3 - 2400 10.70 1300 38.70 95,100 1400 33.20 64,200 Aug. 4 - 1200 8.60 1600 25.20 36,100 2400 7.80 1900 18.40 19,800 2400 15.55 14,300 Aug. 5 - 1200 7.15
2400 6.65 Aug. 3 - 0200 15.00 13,300
0300 20.70 24,900 Aug. 6 - 1200 6.15 0400 23.00 30,400 2400 5.80 0500 21.20 26,000 1200 15.80 14,700 Aug. 7 - 1200 5.45 1800 13.40 10,600 2400 5.20
Highest mean discha:r'ge, in cubic feet pe1' second fo1' the indicated numbe1' of consecutive days
41,700
23 ,COO
-111-
3
20,100
15,000
9,640
7,900
6,710
4,260 3,450
2,840 2,410
2,000 1,720
1,460 1,260

GUADALUPE RIVER BASIN
(83) 08179100 RED BLUFF CREEK NEAR PIPE CREEK, TX
LOCATION.--Lat 29°40'51", long 98°57'19", Bandera County, Hydrologic Unit 12100302, on left bank 0.8 mi (1.3 km) upstream from bridge on Farm Road 1283, 1.8 mi (2.9 km) downstream from Pipe Creek, L9 mi (3.1 km) upstream from mouth, and 3.2 mi (5.1 km) south of Pipe Creek.
DRAINAGE AREA.--56.3 mP (145.8 km 2).
PERIOD OF RECORD .--April 1956 to August 1978.
GAGE.--Water-stage recorder. Datum of gage is 1,107.2 ft (337 .475 m) National Geodetic Vertical Datum of 1929.
REMARKS.--Small dams on upstream tributaries affect flow during time of storm runoff. No known diversion.
MAXIMA: FOR AUGUST 1978.--Discharge, 160 ft;;/s (4.53 m3 /s) Aug. 2, 1978, gage height, 3.7 ft (1.13 m). FOR PERIOD 1956 to July 1978.--Maximum discharge, 46,900 ft 3 /s (1,330 m3 /s) Sept. 27, 1964, gage height, 22.64 ft (6.901
m), from rating curve extended above 2,000 ft 3 /s (56.6 m3 /s) on basis of slope-area measurement of peak flow. HISTORIC.--Maximum stage since at least 1905, that of Sept. 27, 1964. A stage of about 17 ft (5.2 m) was reached in July
1937. Flood in October 1953 reached a stage of 13.8 ft (4.21 m).
MEAN DISC~ARGE, IN CUBIC FEET PER SECOND, AUGUST 1978
-oA~------oisc~A~GE _______ oA~------oiscHA~GE _______ oA~------oiscHA~GE _______ oA~------oiscHA~GE-i~~~~------------~oo _____ 8~~~~------------~oo _____ i6~~~------------~oo _____ 24~~~------------~oo 2.... 70 9.... .00 17... .00 25... .00 3.... 5.4 10... .00 18... .oo 26... .00 4.... .01 11... .00 19... .00 27... .00 5.... .00 12... .00 20... .00 28... .00 6.... .oo 13... .00 21... .00 29... .00 7. ••• .00 14. •• .00 22... .00 30. •• .00
15... .00 23... .00 31... .00
MoNrHLY-MEAN-orscHARGE:-rN-cusic-FEEr-PE~-s[coNo~~~~~~~~~~~~~~~~~~~~~~~~~~~~~~~~-----------2~43 MONTHLY TOTAL ACRE-FEET ••••••••••• .'............................................. 150 RUNOFF, IN INCHES............................................................... .05
Period
August 1978--------------------
1957 to July 1978--------------
70
4,090
Highest mean discharge, in cubic feet per second for the indicated nwnber of consecutive days
-112-
3
25
1 ,830
11
993

GUADALUPE RIVER BASIN
(84) 08179500 MEDINA LAKE NEAR SAN ANTONIO, TX
LOCATION.--Lat 29°32'24", long 98°56'01", Medina County, Hydrologic Unit 12100302, at gate operating platfonn, 576ft (176m) from left end of Medina Dam on Medina River, 4.2 mi (6.8 km) upstream from Medina diversion dam, 13 mi (21 km) north of Castroville, 28 mi (45 km) west of San Antonio, and 70.4 mi (113.3 km) upstream from mouth. Water-quality sampling site at the center of low-water bridge 0.6 mi (1.0 km) downstream.
DRAINAGE AREA.--634 mP (1,642 km2 ).
PERIOD OF RECORD.--May 1913 to August 1978. Prior to October 1965, monthend contents only.
GAGE.--Nonrecording gage read once daily if stage changing materially, otherwise intennittently. Datum of gage is 7.80 ft (2.377 m) below National Geodetic Vertical Datum of 1929.
REMARKS.--The lake is fanned by a gravity-type concrete dam 1,580 ft (482 m) long. The dam was completed and storage began May 7, 1913. The uncontrolled spillway section is a cut through natural rock 880 ft (268m) long, with a 3-foot-wide (1 m) cutoff wall, located near right end of dam. The dam and lake are owned by the Bexar-Medina-Atascosa Counties Water Improvement District No. 1, which has a pennit from he Texas Water Rights Commission to irrigate 150,000 acres (60,700 hm 2 ) annually. An undetennined amount of water from the lake enters the Edwards and associ a ted 1 i mestones in the Bal cones Fau 1 t Zone, part of which is above and part below the dam. Water is released downstream to Medina Diversion Reservoir where it is diverted into Medina Canal by the Water Di strict. Figures given herein represent tot a 1 contents. Data regarding the dam and 1 ake are given in the fallowing table:
Top of dam ••••••••••••••••••••••••••••••••••••••••••••••••••••••••••••••••• Crest of spillway •••••••••••••••••••••••••••••••••••••••••••••••••••••••••• Water-supply outlet pipes (invert) ••••••••••••••••••••••••••••••••••••••••• Lowest gated outlet (invert) .............................................. .
Gage height (feet)
Capacity (acre-feet)
254,000 4,780
0
COOPERATION. --Capacity tab 1 e, based on survey made prior to June 1912, and gage height record furnished by Bexar-Medina-Atascosa Counties Water .Improvement District No. 1.
MAXIMA (at 0800): FOR AUGUST 1978.--Contents, 281,000 acre-ft (346 hm 3 ) Aug. 2, 1978, gage height, 1,076.67 ft (328.169 m). FOR PERIOD 1913 to July 1978.--Maximum contents observed, 288,800 acre-ft (356 hm 3 ) Sept. 16, 1919, gage height,
1,078.0 ft (328.57 m).
CONTENTS, IN ACRE-FEET, AUGUST 1978 INSTANTANEOUS OBSERVATIONS AT 0800
-----------------------------------------------------------------------------------------------DAY CONTENTS DAY CONTENTS DAY CONTENTS DAY CONTENTS
-----------------------------------------------------------------------------------------------1 •••• 188,200 8 •••• 265,000 16 ••• 255,700 24 ••• 254,600 2 •••• 198.100 9 •••• 262,100 17 ••• 255,200 2 5 ••• 254,600 3 •••• 280,100 10 ••• 259,200 18 ••• 255,200 26 ••• 254,600 4 •••• 278,300 11. •• 256,900 19 ••• 255,200 2 7 •• 254,600 5 •••• 274,300 12 •.•• 256,300 20 ••• 255,200 28 ••• 254,000 6 •••• 271 ,400 13 ••• 255,700 21. •• 255,200 29 ••• 254,000 7 •••• 268,500 14 ••• 255,700 22 ••• 255,200 30 ••• 254,000
15 ••• 255,700 2 3 ••• 254,600 31 ••• 254,000
CHANGE IN CONTENTS, IN ACRE-FEET. ••••••••••••••••••••••••••••••••••••••••••••••• 65,400
-113-

GUADALUPE RIVER BASIN
{86) 08180800 MEDINA RIVER NEAR SOMERSET, TX
LOCATION.--Lat 29°15'45", long 98°34'56", Rexar County, Hydrologic Unit 12100302, on left bank 300ft {91 m) upstream from bridge on State Highway 16, 2.1 mi {3.4 km) upstream from Elm Creek, 4.9 mi (7.9 km) downstream from Media Creek, 5.2 mi {8.4 km) northeast of Somerset, and 14.1 mi {22.7 km) upstream from mouth.
DRAINAGE AREA.--967 mP (2,505 km 2 ), 634 mil {1 ,642 km 2 ) above dam forming Medina Lake.
PERIOD OF RECORD .--October 1970 to August 1978.
GAGE.--Water-stage recorder. Datum of gage is 493.56 ft {150.437 m) National Geodetic Vertical Datum of 1929.
REMARKS.--Flow is regulated by Medina Lake (station 08179500) 56 mi {90 km) upstream and by Medina Diversion Lake, capacity 4,500 acre-ft (5.55 hm 3 ). A large part of the streamflow is lost into the Edwards and associated limestones in the Balcones Fault Zone which crosses the basin between the upstream end of Medina Lake and about 5 mi (8 km) downstream from Medina Dam or 0.9 mi {1.4 km) downstream from the diversion dam. There are several small diversions below Medina Diversion Dam.
MAXIMA: FOR AUGUST 1978.--Discharge, 12,800 ft 3 /s {362 m3 /s) Aug. 4, 1978, gage height, 22.35 ft {6.812 m). FOR PERIOD 1970 to July 1978.--Maximum discharge, 30,500 ft 3 /s {864 m3 /s) July 17, 1973 gage height, 29.39 ft (8.958 m). HISTORIC.--Maximum stage since about 1890, that of July 17, 1973.
MEAN DISCHARGE, IN CUBIC FEET PER SECOND, AUGUST 1978
DAY DISCHARGE DAY DISCHARGE DAY DI,SCHARGE DAY DISCHARGE
-----------------------------------------------------------------------------------------------1 •••• 62 8 •••• 1 ,880 16 ••• 536 24 ••• 2 •••• 268 9 •••• 1,570 17 ••• 477 25 ••• 3 •••• 2,260 10 ••• 1 '170 18 ••• 420 26 ••• 4 •••• 10,700 11 ••• 974 19 ••• 372 27 ••• 5 •••• 6,450 12 ••• 848 20 ••• 327 28 ••• 6 •••• 3,470 13 ••• 746 21 ••• 289 29 ••• 7 •••• 2,190 14 ••• 664 22 ••• 263 30 •••
15 ••• 595 23 ••• 231 31 •••
MONTHLY MEAN DISCHARGE, IN CUBIC FEET PER SECOND •••••••••••••••••••••••••••••••• MONTHLY TOTAL ACRE-FEET •••••••••••••••••••••••••••••••••••••••••••••••••••••••••
Period
August 1978--------------------
1971 to July 1978--------------
10,700
24,800
Higf!est mean discharge, in cubic feet per second for the indicated number·of consecutive days
-114-
3
6,870
15,900
4,070
9,540
196 162 145 133 125 120 118 121
1,220 75,100

GUADALUPE RIVER RASIN
(87) 08181500 MEDINA RIVER AT SAN ANTONIO, TX
LOCATION.--Lat 29°15'14", long 98°28'20", Rexar County, Hydrologic Unit 12100302, near left bank on downstream side of pier of upstream bridge of two bridges on U.S. Highway 281 in San Antonio and 6.8 mi {10.9 km) upstream from mouth.
DRAINAGE AREA.--1,317 mP (3,411 km2 ), 634 mil {1,642 km 2 ) is above dam forming Medina Lake.
PERIOD OF RECORD.--October 1929 to December 1930, July 1939 to August 1978. October 1929 to December 1930 records below about 50 ft 3 /s (1.42 m3 /s) in connection with seepage investigation {published as "at Losoya"). Published as "near San Antonio" July 1939 to September 1970.
GAGE.--Water-stage recorder. Datum of gage is 439.0 ft {133.81 m) National Geodetic Vertical Datum of 1929 {levels by Corps of Engineers). October 1929 to December 1930 nonrecording gage at Losoya 1.5 mi (2.4 km) downstream at different datum.
REMARKS.--Flow is slightly regulated by Medina Lake (station 08179500) 60 mi {97'km) upstream and diversion dam reservoir, capacity 4,500 acre-ft {5.55 hm 3 ). For statement concerning losses into the Edwards and associated limestones formation, see Medina River near Somerset (station 08180800),
MAXIMA: FOR AUGUST 1978.--Discharge, 1,030 ft 3 /s {29.2 m3 /s) Aug. 4, 1978, gage height, 29.95 ft (9.129 m). FOR PERIOD 1939 to July 1978.--Maximum discharge, 31,900 ft 3 /s {903 m3 /s) Sept. 17, 1973, gage height, 43.59 ft {13.286 m). HISTORIC.--Maximum stage, 55ft {16.8 m) sometime prior to construction of Medina Dam in 1913, from information by Texas
Department of Highways and Public Transportation.
MEAN DISCHARGE, IN CUBIC FEET PER SECOND, AUGUST 1978
DAY
1 •••• 2 •••• 3 •••• 4 •••• 5 •••• 6 •••• 7 ••••
DISCHARGE
247 788 434
7,760 6,250 3. 370 2,140
DAY
8 •••• 9 •••• 10 ••• 11. .. 12 ••• 13 ... 14 ••• 15 •••
DISCHARGE
1. 650 1,500 1 • 210 1. 100
977 856 762 689
DAY
16 ••• 17 ••• 18 ••• 19 ••• 20 ••• 21 ••• 2 2 ••• 23 ...
DISCHARGE
630 558 508 462 428 397 387 366
DAY
24 ••• 25 ... 26 ••• 27 ••• 28 ••• 29 ••• 30 ••• 31 •••
MONTHLY MEAN DISCHARGE, IN CUBIC FEET PER SECOND •••••••••••••••••••••••••••••••• MONTHLY TOTAL ACRE-FEET •••••••••••••••••••••••••••••••••••••••••••••••••••••••••
Pe1'iod
August 1978--------------------
1941 to July 1978--------------
7,760
28,300
Highest mean ,discharge, in cubic feet pe1' second fo1' the indicated number' of consecutive days
-115-
3
5,790
18,600
3,410
10,600
DISCHARGE
339 312 287 262 256 251 256 255
1 ,150 70,800

GUADALUPE RIVER BASIN
(88) 08183900 CIBOLO CREEK CREEK NEAR BOERNE, TX
LOCATION.--Lat 29°46'26", long 98°41'50", Kendall County, Hydrologic Unit 12100304, on left bank 0.6 mi {1.0 km.) upstream from Southern Pacific Lines bridge, 0.9 mi {1.4 km) downstream from Menger Creek, and 2.5 mi (4.0 km) southeast of Boerne.
DRAINAGE AREA.--68.4 mP {177.2 km2).
PERIOD OF RECORD.--March 1962 to August 1978.
GAGE.--Water-stage recorder. Datum of gage is 1,339.61 ft (408.313 m) National Geodetic Vertical Datum of 1929.
REMARKS.--No known diversion above station.
MAXIMA: FOR AUGUST 1978.--Discharge, 462 ft 3 /s (13.1 m3 /s) Aug. 2, 1978, gage height, 3.65 ft (1.113 m). FOR PERIOD1962 to July 1978.--Maximum discharge, 36,400 ft 3 /s (1,030 m3 /s) Sept. 27,1964, gage height, 19.15 ft (5.837
m), ·from floodmark, from rating curve extended above 2,500 ft 3 /s (70.8 m3 /s) on basis of slope-area measurement at 12,000 ft 3 /s {340 m3 /s) and contracted-opening measurement of 36,400 ft 3 /s {1,030 m3 /s).
HISTORIC.--Maximum stage since at least 1892, that of Sept. 27, 1964. Second highest flood in 1952 reached a stage of 16.3 ft (4.97 m), discharge 25,600 ft 3 /s (725 m3 /s), from information by local resiclents.
MEAN DISCHARGE, IN CUBIC FEET PER SECOND, AUGUST 1978
DAY DISCHARGE DAY DISCHARGE DAY DISCHARGE DAY DISCHARGE
1 •••• 21 8 •••• 1. 5. 16 ••• • 88 24 ••• 1.2 2 •••• 97 9 •••• .97 17 ••• • 96 25 ••• 1.2 3 •••• 4.7 10 ••• .88 18 ••• 1.0 26 ••• 1.3 4 .... 2.0 11 ••• .89 19 ••• 1.1 2 7 ••• 1.2 5 •••• 1.2 12 ... .93 20 ••• 1.1 28 ••• 1.1 6 •••• 1.1 13 ... 1.0 21 ••• 1.2 29 ••• 1.4 7 •••• 2. 7 14 ••• 1.0 22 ••• 1.2 30 ••• 2.3
15 ... .90 23 ••• 1.2 31 ••• 3.4 ----------------------------------------------------------------MONTHLY MEAN DISCHARGE, IN CUBIC FEET PER SECOND •••••••••••••••• :::::::::::::::~-----------~:i~ MONTHLY TOTAL ACRE-FEET......................................................... 316 RUNOFF, IN INCHES ••••••••••••••••••••••••••••• ·•••••••••••••••••••••••••••••••••• .09
Period
August 1978--------------------
1963 to July 1978--------------
97
3,830
Highest mean dischaTge, in cubic feet peT second foT the indicated numbeT of consecutive days
-116-
3
41
l ,510
19
831

NUECES RIVER BASIN
(89) 08195000 FRIO RIVER AT CONCAN, TX
LOCATION.--Lat 29°29'18", long 99°42'16", Uvalde County, Hydrologic Unit 12110106, on left bank 0.7 mi (1.1 km) southeast of Concan Post Office, 15 mi (24 km) upstream from Dry Frio River, and 224.1 mi (360.6 km) upstream from mouth.
DRAINAGE AREA.--405 mil (1 ,049 km2 ).
PERIOD OF RECORD .--October 1923 to September 1929, October 1930 to August 1978.
GAGE.--Water-stage recorder. Datum of gage is 1,203.71 ft (366.891 m) National Geodetic Vertical Datum of 1929. Oct. 26, 1923, to July 28, 1924, nonrecording gage at site 86ft (26m) upstream at datum 5.08 ft (1.548 m) lower. July 29, 1924, to Oct. 3, 1930, nonrecording gage, and Oct. 4, 1930, to May 18, 1939, water-stage recorder, at site 130ft (40 m) downstream at present datum. gage at
REMARKS.--Many small diversion for irrigation above station.
MAXIMA: FOR AUGUST 1978.--D·ischarge, 3,350 ft 3 /s (94.9 m3 /s) Aug. 2, 1978, gage height, 6.90 ft (2.103 m). FOR PERIOD 1923 to July 1978.--Maximum discharge, 162,000 ft 3 /s (4,590 m3 /s) July 1, 1932, gage height, 34.44 ft (10.497
m), from floodmarks, from rat'ing curve extended above 44,000 ft 3 /s (1,250 m3 /s) on basis of flow-over-dam measurement of 56,600 ft 3 /s (1,600 m3 /s) and slope-area measurement of 162,000 ft 3 /s (4,590 m3 /s).
HISTORIC.--Maximum stage since at least 1869, that of July 1, 1932.
MEAN DISCHARGE, IN CUBIC FEET PER SECOND, AUGUST 1978
DAY DISCHARGE DAY DISCHARGE DAY DISCHARGE DAY
1 •••• 65 8 •••• 165 16 ••• 105 24 ••• 2 •••• 834 9 •••• 151 17 ••• 101 25 ••• 3 •••• 616 10 ••• 139 18 ••• 97 26 ••• 4 •••• 415 11 ••• 133 19 ••• 95 27 ••• 5 •••• 280 12 ••• 129 20 ••• 91 28 ••• 6 •••• 207 13 ••• 126 21 ••• 88 29 ••• 7 •••• 184 14 ••• 118 22 ••• 86 30 •••
15 ••• 110 23 ••• 83 31 •••
MONTHLY MEAN DISCHARGE, IN CUBIC FEET PER SECOND •••••••••••••••••••••••••••••••• MONTHLY TOTAL ACRE-FEET ••••••••••••••••••••••••••••••••••••••••••••••••••••••••• RUNOFF, IN INCHES •••••••••••••••••••••••••••••••••••••••••••••••••••••••••••••••
Pe1'iod
August 1978--------------------
1926 to July 1978
834
52,000
Highest mean disaha1'ge, in aubia feet pel' seaond fo1' the indiaated numbe1' of aonseautive days
3
622
23,700
:..117-
3136
11 ,000
DISCHARGE
81 79 77 77 74 75 75 75
162 9,980
.46

NUECES RIVER BASIN
{90) 08196000 DRY FRIO RIVER NEAR REAGAN WELLS, TX
LOCATION.--Lat 29°30'16", long 99°46'52", Uvalde County, Hydrologic Unit 12110106, on right bank 2.3 mi {3.7 km) upstream from bridge on U.S. Highway 83, 3.1 mi {5.0 km) upstream from Rocky Creek, and 4.3 mi {6.9 km) sou~heast of Reagan Wells.
DRAINAGE AREA.--117 mP {303 km2 ).
PERIOD OF RECORD.--September 1952 to August 1978.
GAGE.--Water-stage recorder. Datum of gage is 1,335.2 ft .{406.97 m) National Geodetic Vertical Datum of 1929.
REMARKS.--Several small diversions above station.
MAXIMA: FOR AUGUST 1978.--Discharge, 1,500 ft 3 /s {42.5 m3 /s) Aug. 1, 1978, gage height, 5.23 ft {1.594 m). FOR PERIOD 1952 to July 1978.--Maximum discharge, 123,000 ft 3 /s {3,480 m3 /s) Aug. 13, 1966, gage height, 27.6 ft {8.41 m),
from floodmark, from rating curve extended above 900 ft3/s {25.5 m3 /s) on basis of slope-area measurements of 11,400, 30,700, 64,700, and 123,000 ft 3 /s {323, 869, 1,830, and 3,480 m3 /s).
HISTORIC.--Maximum stage since at least 1875 occurred in 1880, about 33ft {10.1 m). Flood of June 14, 1935, reached a stage of 26.0 ft {7.92 m), discharge at site 2.6 mi {4.2 km) upstream, 64,700 ft 3 /s {1,830 m3 /s), and that of July 1, 1932, reached a stage of 23ft {7.0 m), discharge at site 2.0 mi {3.2 km) upstream, 30,700 ft3/s {869 m3 /s), from information by local residents.
MEAN DISCHARGE, IN CUBIC FEET PER SECOND, AUGUST 1978
DAY
1 .•• ; 2 •••• 3 •••• 4 •••• 5 •••• 6 •••• 7 ••••
DISCHARGE
334 136
68 46 36 32 32
DAY
8 •••• 9 •••• 10 ••• 11 ••• 12 ••• 13 ••• 14 ••• 15 •••
DISCHARGE
29 27 25 22 18 15 15 15
DAY
16 ••• 17 ••• 18 ••• 19 ••• 20 ••• 21 ••• 22 ••• 23 •••
DISCHARGE
16 15 14 12 9.8
12 8 .• 8 8.1
DAY
24 ••• 25 ••• 26 ••• 27 ••• 28 ••• 29 ••• 30 ••• 31 •••
MONTHLY MEAN DISCHARGE, IN CUBIC FEET PER SECOND ••••••• ~·················~······ MONTHLY TOTAL ACRE-FEET ••••••••••••••••••••••••••••••••••••••••••••••••••••••••• RUNOFF, IN INCHES ................................................... ~ ••••••••••••
Period
August 1978--------------------
1953 to July 1978--------------
Highest mean discharge, in cubic feet per second for the indicated number of consecutive days
334
8,100
-ll8-
3
179
3,160
98
1 ,440
DISCHARGE
7.6 7.2 5.6 5.5 6.2
14 6.7 6.3
32.4 1,990
.32

NUECES RIVER BASIN
(91) 08198000 SABINAL RIVER NEAR SABINAL, TX
LOCATION.--Lat 29°29'35", long 99°29'49", Uvalde County, Hydrologic Unit 12110106, on right bank 108ft (33m) upstream from concrete dam, 2.3 mi (3.7 km) downstream fran mouth of Onion Creek, and 12.5 mi (20.1 km) north of Sabinal.
DRAINAGE AREA.--206 mil (534 km1 ).
PERIOD OF RECORD.--October 1942 to August 1978.
GAGE.--Water-stage recorder. Datum of gage is 1,131.20 ft (344.790 m) National Geodetic Vertical Datum of 1929. Prior to Apr. 9, at 1971, site 0.3 mi (0.5 km) downstream at same datum.
REMARKS.--Several small diversions above station for irrigation.
MAXIMA: FOR AUGUST 1978.--Discharge, 23,200 ft 3 /s (657 m3 /s) Aug. 2, 1978, gage height, 19.43 ft (5.922 m). FOR PERIOD 1942 to July 1978.--Maximum discharge, 55,200 ft 3 /s (1,560 m3 /s) June 17, 1958 gage height, 28.3 ft (8.63 m),
fran floodmark at present site, fran rating curve extended above 6,900 ft 3 /s (195 m3 /s) on basis of slope-are measurement of 55,200 ft 3 /s (1,560 m3/s). ·
HISTORIC.--Maximum stage since at least 1892, about 33ft (10.1 m) July 2, 1932, from information by local residents. There is a legend that a flood in the middle 1800's reached a stage of nearly 63 ft (19.2 m).
MEAN DISCHARGE, IN CUBIC FEET PER SECOND, AUGUST 1978
DAY DISCHARGE DAY DISCHARGE DAY DISCHARGE DAY
1 •••• 49 8 •••• 96 16 ••• 52 24 ••• 2 •••• 5,710 9 •••• 86 17 ••• 49 25 ••• 3 •••• 1, 480 1 0 ••• 78 18 ••• 45 26 ••• 4 •••• 331 11. •• 73 19 ••• 42 27 ••• 5 •••• 186 12 ••• 68 20 ••• 40 28 ••• 6 •••• 135 13 ••• 63 21 ••• 38 29 ••• 7 •••• 111 14 ••• 61 22 ••• 37 30 •••
15 ••• 56 23 ••• 35 31 •••
MONTHLY MEAN DISCHARGE, IN CUBIC FEET PER SECOND •••••••••••••••••••••••••••••••• MONTHLY TOTAL ACRE-FEET ••••••••••••••••••••••••••••••••••••••••••••••••••••••••• RUNOFF, IN INCHES •••••••••••••••••••••••••••••••••••••••••••••••••••••••••••••••
Period
August 1978--------------------
1943 to July 1978--------------
Highest mean discharge, in cubic feet per second for the indicated number of consecutive days
5,710
13,000
-119-
3
2,510
5,020
1,150
2,540
DISCHARGE
36 29 32 48 46 49 49 52
299 18,400
1. 67

NUECES RIVER BASIN
{92) 08200000 HONDO CREEK NEAR TARPLEY, TX
LOCATION.--Lat 29°34'10", long 99°14'47':, Medina County, Hydrologic Unit 12110107, on left bank 460ft {140m) downstream from bridge on Ranch Road 462, 6.3 mi (10.1 km) southeast of Tarpley, and 16.6 mi {26.7 km) northwest of Hondo.
DRAINAGE AREA.--86.2 mP {223.3 km2 ).
PERIOD OF RECORD.--August 1952 to August 1978.
GAGE.--Water-stage recorder. Datum of gage is 1,169.1 ft {356.34 m) National Geodetic Vertical Datum of 1929 {Magnolia Oil Co. bench rna rk).
REMARKS.--Several small diversions for irrigation above ·station.
MAXIMA: FOR AUGUST 1978.--Discharge, 13,200 ft 3 /s {374 m3 /s) Aug. 2, 1978, gage height, 13.10 ft {3.993 m). FOR PERIOD 1952 to July 1978.--Maximum discharge, 69,8.00 ft 3 /s (1,980 m3 /s) June 17, 1958, gage height, 28.2 ft (8.60 m),
from floodmark, from rati-ng curve extended above 2,600 ft 3 /s {73.6 m3 /s) on basis of slope-area measurements of 18,600 and 69,800 ft 3 /s {527 and 1,980 m3 /s).
HISTORIC.--Maximum stage .since at least 1907, that of June 17, 1958. Flood in July 1932, reached a stage of about 26 ft (7.9 m), discharge 58,500 ft 3 /s (1,660 m3 /s), from information by local resident.
MEAN DISCHARGE, IN CUBIC FEET PER SECOND, AUGUST 1978
DAY DISCHARGE DAY DISCHARGE DAY DISCHARGE DAY
1 •••• 84 8 •••• 82 16 ••• 40 24 ••• 2 •••• 3,120 9 •••• 70 17 ••• 39 25 ••• 3 •••• 488 1 0 ••• 62 18 ••• 37 26 ••• 4 •••• 234 11 ••• 56 19 ••• 37 27 ••• 5 •••• 152 12 ••• 53 20 ••• 35 28 ••• 6 •••• 114 13 ••• 48 21 ••• 34 29 ••• 7 •••• 97 14 ••• 46 22 ••• 34 30 •••
15 ••• 42 23 ••• 31 31 •••
MONTHLY MEAN DISCHARGE; IN CUBIC FEET PER SECOND •••••••••••••••••••••••••••••••• MONTHLY TOTAL ACRE-FEET ••••••••••••••••••••••••••••••••••••••••••••••••••••••••• RUNOFF, IN INCHES •••••••••••••••••••••••••••••••••••••••••••••••••••••••••••••••
Period
August 1978--------------------
1953 to July 1978--------------
3,120
11 ,900
Highest mean discharge, in cubic feet per second for the indicated number of consecutive days
-120-
3
1 ,280
4,440
613
2,350
DISCHARGE
32 31 31 30 28 31 35 31
170 10,500
2.28
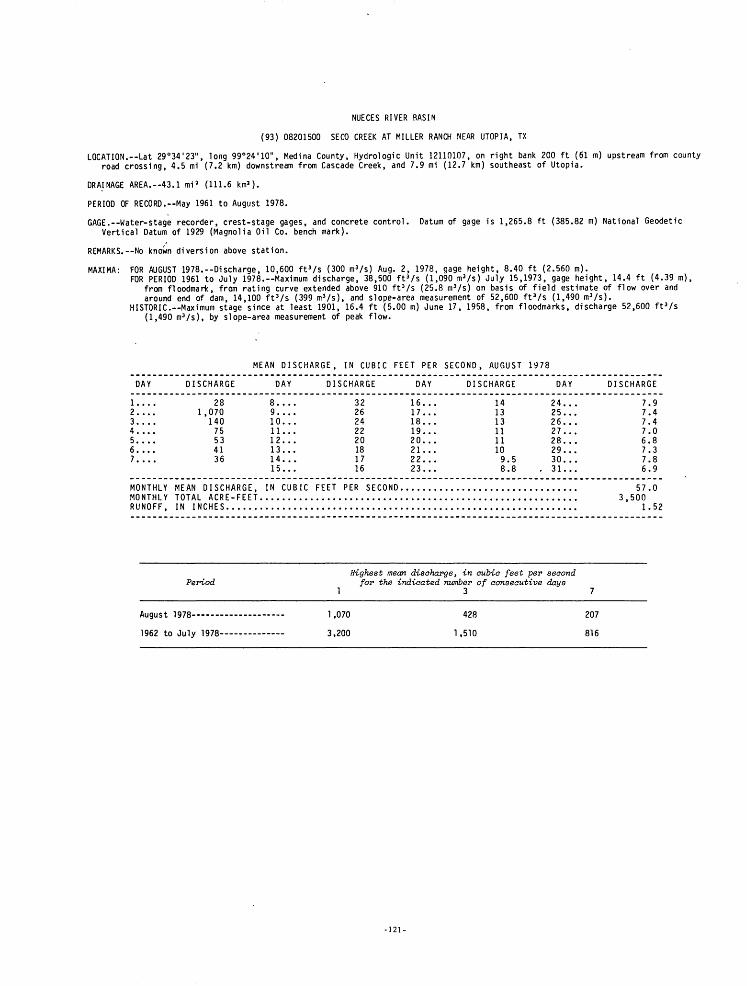
NUECES RIVER RASIN
(93) 08201500 SECO CREEK AT MILLER RANCH NEAR UTOPIA, TX
LOCATION.--Lat 29°34'23", long 99°24'10", Medina County, Hydrologic Unit 12110107, on right bank 200ft (61 m) upstream from county road crossing, 4.5 mi (7.2 km) downstream from Cascade Creek, and 7.9 mi (12.7 km) southeast of Utopia.
DRA~NAGE AREA.--43.1 mil (111.6 km1 ).
PERIOD OF RECORD.--May 1961 to August 1978.
GAGE.--Water-stage recorder, crest-stage gages, and concrete control. Datum of gage is 1,265.8 ft (385.82 m) National Geodetic Vertical Datum of 1929 (Magnolia Oil Co. bench mark).
REMARKS.--No kno~n diversion above station.
MAXIMA: FOR AUGUST 1978.--Discharge, 10,600 ft 3 /s (300 m3 /s) Aug. 2, 1978, gage height, 8.40 ft (2.560 m). FOR PERIOD 1961 to July 1978.--Maximum discharge, 38,500 ftl/s (1,090 m3 /s) July 15,1973, gage height, 14.4 ft (4.39 m),
from floodmark, from rating curve extended above 910 ft 3 /s (25.8 m3 /s) on basis of field estimate of flow over and around end of dam, 14,100 ft 3 /s (399 m3 /s), and slope-area measurement of 52,600 ft 3 /s (1,490 m3 /s).
HISTORIC.--Maximum stage since at least 1901, 16.4 ft (5.00 m) June 17, 1958, from floodmarks, discharge 52,600 ft 3 /s (1,490 m3 /s), by slope-area measurement of peak flow.
MEAN DISCHARGE, IN CUBIC FEET PER SECOND, AUGUST 1978
DAY
1 •••• 2 •••• 3 •••• 4 •••• 5 •••• 6 •••• 7 ••••
DISCHARGE
28 1,070
140 75 53 41 36
DAY
8 ..•• 9 •••• 10 ••• 11 ••• 12 ••• 13 ••• 14 ••• 15 •••
DISCHARGE
32 26 24 22 20 18 17 16
DAY
16 ••• 17 ••• 18 ••• 19 ••• 20 ••• 21 ••• 22 ••• 23 •••
DISCHARGE
14 13 13 11 11 10 9.5 8.8
DAY
24 ••• 25 ••• 26 ••• 27 ••• 28 ••• 29 ••• 30 ••• 31 •••
MONTHLY MEAN DISCHARGE, IN CUBIC FEET PER SECOND •••••••••••••••••••••••••••••••• MONTHLY TOTAL ACRE-FEET ••••••••••••••••••••••••••••••••••••••••••••••••••••••••• RUNOFF, IN INCHES •••••••.••••••••••••••••••••••••••••••••••••••••••••••••••••••••
PeT'iod
August 1978--------------------
1962 to July 1978--------------
1,070
3,200
Highest mean discharge, in cubic feet per second for the indicated number of consecutive days
-121-
3
428
1,510
207
816
DISCHARGE
7.9 7.4 7.4 7.0 6.8 7.3 7.8 6.9
57.0 3,500
1. 52