florida standards assessments · form assessment making use of several technology-enhanced item...
TRANSCRIPT

Florida Standards Assessments
2016–2017
Volume 6 Score Interpretation Guide

FSA 2016–2017 Technical Report: Volume 6
Score Interpretation Guide i Florida Department of Education
ACKNOWLEDGMENTS This technical report was produced on behalf of the Florida Department of Education. Requests for additional information concerning this technical report or the associated appendices should be directed to Dr. Salih Binici at the Florida Department of Education ([email protected]). Major contributors to this technical report include the following staff from the American Institutes for Research (AIR): Dr. Harold Doran, Dr. Elizabeth Ayers-Wright, Dr. Dipendra Subedi, Dr. MinJeong Shin, Dr. Ah-Young Shin, Patrick Kozak, Mayumi Rezwan, Kathryn Conway, and Emily Rubenstein. The major contributors from the Florida Department of Education are as follows: Dr. Salih Binici, Dr. Qian Liu, Vince Verges, Victoria Ash, Susie Lee, Zhongtian Lin, Susan Taylor, Sally Rhodes, and Travis Barton.

FSA 2016–2017 Technical Report: Volume 6
Score Interpretation Guide ii Florida Department of Education
TABLE OF CONTENTS 1. FLORIDA SCORE REPORTS ...........................................................................1
1.1 Overview of Florida’s Score Reports ................................................................................... 1 1.2 Overall Scores and Reporting Categories ............................................................................ 2 1.3 Available Reports of the FSA Reporting System ................................................................. 3
1.3.1 Participation Reports—TIDE ...................................................................................... 4 1.3.2 FSA Reporting System Home Page .............................................................................. 5 1.3.3 PDF/Excel Reports ...................................................................................................... 6 1.3.4 Data Files .................................................................................................................. 14
1.4 Student Reports .................................................................................................................. 16 1.4.1 Student Report USBs .................................................................................................. 16
2. CALCULATION OF STUDENT SCORES .....................................................19
2.1 Points Possible .................................................................................................................... 19 2.2 Theta Score Estimation ...................................................................................................... 19 2.3 Scale Scores ........................................................................................................................ 19 2.4 Alternate Passing Score ...................................................................................................... 19 2.5 Standard Errors ................................................................................................................... 20
3. INTERPRETATION OF REPORTED SCORES .............................................21
3.1 Business Rules .................................................................................................................... 21 3.1.1 Inclusion in Aggregation ........................................................................................... 21 3.1.2 Aggregation ............................................................................................................... 21 3.1.3 Student Mobility Rules ............................................................................................... 22 3.1.4 Minimum Group Size ................................................................................................. 22
3.2 Interpretations ..................................................................................................................... 22 3.2.1 Scale Scores ............................................................................................................... 22 3.2.2 Alternate Passing Scores ........................................................................................... 22 3.2.3 Reporting Categories ................................................................................................. 22
4. CAVEON ANALYSIS .....................................................................................24
LIST OF APPENDICES
A. FSA Reporting System User Guide B. TIDE User Guide C. Understanding FSA Reports D. Sample Student Report
FSA 2016–2017 Technical Report: Volume 6
Score Interpretation Guide iii Florida Department of Education
LIST OF TABLES .......................................................................................... 2
Table 2: Reporting Categories for Mathematics ............................................................................. 2 Tabl
Table 1: Reporting Categories for ELA
e 3: Reporting Categories for EOC.......................................................................................... 3 Table 4: Florida Online Score Reports Summary ........................................................................... 4 Table 5: Communication Dates .................................................................................................... 14 Table 6: FSA Eligibility Requirements and Passing Scores ......................................................... 20 Table 7: School Type .................................................................................................................... 21
LIST OF FIGURES
Figure 1: Participation Report ......................................................................................................... 5 Figure 2: FSA-R Home Page Screen Capture ................................................................................. 6 Figure 3: A Sample State Summary Report for ELA ..................................................................... 8 Figure 4: A Sample District Summary Report ................................................................................ 9 Figure 5: A Sample State Report of Districts ............................................................................... 10 Figure 6: A Sample District Report of Schools ............................................................................ 11 Figure 7: A Sample School Report of Students ............................................................................ 13 Figure 8: Password for Downloadable Data Zip File ................................................................... 15 Figure 9: A Sample FSA ELA Student Report ............................................................................. 18
FSA 2016–2017 Technical Report: Volume 6
Score Interpretation Guide 1 Florida Department of Education
1. FLORIDA SCORE REPORTS
The Florida Standards Assessments (FSA) were first administered to students in spring 2015, replacing the Florida Comprehensive Assessment Test 2.0 (FCAT 2.0) Reading, Writing, and Mathematics assessments. In spring 2017, the FSA was primarily delivered as an online, fixed-form assessment making use of several technology-enhanced item types. Paper-based forms were administered to all students in grade 3 Reading, and paper-based versions were available to students in all other grades and those participating in End-of-Course (EOC) assessments only if such a need was indicated on a student’s Individual Educational Plan (IEP) or Section 504 Plan. The FSA Writing component was administered on paper for students in grades 4 through 7 and online for students in grades 8 through 10, with paper-based accommodations offered to students whose IEPs or Section 504 Plans stipulated that need. Students in grade 3 were not administered a Writing component.
By statute, all Florida public school students were required to participate in the statewide assessments. Students took the FSA Reading, Writing, Mathematics, and EOC assessments in the spring. The EOC assessments were administered in Fall 2016, Winter 2016, and Summer 2017 (no Algebra 2 EOC). An Algebra 1 retake was also administered in Spring 2017. A grade 10 ELA retake was administered in Fall 2016 and Spring 2017.
The purpose of this volume, Score Interpretation Guide, is to document the features of the FSA Reporting System (FSA-R), which was designed to assist stakeholders in reviewing and downloading the test results and in understanding and appropriately using the results of the state assessments. Additionally, this volume describes the score types reported for the Spring 2017 assessments, the feature of the student report and the appropriate uses and inferences that can be drawn from those score types.
1.1 OVERVIEW OF FLORIDA’S SCORE REPORTS
FSA Reading, Writing, Mathematics, and three EOC assessments were administered in the spring. Reading and Writing responses were combined to create an overall English Language Arts (ELA) scale score. Test scores from each Spring 2017 assessment were provided to districts and schools through the FSA-R after FDOE verified the student and score information included in the data files and score reports. The FSA-R provided information on student performance and aggregated summaries at several levels—state, district, and school. Additionally, printed Student Reports were delivered to districts, packaged by school, for distribution to parents. Districts also received a USB drive with an electronic version of the Student Reports for their students, which they were able to save locally and print as needed.
The FSA-R (accessible at https://FSAReports.airast.org) is a web-based application that provided access to the FSA results at various, appropriate levels. Test results availability to any given user was based on his or her user role. There were two basic levels of user roles: the district level and the school level. Each user was granted drill-down access to reports in the system based on his or her assigned user role. This meant that schools could access data for the students only in their school, while districts could access data for the schools and students in their district.

FSA 2016–2017 Technical Report: Volume 6
Score Interpretation Guide 2 Florida Department of Education
The following users had access to the system:
• State users: Access to all data at the state-, district-, school-, and student-levels.
• District Assessment Coordinator (DAC) users: Access to all data for their district and the schools and students in their district.
• School Administrator (SA) users: Access to all data for their school and the students in their school.
Access to the reports was password protected, and users were able to access data at their assigned level and below. For example, an SA could access the school report of students for his or her school but not for another school.
1.2 OVERALL SCORES AND REPORTING CATEGORIES
Each student received a single scale score for each subject tested. A student’s score was based only on the operational items on the assessment. In the State Student Results (SSR) and District Student Results (DSR) data files, the total raw score, theta score, points earned by reporting category, scale score, and performance level are calculated if the test record was assigned a score status flag of 1 or 9, meaning score reported. The computation of the various student scores is outlined below in Section 2 and discussed further in Volume 1, Annual Technical Report.
Student reports and School Report of Students also provided the possible number of points for each reporting category and the number of points earned in each category. The points earned and points possible for each reporting category were established using the same items used to calculate overall scores. The points possible could vary depending on the test forms (e.g., online vs. paper accommodated). Table 1, Table 2, and Table 3 display the reporting categories by grade and subject.
Table 1: Reporting Categories for ELA Grade Reporting Category
3
1. Key Ideas and Details 2. Craft and Structure 3. Integration of Knowledge and Ideas 4. Language and Editing Task
4–10
1. Key Ideas and Details 2. Craft and Structure 3. Integration of Knowledge and Ideas 4. Language and Editing Task 5. Text-based Writing
Table 2: Reporting Categories for Mathematics Grade Reporting Category
3 1. Operations, Algebraic Thinking, and Numbers in Base Ten 2. Numbers and Operations—Fractions 3. Measurement, Data, and Geometry
4
1. Operations and Algebraic Thinking 2. Numbers and Operations in Base Ten 3. Numbers and Operations—Fractions 4. Measurement, Data, and Geometry

FSA 2016–2017 Technical Report: Volume 6
Score Interpretation Guide 3 Florida Department of Education
5 1. Operations, Algebraic Thinking, and Fractions 2. Numbers and Operations in Base Ten 3. Measurement, Data, and Geometry
6
1. Ratio and Proportional Relationships 2. Expressions and Equations 3. Geometry 4. Statistics and Probability 5. The Number System
7
1. Ratio and Proportional Relationships 2. Expressions and Equations 3. Geometry 4. Statistics and Probability 5. The Number System
8
1. Expressions and Equations 2. Functions 3. Geometry 4. Statistics & Probability and The Number System
Table 3: Reporting Categories for EOC
Course Reporting Category
Algebra 1 1. Algebra and Modeling 2. Functions and Modeling 3. Statistics and the Number System
Algebra 2 1. Algebra and Modeling 2. Functions and Modeling 3. Statistics, Probability, and the Number System
Geometry 1. Congruence, Similarity, Right Triangles and Trigonometry 2. Circles, Geometric Measurement, and Geometric Properties with Equations 3. Modeling with Geometry
1.3 AVAILABLE REPORTS OF THE FSA REPORTING SYSTEM
The FSA-R was hierarchically structured. The interactive home page had drop-down menus with a list of aggregated units (e.g., districts, schools within a district) from which the user could choose. An authorized user was able to view reports at his or her own aggregated unit and additionally any lower level of aggregation. For example, a school user could view only the reports and data at the school and student levels at his or her school. DAC users could view the reports and data for their districts and also the student-level results at all of their schools. The FSA-R provided access to results in two main formats. The first format was PDF or Excel reports, which provided score data for each of the FSA assessments. Users could compare score data of individual students with the school, district, or overall state average scores. The second format was downloadable pipe-delimited text data files; this format allowed users to download zipped data files containing individual student and aggregate data for their district and the state. Only state- and district-user have access to downloadable data files.
Participation reports were also available on the Test Information Distribution Engine (TIDE) website (https://fl.tide.airast.org). These reports indicated the students who had completed or needed to complete computer-based testing, and allowed users to view participation summary statistics (counts and percentages) of students who had tested.

FSA 2016–2017 Technical Report: Volume 6
Score Interpretation Guide 4 Florida Department of Education
A FSA Reporting System User Guide is included in Appendix A, and a TIDE User Guide is included in Appendix B. Appendix C, Understanding FSA Reports, includes explanations of the reports, information about the content assessed in Mathematics, ELA and EOC relating to the Florida Standards, and a glossary of terms used in the FSA reports.
Table 4 summarizes the types of score reports that were available in the FSA-R and the levels at which the reports could be viewed. A description of each report is also provided below. Data files were also accessible for district to download.
• District Student Results (DSR) file (district access only)
• District Aggregation Results (DAR) file (district access only)
• State Aggregation Results (SAR) file (district access only)
Table 4: Florida Online Score Reports Summary
Type of Report Page Level Description
State Summary (SS) State, District, School Summary of overall performance for a subject and a grade for all students in the state
District Summary (DS) State, District, School Summary of overall performance for a subject and a grade for all students in the district
State Report of Districts (SRD) State, District, School List of districts with performance overall for
the state District Report of Schools
(DRS) State, District, School List of schools with performance overall for a district
School Report of Students (SRS) for district State, District
Lists of all students who belonged to a district, ordered by school, with their associated subject scores
School Report of Students (SRS) State, District, School Lists of all students who belonged to a
school with their associated subject scores
1.3.1 Participation Reports—TIDE
Once a user logged in, he or she was directed to the home page, which allowed users to access the Participation Reports.
The Participation Report, shown in Figure 1, allowed teachers, principals, and district staff to see which students had not yet completed their tests. Users could select from a series of options to customize the group of students whose participation status was to be reviewed for a particular grade and subject, such as those who had started but had not completed their test or those who had not yet begun their test. Users could export the list into an Excel file and download the file.

FSA 2016–2017 Technical Report: Volume 6
Score Interpretation Guide 5 Florida Department of Education
Figure 1: Participation Report
1.3.2 FSA Reporting System Home Page
State, district, and school users could access student performance reports for the FSA through the FSA-R home page. Figure 2 displays the options a user could select from to access their assessment data. The drill-down options were:
• Year: Test administration year
• Administration: Spring, summer, fall, or winter
• Subject: ELA or Mathematics; or Algebra 1, Algebra 2, or Geometry
• Type: PDF/Excel reports or data files Depending on the report options selected, users are presented with options to select:
• Report: The user selects the report he or she wishes to download (e.g., State Summary, State Report of Districts, or School Report of Students).
• District: State-level users select which district they wish to view.
• School: State and district users select which school they wish to view

FSA 2016–2017 Technical Report: Volume 6
Score Interpretation Guide 6 Florida Department of Education
Figure 2: FSA-R Home Page Screen Capture
1.3.3 PDF/Excel Reports
When the user selected PDF/Excel reports, as shown in Figure 2, he or she had the option to download a PDF report or an Excel spreadsheet. The contents of these reports were the same with the exception that some of the Excel reports include additional information.
State Summary reports provided grade-level aggregated data for the state and displayed overall student performance for the selected test. All data were based on the total number of students who had taken and completed the test, submitted it for scoring, and had a reported score (i.e., a score flag status of 1). One PDF file per subject (Algebra 1, Algebra 1 Retake, Algebra 2, Geometry, and Grade 10 ELA Retake) was posted to the FSA-R for school and district access. Excel spreadsheets containing the same information in a modified format accompanied the PDF files. PDFs were produced for the initial reporting only and created based on the approved SAR file.
As shown in Figure 3 below, the State Summary Reports displayed the following data:
• Name: The name of the entity (district or school)
• Number of Students: Total count of students who took the test and had a score reported in the selected grade, subject, and administration

FSA 2016–2017 Technical Report: Volume 6
Score Interpretation Guide 7 Florida Department of Education
• Mean Scale Score: Mean scale score of students tested in the selected grade, subject, and administration
• Passing Percentage: Grade 10 ELA, Grade 10 ELA Retake, Algebra 1, Algebra 1 Retake, and Geometry only
• Percentage in Each Performance Level: Percentage of students in each level (levels 1, 2, 3, 4, and 5, and levels 3–5 combined)
For EOC assessments, counts were broken down by grade for first-time testers and for retakers.

FSA 2016–2017 Technical Report: Volume 6
Score Interpretation Guide 8 Florida Department of Education
Figure 3: A Sample State Summary Report for ELA

FSA 2016–2017 Technical Report: Volume 6
Score Interpretation Guide 9 Florida Department of Education
The District Summary Report was similar to the State Summary, except that it displayed summary data for all of the students in the selected district who had completed the selected test and had a valid score reported. A sample report is shown in Figure 4.
Figure 4: A Sample District Summary Report
The State Report of Districts, shown in Figure 5, provided both district and state aggregated data and contained summary performance for each district in the state, by grade. State totals were also

FSA 2016–2017 Technical Report: Volume 6
Score Interpretation Guide 10 Florida Department of Education
provided for all fields on the report. For EOC assessments, students were broken out by first-time testers and retakers. The report was generated by subject (Algebra 1, Algebra 1 Retake, Algebra 2, Geometry, and Grade 10 ELA Retake) and contained the same data elements as the State Summary, but was ordered by district number. An Excel spreadsheet containing the same data was posted with the PDF file.
Figure 5: A Sample State Report of Districts
The District Report of Schools, shown in Figure 6, provided aggregated data for the schools in a given district and contained summary performance for each school in a district, by grade. For any given district, one PDF file was generated per grade and subject (Algebra 1, Algebra 1 Retake, Algebra 2, Geometry, Grade 10 ELA Retake), and was accompanied by an Excel spreadsheet. In these reports, the schools in the given district were sorted based on the school number. The same data elements that appeared on the State Summary Reports were provided in these files. For EOC assessments, students were broken out by first-time testers and retakers as with the State Summary and District Summary reports. District totals were provided at the bottom of the report.

FSA 2016–2017 Technical Report: Volume 6
Score Interpretation Guide 11 Florida Department of Education
Figure 6: A Sample District Report of Schools
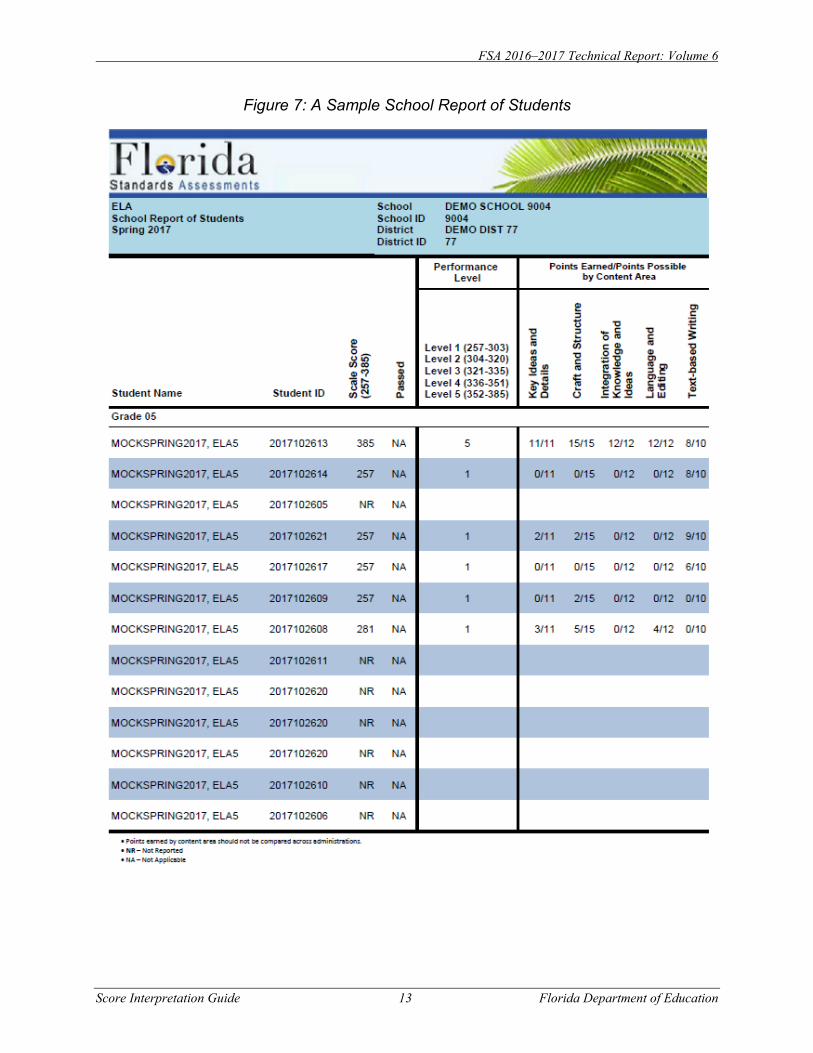
A School Report of Students was available for individual schools and could be accessed by each school or by district administrators in one report that combined data for all schools in their district. Districts had access to both the SRS for the district and the SRS at the school level. Schools only had access to the SRS that contained test results for the students reported in their school. The Fall and Winter 2016 late reporting student results were also released on the FSA-R. A sample report is shown in Figure 7.
School Reports of Students were rosters created from the approved State Student Results (SSR) files and provided on the FSA-R to districts and schools. These reports were created by subject for each school and included score flag status and scores (when score flag status was equal to 1) for all students in any given school. Students were not listed on the School Report of Students if their score flag status was 4 (the PreID label did not match to TIDE for students testing on paper) or 0 (not tested). For the students assigned an NR (not reported) score status, footnotes on the bottom of each page of the Mathematics and EOC reports explained the NR codes. For the ELA School Reports of Students, if no valid ELA score was reported for a student, the score flag statuses for ELA, Reading, and Writing were all presented on the Excel version of the report so that the district and school users could determine why no score was reported for that student. For both initial and late reporting, one PDF report for each tested subject per school was posted in the FSA-R. Additionally, one combined PDF file of all schools in a district was posted to the FSA-R for district access only. Reports created for late reporting did not include students from the initial reporting, and the file names for these PDF reports denoted that these documents only contained students for late reporting. These reports sorted student records first by ascending grade, followed by student last name, then first name, and finally SID. For district-level reports, the records were sorted by school, then by grade, student last name, first name, and finally SID.

FSA 2016–2017 Technical Report: Volume 6
Score Interpretation Guide 12 Florida Department of Education
The fields displayed on the School Report of Students were as follows:
• Grade
• District and school names and numbers
• Student Name (in alphabetical order)
• Student ID
• Scale Score
• Passed: NA for ELA/Math. Displayed as “Y” or “N” for ELA Retake, Algebra 1, and Geometry.
• Performance Level: Numeric value of 1–5.
• Points Earned/Points Possible by Content Area: Shown for each content area on the given form.
• Raw score (points earned) by subcategory
Student names on each grade and subject for the School Reports of Students were sorted by last name, first name, and SID.
FSA 2016–2017 Technical Report: Volume 6
Score Interpretation Guide 13 Florida Department of Education
Figure 7: A Sample School Report of Students

FSA 2016–2017 Technical Report: Volume 6
Score Interpretation Guide 14 Florida Department of Education
To make districts and schools aware of these releases, FDOE distributed information on how to access the FSA-R for each administration via e-mail to School District Superintendents and District Assessment Coordinators. Communication dates are listed in Table 5.
Table 5: Communication Dates Administration Communication Date Fall 2016 EOC October 27, 2016 Fall 2016 ELA Retake January 11, 2017 Winter 2016 EOC January 12, 2017 Spring 2017 Algebra 1 Retake May 19, 2017 Spring 2017 ELA Retake May 19, 2017 Spring 2017 Grade 3 ELA May 19, 2017 Spring 2017 Gr 4-10 ELA, Gr 3-8 Mathematics, EOC (Alg 1, Alg 2, Geo)
June 8, 2017
Summer 2017 EOC August 18, 2017
1.3.4 Data Files
The FSA-R allowed district users to download a compressed file containing data for their district in pipe-delimited text format. These data files were approved by FDOE before release and were used to populate the PDF and Excel reports. Downloadable data files were packaged into a single downloadable compressed file for each subject for access by DAC users. In Spring 2017, there were up to seven files for an individual district: ELA, ELA Retake, Mathematics, Algebra 1, Algebra 1 Retake, Algebra 2, and Geometry. Each compressed file contained three folders (DAR, DSR, and SAR). DAR and DSR folders each contained a single pipe-delimited .txt file. The SAR folder contained one SAR file for each grade 3–10 ELA and 3–8 Mathematics assessment, and a single SAR file for each EOC subject and Retakes (ELA Retake and Algebra 1 Retake). As an extra layer of security, a password was provided in the FSA-R system, as shown in Figure 8, and was required to open the encrypted zip files once they were downloaded. The password was unique to each district’s data file and was only needed once to unzip and extract the contents of the compressed file.

FSA 2016–2017 Technical Report: Volume 6
Score Interpretation Guide 15 Florida Department of Education
Figure 8: Password for Downloadable Data Zip File

FSA 2016–2017 Technical Report: Volume 6
Score Interpretation Guide 16 Florida Department of Education
1.4 STUDENT REPORTS
Student Reports were delivered as printed materials to the districts, which then delivered those reports to schools. The primary purpose of the Student Report was to provide a document that enabled parents to understand their child’s performance in the subject in which he or she tested. The Student Report also presented information that indicated how a student’s performance compared to that of other students who took the same test.
For all subjects, the 2017 spring FSA Student Report had a one-page color design format, an example of which is displayed in Figure 9 (see also Appendix D). The first section provided identifying information about the student and was followed by an introduction with general information about the FSA program and resources for students. The second section provided the student’s 2017 FSA results, including overall scale score, performance level details, reporting category scores, and a table to compare the student’s performance against the aggregate percentages by school, district, and state. The information on the report was translated into Spanish and Haitian Creole.
• Top of Report: The test, student, school, and district were identified, along with the student identification information.
• Purpose of the Report: This section provided a description of the FSA and purpose of the student report.
• FSA Scores: In the middle section of the report, a student’s scale score and corresponding performance level were displayed graphically and explained in an accompanying statement. This information was also translated into Spanish and Haitian Creole.
• Reporting Category Scores: At the bottom left of the report, a table displayed the FSA ELA, Mathematics, or EOC reporting categories assessed. The Points Earned column showed the actual number of points earned in each of the reporting categories. The number of points earned is the sum of the scores of the items measuring a given reporting category. The Points Possible column provided the total number of points possible for each of the reporting categories. This information was not translated into Spanish and Haitian Creole.
• Student Performance Compared: This section provided a comparison between the student’s performance level and that of the student’s school, district, and the state as a whole.
To better enable educators, parents and guardians, and students to understand FSA results and interpret them in a meaningful way, the Department published Understanding FSA Reports (see Appendix C), which provided detailed information regarding the report types and results information contained therein. Understanding FSA Reports is updated before the release of results each spring.
1.4.1 Student Report USBs
AIR also produced USB flash drives containing student report PDFs for Florida districts. USBs were generated and shipped to each district for every administration in which they tested. Late reporting student reports were sent in a separate USB for each administration.

FSA 2016–2017 Technical Report: Volume 6
Score Interpretation Guide 17 Florida Department of Education
Each district received a single USB. Each district USB flash drive contained a single zip file for the district that was password protected. The zip file contained a district folder. Within the district folder, there will be school folders and a .CSV manifest file. Within each school folder, there were PDFs of individual student reports. The manifest file contained a list of all the PDFs that were included in the zip file. This machine readable manifest was intended to enable districts to load them into their learning management system or other systems. Passwords to unzip the USB files were made accessible through the TIDE Inbox feature for District level users with DAC access from Spring 2017 onwards. All DAC level users in a district had access to the USB password for that district only, with the exception of community colleges (district 80) where all TIDE users in each college had access to the password file for their college only. In addition, AIR continued to upload the district passwords to the move-it server as well. These files were used by FDOE for the sample review of real data USBs and also as a backup for the passwords.

FSA 2016–2017 Technical Report: Volume 6
Score Interpretation Guide 18 Florida Department of Education
Figure 9: A Sample FSA ELA Student Report

FSA 2016–2017 Technical Report: Volume 6
Score Interpretation Guide 19 Florida Department of Education
2. CALCULATION OF STUDENT SCORES
This section provides an overview of the calculation of student scores. More detailed information can be found in Volume 1.
2.1 POINTS POSSIBLE
Students received a raw score for each reporting category, with scores being derived using only the operational items in each reporting category. The number of points earned is the sum of the scores of the items measuring a given reporting category. Raw scores were reported at the individual level and shown in the Points Earned column of the Student Reports.
2.2 THETA SCORE ESTIMATION
Student ability estimates, or theta scores, are generated using pattern scoring, a method that scores students differently depending on which items they answer correctly. Some test items provide more statistical information than other items, and when students answer those items correctly, this improves their ability estimate. Because the FSA tests are calibrated and scored based on the 3-parameter logistic model (3PL) and Generalized Partial Credit Models (GPCM) of Item Response Theory models, with the 2PL treated as a special case of the 3PL, two students with the same overall raw score but with correct answers to different questions may have slightly different ability estimates. Section 8.1.1 of Volume 1 outlines the formulas and rules applied during calculation.
Theta scores were not reported, but were used in the calculation of other scores.
2.3 SCALE SCORES
Scale scores are a linear transformation of a student’s theta score onto a consistent scale. Scale scores are calculated as follows:
where is an individual student’s ability estimate obtained from maximum likelihood estimation in AIR’s scoring engine, and a and b are grade- and subject-specific slope and intercept values. Scale scores are rounded to the nearest whole number for reporting. Section 8.1.2 of Volume 1 provides additional details about the calculation of scale scores as well as the grade and subject slopes and intercepts.
Scale scores were reported at the individual level in the FSA-R. Mean scale scores were also reported at the aggregate level.
2.4 ALTERNATE PASSING SCORE
The alternate passing score (APS) is the FCAT 2.0 equivalent score reported as an FSA scaled score. When EOC and Grade 10 ELA cut scores were reported in 2015, there was no approved FSA reporting scale, and so cut scores were reported as an FCAT 2.0 equivalent. The FSA scale transformation constants are now known and so the passing scores can be reported on the FSA scale. Since the cuts recommended from the summer 2015 standard setting process have been

FSA 2016–2017 Technical Report: Volume 6
Score Interpretation Guide 20 Florida Department of Education
approved, it is important to note that these APS cuts will be used only with students who are retaking the test. Section 8.1.4 of Volume 1 provides additional details about the calculation of alternate passing scores. Students who were eligible for the alternate passing score were flagged on the student report PDF file with an asterisk. The APS for the given subject was shown in the footnote of the PDF report for reference. Eligibility for using the Grade 10 FSA ELA APS is based on student cohort. Students who entered grade 9 in 2013–14 (or prior), regardless of his or her first attempt taking the assessment, are eligible to use the APS for graduation purposes. The students who took the Grade 10 FSA ELA assessment in Spring 2015 as above-grade level testers (e.g., grade 9 students receiving grade 10 instruction) are also eligible to use the APS, even though they are NOT in the 2013–14 cohort. Eligibility for using the APS for the FSA Algebra 1 and FSA Geometry tests is based on when students first participated in the assessment. Students who took one of these assessments prior to the adoption of the new passing scores (spring, summer, fall, or winter 2015) are eligible to use the APS for Algebra 1 for graduation/CAP purposes, or the APS for Geometry for scholar designation/CAP purposes. Students who participate in the FSA Algebra 1 or FSA Geometry assessment for the first time in Spring 2016 and beyond must obtain the new passing scores for graduation/CAP and scholar designation/CAP purposes, respectively. Table 6 summarizes eligibility requirements and passing/alternate passing scores for these assessments.
Table 6: FSA Eligibility Requirements and Passing Scores
Assessment Eligibility Passing Score (FSA Scale) Grade 10 ELA, Grade 10 ELA Retake Entered Grade 9 in 2014–15 or after 350
Algebra 1, Algebra 1 Retake First participated in Spring 2016 or beyond 497
Geometry First participated in Spring 2016 or beyond 499 Grade 10 ELA, Grade 10 ELA Retake Entered Grade 9 in 2013–14 or prior 349
Algebra 1, Algebra 1 Retake First participated prior to Spring 2016 489
Geometry First participated prior to Spring 2016 492
2.5 STANDARD ERRORS
A standard error is a statistic that measures the uncertainty associated with a student’s score. No test is perfectly reliable; therefore, a single test score does not perfectly capture any student’s performance. The standard error of a test score can be used to judge the degree to which a student would perform differently if he or she were to repeat the test administration. For example, if a student has a scale score of 350 with a standard error of 10, then—applying properties of the normal distribution—68% of the time, one can expect that student to score between 340 and 360 on repeated testing administrations.

FSA 2016–2017 Technical Report: Volume 6
Score Interpretation Guide 21 Florida Department of Education
3. INTERPRETATION OF REPORTED SCORES
The following business rules are applied for student scores in the FSA-R.
3.1 BUSINESS RULES
3.1.1 Inclusion in Aggregation
All aggregate report data were based on the total number of students who took the test and had a reported score. Only students with a score flag status of 1 were included in this data; all other score flags were excluded from aggregation. Thus, students who completed but did not submit their tests for scoring or whose scores were suppressed were not included in the aggregated reports. Students whose scores were suppressed appeared on the School Report of Students with an NR (not reported) status.
3.1.2 Aggregation
Test data were collected at the individual student level during the testing period. Aggregations to a higher unit, such as a school or district, were calculated directly from the student level. More specifically, state, district, and school aggregates were calculated by aggregating all the students in the state, in the district, and in the school, respectively. For example, the mean scale score was based on the scale scores of the students in their given district, rather than on the average scale scores of each school in the district.
Records are excluded from aggregation based on the Score Status Flag and School Type. Only records for students that have a Score Status Flag of 1 are included in the regular reporting aggregated data. The aggregated data do not include data for the schools that are assigned with school type of 10, 11, 17, or 99. Table 7 below shows the school type information.
Table 7: School Type Special School Name School Type
McKay Scholarship School 11 Florida Tax Scholarship School 11 Department of Juvenile Justice (DJJ) School 10 Private-to-Public School 10 Brick and Mortar private school 17 Home Ed School 99 Ahfachkee School 14
To provide meaningful results and to protect the privacy of individual students, the aggregation results are suppressed if any of the following criteria are met:

FSA 2016–2017 Technical Report: Volume 6
Score Interpretation Guide 22 Florida Department of Education
• If the number of students with reported scores is less than 10
• If all students earn the same performance level
• If all students pass or all students fail for Grade 10 ELA, ELA Retake, Algebra 1 and Geometry
When the aggregated score information was suppressed, the number of students were displayed on the aggregation report but the “—” showed on other score fields.
3.1.3 Student Mobility Rules
Scores were reported based on the enrolled school and district in TIDE as of May 12, 2017, for the Spring 2017 administration, if available. Otherwise, the last known school and district of the student was used.
3.1.4 Minimum Group Size
For all grades and subjects, no data were reported if fewer than 10 students were tested. Additionally, for Grade 10 ELA, Algebra 1, and Geometry, no data were reported if all students passed or if all students failed.
3.2 INTERPRETATIONS
This section provides guidance for appropriate interpretations and uses of test results.
3.2.1 Scale Scores
As described above, scale scores were reported for all FSA ELA, Mathematics, and EOC tests.
Scale scores can be averaged to form overall summaries of student performance within a group.
3.2.2 Alternate Passing Scores
Retake students in Grade 10 ELA, Algebra 1, and Geometry received an alternate passing score. The Student Reports and School Report of Students contained a passing status (“Y” for yes and “N” for no). Student reports included a statement indicating whether the student met the graduation requirement.
3.2.3 Reporting Categories
FDOE encourages educators to use assessment results in a statistically appropriate way. The comparisons described here provide possibilities for evaluation of reporting category scores at the school and district levels.
Reporting category scores, also known as raw scores, are the totals of the scores on the items measuring each specific category. Reporting categories represent groups of student skills, or benchmarks, which are assessed in each grade and subject.

FSA 2016–2017 Technical Report: Volume 6
Score Interpretation Guide 23 Florida Department of Education
Raw scores, however, cannot be compared between the different reporting categories. For example, suppose a student has a raw score of 8 in one category and a raw score of 3 in another. This alone cannot be used to indicate that the student is relatively weak in the second reporting category vis-à-vis the first. The difficulty of the items must be considered, and raw scores do not factor in this information regarding item difficulty.

FSA 2016–2017 Technical Report: Volume 6
Score Interpretation Guide 24 Florida Department of Education
4. CAVEON ANALYSIS
After the testing window was closed, Caveon Test Security reviewed the data for testing irregularities, including student and school scores for anomalous data.
Possible examples of testing irregularities include a student copying another student’s answers or a Test Administrator changing students’ answers. Anomalous scores would have included (1) students with similar response patterns in the same testing group or (2) an unusual increase in school performance. The data forensic analyses detect potential security breaches using several statistics to detect the following:
• Pairs or groups of extremely similar or even identical answers
• Aberrant response patterns, such as answering difficult items correctly and not providing correct answers for easy questions
• Response time stamps, in the case of computer-based tests, to check whether a pair or a group of students worked in a synchronous manner
• Unusual gain scores
Through the results of these statistical analyses, it is possible to detect the source of suspect activity and its effect on test results. If an irregularity is found in the data, flagged student records are put on hold and noted on issue logs for FDOE review. FDOE reviews the data and can either request to release or continue the hold on the record.