flow analysis in patient specific lower airways using...
TRANSCRIPT

15th Int Symp on Applications of Laser Techniques to Fluid Mechanics Lisbon, Portugal, 05-08 July, 2010
Flow analysis in patient specific lower airways using PIV
Mathias Vermeulen1, Cedric Van Holsbeke2, Tom Claessens3, Jan W. De Backer4, Peter Van Ransbeeck5, Pascal Verdonck6
1: BioMech, University College Ghent, Belgium, [email protected] 2: BioMech, University College Ghent, Belgium, [email protected]
3: BioMech, University College Ghent, Belgium, [email protected] 4: FluidDa N.V., Belgium, [email protected]
5: BioMech, University College Ghent, Belgium, [email protected] 6: IbiTech, Ghent University, Belgium, [email protected]
Abstract The objective of this study is to analyze the flow pattern trough a patient specific lower airway under multiple breathing conditions. The measured Particle Image Velocimetry (PIV) results are quantitatively and quantitatively compared to Computational Fluid Dynamics (CFD) simulations. A patient specific 3D model of the lower airway geometry down to the 3rd generation was created to investigate the stationary and oscillatory flow through the branching network by PIV. A water/glycerin mixture with the same refractive index as the transparent silicone model was created and spherical particles were used as tracer particles. The mass flow rate and frequency were adjusted to the properties of the fluid mixture. In this paper, a first comparison was made between the PIV and CFD results of stationary and oscillatory flows for peak inspiration and expiration for a constant Reynolds number and Womersley number. Immediately one can see the different nature of the flow in inspiration and expiration. The comparison between the stationary flows showed that at inspiration the velocity profile has a more constant velocity distribution in PIV than in CFD. The difference in velocity profile lowers for an oscillating flow analysis. At maximum expiration the PIV and CFD results show the two peak velocity profile for a stationary flow while at oscillating flow conditions the flow of the right main bronchus prevails. 1. Introduction The prevelance of Chronic Obstructive Pulmonary Disease (COPD) and asthma is increasing the last years and an additional rise in the number of patients in the near future is foreseen. COPD often caused by smoking and air pollution, is an incurable disease of the airways. The chronic inflammation of the airways leads to a limitation of the airflow into the lungs and causes symptoms like shortness of breath, increased pCO2 and an overall decline in respiratory function. Health institutes predict that COPD will be the 4th leading cause of death worldwide by 2020. Millions of people suffer from COPD and scientists predict that many people are undiagnosed in the first stage of this pathology. The treatment of COPD focuses on improving the life quality of the patients and stabilizing the earnestness of COPD which will often worsen progressively in time. One of the treatments for COPD is volume reduction surgery. In this case the most inflated or emphysematous part of the lung will be removed to enhance the ventilatory airflow to better perfused regions (Tiong et. al., 2006). Another technique is to place an endobronchial valve distal to the most inflated part of the lung (Strange et. al.,2007). The one-way valve will allow the emphysematous part of the lung to deflate at expiration and will obstruct the air at inspiration. The impact of both therapeutic treatments is difficult to predict for a specific patient. So for the time being the used surgical method is based on the experience of the surgeon. In order to investigate the effect of over-expansion of the lung areas causing lung injuries Adler et. al. (2007) performed PIV measurements on a simplified model based on the geometry of Weibel
- 1 -

15th Int Symp on Applications of Laser Techniques to Fluid Mechanics Lisbon, Portugal, 05-08 July, 2010
(1963) and Horsfield (1971). PIV measurements on patient-specific data were done in Große et. al. (2007). The same geometry was used in Freitas et.al. (2008) for numerical simulations. Although the same geometry was used, CFD simulations were performed with air as working fluid while the experimental results were obtained with a water glycerin mixture as working fluid, to assure the same Reynolds number. In the present paper a measurement platform is presented for the investigation of the inspiration and expiration flow patterns in an patient specific lower airway model. A innovative technique was tried to create the lower airway model. 2D PIV measurements were performed for steady and oscillating flow properties and a comparison with CFD simulations, done with the same working fluid, was performed. 2. Materials en Methods 2.1 Experimental model The patient specific model of the airway with a hydraulic diameter of the trachea of 16.3 millimeter was derived from image data. High resolution CT-scans were taken with a multi-slice scanner (GE VCT Lightspeed). Image segmentation and 3D reconstruction of the airway branches were performed with commercially available software (Mimics 10.0, Materialise, Leuven, Belgium). The trachea down to the third bifurcation was extracted from the original STL file into a CAD model to develop the physical model. The kernel of the airway model was printed with Fused Deposition Modeling (FDM, Stratasys Inc, Eden Prairie, U.S.A.). By switching the build and support material it was possible to print the kernel in WaterWorksTM while supporting it with Acrylonitrile Butadiene Styrene (ABS). The ABS support was removed by dissolving it in xylene, which is a clear, colorless and sweet-smelling liquid closely related to benzene. The roughness of the kernel was measured with a perthometer (C5D, Mahr, Göttingen, Germany) and an arithmetic average Ra of 16 µm was measured. This value corresponds to regular milling. The high roughness of the kernel is mainly caused by the relatively thick building layer (0.178mm) of the Stratasys Maxum FDM machine. Using vacuum casting, transparent silicone (Dow Corning, Sylgard 184) was poured around the kernel. This type of silicone allows for optical access and matches the refractive index of the working fluid (water/glycerin mixture) (Hopkins et. al. 2000). After curing, the WaterWorksTM kernel was removed by washing out with sodium hydroxide. The complete development cycle is schematically shown in figure 1.
Figure 1: PIV model development cycle
- 2 -
15th Int Symp on Applications of Laser Techniques to Fluid Mechanics Lisbon, Portugal, 05-08 July, 2010
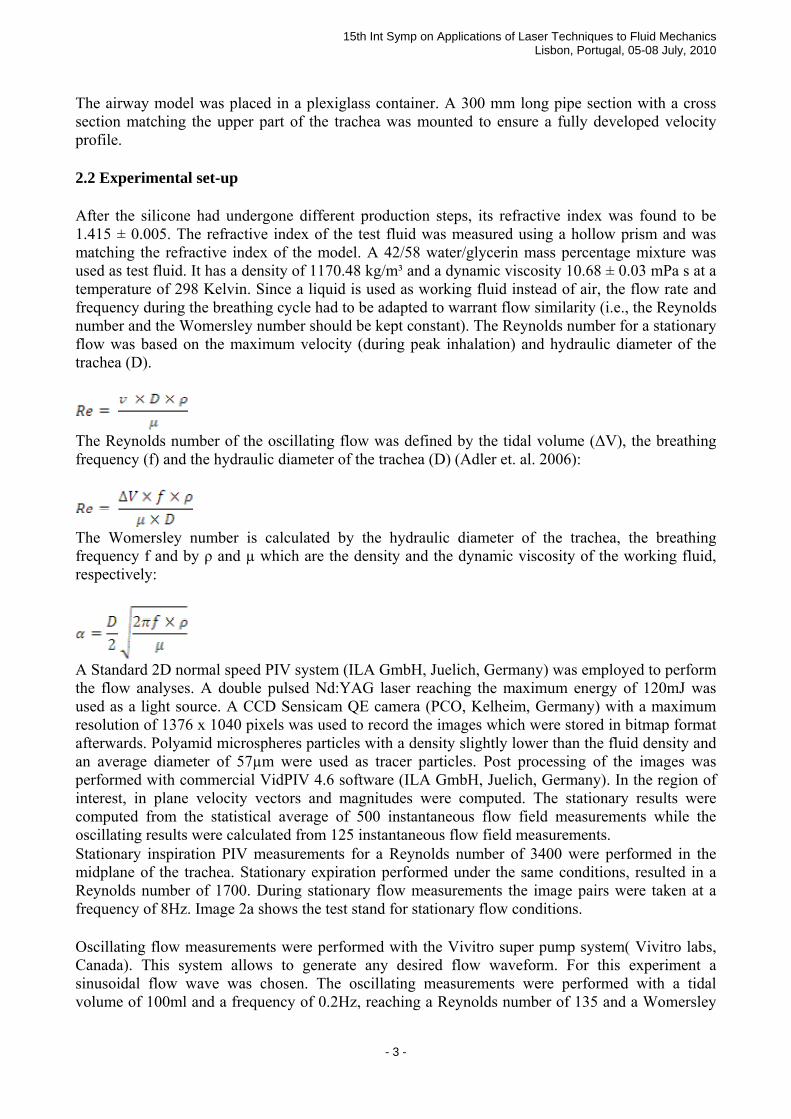
The airway model was placed in a plexiglass container. A 300 mm long pipe section with a cross section matching the upper part of the trachea was mounted to ensure a fully developed velocity profile. 2.2 Experimental set-up After the silicone had undergone different production steps, its refractive index was found to be 1.415 ± 0.005. The refractive index of the test fluid was measured using a hollow prism and was matching the refractive index of the model. A 42/58 water/glycerin mass percentage mixture was used as test fluid. It has a density of 1170.48 kg/m³ and a dynamic viscosity 10.68 ± 0.03 mPa s at a temperature of 298 Kelvin. Since a liquid is used as working fluid instead of air, the flow rate and frequency during the breathing cycle had to be adapted to warrant flow similarity (i.e., the Reynolds number and the Womersley number should be kept constant). The Reynolds number for a stationary flow was based on the maximum velocity (during peak inhalation) and hydraulic diameter of the trachea (D).
The Reynolds number of the oscillating flow was defined by the tidal volume (∆V), the breathing frequency (f) and the hydraulic diameter of the trachea (D) (Adler et. al. 2006):
The Womersley number is calculated by the hydraulic diameter of the trachea, the breathing frequency f and by ρ and µ which are the density and the dynamic viscosity of the working fluid, respectively:
A Standard 2D normal speed PIV system (ILA GmbH, Juelich, Germany) was employed to perform the flow analyses. A double pulsed Nd:YAG laser reaching the maximum energy of 120mJ was used as a light source. A CCD Sensicam QE camera (PCO, Kelheim, Germany) with a maximum resolution of 1376 x 1040 pixels was used to record the images which were stored in bitmap format afterwards. Polyamid microspheres particles with a density slightly lower than the fluid density and an average diameter of 57µm were used as tracer particles. Post processing of the images was performed with commercial VidPIV 4.6 software (ILA GmbH, Juelich, Germany). In the region of interest, in plane velocity vectors and magnitudes were computed. The stationary results were computed from the statistical average of 500 instantaneous flow field measurements while the oscillating results were calculated from 125 instantaneous flow field measurements. Stationary inspiration PIV measurements for a Reynolds number of 3400 were performed in the midplane of the trachea. Stationary expiration performed under the same conditions, resulted in a Reynolds number of 1700. During stationary flow measurements the image pairs were taken at a frequency of 8Hz. Image 2a shows the test stand for stationary flow conditions. Oscillating flow measurements were performed with the Vivitro super pump system( Vivitro labs, Canada). This system allows to generate any desired flow waveform. For this experiment a sinusoidal flow wave was chosen. The oscillating measurements were performed with a tidal volume of 100ml and a frequency of 0.2Hz, reaching a Reynolds number of 135 and a Womersley
- 3 -

15th Int Symp on Applications of Laser Techniques to Fluid Mechanics Lisbon, Portugal, 05-08 July, 2010
number of 2.58. Image 2b shows the oscillating flow set-up.
(a) (b)
Figure 2: (a) stationary flow conditions set-up; (b) oscillating flow conditions set-up. 2.3 Numerical model The computational grid was created in TGrid 5.0.6 (Ansys) and is formed by 2.7 x 10⁶ tetrahedrals. A commercial software package (Fluent 6.3.26, Ansys) solved the discretized Navier-Stokes equations in this domain. A laminar approach was chosen with second order discretization schemes. The Pressure-Velocity coupling was done with the Semi Implicit Method for Pressure Inlet Equation (SIMPLE) algorithm in steady-state regime. For pulsatile flow, simulations performed on the same geometry, were done with the Pressure Implicit with Splitting of Operators (PISO) algorithm. 3. Results and discussion Cross correlation of the images was performed within an interrogation area of 32x32 pixels with a grid overlap of 16 pixels. The PIV measurements were performed separately in two adjacent regions of interest lying in the same plane in the lung model. Afterwards the results from both
- 4 -

15th Int Symp on Applications of Laser Techniques to Fluid Mechanics Lisbon, Portugal, 05-08 July, 2010
ROI’s were merged into one image and results are shown for the trachea and the first bifurcation. The results in this paper focus on the flow dynamics in the midplane of the trachea. Figure 3 shows the used ROI’s.
Figure 3: Region of Interest
3.1 Stationary flow Figure 4(a) shows the PIV result for the flow field distribution in the centerplane of the trachea. The PIV plot shows a nearly plug flow shaped velocity profile at the trachea which might be the result of the wall roughness and the difference in geometry. Although the airway model geometry is identical to the one used for the CFD simulations, the CFD simulations were performed without the 300mm long inlet tube. A parabolic shaped inletprofile was applied to the CFD model.
- 5 -

15th Int Symp on Applications of Laser Techniques to Fluid Mechanics Lisbon, Portugal, 05-08 July, 2010
FRbbfrththpm
In Plane Velocity(m/s)
(a) (b)
Figure 4: (a) PIV result, (b) CFD result for stationary inspiration ( Re = 3400)
igure 5 shows the in plane velocity components measured in the midplane of the trachea, at a eynolds number of 1700 during expiration. Figure 4(b) shows the CFD result at the same oundary conditions (an inlet volume flow of 10l/s). A qualitative and quantitative comparison can e made of the flow profile. The flow profile is strongly determined by the flow structure coming om the subbranches. The flow out of the right main bronchus is skewed towards the inner curve of e bifurcation, unlike the flow of the left main bronchus which is centered. The velocity profile in e lower trachea represents a bi peak (M-shaped) velocity distribution which evolves to a single
eak and finally to a parabolic distribution. The two isolated regions of high velocity (± 1m/s) in the iddle and at the top of the trachea may indicate the existence of swirling flow structures.
- 6 -

15th Int Symp on Applications of Laser Techniques to Fluid Mechanics Lisbon, Portugal, 05-08 July, 2010
(a)
(b) Figure 5: (a) PIV result; (b) CFD result for stationary expiration (Re= 1700)
3.2 Oscillating flow Due to the limitations of the pump, it wasn’t possible to implement the typical tidal volume of 500 ml. Therefore a number of CFD simulations were used to calculate the flow at Reynolds numbers ranging from 200 till 2400 with a step of 200 (based on the mean velocity in the trachea) and flow properties like area weighted averaged pressure coefficient (Cp) were plotted versus the Reynolds number (Figure 6). Given the smooth relation between the pressure coefficient and the Reynolds number, it is anticipated that the velocity profile will contain the same structures at the different Reynolds numbers.
- 7 -

15th Int Symp on Applications of Laser Techniques to Fluid Mechanics Lisbon, Portugal, 05-08 July, 2010
Figure 6: flow volume and pressure coefficient as a function of the Reynolds number
In contrast to the stationary flow profile at maximum inspiration, the flow pattern at maximum inspiration under oscillating flow conditions is shapes more like a parabola. The inlet velocity at the trachea in the PIV result is higher than the inlet velocity at the CFD results. This could be explained by the absence of the inlet tube in the CFD model. Qualitatively a nice comparison between the PIV and CFD results can be made. The parabolic profile skews to the left just before the bifurcation resulting in a maximum velocity region. Figure 7 shows the PIV and CFD results.
(a) (b) Figure 7: PIV (a) and CFD (b) result for max inspiration at oscillating flow (Re = 135, Wo = 2.58)
- 8 -

15th Int Symp on Applications of Laser Techniques to Fluid Mechanics Lisbon, Portugal, 05-08 July, 2010
Maximum expiration is shown in figure 8. A preferential flow left of the trachea can be noticed in the PIV and CFD results most likely caused by the main flow out of the right main bronchus. The PIV results do not show these main flow.
In Plane Velocity (m/s)
(a) (b) Figure 8: PIV(a) and CFD (b) result for max expiration at oscillating flow (Re = 135, Wo = 2.58) 4. Conclusion and future An experimental platform for investigating airflow in the lower airways was developed. A patient specific human lower airway model was designed and developed using an innovative technique for the kernel development. Current weaknesses like wall roughness and fading of the silicone due to the long exposure to sodium hydroxide need to be overcome. 2D PIV measurements were performed in the midplane of the airway geometry and the flow pattern was compared to CFD results for stationary and oscillating flow boundary conditions. Comparing the PIV and CFD results show similar flow patterns for the expiration cases while there are some differences for the inspiration cases. The influence of the roughness and the inlet tube will be modeled in the CFD simulations. Further investigations need to be done with a wider range of Womersley and Reynolds numbers and also high frequency ventilation boundary conditions will be applied to the model. 3D PIV measurements will be performed afterwards in order to be able to compare velocity magnitudes instead of in plane velocities. Also measurements in cross sections of the trachea to visualize secondary flows will be performed. On a longer term this platform aims to help to investigate the flow pattern in the airways to investigate the influence of surgical interventions like lung part removal or placing endobronchial valves.
- 9 -
15th Int Symp on Applications of Laser Techniques to Fluid Mechanics Lisbon, Portugal, 05-08 July, 2010
Acknowledgements The authors would like to thank R. Kaminsky for the assistance and help with PIV, and the Rapid Prototyping & Tooling laboratory, Antoine Dehenau and Frank Demets for the construction of the parts of the hydraulic set-up. References Adler K, Schröder W, Brücker C (2006) DPIV measurements of dynamic flow patterns in a
realistic model of the lung airways down to the 6th generation. In: Proceedings of the 13th international symposium on applications of laser techniques to fluid mechanics, Lisbon, Portugal, 26-29 june 2006
Adler K, Brücker C (2007) Dynamic flow in a realistic model of the upper human airways. In: Exp Fluids 43:411-423 Große S, Schröder W, Klaas M, Klöckner A (2007) Time resolved analysis of steady and oscillating flow in the upper human airways. In: Exp Fluids 42:955-970 Hopkins L.M, Kelly J.T, Wexler A.S, Prasad A.K (2000) Particle image velocimetry in complex geometries. In: Exp Fluids 29:91-95 Horsfield K, Dart G. Olsen D.E. Filley G.F., Cumming G. (1971) „Models of the human bronchial
tree”, J Appl Physiol; 31(2):207–217 Kim S.K, Chung S.K (2009) Investigation on the respiratory airflow in human airway by PIV. In J of Visualisation vol12 nr3:259-266 Strange C, Herth F.J, Kovits K.L, McLennan G, Ernst A, Goldin J, Noppen M, Criner G.J, Sciurba
F.C (2007) Design of the endobroncheal valve for Emphysema palliation trial (VENT): a non-surgical method of lung volume reduction. In BMC. Pulm. Med. 7,10
Tiong, L.U, Davies R, Gibson P.G, Hensley M.J, Hepworth R, Lasserson T.J, Smith B (2006) Lung volume reduction surgery for diffuse emphysema. Cochrane Database Syst Rev CD001001 Weibel, E.R. (1963) ”Morphometry of the Human Lung”, Springer, Berlin
- 10 -