flow and reaction simulation of a tungsten cvd …
TRANSCRIPT

noi
FLOW AND REACTION SIMULATION OF A TUNGSTEN CVD REACTOR
J. I. Ulacia F., S. Howell, H. Koerner*, and Ch. Werner Siemens AG, Corporate Research & Development, 8000 Munich 83, West Germany
* Semiconductor Devices
To minimize and understand the variability of a CVD process, it is necessary to investigate effect of the temperature, flow, pressure, and reaction kinetics in the reactor. Process simulation provides a fast and cost effective alternative because it identifies the physical and chemical environment at the wafer surface and allows the optimization for higher deposition rates, and better uniformity. In addition, it provides visual feedback in space and time on the variables that control the reaction and the effect that equipment settings have on deposition rate [1, 2]. This work presents the two dimensional flow, temperature, pressure, and kinetic simulation of a cold wall tungsten CVD reactor with models that determine the selectivity to oxide from the concentration of hydrogen fluoride (HF) at the wafer surface [3].
The simulations are based on the computation of the Navier-Stokes, mass continuity, and heat transfer equations using the program PHOEMCS [4] with some changes to include surface reaction kinetics and boundary conditions. The reactor is incorporated in 2 and 3 dimensional simulations in cylindrical coordinates taking advantage of the symmetry of the problem. The reaction kinetics are based on the thermal decomposition of tungsten hexafluoride (WF,) by hydrogen (H2) through the reaction
WFg(g) + 3H2(g) >W(s )+ 6HF(g)
with a deposition rate R described transfer R • and reaction kinetics R
by
regions by the equation
a mass limited
V R ^ = V R J + VRk
The mass transfer is determined by a diffusive flux (Jj) in the boundary layer (Xj) assummg the concentration of WFg is zero at the wafer surface
Jd^^w = KDwf6Nw(Xi)/Xi
where d is the density of cvd tungsten, D^rg is an estimation of the diffusion coefficient of WF^ in Ho [Sj at the operating conditions, and N is the concentration of WF^ at the sheath boundary. The kinetics limited regime is described by an Arrhenius equation proportional to the square root of the partial pressure of H2 [6, 7] as
1/2 R^ = k^exp(-E3/kT,)PH2
where k^ = 4.08 x 10^ (nm min"^ Pa"^''^); the activation energy E = 0.75 eV. From the deposition rate, the consumption of WF^ and the
generation of HF are computed as a function of position along the wafer. These equations arc solved self consistently to derive the partial pressures of WFg, H-, and HF and the deposition rate in the reactor. The effects of viscosity as a function of temperature and composition are included in the results. A simple heat conduction model was incorporated to account for the temperature difference between the temperature measured at the holder and the temperature at the wafer. This temperature difference was typically of the order of 50 - 70 K. The boundary conditions for flow and temperature are the ones found in the cold wall reactor where the wafer faces down and is heated by halogen lamps. The gas mbcture is introduced at the bottom and is heated by conduction from the wafer. The range of conditions used in the simulation are for pressure (100 - 900 mT), temperature 650 - 850 K, and flows 100 - 2000 seem of Hj, and 0 - 50 seem of WFg.
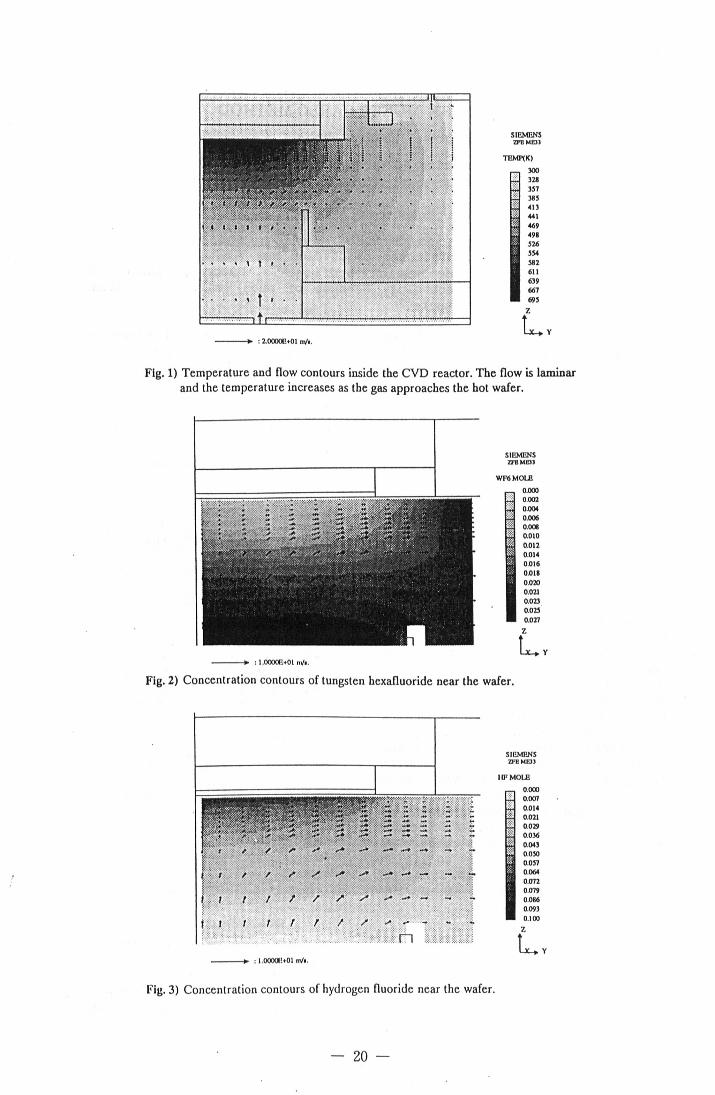
From the results of Fig. 1, the flow was found to be laminar even at 2000 seem total flow, which is explained by small Reynolds number in the system (Re < 1). The temperature increases from the gas inlet to the wafer and is reduced near the pumping port. Figure 2 and 3 illustrate typical concentration of WFg and HF near the wafer surface using a non-reactive holder. The concentration of WF^ on the wafer is reduced slightly and does not bring the reaction into mass transport limited regime. In the simulation conditions, the diffusion flux is larger than the convective flux making the HF concentration somewhat independent of flow; however, if there is a large source of HF near the wafer, there is a direct increase in concentration at the center.
RliiniRBNCeS: /7/G. Wahl, Thin Solid Films 40,13 (1977)
/2/G. Wahl and I'. Batzies, in G.F. Wakefield and J.M. Blocher
(eds) Proc. 4ih Inl. Conf on CVD (1973),
Electrochemical Society, 425
(31 CM. McConica and K. Cooper,
J. Electrochcm. Soc. B5,1003 (1988)
l-lj H.I. Roslen and D.B. Spalding, T h e PHOENICS
Beginner's Guide", CHAM TR/lOO, Wimbledon (1987)
I5j R.C. Rcid, J.M. Hrausniiz, and B.E. Poling,
"The Properties of Gases and Liquids",
Fourth edition, McGraw Hill Co. New York (1986)
/(5/E.K. Broadbent and C.L. Ramiller,
J. Electrochcm. Soc. 131,1427 (1984)
(71 CM. McConica and K. Krishnamani,
J. Olcclrochem. Soc. m^ 2542 (1986)
— 19 —
SIEMRNS ZFeMEll
TEMP(K)
357
441 4«9 49B il6 354 582 611 639 667
-*• : 2.0000G*OI m/i.
Fig. 1) Temperature and flow contours inside the CVD reactor. The flow is laminar and the temperature increases as the gas approaches the hot wafer.
- » :1.0000P>01 m/t.
SIEMENS TTEUat
0.000 0.002 0.004 0.006 0.0« 0.010 0.012 0.014 0.016 0.011 O020 0.021 0.023 0.023
0.027
£.
u. Fig. 2) Concentration contours of tungsten hexafluoride near the wafer.
f
1
I
/
/
/
/
!
t
: 1.00001
/•
/
r
!>01 n Vi.
^
/
/
^^
y
/ n
SrEMRNS ZFEMO)
I (F MOLE
0.000 0.007
£ | 0.014 0.021
0.036 0.043 0050 0037 0064 0.072 0.079 0086 0093 0100
z
u Fig. 3) Concentration contours of hydrogen fluoride near the wafer.
- 20 -