flow boiling study in mini-channels
TRANSCRIPT

HAL Id: hal-00269092https://hal.archives-ouvertes.fr/hal-00269092
Submitted on 7 Feb 2020
HAL is a multi-disciplinary open accessarchive for the deposit and dissemination of sci-entific research documents, whether they are pub-lished or not. The documents may come fromteaching and research institutions in France orabroad, or from public or private research centers.
L’archive ouverte pluridisciplinaire HAL, estdestinée au dépôt et à la diffusion de documentsscientifiques de niveau recherche, publiés ou non,émanant des établissements d’enseignement et derecherche français ou étrangers, des laboratoirespublics ou privés.
Distributed under a Creative Commons Attribution| 4.0 International License
Flow boiling study in mini-channelsAndré Bontemps, Bruno Agostini, Nadia Caney
To cite this version:André Bontemps, Bruno Agostini, Nadia Caney. Flow boiling study in mini-channels. NATO Ad-vanced Study Institute on Microscale Heat Transfer Fundamentals and Applications in Biologicaland Microelectromechanical Systems, Jul 2004, Cesme-Izmir, Turkey. �10.1007/1-4020-3361-3_11�.�hal-00269092�

FLOW BOILING IN MINICHANNELS
ANDRÉ BONTEMPS(1,2), BRUNO AGOSTINI(3), NADIA CANEY(1,2)
(1) CEA-GRETh, 17 rue des Martyrs, 38054 Grenoble, France, (2) LEGI/GRETh, Université Joseph Fourier,17 rue des Martyrs, 38054 Grenoble, France, (3) 15 rue Denis Papin, 38000 Grenoble, France
1. Introduction
The use of mini-channel heat exchangers (hydraulic diameter about 1 mm) in compact heat exchangers improvesheat transfer coefficients, and thermal efficiency while requiring a lower fluid mass. They are widely used incondensers for automobile air-conditioning and are now being used in evaporators, as well as in other appli-cations such as domestic air-conditioning systems. However, more general use requires a better understandingof boiling heat transfer in confined spaces. Many definitions of micro and minichannel hydraulic diameter areused throughout the literature. Kandlikar and Grande (2003) proposed the following classification: conven-tional channels (Dh > 3 mm), minichannels (200 µm < Dh < 3 mm), micro-channels (Dh < 200 µm), that willbe used throughout this paper.
These definitions rely upon the molecular mean free path in a single-phase flow, surface tension effectsand flow patterns in two-phase flow applications. In recent studies in minichannels the hydraulic diameterranges from 100 µm to 2–3 mm. The channel cross sections were either circular or rectangular and much of theresearch concerned boiling. Commonly, classical correlations have been used with or without modifications topredict flow boiling results in minichannels. However agreement was poor and the need for new correlationswas evident.
It has been shown through a number of experiments that boiling is controlled by two additive components:nucleate boiling and convective boiling. Nucleate boiling is due to nucleating bubbles and their subsequentgrowth and removal from the heated surface. Convective boiling is due to heated fluid moving from the heatedsurface to the flow core. These two mechanisms cannot be separated with any precision since they are closelyinterconnected. Figure 1 shows a classical representation of flow boiling regimes in tubes. The successive steps,as the fluid is heated, are:
NUCLEATE
BOILING
CRITICAL
FLOWQUALITY
HEAT TRANSFER
REGIONS
SATURATED BOILINGCOOLED
PURE
CONVECTIVE
BOILING
ONB
ONB
ONB
ONB
Φ
ΦΦ
Φ
LOG
VAPOUR QUALITY
0 < x < 1
SUB−
BOILING
7.5
5
2.5
αcr
(x )cr
αα
α
NB
GO
CV
LO
α
Figure 1: Boiling regimes from Collier and Thome (1994).
(i) In subcooled boiling the average fluid temperature is below the saturation temperature while the fluid atthe tube wall has already reached it and therefore can boil. The heat transfer coefficient rises and depends onthe heat flux, until the core of the flow, which is colder, reaches the saturation temperature. Bubbles formed at
1
the wall move and condense in the flow core and increase its temperature.(ii) In saturated boiling the flow core has reached saturation. Nucleate and convective boiling compete.
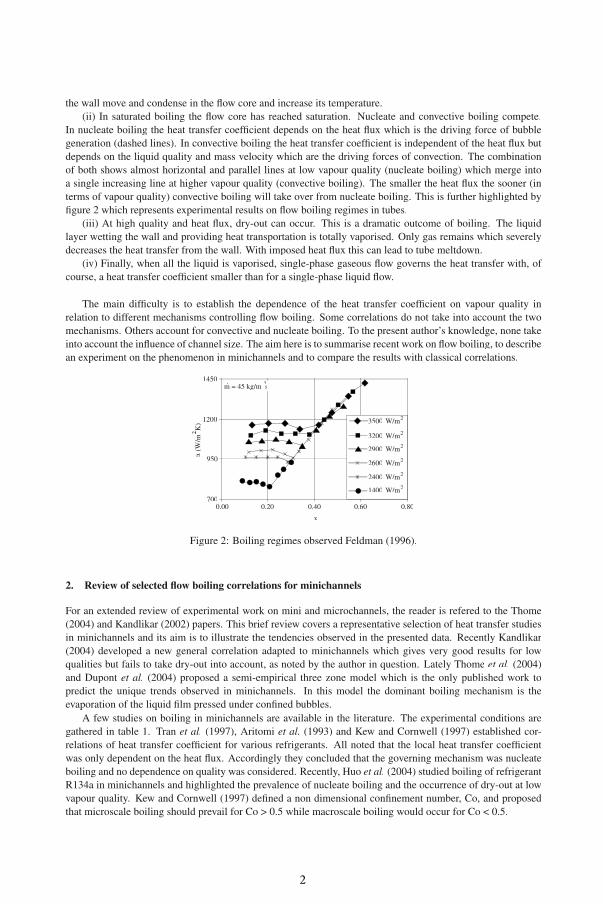
In nucleate boiling the heat transfer coefficient depends on the heat flux which is the driving force of bubblegeneration (dashed lines). In convective boiling the heat transfer coefficient is independent of the heat flux butdepends on the liquid quality and mass velocity which are the driving forces of convection. The combinationof both shows almost horizontal and parallel lines at low vapour quality (nucleate boiling) which merge intoa single increasing line at higher vapour quality (convective boiling). The smaller the heat flux the sooner (interms of vapour quality) convective boiling will take over from nucleate boiling. This is further highlighted byfigure 2 which represents experimental results on flow boiling regimes in tubes.
(iii) At high quality and heat flux, dry-out can occur. This is a dramatic outcome of boiling. The liquidlayer wetting the wall and providing heat transportation is totally vaporised. Only gas remains which severelydecreases the heat transfer from the wall. With imposed heat flux this can lead to tube meltdown.
(iv) Finally, when all the liquid is vaporised, single-phase gaseous flow governs the heat transfer with, ofcourse, a heat transfer coefficient smaller than for a single-phase liquid flow.
The main difficulty is to establish the dependence of the heat transfer coefficient on vapour quality inrelation to different mechanisms controlling flow boiling. Some correlations do not take into account the twomechanisms. Others account for convective and nucleate boiling. To the present author’s knowledge, none takeinto account the influence of channel size. The aim here is to summarise recent work on flow boiling, to describean experiment on the phenomenon in minichannels and to compare the results with classical correlations.
α(W
/m K
)2
2400
2600
2900
3200
3500
1400
W/m
W/m
W/m
W/m
2
2
2
W/m2
W/m2
2
x
1450
950
1200
7000.00 0.20 0.40 0.60 0.80
m = 45 kg/m s. 2ss
Figure 2: Boiling regimes observed Feldman (1996).
2. Review of selected flow boiling correlations for minichannels
For an extended review of experimental work on mini and microchannels, the reader is refered to the Thome(2004) and Kandlikar (2002) papers. This brief review covers a representative selection of heat transfer studiesin minichannels and its aim is to illustrate the tendencies observed in the presented data. Recently Kandlikar(2004) developed a new general correlation adapted to minichannels which gives very good results for lowqualities but fails to take dry-out into account, as noted by the author in question. Lately Thome et al. (2004)and Dupont et al. (2004) proposed a semi-empirical three zone model which is the only published work topredict the unique trends observed in minichannels. In this model the dominant boiling mechanism is theevaporation of the liquid film pressed under confined bubbles.
A few studies on boiling in minichannels are available in the literature. The experimental conditions aregathered in table 1. Tran et al. (1997), Aritomi et al. (1993) and Kew and Cornwell (1997) established cor-relations of heat transfer coefficient for various refrigerants. All noted that the local heat transfer coefficientwas only dependent on the heat flux. Accordingly they concluded that the governing mechanism was nucleateboiling and no dependence on quality was considered. Recently, Huo et al. (2004) studied boiling of refrigerantR134a in minichannels and highlighted the prevalence of nucleate boiling and the occurrence of dry-out at lowvapour quality. Kew and Cornwell (1997) defined a non dimensional confinement number, Co, and proposedthat microscale boiling should prevail for Co > 0.5 while macroscale boiling would occur for Co < 0.5.
2
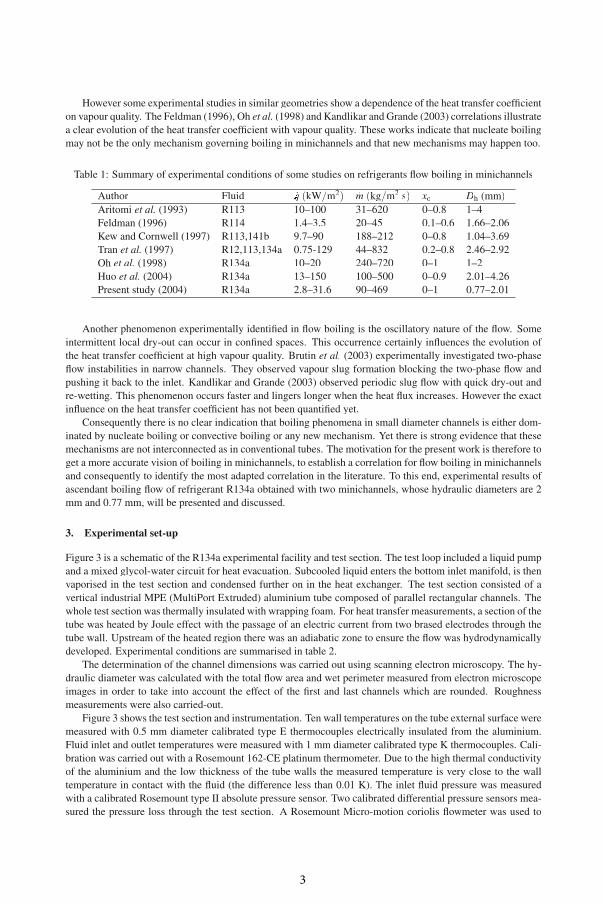
However some experimental studies in similar geometries show a dependence of the heat transfer coefficienton vapour quality. The Feldman (1996), Oh et al. (1998) and Kandlikar and Grande (2003) correlations illustratea clear evolution of the heat transfer coefficient with vapour quality. These works indicate that nucleate boilingmay not be the only mechanism governing boiling in minichannels and that new mechanisms may happen too.
Table 1: Summary of experimental conditions of some studies on refrigerants flow boiling in minichannels
Author Fluid q (kW/m2) m (kg/m2 s) xo Dh (mm)Aritomi et al. (1993) R113 10–100 31–620 0–0.8 1–4Feldman (1996) R114 1.4–3.5 20–45 0.1–0.6 1.66–2.06Kew and Cornwell (1997) R113,141b 9.7–90 188–212 0–0.8 1.04–3.69Tran et al. (1997) R12,113,134a 0.75-129 44–832 0.2–0.8 2.46–2.92Oh et al. (1998) R134a 10–20 240–720 0–1 1–2Huo et al. (2004) R134a 13–150 100–500 0–0.9 2.01–4.26Present study (2004) R134a 2.8–31.6 90–469 0–1 0.77–2.01
Another phenomenon experimentally identified in flow boiling is the oscillatory nature of the flow. Someintermittent local dry-out can occur in confined spaces. This occurrence certainly influences the evolution ofthe heat transfer coefficient at high vapour quality. Brutin et al. (2003) experimentally investigated two-phaseflow instabilities in narrow channels. They observed vapour slug formation blocking the two-phase flow andpushing it back to the inlet. Kandlikar and Grande (2003) observed periodic slug flow with quick dry-out andre-wetting. This phenomenon occurs faster and lingers longer when the heat flux increases. However the exactinfluence on the heat transfer coefficient has not been quantified yet.
Consequently there is no clear indication that boiling phenomena in small diameter channels is either dom-inated by nucleate boiling or convective boiling or any new mechanism. Yet there is strong evidence that thesemechanisms are not interconnected as in conventional tubes. The motivation for the present work is therefore toget a more accurate vision of boiling in minichannels, to establish a correlation for flow boiling in minichannelsand consequently to identify the most adapted correlation in the literature. To this end, experimental results ofascendant boiling flow of refrigerant R134a obtained with two minichannels, whose hydraulic diameters are 2mm and 0.77 mm, will be presented and discussed.
3. Experimental set-up
Figure 3 is a schematic of the R134a experimental facility and test section. The test loop included a liquid pumpand a mixed glycol-water circuit for heat evacuation. Subcooled liquid enters the bottom inlet manifold, is thenvaporised in the test section and condensed further on in the heat exchanger. The test section consisted of avertical industrial MPE (MultiPort Extruded) aluminium tube composed of parallel rectangular channels. Thewhole test section was thermally insulated with wrapping foam. For heat transfer measurements, a section of thetube was heated by Joule effect with the passage of an electric current from two brased electrodes through thetube wall. Upstream of the heated region there was an adiabatic zone to ensure the flow was hydrodynamicallydeveloped. Experimental conditions are summarised in table 2.
The determination of the channel dimensions was carried out using scanning electron microscopy. The hy-draulic diameter was calculated with the total flow area and wet perimeter measured from electron microscopeimages in order to take into account the effect of the first and last channels which are rounded. Roughnessmeasurements were also carried-out.
Figure 3 shows the test section and instrumentation. Ten wall temperatures on the tube external surface weremeasured with 0.5 mm diameter calibrated type E thermocouples electrically insulated from the aluminium.Fluid inlet and outlet temperatures were measured with 1 mm diameter calibrated type K thermocouples. Cali-bration was carried out with a Rosemount 162-CE platinum thermometer. Due to the high thermal conductivityof the aluminium and the low thickness of the tube walls the measured temperature is very close to the walltemperature in contact with the fluid (the difference less than 0.01 K). The inlet fluid pressure was measuredwith a calibrated Rosemount type II absolute pressure sensor. Two calibrated differential pressure sensors mea-sured the pressure loss through the test section. A Rosemount Micro-motion coriolis flowmeter was used to
3

measure the mass flow rate of R134a downstream of the pump. The heating voltage and current were mea-sured directly through a HP 3421A multiplexer. The overall system was tested with single-phase flow runs inorder to check heat losses (Agostini et al. (2002) and Agostini (2002)). Classical turbulent single-phase flowcorrelations agreed with measurements to within ±10%.
The heat flux was varied for every fixed mass flow rate in order to obtain a series of outlet vapour qualitiesbetween 0.2 and 1 with a step of 0.05. Steady state values were monitored using a Hewlett Packard 3421Awith a 30 minutes time lapse between each mass flow rate or heat flux change. Averaging was carried outafter every 20 values and uncertainties were calculated according to the Kline and McClintock (1953) method.The total electrical power dissipated in the test section was calculated as the product of voltage and current.The variations of R134a thermophysical properties with temperature were calculated with the REFPROP 6.01software.
∆P∆∆T TP
T
T
P
U
I
T P
V
T
TV
Q
∆P∆∆
jL = 695 mmj:thermocouple
:window
:flowmeter
:ammeter
:voltmeter
:pressure sensor
liquid pump
mixture 0°Cwater−glycolcooling loop
co
nd
en
ser
liq
uid
tan
k
electrodes5 5
thermocouples
10
inle
t m
an
ifo
ld
φ 300
ou
let m
an
ifold
100
thermocouple
15
5 11
0
60
Test loop Test section
safety valve
test section
18−48
1.3
−2
.3
Figure 3: Test loop and test section.
Table 2: Operating conditions and uncertainties
value error value errorDh (mm) 2.01 ± 3 % 0.77 ± 7 %m (kg/m2 s) 90–295 ± 1.7–8.6 % 214–469 ± 3.3–8.6 %q (kW/m2) 6–31.6 ± 2–4.1 % 2.8–19.5 ± 3 %TwTT , TflTT (K) 276–308 ± 0.1–3 K 281–307 ± 0.2–2 %pi (kPa) 405 & 608 ± 4 % 517 ± 2.7 %∆p (kPa) 9.5–37.5 ± 1.2–17 % 153–1570 ± 0.3–3.7 %
4. Heat transfer results
In this section the general trends of the measurements will be presented. Electrical power, refrigerant massflow rate, in and outward fluid temperatures and wall temperatures were measured. From these data physicalparameters of interest were computed as a function of tube length: heat flux q(z), fluid temperature TflTT (z), vapourquality x(z) and heat transfer coefficient α(z). Table 3 presents uncertainties on some calculated parameters.
Figures 4 and 5 show the local heat transfer coefficient as a function of local quality for Dh = 2 mm andDh = 0.77 mm. Two general trends are observed. On figure 4 a strong decrease in the heat transfer coefficientwith vapour quality is visible when the vapour quality is greater than a "critical quality" whereas on figure 5 theheat transfer coefficient starts decreasing before increasing with vapour quality.
4

Table 3: Uncertainties on calculated parameters
value error value errorCo 0.46 ± 3 % 1.14 ± 7 %Bo×10−4 2.2–7.9 ± 3.7–10.4 % 0.7–2.2 ± 6.3–11.6 %α (kW/m2 K) 0.8–10.3 ± 6–30 % 0.6–32.5 ± 5–30 %xo 0.26–1 ± 1–7 % 0.23–0.9 ± 2–9 %
500 1000
1000 2000
1500 3000
20004000
25005000
30006000
35007000
40008000
4500
90005000
100005500
110006000
00 0.10.1 0.20.2 0.30.3 0.40.4 0.50.5 0.60.6 0.70.7 0.80.8 0.9
x
1
x
α α
cr
(W
/mα
(W/m
α
2 2
m
K)
K)
·
x
= 347 kg/m sBo > 4.3 10 Bo < 4.3 10
x
2
cr
m
4.4 kW/m
· = 83 kg/m2 s
10.8 kW/m22
5.3
6.1
11.6
12.7
6.8
7.6
8.4
13.8
8.7
14.9
10.2
16.2
11.8
12.6
13.1
14.6
−4
D = 2 mmh D = 0.77 mm
h
−4
Figure 4: Local heat transfer coefficient versus local quality.
2000
2500
3000
3500
4000
4500
5000
5500
0 0.1 0.2 0.3 0.4 0.5 0.6
α (W
/mα
2 K
)2
x
q
m
·
·
(kW/m )q
(kg/mm
2))
2 s)
2
117
Bo < 4.3 10 D = 2 mm
6.06.97.88.89.9
inflexionpoint
10.8
−40
h
Dh = 2 mm).
5

Figure 6 shows the local heat transfer coefficient as a function of local quality, for a given heat flux andmass velocity, for Dh = 2 mm and Dh = 0.77 mm. It is clear that the heat transfer coefficient increases whenthe hydraulic diameter decreases. Thus the local heat transfer coefficient is increased by 74 % ± 26 % whenthe hydraulic diameter is decreased by 62 %.
The enhancement ratio can also be written D−0.6±0.1h which is, given the uncertainties, close to the values
proposed by Ishibashi and Nishikawa (1969) (D−0.67h ) and Aritomi et al. (1993) (D−0.75
h ). It is not clear how Tranet al. (1997), who proposed D−1
h for the confinement effect, established this expression. The range of testedhydraulic diameters, 2.4–2.92 mm, is too small to build a correlation. It is possible, from their articles, that itcomes from an analogy with single-phase flow classical theory and has no experimental basis. On the contrarythe D−0.4
h term proposed by Steiner and Taborek (1992) is based on some experimental data. Nevertheless thedata concerning refrigerant fluids (R11 and R113) were performed for hydraulic diameters from 7 to 20 mmonly. The lowest hydraulic diameters (from 1 to 5 mm) were tested with Helium I only so that this D−0.4
h factoris difficult to compare with the present results.
1000
2000
3000
4000
5000
6000
7000
8000
9000
10000
0.01 0.010.1 0.1 11
α (
W/m
α2
K)
2
x x
m =m =
q = q =··
··
kg/m skg/m s
kW/mkW/m22
22
288239
129.3
DhDD (mm)h
0.772.01
Figure 6: Influence of confinement on heat transfer coefficients.
1
1.5
2
2.5
3
3.5
4
5 210 415 620 825 1030 12 1435
α⎯
16
ex
p /
p
18
α⎯
20
Shah
q q·
D = 2 mm D = 0.77 mm
(kW/m )q (kW/m )q2 2q·
) (kW/q
mm·
(kg/m s) (kg/m s)2 2·
) (k /
88 208117176
248282
236 342292 467
622
h hD = 2 mmD D D
Figure 7: Average heat transfer coefficient versus heat flux.
Figure 7 represents the ratio of the measured average heat transfer coefficient to that predicted by theShah (1976) correlation for conventional tubes, as a function of the heat flux. This figure shows the globalintensification of heat transfer in MPE minichannels compared with conventional tubes. This intensificationranges from 0 to 400 % depending on the heat flux and occurs up to 35 kW/m2 for Dh = 2 mm and 20 kW/m2
for Dh = 0.77 mm.
6

5. Heat transfer analysis
An analysis and a physical interpretation of these observations will now be proposed. In order to analyse andclassify the different heat transfer coefficient behaviours observed on figures 4 and 5 it is useful to represent, fora given vapour quality, the heat transfer coefficient as a function of the heat flux and the heat flux as a functionof the wall-fluid temperature difference. For Dh = 2 mm, since Co < 0.5, the results were analysed in terms ofmacroscale boiling. This was done on figure 8, which exhibits two trends:
(i) For TwTT −TsatTT < 3 K and q < 14 kW/m2, q is proportional to TwTT −TsatTT . Thus α is independent of q andmoreover decreases with m. This region may correspond to a convective boiling regime and, as will be furtherhighlighted, the decrease with m may be due to the occurrence of partial dry-out.
(ii) For TwTT −TsatTT > 3 K and q > 14 kW/m2, q is proportional to (TwTT −TsatTT )3, therefore α is proportionalto q2/3, and the heat transfer coefficient depends only weakly on m. This second region may be identified as anucleate boiling regime.
However, as Co is very close to 0.5, these results may also be interpreted in terms of microscale boilingwith the film evaporation mechanism proposed by Thome et al. (2004).
For Dh = 0.77 mm q is always proportional to TwTT − TsatTT and α is independent of m. Since Co is greaterthan 0.5, microscale boiling should prevail and according to the three zone model of Thome et al. (2004) filmevaporation would be the boiling mechanism occurring in this tube.
1010
10
10
10
4000 10000 50000 1 5
α (
W/m
K
)α
WW2
q
q
T·
·
wTT (W/m )q
(W
/m
)q
− Tw
WW
WW
flTT (K)
l
x = 0.2
2
2
m·
(kg/m s)m2
89
117
177
236
292
∝
∝
∝
(T
(T
pTT
pTT
q
−T
−T
·
flTT
flTT
2/3
)
)
3
33
4 5
4
Figure 8: α versus q and q versus TwTT −TsatTT (Dh = 2 mm).
From an analysis conducted on figures 4 and 5 with the dimensionless boiling number, the following ten-dencies can be outlined. For Dh = 2 mm:
(i) for Bo > 4.3 · 10−4 and x < 0.3–0.4, the heat transfer coefficient is weakly dependent on x and propor-tional to q2/3. Thus the nucleate boiling regime might governs this region.
(ii) for Bo > 4.3 ·10−4 and x > 0.3–0.4, the heat transfer coefficient decreases with x but is still proportionalto q2/3. This suggests that partial dry-out occurs with nucleate boiling which is confirmed on figure 9 where thewall temperature and the statistical uncertainty on TwTT suddenly rise for x > 0.3–0.4. Most of the data belong tothese two regions.
(iii) for Bo < 4.3 · 10−4 the heat transfer coefficient is weakly dependent on x and proportional to q2/3 forlow qualities. It then starts increasing with vapour quality when x is greater than a transition value. This transi-tion value is all the greater since the heat flux is high for a given mass velocity. This behaviour may correspondto competition between a convective boiling and a dry-out regime where partial dry-out and regeneration of theliquid layer occur. Furthermore it was found that this transition occurred for a constant value of the productBo · (1− x) equal to 2.2×10⁻⁴.
These results are in agreement with the Huo et al. (2004) study which highlighted the prevalence of heatflux dependent boiling and early dry-out in a 2 mm diameter tube with refrigerant R134a. In their work theboiling number was always greater than 8×10⁻⁴ which is coherent with the present results.
7

For Dh = 0.77 mm, Bo is always smaller than 2.2 ·10−4 and(i) for x < 0.1–0.2, the heat transfer coefficient increases weakly with x and is independent of of q. Film
evaporation seems to dominate and the thinning of the liquid layer could explain the increase.(ii) for x > 0.1–0.2, the heat transfer coefficient always decreases with x and is still independent of q. This
suggests that intermittent dry-out governs the boiling alongside with film evaporation.
It was found that the critical vapour quality xcr did not depend on q and m. This does not mean that xcr doesnot depend on q or m but simply that such a variation is less than the uncertainty. The present study highlightsa decrease in xcr from 0.3–0.4 to 0.1–0.2 when Dh decreases from 2 to 0.77 mm. For comparison, Huo et al.(2004) found that xcr decreased from 0.4–0.5 to 0.2–0.3 when Dh decreased from 4.26 to 2.01 mm. Given thatthe uncertainty on xcr in the present study is about 30 % the results are quite close.
Examination of figure 9 strongly suggest the occurrence of early dry-out. When the liquid layer disappearsfrom the tube wall, the heat transfer coefficient suddenly decreases because of the lesser heat transport propertiesof the gas. This implies a wall temperature rise since heat removal is less efficient. Moreover, it is well knowthat dry-out is an intermittent phenomenon and that liquid drops regularly hit the tube wall, so that the tube walltemperature is submitted to quick changes. For the authors this explains why the uncertainty on the tube walltemperature also increases tenfold when dry-out occurs. Furthermore, the occurrence of early dry-out may beexplained by the thinning of the liquid layer due to bubbles confinement. This hypothesis also explains whythe critical vapour quality decrease from 0.4 to 0.2 when the hydraulic diameter decreases from 2 to 0.77 mmsince this increases bubble confinement. Moreover, this thinning of the liquid layer also explains why the heattransfer coefficient increases when the hydraulic diameter decreases because the heat transfer resistance due tothis liquid layer also decreases as long as dry-out does not occur.
The occuring of dry-out may explain why, when combined with heat flux dependent boiling, the heat trans-fer coefficient decreases with the mass velocity. The greater the mass velocity, the more probable dry-out shouldbe, because the liquid film is increasingly dragged from the wall due to shear stress. Thus dry-out should causea decrease in the heat transfer coefficient with the mass velocity.
0284
0.5286
1
288
1.5
290
2
292
2.5
294
3
296
3.5
298
300
0.1
302
0.2
304
0 0.30.1 0.40.2 0.50.3 0.60.4 0.70.5 0.80.6 0.9
∆
0.7
Tw
0.8
(K)
x
xcr
Tw
TT
m = 119 kg/m s
(K)
w
·
x
x
2
cr
6.0 kW/m 2
6.9
7.7
7.8
8.8
9.9
10.8
12.7
13.8
14.9
16.2
Figure 9: Wall temperature and its uncertainty versus local quality (Dh = 2 mm).
To explain why the boiling number seems to govern the transition between heat flux increasing α and vapourquality increasing α, the following interpretation is proposed, based on macroscale boiling mechanisms. Fromthe Rohsenow (1952) and Kew and Cornwell (1997) analysis, an inertial characteristic time τcv for the liquidlayer and a characteristic time τb for bubbles leaving the wall can be defined. Then, from the Kutaleladze (1981)and Rohsenow (1952) analysis it can be shown that the ratio of these two characteristic times can be written:
τcv
τb= f (θ,g,ρl,ρg,σ) ·Bo · f (x). (1)
This ratio is a comparison of convective effects in the liquid layer (causing α to increase with x) and bubbledynamics at the wall (causing α to increase with q). Thus τcv/τb is proportional to Bo and a function of vapourquality so that the boiling number is the appropriate dimensionless number to study the transition between thesetwo boiling regimes.
8

Finally, figure 10 illustrates the different boiling regimes in minichannels. This work suggests:(i) when Bo > 4.3 ·10−4 and Co < 0.5, nucleate boiling and dry-out seems to govern boiling in minichannels.
Moreover dry-out occurs at low vapour quality. Most of data for Dh = 2 mm were in this case.(ii) when 2.2 ·10−4 < Bo < 4.3 ·10−4 and Co < 0.5, nucleate boiling, convective boiling and dry-out seem
to compete. The frontier between the nucleate boiling and convective boiling is Bo · (1 − x) = 2.2 · 10−4.Furthermore dry-out occurs also at low vapour quality and its effects are superimposed on those of nucleateboiling and convective boiling and competes with them.
(iii) when Bo < 2.2 ·10−4 and Co > 0.5, boiling directly starts in the film evaporation regime with no heattransfer dependance since Bo · (1−0) = 2.2 ·10−4. The heat transfer coefficient increases with vapour quality,and does not depend upon the mass velocity and heat flux, until dry-out occurs. Then boiling is totally governedby dry-out and the heat transfer coefficient decreases sharply with vapour quality and remains independent ofthe mass velocity and heat flux.
This scheme illustrates the difference between the classical boiling regimes representations like figures 1and 2, and the present results on figure 10.
Bo > 4.3 10−4
Bo < 2.2 10−4
xcr
.
x
q.
cr
Tra
nsitio
n
QualityQuality
Heat
transfe
r coe
ffic
ien
t
Tra
nsitio
n
Heat
tran
sfe
r coeff
icie
nt
Quality
NB NB + DO
FE
FE+DO
...
QQualityQuality
NB + DONB
2.2 10 < Bo < 4.3 10−4 −4
q
NB : Nucleate boiling
CB : Convective boiling
DO : Dry−out
(a) (b)
(c)
FE : Film evaporation
x : critical qualitycr
(1−x) Bo = 2.2 10−4
00
CB + DO ?
Co = 0.46 Co = 0.46
Co = 1.14
Figure 10: Summing-up of boiling regimes in minichannels observed in the present work.
6. Correlating data
Most of the present data points belong to the heat flux dependent regime so that it has been possible to correlatethe heat transfer coefficient in this region with m, q and x. Finally, the following expressions were obtained.For Dh = 2 mm and Bo > 4.3 ·10−4,
x < 0.3−0.4 : α = 28 · q2/3 · m−0.26 · x−0.10 and x > 0.3−0.4 : α = 28 · q2/3 · m−0.64 · x−2.08, (2)
for Dh = 0.77 mm and Bo < 2.2 ·10−4,
x < 0.1−0.2 : α = 10260 · x0.15 and x > 0.1−0.2 : α = 10260 · (1− x)1.57. (3)
9

Equation (2), obtained by linear least squares fitting over 723 data points, predicts 95 % of our data in the ±30%range. Equation (3), obtained by linear least squares fitting over 825 data points, predicts 85 % of our data inthe ±30% range.
Figure 11 compares the ability of various correlations to predict the present data for Dh = 2 mm. The an-alytical expressions of these correlations have been reported in table 4. The Tran et al. (1997) and Kandlikar(2004) correlations, proposed for minichannels predicts the present data rather well in the pure heat flux depen-dent regime but fails as soon as dry-out occurs. The Steiner and Taborek (1992) correlation over-predicts thepresent data since it includes a D−0.4
h diameter correction term which is not well fitted for such small diameters.On the contrary the Shah (1976), Liu and Winterton (1991) correlations under-predict the present data becausethey do not take into account any confinement phenomenon as suggested by Cornwell and Kew (1992, 1995).
The Thome et al. (2004) and Dupont et al. (2004) three zone model was able to predict most of the trendsobserved, in particular for the 0.77 mm tube. It is not represented here since it implies the optimization ofminimum and maximum liquid layer thickness and bubble generation frequency parameters. However thereader is invited to refer to the cited articles where this model predictions are compared with the present data.
α (
W/m
α2
K)
·
·
Bo > 4.3 10−4
0
00 0.20.1 0.3 0.4 0.5 0.6 0.7 0.8
x
2000
4000
6000
8000
10000
12000
14000
(a)
(c) (b)
(h) (d)
(f)(g)
(e)
Cooper (1984)
Oh & al. (1998)
Tran & al. (1997)
Steiner & Taborek (1992)
Liu & Winterton (1991)
Shah (1976)
Kandlikar (2004)
eq. (2)
measurements
(a)
(b)
(c)
(d)
(e)
(f)
(g)
(h)
m =
q = 30229·
236 kg/m s
W/m92
2
Figure 11: Comparaison with litterature correlations.
Table 4: Expressions of correlations represented on figure 11.
Author ExpressionShah (1976) αTP/αl = f (Bo,Cv)Cooper (1984) αTP = 55 · p0,12
r · q2/3(− log10 pr)−0,55M−0,5
Liu and Winterton (1991) α2TP = α2
lo +α2Cooper
Steiner and Taborek (1992) α3TP = α3
lo +α3npb
Tran et al. (1997) Nu = 770 · (Bo ·Relo ·Co)0,62 · (ρv/ρl)0,297
Oh et al. (1998) αTP/αl = 240/χtt · (1/ReTP)0,6
Kandlikar (2004) αTP = max(αnb,αcb)Present study (2004) eq. (2)
7. Flow regimes
Different authors have identified various flow regimes in large channels. In both vertical and horizontal config-urations these include bubbly, dispersed bubbly, slug, pseudo-slug, churn, annular, annular mist and disperseddroplet flows. An important difference in minichannels is that the liquid flow is preferentially laminar. Surfacetension effects have more and more influence as the hydraulic diameter is reduced. Gravity becomes negligiblecompared to surface tension so that the orientation is less influential.
10

In different studies identifying flow configurations in minichannels, fundamental configurations specificto minichannels are observed: isolated bubbles, confined bubbles and annular slug flow (Kew and Cornwell(1997)). However, some authors observed flow regimes typical of macroscale tubes: bubbly, plug, slug, wavy-annular and annular flow (Kuwahara et al. (2000)).
Triplett et al. (1999) measured pressure drop and void fraction in minichannels with air-water adiabaticflows. They observed bubbly, churn, slug, slug-annular and annular flows as in conventional tubes, but thetransitions were very different. Moreover they highlighted that the homogeneous model best predicted theirpressure drop measurements for every flow configuration except the annular one.
Huo et al. (2004) established a flow map for refrigerant R134a flowing in 2.01 mm and 4.26 mm diameterround vertical tubes. They observed six typical flow patterns, i.e. dispersed bubbles, bubbly, slug, churn, annularand mist. Significant differences were found with the existing models for normal size tubes. For example thechurn flow pattern becomes a more important flow pattern compared to classical models where it shrinks to avery small area. The authors also observed that reducing the diameter shifted the transition of slug to churn andchurn to annular to higher values of the gas velocity. Figure 12 presents the flow map proposed by Huo et al.(2004) for a 2.01 mm diameter tube. The data of the present work are reported and are all in the annular flowregion. As a conclusion, the analysis in terms of flow chart does not allow us to find a clear relation with theheat transfer coefficient measurements.
0.01 0.1u (m/s)
1 10 1000.01
0.1
1
10
bubblyslug
churn
dispersed bubbles
annular
D = 0.77 mmD = 2 mm
h
h
vs
u ls(m
/s)
Figure 12: Flow regimes observed by Huo et al. (2004).
8. Pressure drop
A time averaging method was used in order to reduce wild pressure oscillations. In order to avoid non uniformdistribution of coolant fluid only subcooled liquid entered the inlet manifold. Furthermore the engineering rulethat the manifold diameter should be at last five times greater than the channel hydraulic diameter to equalisethe fluid distribution was used. However, even if non uniform distribution occurs it will not affect the inlet andoutlet measurements which are performed outside of the manifolds and it should not affect the local temperaturemeasurements because of the averaging of wall temperatures across the N channels due to the very high thermalconductivity of the aluminium.
Figure 13 shows the two-phase pressure drop gradient versus the outlet quality. The solid lines represent thepressure gradient modelled with the homogeneous model. As shown in figure 13, the present measured pressuregradient is linear with xo. This is characteristic of preponderant frictional pressure losses since integration of thehomogeneous model for uniform longitudinal heating, constant thermophysical properties and friction factorshows that the frictional part of the two-phase flow pressure drop is linear with the outlet quality.
However this result and the prevalence of heat flux dependent boiling for Dh = 2 mm seem contradictorywith the prevalence of the annular flow regime (see section 7.) which would rather suggest a separated phasesmodel to calculate pressure losses. Yet, it is well known that the parietal heat transfer deeply disturbs the flowconfiguration because of the generation of bubbles at the wall. Thus the flow configuration might not be pureannular but actually slug-annular or churn flow. That would promote the mixing of liquid and vapour thus
11

explaining the good predictions of the homogeneous model. Nevertheless this issue will be resolved only witha test section allowing flow visualisation and heat transfer at the same time.
0
10
20
30
40
50
60
0.1 0.2 0.3 0.4 0.5 0.6 0.7 0.8 0.9 1
∆p∆∆T
P/ L
PT
PLL
(kPa
/m)
P
xo
90 kg/m2 s2
119179237292
Figure 13: Pressure drop versus outlet quality (Dh = 2 mm).
9. Conclusions
Forced flow boiling heat transfer in minichannels in similar conditions as encountered in automobile air condi-tioners has been studied. Higher heat transfer coefficients than in conventional tubes are achieved but dry-outoccurs at low vapour qualities thus decreasing performances. However the average heat transfer coefficient re-mains higher than in conventional tubes. These observations support literature studies which predict that bubbleconfinement leads to higher heat transfer coefficients and dry-out at low vapour quality in minichannels. Thenew Kandlikar (2004) general correlation for flow boiling in tubes was found to predict the present results be-fore dry-out occurs. The Thome et al. (2004) and Dupont et al. (2004) three zone model for microscale boilingpredicted most of the observed trends, including dry-out and the lack of mass velocity influence. Using it forpredictions still requires testing over a consequent database.
The effect of confinement on the heat transfer coefficient before dry-out was found to be an increase of 74%when the hydraulic diameter decreased from 2 to 0.77 mm. The effect of confinement on dry-out was found tobe a decrease in the critical quality from 0.3–0.4 to 0.1–0.2 for the same reduction of the hydraulic diameter.Heat flux dependent boiling prevailed in the 2 mm hydraulic diameter tube while quality dependent boilingprevailed in the 0.77 hydraulic diameter tube because of the difference in boiling and confinement numbers.The transition from one regime to another occurred for Bo · (1−x) ≈ 2.2 ·10−4 regardless of the heat and massvelocity. Moreover it was found that dry-out could even be the dominant boiling mechanism at low qualities.The results obtained with the 2 mm hydraulic diameter tube were in total agreement with Huo et al. (2004)’swork. Finally frictional pressure losses seem to dominate up to mass velocities of 469 kg/m2 s.
The choice of MPE tubes for the test section allowed easier measurements and results closer to industrialreality. Further studies should put the stress on the accurate influence of channel geometry and confinement onheat transfer with diabatic flow visualisation and a large variety of channels configurations.
Nomenclature
Afl total flow area (m2)Bo = q/(m ·hlv) Boiling numberCo = (σ/(g · (ρl −ρv))0.5/Dh Confinement numberCv = ((1− x)/x)0.8 · (ρv/ρl)0.5 Convection numberDh = 4A44 fl/PflPP hydraulic diameter (m)L tube length (m)M molecular weight g/molm mass velocity (kg/m2 s)N number of channels
12
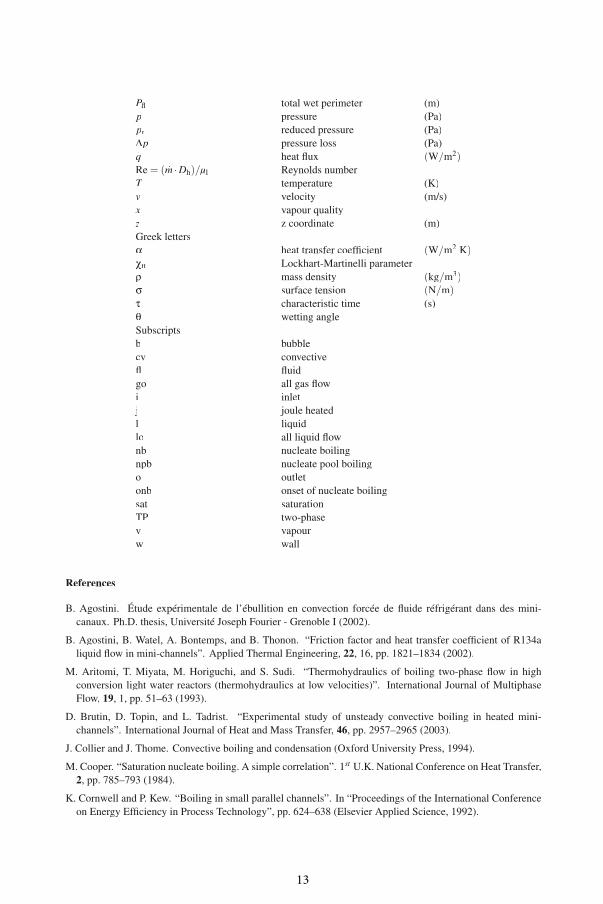
PflPP total wet perimeter (m)p pressure (Pa)pr reduced pressure (Pa)∆p pressure loss (Pa)q heat flux (W/m2)Re = (m ·Dh)/µl Reynolds numberT temperature (K)v velocity (m/s)x vapour qualityz z coordinate (m)Greek lettersα heat transfer coefficient (W/m2 K)χtt Lockhart-Martinelli parameterρ mass density (kg/m3)σ surface tension (N/m)τ characteristic time (s)θ wetting angleSubscriptsb bubblecv convectivefl fluidgo all gas flowi inletj joule heatedl liquidlo all liquid flownb nucleate boilingnpb nucleate pool boilingo outletonb onset of nucleate boilingsat saturationTP two-phasev vapourw wall
References
B. Agostini. Étude expérimentale de l’ébullition en convection forcée de fluide réfrigérant dans des mini-canaux. Ph.D. thesis, Université Joseph Fourier - Grenoble I (2002).
B. Agostini, B. Watel, A. Bontemps, and B. Thonon. “Friction factor and heat transfer coefficient of R134aliquid flow in mini-channels”. Applied Thermal Engineering, 22, 16, pp. 1821–1834 (2002).
M. Aritomi, T. Miyata, M. Horiguchi, and S. Sudi. “Thermohydraulics of boiling two-phase flow in highconversion light water reactors (thermohydraulics at low velocities)”. International Journal of MultiphaseFlow, 19, 1, pp. 51–63 (1993).
D. Brutin, D. Topin, and L. Tadrist. “Experimental study of unsteady convective boiling in heated mini-channels”. International Journal of Heat and Mass Transfer, 46, pp. 2957–2965 (2003).
J. Collier and J. Thome. Convective boiling and condensation (Oxford University Press, 1994).
M. Cooper. “Saturation nucleate boiling. A simple correlation”. 1st U.K. National Conference on Heat Transfer,2, pp. 785–793 (1984).
K. Cornwell and P. Kew. “Boiling in small parallel channels”. In “Proceedings of the International Conferenceon Energy Efficiency in Process Technology”, pp. 624–638 (Elsevier Applied Science, 1992).
13

K. Cornwell and P. A. Kew. “Evaporation in micro-channel heat exchangers”. In “Proceedings of the 4th U.K.National Conference on Heat Transfer”, pp. 289–294 (ImechE, 1995).
V. Dupont, J. Thome, and A. Jacobi. “Heat transfer model for evaporation in microchannels. part II: comparisonwith the database”. International Journal of Heat and Mass Transfer, 47, pp. 3387–3401 (2004).
A. Feldman. De l’ébullition en convection forcée dans des canaux d’échangeurs à plaques et ailettes. Ph.D.thesis, Université Henry Poincaré, Nancy I (1996).
X. Huo, L. Chen, Y. Tian, and T. Karayiannis. “Flow boiling and flow regimes in small diameter tubes”. AppliedThermal Engineering, 24, pp. 1225–1239 (2004).
E. Ishibashi and K. Nishikawa. “Saturated boiling heat transfer in narrow spaces”. International Journal of Heatand Mass Transfer, 12, pp. 863–894 (1969).
S. Kandlikar. “Fundamental issues related to flow boiling in minichannels and microchannels”. ExperimentalThermal Fluid Science, 26, pp. 389–407 (2002).
S. Kandlikar. “An extension of the flow boiling correlation to transition, laminar, and deep laminar flows inminichannels and microchannels”. Heat Transfer Engineering, 25, 3, pp. 86–93 (2004).
S. Kandlikar and W. Grande. “Evolution of microchannel flow passages — thermohydraulic performance andfabrication technology”. Heat Transfer Engineering, 25, pp. 3–17 (2003).
P. A. Kew and K. Cornwell. “Correlations for the prediction of boiling heat transfer in small diameter channels”.Applied Thermal Engineering, 17, 8–10, pp. 705–715 (1997).
S. Kline and F. McClintock. “Describing uncertainties in single-sample experiments”. Mechanical Engineering,pp. 3–8 (1953).
S. Kutaleladze. “Principal equations of thermodynamics of nucleate boiling”. Heat Transfer Sovietic Research,13, 3, pp. 1–14 (1981).
K. Kuwahara, S. Koyama, J. Yu, C. Watanabe, and N. Osa. “Flow pattern of pure refrigerant HFC134a evap-orating in a horizontal capillary tube”. In “Proceedings of Symposium on Energy Engineering in the 21th
Century”, pp. 445–450 (2000).
Z. Liu and R. Winterton. “A general correlation for saturated and subcooled flow boiling in tubes and annuli,based on a nucleate pool boiling equation”. International Journal of Heat and Mass Transfer, 34, 11, pp.2759–2766 (1991).
H. Oh, M. Katsuta, and K. Shibata. “Heat transfer characteristics of R134a in a capillary tube heat exchanger”.In “Proceedings of 11th IHTC”, volume 6, pp. 131–136 (1998).
W. Rohsenow. “A method of correlation heat-transfer data for surface boiling of liquids”. Transactions of theASME, 74, pp. 969–976 (1952).
M. Shah. “A new correlation for heat transfer during boiling flow through pipes”. Transactions of the ASHRAE,82, pp. 66–86 (1976).
D. Steiner and J. Taborek. “Flow boiling heat transfer in vertical tubes correlated by an asymptotic model”.Heat Transfer Engineering, 13, 2, pp. 43–69 (1992).
J. Thome. “Boiling in microchannels: a review of experiment and theory”. International Journal of Heat andFluid Flow, 25, pp. 128–139 (2004).
J. Thome, V. Dupont, and A. Jacobi. “Heat transfer model for evaporation in microchannels. part I: presentationof the model”. International Journal of Heat and Mass Transfer, 47, pp. 3375–3385 (2004).
T. Tran, M. Wambsganss, M. Chyu, and D. France. “A correlation for nucleate flow boiling in small channels”.In R. K. Shah, editor, “Compact Heat Exchangers for the Process Industries”, pp. 353–363 (Begell House,inc., 1997).
K. Triplett, S. Ghiaasiaan, S. Abdel-Khalik, A. LeMouel, and B. McCord. “Gas liquid two-phase flow inmicrochannels. Part I : two-phase flow patterns”. International Journal of Multiphase Flow, 25, pp. 377–394(1999).
14