flow deflection over a foredune - uq espace347925/uq347925_oa.pdf · flow deflection over a...
TRANSCRIPT

�������� ����� ��
Flow deflection over a foredune
Patrick A. Hesp, Thomas A.G. Smyth, Peter Nielsen, Ian J. Walker,Bernard O. Bauer, Robin Davidson-Arnott
PII: S0169-555X(14)00542-XDOI: doi: 10.1016/j.geomorph.2014.11.005Reference: GEOMOR 4973
To appear in: Geomorphology
Received date: 30 May 2014Revised date: 3 November 2014Accepted date: 7 November 2014
Please cite this article as: Hesp, Patrick A., Smyth, Thomas A.G., Nielsen, Peter, Walker,Ian J., Bauer, Bernard O., Davidson-Arnott, Robin, Flow deflection over a foredune,Geomorphology (2014), doi: 10.1016/j.geomorph.2014.11.005
This is a PDF file of an unedited manuscript that has been accepted for publication.As a service to our customers we are providing this early version of the manuscript.The manuscript will undergo copyediting, typesetting, and review of the resulting proofbefore it is published in its final form. Please note that during the production processerrors may be discovered which could affect the content, and all legal disclaimers thatapply to the journal pertain.

ACC
EPTE
D M
ANU
SCR
IPT
ACCEPTED MANUSCRIPT
Flow deflection over a foredune
Patrick A. Hesp1, Thomas A.G. Smyth
1, Peter Nielsen
2, Ian J. Walker
3, Bernard O.
Bauer4, and Robin Davidson-Arnott
5
1School of the Environment, Faculty of Science and Engineering, Flinders University,
Bedford Park, South Australia 5042
[email protected]; [email protected]
2School of Civil Engineering, University of Queensland, St Lucia, Qld. 4072
3Dept of Geography, University of Victoria, P.O. Box 3060, Station CSC, Victoria, BC
Canada V8W 3R4
4Earth and Environmental Sciences & Geography, University of British Columbia,
Okanagan, Kelowna, BC Canada V1V 1V7
5Dept of Geography, University of Guelph, Guelph, ON Canada N1G2W1
Flow deflection of surface winds is common across coastal foredunes and blowouts. Incident
winds approaching obliquely to the dune toe and crestline tend to be deflected towards a
more crest-normal orientation across the stoss slope of the foredune. This paper examines

ACC
EPTE
D M
ANU
SCR
IPT
ACCEPTED MANUSCRIPT
1
field measurements for obliquely incident winds, and compares them to computational fluid
dynamics (CFD) modelling of flow deflection in 10° increments from onshore (0°) to
alongshore (90°) wind approach angles. The mechanics of flow deflection are discussed,
followed by a comparative analysis of measured and modelled flow deflection data that
shows strong agreement. CFD modelling of the full range of onshore to alongshore incident
winds reveals that deflection of the incident wind flow is minimal at 0° and gradually
increases as the incident wind turns towards 30° to the dune crest. The greatest deflection
occurs between 30° and 70° incident to the dune crest. The degree of flow deflection depends
secondarily on height above the dune surface, with the greatest effect near the surface and
toward the dune crest. Topographically forced flow acceleration ("speed-up") across the stoss
slope of the foredune is greatest for winds less than 30° (i.e., roughly perpendicular) and
declines significantly for winds with more oblique approach angles. There is less lateral
uniformity in the wind field when the incident wind approaches from >60° because the effect
of aspect ratio on topographic forcing and streamline convergence is less pronounced.
KEY WORDS: Foredune, flow deflection, Computational fluid dynamics (CFD), oblique
winds.
Introduction
Flow deflection of near surface (i.e., z <10 m) winds approaching dunes and blowouts from
an oblique angle is commonly observed (e.g., Svasek and Terwindt, 1974; Mikkelsen, 1989;
Rasmussen, 1989; Arens et al., 1995; Hesp and Pringle, 2001; Hesp, 2002; Walker et al.,
2006; 2009; Lynch et al., 2008, 2009, 2013; Smyth et al., 2011; 2012; 2013; 2014). Over
coastal foredunes and other ridges such as transverse dunes, oblique winds tend to be
deflected towards more crest-normal as the flow approaches and crosses the stoss slope of the

ACC
EPTE
D M
ANU
SCR
IPT
ACCEPTED MANUSCRIPT
2
dune or ridge (e.g., Svasek and Terwindt, 1974; P. Jackson, 1977; 1979; Tsoar, 1983a, b;
Walker et al., 2006; 2009; Lynch et al., 2008; 2010; Jackson et al., 2011; Bauer et al., 2012;
Rubin and Rubin, 2013; Walker and Shugar, 2013). This phenomenon is important for
several reasons, including: (i) oblique winds can transport sediment onto a foredune or away
from it depending on the incidence angle (Arens, 1996; Walker et al., 2006; Lynch et al.,
2008; 2010), thereby affecting the sediment supply to the dune system (Arens et al., 1995;
Arens, 1996); (ii) wind deflection can strongly influence net transport pathways and
sedimentation patterns on a foredune (Svasek and Terwindt, 1974; Hesp, 2002; Walker et al.,
2006; 2009; Bauer et al., 2012); (iii) beach transport conditions may be decoupled from
foredune transport conditions at certain approach angles (Bauer et al., 2012); (iv) sedimentary
strata may be deposited more crest transverse than the wind regime would indicate (Hesp,
1988), thereby leading to erroneous paleo-environmental interpretations; and (v) fetch
distances and sand transport pathways into and over dunes may be greater or less than
predicted depending on the nature and magnitude of flow deflection (Svasek and Terwindt,
1974; Walker et al., 2006; 2009; Walker and Shugar, 2013).
Several studies have suggested that near-surface flow deflection occurs in response to
pressure differences upwind of the dune toe and up the stoss slope (Svasek and Terwindt,
1974; Bradley, 1983; Mikkelsen, 1989). The resulting pressure gradient produces deviations
of streamline orientations from the incident direction as a consequence of mass and
momentum conservation. Reviews of related topographic forcing and steering effects in near-
surface airflow over foredunes are provided in Walker et al. (2006; 2009), and over
transverse ridges more generally (Finnigan et al., 1990; Weng et al., 1991; Wiggs et al., 1996;
Belcher and Hunt, 1998, Wood, 2000; Parson et al., 2004; Ayotte and Hughes, 2004; Bauer et
al., 2013; Walker and Shugar, 2013). The greatest deflection occurs when incident winds
approach the dune at moderate to highly oblique approach angles (Mikkelsen, 1989).

ACC
EPTE
D M
ANU
SCR
IPT
ACCEPTED MANUSCRIPT
3
According to Svasek and Terwindt (1974), maximum deflection occurs at incident angles
between 30° and 60° and the degree of deflection is most pronounced near the surface
(Mikkelsen, 1989; Walker et al., 2009). Bradley (1983) and Walker et al. (2009) found an
inverse relationship between incident flow direction and speed, such that when the flow was
more oblique to the dune crestline, the flow speed decreased over the dune (cf. Arens, 1995;
1996; Lynch et al., 2010; Jackson et al., 2011), which implies that less sand can be delivered
to the foredune crest and lee-side region. Arens et al. (1995) found that, as winds became
more oblique, the effective slope (i.e., aspect ratio) diminished and, in response, transport
rates up the stoss slope decreased because topographically-forced flow acceleration is not as
pronounced as with perpendicular approach angles.
The degree of flow steering found in empirical studies varies. Bradley (1983) examined flow
over a long low hill in the field and found only slight deflection (~1-2°) of the obliquely
incident winds. This may be a partly methodological issue because they compared winds at
the crest to those at the base of the slope (rather than the incident conditions some distance
upwind of the toe). Moreover, the topographic profile of the ridge was low. Walker et al.
(2006; 2009) and Bauer et al. (2012) report that incident flow is already partly deflected at
the base of a foredune. For a separate theoretical case, Bradley (1983) found a deflection of
~4° for an incident oblique wind approaching the ridge at 24°. Rasmussen (1989), following
on the fieldwork of Mikkelsen (1989), examined flow vectors and steering at 1 m height over
a 2-D symmetrical dune ridge. For an incident oblique wind 30° to crest-normal, Rasmussen
(1989) found that flow was deflected more crest-normal by 10° by the mid-stoss slope and 15°
by the dune crest. For flow approaching a steep, 70- to 90-m high scarp at an angle of 45° to
normal, it was found that flow separated in front of the scarp base and was deflected
alongshore, while higher up the scarp the flow crossed at an oblique angle. Arens et al.
(1995) argued that flow deflection increased with increasing foredune height. They found

ACC
EPTE
D M
ANU
SCR
IPT
ACCEPTED MANUSCRIPT
4
flow deflections of less than 15° up to 30° for low (1-2 m high) to high (12-15 m) foredunes,
respectively.
Walker et al. (2006) examined flow responses over a foredune at Prince Edward Island (PEI),
Canada, and found that the flow veered 7° from the backshore into the dune toe and another
12° from the dune toe to lower stoss slope, despite the regional flow being oblique offshore.
At the same study site, Walker et al. (2009) found that, during very oblique incident flow
conditions, there was significant deflection of flow (as much as 37°) from the backshore to
the crest of the 12-m high foredune. In a subsequent study at the PEI site, Bauer et al. (2012)
documented pronounced deflection of oblique incident winds over the foredune, and found
that wind directions on the beach during a storm event were far less variable than those on the
dune crest for the same incident winds. During alongshore incident flow conditions Lynch et
al. (2009) found that wind near the dune crest was deflected more offshore compared to the
flow along the beach and, for obliquely onshore winds, they found a deflection of ~20°
towards shore-normal.
Despite the number of studies that have documented deflection of near-surface winds and that
have speculated on the implications for aeolian transport pathways (e.g., Walker and
Nickling, 2002; Baddock et al., 2007; Walker and Shugar, 2013), and its importance in
contributing to foredune evolution and form, there have been few detailed studies dedicated
to the nature of flow deflection, and little modelling of the process. In this paper, we examine
the nature of flow deflection over a foredune for a full range of onshore to alongshore
incident winds (0° to 90°) using empirical observations and computational fluid dynamics
modelling (CFD).
STUDY SITE AND METHODS

ACC
EPTE
D M
ANU
SCR
IPT
ACCEPTED MANUSCRIPT
5
Study Site
The study site was located on a foredune within the Greenwich Dunes unit of Prince Edward
Island National Park on the north-east shore of Prince Edward Island (PEI), Canada (Fig. 1).
The field experiments were part of a study on the airflow and sedimentary dynamics of this
beach-dune complex (e.g. Davidson-Arnott et al., 2003, 2008, 2009, 2012; Walker et al.,
2003, 2006, 2009; Hesp et al, 2005, 2009, 2013; Bauer et al., 2009, 2012; Delgado-Fernandez
and Davidson-Arnott, 2009; Hesp and Walker, 2012; Chapman et al., 2012, 2013;Delgado-
Fernandez et al., 2013; Ollerhead et al., 2013).
Figure 1: Location of the Greenwich dunes unit within Prince Edward Island National Park
on P.E.I., Canada.
The foredune crest is ~10 m above mean water level with a steep stoss slope (20°-25°) and an
ENE-WSW crestline orientation. The foredune has been stable in position and growing in

ACC
EPTE
D M
ANU
SCR
IPT
ACCEPTED MANUSCRIPT
6
height since 1953 on this erosional coast (Ollerhead et al., 2013). The dune fronts onto a low-
gradient, microtidal (~1 m), moderate to high energy intermediate beach with a low-tide
width of about 35 m, and backs onto the deflation plain of a large parabolic dune (see Walker
et al., 2009; Mathew et al., 2010). Two experiment lines were originally established on the
foredune, one on a non-scarped section and one on an initially scarped section. The latter
section is the line examined further in this study because this is where the high-frequency
instrumentation was deployed. The foredune displayed a non-vegetated, 0.7-m high scarp at
the initiation of experiments, which later filled in with sand following a significant wind
storm (see Fig. 6 in Hesp et al., 2009). The dune is vegetated by Ammophila breviligulata,
with plant heights averaging 0.3 m and with a spatial density ranging from 2 – 45% based on
visual assessments on contiguous transects.
Experimental Methods and Set-up
Figure 2. Crest perpendicular profile of the foredune at Prince Edward Island. The locations
of 3-D anemometers utilized in the field measurements are indicated by circles on the profile.
The data utilized for modelling comparison purposes were collected on the 11th October,
2004 during a moderate to gale force wind speed event (Tropical Storm Nicole - see Fig. 2 in

ACC
EPTE
D M
ANU
SCR
IPT
ACCEPTED MANUSCRIPT
7
Hesp et al., 2009, Fig. 3 in Hesp et al., 2013, and Fig. 12 in Walker et al., 2009). In this
investigation, wind speed was measured from 7 sonic anemometers on the dune stoss face
and crest. A cup anemometer positioned at 4 m elevation and 12.34 m seawards of the dune
toe on the beach provided incident wind conditions.
Three-dimensional velocity fields were measured with RM Young 3-D sonic anemometers
aligned parallel to the slope (Fig. 2). These instruments have a wind speed resolution of 0.01
ms-1, an accuracy of +/- 1% up to 30 ms-1, and a wind direction resolution of 0.1° and an
accuracy of +/- 2° up to 30 ms-1. Pairs of sensors were deployed at 0.66 m, and 2.05 m above
the bed at the base of the stoss slope, on the mid stoss slope at 0.66 m and 1.66 m, and at the
crest, also at 0.66 m and 1.66 m. An additional 3-D sonic was deployed at 0.66 m height at
the scarp crest. Three-dimensional velocity components (U,V and W) were measured
continuously at 32 Hz for the duration of the storm event, and then subsets of 10-minute
periods were extracted to characterize the range of wind velocities experienced throughout
the storm event.
For the results presented here, the directional reference used in some of our previous papers
at this site has been modified, such that 0° is onshore (perpendicular to the crestline of the
foredune), 90° is alongshore (i.e. from the east) and 180° is offshore (i.e. winds blowing
directly offshore). This was necessary for purposes of the CFD modelling. Instrument U–V
planes were installed parallel to the underlying surface slope so as to limit streamline
misalignment to the sensor sampling plane (Walker, 2005). No pitch corrections were
applied and, therefore, mean flows in the vertical direction (i.e., perpendicular to the
underlying topographic slope) imply a local streamline direction oriented either toward the
surface (negative W) or away from the surface (positive W). As the sonic anemometers were
installed to within +/- 1° of the slope, the time series were not adjusted for yaw, which rotates

ACC
EPTE
D M
ANU
SCR
IPT
ACCEPTED MANUSCRIPT
8
the dataset to a coordinate system that is parallel to the wind streamlines. Nevertheless, the
magnitude of the yaw angle for each time increment was calculated in order to provide the
essential information on flow deflection.
Computational Fluid Dynamics (CFD) Methodology
Wind flow over the dune surface was simulated using CFD, which has been used successfully
to simulate flow over a number of coastal dune landforms (Pattanapol et al., 2008; Wakes et
al., 2010; Jackson et al., 2011; Smyth et al., 2012; 2013). Simulations in this study were
performed using open-source software, OpenFOAM, which is capable of solving a range of
complex fluid flows but also includes tools for meshing the surface topography and
visualising the results. The wind field over the dune was simulated assuming incompressible
flow using a large time-step transient solver, pimpleFoam. Turbulence was modelled using
the Renormalised Group (RNG) k-epsilon method (Yakhot et al., 1992). The turbulence
model is based on the Reynolds-averaged Navier-Stokes (RANS) equations, which focuses
on the effects of turbulence on the average flow rather than resolving turbulence at every
scale, as with direct numerical simulation (DNS) or at the larger scale like a large eddy
simulation (LES). The RNG model has been used to accurately simulate near surface flow
over a transverse dune in a wind tunnel (Parsons et al., 2004), coastal dune complex (Wakes
et al., 2010), and a complex foredune blowout (Smyth et al., 2012; 2013). The digital
elevation model used to represent the dune surface within the computational domain was
generated from RTK-DGPS points collected on site prior to the experiments.
The surface of the domain was given a roughness height of 0.05 m, the same as that stated for
a beach by Pattanapol et al. (2007). This height was prescribed, as at least two cells are
recommended between the surface and the area of interest within the computational domain
(Franke et al., 2004). In this case, the nearest field measurement point was at 0.66 m above

ACC
EPTE
D M
ANU
SCR
IPT
ACCEPTED MANUSCRIPT
9
the surface, therefore a minimum cell height of 0.15 m was utilised. Although this is smaller
than the stem height of the vegetation recorded in the field (0.3 m), the size of the near
surface grid cell (0.6 m) required to include information on actual vegetation effects is too
large to properly simulate the complexity of near surface flow that occurs in vegetated
surfaces in the field.
A mesh independence study was completed to ensure the simulation results were independent
of the mesh resolution. This was achieved by increasing the horizontal resolution of the mesh,
producing an increase in the total number of cells by 40%. Results at 70 locations throughout
the computational domains were compared for 2 directions and average variance in wind
direction was found to be below 1% for both cases.
Flow at the upwind boundary was defined as a logarithmic profile as described by Blocken et
al. (2007). The turbulence model parameters k and epsilon were given initial values of 0.325
on the assumption they would adjust to the upwind boundary conditions quickly on
simulation commencement (as validated by e.g. Wakes et al., 2013, and Flores et al., 2013).
Wind flow over the dune was modelled at 10° increments from parallel to the crest
(alongshore, 90°) to perpendicular to the crest (onshore, 0°), thereby producing a total of ten
flow simulations.
Modelled U, V and W components were adjusted to be slope-aligned using a clockwise
rotation of the coordinate reference frame to be consistent with the field instruments. Only
the modelled U and W vectors were realigned in this way since V for the field and model
results were already in the same reference frame.
The U and W alignment algorithms are:
Aligned CFD U = CFD U*COSINE(slope in radians) – CFD W*SIN(slope in radians) (1)

ACC
EPTE
D M
ANU
SCR
IPT
ACCEPTED MANUSCRIPT
10
Aligned CFD W = CFD U*SIN(slope in radians) + W*COS(slope in radians) (2)
Wind direction was validated graphically by comparing vectors of modelled and measured
data and by percentage difference calculations (Smyth et al., 2013), as follows:
CFD wind direction % error = (measured – modelled)/360*100 (3)
CONCEPTUALIZING FLOW DEFLECTION OVER A DUNE RIDGE
Before examining the field and modelled data, it is useful to consider why flow deflection
occurs when wind approaches a foredune ridge from an oblique angle. Consider an oblique,
onshore coastal wind crossing a beach and encountering a linear, two-dimensional, shore-
parallel dune. As noted above, field observations have shown that such an oblique wind will
be subject to topographic steering effects as it progresses up the stoss slope, such that it
becomes more crest-perpendicular toward the crest (e.g., Arens, 1995; Walker et al., 2006,
2009, Bauer et al., 2012). The Bernoulli equation provides a qualitative explanation for why
topographic steering will occur. At the outset, however, it needs to be recognized that the
Bernoulli approach presumes incompressible, irrotational flow and an inviscid fluid. As a
consequence, there can be no shearing motion in the internal domain of the fluid, and
therefore lateral shear forces are considered to be a secondary effect by definition. Fig. 3
shows two parallel streamlines connected by an infinitesimally small volume of air at the
local ground level with mass, m, length, l, and cross-sectional area, A. The axis of the air
volume along l is perpendicular to the streamlines, but forms a local angle with the dune line
orientation, α. Flow velocity, V, is assumed uniform along any dune contour but is allowed to
change as the streamline moves up the stoss slope as a function of streamline convergence.

ACC
EPTE
D M
ANU
SCR
IPT
ACCEPTED MANUSCRIPT
11
Although velocity will also change with height above the bed this effect is not modelled in
this two-dimensional approach.
Writing the Bernoulli Equation for the two ends of the cylindrical air volume yields,
(4)
where P is pressure, ρ is density, g is acceleration due to gravity, and Z is height. The
standard application of the Bernoulli Equation is normally for two points along the same
streamline, but when the flow is laterally uniform along a two-dimensional dune, the two
streamlines through the ends of the parcel are equivalent and exchangeable. As wind moves
up the dune according to the elevation difference between the two points, the near-surface
flow field converges and accelerates. The flow acceleration, in turn, creates a pressure
gradient, which is ultimately responsible for the steering influence.
1P − ∆ + )2 1
P + ρ(V ∆V + ρg(Z + ∆Z ) = P + ρV 2 + ρgZ2 2 �
� − ∆ + ��� + ∆ ��� � +�

ACC
EPTE
D M
ANU
SCR
IPT
ACCEPTED MANUSCRIPT
12
Figure 3: Illustration of a parcel of air approaching the dune at an oblique angle. The initially
oblique wind tends to become more crest-perpendicular as it climbs the dune stoss slope.
To simplify the analysis, it is useful to combine the pressure and elevation terms into a
piezometric pressure P*= P+ρgz, so equation (4) becomes,
Then, the approximate piezometric pressure difference between the ends of the air parcel can
be written as (omitting a negligible term in ΔV2 given that the difference in velocity across the
air volume is small in comparison to the absolute wind speed),
Svasek and Terwindt (1974; Fig. 6) implicitly followed a similar line of reasoning to reach
the same conclusions.
As above, this piezometric pressure gradient ΔP* provides a net force, on
the air parcel in a direction perpendicular to its trajectory, which is proportional to a rate of
deflection dα/dt through Newton's Second Law of Motion;
(7)
1P * −∆P* + ρ(V ++ ∆
2 V )2 1= P * + ρV 2
2 (5)
∆P* = ρV∆V (6))
dαm |V | = F
dt ⊥
F⊥ = ∆P* A

ACC
EPTE
D M
ANU
SCR
IPT
ACCEPTED MANUSCRIPT
13
�|�|��
��= �
⊥
Using the definition of the total derivative, d/dt = V d/ds, where s is the distance along a
streamline, Equations 6 and 7 can be manipulated as follows,
(8).
�|�|��
��= ���
��
��= �⊥ = ∆�∗ ≈ −�∆�
The approximation at the end of Equation 8 is drawn from Equation 6, which ignores a small,
higher order velocity gradient term. The general form of Equation 8 can be rearranged to
yield,
(9)
��
��=
−∆�
��= −
∆�
��
which shows that an increase of ΔV /V up the dune (right hand side of equation) is balanced
by an increase in the rate of deflection (left hand side of equation). Writing the velocity
difference ΔV between the two ends of the air volume in terms of the uphill acceleration dV/dz
and the elevation difference βl sin α, where β is the slope of the dune surface, we arrive at a
differential equation that describes the deflection of the wind (i.e., variation of α) in terms of
the mean velocity, the velocity gradient in the up-dune direction, and the slope angle,
(10)
m |V |dαdt
= mV 2 dαds
= F⊥ = − ∆P* A ≈ − ρV∆V A
dαds
=−ρ∆V A
mV= − ∆V
lV
dαds
= −β dV
dzV
sinα

ACC
EPTE
D M
ANU
SCR
IPT
ACCEPTED MANUSCRIPT
14
��
��= −
����
�����
Equation 10 shows that if the wind is initially perpendicular to the dune (i.e. sinα = α = 0)
there is no deflection along the streamline. If the angle of wind approach is oblique to the
dune, the sinα term is non-zero and wind steering occurs. The effect is most pronounced
when the dune slope angle (β) is steep and the uphill acceleration (dV/dz) is strongest.
Interestingly, the strength of the steering effect is inversely proportional to the mean incident
wind speed, which may explain some of the variance in the empirical data regarding flow
deflection over dunes. Similarly, there is a limit to this topographic forcing because with
very oblique angles of wind approach, the velocity gradient becomes small as it is forced over
a much longer and gentler facet of the dune (i.e., the apparent steepness or aspect ratio of the
dune decreases). As a very loose approximation, dV/dz ~ cosα, which leads to,
(11)
��
��~��������~���2�
Equation 11 is zero for both 0o and 90o and maximum for α= 45o, corresponding to the
suggestion by Svasek and Terwindt (1974) that maximum deflection should occur for 30o
<α< 90o.
The above derivations are admittedly simplistic in as much as the Bernoulli Equation neglects
friction, turbulence, flow compressibility, wind unsteadiness, and various other 3-D boundary
layer dynamics that occur as the wind approach angle shifts from onshore to alongshore.
Nevertheless, it provides a useful heuristic explanation of why the steering effect occurs and
suggests a means to organize the empirical data into a coherent model of flow deflection that
dαds
~ sinα cosα ~ sin2α

ACC
EPTE
D M
ANU
SCR
IPT
ACCEPTED MANUSCRIPT
15
has four controlling variables: (1) mean incident wind speed; (2) mean angle of wind
approach; (3) dune slope; and (4) strength of flow acceleration up the stoss slope of the dune.
Moreover, a numerical integration of (10), which can be done in a simple spreadsheet, gives
reasonable wind trajectories (s) based on measured V, dV/dz as long as the topography
does not depart significantly from a two-dimensional form.
COMPARISON OF FIELD AND MODELLED CFD DATASETS
Fig. 4 illustrates the CFD and field data for the scarped profile during an incident wind angle
of 68° measured above the beach at 4 m above the surface. The presence of the scarp
exacerbates the incident flow at the toe, and tends to steer the incident flow along-scarp to
some degree as observed in other studies (Svasek and Terwindt, 1974; Arens, 1995;
Mikkelsen, 1989; Hesp et al., 2013). Above the scarp, the streamlines converge and the flow
is accelerated (cf. Bowen and Lindley, 1977) so the velocity is greater there than farther up
the stoss slope. Flow accelerates towards the crest on the upper stoss slope. At 0.66 m above
the ground, the degree of flow deflection from dune toe to crest is 33°, while at 1.66 m above
the ground it is 13°.
The greatest difference between the CFD results and the field data is at the dune scarp. This is
to be expected as this is a highly turbulent region, the scarp tends to deflect the flow
alongshore (corkscrew vortices are commonly observed here), and often turbulent jets are
formed across the scarp crest (e.g. Bowen and Lindley, 1977; Hesp et al., 2009, 2013).
Nevertheless, the flow deflection direction error (see Equation 3) between modelled and field
data is less than 1% for five of the seven locations indicating a remarkably good agreement
between the modelled and field results.

ACC
EPTE
D M
ANU
SCR
IPT
ACCEPTED MANUSCRIPT
16
The CFD modelling also shows that there is a constant difference between the flow deflection
at 0.66 m compared to 1.66 m. The near-surface wind is consistently more deflected than the
upper wind, and this is also observed in the field data (cf., Walker et al., 2009).
Figure 4. Comparison of field measured (in dark grey wind speed and direction and
modelled (in grey) CFD results. Direction represents that recorded at each UVW
anemometer. 0° is onshore perpendicular to the crest of the dune and 90° is alongshore, and
180° onshore. Note that the upper anemometer at the foredune toe is at a height of 2.05 m,
while the other two are at 1.66 m height. „CFD error‟ in the diagram relates to wind direction
only.
ACC
EPTE
D M
ANU
SCR
IPT
ACCEPTED MANUSCRIPT
17
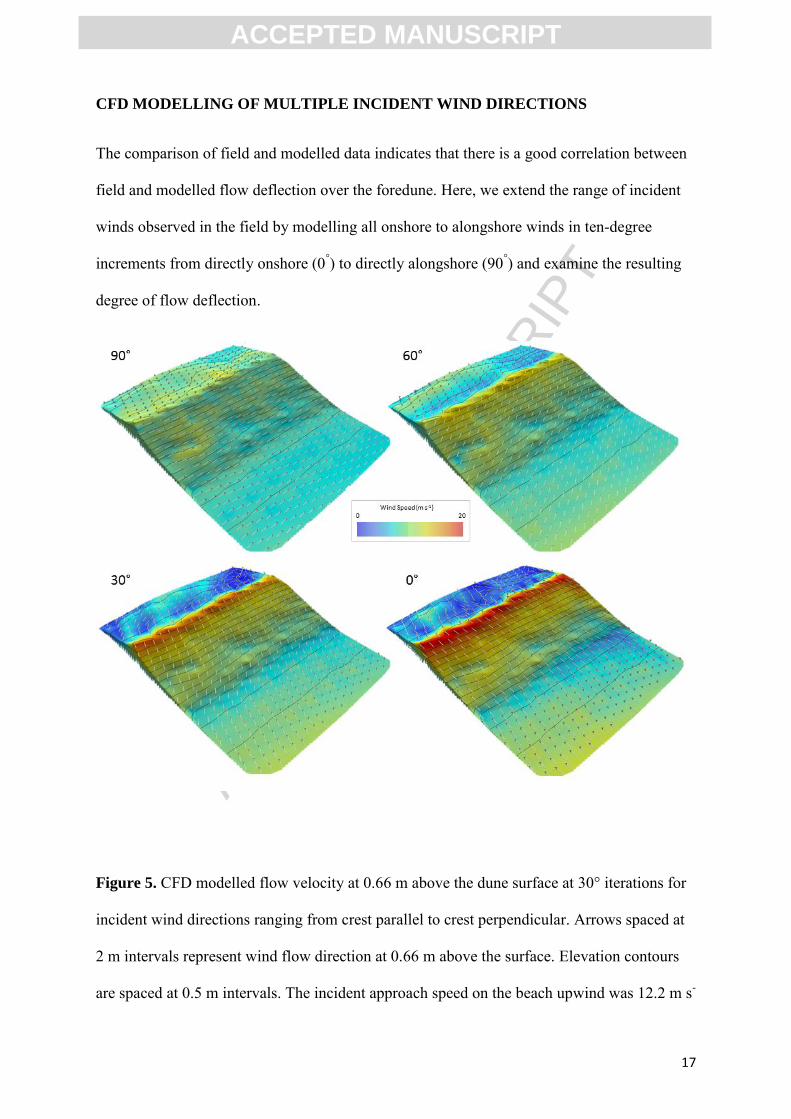
CFD MODELLING OF MULTIPLE INCIDENT WIND DIRECTIONS
The comparison of field and modelled data indicates that there is a good correlation between
field and modelled flow deflection over the foredune. Here, we extend the range of incident
winds observed in the field by modelling all onshore to alongshore winds in ten-degree
increments from directly onshore (0°) to directly alongshore (90°) and examine the resulting
degree of flow deflection.
Figure 5. CFD modelled flow velocity at 0.66 m above the dune surface at 30° iterations for
incident wind directions ranging from crest parallel to crest perpendicular. Arrows spaced at
2 m intervals represent wind flow direction at 0.66 m above the surface. Elevation contours
are spaced at 0.5 m intervals. The incident approach speed on the beach upwind was 12.2 m s-

ACC
EPTE
D M
ANU
SCR
IPT
ACCEPTED MANUSCRIPT
18
1 at 4 m above the beach surface in all cases. The greatest topographically-forced flow
acceleration and least flow deflection occurs for directly onshore winds.
Fig. 5 illustrates the 3-D flow fields produced by the CFD model for four incident wind
directions at a consistent incident speed of 12.2 ms-1 at 4 m above the beach surface. The
greatest topographically-forced flow acceleration and least flow deflection occurs for directly
onshore winds. The greatest velocities occur near the foredune crest (red colours on Fig. 5).
The greatest flow deflection across the dune occurs for winds in the 30° to 60° range, and the
rate of deflection increases towards the dune crest (see 60° incident wind in Fig. 5).
Interestingly, over this relatively uniform dune terrain, there is less lateral uniformity in the
wind field when the incident wind approaches from >60° because even slight topographic
variations are experienced more so by the more oblique to alongdune oriented winds.
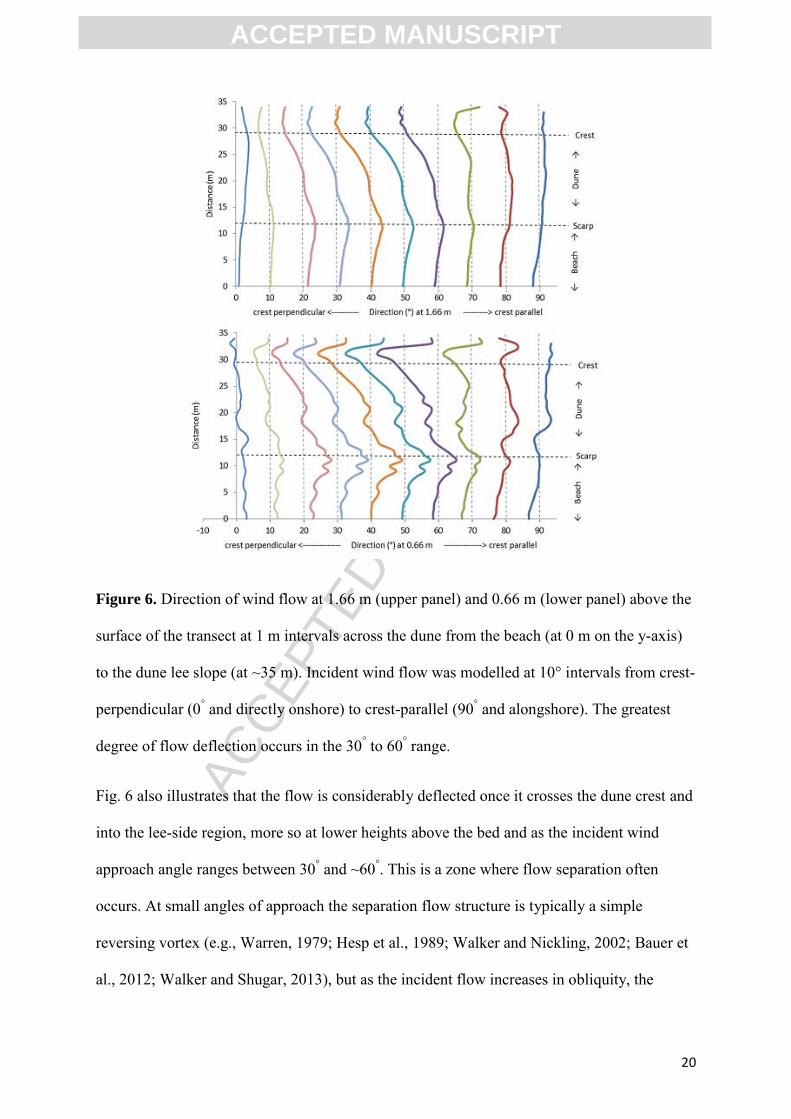
Fig. 6 illustrates a range of incident flows at 10° increments, and shows the degree of flow
deflection in 1 m increments across the foredune. When the flow is perpendicular (i.e. the
zero degree lines on Fig. 6), there is minor flow deflection at both heights above the surface
in the upper stoss slope region. This small degree of deflection probably results from
alongshore variations in dune morphology. As the incident wind becomes more oblique, the
degree of flow deflection increases to a maximum for incident winds arriving from 40° to 50°,
as expected following Equation 13 and as observed by Svasek and Terwindt (1974) and
Arens et al. (1995). Under those conditions, the flow is steered or deflected 20° more crest-
perpendicular from the dune toe and scarp to the crest. For example, at 0.66 m above the
surface and at an incident flow of 50°, the incident direction 10 m seawards of the dune scarp
is approaching at ~49°. This is deflected more crest parallel to ~57° at the dune scarp, and
then deflected back to ~33° and more perpendicular at the dune crest. There is consistently
less flow deflection at higher elevations above the dune compared to flow nearer to the bed
(Fig. 6; Table 1).

ACC
EPTE
D M
ANU
SCR
IPT
ACCEPTED MANUSCRIPT
19
At the dune toe, the flow steers along the beach due to the presence of the scarp, and the
modelling indicates significant variations in flow directions or deflections over a short
distance, even for incident wind approach angle as small as 10°. This process, whereby the
diverging wind flow at the dune toe which directs flow along the beach or up the stoss slope
of the dune, may result in the decoupling of the dune and beach sand transport systems
(Bauer et al., 2012). Note that there is often flow separation, topographic steering of flow
alongshore and the common presence of corkscrew vortices in front of scarps. In addition,
flow acceleration and the formation of a jet over the scarp crest commonly occurs (Bowen
and Lindley, 1977; Tsoar, 1983; Hesp et al., 2009). Above and downwind of the scarp, the
flow expands and becomes more crest-perpendicular as the flow crosses the stoss slope.
Where the incident flow becomes more crest-parallel, there is naturally a greater tendency for
the flow to steer along the scarp and the dune-parallel to the contours. Thus, there is
progressively less deflection as the incident flow becomes more crest-parallel, and this is true
for both anemometer heights examined.
ACC
EPTE
D M
ANU
SCR
IPT
ACCEPTED MANUSCRIPT
20
Figure 6. Direction of wind flow at 1.66 m (upper panel) and 0.66 m (lower panel) above the
surface of the transect at 1 m intervals across the dune from the beach (at 0 m on the y-axis)
to the dune lee slope (at ~35 m). Incident wind flow was modelled at 10° intervals from crest-
perpendicular (0° and directly onshore) to crest-parallel (90° and alongshore). The greatest
degree of flow deflection occurs in the 30° to 60° range.
Fig. 6 also illustrates that the flow is considerably deflected once it crosses the dune crest and
into the lee-side region, more so at lower heights above the bed and as the incident wind
approach angle ranges between 30° and ~60°. This is a zone where flow separation often
occurs. At small angles of approach the separation flow structure is typically a simple
reversing vortex (e.g., Warren, 1979; Hesp et al., 1989; Walker and Nickling, 2002; Bauer et
al., 2012; Walker and Shugar, 2013), but as the incident flow increases in obliquity, the

ACC
EPTE
D M
ANU
SCR
IPT
ACCEPTED MANUSCRIPT
21
separation zone is characterized by corkscrew vortices trending downwind (cf. Walker and
Nickling 2002; Walker and Shugar, 2013). As the incident flow approaches 90° to directly
along the dune crest axis, there is minimal to no flow separation and, therefore, minimal flow
deflection. Again, the impact of the scarp is greater nearer to the bed compared to higher
above the dune for along-dune low.
Incident wind direction
(degrees)
Degree difference scarp & crest
0.66 m 1.66 m
90 4 0
80 1 2
70 5 5
60 16 11
50 19 12
40 19 12
30 17 11
20 14 8
10 7 4
0 2 0
Table 1. Wind direction difference (in degrees) between CFD modelled flow at the scarp
base at 0.6 m high and the crest (at 1.66 m high) for the full range of incident winds (0-90°)
across the western foredune transect. At 90°, for example, there is only a 4° diffference
beween wind direction at the scarp and at the crest, and zero difference at 1.66 m high
between the two, while at 50° incident wind there is a significant difference in flow direction
between the two heights (19° versus 12°)
As noted in several studies, as wind becomes more crest-parallel, the degree of flow speed-up
tends to decrease (e.g. Arens et al., 1995; Hesp, 2002; Walker et al., 2006, 2009; Bauer et al.,

ACC
EPTE
D M
ANU
SCR
IPT
ACCEPTED MANUSCRIPT
22
2012; Hesp et al., 2013). Fig. 7 illustrates wind speeds at 1 m horizontal intervals across the
dune transect for five incident wind directions. As with the previous simulations, the incident
wind speed on the beach was 12.20 m s-1 at 4 m height. The CFD modelling shows that there
is considerable directional unsteadiness and variability in the wind speed across the
backshore upwind of the dune especially nearer the surface due to the positive pressure
gradient induced by the dune on the flow field. It is well known that the dune toe region is an
area of considerable deceleration or speed-down (cf. Bowen and Lindley, 1977) and flow
unsteadiness as turbulent flow structures are conveyed toward the bed in an area of rapid
slope change (e.g., Wiggs et al., 1996, Walker and Nickling 2002, Walker et al., 2006,
Chapman et al., 2012), and this is also more pronounced at or near the lower stoss slope.
From the mid-stoss slope to the crest, the greatest flow acceleration occurs for perpendicular
to low obliquity winds (10-30°) and uniformly decreases as the incident wind direction
swings to 50°, at both heights (0.66 and 1.66 m) above the surface.
There is flow separation at, and beyond, the foredune crest as visualized by multiple videos
taken in the field of smoke bomb flow patterns (e.g. Walker, 2005; Fig. 6) for perpendicular
and low to moderate obliquity winds. The flow structure is typically a simple reversing roller
vortex in this region (Bauer et al., 2012) and this flow separation zone drives significant
deceleration in wind speeds leeward of the dune crest as in Fig. 7. As the flow trends towards
more crest parallel (from 50° towards 70°), the degree of flow deceleration declines leeward
of the crest at 0.66 m above the bed and this pattern holds for winds higher above the surface
(1.66 m). In effect, the dune profile or topography that the 70° incident wind encounters is
still relatively steep and asymmetric. Once the incident wind approaches from 90° to crest
parallel, there is typically significantly less to no flow separation across the dune crest and
extending on the lee slope, so the isovel distribution is quite different compared to other
incident flows. Overall, the CFD modelling demonstrates that the degree of topographically

ACC
EPTE
D M
ANU
SCR
IPT
ACCEPTED MANUSCRIPT
23
accelerated flow decreases as the incident wind becomes increasingly more oblique to the
foredune. At 0.66 m above the bed, for example, the wind speed at the foredune crest for an
incident wind direction of 50° and 80° is on average 25% lower than for winds in the 0 to 30°
incident range. As found in a much simpler CFD simulation by Parsons et al. (2004),
however, dune height is perhaps more important than aspect ratio (h/L) in controlling near-
surface flow response over dunes, particularly at the crest. This is because total vertical
displacement of flow streamlines and resulting flow acceleration responses are fundamentally
greater over taller dunes. Although the flow responses observed here are a function of the
observed dune geometry (i.e., a 10 m tall foredune), this study provides a more
comprehensive picture of flow deflection and acceleration behaviour over foredunes in
response to the full range of onshore incident flow angles.
Figure 7. (a) Wind speed at 1.66 m above the dune at 1 m intervals for five incident wind
directions. (b) Wind speed at 0.66 m above the dune at 1 m intervals. The greatest speed-up

ACC
EPTE
D M
ANU
SCR
IPT
ACCEPTED MANUSCRIPT
24
occurs for winds that are most perpendicular and, therefore, where the topography is steepest
and then decreases as the incident wind becomes increasingly oblique up to ~70°.
Fig. 8 summarises the general flow conditions and degree of deflection that occurs in the 0 to
3 m boundary layer above the beach and foredune. It illustrates three examples of incident
flow approaching the dune from 20°, 40° and 80°. At 20° there is slight decoupling and
deflection to the right near the scarp and then deflection towards more crest-normal on the
mid to upper stoss slope. At 40°, the extent of deflection is considerable and there is greater
deflection of the lowermost streamlines compared to the upper ones. In both the 20° and 40°
examples, the velocity is greatest near the crest (indicated by the red colours). At 80° there is
significantly less overall deflection of the streamlines compared to that at 20° and 40°, but
some still occurs. Speed-up is considerably less than in the 20° and 40° cases, and local
velocity variations are primarily due to changes in surface morphology.

ACC
EPTE
D M
ANU
SCR
IPT
ACCEPTED MANUSCRIPT
25
Figure 8: Examples of lower boundary layer flow (0.66 to 2 m range) and degree of
streamline deflection for three incident wind approach directions, 20° (uppermost), 40°
(middle) and 80° (lowermost). The lowest streamlines show the strongest response to
variations in surface morphological changes and display the greatest degree of deflection.
CONCLUSIONS
A comparison of field data collected during oblique winds and CFD modelling demonstrates
that the CFD simulations are able to provide good agreement with field data. This allows for
simulation of a complete range of incident flows from onshore to alongshore (0-90°) and
interpretation of near-surface flow deflection and acceleration patterns. This study provides

ACC
EPTE
D M
ANU
SCR
IPT
ACCEPTED MANUSCRIPT
26
the first examination of such flow dynamics over a foredune ridge and provides several new
insights. Key findings, include:
(i) deflection of the incident wind flow is minimal at 0° although minor deflection occurs
because the foredune is never perfectly smooth and „prismatic‟;
(ii) deflection gradually increases as the incident wind turns towards 30° to the dune;
(iii) the greatest degree of flow deflection occurs in the 30° to 70° range, and is maximum
at ~45° as it is proportional to sin2α;
(iv) there is a consistent difference in the degree of flow deflection with height above the
dune, with the greatest steering occurring closest to the surface confirming
observations in previous field studies;
(v) the degree of deflection increases towards the dune crest;
(vi) speed-up or topographically-forced flow acceleration up the foredune is strongly
affected by the incident wind flow approach direction, such that speed-up is greatest
for perpendicular to 30° oblique incident winds and declines significantly for winds
>30° as the speed-up is proportional to cosα
(vii) there is less lateral uniformity in the wind field when the incident wind approaches
from >60° because the greater along-dune (compared to across-dune) topographic
variations are “seen” more by the higher angle oblique to along-dune winds;
(viii) in the lee zone, large variations in flow deflection occur because of potential flow
separation at the crest. Differences in the degree of deflection at ~70° incident wind
flow may be due to the onset of corkscrew vortex generation compared to relatively
stationary roller vortices at perpendicular to <50° incident winds.
Deflection of oblique incident winds across a foredune has important implications for
foredune evolution, sedimentation, stratification and palaeoenvironmental interpretations.

ACC
EPTE
D M
ANU
SCR
IPT
ACCEPTED MANUSCRIPT
27
For coastal environments where the winds are predominantly oblique to the coastline, across-
dune sand transport pathways will be more shore-transverse than predicted from regional
wind analyses, sedimentation patterns will mimic that trend, and the subsequent stratification
patterns, stratal dips and cross-bed azimuths will be more variable across the dune from toe
to crest than anticipated or modelled.
ACKNOWLEDGEMENTS
Patrick Hesp acknowledges the support of grants from LSU and NSF (grant no 1024125), and
funding and support from Flinders University and the School of the Environment. Thomas
Smyth thanks Flinders University SotE for provision of a post-doctoral fellowship and
research funding, and access to the Flinders supercomputer. Peter Nielsen, Bernard Bauer and
Robin Davidson-Arnott thank their respective universities for support. Ian Walker
acknowledges support from an NSERC Discovery Grant for fieldwork support at Prince
Edward Island National Park and the Canada Foundation for Innovation for research
infrastructure support. Thanks to the staff at Prince Edward Island National Park and Parks
Canada for support and research permissions, and to Jeff Ollerhead for provision of the
foredune DEM and field support. Thanks also to two anonymous referees and Andrew Plater
for their assistance in improving the manuscript.

ACC
EPTE
D M
ANU
SCR
IPT
ACCEPTED MANUSCRIPT
28
References
Arens, S.M., 1996. Patterns of sand transport on vegetated foredunes. Geomorphology 17:
339-350.
Arens, S.M., van Kaam-Peters, H.M.E., van Boxel, J.H., 1995. Air flow over foredunes and
implications for sand transport. Earth Surface Processes and Landforms 20: 315-332.
Ayotte, K.W., Hughes, D.E., 2004. Observations of boundary-layer wind-tunnel flow over
isolated ridges of varying steepness and roughness. Boundary-Layer Meteorology 112: 525-
556.
Baddock, M. C., Livingstone, I., & Wiggs, G. F. S. (2007). The geomorphological
significance of airflow patterns in transverse dune interdunes. Geomorphology, 87(4): 322-
336. doi:10.1016/j.geomorph.2006.10.006
Bauer, B.O., Davidson-Arnott, R.G.D., Walker, I.J., Hesp, P.A., Ollerhead, J., 2012. Wind
direction and complex sediment transport response across a beach-dune system. Earth
Surface Processes and Landforms 37 (15): 1661-1677.
Bauer, B.O., Davidson-Arnott, R.G.D., Hesp, P.A., Namikas, S.L., Ollerhead, J., Walker,
I.J., 2009. Aeolian sediment transport conditions on a beach: Surface moisture and wind
fetch effects on mean transport rates. Geomorphology 105 (1-2): 106-116.
Bauer, B.O., Walker, I.J., Baas, A.C.W., Jackson, D.W.T., Mckenna Neuman, C.,
Wiggs, G.S.F., Hesp, P.A., 2013, Critical Reflections on the Coherent Flow Structures
Paradigm in Aeolian Geomorphology. In: J.G. Venditti, J.L. Best, M. Church, and
R.J. Hardy (eds.), Coherent Flow Structures at the Earth's Surface. Wiley-Blackwell:
111-134.
Belcher, S.E., Hunt, J.C.R., 1998. Turbulent flow over hills and waves.
Annual Review of Fluid Mechanics 30: 507-538.

ACC
EPTE
D M
ANU
SCR
IPT
ACCEPTED MANUSCRIPT
29
Blocken, B., Stathopoulos, T., Carmeliet, J., 2007. CFD simulation of the atmospheric
boundary layer : wall function problems, Atmospheric Environment 41: 238–252.
Bowen, A.J., Lindley, D., 1977. A wind-tunnel investigation of the wind speed and
turbulence characteristics close to the ground over various escarpment shapes. Boundary-
layer Meteorology 12: 259-271.
Bradley, E.F., 1983.the influence of thermal stability and angle of incidence on the
acceleration of wind up a slope. J. Wind Engineering and Industrial Aerodynamics 15: 231-
242.
Chapman, C.A., Walker, I.J., Hesp, P.A., Bauer, B.O., Davidson-Arnott, R.G., 2012.
Turbulent Reynolds stress and quadrant event activity in wind flow over a coastal foredune.
Geomorphology 151-152: 1-12.
Chapman, C.A., Walker, I.J., Hesp, P.A., Bauer, B.O., Davidson-Arnott, R.G., Ollerhead, J.,
2013. Reynolds stress and sand transport over a foredune. Earth Surface Processes and
Landforms 38 (14): 1735-1747.
Davidson-Arnott, R.G.D., Yanqi Yang, Ollerhead, J., Hesp, P.A., Walker, I.J., 2008. The
effects of surface moisture on aeolian sediment transport threshold and mass flux on a
beach. Earth Surface Processes and Landforms 33: 55-74.
Davidson-Arnott, R.G.D., Bauer, B.O., Walker, I.J., Hesp, P.A., Ollerhead, J., Delgado-
Fernandez, I., 2009. Instantaneous and mean aeolian sediment transport rate on beaches:
an intercomparison of measurements from two sensor types. J. Coastal Research SI 56:
297-301.

ACC
EPTE
D M
ANU
SCR
IPT
ACCEPTED MANUSCRIPT
30
Davidson-Arnott, R.G.D., Bauer, B.O., Walker, I.J., Hesp, P.A., Ollerhead, J., Chapman, C.,
2012. High-frequency sediment transport responses on a vegetated foredune. Earth Surface
Processes and Landforms 37 (11): 1227-1241, doi:10.1002/esp.3275
Delgado-Fernandez, I., Davidson-Arnott, R. G., and Ollerhead, J., 2009. Application of a
remote sensing technique to the study of coastal dunes. Journal of Coastal Research: 25 (5):
1160-1167.
Delgado-Fernandez, I., Davidson-Arnott, R.D.A., Bauer, B.O., Walker, I.J. and Ollerhead, J.,
2013. Evaluation of the optimal resolution for characterizing the effect of beach surface
moisture derived from remote sensing on Aeolian transport and deposition. In: Conley, D.C.,
Masselink, G., Russell, P.E. and O‟Hare, T.J. (eds.), Proceedings 12th International Coastal
Symposium (Plymouth, England), Journal of Coastal Research, Special Issue No. 65: 1277-
1282.
Finnigan, J.J., Raupach, M.R., Bradley, E.F., Aldis, G.K., 1990. A wind tunnel study of
turbulent flow over a two-dimensional ridge. Boundary-Layer Meteorology 50 (Issue 1-
4):277-317.
Franke, J., Hirsch, C., Jensen, A.G., Kru¨ s, H.W., Schatzmann, M., Westbury, P.S., Miles,
S.D., Wisse, J.A., Wright, N.G., 2004. Recommendations on the use of CFD in wind
engineering. In: van Beeck, J.P.A.J. (Ed.), COST Action C14, Impact of Wind and Storm on
City Life Built Environment. Proceedings of the International Conference on Urban Wind
Engineering and Building Aerodynamics, 5–7 May 2004. von Karman Institute, Sint-
Genesius-Rode, Belgium.
Hesp, P.A., 2002. Foredunes and Blowouts: initiation, geomorphology and dynamics.
Geomorphology 48: 245-268.

ACC
EPTE
D M
ANU
SCR
IPT
ACCEPTED MANUSCRIPT
31
Hesp, P.A., Illenberger, W., Rust, I., McLachlan, A., Hyde, R., 1989. Some aspects of
transgressive dunefield and transverse dune geomorphology and dynamics, south coast,
South Africa. Zeitschrift fur Geomorph. Suppl-Bd 73: 111-123.
Hesp, P.A., Walker, I.J., 2012. Three-dimensional æolian dynamics within a bowl blowout
during offshore winds: Greenwich dunes, Prince Edward Island, Canada. Aeolian Research 3:
389-399.
Hesp, P.A., Walker, I.J., Davidson-Arnott, R.G., Ollerhead, J., 2005. Flow dynamics
over a vegetated foredune at Prince Edward Island, Canada. Geomorphology 65: 71-84.
Hesp, P.A., Walker, I.J., Namikas, S.L., Davidson-Arnott, R.G., Bauer, B.O., Ollerhead,
J., 2009. Storm wind flow over a foredune, Prince Edward Island, Canada. J. Coastal
Research SI 56: 312-316.
Hesp, P.A., Walker, I.J., Chapman, C., Davidson-Arnott, R.G., and Bauer, B.O., 2013.
Æolian dynamics over a foredune, Prince Edward Island, Canada. Earth Surface
Processes and Landforms 38 (1): 1566-1575.
Jackson, D.W. T., Beyers, J.H.M., Lynch, K., Cooper, J.A.G., Baas, A.C.W., Delgado-
Fernandez, I, 2011. Investigation of three-dimensional wind flow behaviour over coastal
dune morphology under offshore winds using computational fluid dynamics (CFD) and
ultrasonic anemometry Earth Surface Processes and landforms 36 (8): 1113-1124.
Jackson, P.S., 1977. Aspects of surface wind behaviour. Wind Engineering 1: 1-14.
Jackson, P.S., 1979. The influence of local terrane features on the site selection for wind
energy generating systems. Report BLWT-1-1979, Faculty of Engineering Science, The
University of Western Ontario, London, Ontario, Canada.

ACC
EPTE
D M
ANU
SCR
IPT
ACCEPTED MANUSCRIPT
32
Lynch, K., Jackson, D.W.T., Cooper, J.A.G., 2008. Aeolian fetch distance and secondary
airflow effects: the influence of micro-scale variables on meso-scale foredune development.
ESPL 33: 991-1005.
Lynch, K., Jackson, D.W.T., Cooper, J.A.G., 2009. Foredune accretion during offshore
winds. Geomorphology 105:139-146.
Lynch, K., Delgado-Fernandez, I., Jackson, D.W.T., Cooper, J.A.G., Baas, A.C.W., Beyers,
J.H.M., 2013. Alongshore variation of aeolian sediment transport on a beach, under offshore
winds. Aeolian Research 8: 11-18.
Mikklesen, H.E., 1987. Wind flow and sediment transport over a low coastal dune.
Geoskrifter nr. 32. Institute of Geology, University of Aarhus, Denmark. 60pp.
Ollerhead,J., Davidson-Arnott, R., Walker, I.J., Mathew, S., 2013. Annual to decadal
morphodynamics of the foredune system at Greenwich Dunes, Prince Edward Island, Canada.
Earth Surface Processes and Landforms 38 (3): 284–298.
Parsons, D.R., Walker, I.J., Wiggs, G.F.S., 2004. Numerical modelling of flow structures
over idealized transverse aeolian dunes of varying geometry. Geomorphology 59: 149–164.
Pattanapol, W., Wakes, S.J., Hilton, M.J., Dickinson, K.J.M., 2007. Modeling of Surface
Roughness for Flow Over a Complex Vegetated Surface. Engineering and Technology 26:
271-281.
Rasmussen, K.R., 1989. Some aspects of flow over coastal dunes. Proc Royal Soc. Edinburgh
96B: 129-147.
Rubin, D.M., Rubin, A.M., 2013. Origin and lateral migration of linear dunes in the Qaidam
Basin of NW China revealed by dune sediments, internal structures, and optically stilulated
ACC
EPTE
D M
ANU
SCR
IPT
ACCEPTED MANUSCRIPT
33
luminescence ages, with implications for linear dunes on Titan: discussion. GSA Bulletin
125: 1943-1946.
Smyth, T.A.G., Jackson, D.W.T., Cooper, J.A.G., 2011. Computational fluid dynamic
modelling of three-dimensional airflow over dune blowouts. Journal of Coastal Research, 64:
314-318 .
Smyth, T.A.G., Jackson, D.W.T., Cooper, J.A.G., 2012. High resolution measured and
modelled three-dimensional airflow over a coastal bowl blowout. Geomorphology 177-178:
62-73.
Smyth, T.A.G., Jackson, D.W.T., Cooper, J.A.G., 2013. Three dimensional airflow patterns
within a coastal blowout during fresh breeze to hurricane force winds. Aeolian Research,
9: 111-123.
Smyth, T.A.G., Jackson, D.W.T., Cooper, J.A.G., 2014. Airflow and aeolian sediment
transport patterns within a coastal trough blowout during lateral wind conditions, Earth
Surface Processes and Landforms 39 (14): 1847-1854.
Svasek, J.N., Terwindt, J.H.T., 1974. Measurements of sand transport by wind on a natural
beach. Sedimentology 21: 311-322.
Tsoar, H., 1983a. Dynamic processes acting on a longitudinal (seif) sand dune.
Sedimentology 30: 567-578.
Tsoar, H., 1983b. Deflection of sand movement on a sinuous longitudinal (seif) dune.
Sedimentary Geology 36: 25-39.
Wakes, S.J., Maegli, T., Dickinson, K.J., Hilton, M.J., 2010. Numerical modelling of wind
flow over a complex topography. Environmental Modelling & Software 25, 237-247.

ACC
EPTE
D M
ANU
SCR
IPT
ACCEPTED MANUSCRIPT
34
Wakes, S., 2013. Three-dimensional Computational Fluid Dynamic experiments over a
complex dune topography 1337-1342.
Walker, I.J., 1999. Secondary airflow and sediment transport in the lee of a reversing dune.
Earth Surface Processes and Landforms 24 (5): 437-448.
Walker, I.J., 2005. Physical and logistical considerations of using ultrasonic anemometers in
aeolian sediment transport research. Geomorphology 68: 57-76.
Walker, I.J., Hesp, P.A., R. Davidson-Arnott, R.G., Ollerhead, J., 2006. Topographic
steering of alongshore flow over a vegetated foredune: Greenwich dunes, Prince Edward
Island, Canada. J. Coastal Research 22 (5): 1278-1291.
Walker, I.J., Davidson-Arnott, R.G.D., Hesp, P.A., Bauer, B.O., Ollerhead, J., 2009.
Mean flow and turbulence responses in airflow over foredunes: new insights from recent
research. J. Coastal Research SI 56: 366-370.
Walker, I.J., Hesp, P.A., Davidson-Arnott, R.G.D., Bauer, B.O.,Namikas, S.L., Ollerhead,
J., 2009. Responses of 3-D flow to variations in the angle of incident wind and profile
form of dunes: Greenwich Dunes, Prince Edward Island, Canada. Geomorphology 105
(1-2): 127-138.
Walker I.J., Nickling, W.G. 2002. Dynamics of secondary airflow and sediment transport
over and in the lee of transverse dunes. Progress in Physical Geography 26: 47-75.
Walker, I. J., & Shugar, D. H. (2013). Secondary flow deflection in the lee of transverse
dunes with implications for dune morphodynamics and migration. Earth Surface
Processes and Landforms, 38(14): 1642-1654. doi:10.1002/esp.3398
Warren, A., 1979. Aeolian processes. In: Embleton, C., Thornes, J. (Eds.), Process in
Geomorphology. Edward Arnold: 325-351

ACC
EPTE
D M
ANU
SCR
IPT
ACCEPTED MANUSCRIPT
35
Weng, W.S., Hunt, J.C.R., Carruthers, D.J., Warren, A., Wiggs, G.F.S., 1991. Air flow
and sand transport over sand dunes. Acta Mechanica [Suppl] 2: 1-22
Wiggs, G. F., Livingstone, I., Warren, A., 1996. The role of streamline curvature in sand
dune dynamics: evidence from field and wind tunnel
measurements. Geomorphology, 17(1): 29-46.
Wood, N., 2000. Wind flow over complex terrain: a historical perspective and the
prospect for large-eddy modelling. Boundary-layer Meteorology 96: 11-32.

ACC
EPTE
D M
ANU
SCR
IPT
ACCEPTED MANUSCRIPT
36
Graphical abstract

ACC
EPTE
D M
ANU
SCR
IPT
ACCEPTED MANUSCRIPT
37
HIGHLIGHTS
Field measurements for oblique winds over a foredune are compared to CFD modelling of flow deflection.
The mechanics of flow deflection are outlined. Deflection of the incident wind flow is minimal at 0° and greatest at ~45°. Deflection decreases with height above the surface. Topographically-forced flow acceleration across the stoss slope is greatest for winds
less than 30°.