flow properties of filled materials and standards...
TRANSCRIPT
Flow Properties of Filled Materials and Standards Update
Martin Rides 25 October 2006
H4 - Flow properties of filled materials (2005-08)U4: Dynamic properties of solid/liquid materials systems at the nano
and micro-scale (2005-08)

2
Outline
• Introduction• Update on intercomparison on slip flow
measurements – final results• Characterisation of filled materials• Piezoelectric devices for rheological
measurements• Rheological standards in ISO• Summary / future work

3
Background
The flow behaviour of multi-phase/highly filled materials can be complex
Multi-phase materials exhibit flow behaviours that are difficult to characterise, but are often essential to their processability, e.g.:– extreme shear thinning (e.g. thixo-casting)– slip (e.g. plastics extrusion)
The reliable measurement of the flow behaviour of multi-phase is relevant to many industrial sectors and is important to, for example: – materials design, selection, quality control (mix quality)– process modelling (design, optimisation)– reducing scrap rates and time to market

4
H4: Flow properties of filled materials
Project objectives:• development of new/improved measurement methods/procedures for monitoring flow properties of filled materials, with particular emphasis on mixing/compounding processes (mix quality)
RAPRA – supply of nano-composite samples / mix quality
• evaluation of the use and capability of innovative piezoelectric devices, to facilitate rheological measurement and improved process monitoring
• development of the Melt Flow Rate method for moisture sensitive materials (e.g. PET, PBT, nylon) to avoid the need for solvent-based testing
• development of Melt Flow Rate precision and uncertainty statementsin support of ISO standardisation activities, through intercomparison
5
0
10
20
30
40
50
60
0 50 100 150 200 250Time
Ext
rusi
on p
ress
ure,
MP
a
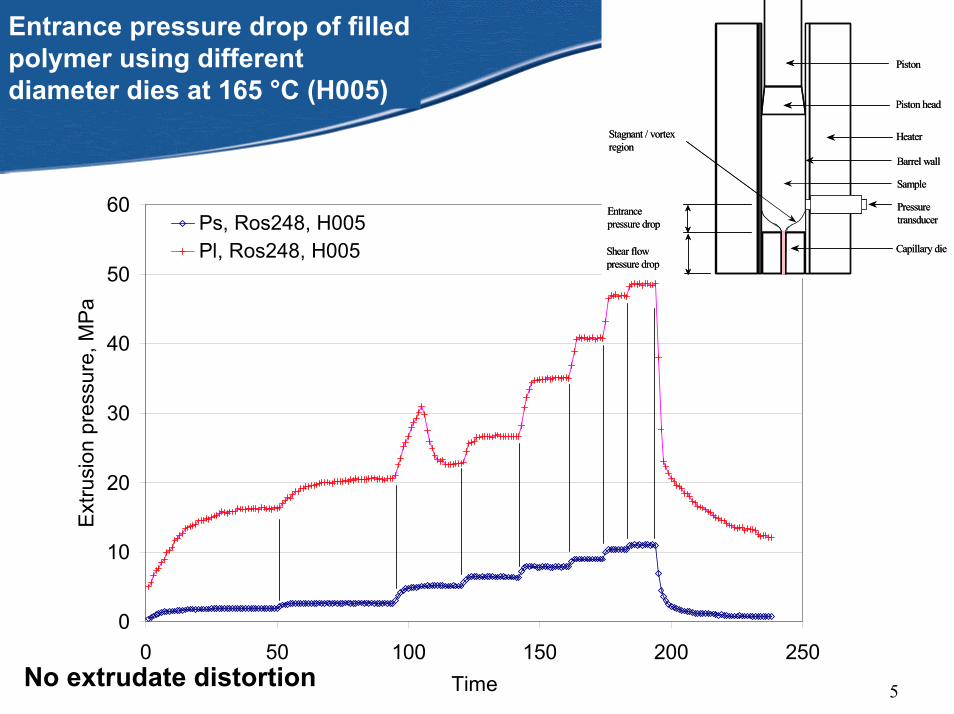
Ps, Ros248, H005Pl, Ros248, H005
No extrudate distortion
Piston head
Piston
Pressuretransducer
Capillary die
Heater
Barrel wall
Sample
Entrance pressure drop
Shear flow pressure drop
Stagnant / vortexregion
Piston head
Piston
Pressuretransducer
Capillary die
Heater
Barrel wall
Sample
Entrance pressure drop
Shear flow pressure drop
Stagnant / vortexregion
Entrance pressure drop of filled polymer using different diameter dies at 165 °C (H005)
6
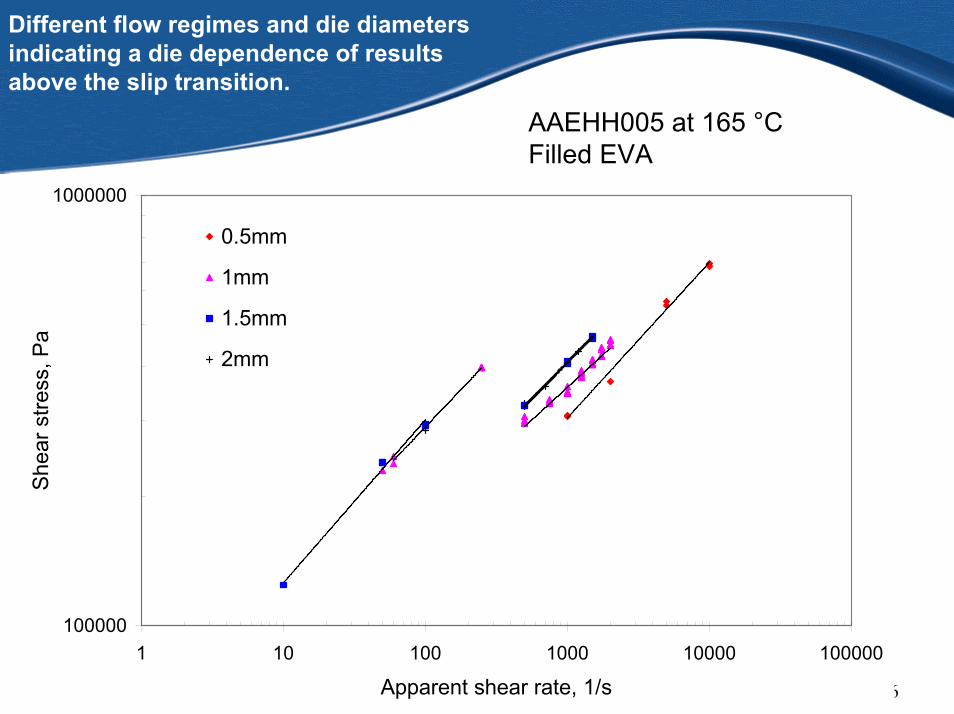
Different flow regimes and die diameters indicating a die dependence of results above the slip transition.
AAEHH005 at 165 °CFilled EVA
100000
1000000
1 10 100 1000 10000 100000
Apparent shear rate, 1/s
She
ar s
tress
, Pa
0.5mm
1mm
1.5mm
2mm

7
Constant shear stress data to determine slip velocity
AAEHH005 at 165 °CFilled EVA
y = 500x + 2000
y = 693.46x + 501.54
y = 532.04x + 375.96
y = 366.37x + 263.23
y = 278.36x + 196.75
0
500
1000
1500
2000
2500
3000
3500
4000
4500
0 1 2 3 4 51/(die radius, mm)
App
aren
t she
ar ra
te, 1
/s
325 kPa350 kPa400 kPa450 kPa500 kPaLinear (500 kPa)Linear (450 kPa)Linear (400 kPa)Linear (350 kPa)Linear (325 kPa)
Shear stress

8
Intercomparison results for wall slip velocity
AAEHH005 at 165 °CFilled EVA
10
100
1000
100 1000Shear stress, kPa
Wal
l slip
vel
ocity
, mm
/s
.
Lab ALab BLab CLab D

9
Intercomparison results for wall slip velocity
AAEHH002 at 220 °Ccarbon black filled HDPE
1
10
100
1000
100 1000Shear stress, kPa
Slip
vel
ocity
, mm
/s
Lab Alab BLab CLab D
+/- 40%

10
Uncertainties in slip velocityMeasurement Good Practice Guide No. 90 Using at least three dies
EVA AAEHH005 at 165 °C.
Shear stress, kPa 1/R 325 400 450 325 400
1 500 940 - 500 940
1.333333 500 950 1350 500 -
2 806 1572 1990 806 1572
4 1300 2475 3250 - 2475
Maximum radius ratio 4 4 3 2 4
95% confidence range on gradient value 118 254 838 1443 657
Relative expanded uncertainty of slip velocity (95% conf. level), % 42% 48% 121% 440% 131%
2
22
2
11
2
22
2
11
)(.)(.)(.)(. )(
∂∂
+
∂∂
+
∂∂
+
∂∂
= RuRV
RuRV
QuQV
QuQV
Vu ssT
T
sT
T
ssc

11
Intercomparison results for wall slip velocity
10
100
1000
100 1000Shear stress, kPa
Wal
l slip
vel
ocity
, mm
/s
.
Lab ALab BLab CLab D
AAEHH005 at 165 °CFilled EVA
+/- 40% tolerance bars
12
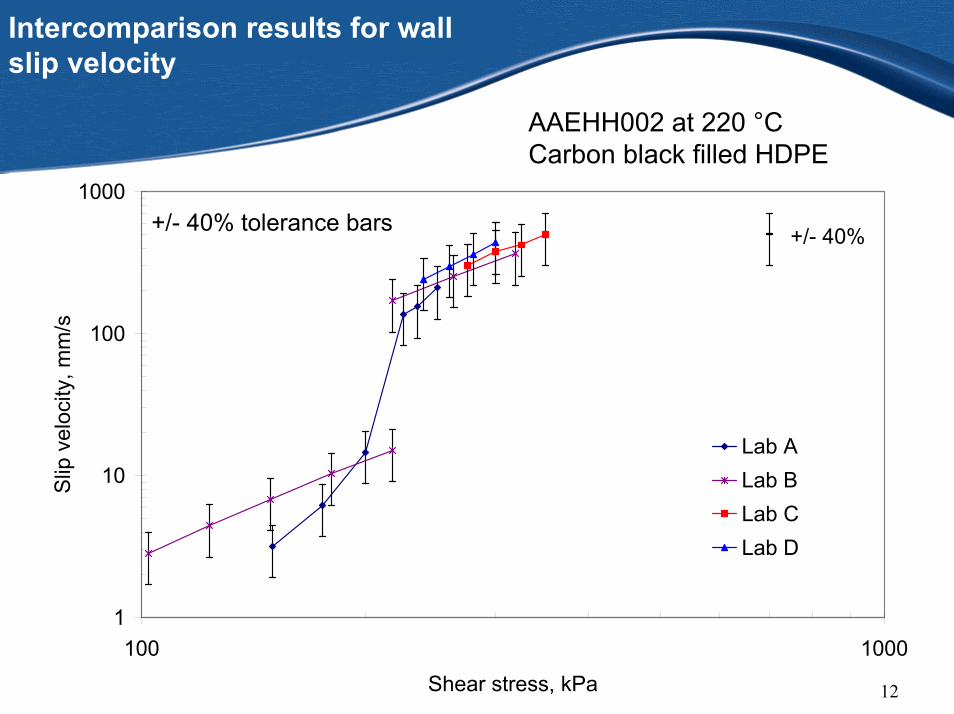
Intercomparison results for wall slip velocity
AAEHH002 at 220 °CCarbon black filled HDPE
+/- 40% tolerance bars
1
10
100
1000
100 1000Shear stress, kPa
Slip
vel
ocity
, mm
/s
Lab ALab BLab CLab D
+/- 40%

13
Intercomparison –paper in preparation
Results of an intercomparison of slip flow velocity measurements of filled polymers by capillary extrusion rheometry
by
M Rides*&, C Allen*, D Fleming+, B Haworth$, A Kelly#
*National Physical Laboratory+ Fleming Polymer Testing & Consultancy
$ IPTME, Loughborough University# IRC in Polymer Science and Technology, University of Bradford
14
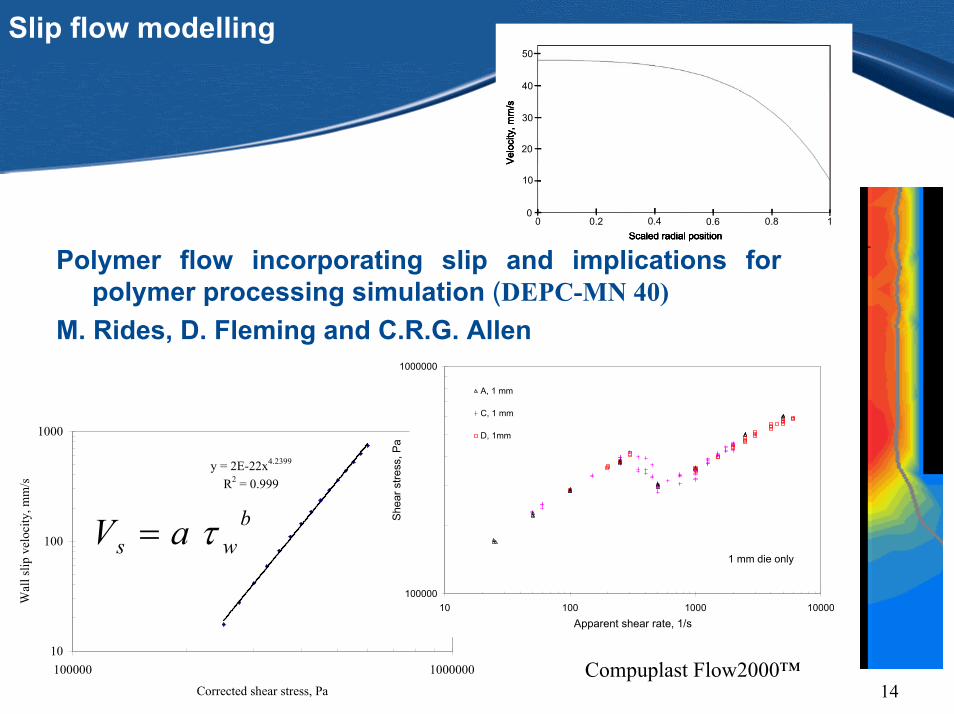
Polymer flow incorporating slip and implications for polymer processing simulation (DEPC-MN 40)
M. Rides, D. Fleming and C.R.G. Allen
y = 2E-22x4.2399
R2 = 0.999
10
100
1000
100000 1000000
Corrected shear stress, Pa
Wal
l slip
vel
ocity
, mm
/s
Scaled radial position
Vel
ocity
, mm
/s
0 10.2 0.4 0.6 0.80
10
20
30
40
50
Scaled radial position
Vel
ocity
, mm
/s
0 10.2 0.4 0.6 0.80
10
20
30
40
50
Scaled radial position
Vel
ocity
, mm
/s
0 10.2 0.4 0.6 0.80
10
20
30
40
50
Scaled radial position
Vel
ocity
, mm
/s
0 10.2 0.4 0.6 0.80
10
20
30
40
50
100000
1000000
10 100 1000 10000Apparent shear rate, 1/s
She
ar s
tress
, Pa
A, 1 mm
C, 1 mm
D, 1mm
1 mm die only
bws aV τ=
Slip flow modelling
Compuplast Flow2000™
15
Slip flow characterisation
• Intercomparison of determination of slip velocity measurement
• Assessment of uncertainties in slip velocity determination
• Good Practice Guide• Input to development of ISO 11443 on capillary
and slit die extrusion rheometry• Input to flow simulation software development

16
Slip flow measurements by capillary extrusion rheometry (NPL GPG90)
http://www.npl.co.uk/materials/polyproc/research_projects/mpp74_overview.html
17
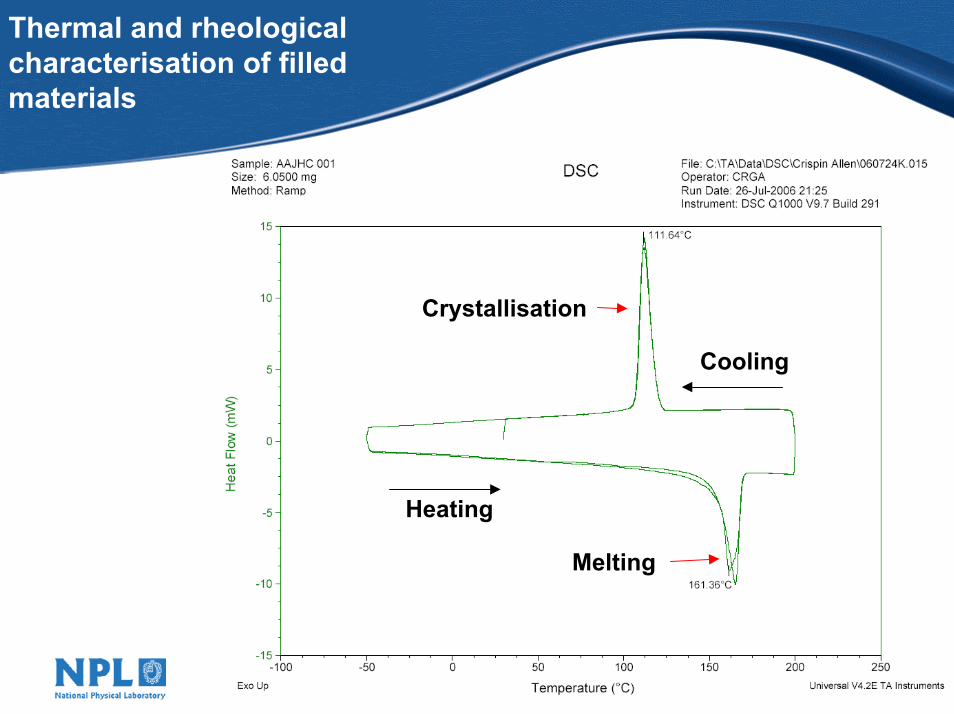
Thermal and rheological characterisation of filled materials
Investigation of thermal and rheological techniques for assessing mix quality
Thermal Differential Scanning Calorimetry (DSC) measurement of crystallisation behaviour and Tg
RheologicalDynamic rheological measurements
Case studies

18
Thermal and rheological characterisation of filled materials
DSC good repeatability/good
reproducibility
DMA good repeatability/poor
reproducibility
NPL Good Practice Guide 62
DSC temperature calibration (melting point of indium, 95% confidence) +/- 0.25 °C
Tg by DSC Repeatability
(95% confidence)
Reproducibility (95%
confidence) Unreinforced
polyester 3.9 °C 6.1 °C
Epoxy adhesive 2.9 °C 12.9 °C

19
Thermal and rheological characterisation of filled materials
Tg
20
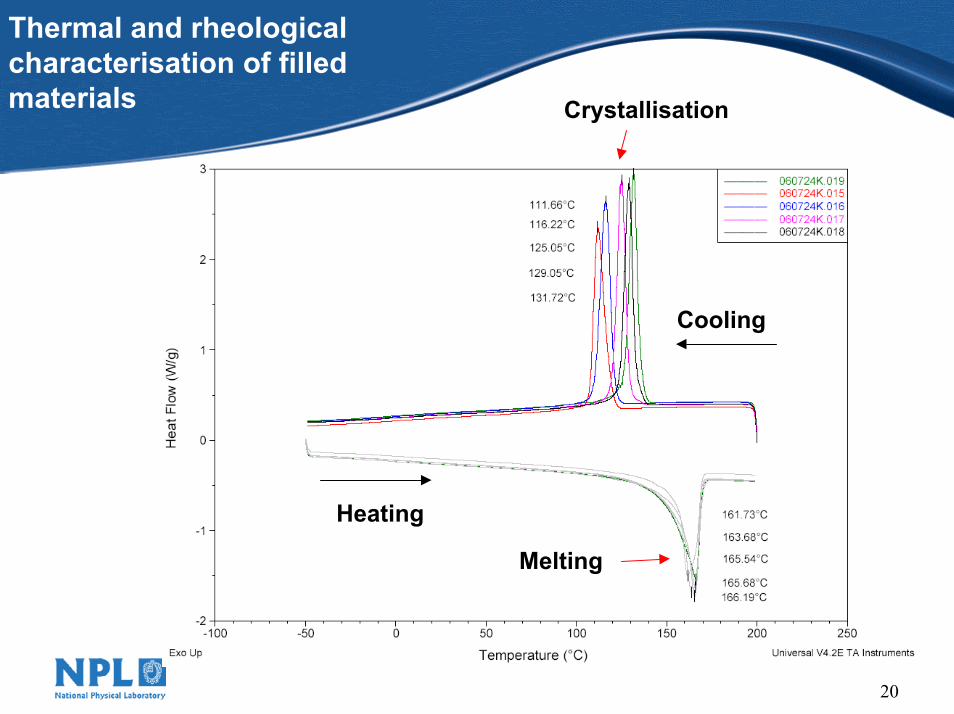
Thermal and rheological characterisation of filled materials Crystallisation
Melting
Cooling
Heating
21
Thermal and rheological characterisation of filled materials
Crystallisation
Melting
Cooling
Heating

22
Thermal and rheological characterisation of filled materials
Crystallisation
Melting
Cooling
Heating

23
H4: Flow properties of filled materials
Industrial input: e.g. materials,
industrial trials, equipment
Measurements for dispersion Case studies:
Compounding for nano-fillers,
micro-mouldingRheometry, Tg, other
Your input to steer the project
to maximise the benefits to youSimple QC / inline techniques
24
U4: Dynamic properties of solid/liquid materials systems at the nano and micro-scale(2005-08)
Industry need to measure and understand the behaviour of materials on the nano and micro-scale, particularly where scale effects are significant, if they are to develop successfully micro- and nano-technologies (e.g HTT).
Process monitoring is key to improving quality and profitability but is often expensive to implement. Through the development of small-scale instrumentation, process monitoring will become more attractive and cost effective.
To address such issues this project aims to develop new innovative capability to measure the dynamic properties of materials
• Development of a macro scale resonating piezoelectric cantilever device for fluid rheology, and validated using a range of reference fluids
• Design and development of prototype nano-mechanical tester (NTM3D) based in an SEM for measurement of solids
25
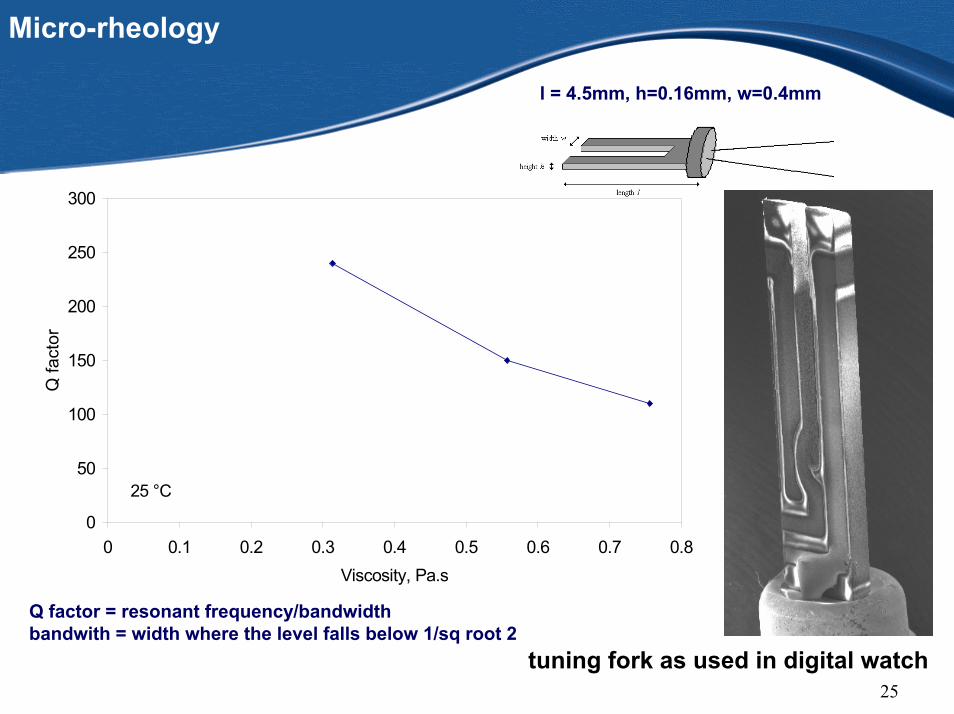
Micro-rheology
l = 4.5mm, h=0.16mm, w=0.4mm
0
50
100
150
200
250
300
0 0.1 0.2 0.3 0.4 0.5 0.6 0.7 0.8Viscosity, Pa.s
Q fa
ctor
25 °C
Q factor = resonant frequency/bandwidthbandwith = width where the level falls below 1/sq root 2
tuning fork as used in digital watch

26
Piezoelectric device
Piezoelectric PZT cantileverSupporting structure
tiliqinliq eFEI
tbb
tSA ωζλ
ζζρρ −=+
∂∂
++∂∂
+ 0141
21
2
)()(
Vibrating cantilever immersed in fluid behaviour
3311111 EdS E +Χ=χPiezoelectric behaviour
3331313 EdD Xε+Χ=
27
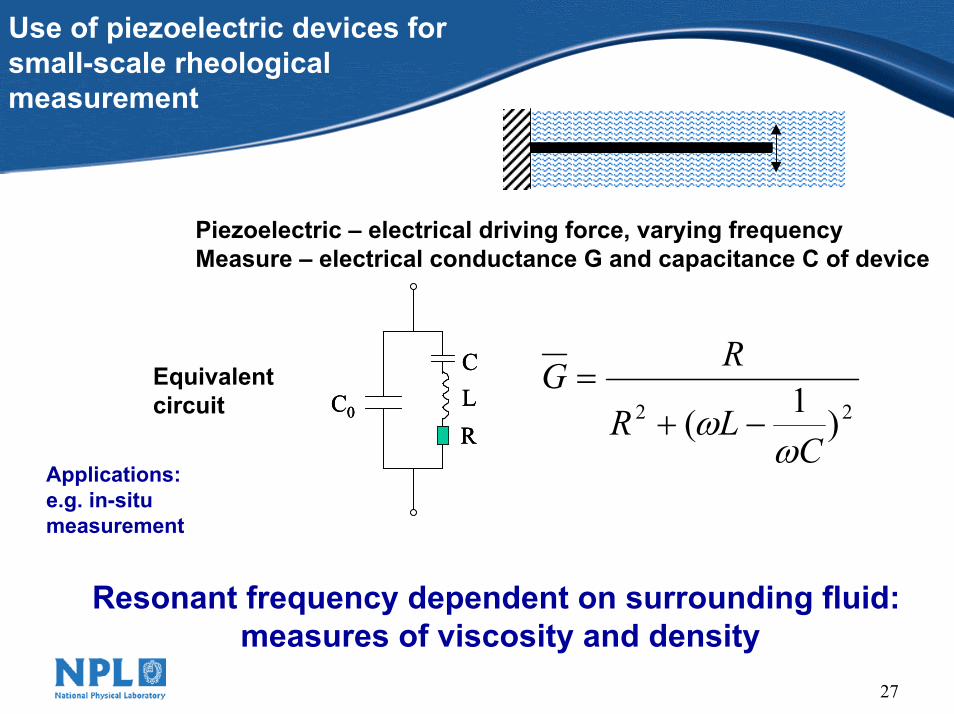
Use of piezoelectric devices for small-scale rheological measurement
Piezoelectric – electrical driving force, varying frequencyMeasure – electrical conductance G and capacitance C of device
C0R
CLC0R
CLC0R
CL 22 )1(
CLR
RG
ωω −+
=Equivalent circuit
Applications:e.g. in-situ measurement
Resonant frequency dependent on surrounding fluid: measures of viscosity and density

28
Use of piezoelectric devices for small-scale rheological measurement
Resonant frequency dependent on surrounding fluid: measures of viscosity and density
0
1x10⁻⁵
2x10⁻⁵
3x10⁻⁵
4x10⁻⁵
G (S
)
0
2x10⁻¹⁰
4x10⁻¹⁰
6x10⁻¹⁰
8x10⁻¹⁰
1x10⁻⁹
1x10⁻⁹
60005000
C (F
)
Frequency (Hz)
Applications:e.g. in-situ measurement
electrical conductance G and capacitance C

29
Use of piezoelectric devices for small-scale rheological measurement
0
1x10⁻⁵
2x10⁻⁵
3x10⁻⁵
4x10⁻⁵
G (S
)
0
2x10⁻¹⁰
4x10⁻¹⁰
6x10⁻¹⁰
8x10⁻¹⁰
1x10⁻⁹
1x10⁻⁹
60005000
C (F
)
Frequency (Hz)
Frequency
Con
duct
ance

30
Use of piezoelectric devices for small-scale rheological measurement
0
0.000005
0.00001
0.000015
0.00002
0.000025
3000 3500 4000 4500 5000 5500 6000 6500 7000 7500 8000
Frequency
Con
duct
ance
G raw data
G fitted curve
Parameter Value Error----------------------------------------R 43426.23886 75.43748L 30.59421 0.06205C 2.57E-11 5.22E-14B 4.54E-07 6.53E-09
`

31
PZT measurements
1st resonant mode
2nd resonant mode
3rd resonant mode

32
PZT measurements
1
10
100
1000
0.1 1 10 100 1000(Viscosity, mPa.s)1/2
R/(L
wo1/
2 )
Resonant peak 1
Resonant peak 2
Resonant peak 3
Resonant peak 4
Resonant peak 5

33
PZT measurements
1
10
100
1000
0.1 1 10 100 1000(Viscosity, mPa.s)1/2
R/(L
wo1/
2 )
Resonant peak 1
Resonant peak 2
Resonant peak 3

34
PZT measurements
y = 33675x-0.0161
y = 505494x-0.0038
y = 905781x-0.0034
y = 1E+06x-0.0016
y = 196980x-0.007
1.E+04
1.E+05
1.E+06
1.E+07
1.E-02 1.E-01 1.E+00 1.E+01 1.E+02 1.E+03 1.E+04 1.E+05 1.E+06
Viscosity, mPa.s
Res
onan
t fre
quen
cy w
o
Resonant peak 1
Resonant peak 2
Resonant peak 3
Resonant peak 4
Resonant peak 5
Resonant peak 1
Repeatability of ωο: 0.01% undisturbed, 0.6% disturbedEquivalent repeatability of viscosity: 0.6% undisturbed, 27% disturbed

35
PZT measurements
y = 33675x-0.0161
y = 505494x-0.0038
y = 905781x-0.0034
y = 1E+06x-0.0016
y = 196980x-0.007
1.E+04
1.E+05
1.E+06
1.E+07
1.E-02 1.E-01 1.E+00 1.E+01 1.E+02 1.E+03 1.E+04 1.E+05 1.E+06
Viscosity, mPa.s
Res
onan
t fre
quen
cy w
o
Resonant peak 1
Resonant peak 2
Resonant peak 3
Resonant peak 4
Resonant peak 5
Resonant peak 1
Repeatability of ωο: 0.01% undisturbed, 0.6% disturbedEquivalent repeatability of viscosity: 0.6% undisturbed, 27% disturbed
35600
35700
35800
35900
36000
36100
36200
36300
36400
0.018199995 0.0182

International standards activities on rheological measurement of plastics
http://www.npl.co.uk/materials/polyproc/iso.html
Next ISO TC61 meeting to be held in September 2007

37
Developments in rheology standards
ISO TC 61 (Plastics) SC5 (Thermophysical properties) WG9 (Rheology) -Chairman
Represent UK interests in the revision of ISO rheological standards and the drafting of new standards
– Melt flow rate (MFR/MVR) – ISO 1133 – Capillary extrusion rheometry – ISO 11443– Extensional viscosity (tensile drawing method) – ISO 20965– Drawing characteristics of molten thermoplastics (fibre-spinning method) – ISO 16790– Oscillatory rheometry - ISO 6721-10– Pressure-volume-temperature (pvT) – ISO 17744
– Acquisition and presentation of comparable multipoint data: Thermal and processing properties – ISO 11403-2
– ISO guide for the acquisition and presentation of design data for plastics - ISO 17282

38
ISO 1133 Melt mass-flow rate (MFR) and melt volume-flow rate (MVR) Recently revised (published 2005):
Incorporation of additional die (half normal length and half normal diameter) to enable higher MFR/MVR value materials (MFR>75) to be measured
Removal of dead-weight specificationRevised temperature tolerances
Future revisions:
moisture sensitive/high MFR/MVR materials
preparation of a consolidated charge
inclusion of novel NPL tests features
39
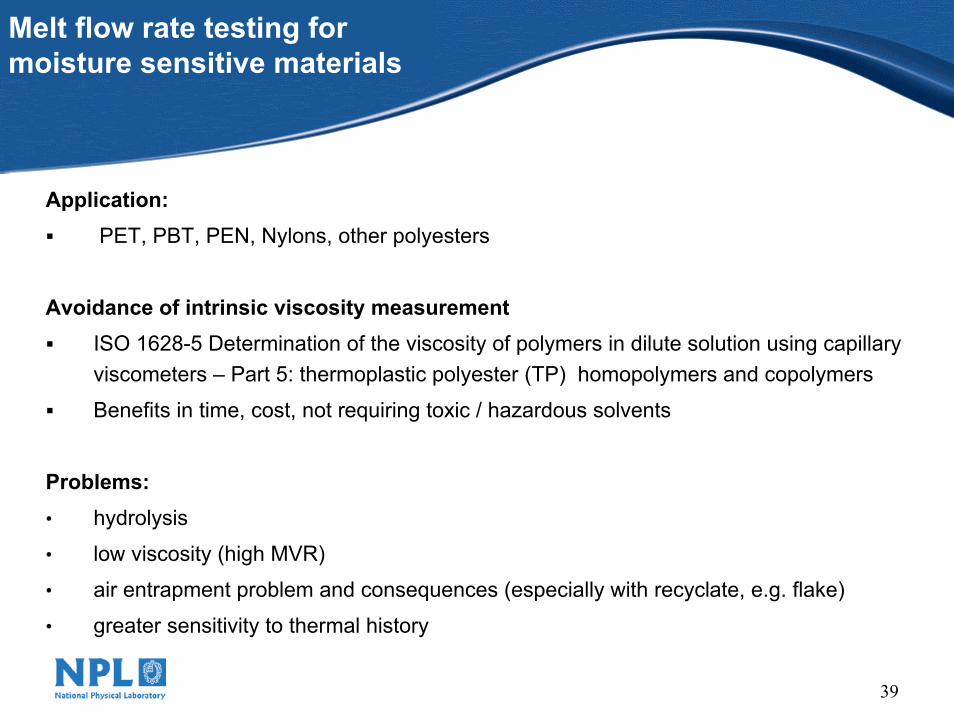
Melt flow rate testing for moisture sensitive materials
Application:PET, PBT, PEN, Nylons, other polyesters
Avoidance of intrinsic viscosity measurement ISO 1628-5 Determination of the viscosity of polymers in dilute solution using capillary viscometers – Part 5: thermoplastic polyester (TP) homopolymers and copolymers
Benefits in time, cost, not requiring toxic / hazardous solvents
Problems:• hydrolysis
• low viscosity (high MVR)
• air entrapment problem and consequences (especially with recyclate, e.g. flake)
• greater sensitivity to thermal history

40
Melt flow rate testing for moisture sensitive materials
Intercomparison:
To provide precision data and statement to ISO 1133 for both current and moisture sensitive parts
Led by NPL
Participants welcomed

41
Melt flow rate testing: potential developments
Sample preparation:
Related problem for recycled polymer, flakes, film, shredded product samples, e.g. PET bottles (low bulk density).
Pre-forming of charge using cylinder (9.55 mm diameter) under vacuum.
Temperature 241 °C +/- 1 °C
Load 1.5 kN +/- 0.5 kN
Charge 6 g to 10 g sample
Incorporation of short die specification:
For determination of extensional flow properties
Particularly relevant to blow moulding, film blowing, vacuum forming

42
Potential future developments in standards for plastics
• On-line viscosity measurement
• Rotational rheometry- steady shear, creep/stress relaxation, calibration of,
• Determination of no-flow temperature
• Other? – your say
43
Summary
• Slip intercomparison – slip velocities within approx. +/- 20%
• Crystallisation behaviour shows most promise of thermal techniques for differentiating filled materials
• Industrial input for case studies being developed• Assessment of piezoelectric device for rheological
measurement has identified various strengths and weaknesses of technique
• ISO standardisation of MVR/MFR testing of moisture sensitive materials progressing

44
Next twelve months
• Technical/industrial case studies on mix quality
• Further explore use of thermal and rheological techniques for
evaluating dispersion quality (case studies)
• Further assessment of small-scale rheological devices (reduction in
size issues)
• Progress standardisation of moisture sensitive MVR/MFR method
• Intercomparison on MFR/MVR in support of standards activity

45
http://www.npl.co.uk/materials/polyproc/

Acknowledgements:DTI
Crispin Allen, Angela Dawson, Don Fleming, Adrian Kelly, Barry Howarth,
http://www.npl.co.uk/materials/polyproc/