flow related fish and fisheries ecology in the coorong
TRANSCRIPT

Flow related fish and fisheries ecology in the Coorong, South Australia
Qifeng Ye, Jason Earl, Luciana Bucater, Katherine Cheshire, Dale McNeil, Craig Noell and David Short
SARDI Publication No. F2009/000014-2 SARDI Research Report Series No. 698
ISBN: 978-1-921563-48-5
FRDC PROJECT NO. 2006/045
SARDI Aquatic Sciences PO Box 120 Henley Beach SA 5022
August 2013
Final Report

Flow related fish and fisheries ecology in the Coorong, South Australia
Final Report
Qifeng Ye, Jason Earl, Luciana Bucater, Katherine Cheshire, Dale McNeil, Craig Noell and David Short
SARDI Publication No. F2009/000014-2 SARDI Research Report Series No. 698
ISBN: 978-1-921563-48-5
FRDC PROJECT NO. 2006/045
August 2013

This publication may be cited as: Ye, Q., Earl, J., Bucater, L., Cheshire, K., McNeil, D., Noell, C. and Short, D. (2013). Flow related fish and fisheries ecology in the Coorong, South Australia. Final Report. South Australian Research and Development Institute (Aquatic Sciences), Adelaide. SARDI Publication No. F2009/000014-2. SARDI Research Report Series No. 698. 84pp.
South Australian Research and Development Institute SARDI Aquatic Sciences 2 Hamra Avenue West Beach SA 5024
Telephone: (08) 8207 5400 Facsimile: (08) 8207 5406 http://www.sardi.sa.gov.au
DISCLAIMER The report has been through the SARDI internal review process, and has been formally approved for release by the Research Chief, Aquatic Sciences. The SARDI Report Series is an Administrative Report Series which has not been reviewed outside the department and is not considered peer-reviewed literature. Material presented in these Administrative Reports may later be published in formal peer-reviewed scientific literature. The authors do not warrant that the information in this document is free from errors or omissions. The authors do not accept any form of liability, be it contractual, tortious, or otherwise, for the contents of this document or for any consequences arising from its use or any reliance placed upon it. The information, opinions and advice contained in this document may not relate, or be relevant, to a reader’s particular circumstances. Opinions expressed by the authors are the individual opinions expressed by those persons and are not necessarily those of the publisher, research provider or the FRDC. The Fisheries Research and Development Corporation plans, invests in and manages fisheries research and development throughout Australia. It is a statutory authority within the portfolio of the federal Minister for Agriculture, Fisheries and Forestry, jointly funded by the Australian Government and the fishing industry.
© 2013 FRDC & SARDI This work is copyright. Apart from any use as permitted under the Copyright Act 1968 (Cth), no part may be reproduced by any process, electronic or otherwise, without the specific written permission of the copyright owner. Neither may information be stored electronically in any form whatsoever without such permission.
Printed in Adelaide: August 2013
SARDI Publication No. F2009/000014-2 SARDI Research Report Series No. 698
ISBN: 978-1-921563-48-5
Author(s): Qifeng Ye, Jason Earl, Luciana Bucater, Katherine Cheshire, Dale McNeil, Craig Noell and David Short
Reviewer(s): Stephen Madigan, Michael Geddes, Mike Steer, Jason Tanner, and FRDC Reviewers
Approved by: Prof Xiaoxu Li Science Leader – Aquaculture
Signed:
Date: 23 August 2013
Distribution: FRDC, DEWNR and SA MDB NRM Board, SAASC Library, University of Adelaide Library, Parliamentary Library, State Library and National Library
Circulation: Public Domain

Ye et al. 2013 Flow related fish and fisheries ecology in the Coorong
Table of Contents 1. Non-Technical Summary .................................................................................................................... 3
2. Acknowledgements .............................................................................................................................. 8
3. Background .......................................................................................................................................... 9
4. Need .................................................................................................................................................... 12
5. Objectives ........................................................................................................................................... 13
6. Methods .............................................................................................................................................. 14
6.1 Study region ........................................................................................................................................ 14
6.2 Environmental characteristics ............................................................................................................. 16
6.3 Fish assemblages ................................................................................................................................. 16
Sampling regime ............................................................................................................................ 16
Data analyses................................................................................................................................. 17
6.4 Reproductive biology .......................................................................................................................... 17
Sampling regime ............................................................................................................................ 17
Sample processing and macroscopic analysis ............................................................................... 17
Size at first maturity ....................................................................................................................... 18
6.5 Salinity tolerance trials for key species ............................................................................................... 18
Experimental setup: slow acclimation tolerance trials .................................................................. 19
Behavioural observations .............................................................................................................. 19
Data analysis and threshold determination ................................................................................... 20
6.6 Influence of freshwater flows on fishery production for key species .................................................. 21
7. Results ................................................................................................................................................ 23
7.1 Environmental characteristics ............................................................................................................. 23
Water temperature ......................................................................................................................... 23
Salinity ........................................................................................................................................... 23
Dissolved oxygen ........................................................................................................................... 23
pH .................................................................................................................................................. 23
Turbidity ........................................................................................................................................ 24
7.2 Fish assemblage structure and composition ........................................................................................ 25
Classification of fish assemblages: spatial variation ..................................................................... 27
Link between salinity and fish assemblages ................................................................................... 30
Length-frequency distributions of key species ............................................................................... 30
7.3 Reproductive characteristics of key species ........................................................................................ 33
Black bream (Acanthopagrus butcheri) ......................................................................................... 33
Yelloweye mullet (Aldrichetta forsteri) .......................................................................................... 35
Greenback flounder (Rhombosolea tapirina) ................................................................................ 37
Tamar goby (Afurcagobius tamarensis) ........................................................................................ 39
Congolli (Pseudaphritis urvillii) .................................................................................................... 39
Spawning modes ............................................................................................................................ 42
1

Ye et al. 2013 Flow related fish and fisheries ecology in the Coorong
7.4 Effects of hypersalinity on the survival and distribution of key species ............................................. 43
Comparative vulnerability to hypersaline conditions .................................................................... 45
Salinity tolerance thresholds and relative distribution for individual species ............................... 45
7.5 Fishery production relative to freshwater inflows for key fish species ............................................... 48
Description of time series .............................................................................................................. 48
Univariate ARIMA and Transfer Function (TF) models for key species ....................................... 53
Model fit ......................................................................................................................................... 55
8. Discussion ........................................................................................................................................... 56
8.1 Environmental characteristics: salinity gradient ................................................................................. 56
8.2 Composition of fish assemblages ........................................................................................................ 56
Link between salinity and fish assemblages ................................................................................... 57
Size and growth characteristics for key species ............................................................................. 58
Influence of drought on fish assemblages ...................................................................................... 59
8.3 Reproductive Characteristics of key species ....................................................................................... 60
Sex ratios ....................................................................................................................................... 60
Temporal variation in spawning behaviour ................................................................................... 60
Size at first maturity ....................................................................................................................... 61
Impacts of drought on reproduction .............................................................................................. 62
8.4 Influence of salinity on the survival and distribution of key s pecies .................................................. 63
Tolerance to hypersaline conditions .............................................................................................. 63
Relating tolerance thresholds to ecological distribution ............................................................... 64
Ecological and management significance ...................................................................................... 65
8.5 Influence of freshwater flows on fishery production........................................................................... 65
9. Benefits ............................................................................................................................................... 68
10. Further Development ........................................................................................................................ 69
11. Planned outcomes .............................................................................................................................. 70
12. Conclusion .......................................................................................................................................... 71
References ...................................................................................................................................................... 74
List of Figures ................................................................................................................................................ 81
List of Tables ................................................................................................................................................. 83
Appendix 1: Staff ........................................................................................................................................... 84
Appendix 2: Companion studies .................................................................................................................... 84
Appendix 3: Intellectual Property .................................................................................................................. 84
2

Ye et al. 2013 Flow related fish and fisheries ecology in the Coorong
1. Non-Technical Summary
2006/045. Flow Related Fish and Fisheries Ecology in the Coorong, South Australia
PRINCIPAL INVESTIGATOR: Dr Qifeng Ye
ADDRESS: SARDI Aquatic Sciences
PO Box 120
Henley Beach, SA 5022
Telephone: 08 8207 5447; Fax: 08 8207 5481
OBJECTIVES
1. To determine the distribution, relative abundance and size structure of key fish species and how
these relate to habitat and environmental conditions (e.g. salinity, temperature) in the Murray
Estuary and Coorong.
2. To examine aspects of reproductive biology and influence of environmental conditions on
spawning success of key species in the region.
3. To investigate the influence of environmental conditions (e.g. salinity, temperature) on the
critical early life stages of key species.
4. To investigate the relationship between freshwater flows (timing, quantity and duration) and
recruitment success and fisheries production of key commercial species.
Five species were selected as key species:
• black bream (Acanthopagrus butcheri) – commercially important estuarine species.
• yelloweye mullet (Aldrichetta forsteri) – commercially important marine/estuarine opportunist.
• greenback flounder (Rhombosolea tapirina) – commercially important estuarine and marine
species.
• Tamar goby (Afurcagobius tamarensis) - important trophic level small-bodied estuarine species.
• congolli (Pseudaphritis urvillii) – conservation significant catadromous species.
Additional species of interest included:
• mulloway (Argyrosomus hololepidotus) – commercially important marine/estuarine opportunist.
• small mouthed hardyhead (Atherinosoma microstoma) - estuarine species.
3

Ye et al. 2013 Flow related fish and fisheries ecology in the Coorong
Outcomes achieved
The project outputs have contributed to or will lead to the following outcomes:
1. The ability to compare the effect of various flow regimes and management scenarios or
actions on the abundance and distribution of fish populations and fisheries for the region.
2. The opportunity to incorporate fishery and ecological considerations through the CSIRO
Flagship CLLAMMecology Program into a decision-support system framework for the
region. The findings of the study will be used to quantify the environmental, social, and
economic tradeoffs of water use in the Murray-Darling Basin. Cost benefit analyses will be
used to determine the volume of water required to maximise fisheries production, preserve
fish biodiversity and maintain a viable commercial and recreational fishing communities in
the CLLAMM region.
3. Improved ecological health in the Coorong and Murray Mouth, and other estuaries in
southeastern Australia, through better knowledge of the role of freshwater in estuarine
processes and functions and improved management of water resources. This will be of both
private and public benefit.
4. Sustainable production of both the Lower Lakes irrigation agriculture and estuarine fisheries
from the water resources available as a consequence of a better understanding of the relative
importance of freshwater flows to these industries.
5. Provides an understanding of flow related fish ecology that will inform ongoing fisheries
management by PIRSA and the natural resource management by the partner agencies in the
CLLAMM region (SA DENR, SA MDBNRMB and DFW; now DEWNR).
6. Water Management Plans and other related Natural Resource Management Plans that allocate
water in an ecological sustainable manner to environmental needs, as well as sustainable
production.
7. Increased stakeholder and community awareness about the environmental and economic
benefits and costs of providing freshwater flows to estuaries.
The findings of this study are discussed in context of the importance of freshwater flow to fish
habitats and recruitment dynamics in the estuarine system, emphasising that maintaining a salinity
gradient and connectivity between the freshwater, Coorong and marine system is paramount to the
ecological health of the Coorong fish community and the fishery.
4

Ye et al. 2013 Flow related fish and fisheries ecology in the Coorong
The importance of quantitative assessment and linkage between freshwater flows and ecological
outcomes has been increasingly recognised in recent years. Information is particularly lacking for
estuarine fisheries in Australia. The Coorong, Lower Lakes and Murray Mouth (CLLAMM) region
supports a significant local economy based on irrigation/agriculture/tourism and
commercial/recreational fisheries. The region also has a high biodiversity value, recognised by Ramsar
Wetland and Living Murray Icon Site status. However, the economic and biodiversity values of the
region are currently under threat due to the reduction in flows from upstream abstraction. A number of
environmental flow and engineering options have been considered to help improve the social, economic
and environmental value of the system, including ecologically sustainable fisheries. However, there is a
lack of biophysical system knowledge required to assess and predict the potential environmental benefits
of the different management options. Knowledge gaps include flow-related fish ecology, which is
critical for water management to enhance spawning and recruitment of native fish, thus supporting
ecologically sustainable fisheries in the region.
The South Australian Lakes and Coorong Fishery Management Plan identified flows as an important
factor impacting key commercial and recreational species. However, there has been little research on
specific flow and habitat requirements of these fish. This led to the present study, aiming to address
flow-related ecology of key fish species of commercial, recreational, conservation and/or ecological
significance (A. butcheri, R. tapirina, A. forsteri, P. urvillii and A. tamarensis) in the Murray Estuary
and Coorong. This project was conducted as a part of the CLLAMMecology Research Program (2006
2009), and was supported by the CSIRO Flagship Collaborative Fund and the South Australian Murray-
Darling Basin Natural Resources Management Board.
During the study period (October 2006 to September 2008), the lower Murray system was in drought,
and there was no freshwater released through the Murray barrages to the Coorong. This precluded any
in-situ investigation of ecological response to flow events in the Coorong. Nevertheless, a strong north-
south salinity gradient that increased with distance from the Murray Mouth persisted throughout the
study; mean salinities of 30–40 ppt were recorded in the Murray Mouth subregion, 61–86 ppt in the
North Lagoon, and 105–164 ppt in the South Lagoon. This allowed us to study the impact of ‘lack of
flows’ on fish assemblages and various aspects of biology and ecology in the region.
Quantitative assessment of the fish assemblages of the Murray Mouth and Coorong region was
conducted over a two-year period under prolonged drought conditions. A total of 31 species, consisting
of estuarine, marine estuarine-opportunist, marine straggler, freshwater and catadromous species, were
collected by seine and gill netting. Notably, six of the marine species had not been recorded in previous
inventories for the region. Length-frequency distributions were obtained to identify cohorts for key
species to gain an understanding of the recruitment pattern (timing and duration of these cohorts) and
fish growth (modal progression) in the region. A general decline in species diversity occurred with
increasing distance from the mouth, with only a single species was present in the South Lagoon. Fish
assemblages tended to be more similar between sites, either within the same subregion or proximate to
5

Ye et al. 2013 Flow related fish and fisheries ecology in the Coorong
one another, with no temporal differences (by year or season) detected. Among several water quality
variables considered, salinity was found to most significant driver of variation in the structure of fish
assemblages and was also strongly correlated to species abundances.
There is a high likelihood that the extended drought conditions and the subsequent lack of freshwater
input and increases in salinity throughout the Murray Mouth and Coorong influenced the composition of
fish assemblages observed in this study. These conditions may have negative implications for R.
tapirina, A. hololepidotus, A. butcheri and P. urvillii based on knowledge of these species’ life histories
and low densities recorded in the current study. The decline in species diversity with distance from the
mouth is likely a response to the greater osmoregulatory stress and diminishing food resources, thus
limiting the amount of available habitat for most species. We recommend that the results of this study be
treated as a baseline by which future quantitative assessments can be made, particularly under non-
drought conditions.
A targeted study (July 2007 to July 2008) provides a baseline of key aspects of reproductive biology
(including sex ratios, spawning time and duration, size at first maturity and macroscopic and
microscopic characteristics of ovaries) for five key species during drought conditions. Sex ratios for all
species, were heavily weighted towards females. Most species, with the exception of A. forsteri,
exhibited plasticity in size at maturity either between different subregions or as a result of environmental
stressors. Seasonal spawning guilds were identified for all species, consisting of spring (A. butcheri),
spring/summer (A. tamarensis), summer/autumn/winter (A. forsteri) and winter (R. tapirina and P.
urvillii) spawners. All species were identified as multiple batch spawners, i.e. they developed and
released batches of oocytes on multiple occasions throughout the reproductive season (see Cheshire et
al. (2013)). Microscopic analysis suggested spawning for P. urvillii may not have occurred in the
Coorong during this study. It was suggested that the low flow conditions in the Coorong may have
directly impacted the reproductive biology of the key species. Ensuring appropriate salinity ranges and
connectivity between fresh, estuarine and marine waters is integral for the spawning and recruitment
success of many Coorong species.
An experimental approach was used to investigate the influence of salinity on critical life stages (i.e.
juveniles) and thus, recruitment success of key species. Gradual acclimation trials were conducted in
aquaria to establish tolerance thresholds at 14 ºC (representative ‘winter’ temperature) and 23 ºC
(representative ‘summer’ temperature) for each species. Daily measurements were taken for mortalities
and behavioural changes. Probit analysis was applied to estimate a species Lethal Concentration (LC)
values for 10%, 50% and 90% mortalities. Daily Feeding Response Scores and Stress Scores were also
calculated from behavioural observations. Juveniles of all species trialled tolerated high salinity levels
approximately twice the concentration of sea-water. There was, however, a gradient of relative tolerance
across species. Behavioural response measures during gradual salinity increase trials provided additional
insight into the sub-lethal impacts. The maximum field salinities at which species were caught in the fish
assemblage study more clearly divided species into two groups, with species captured in salinities of
6

Ye et al. 2013 Flow related fish and fisheries ecology in the Coorong
over 74 ppt and species captured below 60 ppt. These field patterns suggest that the winter temperature
tolerance thresholds for these species were closely related to their distribution throughout the Coorong
during 2006 to 2008. A key outcome of the current study is the application of experimentally derived
tolerance thresholds to the distribution of fish across a natural salinity gradient in the field. The results
suggest that threshold values, in particular LC for 10% and 50% mortalities, can approximate the
maximum salinity extent of field distribution of species with moderate accuracy.
Finally, we used time series analysis to explore the relationships between freshwater flow and monthly
commercial catches of key species in the South Australian Lakes and Coorong Fishery between July
1984 and June 2008. The autoregressive integrated moving average (ARIMA) modelling technique was
adopted. For A. butcheri and large A. hololepidotus taken from outside the Murray Mouth, catches were
best predicted by univariate models (i.e. catches in the previous year alone). For A. forsteri and small
A. hololepidotus taken inside the Murray estuary and Coorong, multivariate models slightly improved
predictive power when accounting for the effects of flow and other species catch. For example, it was
indicated that increased flow leads to additional catch of A. forsteri during the same month, whereas
catch of this species had a negative relationship with the catch of A. hololepidotus A, suggesting a fisher
behaviour influence. No model could be specified for R. tapirina. Although this study identified
limitations of time series modelling when applied to commercial catch data of the Lakes and Coorong
Fishery, some of these limitations may be overcome with careful planning of future research. It therefore
remains a potentially useful tool to describe the influence of flows on fishery production, as has been
demonstrated in other fisheries.
KEY WORDS: fish, flow, salinity, drought, reproductive biology, tolerance, estuaries, fishery, time
series modelling.
7

Ye et al. 2013 Flow related fish and fisheries ecology in the Coorong
2. Acknowledgements This project was funded by the Fisheries Research and Development Corporation (FRDC), the CSIRO
Flagship Collaboration Fund and the Murray-Darling Basin Authority’s (MDBA’s) Living Murray
program through South Australian Murray-Darling Basin Natural Resources Management Board (SA
MDB NRMB). This work was originally commissioned and produced for the Murray-Darling Basin
Commission (MDBC) and contains references to the MDBC. In December 2008, the MDBC's rights and
its functions were transferred to the MDBA in accordance with the Water Act 2008 (Cth).
We also acknowledge the contribution of several other funding agencies to other aspects of the
CLLAMM program and the CLLAMMecology Research Cluster, including Land and Water Australia
and SA Water. The objectives of this program were endorsed by the SA Department of Environment and
Natural Resources (DENR, now DEWNR), SA Department for Water (DFW, now DEWNR).
All staff primarily involved in the project are extremely grateful to the following members of the Lakes
and Coorong fishing industry, NRM agencies and research organisations who provided assistance within
the project. These included commercial fishers Garry Hera-Singh, Darren Hoad, Matt Hoad, Dingles
Dennis, Kane Ebel, Glen and Tracey Hill who provided fish samples for this study; NRM managers
Judy Goode, Adrienne Frears, Russell Seaman and Jason Higham (DEWNR), and Alice Fistr (PIRSA
Fisheries and Aquaculture) who provided constant support to the research; SARDI staff Dave Fleer,
Phillipa Wilson, Josh Fredberg, Jason Nicol, Michael Guderian and Matt Pellizzari and Dr Andrew
Munroe from the University of Adelaide who assisted with field and/or laboratory work; and Suzanne
Bennett, the SAASC librarian who greatly assisted with literature searches. The authors also thank
Professor Bronwyn Gillanders from the University of Adelaide for invaluable advice and discussions
throughout the project. Dr Anthony Miskiewicz from the Wollongong City Council provided invaluable
help with the larval identifications of goby species.
Special thanks to the Stakeholders and Traditional Owners Committee (STOC) for this project.
Members included Alice Fistr and Lianos Triantafillos (PIRSA Fisheries and Aquaculture), Adrienne
Frears and Rohan Henry (SA MDB NRMB/DEWNR), Jason Higham, Simon Oster and Tim Hartley
(DEWNR), Garry Hera-Singh and Rod Ayers (Commercial fishers representatives), John Winwood
(Recreational Fishers representative), and George Trevorrow (Ngarrindjeri Traditional Owners
representative).
SA Rural Solutions staff Virginia Simpson, Jason Downs and Peter Marin provided administrative
support for the STOC meetings, and Virginia also conducted a preliminary review regarding the
historical conditions and traditional fishing in the Coorong.
Fish sampling for this project was conducted through the Exemption under Fisheries Management Act
2007: Section 115. Finally, we thank the reviewers for this report, including Drs Stephen Madigan,
Michael Geddes, Michael Steer and Jason Tanner, and two anonymous reviewers nominated by the
FRDC and the SA MDB NRMB/DEWNR.
8

Ye et al. 2013 Flow related fish and fisheries ecology in the Coorong
3. Background River regulation and freshwater flow extraction for agricultural, industrial and residential use are
common practices across Australia and have had severe impacts on water-dependent ecosystems
including estuarine environments and coastal fisheries. In recent years, the need for environmental flow
allocation is being increasingly recognised within Australia, and worldwide, as part of the sustainable
use of water resources in integrated catchment management strategies (Davis and Hirji 2003a: 2003b:
2003c; Dyson et al. 2003). However, there is little knowledge of the influence of freshwater flows on
estuarine health and fishery production (Gillanders and Kingsford 2002). A limited number of previous
studies have indicated that estuary-specific information might be required due to hydrological and
biological differences between catchments (Vance et al. 1998). Recognising the importance of estuarine
health and productivity, the Fisheries Research and Development Corporation (FRDC) and Land and
Water Australia requested an assessment of the priority research topics on the effects of freshwater
flows into Australian estuaries. Knowledge of the influence of freshwater flow regimes on habitat-biota
relationships; flow regime conditions needed to maintain estuarine health; flow and water quality
requirements of species (flora and fauna); and more specifically the role of flows on commercial and
recreational fisheries species and their supporting ecosystems (e.g. spawning success, migration and
distribution, predation rates, trophic pathways) were all among the highest priorities in terms of benefits
to management and scientific merits.
The Murray-Darling system, Australia’s largest river catchment (an area of 1,063,000 km2), is heavily
affected by river regulation (Kingsford 2000). With a total length of 2,530 km, the River Murray has 15
major storages on the main channel between Hume Dam and the sea and a series of 5 barrages near the
Murray mouth. The terminal system covers an area of about 140,000 hectares, including the Coorong (a
narrow 140 km lagoon system, with two major basins), lower lakes (Lake Albert and Lake Alexandrina)
and a dynamic mouth opening to the South Ocean (Jensen et al. 2000). The overall economy of the
Coorong Lower Lakes and Murray Mouth (CLLAMM) region is worth approximately $236m/year and
is based principally on irrigation agriculture ($162m/year) and tourism ($59m/year) with smaller
contributions from recreational ($9.6m/year) and commercial fisheries ($5m/year). The region also plays
a significant role in providing ecosystem services and is recognized internationally as an important
wetlands for migratory waders under the Ramsar Convention with 33 bird species listed under
international treaties. There are some 78 species of marine and freshwater fish inhabiting the area and it
is an important nursery and feeding ground for key commercial species and habitat for ecologically
significant fish. The area represents significant intrinsic value for the broader community and has strong
spiritual and cultural meaning for Indigenous people. The CLLAMM region has always been the focus
of considerable environmental and political interest. It is also one of the six significant ecological assets
under the Living Murray initiative.
As in many other coastal catchments, flow reduction and barrage structures have exerted profound
impacts to the Coorong estuary and Murray Mouth. These include an 89% reduction of original
9

Ye et al. 2013 Flow related fish and fisheries ecology in the Coorong
estuarine habitat, disrupted transition between fresh and salt conditions, and major barriers for fish
movement and migration. The ecological condition of this estuarine system worsened significantly
during the recent drought, and from 2002 to 2010 two dredges were installed to maintain the Murray
Mouth open, costing $9m/year. Despite this, the ecological trajectories for the CLLAMM systems are
far from certain. Recent studies in the Coorong, in particular, have shown declines in fish stocks and the
abundances of aquatic angiosperms, invertebrates and bird populations (Geddes 2003). The capacity to
return long term ecological function to the CLLAMM systems through infrastructure upgrade and flow
management is largely unknown, although previous releases of small volumes of freshwater over the
barrages provided limited ecological benefits (Geddes 2005a). Foundation knowledge and decision tools
are required to target and assess the effectiveness of management actions and investment over longer
time frames.
In 2008, the CLLAMMecology research cluster was developed in close consultation between South
Australian research and management agencies and the CSIRO Flagships Program through the Water for
a Healthy Country Flagship. The program aimed to produce a decision-support framework to assess the
ecological, social and economic costs and benefits of different management options, particularly through
water/flow management. This research framework aimed to link the key levers for management with
key biophysical (hydrodynamics, biogeochemistry, ecology) processes. The levers for the Coorong and
Murray Mouth region included barrage operation, releases from upstream storages, dredging of the
Murray Mouth and releases from the Upper South East Drainage scheme. The CSIRO Water for a
Healthy Country Flagship program facilitated the development of an overall system framework for the
region, including its hydrodynamic function and social and economic assessment components.
CLLAMMecology further complemented these activities by addressing the critical knowledge needs to
quantify the potential ecological costs and benefits of possible management action (e.g. flow releases
and barrage operations) for the region. By implementing a whole-of-system approach, the study served
as one of the few case studies for the integrated catchment management for sustainable water use in the
temperate Australia.
A key knowledge gap identified in the CLLAMMecology program was flow-related fish and fisheries
ecology. A number of estuarine-lagoonal fish species of commercial value, complete their life cycles in
the Coorong estuary and Murray Mouth region. Other fish use the system as refuge, nursery and feeding
ground, and a migration pathway at a certain life history stage. The Lakes and Coorong Fisheries
Management Plan identified the critical need of environmental flows for the sustainable management of
the fisheries in the region. “Ensuring more frequent estuarine fish spawning” is also a main ecological
objective for this significant asset in the Living Murray initiative. Previous attempts were made to
develop models based on expert opinions such as preference curves for some species/functional groups
in the CLLAMM region for incorporation into the Murray Flow Assessment Tool (MFAT). However,
these were not based on measured responses to environmental variables, and none of them were spatially
explicit, or considered performances over a series of events. The exercise also highlighted the critical
10
Ye et al. 2013 Flow related fish and fisheries ecology in the Coorong
need for quantitative data for this region to develop robust models for signature fish. This FRDC project
provides quantitative research to determine environmental conditions that are essential to the
maintenance and/or enhancement of fish populations in the region. The information will be used to
develop fish response models to evaluate the impact of environmental events on the critical life history
stages (e.g. minimum flows/environmental cues to induce spawning) of key species (e.g. A. butcheri, R.
tapirina, A. forsteri, P. urvillii and gobies) or functional groups.
The lack of freshwater flows to the system during the study period, precluded the proposed in-situ
investigation of ecological response of key fish species to freshwater flow events in the Coorong.
However, the prolonged period of no-flow facilitated an investigation into the impact of ‘no flows’ on
fish assemblages and various aspects of biology and ecology in the region including fishery
productivity. This FRDC project investigates recruitment processes, including spawning and
survivorship during the early life stages and how these processes relate to salinity, habitat availability
and water quality. The findings of this project will further complement the outcomes of the
CLLAMMecology research cluster which included habitat mapping/modelling, study of productivity
and tropho-dynamics, research into key species responses, and ecosystem modelling, as well as an
independent fish movement/migration project conducted by SARDI Aquatic Sciences. The overall
research program will provide a template for the development of other large-scale multidisciplinary
models for natural resource management, contributing with a range of outcomes directly related to
CLLAMM policies and implementation initiatives, such as: Significant Ecological Asset Management
Plan (Living Murray); Ramsar Plan - ecological character and wise use; and Murray-Darling Basin
Native Fish Strategy.
11

Ye et al. 2013 Flow related fish and fisheries ecology in the Coorong
4. Need The importance of quantitative assessment and linkage between freshwater flows and ecological
outcomes has been increasingly recognised in recent years. Information is particularly lacking for
estuarine fisheries in Australia. The CLLAMM region supports a significant local economy based on
irrigation/agriculture/tourism and commercial/recreational fisheries. The region also has a high
biodiversity value and is internationally recognised as a Ramsar wetland and Living Murray Icon Site.
However, the economy and biodiversity values of the region are under threat due to the reduction in
freshwater flows due to the over-exploitation and abstraction of freshwater resources in the Murray-
Darling Basin. While several environmental flow and engineering options are currently being considered
to help improve the social, economic and environmental values of the system including ecologically
sustainable fisheries, there is an inherent lack of biophysical and ecological knowledge required to
assess and predict the potential environmental benefits of the different management options.
From 2008 – 2010, the CLLAMMecology research cluster redressed some of the major knowledge gaps
on the hydrodynamics, biogeochemistry and ecology of the region. However, the influence of freshwater
flow on fish populations and subsequent productivity of commercial and recreational fisheries remains
poorly understood. Such information is critical for water management to enhance spawning/recruitment
of native fish (key objective of the Environmental Management Plan). In recent years,
State/Commonwealth policies to facilitate ecosystem-based, ecologically sustainable fisheries
management have been developed and implemented. While, the Lakes and Coorong Fishery
Management Plan identified freshwater flows to the estuary as an important issue impacting key
commercial/recreational species (A. hololepidotus, A. butcheri, R. tapirina, and M. ambigua), research
on specific flow/habitat requirements of these species is limited. Therefore, quantitative data on
ecological processes that influence the population dynamics (spawning, recruitment and biomass) is
needed to facilitate the sustainable management of fisheries and water resources.
This project aims to examine and describe the flow-related ecology of key fish species of
commercial/recreational/conservation or ecological significance (i.e. A. butcheri, R. tapirina, A. forsteri,
P. urvillii and A. tamarensis) in the Murray Estuary and Coorong. The lack of freshwater flows to the
system, precluded any in-situ investigation of ecological response to flow events in the Coorong.
However, this facilitated an investigation into the impact of ‘no flows’ on fish assemblages and various
aspects of biology and ecology in the region including reproduction, recruitment and fishery
productivity.
12

Ye et al. 2013 Flow related fish and fisheries ecology in the Coorong
5. Objectives 1. To determine the distribution, relative abundance and size structure of key fish species and how
these relate to habitat and environmental conditions (i.e. salinity, temperature) in the Murray
Estuary and Coorong.
2. To examine aspects of reproductive biology and influence of environmental conditions on
spawning success of key species in the region.
3. To investigate the influence of environmental conditions (i.e. salinity, temperature) on the
critical early life stages of key species.
4. To investigate the relationship between freshwater flows (timing, quantity and duration) and
recruitment success and fisheries production of key commercial species.
Five species were selected as key species:
• black bream (Acanthopagrus butcheri): a commercially important estuarine species.
• yelloweye mullet (Aldrichetta forsteri): a commercially important marine/estuarine-opportunist.
• greenback flounder (Rhombosolea tapirina): a commercially important estuarine and marine
species.
• Tamar goby (Afurcagobius tamarensis): an important trophic level small-bodied estuarine
species.
• congolli (Pseudaphritis urvillii): a conservation significant catadromous species.
Additional species of interest included:
• mulloway (Argyrosomus hololepidotus): a commercially important marine/estuarine opportunist.
• small mouthed hardyhead (Atherinosoma microstoma): an estuarine species.
13

Ye et al. 2013 Flow related fish and fisheries ecology in the Coorong
6. Methods
6.1 Study region
The Murray Mouth and Coorong region comprises a modified estuary and lagoon system situated
between the River Murray and lower lakes (Lakes Alexandrina and Albert) of the Murray-Darling Basin
and its opening to the sea (
Figure 6.1). The long (> 100 km), narrow and shallow (mean depth ≈ 2 m) Coorong lagoons extend
south-eastward from the Murray Mouth, running parallel to the South Australian coastline, and are
isolated from the South Ocean by the Younghusband Peninsula. The Coorong is divided into the North
and South Lagoons, which are connected by a very narrow channel at Parnka Point with adjacent
shallow sand bars.
Figure 6.1. Map showing the location of the Murray Mouth and Coorong region in relation to the Murray River and lower lakes (Lakes Alexandrina and Albert). Dashed lines indicate the Murray Mouth, North Lagoon and South Lagoon sub-regions. Inset map shows the locations of the five barrages (red lines) and the Murray Mouth within the Murray Mouth sub-region.
14

Ye et al. 2013 Flow related fish and fisheries ecology in the Coorong
A series of five barrages with a combined length of almost 8 km, separate the fresh water of the Lower
Lakes from the saline waters of the Coorong lagoons that exchange water with the sea through the
Murray Mouth. These barrages were constructed in the 1940s to maintain a freshwater reservoir in the
Lower Lakes and to prevent entry of saltwater. Through regulation of these barrages, the Murray Mouth
and Coorong periodically receive freshwater inflows when the water level of Lake Alexandrina exceeds
its full supply level at 0.75 m above sea level. However, over the past decade or so, the volume of fresh
water discharged across the barrages has substantially reduced to a fraction of previous volumes (Figure
6.2), mainly due to water extraction (predominantly used for irrigation purposes) and an extended
drought in the Murray-Darling Basin. Along with a reduction in discharge across the barrages is an
increase in the likelihood of closure of the Murray Mouth (Webster 2005). Ongoing dredging has been
necessary to keep the mouth open to the sea, and so over the recent low-flow period, the Murray Mouth
can be regarded as permanently open.
Figure 6.2: Average monthly flow volume across the barrages from January 1968 to October 2008 (source: MDBC 2008). Asterisk (*) indicates commencement of current study. 2nd Y-axis indicates the mean monthly water level (in metres Australian Height Datum, AHD) for Lake Alexandrina above Goolwa Barrage (source: DWLBC 2008).
The Murray Mouth and Coorong region has an estuarine influence, but it is not a typical estuary
(Geddes 2003). The dredging of the mouth and lack of freshwater input means the Murray Mouth and
Coorong is now effectively a tidal marine inlet with a reverse estuary influence. Salinity increases with
distance from the mouth, generally ranging between saline in the Murray Mouth and hypersaline in the
North and South Lagoons. With construction of the barrages, the ‘estuary’ was reduced to 11% of its
original size (Ferguson et al. 2008).
The region (including the Lower Lakes) is a Ramsar-listed Wetland of International Importance,
provides important habitat for several migratory waterbirds, is listed as one of six Significant Ecological
Assets in the Living Murray Initiative, and supports the multi-species Lakes and Coorong Fishery.
For the duration of this study (October 2006 to September 2008), the Murray-Darling Basin, including
the lower lakes, Murray Mouth and Coorong, experienced particularly dry weather and high evaporative
losses. As a result of these drought conditions, as well as ongoing water extraction along the length of
15

Ye et al. 2013 Flow related fish and fisheries ecology in the Coorong
the River Murray, the water level of Lake Alexandrina steadily declined and remained well below sea
level (Figure 6.2). At such low lake levels it is not possible to release freshwater and, consequently, the
Murray Mouth and Coorong region received no freshwater inflows between August 2006 and September
2010. The mean annual freshwater discharge at the barrages of the Lower Lakes during 2004-2008 was
only 176 GL yr-1, a small fraction of the previous five-year mean during 1999-2003 of ~1,500 GL yr-1
and the long-term mean during 1979-2003 of ~4,400 GL yr-1 .
6.2 Environmental characteristics
Information on the environmental characteristics of each study site was collected periodically
throughout the study period to examine the influence of environmental conditions on fish assemblage
structure and recruitment processes. On each sampling occasion, the water temperature, salinity,
dissolved oxygen and pH were measured at 30 cm beneath the water surface using a TPS water quality
meter (model 90FL), and a measure of transparency was obtained from a secchi disk depth measurement
(raw data are shown in Noell et al. (2009). The TPS meter was calibrated prior to each sampling
occasion. According to the manufacturer, salinity measurements are accurate between 0 ppt and 100 ppt
using the recommended standard solution of 36 ppt, however, we obtained an accuracy of -1.2% with a
known solution of 150 ppt.
6.3 Fish assemblages
Sampling regime
To examine and describe the fish assemblage composition in the Murray Mouth and Coorong region,
fish were collected from ten sites, on ten sampling occasions, at approximately three-monthly intervals
between October 2006 and September 2008. Of these sites, five were located near (within 15 km) the
Murray Mouth, three in the North Lagoon, and two in the South Lagoon (see Noell et al. (2009) for
detailed map and site details). Each site was sampled during the day with a 61 m long seine net (22 mm
mesh). Three replicate samples were conducted on each sampling occasion. Each replicate swept an area
of ~592 m2. In addition, several sites were also sampled using sinking composite gill nets. The results of
the gill net sampling are shown in Noell et al. (2009).
All fish collected were identified to species level and the total number of each species recorded. Each
species was categorised as marine straggler (S), marine estuarine-opportunist (O), solely estuarine (E),
estuarine and marine (E&M), catadromous (C) or freshwater (F), using the criteria of Potter and Hyndes
(1999). For the key species, the total length (TL) of each fish was measured to the nearest mm, except
when the number of individuals of a species was large, in which case the lengths of a random subsample
16

Ye et al. 2013 Flow related fish and fisheries ecology in the Coorong
of up to 100 fish were recorded. The total number of each fish species caught at each site by seine net
was adjusted to a density, i.e. number of fish 500 m-2 .
Data analyses
Multivariate analyses were performed to compare the composition of fish assemblages at each site in the
CLLAMM region. All multivariate analyses were performed using the PRIMER v6 package (Clarke and
Warwick, 2001). Detailed descriptions of the statistical procedures used are shown in Noell et al.
(2009).
6.4 Reproductive biology
Sampling regime
To examine the reproductive biology for each of the key species, fish were collected from the Murray
Mouth and Coorong region on 13 sampling occasions at approximately one-monthly intervals between
July 2007 and July 2008. A. butcheri, A. forsteri and R. tapirina were collected by commercial fishers,
using monofilament gill nets, with mesh sizes ranging from 2 to 6 inches. P. urvillii and A. tamarensis
were sampled using single winged (6 mm mesh) fyke nets by SARDI researchers. Fyke nets were set
overnight (~16 hours), and positioned with the wing facing the bank. The aim was to collect at least 30
fish per species per month, however low catch rates for some species limited sample sizes for some
months.
Sample processing and macroscopic analysis
Samples of adult fish for each species were processed in the laboratory. All fish were measured for total
length (TL) (to the nearest mm), weighed (to the nearest g), and dissected for the study of reproductive
biology within 24 hours of capture. For each fish the gonads were removed, sexed and weighed to 0.1 g.
Gonado-somatic indices (GSI) were calculated as:
GSI = [Wg/Wf]*100%
Where Wg = gonad weight, Wf = gonad-free fish weight.
Ovaries were classified macroscopically to one of five stages of development, based on size, colour and
visibility of oocytes (Fowler et al. 1999) (Table 6.1). Males were also staged macroscopically and
classified to one of three stages of development (Table 6.1).
In addition, from the fish collected for the macroscopic staging, a random sub-sample of ovaries was
collected monthly for each species for more detailed analysis by histological preparation and
microscopic examination. Histological sections of formalin preserved ovarian tissue were prepared and
examined following methods outlined in Fowler et al. (1999). The microscopic staging allowed the
spent/regressing stage to be separated based on presence/absence of post-ovulatory follicles and level of
17

Ye et al. 2013 Flow related fish and fisheries ecology in the Coorong
atresia. See Cheshire et al. (2013) for a detailed description of the microscopic characteristics of ovarian
tissue at each stage of development for each of the key species.
Table 6.1. Classification of development of ovaries and testes for macroscopic staging (after Fowler et al. 1999).
Gonad Stage Macroscopic characteristics
F1- Immature Ovaries small and undeveloped, clear or translucent showing little or no colouration
F2- Developing Ovaries small but larger F1 and become more orange/yellow/white (varies between species) no individual oocytes discernible.
F3- Developed Ovaries larger and turgid, yellow/orange in colour, individual oocytes discernible
F4- Hydrated Large ovaries, taking up a large space in gut cavity, with hydrated oocytes easily discernible.
F5- Regressing /Spent Ovaries are large, similar in size and colour to F2 stage, however more flaccid with a granular appearance.
M1- Immature Undeveloped testes usually dark in colour.
M2- Developing Developing testes whereby they are larger and become grey - white in colour but no milt present.
M3- Developed Developed testes that are large and white in colour and milt is present
Size at first maturity
The size at maturity was measured for females of all key species. Those individuals with ovaries
≥ stage 3 during spawning season were defined as mature. Logistic curves were fitted to describe the
percentage of mature male and females at TL using the non-linear least squares (NLIN) procedure in
SAS (Anon 1989) according to the equation:
100Pm = −k ( X −m)1+ e
Where, Pm is % maturity, X is the TL (mm), k is a constant describing how rapidly fish mature, and m is
the size at 50% maturity.
6.5 Salinity tolerance trials for key species
The influence of salinity on the behaviour and survival of key fish species in the Coorong and Murray
Mouth was investigated using controlled salinity trials. Key fish species trialled were Acanthopagrus
butcheri, Aldrichetta forsteri, Rhombosolea tapirina, Afurcagobius tamarensis, Pseudaphritis urvillii,
Argyrosomus hololepidotus and Atherinosoma microstoma.
18

Ye et al. 2013 Flow related fish and fisheries ecology in the Coorong
Experimental setup: slow acclimation tolerance trials
Juvenile fish of each species were collected from the Lower River Murray and Coorong, except for A.
hololepidotus juveniles, which were hatchery-reared (see McNeil et al. (2013) for size and weight
characteristics of fish considered). Once captured and transported back to the SARDI research facility at
West Beach, fish were transferred into 2000 L aquaria under controlled environment conditions. All fish
were quarantined and treated for potential disease as per Australian Pest and Veterinary Medicine
Authority permit no. 8853. Test fish were acclimated in sea water within experimental aquaria for at
least one week under experimental conditions prior to testing.
For each species, five fish were acclimated within three 20 L experimental aquaria and at the onset of
experimentation salinity was increased. Gradual acclimation style tolerance trials were conducted within
aquaria maintained at two test temperatures; 14 ºC (representative ‘winter’ temperature) and 23 ºC
(representative ‘summer’ temperature). At the onset of experiments, test aquaria were subjected to a
gradual increase in salinity at a rate of 2 ppt per day from an initial concentration of 35 ppt with the use
of Ocean Nature® or Sea-Chem® salt mixed with filtered seawater. Daily measurements of key water
quality parameters were recorded including dissolved oxygen, total dissolved solids (as a measure of
salinity), pH and temperature.
Experimental measurements were then recorded including: number of mortalities, number of fish
actively swimming, presence of any disease or health conditions and maintenance of equilibrium (i.e.
maintaining balanced position in the water). An index of feed acceptance and an index of visual stress
were also recorded daily. Finally, salinity was reset at the next incremental level within treatment tanks
(i.e. 2 ppt higher than the previous day).
Throughout acclimation and trials, a light:dark ratio approximating 12:12 hrs was used. Fish were fed
daily with a varied diet of frozen bloodworm, frozen brine shrimp (Artemia sp.), live brine shrimp, and
1mm or 5/8 proton aquaculture pellet. Diet was dependant on species specific acceptance of these foods.
Behavioural observations
Daily assessment of fish behaviour via observation was performed prior to resetting of salinity to inform
and complement the measurement of lethal threshold and provided insight into some of the potential
sub-lethal thresholds that indicate physiological impact prior to lethality. Daily behaviour measurements
relating to stress and diminished feeding activity were taken based on Nominal Keys (Table 6.2 and
Table 6.3) and used to calculate Daily Feeding Response Scores (DFRS) and Stress Scores (SS). These
were made by the same researcher to minimise experimental variation in observational scoring.
19

5
4
3
2
1
0
Ye et al. 2013 Flow related fish and fisheries ecology in the Coorong
Table 6.2. Nominal Key used to score observed feeding response during trials.
Daily Feeding Response Score (DFRS)
High response Feeding eagerly at surface, feed not reaching floor of tank.
Medium high
response Some feed reaching floor of tank, but consumed within 5mins.
Medium response Most feed reaching floor of tank, but consumed within half an hour.
Medium low response Feed reaching floor of tank, more than half consumed within half an hour.
Low response Feed reaching floor of tank, less than half consumed within half an hour.
No response Feed not consumed, little interest in feeding observed.
Table 6.3. Nominal Key used to score observations of stress during trials.
Stress Score (SS)
5 High stress Dark obvious banding increased opercula pumping and constant hiding.
Dark obvious banding, slightly increased opercula pumping and hiding majority of
4 Medium high stress time.
3 Medium stress Some dark banding, often accompanied by hiding.
2 Medium low stress Faint banding, some hiding from movement.
1 Low stress No banding, some hiding from movement.
0 No stress Little flight response, swimming at front of tank in anticipation of feeding.
Data analysis and threshold determination
The survival (%) of test fish under gradually increasing salinity was estimated daily for each trial.
Results from the three replicate trials for each species were then analysed using Probit analysis to give a
species Lethal Concentration (LC) value. LC values were estimated for levels of salinity that were lethal
for 10% (LC10), 50% (LC50) and 90% (LC90) of test fish. For A. microstoma the LC10, LC50, and LC90
values were estimated from data reported in Lui (1969) due to the low number of fish available. Probit
analyses were carried out using SPSS Version 16.0 and StatsDirect Version 2.6.2. Salinity concentration
(ppt) was log10 transformed for analysis.
Spatial and temporal abundance data for each of the selected species and field salinity data (parts per
thousand, ppt) were adopted from the concurrent study described in Section 7.2. Abundances of each
species were overlaid as bubbles onto contour salinity graphs and presented through time with
increasing distance from the Murray Mouth. LC50 estimates at 14 °C and 23 °C were applied as a
threshold of expected field distribution.
20

Ye et al. 2013 Flow related fish and fisheries ecology in the Coorong
6.6 Influence of freshwater flows on fishery production for key species
The Lakes and Coorong Fishery is a multi-species, multi-gear commercial fishery. The four most
important species, in terms of landings and value, are Acanthopagrus butcheri, Rhombosolea tapirina,
Argyrosomus hololepidotus and Aldrichetta forsteri. Since July 1984, licence holders of the Lakes and
Coorong Fishery have been required to submit catch and effort returns to the South Australian
Government at the end of each month which indicates the target species, the gear types used and the
fishing area (FA) where fishing was done (Figure 6.3). The availability of this long uninterrupted time
series of data, along with a corresponding time series of flow data (also provided by the Government),
provided the opportunity to use time series modelling techniques to investigate the relationships between
freshwater inflows and the production of these key species.
The basic working objective of this fishery-dependent study was to identify and characterise
relationships between freshwater inflows and production of the key species in the Lakes and Coorong
Fishery using time series analysis. Specifically, it is expected that flow has a positive influence on
spawning aggregations of A. hololepidotus (Ferguson and Ward 2003; Hall 1984), a positive influence
on recruitment of A. forsteri (Pellizzari 2002), A. hololepidotus (Ferguson et al. 2008) and R. tapirina
(Hall 1984), a negative influence on recruitment of A. butcheri (Hobday and Moran 1983; Morison et al.
1998), and these influences are reflected in catches of these species.
For this component of the project, the study region comprised the waters inside the Murray Mouth, the
North and South Lagoons of the Coorong, and the waters outside the Murray Mouth, which extend for
~180 km along the coastline (Figure 6.1). It encompasses the saltwater part of the Lakes and Coorong
Fishery, which is separated by the barrages from the freshwater part of the fishery, Lakes Alexandrina
and Albert. The saltwater part of the fishery was divided into four subregions, each of which comprise
two or three FA (i.e. the Murray Mouth comprises FA 6-8, the North Lagoon comprises FA 9-11, the
South Lagoon comprises FA 12-14, and the coastal waters outside the Murray Mouth comprise FA 15
and 16) (Figure 6.3).
21

Ye et al. 2013 Flow related fish and fisheries ecology in the Coorong
Figure 6.3. Map showing the location of the Murray Mouth (fishing areas 6-8), North Lagoon (9-11), South Lagoon (1214), and coastal waters (outside the Murray Mouth) (15-16) subregions of the Lakes and Coorong Fishery.
22

Ye et al. 2013 Flow related fish and fisheries ecology in the Coorong
7. Results
7.1 Environmental characteristics
Water temperature
A seasonal cycle was clearly evident for water temperature across the region, with similar mean
temperatures recorded in each subregion in most months (Figure 7.1). Mean monthly water temperatures
fell from a maximum of ~23 °C in December 2006 to a minimum of ~11 °C in June 2007, and then rose
to at least 25 °C in December 2007 before dropping again to ~14 °C in June 2008. The lowest and
highest mean monthly water temperatures of 11.2 and 27.2 °C were recorded in the South Lagoon in
June and December 2007, respectively.
Salinity
Mean salinities for each subregion differed on each sampling occasion; salinities were always lowest in
the Murray Mouth and highest in the South Lagoon (Figure 7.1). Mean monthly salinities ranged
between ~30 and ~43 ppt in the Murray Mouth, 61 and ~86 ppt in the North Lagoon, and ~105 and ~164
ppt in the South Lagoon. No obvious temporal pattern in mean monthly salinities occurred for either the
Murray Mouth or North Lagoon, but sharp peaks in salinity occurred in the South Lagoon around
March. Mean salinities at each site generally increased with increasing distance from the mouth, from
35.5 ppt at M1 to 125.1 ppt at Jack Point in the South Lagoon.
Dissolved oxygen
Dissolved oxygen concentrations generally followed similar trends in the Murray Mouth and North
Lagoon, with higher concentrations recorded in the North Lagoon on most occasions (Figure 7.1). Thus,
mean monthly dissolved oxygen concentrations in these two subregions rose from 6.4-7.6 ppM in
December 2006 to 9.8-13.1 ppM in June 2007, and then declined to 6.0-7.5 ppM in March 2008 before
rising again to 12.4-13.2 ppM in September 2008. In the South Lagoon, mean monthly dissolved oxygen
concentrations appeared to peak between September and December, however, measurements were
highly variable in this subregion.
pH
Mean monthly pH values were lower in the South Lagoon than in the other two subregions except on
two occasions (in December 2006 and September 2008), when the trend was reversed (Figure 7.1). Both
the lowest and highest pH of 7.8 and 8.5 were recorded in the South Lagoon, in October 2006 and
September 2007, respectively, while pH values in the Murray Mouth and North Lagoon usually
fluctuated between ~8.2 and 8.4.
23

Turbidity
In most months, water transparency generally decreased (= increase in turbidity) with distance from the
mouth, as indicated by secchi disk depth measurements (Figure 7.1). Examination of mean secchi disk
depth measurements at each site showed that a steep decline in water transparency occurs between
Pelican Point in the Murray Mouth subregion (1.45 m) and the South end of the North Lagoon (0.44 m).
(ppt
)
Ye et al. 2013 Flow related fish and fisheries ecology in the Coorong
Figure 7.1. Mean values ± 1 S.E. for water temperature, salinity, dissolved oxygen, pH and secchi depth for subregions on each sampling occasion (sites pooled, left graphs) and for each site (sampling occasions pooled, right graphs: see Noell et al. (2009) for map showing location of individual sites) within the Murray Mouth and Coorong region between October 2006 and September 2008.
24

Ye et al. 2013 Flow related fish and fisheries ecology in the Coorong
7.2 Fish assemblage structure and composition
A total of 78,754 fish representing 26 species were caught using the seine net throughout the Murray
Mouth and Coorong region between October 2006 and September 2008 (Table 7.1). A. microstoma was
by far the most abundant species, contributing 60.5% to the total number of fish collected using this
method. The second most abundant species, A. forsteri, contributed 16.5% to the total number, while the
third most abundant, Hyperlophus vittatus, contributed 15.6%. These three species collectively
accounted for 92.5% of the total catch using the seine net.
All 26 fish species collected were recorded from the Murray Mouth subregion, while 13 were recorded
in the North Lagoon, and only 1 species, A. microstoma, was found in the South Lagoon (Table 7.1).
The five most abundant species in the Murray Mouth subregion were H. vittatus (38.0% contribution to
total abundance), A. forsteri (34.5%), A. microstoma (10.1%), A. truttaceus (6.6%), and G. maculatus
(3.4%). In contrast, the North Lagoon was dominated by A. microstoma (91.8%), with relatively small
contributions by A. forsteri (5.3%) and H. vittatus (1.6%), and minor contributions by the pleuronectid
R. tapirina (0.5%) (Table 7.1). Despite the low species diversity in the North Lagoon, a greater total
number of fish were collected from that subregion due to the high abundances of A. microstoma in that
subregion. In addition, a site-specific breakdown of species richness along the longitudinal gradient of
the estuarine system showed a general decline in diversity with distance from the Murray Mouth (Figure
7.2). The assemblage structure for each sampling site is described in more detail in Noell et al. (2009).
The vast majority of the total number of fish across the region was made up by solely-estuarine (61.8%)
and estuarine-opportunist species (35.4%). The estuarine-opportunists were more abundant in the
Murray Mouth (80.4%), while solely-estuarine species were dominant in the North (92.1%) and South
Lagoons (100%).
25

Ye et al. 2013 Flow related fish and fisheries ecology in the Coorong
Table 7.1.Life-cycle category, ranking by abundance (R), relative abundance (n), and percentage contribution (%) of each fish species in the Murray Mouth, North Lagoon and South Lagoon subregions, derived from seine net samples collected at all sites between October 2006 and September 2008. Mean lengths and length ranges for key species are also given. Numbers were calculated after seine net samples were adjusted to no. fish 500 m-2 and then summed.
Life Total region Murray Mouth North Lagoon South Lagoon Mean Length Species length range cycle R n % R n % R n % R n % (mm) (mm) Atherinosoma microstoma E 1 40216 60.5 3 2587 10.1 1 35964 91.8 1 1666 100.0 53 17-91 Aldrichetta forsteri O 2 10959 16.5 2 8867 34.5 2 2092 5.3 73 26-308 Hyperlophus vittatus O 3 10370 15.6 1 9748 38.0 3 622 1.6 Arripis truttaceus O 4 1780 2.7 4 1694 6.6 6 86 0.2 Galaxias maculatus C 5 866 1.3 5 866 3.4 Hyporhamphus regularis E 6 494 0.7 6 474 1.8 8 20 <0.1 Rhombosolea tapirina E&M 7 470 0.7 7 286 1.1 4 183 0.5 66 18-355 Afurcagobius tamarensis E 8 316 0.5 10 215 0.8 5 101 0.3 46 20-77 Ammotretis rostratus O 9 285 0.4 11 205 0.8 7 80 0.2 Engraulis australis E&M 10 252 0.4 9 236 0.9 9 15 <0.1 Family Tetraodontidae E&M 11 242 0.4 8 240 0.9 12 2 <0.1 Arripis georgianus O 12 69 0.1 12 68 0.3 13 1 <0.1 Argyrosomus hololepidotus O 13 49 <0.1 13 49 0.2 193 128-380 Tasmanogobius lasti E 14 45 <0.1 14 39 0.2 10 6 <0.1 Arenigobius bifrenatus E&M 15 34 <0.1 15 34 0.1 Acanthopagrus butcheri E 16 25 <0.1 16 25 <0.1 269 105-484 Hyporhamphus melanochir E&M 17 15 <0.1 17 15 <0.1 Pseudaphritis urvillii C 18 9 <0.1 18 7 <0.1 11 3 <0.1 131 40-230 Pseudogobius olorum E =19 5 <0.1 =19 5 <0.1 Gymnapistes marmoratus O =19 5 <0.1 =19 5 <0.1 Nematalosa erebi F 21 3 <0.1 21 3 <0.1 Sardinops neopilchardus S =22 2 <0.1 =22 2 <0.1 Liza argentea E&M =22 2 <0.1 =22 2 <0.1 Retropinna semoni F =24 1 <0.1 =24 1 <0.1 Heteroclinus heptaeolus O =24 1 <0.1 =24 1 <0.1 Myliobatis australis O =24 1 <0.1 =24 1 <0.1 Total number of species 26 26 13 1 Total number of fish 66515 25676 39174 1666
26

Ye et al. 2013 Flow related fish and fisheries ecology in the Coorong
Classification of fish assemblages: spatial variation
Classification of the mean densities of each fish species collected using a seine net at each site (10) on
each sampling occasion (10) demonstrated evidence of structure among the 100 samples. Using the
SIMPROF procedure, each sample (made up of three replicate samples) was allocated to one of six
‘similar profile’ groups on the basis that it had significantly similar internal structure, i.e. samples within
the same group share a similar fish assemblage pattern (Figure 7.2). These groupings are significant (P <
0.05) at a similarity of at least 48%.
In general, these similarity profile groups were dominated (>77%) by samples collected from sites
within the same subregion, which suggests that some overall fish assemblage pattern exists throughout
the Murray Mouth and Coorong region (Figure 7.2). Furthermore, ANOSIM demonstrated that highly
significant differences were found in the composition of samples between subregions (Global R-statistic
= 0.626, P < 0.001). All three subregions were highly significantly different from one another (Murray
Mouth vs. South Lagoon: R-statistic = 0.958; Murray Mouth vs. North Lagoon: 0.520; North Lagoon vs.
South Lagoon: 0.315). No significant differences were found between years or seasons. Detailed results
of the ANOSOM are shown in Noell et al. (2009).
Ordination using non-metric multidimensional scaling (MDS) is comparable to the results of
classification and ANOSIM (Figure 7.3). Thus, all samples collected from the Murray Mouth are
distinctly separate from all samples taken from the South Lagoon, while North Lagoon samples are
either interspersed with samples from one of the other subregions. Also shown are the groups of samples
with similar assemblage structure (at similarity boundaries of 48%).
Specific differences between the groups of samples identified using classification; ANOSIM and
ordination were identified using SIMPER. The fish assemblages of the Murray Mouth subregion
contained relatively lower numbers of A. microstoma and higher numbers of A. forsteri and A. truttaceus
than the North Lagoon, which collectively accounted for almost half (48.6%) of the dissimilarity
between the two subregions (Table 7.2). Differences in assemblage structure between the North and
South Lagoon were attributed mainly to A. microstoma (57.0% dissimilarity) being present at much
higher densities in the North Lagoon. The dissimilarity between the Murray Mouth and South Lagoon
assemblages can be attributed to all species present having a relatively greater abundance in the Murray
Mouth.
27

Ye et al. 2013 Flow related fish and fisheries ecology in the Coorong
Figure 7.2. Dendrogram of the species abundance data for all 100 seine net samples (10 sites × 10 sampling occasions) collected from the Murray Mouth, North Lagoon and South Lagoon subregions between October 2006 and September 2008. Classification of samples was carried out using group average clustering from Bray-Curtis similarities (including a dummy variable) on fourth-root transformed data. The six similarity profile groups (Groups IS-VIS) are indicated by the vertical branches with arrowheads that bisect the 48% similarity threshold.
28

Ye et al. 2013 Flow related fish and fisheries ecology in the Coorong
Figure 7.3. MDS ordination of the species abundance data for all 100 seine net samples (10 sites × 10 sampling occasions) collected from the Murray Mouth, North Lagoon and South Lagoon subregions between October 2006 and September 2008. Boundaries indicate the six similarity profile groups (Groups IS-VIS) at similarity levels of 48%. Stress = 0.14.
Table 7.2. SIMPER results indicating which species contributed most to the overall dissimilarity between significantly different subregions (from ANOSIM) derived from seine net samples collected at all sites between October 2006 and September 2008. Consistency ratio (CR) is the ratio of the mean to standard deviation of the dissimilarities between groups, with larger values indicating greater consistency. A cumulative cut-off of 75% was applied. Note that non-transformed mean abundances are presented to aid interpretation.
29
Species Mean abundance (no. fish 500 m-2)
CR Contrib.
% Cumul.
% M. Mouth vs. N. Lagoon: mean dissimilarity = 71.2% M. Mouth N. Lagoon
Atherinosoma microstoma 17.2 399.6 1.3 21.1 21.1 Aldrichetta forsteri 59.1 23.2 1.3 16.7 37.8
Arripis truttaceus 11.3 1.0 1.2 10.8 48.6 Hyperlophus vittatus 65.0 6.9 1.0 10.1 58.7
Rhombosolea tapirina 1.9 2.0 1.2 7.1 65.8 Hyporhamphus regularis 3.2 0.2 1.0 6.4 72.2
Tetraodontidae 1.6 <0.1 1.1 6.4 78.7 M. Mouth vs. S. Lagoon: mean dissimilarity = 91.1% M. Mouth S. Lagoon Aldrichetta forsteri 59.1 0.0 2.0 22.6 22.6
Arripis truttaceus 11.3 0.0 1.3 12.8 35.5 Atherinosoma microstoma 17.2 27.8 1.2 11.5 46.9
Hyperlophus vittatus 65.0 0.0 0.9 9.8 56.7 Rhombosolea tapirina 3.2 0.0 1.6 9.4 66.2
Tetraodontidae 1.6 0.0 1.1 7.2 73.3 Hyporhamphus regularis 3.2 0.0 1.0 7.1 80.4
N. Lagoon vs. S. Lagoon: mean dissimilarity = 75.8% N. Lagoon S. Lagoon
Atherinosoma microstoma 399.6 27.8 1.3 57.0 57.0 Aldrichetta forsteri 23.2 0.0 0.8 11.4 68.4
Rhombosolea tapirina 0.2 0.0 0.6 10.1 78.5

Ye et al. 2013 Flow related fish and fisheries ecology in the Coorong
Link between salinity and fish assemblages
Despite the availability of up to five water quality variables to potentially explain the observed fish
assemblages across the region, salinity alone was the best explanatory variable of all possible
combinations of variables for seine net samples. The correlation (rho-statistic, ρ = 0.676) between the
salinity data and species abundance data was highly significant (P < 0.001).
The salinity ranges of the key study species were examined based on water quality measurements taken
at the same time as seine net samples (Table 7.3). The two most abundant species were both euryhaline,
occurring at various times at almost all sites in the Murray Mouth and North Lagoon subregions, in
salinities ranging from brackish to hypersaline (i.e. 12.9 to 55 ppt and greater). A. microstoma, the only
species found in the South Lagoon, demonstrated a very high salt tolerance, occurring at extreme hyper-
salinities up to 133.5 ppt.
Table 7.3. Salinity ranges of the key species (R, overall abundance rank) collected using a seine net between October 2006 and September 2008. The occurrence and mean density x of these species at each site (no. fish 500 m-2) is also indicated by shading: (blank) x = 0; 0 < x ≤ 1; 1 < x ≤ 10; 10 < x ≤ 100; 100 < x ≤ 1000; x > 1000.
Salinity (ppt) Density Species R
Min. Max. M1 M2 M3 M4 M5 N1 N2 N3 S1 S2 A. microstoma 1 12.9 133.5 A. forsteri 2 12.9 74.1 R. tapirina 7 12.9 74.1 A. tamarensis 8 12.9 60.1 A. hololepidotus 13 28.0 43.0 A. butcheri 16 30.3 42.2 P. urvillii 18 38.6 62.4
Length-frequency distributions of key species
In addition to describing the composition of fish assemblages, length frequency distributions for key
species were developed to gain more detailed information with respect to the utilisation of the region by
particular life stages of these species. The length data shown were obtained from both seine and gill net
samples. If it is assumed that for a particular species, both methods collectively sampled most size
classes of its population, then length-frequency data for that species enable the identification of cohorts,
an estimation of the timing and duration of these cohorts in the region, and the modal progression (or
growth) of cohorts to be traced with successive samples.
A. microstoma had a TL range of 17-91 mm. In October 2006, the size distribution comprised a single
dominant cohort. There is evidence of a second cohort emerging in November/December 2006 which
was subsequently evident in March, June, September and December 2006. In December 2007, the
smallest length classes (15-20 and 20-25 mm) began to appear again and grow through March, June and
September 2008 (see Noell et al. (2009) for size structures).
A. forsteri had a TL range of 26-375 mm. Three or four cohorts were clearly identifiable in most months
(Figure 7.4). It appears that A. forsteri spawn between February and early April, consistent with Harris
30

Ye et al. 2013 Flow related fish and fisheries ecology in the Coorong
(1968). The modal progression of these cohorts (year classes) to March 2007 and March 2008 suggests
that this species attains growth of approximately 120-130, 240, and 290 mm TL in its first, second and
third years of life, respectively.
R. tapirina had a TL range of 18-355 mm TL across all samples. Most length frequencies derived from
samples collected between October 2006 and March 2007 were dominated by a single cohort, with a
length range of 18 to ~110 mm TL. It is assumed that most, if not all, of these fish originated from the
most recent spawning season during the winter months June to August 2006. The growth of this winter
cohort is evident in consecutive samples of December and March, with a modal progression from 40-50
to 70-80 mm TL during these months. Catches of R. tapirina larger than 150 mm TL were small and
sporadic, which suggests these larger fish have low catchability using either seine or gill nets (see Noell
et al. (2009) for size structures).
A. tamarensis had a TL range of 20-77 mm. Following an estimated spawning period of October to
January (based on gonadosomatic data), the smallest size class of 20-25 mm TL began to appear in
March and June 2007 and again in June 2008. Although somewhat unclear, there is evidence of modal
progression of three different cohorts between October and November 2006, March and September
2007, and June and September 2008 (see Noell et al. (2009) for size structures).
A. hololepidotus ranged in TL from 128-710 mm (Figure 7.5). Although a few of these fish reached up
to 710 mm TL, most were within the length range of 180-500 mm TL. The progression of a single mode
can be traced from December 2006 (modal length class of 180-200 mm TL) to March 2008 (~400 mm
TL). This cohort represents the 2005/06 year class from the November-March spawning period
(Ferguson et al. 2008). On either side of this cohort there is evidence of an older (2004/05) year class,
between November 2006 and March 2007, and younger (2006/07) year class, between December 2007
and June 2008.
Small juvenile (100-150 mm TL) A. butcheri were found each year (i.e. December 2006, September
2007 and September 2008), which indicates that recruitment of this species occurred each year.
However, the wide length ranges for A. butcheri and P. urvillii in this study (105-484 and 40-265 mm
TL, respectively) and the small numbers collected using either gear type meant that few conclusions can
be drawn for either species with respect to relative success in spawning or recruitment (see Noell et al.
(2009) for size structures).
31

Ye et al. 2013 Flow related fish and fisheries ecology in the Coorong
Figure 7.4. Length-frequency histograms for A. forsteri collected from the Murray Mouth and Coorong region between October 2006 and September 2008 using seine and gill nets (black and white bars, respectively). Dashed lines indicate modal progression of probable year classes. nS = number of fish collected using seine net, nG = number of fish collected using gill nets. Percentages in parentheses indicate that a subsample was measured.
32

Ye et al. 2013 Flow related fish and fisheries ecology in the Coorong
Figure 7.5. Length-frequency histograms for A. hololepidotus from the Murray Mouth and Coorong region between October 2006 and September 2008 using seine and gill nets (black and white bars, respectively). Dashed lines indicate modal progression of probable year classes. nS = number of fish collected using seine net, nG = number of fish collected using gill nets. Percentages in parentheses indicate that a subsample was measured.
7.3 Reproductive characteristics of key species
Black bream (Acanthopagrus butcheri)
The catch of A. butcheri in the Coorong and Murray Mouth region was consistently dominated by
female fish throughout the study period. While males were also captured, they were present in very low
numbers in most months and absent from catches in December, January and July 2008. See Cheshire et
al. (2013) for monthly sex ratios.
The monthly GSI for female A. butcheri increased from August to November in 2007, suggesting a
spring spawning season in the Coorong and Murray Mouth region. Increasing female GSI followed the
increase in water temperature early in the season (Figure 7.6a), before dropping substantially in
33

Ye et al. 2013 Flow related fish and fisheries ecology in the Coorong
December 2007 and remaining low for the rest of the sampling period. GSI for males followed a similar
pattern to females, increasing from July to November (Figure 7.6b). GSI was highest in males between
July and February, although given the relatively small sample size and absence of male fish in
December and January; this should be treated with caution.
Mature females (≥ stage 3) were present in samples throughout the sampling period, with the exception
of March to May 2006, when no females were collected (Figure 7.7). In July 2007, the majority of
females had ripe (stage 4) ovaries, whilst a small percentage (>20%) had developed (stage 3) ovaries.
From August to November 2007, the stages varied between developed and ripe. By December only one
female was collected, which was at the ripe stage (stage 4). During January and February only resting
and developed stage (stage 2 and 3) ovaries were recorded. In June and July 2008, a small number of
females were collected, with ovaries being at stages 2 or 3. No spent (stage 5) ovaries were recorded
throughout the study period (Figure 7.7).
Half of the population of female A. butcheri within the Coorong area were sexually mature at
289 mm TL, whilst the smallest mature female was 270 mm TL (Table 7.4). Half of all males were
sexually mature at ≥ 340 mm TL, the smallest mature male was 251 mm TL. Specific parameter
estimates for the logistic maturity curves are provided in Cheshire et al. (2013).
Figure 7.6. Temporal trends in GSI (± s.e.) (dotted line) for a) female (n = 91) and b) male (n= 39) A. butcheri in the Coorong from July 2007 to July 2008. Solid black line is mean monthly temperature.
34

Ye et al. 2013 Flow related fish and fisheries ecology in the Coorong
Figure 7.7. Temporal trends in macroscopic stages of gonad development (frequency %) for female A. butcheri in the Coorong from July 2007 to July 2008. (n = 91).
Table 7.4. Summary of the parameter estimates for the logistic length at maturity curves for each of the key species.
Species Sex n L50 SE 95%CL K SE 95%CL R2
A. butcheri F 271 289 2.48 284 – 294 0.06 0.008 0.04 – 0.08 0.05
M 148 340 11.03 316 – 364 0.02 0.004 0.01 – 0.03 0.16
A. forsteri F 691 256 2.84 250 – 262 0.04 0.005 0.03 – 0.05 0.17
R. tapirina F 219 203 4.83 192 – 214 0.1 0.048 0.02 – 0.21 0.06
A. tamarensis F 348 53 1.74 49 – 57 0.15 0.034 0.07 – 0.22 0.18
P. urvillii F 86 165 1.09 162 - 167 0.13 0.016 0.09 – 0.16 0.02
Yelloweye mullet (Aldrichetta forsteri)
The monthly catches of A. forsteri in the Coorong and Murray Mouth region during 2007 and 2008 were
typically dominated by female fish. One exception occurred in November 2007, during which time the
sample consisted predominantly of male fish. See Cheshire et al. (2013) for monthly sex ratios.
GSI for female A. forsteri remained high throughout most months except for the period of October-
December (Figure 7.8a), and GSI for males followed an almost identical pattern to the females (Figure
7.8b). This suggests that A. forsteri has a protracted spawning season across summer/autumn/winter in
the Murray Estuary and Coorong.
35

Ye et al. 2013 Flow related fish and fisheries ecology in the Coorong
Figure 7.8. Temporal trends in GSI (± s.e.) (dotted line) for a) female (n = 479) and b) male (n = 125) A. forsteri in the Coorong from July 2007 to July 2008. Solid black line is mean monthly temperature.
Females with developed, hydrated, spent or regressing ovaries (≥ stage 3) were collected throughout the
sampling period, although no samples were collected in March and June 2008, and only one female was
collected in November 2007 (Figure 7.9). Patterns of ovarian development indicated an extended
spawning period of A. forsteri with no distinct seasonality.
Half the population of female A. forsteri were sexually mature at the size ≥ 256 mm TL, the smallest
mature individual was of 226 mm TL (Table 7.4). Insufficient numbers of mature males were collected
to estimate size at maturity. The smallest mature male was 220 mm TL.
36

Ye et al. 2013 Flow related fish and fisheries ecology in the Coorong
Figure 7.9. Temporal trends in macroscopic stages of gonad development (frequency %) for female A. forsteri in the Coorong from July 2007 to July 2008 (n = 479).
Greenback flounder (Rhombosolea tapirina)
The catch of R. tapirina from the Coorong and Murray Mouth region during 2007 and 2008 was
dominated by female fish. Only three males were collected throughout the entire sampling period. See
Cheshire et al. (2013) for monthly sex ratios.
GSI for female R. tapirina was highest in July 2007 and decreased gradually in the following months
(Figure 7.10a). This temporal trend coincided with increasing water temperatures, and suggests that R.
tapirina in the Coorong and Murray Mouth region is a winter spawner (Figure 7.10a). Female GSI was
lowest from November to February, i.e. during the summer months when water temperatures were
highest. GSI for males cannot be extrapolated to spawning season as only one individual was collected
on three occasions (Figure 7.10b).
Temporal trends in macroscopic staging for female R. tapirina suggests that spawning condition was
reached (stage 4) and that spawning had occurred (stage 5) during August and September 2007 (Figure
7.11). Following this period, mature ovaries returned to a resting state (stage 3) and immature and
developing (stage 1 and 2) ovaries were recorded from November 2007. Regressing (stage 5) ovaries
were identified in January; unfortunately no samples were collected between March and May 2008; and
fish appeared to be returning to spawning condition in June 2008. These results are generally consistent
with the temporal patterns of variation in female GSI.
37

Ye et al. 2013 Flow related fish and fisheries ecology in the Coorong
Figure 7.10. Temporal trends in GSI (± s.e.) (dotted line) for a) female (n = 105) and b) male (n = 3) R. tapirina in the Coorong from July 2007 to July 2008. Solid black line is mean monthly temperature
Figure 7.11. Temporal trends in macroscopic stages of gonad development (frequency %) for female R. tapirina in the Coorong from July 2007 to July 2008. (n = 105)
38

Ye et al. 2013 Flow related fish and fisheries ecology in the Coorong
Half the female population of R. tapirina within the Coorong area were sexually mature at ≥ 203 mm,
whilst the smallest mature individual recorded was 211 mm TL (Table 7.4). Insufficient numbers of
mature males were collected to develop a model to estimate size at 50% maturity.
Tamar goby (Afurcagobius tamarensis)
Catches of A. tamarensis from the Coorong and Murray Mouth region were dominated by females in
most months, although sex ratios (female: male) approximated 1:1 during December 2007 and April and
May 2008. Males were present throughout most of the season, although in low proportions. See
Cheshire et al. (2013) for monthly sex ratios.
Female GSI for A. tamarensis appeared to be high between October and February, generally coinciding
with the warmer temperatures (Figure 7.12a), suggesting a spring/summer spawning period. Female GSI
declined to the lowest during April and May 2008 (Figure 7.12a). Variation in male GSI followed a
slightly different pattern to the females, peaking in November 2007 (Figure 7.12b).
Mature female (≥ stage 3) A. tamarensis were present in the estuarine system throughout the study
period. Ripe females (stage 4) were recorded in low numbers from August 2007 through to January
2008 suggesting a spring/summer spawning season (Figure 7.13). No regressing (stage 5) ovaries were
recorded throughout the sampling period. Immature fish (stage 1) were recorded periodically between
October 2007 and July 2008, and formed a large proportion of the females surveyed in April 2008. The
spawning period identified by ovarian development is generally consistent with that shown in female
GSI patterns
Female A. tamarensis within the Coorong area had reached 50% sexual maturity at 53 mm TL, whilst
the smallest mature female collected was 45 mm TL (Table 7.4). There were insufficient numbers of
mature males collected to develop a model to estimate size at 50% maturity, however, the smallest
mature male collected was 65 mm TL.
Congolli (Pseudaphritis urvillii)
The catch of P. urvillii was dominated by females in all months throughout the sampling season, with
the highest percentage of males recorded in May 2008 (approximately 40%). See Cheshire et al. (2013)
for monthly sex ratios.
The temporal variation in female GSI for P. urvillii indicated that GSI was highest from July to
September 2007 (Figure 7.14). Female GSI was low throughout the rest of the season under high
temperatures during summer and appeared to rise again in May 2008 as water temperatures decreased
(Figure 7.14a). Male GSI followed similar patterns as the females, although due to smaller sample sizes
and absence of males in some months, this should be interpreted cautiously (Figure 7.14b).
39

Ye et al. 2013 Flow related fish and fisheries ecology in the Coorong
Figure 7.12. Temporal trends in GSI (± s.e.) (dotted line) for a) female (n = 420) and b) male (n = 137) A. tamarensis the Coorong from July 2007 to July 2008. Solid black line is mean monthly temperature
Figure 7.13. Temporal trends in macroscopic stages of gonad development (frequency %) for female A. tamarensis in the Coorong from July 2007 to July 2008. (n = 420).
40

Ye et al. 2013 Flow related fish and fisheries ecology in the Coorong
Mature female (≥ stage 3) P. urvillii were only recorded from July to September 2007, and in April,
June and July 2008. From October 2007 to March 2008, only immature and developing ovaries were
recorded (Figure 7.15). During July to September 2007 the majority of females collected had developed
ovaries. However, no ripe (stage 4) or spent (stage 5) ovaries were recorded. This pattern was consistent
with the GSI for females and suggests a winter spawning period for P. urvillii.
Figure 7.14. Temporal trends in GSI (± s.e.) (dotted line) for a) female (n = 364) and b) male (n = 48) P. urvillii in the Coorong from July 2007 to July 2008. Solid black line is mean monthly temperature
41

Ye et al. 2013 Flow related fish and fisheries ecology in the Coorong
Figure 7.15. Temporal trends in macroscopic stages of gonad development (frequency %) for female P. urvillii in the Coorong from July 2007 to July 2008. (n = 364).
On average, female P. urvillii were sexually mature at 165 mm TL, the same size of the smallest mature
female collected (Table 7.4). There were insufficient numbers of mature males collected to develop a
model to estimate size at 50% maturity; the smallest male collected was 103 mm.
Spawning modes
Determination of spawning mode required a comprehensive analysis of the microscopic characteristics
of ovaries for individual species. All species were classified as multiple batch spawners (i.e. they release
batches of oocytes (eggs) on multiple occasions over a prolonged reproductive period). Full
descriptions, including photographs are shown in Cheshire et al. (2013).
42
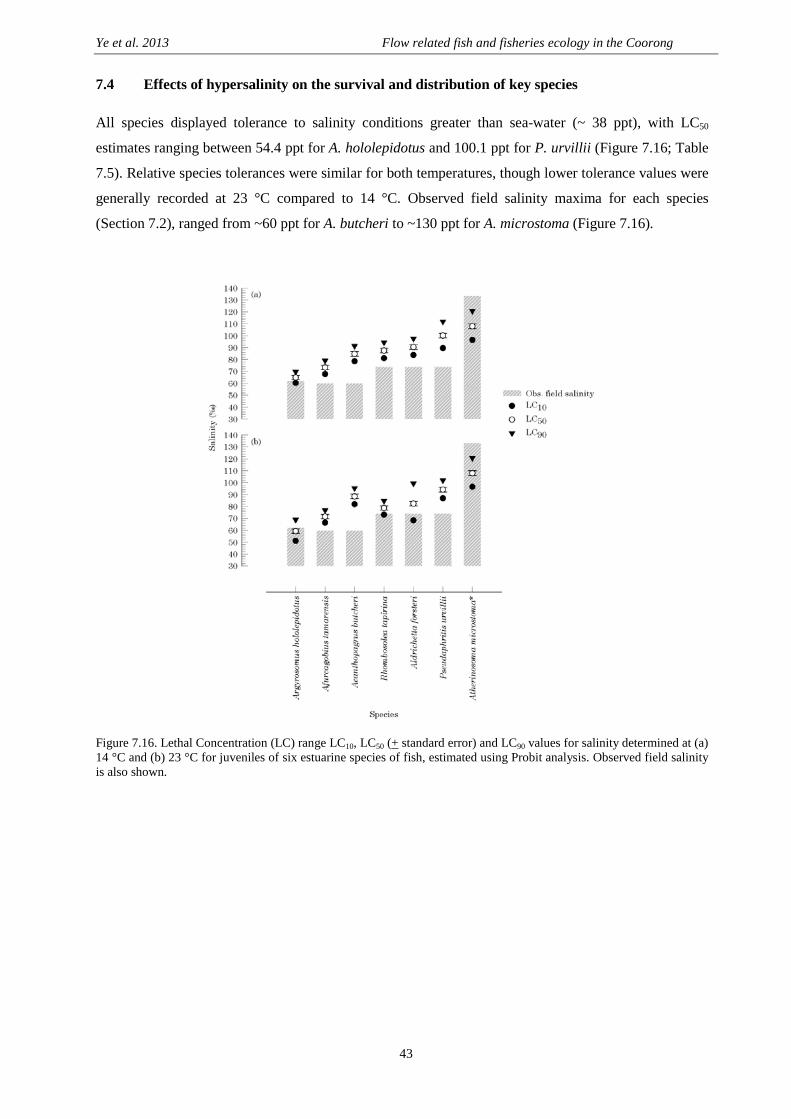
Ye et al. 2013 Flow related fish and fisheries ecology in the Coorong
7.4 Effects of hypersalinity on the survival and distribution of key species
All species displayed tolerance to salinity conditions greater than sea-water (~ 38 ppt), with LC50
estimates ranging between 54.4 ppt for A. hololepidotus and 100.1 ppt for P. urvillii (Figure 7.16; Table
7.5). Relative species tolerances were similar for both temperatures, though lower tolerance values were
generally recorded at 23 °C compared to 14 °C. Observed field salinity maxima for each species
(Section 7.2), ranged from ~60 ppt for A. butcheri to ~130 ppt for A. microstoma (Figure 7.16).
Figure 7.16. Lethal Concentration (LC) range LC10, LC50 (+ standard error) and LC90 values for salinity determined at (a) 14 °C and (b) 23 °C for juveniles of six estuarine species of fish, estimated using Probit analysis. Observed field salinity is also shown.
43

Ye et al. 2013 Flow related fish and fisheries ecology in the Coorong
Table 7.5. Summary of LC10, LC50, LC90 estimates (expressed as ppt) and fatal Daily Feeding Response Score (DFRS) for the six key species at 14ºC and 23ºC temperatures compared to field observations obtained from Section 7.1 and 7.2. *possibly affected by another unknown water quality factor. *from Lui (1969).
Vulnerability to high salinity Species name
Argyrosomus hololepidotus
LC10
60.3
14 °C
LC50 LC90
64.4 69.6
Fatal DFRS
62
LC10
51.1
23 °C
LC50 LC90
59.3 68.8
Fatal DFRS
66
Maximum observed field
salinity
62.4
Afurcagobius tamarensis 67.7 73.2 79.1 72 66.3 71.4 76.8 72 60.1
Acanthopagrus butcheri 78.6 84.7 91.4 82 81.8 88.4 95.3 86 60.1
Rhombosolea tapirina 81.1 87.5 94.4 82 72.9 78.6 84.7 78 74.1
Aldrichetta forsteri 83.8 90.5 97.6 88 68.3 82.4* 99.4 90 74.1
Least
Pseudaphritis urvillii
Atherinosoma microstoma *
89.5 100.1
108
111.9 88
-
86.9 94.1
108
101.9 88
-
74.1
133.5
Most
44

Ye et al. 2013 Flow related fish and fisheries ecology in the Coorong
Comparative vulnerability to hypersaline conditions
Maximum salinities occupied by individual species based on field observations (Section 7.1 and 7.2)
were compared to LC50 values for all species as determined in this study (Table 7.5). Estimated relative
order of vulnerability to salinity for each species was identified; A. hololepidotus was considered to be
the most vulnerable, whilst A. microstoma the most tolerant.
Salinity tolerance thresholds and relative distribution for individual species
Argyrosomus hololepidotus: At 14 °C, A. hololepidotus mortalities occurred between 58 to 70 ppt
(Figure 7.17a), with an LC50 estimate of 64.4 ppt. At 23 °C, mortalities occurred between 50 to 74 ppt
with an LC50 estimate of 59.3 ppt (Figure 7.17b). Daily Feeding Response Scores (DFRS) indicated that
feeding rates decreased at approximately 53 ppt in both temperature treatments, and had completely
ceased at approximately 62 ppt (14 °C) and approximately 66 ppt (23 °C) (Table 7.5). Stress Scores
(SS) were initially higher at 14 °C than at 23 °C; but rose in both treatments at approximately 52 to
54 ppt with colouration darkening at approximately 60 ppt and general inactivity occurring at 60 ppt
(14 °C) and 64 ppt (23 °C). The field distribution of A. hololepidotus was generally within 40 km of the
Murray Mouth with occasional catches taken between March and September 2007 in salinity
concentrations exceeding the LC50 at 23 °C (Figure 7.18).
Afurcagobius tamarensis: At 14 °C, mortalities occurred from 70 to 72 ppt, with an LC50 estimate of
73.2 ppt (see McNeil et al. (2013) for detailed figure). At 23 °C, mortalities occurred in salinities from
66 to 72 ppt and the estimated LC50 was 71.4 ppt (Table 7.5). DFRS decreased at 66 ppt in 14 °C, and
58 ppt in 23 °C, this pattern continued steadily, until feeding ceased entirely in both treatments when
ambient salinities reached 72 ppt (Table 7.5). SS initially began to rise at approximately 52 to 54 ppt in
both temperatures and change in colouration started to occur at approximately 58 ppt, followed by
general inactivity at approximately 70 ppt in both treatments. The observed field distribution of A.
tamarensis was generally within 20 km of the Murray Mouth within salinity conditions well within their
tolerance range.
45

Ye et al. 2013 Flow related fish and fisheries ecology in the Coorong
Sur vi val at 14°C Sur vi val at 23°C
Scor
e
(ppt)
Figure 7.17. Survival, feeding vigour and indications of stress with increasing salinity (a) 14 °C (‘winter’) and (b) 23 °C (‘summer’) temperatures for juvenile A. hololepidotus.
LC50 at 14°C LC50 at 23°C
(ppt)
Figure 7.18. Salinity concentration with distance from the Murray Mouth against time; with LC50 values determined at 14 °C and 23 °C and field observations (◦ = relative abundance, from Section 6.2) plotted for juvenile A. hololepidotus.
Acanthopagrus butcheri: At 14 °C, mortalities occurred at approximately 80 to 86 ppt, the LC50 estimate
was 84.7 ppt. In contrast, at 23 °C mortalities occurred between 82 and 90 ppt, the estimate of LC50 was
88.4 ppt (Table 7.5). DFRS decreased between 76 and 78 ppt for both temperatures, and continued to
decline until feeding ceased at 82 and 86 ppt for 14°C and 23° C treatments, respectively (Table 7.5). SS
initially began to rise at 74 ppt for both temperature treatments, which included darkening colouration
and fish generally became inactive at 74 ppt at 23 °C and 80 ppt at 14 °C. A. butcheri was generally
collected within 20 km of the Murray Mouth. Field salinities in these areas did not approach LC50
estimates. The schematic map showing the temporal variability in distribution and abundance for this
species is shown in McNeil et al. (2013).
46

Ye et al. 2013 Flow related fish and fisheries ecology in the Coorong
Rhombosolea tapirina: Mortalities of juvenile R. tapirina occurred at 14° C between 78 and 92 ppt,
whilst estimated LC50 was 87.5 ppt. In 23 °C, mortalities occurred between 68 and 82 ppt, whilst the
LC50 was 78.6 ppt (Table 7.5). DFRS declined from ~66 to 68 ppt for both temperature treatments, and
continued to decrease until 82 ppt at 14 °C and 78 ppt at 23 °C (Table 7.5). SS initially began to rise
between 74 and 78 ppt in both temperatures, and general inactivity became apparent in 76 ppt at 14 °C
and 82 ppt at 23 °C. R. tapirina were frequently caught up to 50 km from the Murray Mouth. Whilst
they were often distributed in close proximity to saline waters, they were never caught in salinities
exceeding the LC50 thresholds identified here, yet they were regularly caught in salinities that exceeded
their LC10 threshold suggesting that some individuals of this species may enter and tolerate hypersaline
waters (Figure 7.19).
(ppt)
LC50 at 14°C LC50 at 23°C
Figure 7.19 Salinity concentration with distance from the Murray Mouth against time; with LC50 values determined at 14 °C and 23 °C and field observations (◦ = relative abundance, from Noell et al., 2009) plotted for juvenile R. tapirina.
Aldrichetta forsteri: At 14 °C, mortalities occurred between approximately 82 and 90 ppt, with an LC50
estimate of 90.5 ppt. At 23 °C, 20% of mortalities occurred between 50 and 70 ppt, with the majority
occurring after 86 ppt, the estimated LC50 was 82.4 ppt (Table 7.5). At 14 °C, DFRS started to decline
from 84 ppt and continued to decline until feeding ceased completely at 88 ppt. Whilst at 23 °C, DFRS
declined from 70 ppt and feeding did not cease until complete mortality at 90 ppt. SS initially began to
increase with darkening colouration observed from 74 to 76 ppt at both temperatures and reduced
activity was noticeable at approximately 84 to 86 ppt. A. forsteri were recorded up to 40 km from the
Murray Mouth. In June of 2008, this species was collected near hypersaline waters, but were never
caught in salinities matching or exceeding the LC50 thresholds. The schematic map showing the
temporal variability in distribution and abundance for this species is shown in McNeil et al. (2013).
Pseudaphritis urvillii: At 14 °C, mortalities occurred between 92 and 104 ppt and the estimated LC50
was 100.1 ppt. At 23 °C, mortalities occurred between 84 and 98 ppt, with an LC50 estimate of 94.1 ppt
(Table 7.5). DFRS started to decrease at 82 ppt at 14 °C and 78 ppt at 23 °C, and continued to decrease
47

Ye et al. 2013 Flow related fish and fisheries ecology in the Coorong
steadily with exposure. Fish ceased feeding at 88 ppt at both 14 °C and 23 °C. At 14 °C, SS began to
rise at 68 ppt and darkening colouration was evident at 70 ppt. At 23 °C, SS began to increase at 74 ppt
and darkened colouration was evident at 76 ppt. Reduced activity was noticeable after exposure to
88 ppt at both temperatures. The observed field distribution of P. urvillii was within 40 km of the
Murray Mouth and largely within 20 km. Ambient salinity was in all cases well below the LC50
estimates for this species.
A. microstoma: Juvenile A. microstoma were collected up to 90 km from the Murray Mouth under field
salinities greatly exceeding the LC50 estimates identified by Lui (1969) using direct transfer
methodologies (Figure 7.20). The highest abundances were recorded in salinities below the estimated
LC50, closer to the Murray Mouth; however, fish were recorded in ambient salinities up to 130 ppt
exceeding even the LC90 threshold calculated for this species.
(ppt)
Figure 7.20. Salinity Concentration with distance from the Murray Mouth against time; with LC50 values determined at by Lui (1969) and field observations (◦ = relative abundance, from Section 6.2) plotted for juvenile A. microstoma.
7.5 Fishery production relative to freshwater inflows for key fish species
Description of time series
The time series for monthly catch of the species groups between July 1984 and June 2008 and the
corresponding number of areas fished are shown in Figure 7.21. Despite the confidentiality provisions
applied to the data, monthly catches of the species groups fluctuated greatly in any given year. Periodic
peaks in catches suggested seasonality in catches of A. butcheri, A. hololepidotus A, R. tapirina and, to
a lesser extent, A. forsteri. Relatively large catches were taken in October 1984, September 1985 and
September 1986 for A. butcheri (>8,000 kg), March and December 2001 for A. hololepidotus A
(≥28,000 kg), and April 1991 for R. tapirina (>14,000 kg). A general reduction in the number of areas
that were fished across the time series is also apparent for each species group (Figure 7.21).
Similarly, the flow time series exhibits large intra-annual variation, and the peak monthly volumes occur
on a seasonal basis (Figure 7.22a). Monthly flow volumes were particularly high (>2,500 GL) in
48

Ye et al. 2013 Flow related fish and fisheries ecology in the Coorong
November 1990, and January and December 1993. The study region has been subjected to several
droughts (defined here as periods of at least six months with zero flows) over the 24-year time series;
however, these have become more frequent and protracted since January 2002. Furthermore, the few
flows that intersperse these recent drought periods are relatively low compared to the pre-drought period
(i.e. prior to 2002).
It appears that the frequency and magnitude of flows have a direct impact on the spatial extent of the
study region that comprises brackish water (0.5-29.9 ppt salinity). Therefore, as a consequence of the
extensive drought periods since 2002, brackish areas diminished to the point that the study region
almost exclusively comprised saline (30-49.9 ppt) and hypersaline (≥50 ppt) waters during this
‘drought’ phase, with salinities reaching unprecedented levels (i.e. 200 ppt on one occasion) in the
South Lagoon (Figure 7.22b).
Mann-Whitney U-test results revealed significant differences in underlying distributions of mean
monthly catch (using median values as the measure of central tendency) between pre-drought and
drought phases for A. forsteri, A. hololepidotus B and R. tapirina, whereby catches for A. forsteri and R.
tapirina were significantly reduced during the drought phase, whilst A. hololepidotus B catch
significantly increased (Table 7.6). Significant differences were also found for each of the species
groups (except A. hololepidotus B) with respect to the number of areas fished and number of active
licences contributing to catch, all of which were reduced during the drought phase (by 1-2 areas fished
and 3-5 active licences).
49

Ye et al. 2013 Flow related fish and fisheries ecology in the Coorong
Figure 7.21. Monthly time series of catch (kg) of (a) Acanthopagrus butcheri, (b) Aldrichetta forsteri, (c) Argyrosomus hololepidotus A (inside the Murray Mouth), (d) A. hololepidotus B (outside the Murray Mouth) and (e) Rhombosolea tapirina from the Lakes and Coorong Fishery between July 1984 and June 2008. Also shown is the number of areas fished (out of a total of 11, except for A. hololepidotus A and A. hololepidotus B, which are taken from a total of 9 and 2 areas, respectively). Note: where catch represents <5 licence holders, this data is confidential and is therefore omitted from the graph.
50

(ppt)
Ye et al. 2013 Flow related fish and fisheries ecology in the Coorong
Figure 7.22. Monthly time series of (a) flow volume (GL) across the barrages, with corresponding drought periods ≥6 months, and (b) model-interpolated salinities (ppt) throughout the Murray Mouth, North Lagoon and South Lagoons between July 1984 and June 2008. Distance (km) refers to the south-easterly distance along the Coorong from the Murray Mouth. Salinity contours for 30 ppt and 50 ppt are shown to identify brackish (0.5-29.9 ppt), saline (30-49.9 ppt) and hypersaline (≥50 ppt) boundaries along the Coorong. Note: The North and South Lagoons are divided by significant reductions in channel width and depth near Parnka Point at ~55 km from the Murray Mouth.
51

Ye et al. 2013 Flow related fish and fisheries ecology in the Coorong
Table 7.6. Results of two-sample Mann-Whitney U-test for difference in mean monthly catch, number of areas fished and number of active licenses between pre-drought (before 2002) and drought (2002 onward) phases from July 1984 to June 2008. Median values are presented. Abbreviations: n, number of months; Z, Z-statistic. Note: the absolute value of the Z-statistic is used since U is approximately normally distributed for large samples (Zar 2009).
Median values Species group Pre-drought Drought Z
(n = 210) (n = 78)
Total catch (kg) A. butcheri 397 325 -0.957 A. forsteri 14,191 11,682 -3.355*** A. hololepidotus A 2,246 2,247 -0.345 A. hololepidotus B 117 333 -2.830** R. tapirina 1,107 343 -5.041*** No. areas fished A. butcheri 5 3 -8.858*** A. forsteri 6 5 -8.005*** A. hololepidotus A 5 4 -9.139*** A. hololepidotus B 1 1 -1.257 R. tapirina 5 3 -7.190*** No. licences A. butcheri 10 6 -6.553*** A. forsteri 14 10 -6.427*** A. hololepidotus A 12 9 -5.784*** A. hololepidotus B 2 2 -1.760 R. tapirina 10 5 -6.068*** **P < 0.01; ***P < 0.001.
The spectral density plot of monthly catch for each of the species groups reveals a peak at a frequency
of 0.083, which corresponds to 12 months (i.e. 1/0.083) (Noell and Ye 2013). We conclude from this
that the monthly catch series exhibit periodic behaviour, and that the development of time series models
for all species groups should consider seasonal models with a monthly periodicity.
Seasonality of monthly catch for the species groups were suspected from visual examination of the time
series plots, and then confirmed through spectral analysis techniques. Details of this seasonality, in
terms of distinctiveness and timing, were determined by isolating the seasonal adjustment factor (SAF)
of each time series, along with other components, through a seasonal decomposition procedure (refer to
Noell and Ye (2013) for a more detailed explanation).
Mean monthly catches were largest in early spring (September) for A. butcheri, summer (January) for A.
hololepidotus A, and late spring (November) for A. hololepidotus B and R. tapirina (Figure 7.23).
Seasonality was pronounced in these species groups, as their maxima were at least 100% greater than
the mean monthly catch for the respective species group obtained over the 24-year time series (except
for R. tapirina, where the November catch was 83% greater than the overall mean). Seasonality was
relatively weak for A. forsteri, where mean monthly catch only deviated <30% from the overall mean.
In comparison, mean monthly flow volumes across the barrages were highest during spring (September
to November), and 99% greater than the overall mean.
52

Ye et al. 2013 Flow related fish and fisheries ecology in the Coorong
Figure 7.23. Seasonal adjustment factor (SAF, %) of flow and monthly catch of Acanthopagrus butcheri, Aldrichetta forsteri, Argyrosomus hololepidotus A (inside the Murray Mouth), A. hololepidotus B (outside the Murray Mouth) and Rhombosolea tapirina from the Lakes and Coorong Fishery. The SAF for each calendar month represents the percentage above/below the mean monthly catch obtained between July 1984 and June 2008.
Univariate ARIMA and Transfer Function (TF) models for key species
For the development of a model for any dependent time series, the modelling software ‘Expert Modeler’
only identifies those models whose parameters and coefficients are statistically significant. The best
model for that series is then selected based on goodness-of-fit.
Once a univariate ARIMA model (Type A model) was established for catch of a species group, we
systematically selected flow volume and catches of other species groups as candidate predictor series’
for the development of TF models (Type B, C, D models). In doing so, we considered the univariate
model a baseline to assess whether the inclusion of the predictor series in TF models offer greater
predictive power than previous catches of the dependent series alone.
To facilitate the interpretation of models and complement the model descriptions shown below
including the differences between model types, comprehensive model output summary tables are
arranged for each species group and are shown in Noell and Ye (2013). In addition, all graphical
comparisons between observed and model-predicted catches of the different species groups are arranged
by model type and are shown in Noell and Ye (2013).
Rhombosolea tapirina: The monthly catch of R. tapirina was not modelled successfully using any of the
ARIMA time series modelling techniques presented in this study. Either the Type A or D model was not
correctly specified by virtue of its significant Q-value or a Type B or C model could not be identified.
A. butcheri: Mean monthly catch for A. butcheri was successfully modelled based on previous catches
alone (Type A model). The catch time series for A. butcheri was natural log-transformed to stabilise
variance, and seasonal differencing applied in order to account for the decreasing trend resulting from
relatively large periodic catches in the 1980s. Catch at time t is influenced by catch at time t-1 as
indicated by a non-seasonal AR parameter with an order of 1, and is also affected by the deviation of the
series mean at time t-12 as indicated by a seasonal term with order 1 (= 12 months).
53

Ye et al. 2013 Flow related fish and fisheries ecology in the Coorong
For the development of Type B and C models, monthly flow was selected as the input series to (partly)
predict the catch of a species group (along with previous catches). Both model outputs for A. butcheri
identified no predictors, which indicate that no model could be identified that improved on the
univariate model for this species.
Type D models build upon Type C models with the inclusion of catches of other species groups as
potential predictors, particularly given that the Lakes and Coorong Fishery is a multi-species fishery.
Whilst the Type D model identified season-specific flows (August−December), and catches of A.
hololepidotus B and R. tapirina as predictors of catch of A. butcheri, the coefficients of the model
parameters all approached zero, which means they have a negligible effect.
A. forsteri: The Type A model for the A. forsteri catch series could not be correctly specified, by virtue
of a significant Q-statistic.
The Type B model for A. forsteri revealed that catch is partly predicted by flows during the same month.
Since there is no confounding delay before the predictor series has an influence, the Num coefficient
(2.423, P < 0.001) indicates that, at time t, every 1 GL of freshwater discharged across the barrages
leads to an additional catch of A. forsteri of 2.4 kg. The catch of A. forsteri is also influenced by non
seasonal MA orders of 1-4 and a seasonal AR order of 1. An estimated 63% of the total variation in the
series is explained by this model.
No Type C model could be identified for A. forsteri.
The Type D model identified that catch of A. forsteri is partly predicted by A. hololepidotus A catch
during the same month. As for the Type B model for A. forsteri, this relationship can be quantified. The
Num coefficient (-0.268, P < 0.001) indicates that, at time t, every 1 kg of A. hololepidotus A that is
caught corresponds with a reduction in catch of A. forsteri by 0.3 kg. The Type D model for A. forsteri
has only a slightly higher r2 and improved BIC measure compared to the Type B model.
A. hololepidotus A: The Type A model for catch of A. hololepidotus A had non-seasonal AR orders of 1
and 2, a seasonal AR order of 1 and a seasonal MA order of 1. This model explains an estimated 86% of
the total variation in the A. hololepidotus A catch series.
The Type B model for catch of A. hololepidotus A indicate that catch is partly predicted by concurrent
flows and flows of the 1st and 2nd lagged months (coefficients reveal that the flow-catch relationship is
negative at t and t-1), and by deviations in the 1st and 2nd lagged months from the series mean. The catch
of A. hololepidotus A is also influenced by non-seasonal AR orders of 1 and 2 and non-seasonal MA
orders of 9 and 10. The Type B model for A. hololepidotus A is a poorer fit to the catch series (in terms
of r2 and BIC measure) compared to the Type A model.
Type C models were successfully developed only for A. hololepidotus species groups A and B, therefore
the season-specific flow data for this species refers to the spawning season of November−March. The
catch model for A. hololepidotus A indicate that catch is partly predicted by season-specific flow at
times t and t-1, and by deviations at times t-1 and t-2 from the series mean. As for the Type B model,
54

Ye et al. 2013 Flow related fish and fisheries ecology in the Coorong
the coefficients for Num orders 0 and 1 for A. hololepidotus A are both negative. The catch of A.
hololepidotus A is also influenced by a non-seasonal AR order of 1, a non-seasonal MA order of 9, a
seasonal AR order of 1 and a seasonal MA order of 1. The Type C model for A. hololepidotus A has
only a slightly improved BIC measure compared to the Type A model.
A Type D model for the A. hololepidotus A catch series could not be correctly specified.
A. hololepidotus B: The Type A model for catch of A. hololepidotus B has a non-seasonal order of 1 and
a seasonal AR order of 1. This model explains an estimated 82% of the total variation in the A.
hololepidotus B catch series.
The Type B model identified that catch of A. hololepidotus B indicates that every 1 GL of flow at time t
and t–15 leads to an increase and reduction in catch by 0.3 kg, respectively. The catch of A.
hololepidotus B is also influenced by a non-seasonal AR order of 1, a non-seasonal MA order of 10 and
a seasonal AR order of 1. The Type B model for A. hololepidotus B is a poorer fit to the catch series
compared to the Type A model.
The Type C model for catch of A. hololepidotus B is similar to the Type B model, but its Num
coefficient of order 0 (0.405, P < 0.001) further specifies that every 1 GL of flow during the spawning
season (November−March) at time t leads to an additional catch of 0.4 kg. The catch of A. hololepidotus
B is also influenced by a non-seasonal AR order of 1 and a seasonal AR order of 1. The Type C model
for A. hololepidotus B is a better fit to the catch series than the Type B model but is still a poorer fit
compared to the Type A model.
The Type D model identified that, in addition to season-specific flows, catch of R. tapirina partly
predicts catch of A. hololepidotus B. Flow has a Num order of 1, whereas R. tapirina catch has Num
orders of 0 and 1 and a delay of 4. The combined influence of these predictors, in the absence of Den
coefficients, is that every 1 GL of flow during the spawning season (November−March) at time t leads
to an additional catch of 0.4 kg and every 1 kg of R. tapirina that is caught at time t and t-1 leads to
small reductions in catch of A. hololepidotus B by 0.1 and 0.1 kg, respectively. The Type D model was
the poorest fitting of all four model types for predicting catch of A. hololepidotus B.
Model fit
Only minor improvements to model fit were obtained through the inclusion of predictor series (a poorer
fit actually resulted in some cases). Nevertheless, the overall fit of model-predicted values compared to
actual catch time series for each of the species groups is satisfactory. This is evident in the comparison
plots (see Noell and Ye (2013)) and the r2-values, which generally ranged between 0.63 and 0.86 (the
exception being the models for A. butcheri, which had r2-values of almost 0.5).
55

Ye et al. 2013 Flow related fish and fisheries ecology in the Coorong
8. Discussion
8.1 Environmental characteristics: salinity gradient
For the duration of this study (October 2006 to September 2008), the Murray Mouth and Coorong
region received no freshwater inflows from the River Murray. Ongoing dredging work kept the mouth
open during the study period (DWLBC 2008) and as a consequence, only seawater entered the Murray
Mouth and Coorong and continued evaporation resulted in increasing salinities along the Coorong. In
our study, mean salinities ranged from 30-43 ppt in the Murray Mouth subregion, 61-86 ppt in the North
Lagoon, and 105-164 ppt in the South Lagoon. There was no obvious temporal pattern in salinities for
either the Murray Mouth or North Lagoon, but there were sharp peaks in salinity each March in the
South Lagoon, presumably due to relatively high evaporative water loss during the preceding summer
and a lack of water exchange between the lagoons (Geddes 2005b).
Salinity levels recorded in this study, particularly from the South Lagoon, were quite high in
comparison to observations made in a previous study undertaken in the Coorong during the 1982
drought, one which included a 16-month period of no freshwater inflows (Geddes and Butler 1984). In
that study, salinities in the North Lagoon reached 80 ppt, while salinities in the South Lagoon ranged
between 90 and 100 ppt. The contrast is even greater when we compare our results to the 1983/84 flow
year, when, following a period of substantial flows from the River Murray, the North Lagoon became
brackish (<30 ppt) and the South Lagoon moderately hypersaline (55-70 ppt) (Geddes 1987).
8.2 Composition of fish assemblages
In this study, over 66,000 fish, representing 26 species were collected. Although few quantitative fish
surveys have been conducted in the Murray Mouth and Coorong region, the abundance and diversity of
fish species in the current study is comparable to that reported for the Wellstead Estuary in south
western Australia (Young and Potter 2002). Unlike the Murray Mouth, which is kept open through
ongoing dredging, the mouth of the Wellstead Estuary typically closes-over during summer months and
as such the estuary is landlocked for long periods (it occasionally opens at times of high freshwater
discharge). Despite this, both regions are similar in that they exhibit a variable salinity gradient with
extremely high salinities in some areas. The fish fauna in the Wellstead Estuary is described as
‘depauperate’ in comparison to other temperate estuaries of south-western Australia (Young and Potter
2002).
The seine net (8 mm mesh size) used in this study was very effective in sampling small-bodied fish
species and juvenile fish of large-bodied species. The small-bodied A. microstoma, in particular, was
very abundant, making up most of the total number of fish collected throughout the study (>60%), and
being the only species found in the South Lagoon. This and other small atherinids are particularly
important species in the fish fauna of many temperate Australian estuaries, where they are often the
dominant species (at least 50% of total number of fish), particularly where salinities are near or above
56

Ye et al. 2013 Flow related fish and fisheries ecology in the Coorong
that of seawater (Potter et al. 1993; Potter and Hyndes 1994; Valesini et al. 1997; Griffiths and West
1999; Young and Potter 2002; Hoeksema and Potter 2006). The second most abundant species, A.
forsteri, is also consistently abundant in south-western Australian estuaries, particularly as juveniles (see
Potter and Hyndes 1999).
From seine net samples, almost the same number of marine species utilised the Murray Mouth and
Coorong region as the estuarine group. In terms of numbers of fish, however, the solely-estuarine
category was dominant (62%) due to the high abundance of A. microstoma, with marine estuarine-
opportunists making up approximately 35%. Two catadromous species, G. maculatus and P. urvillii,
collectively made a notable contribution to the total number of fish (1.3%), mainly due to the relative
abundance of G. maculatus. Two species of freshwater fish, N. erebi and Retropinna semoni, were only
found in very low numbers as might be expected as the Murray Mouth received no freshwater input
from the Lower Lakes during the period.
Overall, a grand total of 31 fish species were recorded from both seine and gill net samples; this
comprised 30 teleost species (bony fishes) and 1 ray species (cartilaginous fish). Of these, 6 species had
not been recorded in previous inventories of some 77 species of the region (including freshwater
species) (Eckert and Robinson 1990; Higham et al. 2002). These additional species were all marine
species (i.e. either estuarine opportunists or marine stragglers), i.e. Heteroclinus heptaeolus, Sardinops
neopilchardus, Ammotretis rostratus, Pomatomus saltatrix, Stigmatopora argus, and Myliobatis
australis. Importantly, all 11 ‘estuarine’ species identified by Higham et al. (2002) as characteristic of
the Murray Mouth and Coorong region were collected in this study, albeit quite low densities.
Link between salinity and fish assemblages
It has been well documented, that salinity is an overwhelmingly important factor in the ecological health
of the Coorong (e.g. Geddes and Butler 1984; Geddes 1987, 2003, 2005c).
Through a descriptive account of seine net and gill net collections conducted over a two-year period and
the subsequent multivariate analyses of the component fish assemblages, the results of this study
highlight the influence of salinity on the fish assemblages along the length of the Murray Mouth and
Coorong region. Specifically, it describes the assemblages during an extended drought period. Further,
it provides a comprehensive sampling methodology and baseline data to which future assessments can
be compared.
The general decline in species diversity with increasing distance from the Murray Mouth observed in
this and previous studies is believed to be a response to the strong salinity gradient because of the
increasing osmoregulatory stress and/or diminishing food resources, which force certain fish taxa out of
the area (Whitfield 1999). When environmental pressures are selective towards a low number of species
inhabiting a particular area, both predation and competition for food resources decreases, which provide
opportunities for those remaining few species to extend their ecological niche (Colburn 1988). The
absence of potential predators and competitors in hypersaline conditions is assumed to allow species
57

Ye et al. 2013 Flow related fish and fisheries ecology in the Coorong
that are able to tolerate these conditions broader access to food, space and habitat, and thereby
compensate for the added energetic cost of osmoregulation (Vega-Cendejas and Hernández de
Santillana 2004). The utilisation of such opportunities is best exemplified in this study by the
dominance of A. microstoma in the North Lagoon and its occurrence as the only fish species in the
South Lagoon, which place it as a keystone species in the structuring of fish assemblages throughout the
Murray Mouth and Coorong region.
Size and growth characteristics for key species
In addition to describing the composition of fish assemblages, length frequency distributions for seven
key species were measured in order to gain more detailed information with respect to the utilisation of
the Murray Mouth and Coorong by particular life stages of these species.
Atherinosoma microstoma: The broad temporal scale of sampling made the modal progression of
cohorts between samples somewhat unclear. Nevertheless, it appears that early-spawned fish from a
September-December spawning season (Molsher et al. 1994) only just began to appear during
November/December. Rapid growth occurs over summer until early autumn, by which time it attains
most of its growth and forms a single cohort with a broad size range, probably as a result of multiple
spawnings per fish over a protracted spawning period. Growth slows considerably over winter before
spawning in spring and dying shortly after at approximately one year of age (Molsher et al. 1994), with
a small proportion of the cohort surviving to the second year of growth.
Aldrichetta forsteri: The length-frequency distributions for A. forsteri showed a noticeable difference in
size structure between subregions, with relatively few fish <170 mm TL occurring in the North Lagoon
compared to the Murray Mouth. We are uncertain of the reason for this size-based segregation, although
an increase in salinity tolerance with growth does not appear to be a factor, since tank experiments
conducted in this study suggest a high salinity tolerance for juveniles. However, one explanation for
larger A. forsteri mainly occurring in the North Lagoon is that this subregion provides greater refuge
from seals or other predators than the Murray Mouth subregion where they are more prevalent. The
length-frequency distributions nevertheless demonstrate modal progression of clearly distinguishable
cohorts, which is characteristic of a species with a relatively distinct spawning season. These cohorts
presumably represent year classes, and up to four year classes were present in the region at any one
time.
Rhombosolea tapirina: Adult R. tapirina are found in sheltered bays, estuaries, and inshore coastal
waters, where they prefer sand, silt and muddy substrates (Last et al. 1983; Kailola et al. 1993; Gomon
et al. 2008). The distribution of this species in the marine waters adjacent to the Coorong lagoons
remains unknown, yet it is believed that the species completes its life cycle within the Murray Mouth
and Coorong region (Hall 1984). The growth of juveniles could be detected from a modal size class of
40-50 mm TL in December to 70-80 mm TL in March. However, further growth of this cohort was
uncertain, with fish larger than ~110 mm TL occurring only sporadically on most sampling occasions.
Most R. tapirina of all sizes were collected using the seine net, yet the commercial catch of this species
58

Ye et al. 2013 Flow related fish and fisheries ecology in the Coorong
is primarily taken by large mesh gill net. This suggests that gill nets used in this study (which are
configured to include mesh sizes used by commercial fishers) may have been set at locations where this
species occurs in low numbers, and that further monitoring, possibly through a combined fishery-
dependent and independent sampling program, would be useful to ascertain whether the R. tapirina
population has a more ‘complete’ size and age distribution.
Afurcagobius tamarensis: This small-bodied species spawns in spring and completes its life cycle in
estuaries (Larson and Hoese 1996). Despite the lack of information on age and growth of A. tamarensis,
this species probably has a short lifespan of perhaps just over one year. Length-frequency distributions
show that, after being spawned in spring or summer (Section 6.3), this species first appears in March as
small as 20 mm TL and belonging to a cohort with a modal size class of 35-40 mm TL. The progression
of this cohort can be traced through to at least November at a modal size of ~70 mm TL and an
approximate age of 1 year.
Argyrosomus hololepidotus: The Murray Mouth and Coorong A. hololepidotus population is comprised
almost exclusively of juveniles (<750 mm TL), whilst the nearshore marine fishery comprises
reproductively mature and sub-mature adults (800-1500 mm TL) that aggregate at the interface of the
River Murray plume during the spring-summer (November to March) spawning period (Hall 1984;
Ferguson et al. 2008). Larval development is thought to occur at sea with juveniles entering the Murray
Mouth several months later at 100-150 mm TL (Hall 1986). The length-frequency distributions obtained
in this study conform to these life history descriptions, with juveniles as small as 128 mm TL and
belonging to a cohort with a modal size of <200 mm TL appearing in December (approximately one
year of age). Modal progression of this cohort indicates that juveniles reach a modal size class of ~350
mm TL over the subsequent 12-month period (at two years of age).
Acanthopagrus butcheri and Pseudaphritis urvillii: Only a few A. butcheri and P. urvillii were collected
in this study. Small sample sizes of these species could be due to a number of possible reasons,
including species’ behaviour making it difficult to sample effectively, low actual abundances, an
ineffective sampling method (e.g. non-selective gear type for these species, poor positioning of nets), or
a combination of these. Recent poor recruitment of P. urvillii has also been suggested, which is
probably related to the closed barrages and fishways preventing this species undertaking spawning
migrations.
This study aimed to sample fish assemblages rather than target individual species. As such, a more
species-specific approach in sampling methods is required to sample and comprehensively describe the
long-term progression of cohorts of these species more effectively.
Influence of drought on fish assemblages
There is a high likelihood that the extended drought conditions and the subsequent lack of freshwater
input and increases in salinity throughout the Murray Mouth and Coorong have influenced the
composition of fish assemblages and severely limited distributions.
59

Ye et al. 2013 Flow related fish and fisheries ecology in the Coorong
During the early 2000s the overall ecological health of the Coorong was considered poor and possibly at
an historical low point for the region with respect to its biodiversity and productivity (Geddes 2003).
For fish communities, the condition of the environment during this study was worse as a result of the
low mean annual flow volume across the barrages of 176 GL.yr-1 during 2004-2008 and the
significantly higher salinities.
Given the resumption of a normal, seasonal flow regime to the Murray Mouth and Coorong in 2010, we
recommend that this study is repeated in order to understand whether and how the composition of fish
assemblages of this region responds to non-drought conditions. We hypothesise that the freshening of
the Murray Mouth and Coorong through either an increase in freshwater inflows or greater rate of
exchange with less saline waters of the sea would result in an increase in species diversity and
abundance and a greater southward distributional range of some species throughout the region.
However, there is considerable risk that, for those species that need periodic freshwater input for some
part of their life cycle, spawning and recruitment success may have already progressively weakened
from consecutive years of the current drought.
8.3 Reproductive Characteristics of key species
Sex ratios
Sex ratios for each species varied temporally throughout the sampling period. However, ratios for most
species were heavily weighted towards females. Males only dominated the catch in two instances; A.
forsteri during November and A. tamarensis in December 2007. In the current study the most likely
factors explaining this result are sampling methodology and habitat variation between the sexes. Sex
ratios in the commercially caught species, A. butcheri, A. forsteri and R. tapirina are likely to be
influenced in part by the method of collection, whereby commercial fishing methods may hold bias due
to the sampling of spawning aggregations. Other species-specific factors that may explain large numbers
of females compared to males are discussed in more detail in Cheshire et al. (2013).
Temporal variation in spawning behaviour
The timing of the spawning period is an important aspect of fish ecology, as it aims to place eggs, larvae
and juveniles into the system under the optimal conditions for growth and survival (Bye 1984; Jobling
1995; Yaron and Sivan 2006). In temperate systems, spawning time is often correlated with day length,
temperature and food availability. Seasonal timing of spawning within a year is likely to be driven by
these factors, however long term (preferably greater than 5 years) studies are most likely required before
environmental correlations for spawning activity can be accurately identified.
Using GSI and macroscopic staging, this study has identified the spawning seasons for the five selected
species in the Coorong under drought conditions. Spring and spring/summer spawners included A.
butcheri and A. tamarensis, respectively. A previous investigation into the spawning season of A.
butcheri in the Coroong suggested a solely summer spawning season (Hall 1984). However,
60

Ye et al. 2013 Flow related fish and fisheries ecology in the Coorong
considerable variation in spawning times between different estuaries has been documented (Newton
1996; Haddy and Pankhurst 1998; Sarre and Potter 2000; Norriss et al. 2002). The spring period
identified for A. butcheri spawning is not localised to South Australian estuaries (Harbison 1974) but
has also been observed in Victorian estuaries such as the Glenelg River and Gippsland Lakes (Coutin et
al. 1997; Norriss et al. 2002). Acanthopagrus butcheri has been documented to move downstream with
freshwater flushes and then move upstream during summer months in order to find the appropriate
salinity, dissolved oxygen content and habitat suitable for spawning (Norriss et al. 2002). For A.
tamarensis, this study is the first to comprehensively assess the spawning season in the Coorong region.
However, the spawning season identified is consistent with results from Victorian estuaries where they
have been seen to spawn from September to November (Cadwallader and Backhouse 1983). Spring and
summer spawners are likely to be utilising a time characterised by warmer temperatures, ensuring faster
growth and an abundant source of food for developing larvae (Wootton 1998).
A. forsteri was identified as a summer/autumn/winter spawner; whereas P. urvillii and R. tapirina were
found to be winter spawners. Timing of the spawning seasons can also vary depending on location and
stock structure. For example, A. forsteri can be split into two stocks; eastern and western, whereby
eastern populations spawn in late summer to autumn and western populations spawn in winter
(Thomson 1957; Chubb et al. 1981; Lenanton 1982). The spawning season of R. tapirina in Tasmania,
based on gonadosomatic indices, occurred from June to October (Kurth 1957; Crawford 1984; Ferguson
2007). Due to the absence of ripe (stage 4) and spent (stage 5) ovaries in female P. urvillii, an actual
spawning event may not have occurred within the sampling period, however, the spawning season
identified in this study is comparable to populations in two estuarine or freshwater habitats in eastern
and western Victoria (Crook et al. 2010). Crook et al. (2010) identified that females started their
spawning migration and were in optimum spawning condition between May and June. Female P. urvillii
have been documented to migrate downstream with the onset of freshwater flows, which historically
would have occurred towards the end of winter (Zampatti et al. 2011). Both A. forsteri and P. urvillii are
believed to spawn in the marine environment during autumn or winter, developed larvae and juveniles
then migrate back into the estuaries during spring (Jenkins 1986; Crook et al. 2010). This strategy
places well developed larvae and juveniles into the estuaries during spring, allowing them to
competitively take advantage of the warmer temperatures and abundant food resources. Complementary
larval fish sampling during this study between August and November 2008 collected a very small
number of P. urvillii larvae in the vicinity of Murray Mouth, however, environmental conditions in this
area more resembled the marine environment due to lack of freshwater inflows (Bucater et al. 2013).
Size at first maturity
Size at first maturity represents a transitional point in the life of an individual where allocation of time
and resources shifts from growth and survival only, to include reproduction (Wootton 1998). Size at
first maturity varies between and within species and can be influenced by environmental change or
external stressors (Stearns and Crandall 1984; Wootton 1998). Species that exhibit variations in size at
61

Ye et al. 2013 Flow related fish and fisheries ecology in the Coorong
maturity as a result of external pressures are said to demonstrate life history plasticity and is most
commonly displayed by a shift to an earlier maturation in faster growing fish (Stearns and Crandall
1984). However, this is not always the case. Three prominent patterns of decreased growth have been
reported in the literature, both within and between populations, 1) delayed maturity at a smaller size, 2)
delayed maturity at the same size, and 3) delayed maturity at a larger size (Stearns and Crandall 1984).
Female A. butcheri matured more rapidly when compared to males, however, some males reached
sexual maturity before that of the minimum size (270 mm) of females with ripe or hydrated ovaries. A.
butcheri within the Coorong lagoons reached first maturity at a size greater than those found in
populations in South Victorian and Western Australian estuaries (Sarre 1999; Norriss 2002; Sarre and
Potter 2000). This suggests that during periods of drought with no freshwater flushes or flows, sexual
maturity in relation to size may slow, due to factors such as the availability of food resources and
salinity gradients optimal in the stages of reproductive development for A. butcheri.
The results for A. forsteri in this study concur with results from Harris’ (1968) Coorong study; female A.
forsteri were found to be sexually mature at 255 mm TL, while males were found to sexually mature at
244 mm TL. This indicates that A. forsteri’s reproductive development was not greatly affected by the
drought conditions. This is most likely a result of being a marine species, more so than an estuarine
species; that is, being less reliant on freshwater inflows or fluctuating salinities for optimum
reproductive development.
This is the first study to determine size at maturity for the Coorong population of R. tapirina. Size at
first maturity has been determined for R. tapirina populations in Tasmania where Crawford (1984)
found that females reached sexual maturity at sizes ≥ 219 mm whilst males were smaller at 190 mm.
Also, this is the first study to determine size at maturity for A. tamarensis and P. urvillii, within
Australia. Thus, the results indicating that female A. tamarensis reaches sexual maturity at ≥ 53 mm and
female P. urvillii reach sexual maturity at ≥ 165 mm, these results can be used as a basis during drought
conditions for future reference. Results indicate that male A. tamarensis are likely to take a longer time
to mature than their female counter-parts. Contrastingly the results for P. urvillii indicate that males
would mature more rapidly than females. However, in both these cases and in the absence of a model to
determine size at 50% maturity for males (due to low sample size), this claim requires further
verification.
Impacts of drought on reproduction
Previous studies on Coorong spawning of A. butcheri suggested a summer spawning season (Hall
1984), rather than a spring spawning season as identified in this study. Summer spawning may have
resulted following periods of high spring rainfalls whereby A. butcheri move downstream with
freshwater flushes and then move upstream during summer months to find appropriate salinity,
dissolved oxygen levels and habitat suitable for spawning (Norriss et al. 2002). However, in periods of
62

Ye et al. 2013 Flow related fish and fisheries ecology in the Coorong
drought fish may have been cued to spawn via increasing water temperatures and minor freshwater
releases during the winter months, causing fish to spawn during spring.
Aldrichetta forsteri are known to move into freshwater on rising tides (Thomson 1996), however, they
are still predominately a marine estuarine-opportunistic species which can complete their entire lifecycle
in a marine environment (Potter and Hyndes 1994). This suggests that whilst freshwater flows would
not hold much significance in terms of cueing a spawning event, they may be important in maintaining
suitable spawning habitat. Access to suitable habitat will influence the timing for spawning, for example
in the western population of A. forsteri, during summer there is a tendency for estuaries to close over by
the formation of sandbars at the mouth which effectively prevents the movement of fish in spawning
condition into the estuary (Chubb et al. 1981). Subsequently the opening of estuaries by heavy
freshwater discharge during winter, permits spawning and supports the movement of juveniles into the
protected estuaries for their first year of life.
Salinity levels also play a key role in the reproductive biology of R. tapirina, with optimum fertilisation
rates occurring at salinities of 35-45 ppt (Hart and Purser 1995). Eggs of R. tapirina are said to be
positively buoyant at salinities above 28 ppt and after fertilisation were tolerant of a wide range of
salinities (15-45 ppt) (Hart and Purser 1995). Although adult R. tapirina are said to be tolerant to a wide
range of salinities (Kailola et al. 1993), specific threshold values are still unknown.
Increased GSI and developed gonads were also associated with low water temperatures for some species
(i.e. P. urvillii which is a winter spawner). However, there was no direct evidence of recent spawning
for P. urvillii, suggesting that an actual spawning event may not have occurred within the sampling
period and hence during drought conditions. As such, there is still some uncertainty in regards to the
spawning mode of P. urvillii and whether it varies in response to environmental conditions. If spawning
did not occur during the sample period, it could be directly attributed to the loss of fish passage from
freshwater to estuarine habitats in the region, whereby females are unable to move into the Coorong
lagoon area to disperse their eggs for fertilisation..
In summary the low flow conditions in the Coorong may have direct impacts on the reproductive
biology of the key species present. This may require interventions to ensure that the Murray Mouth
stays open, ensuring the salinity in the Coorong remains within a reasonable range for survival of eggs
and larvae and that the passage between fresh and salt waters remains accessible.
8.4 Influence of salinity on the survival and distribution of key species
Tolerance to hypersaline conditions
Controlled tank experiments were conducted at summer (23 oC and) winter (14 oC) temperature regimes,
to assess the salinity tolerance thresholds of key fish species that inhabit the Murray Mouth estuary and
Coorong lagoons. All fish species (juveniles) tested tolerated high salinity levels approximately twice
the concentration of seawater. There was a gradient of relative tolerance across species with the highest
tolerances recorded by A. microstoma, followed by P. urvillii, and A. forsteri which were tolerant of
63

Ye et al. 2013 Flow related fish and fisheries ecology in the Coorong
salinities greater than 80 ppt regardless of water temperature. Although differentially effected by water
temperature, R. tapirina and A. butcheri also recorded high tolerances (> approximately 80 ppt).
Slightly less tolerant, A. tamarensis and A. hololepidotus recorded tolerances between approximately 60
and 72 ppt. A. butcheri was the only species tested to record a higher tolerance value under summer
water temperatures (23 °C) than the cooler 14 °C treatment.
The maximum field salinities at which species were caught more clearly divide these species into two
groups with A. microstoma, P. urvillii, A. forsteri and R. tapirina captured in salinities of over 74 ppt
and A. butcheri, A. tamarensis and A. hololepidotus found only at salinities below approximately 60 ppt.
These field patterns suggest that the winter temperature tolerance thresholds for these species are more
closely related to their distribution throughout the Coorong during 2006 to 2008 (Section 6.2).
Relating tolerance thresholds to ecological distribution
A key outcome of the current study is the application of experimentally derived tolerance thresholds to
the distribution of wild fish across a natural salinity gradient. The results suggest that threshold values,
in particular LC10 and LC50, can approximate the maximum field distribution of species with moderate
accuracy. In general, species tended to be caught in salinities far lower than threshold limits which
concurs with results from Kefford et al. (2004). This is a reasonable result considering the range of
chronic impacts that sub-lethal concentrations of salinity may have on the homeostasis of estuarine fish.
Respiratory efficiency, energetic budgets, growth and immune responses are impacted at levels far
below those directly lethal to individual fish (Geddes 1979; Hart et al. 1991; Haddy and Pankhurst
2000; Boeuf and Payan 2001; Akin and Neill 2003).
By exception, two species (i.e. A. hololepidotus and A. microstoma) were observed occupying habitats
more saline than their tolerance limits would suggest. A. hololepidotus recorded LC10 and LC50
thresholds under 23 °C that were lower than salinities at which they were recorded in the field.
However, the catches of A. hololepidotus at these salinities only occurred during the cooler months and
therefore the summer temperature threshold does not apply. Instead the winter (14 °C) threshold would
apply and whilst salinity levels may still be high enough to restrict <10% of individuals, trials suggest
most members of this species could survive under these salinity and temperature conditions.
Tolerance estimates were lower than habitat field salinities for A. microstoma and this was the only
species not tested using gradual acclimation tolerance trials. Instead, threshold values were re-calculated
from published data (Lui 1969) that used a direct transfer methodology. Direct transfer methods do not
allow for any degree of acclimation to increasing salinities and can often under-estimate the ability of
fish to physiologically adapt to rising salinity levels, leading to lower estimates of LC50 (McNeil et al.
2010a; 2010b; 2010c). This result emphasises the importance of comprehensive and comparative
assessments of species’ tolerances when addressing the impacts of water quality extremes on fish health
and survival, as the application of previously or variously derived estimates may not allow valid
comparisons across species.
64

Ye et al. 2013 Flow related fish and fisheries ecology in the Coorong
If comparable methods were used for A. microstoma, as were used for other species in the current study,
it is likely that LC estimates may more closely approximate field distribution limits. This would also
render A. microstoma the most tolerant of all Coorong fish species as indicated by the field results, and
we hypothesise that the gradual acclimation derived LC50 for this species is likely to approximate 140
ppt. This suggests that A. microstoma, alongside Cyprinodon variegates, is one of the most salt-tolerant
fish species in the world (Gunther 1956).
Ecological and management significance
These results have significant implications for the provision of freshwater inputs into the Coorong and
Lower River Murray. They indicate that freshwater inflows of subsequent size and duration to push
back or break down the hypersaline mass will almost certainly result in the expansion of key marine and
estuarine species southward into the Coorong lagoon, expanding from remaining source populations that
persist within marine environments close to the Murray Mouth. Furthermore, the data suggests that
salinity levels do not need to be significantly fresh to facilitate the re-distribution of most fish species
back into the lagoon, assuming that ecological fidelity also recovers and the ecological processes
necessary to support fish populations is also able to recover from hypersaline conditions.
The distributional data also shows that the true estuarine species, A. butcheri and A. tamarensis, are
perhaps the least likely to respond quickly to improvements in saline conditions due to their apparent
reluctance to move toward a hypersaline mass, even during seasonal retreats southward. It is likely that
these species are persisting within sub-optimum marine environments around the Murray Mouth. These
species have relatively low tolerances and are likely to be most impacted by any further expansion of
the hypersaline mass into the Murray Mouth subregion. Whilst also relatively intolerant, A.
hololepidotus is also highly mobile and therefore able to retreat rapidly to marine environments to
which they are well adapted.
8.5 Influence of freshwater flows on fishery production
Time series analysis was identified as a potentially useful tool to investigate the influence of freshwater
discharge across barrages (flow volume) as a predictor of catch of key species groups in the Lakes and
Coorong Fishery. Specifically, it is hypothesised that flow has an influence on the spawning and
recruitment (A. butcheri, A. hololepidotus, R. tapirina) or spawning aggregation (A. hololepidotus) of
most of these species, although it is unclear what effect flow has, if any, on A. forsteri.
The basic premise of this study was that these biological processes have a causal effect on fish
production, which is reflected (concurrently or some time later) in the catches of the species concerned.
Catches in another multi-species fishery in the northwest Mediterranean Sea were typically found to
correspond to either the time of spawning or recruitment to the gear (Lloret et al. 2000).
Importantly, the development of time series models to investigate these relationships accounts for any
inherent seasonality and underlying trends and periodicity in the time series before the final model is
65

Ye et al. 2013 Flow related fish and fisheries ecology in the Coorong
developed. The specific nature of the relationships can then be inferred from the model parameters and
their coefficients.
As the Lakes and Coorong Fishery is a multi-species fishery, the licensed net fishers are able to target
different species under different circumstances (season, time of day, weather, etc.). Therefore, the catch
of any species is not independent of the catch of another species. To allow for any confounding
influence of catches of other species, further models were developed to include these catches as
potential predictors (in addition to flow).
The univariate ARIMA model (Type A) described the catch series for A. butcheri and A. hololepidotus
B better than any TF model (Types B, C, D). Both models exhibited a positive autoregressive
component, which indicates that catch is predominantly influenced by catch in the previous month. No
valid model was produced for R. tapirina. The catches of A. forsteri and A. hololepidotus A, were best
described using TF models, some of which can be explained by biological process or fisher behaviour.
The TF model identified for catch of A. forsteri indicated that increases in flow lead to additional catch
taken during the same month. If we assume that catch of A. forsteri, in this case, is a proxy for
abundance, then this model could be explained by their: 1) aggregation to take advantage of an
increased food supply from the nutrient-enriched freshwater discharge; 2) immigration from the sea into
the Murray Mouth and Coorong to shelter from predation in more turbulent water; or 3) immigration
from the sea to occupy the increasing area available that comprises preferred lower salinities or other
optimal conditions (Geddes 1987). The latter of these explanations is supported by Hall’s (1984)
observation of a general southward expansion of the range of fish species when salinities fall. The latter
explanation is supported by the observation that larger catches of A. forsteri generally corresponded to
more fishing areas being fished, and vice versa.
With the inclusion of catches of other species groups as potential predictors, an alternative TF model
that described catch of A. forsteri was developed. This model indicated that A. forsteri catch was
inversely related to catch of A. hololepidotus A (taken from inside the Murray Mouth). This model may
be explained by licensed net fishers targeting one species at a time, particularly since A. forsteri are
predominantly caught using small-mesh gill nets, whereas A. hololepidotus A are caught using large-
mesh gill nets.
The TF model identified for catch of A. hololepidotus A indicated that catch was inversely influenced
by flows during the spawning season 1 and 2 months earlier or, in other words, catches of A.
hololepidotus A during December−May are reduced with increasing flows 1 or 2 months earlier during
its spawning season (November−March). However, this model is difficult to interpret as there is no
conceivable explanation for this relationship.
Despite the hypothesised relationship between flow and catch of species groups, it was difficult to
establish these relationships in this study. Transfer Function (TF) models, which included flow as a
66

Ye et al. 2013 Flow related fish and fisheries ecology in the Coorong
predictor series, offered only slight improvements in predictive power to the univariate ARIMA models,
in which catch is modelled on previous catches alone.
The lack of predictive models does not preclude that these relationships actually exist. However,
without knowing the level of impact, it is worth considering that there are a number of possible reasons
that have interfered with model development. These reasons are listed below, but are comprehensively
discussed in the context of this study in Noell and Ye (2013).
• Catch is delayed to detect flow-recruitment signal;
• Catch does not accurately reflect production;
• Time series intervals conceal important information;
• Errors in model-derived series.
With careful planning of further research, some of these limitations may be overcome. Fishery-
independent sampling, for instance, may be employed to sample and estimate abundance of earlier life
stages of the species concerned. This would reduce the opportunity for external factors (other than flow)
to interfere with the relationship, as well as provide an improved measure of fish production. Since there
must be at least 50 observations required to develop a reliable time series model, the research sampling
may be undertaken monthly over at least four years or more frequently with intensive sampling, but this
depends on the timescale that the relationship under investigation is likely to exist.
Although this study identified limitations of time series modelling when applied to commercial catch
data of the Lakes and Coorong Fishery, it remains a potentially useful tool to describe the influence of
flows on fishery production, as has been demonstrated in other fisheries.
67

Ye et al. 2013 Flow related fish and fisheries ecology in the Coorong
9. Benefits Sectors of the fishing industry, government and community that will benefit directly from this research
include:
• Commercial fishers operating in the South Australian Lakes and Coorong Fishery.
• Interstate commercial fisheries (NSW, TAS, VIC, WA).
• Local and interstate recreational fishers (SA, NSW, TAS, VIC, WA).
• Department of Primary Industries and Resources of South Australia (PIRSA): Fisheries –
managers of the Lakes and Coorong Fisheries.
• Managers of South temperate estuarine environments and natural resources.
• Department of Environment, Water and Natural Resources (DEWNR).
• Murray-Darling Basin Authority (MDBA): water policy makers and river managers.
• South Australian Murray-Darling Basin Authority Natural Resources Management Board (SA
MDBANRMB).
• Agricultural industries irrigating in the vicinity of the Lower Lakes.
• Traditional fishers of the Ngarrindjeri Aboriginal group.
• South Australian Eco-Tourism Industry: Spirit of the Coorong.
• South Australian Tourism Commission.
The benefits and beneficiaries are similar to those listed in the original application. The new major
beneficiaries are the local fishing and tackle retailers in the Fleurieu Peninsula region, South Australian
Tourism Commission and SA Eco-tourism industry operators in the South Fleurieu region, especially
those conducting daily eco-tours from Goolwa, through the Murray Mouth region and into the
Coorong’s North Lagoon.
68

Ye et al. 2013 Flow related fish and fisheries ecology in the Coorong
10. Further Development The results of this study further highlight the need for a more integrated and strategic approach to
restore and maintain improved ecological health in the Coorong and Murray Mouth, and other estuaries
in southeastern Australia, through better knowledge of the role of freshwater in estuarine processes and
functions and improved management of water resources. Research and other activities that should be
undertaken to further develop the results of this research and facilitate more integrated management
strategies include:
Dissemination of results and outputs to relevant stakeholders including: resource managers and policy
makers preparing water and fisheries management plans in South Australia and south-eastern Australia,
i.e. PIRSA, DEWNR, SA MDB NRM Board, MDBA, DSEWPaC, commercial, recreational and
indigenous sectors of the Lakes and Coorong Fishery, Fisheries and other NRM committees; and the
scientific and broader communities. Dissemination of the results has and will involve:
- presentations to the Project Stakeholders and Traditional Owners Committee, and at scientific
forums and relevant meetings of government agencies (PIRSA, DEWNR, SA MDB NRMB,
MDBA, etc);
- media releases where appropriate, e.g. radio or TV interviews and newspaper articles;
- oral presentations to the broader scientific community at relevant conferences; and
- publication of scientific papers in international journals.
Development of quantitative models of ecological performance: The collaborative approach with the
CLLAMMecology team has ensured that key outputs of this project be incorporated in the development
of quantitative models to evaluate and maintain ecological performance, which will be integrated into a
decision support system framework for the region. This collaboration emphasises the importance of
differing freshwater input and flow regimes to the maintenance of fish populations, estuarine health and
productivity, and highlights the importance and linkage of key levers (barrage operation, releases from
upstream storages, Murray Mouth opening and releases from the Upper South East Drainage Scheme) to
the ecosystem health for the CLLAMM region.
Further research on flow-related fish and fisheries ecology for key species is required to better
understand the role and influence of freshwater inflows and the importance of estuarine habitats on the
population dynamics of individual species. Future research should investigate habitat requirements and
resource use for individual species; predator/prey interactions; early life history including factors that
influence recruitment; and immigration and emigration to and from the estuarine system. Further
monitoring and fishery dependent research is required to better understand sustainable fishing rates and
the influence of fishing on broader populations.
Data management after the project’s completion: The data were entered onto a database (ACCESS),
being managed by the PI at SARDI Aquatic Sciences. The data can be provided to the FRDC on
request.
69

Ye et al. 2013 Flow related fish and fisheries ecology in the Coorong
11. Planned outcomes The project outputs have contributed to the following outcomes by:
- Providing baseline data and ecological information on the impacts of no freshwater inflows to
the estuary and management actions on the abundance and distribution of fish populations and
fisheries for the region.
- Providing the collaborative opportunity to incorporate fishery and ecological considerations
through the CSIRO Flagship CLLAMMecology program into a decision-support system
framework for the region that can be used to quantify the environmental, socio-economic
tradeoffs of water use in the Murray-Darling Basin.
- Facilitating improved ecological health in the Coorong and Murray Mouth, and other estuaries
in southeastern Australia, through better knowledge of the role of freshwater in estuarine
processes and functions and improved management of environmental flows.
- Increasing awareness and promoting sustainable production of both the Lower Lakes irrigation
agriculture and estuarine fisheries from the water resources available as a consequence of a
better understanding of the relative importance of freshwater flows to these industries.
- Providing key biological and ecological information that is relevant to fisheries in southern
temperate estuaries because the importance of freshwater flows to estuarine fisheries remains
poorly understood.
- Facilitating well informed ecosystem-based environmental and fishery management by PIRSA
and other partner agencies in the CLLAMM region (DEWNR and SA MDB NRMB) by
providing a better understanding of flow related fish ecology.
- Encouraging Water Management Plans and other related Natural Resource Management Plans
to allocate water in an ecologically sustainable manner that will help restore and maintain
ecological processes and sustainable production.
- Highlighting the importance of freshwater flow to fish habitats and recruitment in estuaries,
emphasising that maintaining a salinity gradient and connectivity between the freshwater,
Coorong and marine system is paramount to the ecological heath of the Coorong fish
community and the fishery. The communication of results from this study will increase
stakeholder and community awareness about the environmental and economic benefits of
providing freshwater flows to estuaries.
- In addition to the FRDC final report, communication of the project results has been and will be
conducted through publications in scientific journals and presentations to the Stakeholders and
Traditional Owners Committee (involving PIRSA, DEWNR, commercial and recreational
fishing industry and Ngarrindjeri Traditional Owners) and other NRM committees (e.g.
CLLMM Science Advisory Group), and to the broader scientific community at relevant
workshops and conference.
70

Ye et al. 2013 Flow related fish and fisheries ecology in the Coorong
12. Conclusion Reduced freshwater inflows to the Murray Mouth and Coorong estuary due to the over-exploitation and
diversion of freshwater resources in the Murray-Darling Basin has been identified as a major threat to
the local estuarine ecosystem including fish populations and the productivity of the commercial and
recreational fisheries. While a number of environmental flow options/scenarios have been considered to
help improve the social, economic and environmental value of the system, there is a lack of biological
and ecological knowledge which is required to identify the environmental flow requirements and assess
and predict the potential environmental benefits of the different management options. Knowledge gaps
include flow-related fish ecology, which is critical for water management to enhance spawning,
recruitment and habitat availability for native fish, thus supporting ecologically sustainable fisheries in
the region.
The South Australian Lakes and Coorong Fishery Management Plan identified flows as an important
issue impacting key commercial and recreational fish species. However, there has been little research on
specific flow and habitat requirements of these fish. This led to the present study, aiming to address
flow-related ecology of key fish species of commercial, recreational, conservation or ecological
significance (A. butcheri, R. tapirina, A. forsteri, P. urvillii and A. tamarensis) in the Murray Estuary
and Coorong. The lack of freshwater flows during the study period precluded any in-situ investigation
of ecological response to flow events in the Coorong. Nevertheless, a strong north-south salinity
gradient that increased with distance from the Murray Mouth persisted throughout the study, allowed us
to study the impact of ‘lack of flows’ on fish assemblages and various aspects of biology and ecology in
the region.
There is a high likelihood that the extended drought conditions and the subsequent lack of freshwater
input and increases in salinity throughout the Murray Mouth and Coorong influenced the composition of
fish assemblages observed in this study. These conditions may have negative implications for R.
tapirina, A. hololepidotus, A. butcheri and P. urvillii based on knowledge of the life histories of these
species and low densities recorded in the current study. The decline in species diversity with distance
from the mouth is likely a response to the greater osmoregulatory stress and diminishing food resources,
thus providing limited opportunities for only the few highly salt-tolerant species to extend their
ecological niche. We recommend that the results of this study be treated as a baseline by which future
quantitative assessments are made, particularly under non-drought conditions.
The reproductive biology for the five key species during drought conditions was examined. Sex ratios
for all species, were heavily weighted towards females. Most species, with the exception of A. forsteri,
exhibited plasticity in size at maturity either between different regions or as a result of environmental
change or external stressors. Seasonal spawning guilds were identified for all species, consisting of
spring (A. butcheri), spring/summer (A. tamarensis), summer/autumn/winter (A. forsteri) and winter (R.
tapirina and P. urvillii) spawners. Microscopic analysis of gonads suggested spawning for P. urvillii
may not have occurred in the Coorong during this study. It is highly likely that the reduction in the
71

Ye et al. 2013 Flow related fish and fisheries ecology in the Coorong
amount of available habitat induced by the low flow conditions and the absence of flow-induced
spawning cues during the study period had direct impacts on the reproductive biology of the key species
examined. Maintaining appropriate salinity ranges and connectivity between fresh, estuarine and marine
waters is integral for the spawning and recruitment of many of the key Coorong species.
An experimental approach investigating the influence of hypersalinity on juveniles of the key fish
species was conducted to assess the influence of hypersaline conditions on early life survival. Juveniles
of all species trialled tolerated high salinity levels approximately twice the concentration of seawater.
There was, however, a gradient of relative tolerance across species. Behavioural response measures
during gradual salinity increase provided additional insight into the sub-lethal impacts. The maximum
field salinities at which species were caught in the fish assemblage study divided species into two
groups, with species captured in salinities of over 74 ppt and those below 60 ppt. These field patterns
suggest that the tolerance thresholds for the species at 14 oC were closely related to their distribution
throughout the Coorong during 2006 to 2008. A key outcome of the current study is the application of
experimentally derived tolerance thresholds to the distribution of fish across a natural salinity gradient
in the field. The results suggest that threshold values, in particular LC for 10% and 50% mortalities, can
approximate the maximum salinity extent of field distribution of species with moderate accuracy.
Finally, we used time series analysis to explore the relationships between freshwater flow and monthly
commercial catches of key species in the South Australian Lakes and Coorong Fishery between July
1984 and June 2008. For A. butcheri and large A. hololepidotus (taken from outside the Murray Mouth),
catches were best predicted by univariate models (i.e. catches in the previous year alone). For A. forsteri
and small A. hololepidotus (taken from inside the Murray Mouth), multivariate models slightly
improved predictive power when accounting for the effects of flow and other species catch. For
example, it was indicated that increased flow leads to additional catch of A. forsteri during the same
month, whereas catch of this species had a negative relationship with the catch of A. hololepidotus
outside the Murray Mouth, suggesting a fisher targeting behaviour influence. No model could be
specified for R. tapirina. Although this study identified limitations of time series modelling when
applied to commercial catch data of the Lakes and Coorong Fishery, some of these limitations may be
overcome with careful planning of further research. It therefore remains a potentially useful tool to
describe the influence of flows on fishery production, as has been demonstrated in other fisheries.
Despite the preclusion of any in-situ investigation on the ecological response of fish ecology to
freshwater flows to the Coorong, this project has successfully delivered upon its four research
objectives. The findings of this research provides important baseline information in fish and fisheries
ecology in the Murray Mouth and Coorong that can be used to compare the effect of various flow
regimes and management scenarios or actions on the fish populations and fisheries for the region. The
outcomes of the project also provide a unique opportunity to incorporate fishery and ecological
information through collaboration with the CSIRO Flagship CLLAMMecology Program that can be
used to develop a decision-support system framework for the region. The findings of this study facilitate
72

Ye et al. 2013 Flow related fish and fisheries ecology in the Coorong
the development of management strategies that will contribute to improved ecological health in the
Coorong and Murray Mouth, and other estuaries in southeastern Australia.
73

Ye et al. 2013 Flow related fish and fisheries ecology in the Coorong
References
Akin S. and Neill W. H. (2003) Routine metabolism of mosquitofish (Gambusia affinis) at three different salinities. Texas Journal of Science, 55, 255-262.
Boeuf G. and Payan P. (2001) How should salinity influence fish growth? Comparative Biochemistry and Physiology Part C: Toxicology and Pharmacology, 130, 411-423.
Bucater L. B., Livore J. P., Noell C. J. and Ye Q. (2013). Temporal variation of larval fish assemblages of the Murray Mouth in prolonged drought conditions. Marine and Freshwater Research. http://dx.doi.org/10.1071/MF12278.
Bye V. J. (1984) The role of environmental factors in the timing of reproductive cycles. In Fish reproduction: strategies and tactics. (Eds G.W. Potts and R.J. Wootton). (Acadmeic Press Inc: London, United Kingdom).
Cadwallader P. L. and Backhouse G. N. (1983) A Guide to the freshwater fish of Victoria (Victorian Government Printing Office: Melbourne, Australia).
Cheshire K. J. M., Ye Q., Fredberg J., Short D. and Earl J. (2013). Aspects of reproductive biology of five key fish species in the Murray Mouth and Coorong. South Australian Research and Development Institute (Aquatic Sciences), Adelaide. SARDI Publication No. F2009/000014-3. SARDI Research Report Series No. 699. 63pp.
Chubb C. F., Potter I. C., Grant C. J., Lenanton R. C. J. and Wallace J. (1981) Age structure, growth rates and movements of sea mullet, Mugil cephalus L., and yellow-eye mullet, Aldrichetta forsteri (Valenciennes), in the Swan-Avon River system, Western Australia. Australian Journal of Marine and Freshwater Research, 32, 605-628.
Clarke K. R. and Warwick, R. M. (2001) Change in Marine Communities: An Approach to Statistical Analysis and Interpretation. PRIMER-E Ltd: Plymouth, UK.
Colburn E. A. (1988) Factors influencing species diversity in saline waters of Death Valley, USA. Hydrobiologia, 158, 215-226.
Coutin P., Walker S. and Morison A. (Eds) (1997) Black bream - 1996. Complied by the Bay and Inlet Fisheries and Stock Assessment Group. Fisheries Victoria Assessment Report No. 14. (Fisheries Victoria: Melbourne).
Crawford C. M. (1984) An ecological study of Tasmanian flounder. PhD thesis, University of Tasmania. Hobart.
Crook D. A., Koster W. M., Macdonald J. I., Nicol S. J., Belcher C. A., Dawson D. R., O’Mahony D. J., Lovett D., Walker A. and Bannam L. (2010) Catadromous migrations by female tupong (Pseudaphritis urvillii) in coastal streams in Victoria, Australia. Marine and Freshwater Research, 61, 474-483.
Davis R. and Hirji R. (2003a). Environmental flows: concepts and methods. Water Resources and Environment Technical Note C1, The World Bank, Washington, DC.
Davis R. and Hirji R. (2003b). Environmental flows: case studies. Water Resources and Environment Technical Note C2, The World Bank, Washington, DC.
Davis R. and Hirji R. (2003c). Environmental flows: flood flows. Water Resources and Environment Technical Note C3, The World Bank, Washington, DC.
74

Ye et al. 2013 Flow related fish and fisheries ecology in the Coorong
Dyson M., Bergkemp G. and Scanlon J. (2003). ‘Flow: the Essentials of Environmental Flows.’ (IUCN: Gland, Switerzland).
DWLBC (2008) Fact sheet 23: Murray Mouth sand pumping project. The Department of Water, Land and Biodiversity Conservation: Adelaide, South Australia.
Eckert J. and Robinson R. D. (1990) The fishes of the Coorong. The South Australian Naturalist, 65, 430.
Ferguson G. (2007) The South Australian greenback flounder (Rhombosolea tapirina) fishery. Fisheries Assessment Report for PIRSA Fisheries. South Australian Research and Development Institute, Aquatic Sciences, SARDI Aquatic Sciences Publication No. RD 2007/00315-1, SARDI Research Report Series No. 221, Adelaide, SA.
Ferguson G., Ward T. and Geddes M. C. (2008) Do recent age structures and historical catches of mulloway, Argyrosomus japonicus (Sciaenidae), reflect freshwater inflows in the remnant estuary of the Murray River, South Australia? Aquatic Living Resources 21, 145-152.
Ferguson G. J. and Ward T. (2003) Mulloway (Argyrosomus japonicus) fishery. Fishery assessment report, RD03/0040. South Australian Research and Development Institute (Aquatic Sciences):
Fowler A. J., McLeay L. and Short D. A. (1999) Reproductive mode and spawning information based on gonad analysis for the King George whiting (Percoidei: Sillaginidae) from South Australia. Marine and Freshwater Research, 50, 1-14.
Geddes M. C. (1979) Salinity tolerance and osmotic behaviour of European carp (Cyprinus carpio L.) from the River Murray, Australia. Transactions of the Royal Society of South Australia, 103, 185-189.
Geddes M. and Bulter A. (1984) Physicochemical and biological studies on the Coorong lagoons, South Australia, and the effect of salinity on the distribution of the macrobenthos. Transactions of the Royal Society of South Australia, 108, 51-62.
Geddes M. (1987) Changes in salinity and in the distribution of macrophytes, macrobenthos and fish in the Coorong Lagoons, South Australia, following a period of River Murray flow. Transactions of the Royal Society of South Australia, 111, 173-181.
Geddes M. C. (2003) Survey to investigate the ecological health of the North and South Lagoons of the Coorong, June/July 2003. Report prepared for the Department of Environment and Heritage and the Department of Water, Land and Biodiversity Conservation. South Australian Research and Development Institute (Aquatic Sciences): Adelaide, South Australia. SARDI Aquatic Sciences Publication No. RD03/0103.
Geddes M. (2005a) The ecological health of the North and South Lagoons of the Coorong in July 2004. Final report. SARDI Aquatic Sciences, No. RD03/0272-2, Adelaide.
Geddes M. C. (2005b) The ecological health of the North and South Lagoons of the Coorong in July 2004. Report prepared for the Department of Water, Land and Biodiversity Conservation. South Australian Research and Development Institute (Aquatic Sciences): Adelaide, South Australia. SARDI Aquatic Sciences Publication No. RD03/0272-2.
Geddes M. C. (2005c) Ecological outcomes from the small barrage outflow of August 2004. South Australian Research and Development Institute (Aquatic Sciences): Adelaide, South Australia. SARDI Aquatic Sciences Publication No. RD05/0018-1.
75

Ye et al. 2013 Flow related fish and fisheries ecology in the Coorong
Geddes M. C. and Weddeburn S. D. (2007) Fish monitoring below tidal barrages in Boundary Creek and Mundoo Channel during freshwater inflow to the River Murray estuary in 2005 and 2006. Report prepared for the Department of Water, Land and Biodiversity Conservation. The University of Adelaide: Adelaide.
Gillanders B. M. and Kingsford M. J. (2002) Impact of changes in flow of freshwater on estuarine and open coastal habitats and the associated organisms. Oceanography and Marine Biology: an Annual Review, 40, 233-309.
Gomon M. F., Bray D. J. and Kuiter R. H. (2008) Fishes of Australia’s South Coasts. Reed New Holland, Museum Victoria.
Griffiths S. P. and West R. J. (1999) Preliminary assessment of shallow water fish in three small intermittently open estuaries in south-eastern Australia. Fisheries Management and Ecology, 6, 311-321.
Gunther G. (1956) Some relations of faunal distributions to salinity in estuarine waters. Ecology, 37, 616-619.
Haddy J. A. and Pankhurst N. W. (1998) Annual change in reproductive condition and plasma concentrations of sex steroids in black bream, Acanthopagrus butcheri (Munro) (Sparidae). Marine and Freshwater Research, 49, 389-397.
Haddy J. and Pankhurst N. (2000) The effects of salinity on reproduction development, plasma steroid levels, fertilisation and egg survival in black bream Acanthopagrus butcheri. Aquaculture, 188,115-131.
Hall D. (1984) The Coorong: biology of the major fish species and fluctuations in catch rates1976-1984. SAFIC, 8, 3-17.
Hall D. A. (1986). An assessment of the mulloway (Argyrosomus hololepidotus) fishery in South Australia with particular reference to the Coorong lagoon. Department of Fisheries, South Australia.
Harbison I. P. (1974) The black bream in the Onkaparinga Estuary: a study of the age structure, spawning cycle and feeding relationships of Acanthopagrus butcheri (Munro) in the Onkaparinga Estuary, South Australia, during the months May-December 1973. Diploma of Education thesis, Department of Biology, Salisbury College of Advanced Education. Salisbury.
Harris J. A. (1968) The yellow-eye mullet: age structure, growth rate and spawning cycle of a population of yellow-eye mullet Aldrichetta forsteri (Cuv. and Val.) from the Coorong Lagoon, South Australia. Transactions of the Royal Society of South Australia, 92, 37-50.
Hart B. T., Bailey P., Edwards R., Hortle K., James K., McMahon A., Meredith C. and Swadling K. (1991) A review of the salt sensitivity of the Australian freshwater biota. Hydrobiologia, 210,105-144.
Hart P. R. and Purser G. J. (1995). Effects of salinity and temperature n eggs and yolk sac larvae of the greenback flounder (Rhombosolea tapirina Gunther, 1862). Aquaculture, 136, 221-230.
Higham J., Hammer M. and Geddes M. (2002) Fish and invertebrates. In The Murray Mouth: Exploring the Implications of Closure or Restricted Flow (Murray-Darling Basin Commission), pp. 53-63. Murray-Darling Basin Commission: Canberra.
Hobday D. and Moran M. (1983) Age, growth and fluctuating year class strength in black bream in Gippsland Lakes, Victoria. Marine Science Laboratories, Ministry of Conservation: Victoria.
76

Ye et al. 2013 Flow related fish and fisheries ecology in the Coorong
Hoeksema S. D. and Potter I. C. (2006) Diel, seasonal, regional and annual variations in the characteristics of the ichthyofauna of the upper reaches of a large Australian microtidal estuary. Estuarine, Coastal and Shelf Science, 67, 503-520.
Jenkins G. P. (1986) Composition, seasonality and distribution of ichthyoplankton in Port Phillip Bay, Victoria. Australian Journal of Marine and Freshwater Research, 37, 507-520.
Jobling M. (1995) Environmental biology of fishes (Chapman and Hall Publishers: London, United Kingdom).
Kailola P. J., Williams M. J., Stewart P. C., Reichelt R. E., McNee A. and Grieve C. (Eds) (1993) Australian Fisheries Resources. (Bureau of Resource Sciences, Department of Primary Industries and Energy and the Fisheries Research and Development Corporation: Canberra).
Kefford B. J., Papas P. J., Metzeling L. and Nugegoda D. (2004) Do laboratory salinity tolerances of freshwater animals correspond with their field salinity? Environmental Pollution, 129, 355-362.
Kingsford R. T. (2000). Ecological impacts of dams, water diversions and river management on floodplain wetlands in Australia. Austral Ecology, 25, 109-127.
Kurth D. (1957) An investigation of the greenback flounder, Rhombosolea tapirina Günther. PhD thesis, University of Tasmania. Hobart.
Larson H. K. and Hoese D. F. (1996) Family Gobiidae, subfamilies Gobiinae and Gobiinellinae: Gobies. In Freshwater Fishes of Southeastern Australia (McDowall, R. M., ed.), pp. 220-228. Reed Books: Sydney.
Last P. R., Scott E. O. G. and Talbot F. H. (1983) Fishes of Tasmania (Tasmanian Fisheries Development Authority: Hobart).
Lenanton R. C. J. (1982) Alternative non-estuarine nursery habitats for some commercially and recreationally important fish species of south-western Australia. Australian Journal of Marine and Freshwater Research, 33, 881-900.
Lloret J., Lleonart J. and Solé I. (2000) Time series modelling of landings in Northwest Mediterranean Sea. ICES Journal of Marine Science, 57, 171-184.
Lui L. (1969) Salinity tolerance and osmoregulation of Taeniomembers microstomus (Gunther, 1861) (Pisces: Mugiliformes: Atherinidae) from Australian salt lakes. Marine and Freshwater Research, 20, 157-162.
McNeil D. G., Westergaard S. and Ye Q. (2010a) Chapter 2. Juvenile salinity tolerance of eight native fish species from the Lower River Murray, South Australia. In influences of salinity, water quality and hydrology on the early life stages of fishes in the Lower River Murray, South Australia. In 'Influences of salinity, water quality and hydrology on early life stages of fishes in the Lower River Murray, South Australia.' (Eds Q. Ye, K. J. Cheshire and D. G. McNeil) pp. 48-72. (South Australian Research and Development Institute (SARDI), Aquatic Sciences: Adelaide, Australia) SARDI Publication No. F2009/000470-2. SARDI Research Report Series No. 446: Adelaide).
McNeil D. G., Westergaard S. and Ye Q. (2010b) Chapter 3. Larval salinity tolerance of nine native fish species from the Lower River Murray, South Australia. In Influences of salinity, water quality and hydrology on early life stages of fishes in the Lower River Murray, South Australia. In 'Influences of salinity, water quality and hydrology on early life stages of fishes in the Lower River Murray, South Australia. .' (Eds Q. Ye, K. J. Cheshire and D. G. McNeil) pp. 73-102. (South Australian Research and
77

Ye et al. 2013 Flow related fish and fisheries ecology in the Coorong
Development Institute (SARDI), Aquatic Sciences: Adelaide, Australia) SARDI Publication No. F2009/000470-3. SARDI Research Report Series No. 446: Adelaide).
McNeil D. G., Westergaard S. and Ye Q. (2010c) Chapter 4. The impact of salinity on egg development of four species of native fish from the Lower River Murray, South Australia. In Influences of salinity, water quality and hydrology on early life stages of fishes in the Lower River Murray, South Australia. In 'Influences of salinity, water quality and hydrology on early life stages of fishes in the Lower River Murray, South Australia.' (Eds Q. Ye, K. J. Cheshire and D. G. McNeil) pp. 103-127. (South Australian Research and Development Institute (SARDI), Aquatic Sciences: Adelaide, Australia) SARDI Publication No. F2009/000470-4. SARDI Research Report Series No. 446: Adelaide).
McNeil D. G., Westergaard S., Cheshire K. J. M., Noell C. J. and Ye Q. (2013). Effects of hypersaline conditions upon six estuarine fish species from the Coorong and Murray Mouth. South Australian Research and Development Institute (Aquatic Sciences), Adelaide. SARDI Publication No. F2009/000014-4. SARDI Research Report Series No. 700. 27pp.
Molsher R. L., Geddes M. C. and Paton D. C. (1994) Population and reproductive ecology of the small-mouthed hardyhead Atherinosoma microstoma (Gunther) (Pisces: Atherinidae) along a salinity gradient in the Coorong, South Australia. Transactions of the Royal Society of South Australia, 118, 207-216.
Morison A. K., Coutin P. C. and Robertson S. G. (1998) Age determination of black bream, Acanthopagrus butcheri (Sparidae), from the Gippsland Lakes of south-eastern Australia indicates slow growth and episodic recruitment. Marine and Freshwater Research, 49, 491-498.
Newton G. M. (1996) Estuarine ichthyoplankton ecology in relation to hydrology and zooplankton dynamics in a salt-wedge estuary. Marine and Freshwater Research, 47, 99-111.
Noell C., Ye Q., Short D. A., Bucater L. B. and Wellman N. R. (2009) Fish assemblages of the Murray Mouth and Coorong region, South Australia, during an extended drought period. CSIRO: Water for a healthy Country National Research Flagship and South Australia Research and Development Institute (Aquatic Sciences), Adelaide, Adelaide, SA.
Noell C. J. and Ye Q. (2013). An investigation into the relationship between freshwater flow and production of key species in the South Australian Lakes and Coorong Fishery. South Australian Research and Development Institute (Aquatic Sciences), Adelaide. SARDI Publication No. F2009/000014-5. SARDI Research Report Series No 701. 64pp.
Norriss J. V., Tregonning J. E., Lenanton R. C. J. and Sarre G. A. (2002) Biological synopsis of the black bream, Acanthopagrus butcheri (Munroe) (Teleostei: Sparidae) in Western Australia with reference to information from other South states. Department of Fisheries, Western Australia, Fisheries Research Report No. 93, Perth.
Pellizzari M. (2002) The early-life history of yellow-eye mullet (Aldrichetta forsteri), in the Coorong lagoon, South Australia, determined via analysis of otolith microstructure. Unpublished honours thesis, Department of Environmental Biology, University of Adelaide, Australia.
Potter I. C., Hyndes G. A. and Baronie F. M. (1993) The fish fauna of a seasonally closed Australian estuary. Is the prevalence of estuarine-spawning species high? Marine Biology, 116, 19-30.
Potter I. C. and Hyndes G. A. (1994) Composition of fish fauna of a permanently open estuary on the South coast of Australia, and comparisons with nearby seasonally closed estuary. Marine Biology, 121, 199-209.
78

Ye et al. 2013 Flow related fish and fisheries ecology in the Coorong
Potter I. C. and Hyndes G. A. (1999) Characteristics of the ichthyofaunas of southwestern Australian estuaries, including comparisons with holarctic estuaries and estuaries elsewhere in temperate Australia: A review. Australian Journal of Ecology, 24, 395-421.
Sarre G. and Potter I. (2000) Variation in age compositions and growth rates of Acanthopagrus butcheri (Sparidae) among estuaries: some possible contributing factors. Fishery Bulletin, 98, 785-799.
Sarre G. A. (1999) Age composition, growth rates, reproductive biology and diets of the black bream (Acanthopagrus butcheri) in four estuaries and a coastal saline lake in south western Australia. PhD thesis, Murdoch University. Perth
SPSS Inc. (n.d.a). PASW® Forecasting 18. SPSS Inc.: Chicago.
SPSS Inc. (n.d.b). TSMODEL Algorithms. In PASW® Statistics 18 Algorithms, pp. 868-884. SPSS Inc.: Chicago.
Stearns S. C. and Crandall R. E. (1984) Plasticity for age and size at sexual maturity: a life-history response to unavoidable stress. In Fish reproduction: strategies and tactics. (Eds G.W. Potts and R.J. Wootton). (Academic Press Incorporated Limited: London, UK).
Thomson J. M. (1957) Biological studies of economic significance of the yellow-eye mullet, Aldrichetta forsteri (Cuvier and Valenciennes) (Mugilidae). Australian Journal of Marine and Freshwater Research, 8, 1-13.
Thomson J. M. (1996) Family Mugilidae: grey mullets. In Freshwater Fishes of South-Eastern Australia. (Ed. R.M. McDowall) pp. 191-197. (Reed Books: Sydney).
Valesini F. J., Potter I. C., Platell M. E. and Hyndes G. A. (1997) Ichthyofaunas of a temperate estuary and adjacent marine embayment. Implications regarding choice of nursery area and influence of environmental changes. Marine Biology, 128, 317-328.
Vance D. J., Haywood M. D. E., Heales D. S., Kenyon R. A. and Loneragan, N. R. (1998). Seasonal and annual variation in abundance of postlarval and juvenile banana prowns Penaeus merguiensis and environmental variation in two estuaries in tropical northeastern Australia: a six year study. Marine Ecology Progress Series, 163, 21-36.
Vega-Cendejas M. E. and Hernández de Santillana M. (2004) Fish community structure and dynamics in a coastal hypersaline lagoon: Rio Lagartos, Yucatan, Mexico. Estuarine, Coastal and Shelf Science, 60, 285-299.
Webster I. T. (2005) An overview of the hydrodynamics of the Coorong and Murray Mouth. Water for a Healthy Country National Research Flagship, CSIRO.
Whitfield A. K. (1999) Ichthyofaunal assemblages in estuaries: a South African case study. Reviews in Fish Biology and Fisheries, 9,151-186.
Wootton R. J. (Ed.) (1998) Ecology of teleost fishes (2nd Edn). (Kluwer Academic Publishers Dordrecht, The Netherlands).
Yaron Z. and Sivan B. (2006) Reproduction In The physiology of Fishes (3rd Edn). (Eds D.H. Evans and J.B. Claiborne) pp. 343-386. (CRC Press: United States of America).
79

Ye et al. 2013 Flow related fish and fisheries ecology in the Coorong
Yearsley G. K., Last P. R. and Hoese D. F. (2006) Standard Names of Australian Fishes. (CSIRO Marine and Atmospheric Research Paper 009.) CSIRO Marine and Atmospheric Research: Hobart, Australia.
Young G. C. and Potter I. C. (2002) Influence of exceptionally high salinities, marked variations in freshwater discharge and opening of estuary mouth on the characteristics of the ichthyofauna of a normally-closed estuary. Estuarine, Coastal and Shelf Science, 55, 223-246.
Zampatti, B. P, Bice, C. M. and Jennings, P. R. (2011) Movements of female congolli (Pseudaphritis urvillii) in the Coorong and Lower Lakes of the River Murray. South Australian Research and Development Institute (Aquatic Sciences), Adelaide. SARDI Publication No. F2011/000333-1. SARDI Report Series No. 577. 32pp.
Zar J. H. (2009) Biostatistical Analysis. Prentice-Hall: Upper Saddle River, New Jersey.
80

Ye et al. 2013 Flow related fish and fisheries ecology in the Coorong
List of Figures
Figure 6.1. Map showing the location of the Murray Mouth and Coorong region in relation to the Murray River and lower lakes (Lakes Alexandrina and Albert). Dashed lines indicate the Murray Mouth, North Lagoon and South Lagoon sub-regions. Inset map shows the locations of the five barrages (red lines) and the Murray Mouth within the Murray Mouth sub-region........................................................................................................................................... 14
Figure 6.2: Average monthly flow volume across the barrages from January 1968 to October 2008 (source: MDBC 2008). Asterisk (*) indicates commencement of current study. 2nd Y-axis indicates the mean monthly water level (in metres Australian Height Datum, AHD) for Lake Alexandrina above Goolwa Barrage (source: DWLBC 2008). ... 15
Figure 6.3. Map showing the location of the Murray Mouth (fishing areas 6-8), North Lagoon (9-11), South Lagoon (12-14), and coastal waters (outside the Murray Mouth) (15-16) subregions of the Lakes and Coorong Fishery. .... 22
Figure 7.1. Mean values ± 1 S.E. for water temperature, salinity, dissolved oxygen, pH and secchi depth for subregions on each sampling occasion (sites pooled, left graphs) and for each site (sampling occasions pooled, right graphs: see Noell et al. (2009) for map showing location of individual sites) within the Murray Mouth and Coorong region between October 2006 and September 2008. .................................................................................................. 24
Figure 7.2. Dendrogram of the species abundance data for all 100 seine net samples (10 sites × 10 sampling occasions) collected from the Murray Mouth, North Lagoon and South Lagoon subregions between October 2006 and September 2008. Classification of samples was carried out using group average clustering from Bray-Curtis similarities (including a dummy variable) on fourth-root transformed data. The six similarity profile groups (Groups IS-VIS) are indicated by the vertical branches with arrowheads that bisect the 48% similarity threshold. ................. 28
Figure 7.3. MDS ordination of the species abundance data for all 100 seine net samples (10 sites × 10 sampling occasions) collected from the Murray Mouth, North Lagoon and South Lagoon subregions between October 2006 and September 2008. Boundaries indicate the six similarity profile groups (Groups IS-VIS) at similarity levels of 48%. Stress = 0.14. ..................................................................................................................................................... 29
Figure 7.4. Length-frequency histograms for A. forsteri collected from the Murray Mouth and Coorong region between October 2006 and September 2008 using seine and gill nets (black and white bars, respectively). Dashed lines indicate modal progression of probable year classes. nS = number of fish collected using seine net, nG = number of fish collected using gill nets. Percentages in parentheses indicate that a subsample was measured. ........ 32
Figure 7.5. Length-frequency histograms for A. hololepidotus from the Murray Mouth and Coorong region between October 2006 and September 2008 using seine and gill nets (black and white bars, respectively). Dashed lines indicate modal progression of probable year classes. nS = number of fish collected using seine net, nG = number of fish collected using gill nets. Percentages in parentheses indicate that a subsample was measured........................... 33
Figure 7.6. Temporal trends in GSI (± s.e.) (dotted line) for a) female (n = 91) and b) male (n= 39) A. butcheri in the Coorong from July 2007 to July 2008. Solid black line is mean monthly temperature. ............................................. 34
Figure 7.7. Temporal trends in macroscopic stages of gonad development (frequency %) for female A. butcheri in the Coorong from July 2007 to July 2008. (n = 91).................................................................................................... 35
Figure 7.8. Temporal trends in GSI (± s.e.) (dotted line) for a) female (n = 479) and b) male (n = 125) A. forsteri in the Coorong from July 2007 to July 2008. Solid black line is mean monthly temperature. ....................................... 36
Figure 7.9. Temporal trends in macroscopic stages of gonad development (frequency %) for female A. forsteri in the Coorong from July 2007 to July 2008 (n = 479). ....................................................................................................... 37
Figure 7.10. Temporal trends in GSI (± s.e.) (dotted line) for a) female (n = 105) and b) male (n = 3) R. tapirina in the Coorong from July 2007 to July 2008. Solid black line is mean monthly temperature ........................................ 38
Figure 7.11. Temporal trends in macroscopic stages of gonad development (frequency %) for female R. tapirina in the Coorong from July 2007 to July 2008. (n = 105).................................................................................................. 38
81

Ye et al. 2013 Flow related fish and fisheries ecology in the Coorong
Figure 7.12. Temporal trends in GSI (± s.e.) (dotted line) for a) female (n = 420) and b) male (n = 137) A. tamarensis the Coorong from July 2007 to July 2008. Solid black line is mean monthly temperature ................. 40
Figure 7.13. Temporal trends in macroscopic stages of gonad development (frequency %) for female A. tamarensis in the Coorong from July 2007 to July 2008. (n = 420).............................................................................................. 40
Figure 7.14. Temporal trends in GSI (± s.e.) (dotted line) for a) female (n = 364) and b) male (n = 48) P. urvillii in the Coorong from July 2007 to July 2008. Solid black line is mean monthly temperature ........................................ 41
Figure 7.15. Temporal trends in macroscopic stages of gonad development (frequency %) for female P. urvillii in the Coorong from July 2007 to July 2008. (n = 364).................................................................................................. 42
Figure 7.16. Lethal Concentration (LC) range LC10, LC50 (+ standard error) and LC90 values for salinity determined at (a) 14 °C and (b) 23 °C for juveniles of six estuarine species of fish, estimated using Probit analysis. Observed field salinity is also shown.......................................................................................................................................... 43
Figure 7.17. Survival, feeding vigour and indications of stress with increasing salinity (a) 14 °C (‘winter’) and (b) 23 °C (‘summer’) temperatures for juvenile A. hololepidotus. ................................................................................... 46
Figure 7.18. Salinity concentration with distance from the Murray Mouth against time; with LC50 values determined at 14 °C and 23 °C and field observations (◦ = relative abundance, from Section 6.2) plotted for juvenile A. hololepidotus. ............................................................................................................................................................. 46
Figure 7.19 Salinity concentration with distance from the Murray Mouth against time; with LC50 values determined at 14 °C and 23 °C and field observations (◦ = relative abundance, from Noell et al., 2009) plotted for juvenile R. tapirina. ...................................................................................................................................................................... 47
Figure 7.20. Salinity Concentration with distance from the Murray Mouth against time; with LC50 values determined at by Lui (1969) and field observations (◦ = relative abundance, from Section 6.2) plotted for juvenile A. microstoma. ................................................................................................................................................................ 48
Figure 7.21. Monthly time series of catch (kg) of (a) Acanthopagrus butcheri, (b) Aldrichetta forsteri, (c) Argyrosomus hololepidotus A (inside the Murray Mouth), (d) A. hololepidotus B (outside the Murray Mouth) and (e) Rhombosolea tapirina from the Lakes and Coorong Fishery between July 1984 and June 2008. Also shown is the number of areas fished (out of a total of 11, except for A. hololepidotus A and A. hololepidotus B, which are taken from a total of 9 and 2 areas, respectively). Note: where catch represents <5 licence holders, this data is confidential and is therefore omitted from the graph.................................................................................................. 50
Figure 7.22. Monthly time series of (a) flow volume (GL) across the barrages, with corresponding drought periods ≥6 months, and (b) model-interpolated salinities (ppt) throughout the Murray Mouth, North Lagoon and South Lagoons between July 1984 and June 2008. Distance (km) refers to the south-easterly distance along the Coorong from the Murray Mouth. Salinity contours for 30 ppt and 50 ppt are shown to identify brackish (0.5-29.9 ppt), saline (30-49.9 ppt) and hypersaline (≥50 ppt) boundaries along the Coorong. Note: The North and South Lagoons are divided by significant reductions in channel width and depth near Parnka Point at ~55 km from the Murray Mouth. .................................................................................................................................................................................... 51
Figure 7.23. Seasonal adjustment factor (SAF, %) of flow and monthly catch of Acanthopagrus butcheri, Aldrichetta forsteri, Argyrosomus hololepidotus A (inside the Murray Mouth), A. hololepidotus B (outside the Murray Mouth) and Rhombosolea tapirina from the Lakes and Coorong Fishery. The SAF for each calendar month represents the percentage above/below the mean monthly catch obtained between July 1984 and June 2008. ......... 53
82

Ye et al. 2013 Flow related fish and fisheries ecology in the Coorong
List of Tables
Table 6.1. Classification of development of ovaries and testes for macroscopic staging (after Fowler et al. 1999). . 18
Table 6.2. Nominal Key used to score observed feeding response during trials. ....................................................... 20
Table 6.3. Nominal Key used to score observations of stress during trials. ............................................................... 20
Table 7.1.Life-cycle category, ranking by abundance (R), relative abundance (n), and percentage contribution (%) of each fish species in the Murray Mouth, North Lagoon and South Lagoon subregions, derived from seine net samples collected at all sites between October 2006 and September 2008. Mean lengths and length ranges for key species are also given. Numbers were calculated after seine net samples were adjusted to no. fish 500 m-2 and then summed....................................................................................................................................................................... 26
Table 7.2. SIMPER results indicating which species contributed most to the overall dissimilarity between significantly different subregions (from ANOSIM) derived from seine net samples collected at all sites between October 2006 and September 2008. Consistency ratio (CR) is the ratio of the mean to standard deviation of the dissimilarities between groups, with larger values indicating greater consistency. A cumulative cut-off of 75% was applied. Note that non-transformed mean abundances are presented to aid interpretation. ........................................ 29
Table 7.3. Salinity ranges of the key species (R, overall abundance rank) collected using a seine net between October 2006 and September 2008. The occurrence and mean density x of these species at each site (no. fish 500 m
2) is also indicated by shading: (blank) x = 0; 0 < x ≤ 1; 1 < x ≤ 10; 10 < x ≤ 100; 100 < x ≤ 1000; x > 1000. ........................................................................................................................................................................... 30
Table 7.4. Summary of the parameter estimates for the logistic length at maturity curves for each of the key species. .................................................................................................................................................................................... 35
Table 7.5. Summary of LC10, LC50, LC90 estimates (expressed as ppt) and fatal Daily Feeding Response Score (DFRS) for the six key species at 14ºC and 23ºC temperatures compared to field observations obtained from Section 7.1 and 7.2. *possibly affected by another unknown water quality factor. *from Lui (1969)..................................... 44
Table 7.6. Results of two-sample Mann-Whitney U-test for difference in mean monthly catch, number of areas fished and number of active licenses between pre-drought (before 2002) and drought (2002 onward) phases from July 1984 to June 2008. Median values are presented. Abbreviations: n, number of months; Z, Z-statistic. Note: the absolute value of the Z-statistic is used since U is approximately normally distributed for large samples (Zar 2009). .................................................................................................................................................................................... 52
83

Ye et al. 2013 Flow related fish and fisheries ecology in the Coorong
Appendix 1: Staff
Qifeng Ye (Principal Investigator)
Jason Earl
Katherine Cheshire
Craig Noell
Luciana Bucater
Dale McNeil
Josh Fredberg
David Short
Neil Wellman
David Fleer
Simon Westergaard
Appendix 2: Companion studies
The five companion studies for the FRDC Project No. 2006/045 were:
Bucater L. B., Livore J. P., Noell C. J. and Ye Q. (2013). Temporal variation of larval fish assemblages of the Murray Mouth in prolonged drought conditions. Marine and Freshwater Research. http://dx.doi.org/10.1071/MF12278.
Cheshire K. J. M., Ye Q., Fredberg J., Short D. and Earl J. (2013). Aspects of reproductive biology of five key fish species in the Murray Mouth and Coorong. South Australian Research and Development Institute (Aquatic Sciences), Adelaide. SARDI Publication No. F2009/000014-3. SARDI Research Report Series No. 699. 63pp.
McNeil D. G., Westergaard S., Cheshire K. J. M., Noell C. J. and Ye Q. (2013). Effects of hypersaline conditions upon six estuarine fish species from the Coorong and Murray Mouth. South Australian Research and Development Institute (Aquatic Sciences), Adelaide. SARDI Publication No. F2009/000014-4. SARDI Research Report Series No. 700. 27pp.
Noell C. J., Ye Q., Short D. A., Bucater L. B. and Wellman N. R. (2009). Fish assemblages of the Murray Mouth and Coorong region, South Australia, during an extended drought period. CSIRO: Water for a Healthy Country National Research Flagship and South Australian Research and Development Institute (Aquatic Sciences), Adelaide.
Noell C. J. and Ye Q. (2013). An investigation into the relationship between freshwater flow and production of key species in the South Australian Lakes and Coorong Fishery. South Australian Research and Development Institute (Aquatic Sciences), Adelaide. SARDI Publication No. F2009/000014-5. SARDI Research Report Series No 701. 64pp.
Appendix 3: Intellectual Property
All intellectual property arising from this research project has been made publicly available.
84