flow structures of gaseous jets injected into water for
TRANSCRIPT

American Institute of Aeronautics and Astronautics
1
Flow Structures of Gaseous Jets Injected into Water for Underwater Propulsion
Jia-Ning Tang 1 Beijing Institute of Technology, Beijing, 100081, China
University of Michigan, Ann Arbor, MI, 48109, U.S.A.
Chien-Chou Tseng 2 University of Michigan, Ann Arbor, MI, 48109, U.S.A.
Ning-Fei Wang3 Beijing Institute of Technology, Beijing, 100081, China
and
Wei Shyy4 University of Michigan, Ann Arbor, MI, 48109, U.S.A.
Hong Kong University of Science and Technology, Kowloon, Hong Kong
Gaseous jets injected into water are typically found in underwater propulsion, and the flow is essentially unsteady and turbulent. Additionally, the high water-to-gas density ratio can result in complicated flow structures; hence it remains a challenging issue to measure the flow structures numerically and experimentally. To investigate the performance of the underwater propulsion, the detailed Navier-Stokes flow computations are utilized in this paper to elucidate the gas-water interactions under the framework of the volume of fluid (VOF) model. Furthermore, the fluid compressibility, viscosity, and energy transfer are taken into consideration. The numerical results and experimental data are compared, showing that phenomena including expansion, bulge, necking/breaking and back-attack are highlighted in the jet process. The resulting analysis indicates that the pressure difference on the rear and front surfaces of the propulsion system can generate an additional thrust. The strong and oscillatory thrust of the underwater propulsion system is caused by the intermittent pulses of the back pressure and the nozzle exit pressure. As a result, the total thrust in underwater propulsion is not only determined by the nozzle geometry but also by the flow structures and associated pressure distributions.
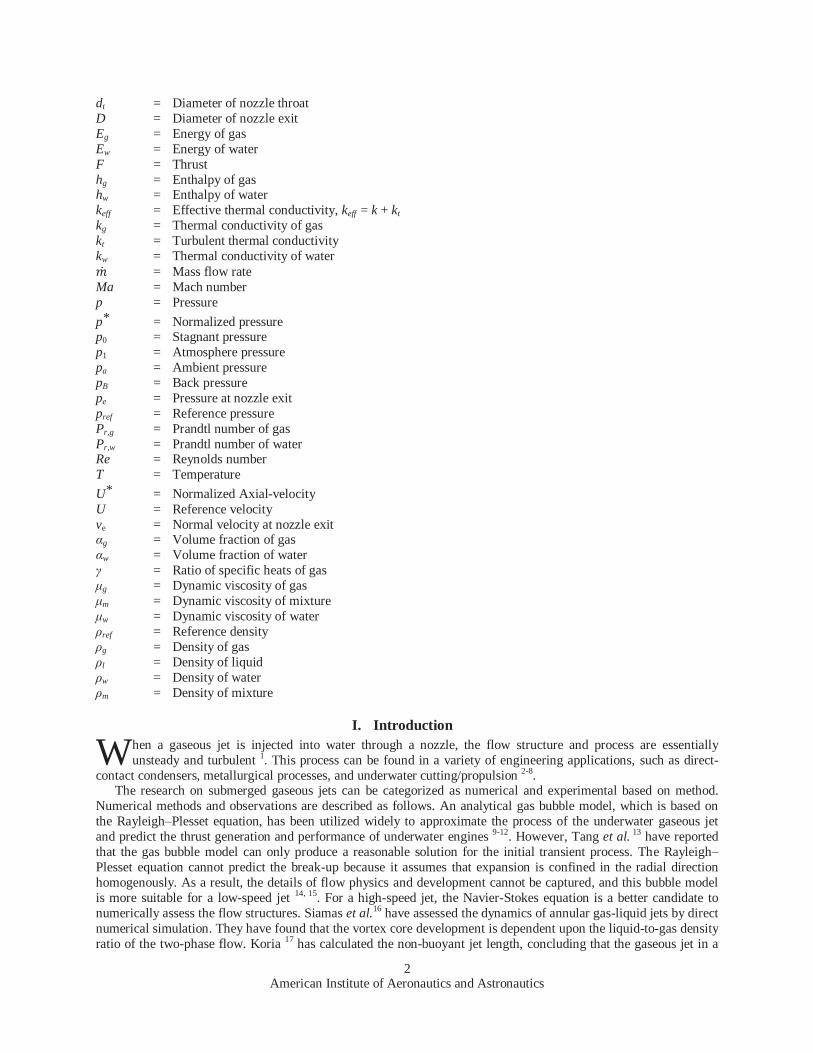
Nomenclature Ae = Area of nozzle exit As = Area of cross-section of propulsion system At = Area of nozzle throat ds = Diameter of cross-section of propulsion system
1 Ph.D. candidate, School of Aerospace Engineering, Beijing Institute of Technology; visiting Ph.D. candidate, Department of Aerospace Engineering, University of Michigan, [email protected], Member AIAA. 2 Ph.D., Department of Mechanical Engineering, University of Michigan, [email protected], Member AIAA. 3 Professor, School of Aerospace Engineering, Beijing Institute of Technology, [email protected], Member AIAA. 4 Clarence L. "Kelly" Johnson Collegiate Professor, Department of Aerospace Engineering, University of Michigan; currently, Provost & Chair Professor, Department of Mechanical Engineering, Hong Kong University of Science and Technology, [email protected], Fellow AIAA.
49th AIAA Aerospace Sciences Meeting including the New Horizons Forum and Aerospace Exposition4 - 7 January 2011, Orlando, Florida
AIAA 2011-185
Copyright © 2011 by the American Institute of Aeronautics and Astronautics, Inc. All rights reserved.
American Institute of Aeronautics and Astronautics
2
dt = Diameter of nozzle throat D = Diameter of nozzle exit Eg = Energy of gas Ew = Energy of water F = Thrust hg = Enthalpy of gas hw = Enthalpy of water keff = Effective thermal conductivity, keff = k + kt kg = Thermal conductivity of gas kt = Turbulent thermal conductivity kw = Thermal conductivity of water
= Mass flow rate Ma = Mach number p = Pressure p* = Normalized pressure p0 = Stagnant pressure p1 = Atmosphere pressure pa = Ambient pressure pB = Back pressure pe = Pressure at nozzle exit pref = Reference pressure Pr,g = Prandtl number of gas Pr,w = Prandtl number of water Re = Reynolds number T = Temperature U* = Normalized Axial-velocity U = Reference velocity ve = Normal velocity at nozzle exit αg = Volume fraction of gas αw = Volume fraction of water γ = Ratio of specific heats of gas μg = Dynamic viscosity of gas μm = Dynamic viscosity of mixture μw = Dynamic viscosity of water ρref = Reference density ρg = Density of gas ρl = Density of liquid ρw = Density of water ρm = Density of mixture
I. Introduction hen a gaseous jet is injected into water through a nozzle, the flow structure and process are essentially unsteady and turbulent 1. This process can be found in a variety of engineering applications, such as direct-
contact condensers, metallurgical processes, and underwater cutting/propulsion 2-8. The research on submerged gaseous jets can be categorized as numerical and experimental based on method.
Numerical methods and observations are described as follows. An analytical gas bubble model, which is based on the Rayleigh–Plesset equation, has been utilized widely to approximate the process of the underwater gaseous jet and predict the thrust generation and performance of underwater engines 9-12. However, Tang et al. 13 have reported that the gas bubble model can only produce a reasonable solution for the initial transient process. The Rayleigh–Plesset equation cannot predict the break-up because it assumes that expansion is confined in the radial direction homogenously. As a result, the details of flow physics and development cannot be captured, and this bubble model is more suitable for a low-speed jet 14, 15. For a high-speed jet, the Navier-Stokes equation is a better candidate to numerically assess the flow structures. Siamas et al.16 have assessed the dynamics of annular gas-liquid jets by direct numerical simulation. They have found that the vortex core development is dependent upon the liquid-to-gas density ratio of the two-phase flow. Koria 17 has calculated the non-buoyant jet length, concluding that the gaseous jet in a
W

American Institute of Aeronautics and Astronautics
3
metal bath disintegrates into a very fine bubble structure within a short distance after the orifice if Ma < 1. As for Ma > 1, the length of the non-buoyant jet is more appreciable, and the collapse of the jet will be delayed. Lindau et al. 18 have developed a computational algorithm to consider the compressible features in multiphase and reacting flows. They have calculated the propulsion plum of a high-speed supercavitating-vehicle and indicated that the effect of mass transfer is slight but noticeable. However, the unsteadiness and turbulence together with the large density ratio across the interfaces lead to difficulties in the numerical approach, and hence it remains challenging to measure and investigate the flow structures with the numerical method.
Experimentally, Surin et al. 19 have indicated that the pulsative regime of gaseous jets in a liquid is connected with the retention of jet flow in the central region. Hoefele and Brimacombe 20 have investigated the dynamics of a gaseous jet discharging horizontally into liquids over a wide range of the gaseous flow rates. They have found that flow regimes and penetration distance depend both on the Froude number and density ratio ρg /ρl. Engh and Nilmani 21 have examined the effects of the high gaseous flow rates and high viscosities in submerged gas injection, and indicated that viscosity can retard the gas flow velocity.
Loth and Faeth 22 and Qi et al. 23 have observed a shock-wave-containing expansion region for air jets into water. This and other shock-related studies place emphasis on the transport/reflection of shock waves 24-28 and the influence of the confined boundary on their structures. For example, Abate and Shyy 26 have investigated the gas dynamic phenomenon of a normal shock wave within a tube undergoing a sudden area expansion. Their investigation focused on multiple gaseous mechanisms associated with highly transient flow and diffraction that give rise to turbulent, compressible, and vortical flows. Under these conditions, shock-strain rate interaction, baroclinic effect, vorticity generation, and different aspects of viscous dissipation have been examined respectively. Dai et al. 29 have evaluated the flow pattern and hydrodynamic effect of underwater gaseous jets from supersonic and sonic nozzles experimentally, in both perfect and imperfect expansion conditions. Their results show that high-speed gaseous jets in still water can induce large pressure pulsations in the upstream of the nozzle exit, and that the shock-cell structures in the over- and under-expanded jets can lead to a strong hydrodynamic pressure. Shi et al. 30, 31 have indicated that the process of supersonic air jets into water causes large flow oscillation, which can be related to shock waves reflecting in the gas phase. Wang et al. 32 have observed the back-attack phenomenon of the jet process experimentally under supersonic conditions. These experimental findings have indicated that the distortion of the gaseous jet can induce a strong pressure pulse behind the nozzle exit. Thus, for underwater propulsion, complicated shockwave structures and pressure oscillation phenomena are likely to be the unique features, as compared to aerial propulsion.
The goal of the present work is to contribute to a better understanding of underwater propulsion mechanisms. This paper aims to study the flow structures of submerged gaseous jets under supersonic conditions and evaluate the corresponding influences on the performance of the underwater propulsion.
II. Modeling and computational approaches
A. Governing equations The set of governing equations consists of the conservative forms of the Navier-Stokes equations, the original k-ε
two-equation turbulence closure, and a transport equation for the gas volume fraction. The continuity, momentum, energy and VOF model equations are given below:
The mixture property, can be expressed as , where φ can be density, viscosity, and so on. The density of gas, ρg, conforms to the ideal gas law ( ), and the density of water, ρw, is assumed to

American Institute of Aeronautics and Astronautics
4
be constant 16, 18, 33. Since the Froude number is O( ), the body force is negligible in Equation (2). In Equation (3), the energy, is defined as follows:
where is the enthalpy based on the specific heat capacity at constant pressure and the temperature. Under our current flow conditions, the water can experience neither cavitation (which appears when local pressure is less than the vapor pressure) nor boiling (which occurs when the local temperature is higher than the boiling point). As a result, the phase change/mass transfer can be neglected, inducing the absence of the additional sink and source terms in Equation (4).
B. Turbulence model The original k-ɛ turbulence model is used in this study. The turbulence kinetic energy, k, and its dissipation rate,
ɛ, are obtained from the following transport equations 16:
where represents the turbulent production term. represents the contribution of the fluctuating dilatation in compressible turbulence to the overall dissipation rate, it is defined as , and is the turbulent Mach number. , , , and are setup as constants. The turbulent viscosity is defined as:
C. Boundary conditions The gas volume fraction, pressure, temperature, and turbulent quantities are specified at the inlet. For the outlet,
pressure is fixed according to the operated depth, and other flow variables are extrapolated. On the walls, pressure, gas volume fraction, and turbulent quantities are extrapolated along with no-slip boundary condition.
III. Results and discussions Supersonic gaseous jets injected into water are simulated in this study. The converging-diverging Laval nozzles
are used. The corresponding geometries and operation conditions of these four simulated cases are listed in Table 1. dt is the diameter of nozzle throat; D is the interior diameter of nozzle exit; ds is the diameter of cross-section of propulsion system.
Table 1 The geometries and operation conditions of the simulated cases
No. dt (mm) D
(mm) ds
(mm) Ma Stagnation pressure
( ) Depth (m)
State
1 4.3 5.6 55 2 9.8222 0.15 Under-expansion pe / pa = 1.2
2 4.3 4.7 55 1.5 4.5182 0.15 Under-expansion pe / pa = 1.2
3 4.3 4.7 55 1.5 3.7652 0.15 Full-expansion pe / pa = 1
4 80 160 220 3 50 50 Over-expansion pe / pa = 0.25
American Institute of Aeronautics and Astronautics
5
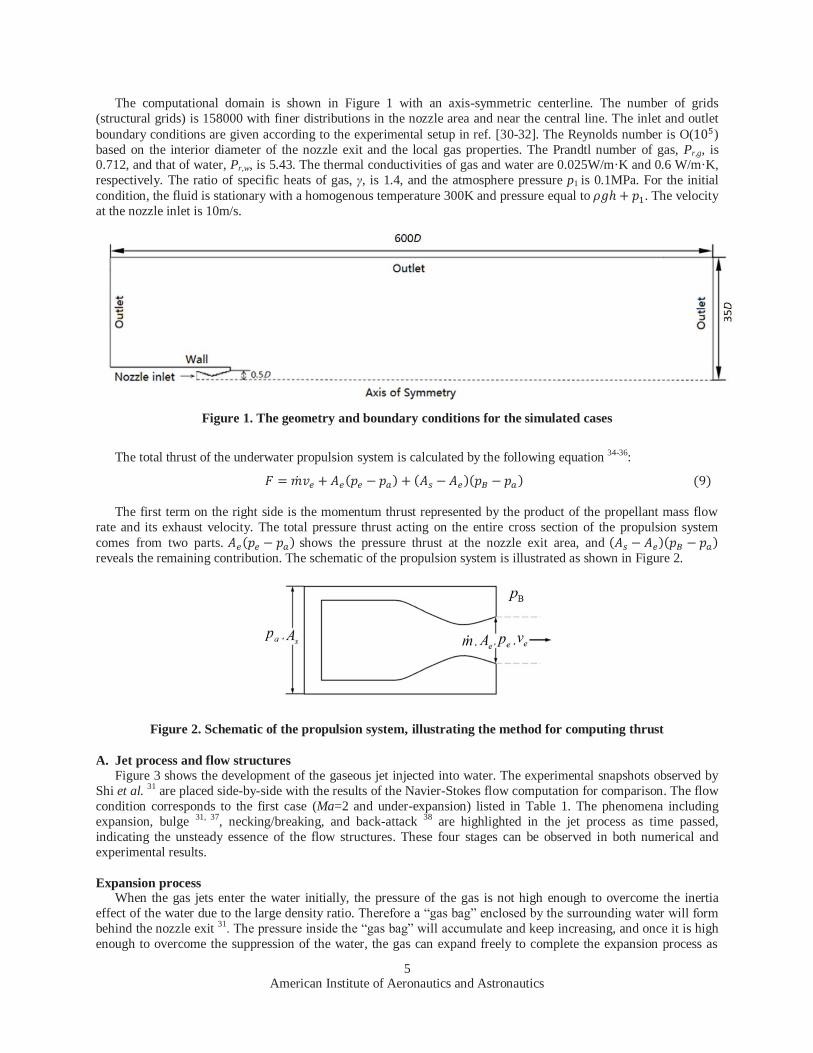
The computational domain is shown in Figure 1 with an axis-symmetric centerline. The number of grids (structural grids) is 158000 with finer distributions in the nozzle area and near the central line. The inlet and outlet boundary conditions are given according to the experimental setup in ref. [30-32]. The Reynolds number is O( ) based on the interior diameter of the nozzle exit and the local gas properties. The Prandtl number of gas, Pr,g, is 0.712, and that of water, Pr,w, is 5.43. The thermal conductivities of gas and water are 0.025W/m·K and 0.6 W/m·K, respectively. The ratio of specific heats of gas, γ, is 1.4, and the atmosphere pressure p1 is 0.1MPa. For the initial condition, the fluid is stationary with a homogenous temperature 300K and pressure equal to . The velocity at the nozzle inlet is 10m/s.
Figure 1. The geometry and boundary conditions for the simulated cases
The total thrust of the underwater propulsion system is calculated by the following equation 34-36:
The first term on the right side is the momentum thrust represented by the product of the propellant mass flow rate and its exhaust velocity. The total pressure thrust acting on the entire cross section of the propulsion system comes from two parts. shows the pressure thrust at the nozzle exit area, and reveals the remaining contribution. The schematic of the propulsion system is illustrated as shown in Figure 2.
Figure 2. Schematic of the propulsion system, illustrating the method for computing thrust
A. Jet process and flow structures Figure 3 shows the development of the gaseous jet injected into water. The experimental snapshots observed by
Shi et al. 31 are placed side-by-side with the results of the Navier-Stokes flow computation for comparison. The flow condition corresponds to the first case (Ma=2 and under-expansion) listed in Table 1. The phenomena including expansion, bulge 31, 37, necking/breaking, and back-attack 38 are highlighted in the jet process as time passed, indicating the unsteady essence of the flow structures. These four stages can be observed in both numerical and experimental results.
Expansion process
When the gas jets enter the water initially, the pressure of the gas is not high enough to overcome the inertia effect of the water due to the large density ratio. Therefore a “gas bag” enclosed by the surrounding water will form behind the nozzle exit 31. The pressure inside the “gas bag” will accumulate and keep increasing, and once it is high enough to overcome the suppression of the water, the gas can expand freely to complete the expansion process as

American Institute of Aeronautics and Astronautics
6
shown in Figure 3(a), which is captured by both numerical and experimental approaches. In some special circumstances, the gas cannot be injected successfully due to the large density jump in this initial transient, causing failure and thrust loss for the engine 12, 39, 40.
Furthermore, as shown in Figure 3(a), when the “gas bag” bursts, we can observe that the velocity near the nozzle exit becomes very high, and hence the pressure in this area will suddenly drop, creating an additional thrust due to the pressure difference between the rear and front parts of the propulsion system. In addition, the tip location of the jet is closer to the stagnation point, which results in a large local pressure, generating the backflows from the tip location to the nozzle exit as shown in Figure 3(a).
Bulge After the expansion process, a small bulged bubble appears near the nozzle exit, as shown in Figure 3(b). It will
not collapse, and is usually swept away to the downstream 31. This bulged bubble will appear several times 31, 37 before necking/breaking and results in pressure oscillation, which is observed in both experimental and numerical results.
Experimental results31 Liquid volume fraction Axial-velocity Pressure
(a)
(b)
(c)
(d)
Figure 3. The flow structures of (a) expansion, (b) bulge, (c) necking/breaking, and (d) back-attack during the jet development (Ma=2, Under-expansion). The axial-velocity and pressure are normalized as ,
, and the solid lines represent the streamlines) Necking/breaking
At this stage, first, the injected gas keeps expanding and spreading away from the nozzle exit, causing the pressure to drop lower than the ambient pressure and strengthening the backflows from the tip location. Second, the pressure difference between the surrounding water and the bulged bubble can change very abruptly with large amplitudes, causing the “gas bag” to become unstable. As a result, the “gas bag” will be compressed in the direction perpendicular to the centerline. The “gas bag” will collapse and separate the gaseous jet into two parts, which is the so-called necking/breaking in Figure 3(c).
This necking/breaking will narrow the jet diameter as shown in Figure 3(c), and hence the gaseous jet newly supplied from the nozzle will encounter difficulties passing through this area. As a result, the pressure between the breaking point and the nozzle exit will become much higher. Meanwhile, a shockwave will move into the nozzle,

American Institute of Aeronautics and Astronautics
7
and the velocity at the nozzle exit will decrease. This necking/breaking phenomenon plays a very important role in causing the jet process to become more unsteady and turbulent. However, this mechanism cannot be observed in gas-gas jets due to their comparable density ratio.
During this stage, a certain amount of the surrounding water has already been entrapped by the backflows of the gaseous jet, which can be observed in Figure 3(c) and hereafter. This phenomenon is more significant when the mass transfer cannot be neglected, and it will enhance the complexity of the flow structures, such as the turbulent mixing process.
Back-attack As described during the necking/breaking process, the gas flow passage will become narrow and the resistance
acting on the flow propagation will become stronger. Therefore, it will generate a backflow impacting on the nozzle surface, and this backflow can even enclose the end of the propulsion system as shown in Figure 3(d), which is called “back-attack” 32, 38. A typical characteristic in the back-attack process is the presence of a negative axial-velocity at the rear part of the nozzle. Aoki et al. 41 have observed that this phenomenon can cause tuyere refractory erosion and found that it occurs after the jet necking. Shi et al. 30, 31 have suggested that the back-attack can be due to a shockwave feedback phenomenon. However, in contrast to the previous necking/breaking stage, the shockwave is moving out of the nozzle, indicating that this back-attack is not a shockwave feedback phenomenon. The impact force generated in this “back-attack” can result in the instability of underwater propulsion.
B. The r.m.s value of oscillation pressure in downstream The instantaneous pressure is tracked by a probe rank as shown in Figure 4 and 5. The three probes are in one
row vertically and equally spaced with a distance of 1 cm, probe 1 is along the central line of the jet. As described in ref. 31, these three probes are installed on the front wall of an aluminum frame, and each probe connects to a pressure transducer, which is fixed on the backside of the frame. The probe has a sharp tip, and the measuring hole of the static pressure is drilled at the position of 12 mm away from the tip. The probe rank can be placed in different horizontal positions. The r.m.s value of pressure between the experimental study 31, 32 and our current numerical results are compared based on Case 1 (Ma=2.0, under-expansion) in Figure 6 and Case 2 (Ma=1.5, under-expansion) in Figure 7.
Figure 4. The experimental setup of probe rank 31
Figure 5. The structure of the probe rank 1: Probe, 2: Frame of probe rank, 3: Pressure transducer, and
4:Supporter 31

American Institute of Aeronautics and Astronautics
8
(a)Probe1 (b) Probe 2 (c) Probe3
Figure 6. The r.m.s value of the oscillation pressure obtained by numerical results and experimental data for Case 1 (Case 1: Ma=2.0, under-expansion, and X axis represents the distance between the probe rank and the
nozzle exit)
(a)Probe1 (b) Probe 2 (c) Probe3
Figure 7. The r.m.s value of the oscillation pressure obtained by numerical results and experimental data for Case 2 (Case 2: Ma=1.5, under-expansion, and X axis represents the distance between the probe rank and the
nozzle exit)
From Figure 6 and Figure 7, it can be observed that probe 1, which is located along the jet centerline, has a stronger pressure oscillation. The trends of experimental and numerical results are within a reasonable range, considering the measurement difficulties. The profile of the jet will change very rapidly at X=1 cm 32, intensifying the interaction between shockwave and gas-water interface. In this position, the resulted oscillations will become stronger as illustrated in Figure 6 and 7.
The probe 2 and probe 3 show very limited variations experimentally. Apparently, probe 2 and 3 are already outside the jet area and located in the water region based on the experiment. Therefore, the oscillation will be smaller because the shockwave cannot go across the gas-water interface. On the other hand, the fluctuation obtained by the numerical method is more significant, suggesting that the jet diameter is larger numerically. Furthermore, probe 2 and 3 are placed in a subsonic region based on our simulation, and any disturbance, such as the experimental setup in Figure 4 and 5, can influence the entire flow field, leading to a difference between numerical and experimental results.
C. Fast Fourier transformation of the oscillation pressure Fast Fourier transformations (FFT) of the pressure oscillation are carried out based on Case 2 (Ma =1.5, under-
expansion) and Case 3 (Ma = 1.5, Full-expansion). For Case 2, the probes are placed at X = 2 cm. As for Case 3, these probes are positioned at X=1 cm.

American Institute of Aeronautics and Astronautics
9
The experimental and numerical FFT results of Case 2 are compared in Figure 8. The amplitude is non-dimensionalized by the maximum amplitude of each probe. It can be observed that the main frequencies of experimental and numerical results are 100 Hz and 140 Hz respectively. Both results indicate that the main frequencies of probe 1, 2 and 3 are nearly the same. Figure 9(a) shows the experimental result of Case 3 obtained by Shi et al. 31, and the main frequency is around 130 Hz. The mechanical energy mainly distributes in the frequency band of 0-500 Hz. Figure 9 (b) shows that the main frequency is around 110 Hz, and the bandwidth is 0-600 Hz by the current Navier-Stokes computation. From Figure 8 and Figure 9, it can be observed that the frequency bandwidth calculated from the numerical data is wider with less abrupt change. This is a result of averaging both in time and space by the Reynolds-averaged Navier-Stokes (RANS) model, which will tend to smoothen the profiles. Overall, the main frequencies obtained by the experimental and numerical methods match well.
Experimental result Navier-Stokes computational result
Probe 1
Probe 2
Probe 3
Figure 8. FFT of the pressure at X= 2 cm obtained by probe 1, 2 and 3 of Case 2 (Case 2: Ma=1.5, under-expansion)

American Institute of Aeronautics and Astronautics
10
(a) Experimental result (b) Navier-Stokes computational result
Figure 9. FFT of the pressure at X=1 cm obtained by probe 1 of Case 3 (Case 3: Ma = 1.5, Full-expansion)
D. Underwater propulsion performance Based on Case 4 (Ma = 3, Over-expansion), the impact factors of the thrust obtained by Equation (9) will be
discussed in terms of the back pressure, nozzle exit pressure, normal velocity at nozzle exit, and mass flow rate through the nozzle.
Back pressure The back pressure profile obtained via Navier-Stokes computation is shown in Figure 10. The pressure and time
are normalized as ( and are the reference pressure and density at the nozzle exit) and respectively. From Figure 10, it can be seen that the maximum peak of the back pressure occurs at the initial instant, which is caused by the inertial and viscous force of the water 21. After this moment, the back pressure drops to a value lower than that of the first peak, indicating that the pressure of the gaseous jet is high enough to overcome the threshold, and then the whole process can be initiated. Furthermore, the back pressure can be lower than the ambient pressure between the pulses. These pulses are characterized by Hoefele and Brimacombe 20 as the “heartbeats” of the jet. There are four pulses marked as 1 to 4, which correspond to = 475, 750, 1250, and 1730. Furthermore, the liquid volume fraction contours at these four instants are shown in Figure 11 in order to investigate the relationship between the back pressure and the flow structures. It can be observed that these pulses occur when the necking/breaking phenomenon occurs. Pulses 3 and 4 have higher back pressure, which can be owed to a stronger necking as shown in Figure 11. These results are consistent with those presented by Engh and Nilmani 21 and Wang et al. 32.
Figure 10. Back pressure obtained via Navier-Stokes computation

American Institute of Aeronautics and Astronautics
11
Pulse 1 Pulse 2 Pulse 3 Pulse 4
Figure 11. The Liquid volume fraction contour corresponding to the four pulses in Figure 10
Pressure and normal velocity at the nozzle exit The pressure and the normal velocity at the nozzle exit are non-dimensionalized as and
, as shown in Figure 12(a) and Figure 12(b) respectively. From Figure 12(a), it can be observed that the trend of the nozzle exit pressure has a very consistent profile much like that of the back pressure shown in Figure 10. The local maximums and pulses all happen at the same instants. Meanwhile, the velocity will drop to the local minimum when the nozzle exit pressure reaches its local maximum.
Figure 13 shows the corresponding pressure contours at these four instants. It can be found that the pressure around the nozzle exit is very high with shock waves pushed into the nozzle. If the back pressure is lower than the critical value that allows the normal shock wave to stand precisely at the nozzle exit 42, the shock wave will stay outside the nozzle, indicating that the nozzle exit pressure will be fixed and determined by the nozzle geometry and the stagnant pressure. However, if the back pressure is higher than the critical pressure, the shock wave will move into the nozzle, and the back and nozzle exit pressure will be identical as illustrated in Figure 10 and 12(a).
(a) Pressure (b) Normal velocity
Figure 12. The pressure and normal velocity at nozzle exit acquired via Navier-Stokes computation
American Institute of Aeronautics and Astronautics
12
Pulse 1 Pulse 2 Pulse 3 Pulse 4
Figure 13. The pressure distributions and shockwaves corresponding to these four pulses in Figure 12
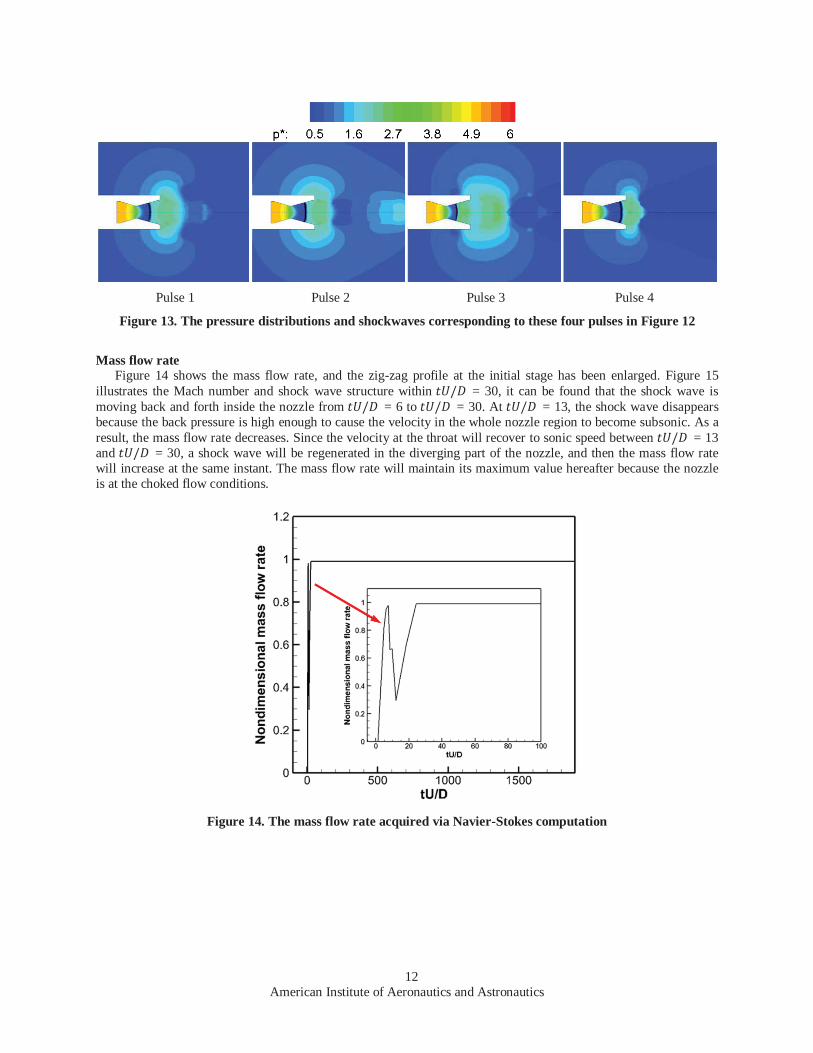
Mass flow rate Figure 14 shows the mass flow rate, and the zig-zag profile at the initial stage has been enlarged. Figure 15
illustrates the Mach number and shock wave structure within = 30, it can be found that the shock wave is moving back and forth inside the nozzle from = 6 to = 30. At = 13, the shock wave disappears because the back pressure is high enough to cause the velocity in the whole nozzle region to become subsonic. As a result, the mass flow rate decreases. Since the velocity at the throat will recover to sonic speed between = 13 and = 30, a shock wave will be regenerated in the diverging part of the nozzle, and then the mass flow rate will increase at the same instant. The mass flow rate will maintain its maximum value hereafter because the nozzle is at the choked flow conditions.
Figure 14. The mass flow rate acquired via Navier-Stokes computation

American Institute of Aeronautics and Astronautics
13
tU/D=6 tU/D=8 tU/D=13 tU/D=30
Figure 15. The distribution of Mach number and shock waves when = 6, 8, 13, and 30
Thrust of underwater propulsion The total thrust of the underwater propulsion system is calculated by Equation (9) and normalized as
as shown in Figure 16. It indicates that the maximum peak thrust occurs in the initial period with a big jump, which is consistent with the findings of Zhang et al. 12, Shan et al. 35 and Wang et al. 36. The thrust fluctuates abruptly hereafter with a similar trend as shown in Figure 10 for back pressure and Figure 12(a) for nozzle exit pressure.
As shown in Equation (9), the total thrust can be divided into three terms, and these three components are illustrated in Figure 17. It is clear that the pulses of the total thrust are mainly contributed by and
, and the pulse distributions in Figure 16 are consistent with those of the back pressure in Figure 10 and nozzle exit pressure Figure 12(a). The momentum thrust, , largely maintains as a constant because the mass flow rate is saturated after the initial stage in Figure 14, and it will drop according to the four pulses as shown in Figure 12(b) when the exit velocity decreases. Overall, for underwater propulsion systems, the thrust fluctuates intensely.
Figure 16. Total thrust of the underwater propulsion system

American Institute of Aeronautics and Astronautics
14
Figure 17. Three components of the total thrust predicted by the Navier-Stokes computation
IV. Conclusion In the present work, Navier-Stokes computations are used to elucidate the flow structures of the gas-water
interactions and evaluate their effect on propulsion systems. The main findings are summarized below: (1) The main flow characteristics observed in gaseous jet injected into water, including expansion, bulge,
necking/breaking, and back-attack, are highlighted. First of all, the injected gas keeps expanding away from the nozzle exit, causing the pressure to drop lower than the ambient pressure. Second, a series of bulged bubbles cause an unstable jet. As a result, the jet will be compressed in the direction perpendicular to the centerline, leading to a break-up of the gas. Upon breaking up, the pressure before the break point increases due to the obstruction of the flow passage causing the flow reversal. The flow reversal impacts the nozzle surface, creating the back-attack.
(2) The four highlighted processes cause the flow structures of gaseous jets submerged in water to become much more unsteady and turbulent, as the result, the pressure in the downstream flow field fluctuates intensively.
(3) The back pressure significantly affects the flow structures in the nozzle. As the back pressure elevates, shockwave can move into the nozzle, causing the exit velocity to become subsonic and the exit pressure to be equal to the back pressure. A high back pressure also reduces the mass flow rate through the nozzle.
(4) The back pressure in underwater propulsion is much different from the ambient pressure; the pressure difference on the rear and front surfaces of the propulsion system may generate an additional thrust.
(5) The total thrust of an underwater propulsion system depends on the geometry of the system, the mass flow rate through the nozzle, the velocity and pressure at the nozzle exit, the ambient pressure, and the back pressure which is influenced by the flow structures. The strong and oscillatory thrust of an underwater propulsion system is caused by the intermittent pulses of the back pressure and nozzle exit pressure
Acknowledgments The authors would like to acknowledge Mr. Ezeldin Hassan, Mr. Sida Zhou, Dr. Yingjie Wei, Dr. Hikaru Aono, Mr.
Weichen Wang, Mr. Chang-Kwon Kang and Dr. Amit Gupta for offering helpful discussions and comments.

American Institute of Aeronautics and Astronautics
15
References 1Linck, M., Gupta, A.K., and Yu, K., “Submerged Combustion and Two-Phase Exhaust Jet Instabilities,” Journal of
Propulsion and Power, 2009, 25(2), 522-532 2Gulawani, S.S., Deshpande, S.S., and Joshi, J.B., “Submerged Gas Jet into a Liquid Bath: A Review,” Industrial &
Engineering Chemistry Research, 2007, 46, 3188-3218 3Petipas, F., Massoni, J., Saurel, R., Lapebie, E. and Munier, L., “Diffuse interface model for high speed cavitating
underwater systems,” International Journal of Multiphase Flow, 2009, 35, 747-759 4Yang, Q. X., Gustavsson, H., Burström, E., “Erosion of refractory during gas injection-a cavitation based model,”
Scandinavian Journal of Metallurgy, 1990, 19, 127-136 5Gongwer, C. A., “Some Aspects of Underwater Jet Propulsion Systems,” ARS Journal, 1960, 30(12), 1148-1151 6Wislicenus, G.F., “Hydrodynamics and Propulsion of Submerged Bodies,” ARS Journal, 1960, 30(12): 1140-1148 7Yang, Q.X., Gustavsson, H., “Effects of gas jet instability on refractory wear-a study by high-speed photography,”
Scandinavian Journal of Metallurgy, 1992, 21: 15-26 8Brady, J.F., “Underwater Propulsion,” AIAA and office of naval research, symposium on deep submergence propulsion and
marine systems, forest park, ill. AIAA-1966-2408, 1966, 204-225 9Rogers, K.W., “A theoretical and experimental investigation of the transient phase of underwater rocket motor firing,”
University of Southern California Engineering Center Report, 1962 10Wang, X.H., Chen, Y.L., Li, Q., Liu, C.J., “Nozzle flows of the launching under water (In Chinese),” Journal of Propulsion
Technology, 2001, 22(1), 61-64 11Labotz, R. J., “Hydrodynamic Consideration and Limitations in Submerged Rocket Firings,” Journal of Spacecraft and
rocket, 1965, 2(3), 320-324 12Zhang, Y.W., Wang, X.H., and Yang, J.X., “Study on working thrust for underwater engine using the spherical bubble
model(In Chinese),” Journal of Hydrodynamics, 2005, 20(5), 636-640 13Tang, J.N., Li, S.P., Wang, N.F., Wei, Y.J., and Shyy, W., “Flow Structures of Gaseous Jet Injected into Liquid for
Underwater Propulsion,” 46th AIAA/ASME/SAE/ASEE Joint Propulsion Conference and Exhibit, Nashville, TN. AIAA-2010-6911, 2010
14Chen, K., Richter, H.J., “Instability analysis of the transition from bubbling to jetting in a gas injected into a liquid,” International Journal of Multiphase Flow, 1997, 23(4), 699-712
15Longuet-Higgins, M.S., Kerman, B.R., Lunde, K., “The release of air bubbles from an underwater nozzle,” Journal of Fluid Mechanics, 1991, 230, 365-390
16Siamas, G.A., Jiang, X, Wrobel, L.C., “Dynamics of annular gas-liquid two-phase swirling jets,” International Journal of Multiphase Flow, 2009, 35, 450-467
17Koria, S.C., “Principles and applications of gas injection in steelmaking practice,” Scandinavian Journal of Metallurgy, 1993, 22, 271
18Lindau, J.W., Venkateswaran, S., Kunz, R.F. and Merkle, C.L., “Multiphase Computations for Underwater Propulsive Flows,” AIAA 2003-4105.
19Surin, V.A., Evchenko, V.N., and Rubin, V.M., “Propagation of a gas jet in a liquid,” Journal of Engineering Physics, 1983, 45, 1091-1101
20Hoefele, E.O. and Brimacombe, J.K., “Flow regimes in submerged gas injection,” Metallurgical transactions B, 1979, 10B, 631-648
21Engh, T.A. and Nilmani, M., “Bubbling at high flow rates in inviscid and viscous liquids (slags),” Metallurgical transactions B, 1988, 19B, 83-94
22Loth E, Faeth G.M., “Structure of underexpanded round air jets submerged in water,” International Journal of Multiphase Flow, 1989, 15(4), 589-603
23Qi, L. X., Cao, Y., and Wang, B.Y., “Experimental study of under-expanded sonic air jets in water (In Chinese),” Acta Mechanica Sinica, 2000, 32(6), 667-675
24Irie, T., Yasunobu, T., Kashimura, H., and Setoguchi, T., “Characteristics of the Mack Disk in the Underexpanded Jet in which the Back Pressure Continuously Changes with Time,” Journal of Thermal Science, 2003, 12(2), 132-137
25Chang, K. S., Kim, J.K., “Numerical investigation of inviscid shock wave dynamics in an expansion tube,” Shock Waves, 1995, 5, 33-45
26Abate, G., Shyy, W., “Dynamic structure of confined shocks undergoing sudden expansion,” Progress in Aerospace Sciences, 2002, 38, 23-42
27Jiang, Z., Takayama, K., Babinsky, H., Meguro, T., “Transient shock wave flows in tubes with a sudden change in cross section,” Shock Waves, 1997, 7, 151-162
28Liang, S. M., and Chen, H., “Numerical Simulation of Underwater Blast-Wave Focusing Using a High-Order Scheme,” AIAA Journal, 1999, 37(8), 1010-1013

American Institute of Aeronautics and Astronautics
16
29Dai, Z.Q., Wang, B.Y., Qi, L.X., and Shi, H.H. “Experimental study on hydrodynamic behaviors of high-speed gas jet in still water,” Acta Mechanica Sinica, 2006, 22,443-448
30Shi, H.H., Wang, B.Y., Qi, L.X., “A submerged supersonic gas jet (In Chinese),” In: Proc. 7th National Congress on Hydrodynamics and 19th National Symposium on Hydrodynamics. Beijing: Ocean Press, 2005, 75–81
31Shi, H.H., Wang, B.Y., Dai, Z.Q., “Research on the mechanics of underwater supersonic gas jets,” Science China, 2010, 53(3), 527-535
32Wang, B.Y., Dai, Z.Q., Qi, L.X., and Shi, H. H., “Experimental study on back-attack phenomenon in underwater supersonic gas jets (In Chinese),” Acta Mechanica Sinica, 2007, 39(2), 267-272
33Cao, J.Y., Lu, C.J., Li, J., and Chen, X., “Research on dynamic characteristics of underwater supersonic gas jets (In Chinese),” Chinese Journal of Hydrodynamics, 2009, 24(5), 575-582
34Kerrebrock, J.L., “Aircraft Engines and Gas Turbines,” The MIT Press, Cambridge, Massachusetts, and London, England 1987
35Shan, X.S., Yang, R.G., Ye, Q.Y., “Fluid force on a vehicle with control system of vectorial thrust (In Chinese),” Journal of Shanghai Jiaotong University, 2001, 35(4), 625-629
36Wang, C., Ye, Q.Y., He, Y.S., “Calculation of an exhausted gas cavity behind an under-water vehicle (In Chinese),” Chinese Journal of Applied Mechanics, 1997, 14(3), 1-7
37Shi, H.H., Guo, Q., Wang, C., Dong, R.L., Zhang, L.T., Jia, H.X., Wang, X.G., and Wang, B.Y., “Oscillation flow induced by underwater supersonic gas jets,” Shock Waves, 2010, 20, 347-352
38Wei, J.H., Ma, J.C., Fan, Y.Y., “Back-attack phenomena of gas jets with submerged horizontally blowing and effects on erosion and water of refractory,” ISIJ International, 1999, 39(8), 779-786
39Lu, C.J., Chen. F., Fan, H., Shen, X.H., “The fluid dynamic research on the underwater ignition (In Chinese),” Acta Aeronautica et Astronautica Sinica, 1992, 13(4), B124-B130
40Ju, Y.T., Wu, X.X., Zhu, F.Y., “The study of air flow characteristic in nozzle and the thrust computation method in higher surrounding pressure (In Chinese),” Journal of Ballistics, 2003, 15(3), 66-69
41Aoki T, Masuda S, Hatano A., “Characteristics of submerged gas jets and a new type bottom blowing tuyere,” In: Injection Phenomena in Extraction and Refining. Wraith A E, ed. Newcastle: Department of Metallurgy and Engineering Materials (University of Newcastle upon Tyne), 1982, A1-A36
42Anderson, J.D., “Fundamentals of aerodynamics,” International edition, 1991