flowcad an pspice tips tricks aa
TRANSCRIPT

Application Note PSpice Tipps & Tricks and PSpice AA Page 1 von 23
Title: PSpice A/D Tips & Tricks and PSpice AA Product: OrCAD PSpice A/D, OrCAD PSpice AA
and Allegro AMS Simulator Summary: This application note describes some
helpful features of PSpice for the daily work and demonstrates on simple examples how PSpice Advanced Analysis can be used.
Author/Date: Marco Waller / 23.08.2010
Table of Contents
1 Introduction .................................................................................................................... 3 2 PSpice Templates .......................................................................................................... 3
2.1 Design Entry Capture............................................................................................. 3 2.2 Design Entry HDL .................................................................................................. 4
3 Probe Customization ...................................................................................................... 5 4 Cursor ............................................................................................................................ 7 5 Export Data .................................................................................................................... 7
5.1 Export Cursor Values............................................................................................. 7 5.2 Export Trace Values .............................................................................................. 8
6 Copy Simulation Results ................................................................................................ 9 7 Display control...............................................................................................................10 8 Append Waveforms.......................................................................................................11 9 Performance Analysis ...................................................................................................12 10 Optimizer ..................................................................................................................13
10.1 Introduction ...........................................................................................................13 10.2 Example................................................................................................................13
10.2.1 Create a new Project.....................................................................................13 10.2.2 Starting Simulation ........................................................................................14 10.2.3 Create Measurement.....................................................................................15 10.2.4 Start the Optimizer ........................................................................................17 10.2.5 Set up the Optimizer......................................................................................18

Application Note PSpice Tipps & Tricks and PSpice AA Page 2 von 23
10.2.6 Results ..........................................................................................................19 11 Monte Carlo Analysis ................................................................................................20
11.1 Introduction ...........................................................................................................20 11.2 Example................................................................................................................20
11.2.1 Add Tolerance Value.....................................................................................20 11.2.2 Start Simulation.............................................................................................21 11.2.3 Set up the Monte Carlo Analysis ...................................................................22 11.2.4 Results ..........................................................................................................23

Application Note PSpice Tipps & Tricks and PSpice AA Page 3 von 23
1 Introduction In the first part you find some practical information how to use PSpice. The second part shows how simply PSpice Advanced Analysis (AA) can be used. Note, PSpice AA is a separate product and requires a separate license. In the Demo-Mode you can run the examples as described in this application note with certain limitation. Don’t hesitate to contact us if you want to know more about PSpice or PSpice AA.
2 PSpice Templates When creating a new PSpice project, there are a lot of Templates furnished with the installation. These examples are completely finished and ready to use for simulation. These examples are:
• a good starting point for designer
• good for learning
• quick initial setup
2.1 Design Entry Capture
When creating a new project you can use an existing project from the list

Application Note PSpice Tipps & Tricks and PSpice AA Page 4 von 23
2.2 Design Entry HDL
When working with the Design Entry HDL you find the examples in following directory: <InstallDirectory>\SPB1630\tools\pspice\concept_samples\design_examples

Application Note PSpice Tipps & Tricks and PSpice AA Page 5 von 23
3 Probe Customization
In the Probe Window you can change the color, line width and pattern of each trace. This helps to improve the readability of the results in the Probe Window.

Application Note PSpice Tipps & Tricks and PSpice AA Page 6 von 23
In Tools->Options-> Color Settings you can predefine a certain color order for the traces.
Application Note PSpice Tipps & Tricks and PSpice AA Page 7 von 23
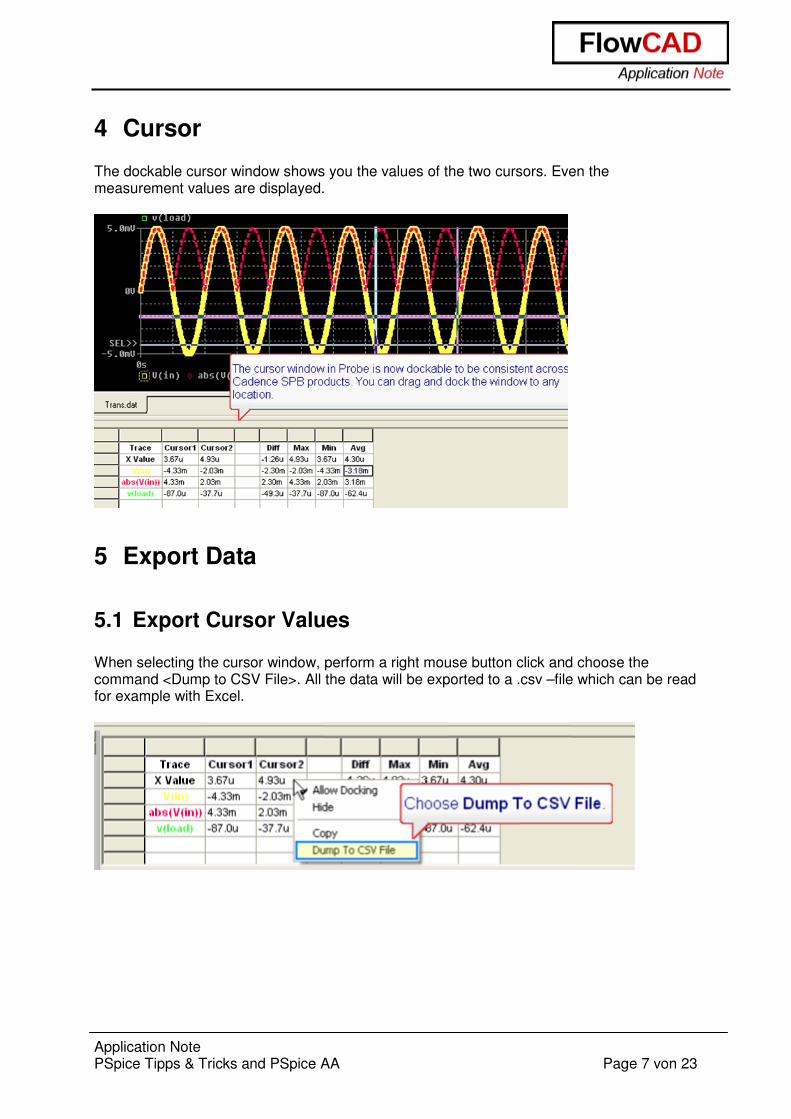
4 Cursor The dockable cursor window shows you the values of the two cursors. Even the measurement values are displayed.
5 Export Data
5.1 Export Cursor Values
When selecting the cursor window, perform a right mouse button click and choose the command <Dump to CSV File>. All the data will be exported to a .csv –file which can be read for example with Excel.
Application Note PSpice Tipps & Tricks and PSpice AA Page 8 von 23
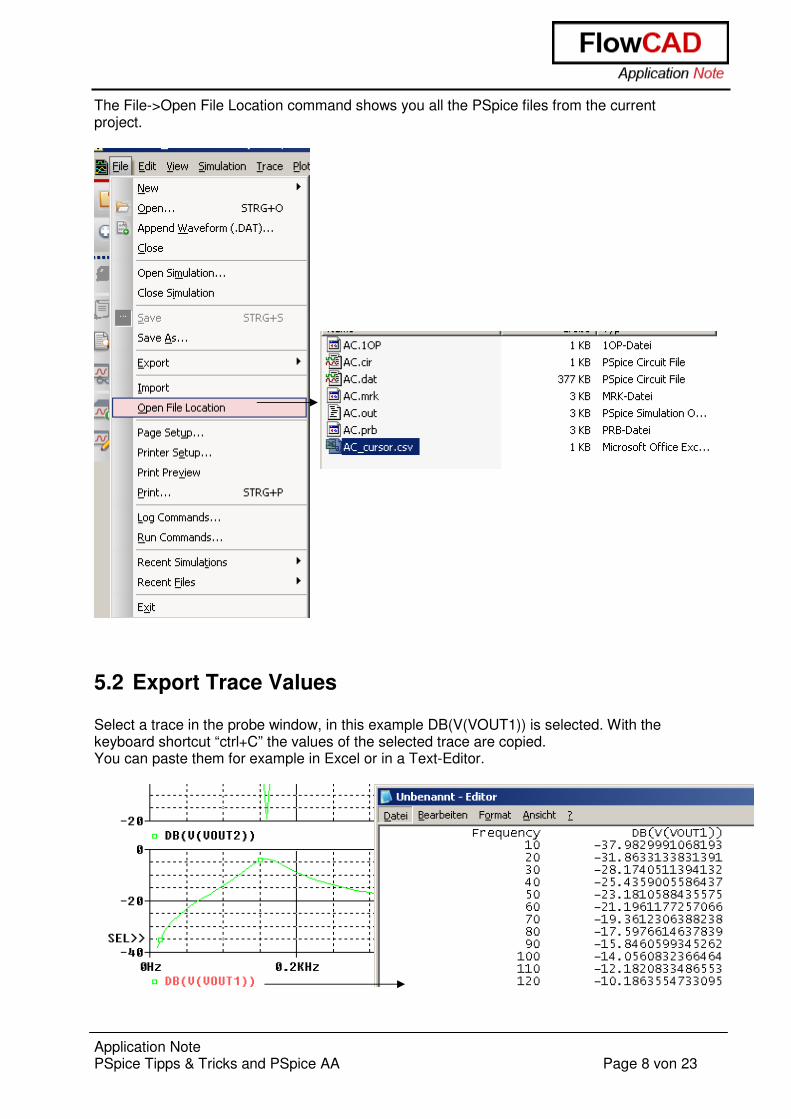
The File->Open File Location command shows you all the PSpice files from the current project.
5.2 Export Trace Values
Select a trace in the probe window, in this example DB(V(VOUT1)) is selected. With the keyboard shortcut “ctrl+C” the values of the selected trace are copied. You can paste them for example in Excel or in a Text-Editor.
Application Note PSpice Tipps & Tricks and PSpice AA Page 9 von 23
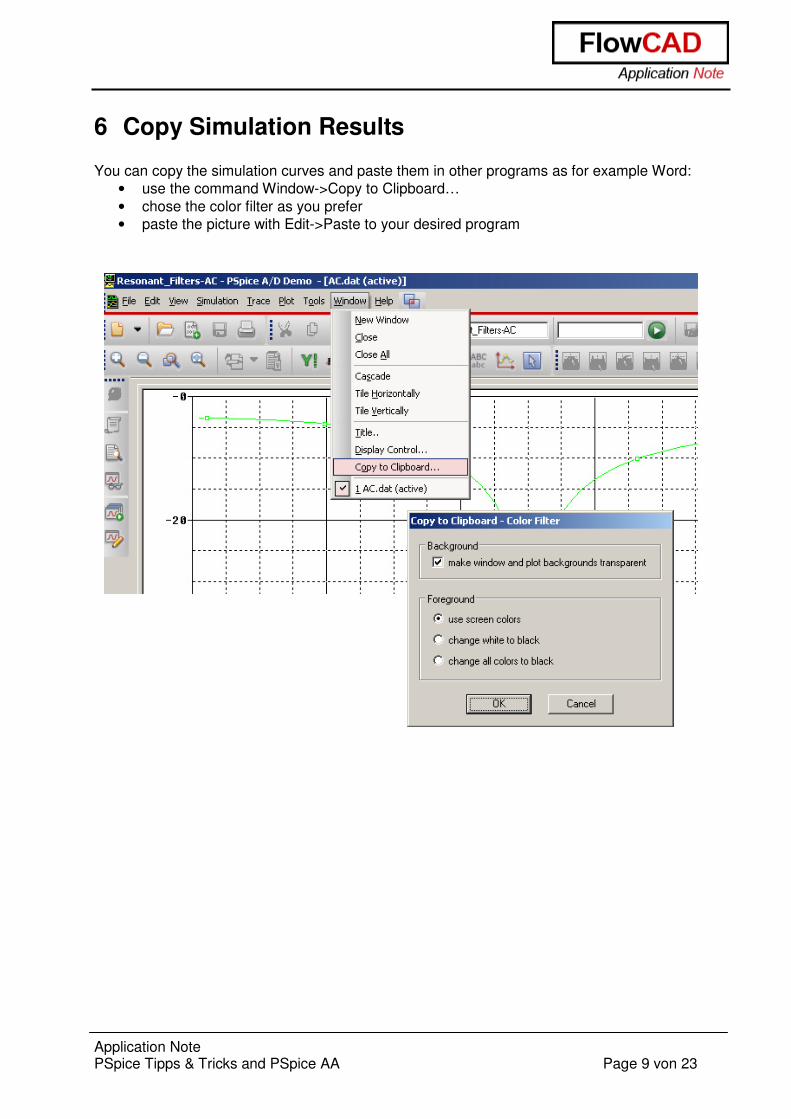
6 Copy Simulation Results
You can copy the simulation curves and paste them in other programs as for example Word:
• use the command Window->Copy to Clipboard…
• chose the color filter as you prefer
• paste the picture with Edit->Paste to your desired program
Application Note PSpice Tipps & Tricks and PSpice AA Page 10 von 23
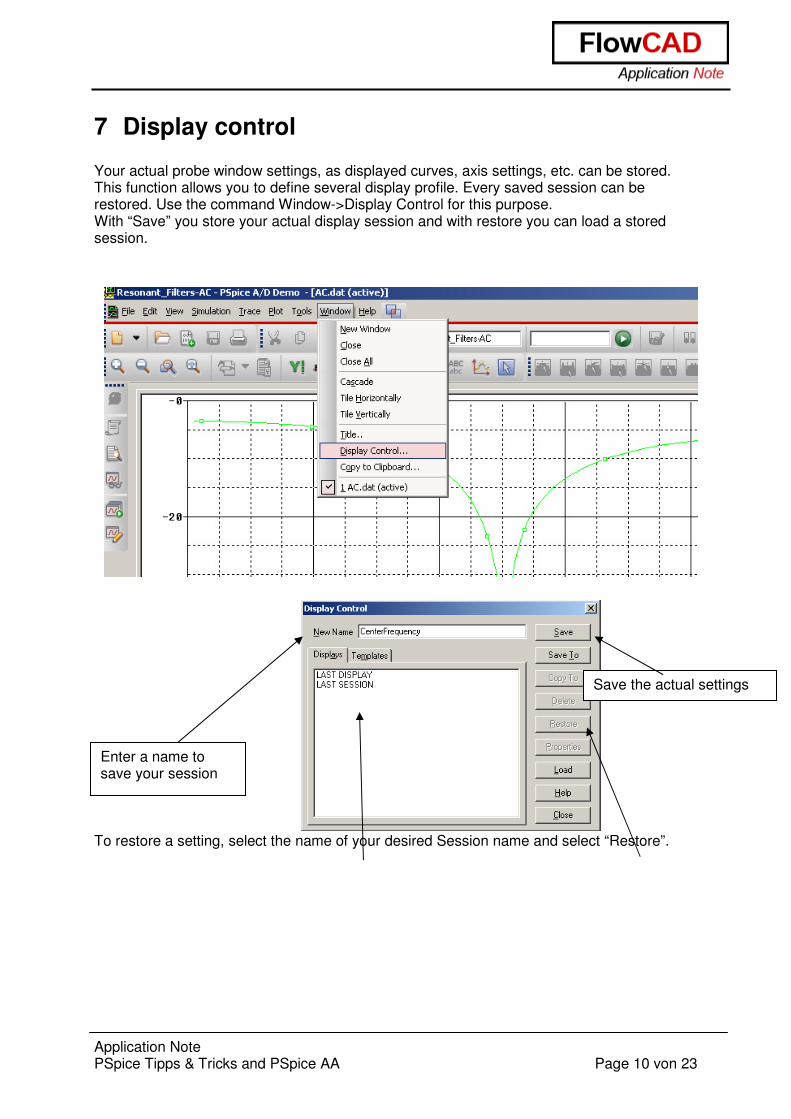
7 Display control
Your actual probe window settings, as displayed curves, axis settings, etc. can be stored. This function allows you to define several display profile. Every saved session can be restored. Use the command Window->Display Control for this purpose. With “Save” you store your actual display session and with restore you can load a stored session.
To restore a setting, select the name of your desired Session name and select “Restore”.
Enter a name to save your session
Save the actual settings

Application Note PSpice Tipps & Tricks and PSpice AA Page 11 von 23
8 Append Waveforms
You can add stored waveforms to your actual probe window. Stored waveforms have always the .DAT file format. Use the command File->Append Waveform for this purpose:

Application Note PSpice Tipps & Tricks and PSpice AA Page 12 von 23
9 Performance Analysis
Probe is very useful as a waveform viewer to check the output of a simulation. In addition, it has a Performance Analysis feature, which allows it to be much more versatile and useful for evaluating the behaviour of a design, especially in a multi-section simulation. Multi-section simulations are simulations that perform a variable sweep such as a parametric or Monte Carlo Analysis. With Trace->Performance Analysis you can start the Performance Analysis. A Wizard guides you through the different steps.

Application Note PSpice Tipps & Tricks and PSpice AA Page 13 von 23
10 Optimizer
10.1 Introduction The Optimizer analyzes analog circuits and systems, fine-tuning designs faster than trial-and-error bench testing. It helps find the best component values to meet performance goals and constraints. Designer can use the Optimizer to improve design performance, update designs to meet new specifications, optimize behavioural models for top-down design and model generation, and tune a circuit to match known results in the form of measurements or curves. You can define several goals to optimize. The requirements could be simple, for example an output voltage. But you can also define complex requirements as a cut-off frequency of a lowpass-filter.
10.2 Example On a simple example we demonstrate how easy it is to use the optimizer. The goal is to change the
center frequency from 160Hz to 500Hz with the optimizer.
10.2.1 Create a new Project
In Capture, chose new->Project and Enter a project name:
Choose the ResonantFilters.opj template.

Application Note PSpice Tipps & Tricks and PSpice AA Page 14 von 23
In this example we’re working with the „Series LC Resonant Band Stop Filter“. The Demo-Version has limitations. So If you’re working in demo-mode, please delete all components exept the “Series LC Resonant Band Stop Filter” Circuit. After srarting the simulation, you can delete the empty plots in the probe window.
10.2.2 Starting Simulation
You can directly start a AC-Simulation, the simulation profile is already defined.

Application Note PSpice Tipps & Tricks and PSpice AA Page 15 von 23
10.2.3 Create Measurement
To measure the center frequency of a band stop filter, we can use cursor or create our own measurement function. We need this measurement afterwards for the Optimizer. So we’ll create a new measurement. In Trace->Measurements you get a list with all existing measurement. With “New” you can create your own measurement:
Enter a name for the new measurement: “Center_Frequency_Bandstop” To measure the frequency at the minimum value of a trace, the command is: Center_Frequency_Bandstop(1) = x1 { 1|Search forward min !1; }
It will take to much time to explain the entire syntax of creating measurements. The syntax is described in the PSpice User’s Guide.
Application Note PSpice Tipps & Tricks and PSpice AA Page 16 von 23
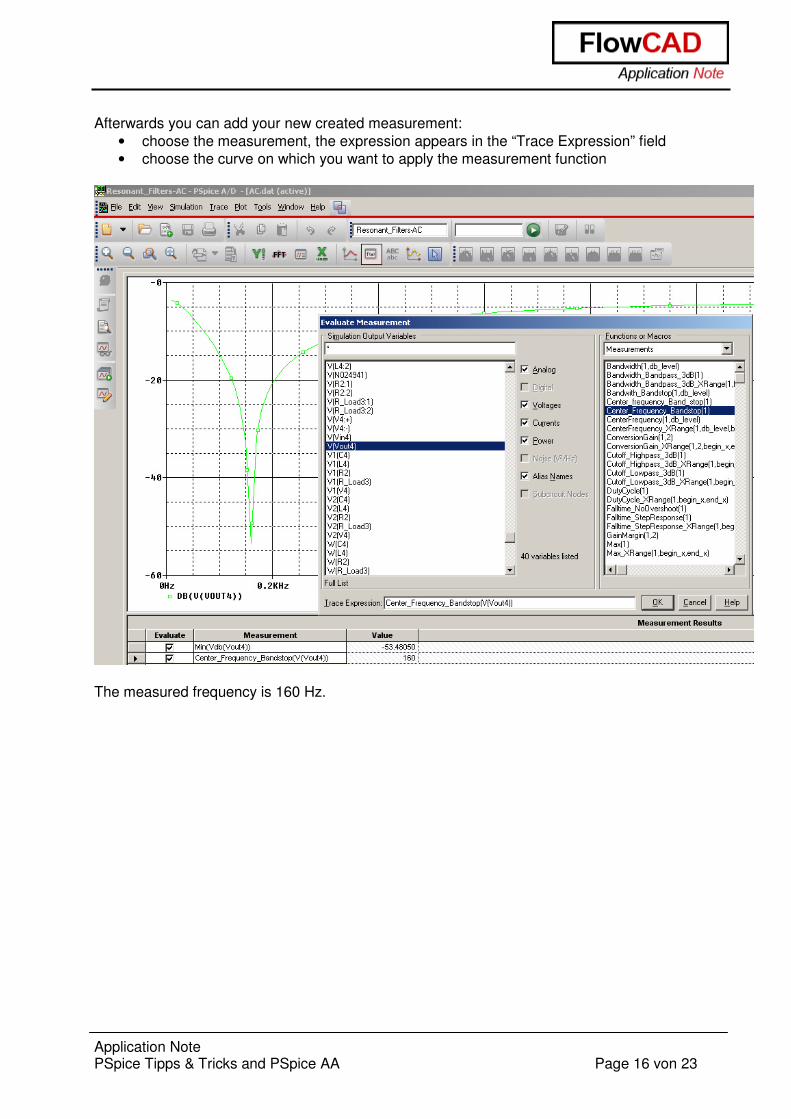
Afterwards you can add your new created measurement:
• choose the measurement, the expression appears in the “Trace Expression” field
• choose the curve on which you want to apply the measurement function
The measured frequency is 160 Hz.

Application Note PSpice Tipps & Tricks and PSpice AA Page 17 von 23
10.2.4 Start the Optimizer
We want to change the center frequency from 160 Hz to 500Hz. This can be done with the Optimizer. Starting the Optimizer:

Application Note PSpice Tipps & Tricks and PSpice AA Page 18 von 23
10.2.5 Set up the Optimizer
1. Define the goal measurement, in our case it’s the center frequency 2. Define the value which we want to achieve with the Optimizer
We define 490Hz as minimum and 510Hz as maximum value 3. Choose the component which can be modified with the Optimizer
In our case we choose C4 4. Define the range in which the component value can vary
We limit the value range from 1uF to 100uF 5. Define the Optimizer engine
We choose the random engine 6. Start the optimization process
1 2
3
4
5
6

Application Note PSpice Tipps & Tricks and PSpice AA Page 19 von 23
10.2.6 Results
The Optimizer simulates the entire circuit and changes the value of the component C4 in the defined range. In the Error Graph we can select a Run. For the selected run, the component value and the result is shown.
The best result was achieved at run #20. The component value for the capacitance is 1uF and the calculated center frequency is 500Hz. So our goal center frequency is achieved.

Application Note PSpice Tipps & Tricks and PSpice AA Page 20 von 23
11 Monte Carlo Analysis
11.1 Introduction Monte Carlo predicts the behaviour of a circuit statistically when part values are varied within their tolerance range. Monte Carlo also calculates yield, which can be used for mass manufacturing predictions. Designers use Monte Carlo for calculating yield based on your specifications, calculating statistical data, displaying results in a probability density histogram, and displaying results in a cumulative distribution graph.
11.2 Example On the same circuit as used in the Optimizer Example, we want to demonstrate how quick and easy you can set up a Monte Carlo Analysis. In this example we analyze, how the center-frequency of this series LC Resonant Band Stop Filter can vary.
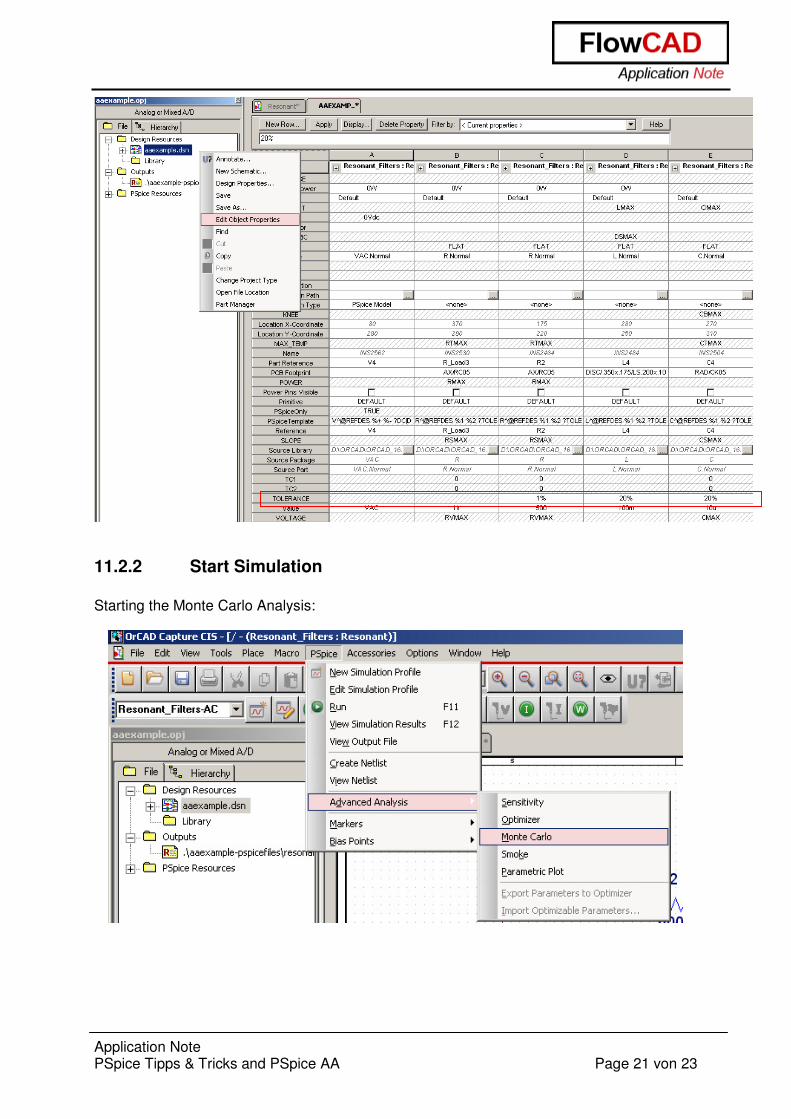
11.2.1 Add Tolerance Value
With the “Edit Object Properties” command on the .dsn file, all used components with their parameters are listed on a table. We added following tolerance value on the components: C4-> 20% L4-> 20% R2->2% Note: This tolerance value is always +-
Application Note PSpice Tipps & Tricks and PSpice AA Page 21 von 23
11.2.2 Start Simulation
Starting the Monte Carlo Analysis:

Application Note PSpice Tipps & Tricks and PSpice AA Page 22 von 23
11.2.3 Set up the Monte Carlo Analysis
We first have to select the measurements on which we want to make a Monte Carlo analysis. So we choose the Center-Frequency Measurement.
On Edit->Profile Setting we set the number of runs to 100 so that we get a significant result.
Application Note PSpice Tipps & Tricks and PSpice AA Page 23 von 23
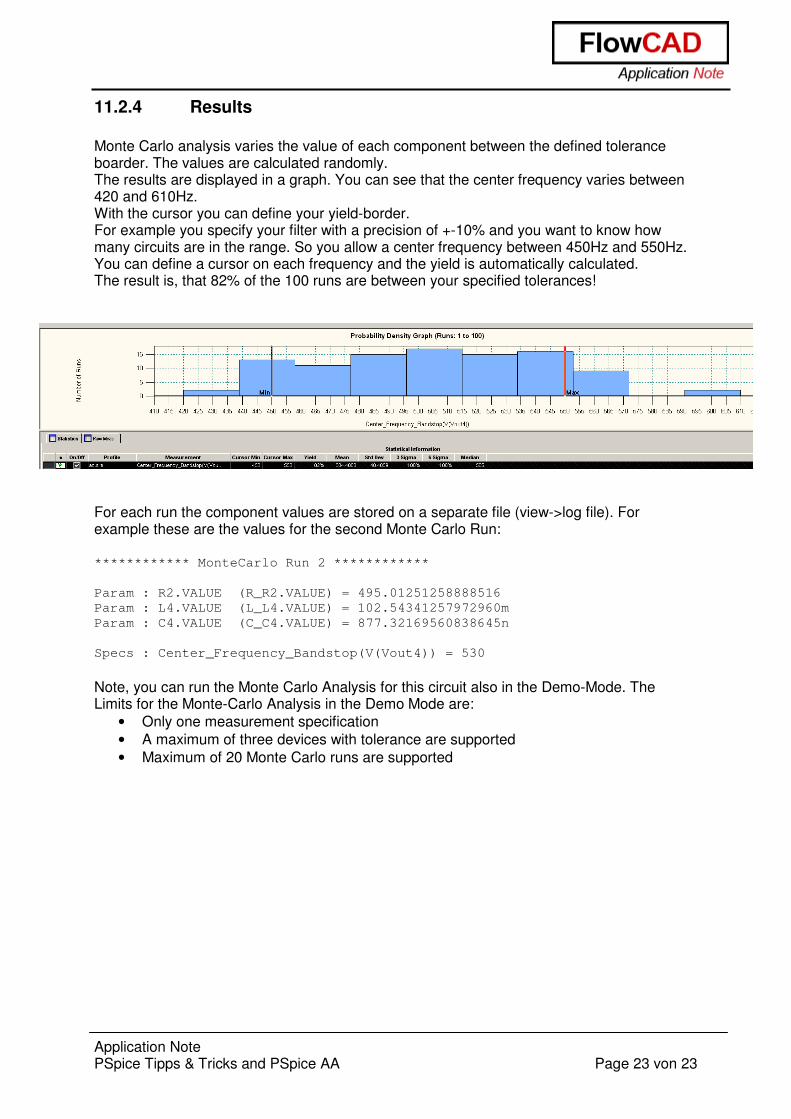
11.2.4 Results
Monte Carlo analysis varies the value of each component between the defined tolerance boarder. The values are calculated randomly. The results are displayed in a graph. You can see that the center frequency varies between 420 and 610Hz. With the cursor you can define your yield-border. For example you specify your filter with a precision of +-10% and you want to know how many circuits are in the range. So you allow a center frequency between 450Hz and 550Hz. You can define a cursor on each frequency and the yield is automatically calculated. The result is, that 82% of the 100 runs are between your specified tolerances!
For each run the component values are stored on a separate file (view->log file). For example these are the values for the second Monte Carlo Run: ************ MonteCarlo Run 2 ************
Param : R2.VALUE (R_R2.VALUE) = 495.01251258888516
Param : L4.VALUE (L_L4.VALUE) = 102.54341257972960m
Param : C4.VALUE (C_C4.VALUE) = 877.32169560838645n
Specs : Center_Frequency_Bandstop(V(Vout4)) = 530
Note, you can run the Monte Carlo Analysis for this circuit also in the Demo-Mode. The Limits for the Monte-Carlo Analysis in the Demo Mode are:
• Only one measurement specification
• A maximum of three devices with tolerance are supported
• Maximum of 20 Monte Carlo runs are supported