flows, barriers and drivers of trade in environmental...
TRANSCRIPT

___________________________________________________________________________
2009/SOM2/MAG/WKSP/011 Session 1
Flows, Barriers and Drivers of Trade in Environmental Goods: Evidence from the
Renewable Energy Supply Sector
Submitted by: ICTSD
Workshop on Environmental Goods and Services
Singapore28 July 2009

Flows, Barriers and Drivers of Trade in Environmental Goods: Evidence from the Renewable Energy Supply Sector.
-Mahesh Sugathan
APEC Market Access Group
Workshop on Environmental Goods and Services (EGS), Singapore
28 July 2009
Overview
• What is Happening at the WTO on Climate-friendly Environmental Goods?
• Some Issues important to developing countries.
• Analysis of the ‘Friends’ WTO 153 List • Biofuels and Energy-efficient goods• ICTSD Mapping Study of Renewable
Energy Technologies and Analysis• Implications of Findings and Concluding
Remarks

Renewable Energy Plant Exporters 2004 - 2006
0
2500000
5000000
7500000
10000000
12500000
15000000
17500000
20000000
22500000
25000000
2004 2005 2006
To
tal
Tra
de
Va
lue
($
'00
0)
China Mexico Hong Kong US Germany
• Global EGS industry: USD 650 billion.
•Trade in EGS estimated at roughly a tenth of that amount
•Few developing countries are participating but
• A handful of emerging economies are becoming important players
• China, India (wind energy, fluorescent lamps) Mexico, Hong Kong, Korea, Malaysia, Colombia, South Africa or Brazil (Bio-fuel)
Environmental Goods and Services, a Growing Market with New Players
The WTO Window: the DDA Negotiations on EGS
• Doha Ministerial Declaration: Para 31(iii) calls for “ the reduction or as appropriate elimination of tariff and non-tariff barriers to environmental goods and services.”
• No definition exists of what is an environmental good. This has made an agreement difficult to reach.
• Approaches to Liberalisation• List: Bound, MFN permanent liberalisation on pre-determined products.
(Friends of Env Goods: Canada, the EU, Japan, Korea, New Zealand, Norway, Chinese Taipei, Switzerland and the US).
• Project/Integrated: Temporary liberalisation of all goods and services for designated projects. (India and Argentina).
• Request-Offer: Negotiations on the basis of bilateral or plurilateral requests on products of interest. Offers extends on MFN basis to all Members. (Brazil)

6-digit HS code entry (841360) :
Pumps for liquids, whether or not
fitted with a measuring device; other
rotary positive displacement pumps
Environmental GoodEx-Out:
Pumps for Sewage and Wastewater treatment
Non-environmental good
Other pumps
Non-environmental good
Other pumps
PipesAs an Environmental Good:Used in Solar Hot Water Systems
As a Non-Environmental Good:Used in Oil and Gas Transportation
The Problem of ‘Dual –Use’
Case 2:
Case 1:
Climate-relevant Environmental Goods-What has been going on in the WTO?
• Qatar : includes natural gas fired generation systems and advanced gas-generation systems.
• Canada initially included hydrogen and bio-diesel;New Zealand :methanol and bio-diesel-later dropped.
• Brazil has informally proposed bio-fuels and bio-fuel technologies.
• Glass Insulation (Japan and New Zealand). Fluorescent Lamps (Japan, Canada, New Zealand and the United States).
• US-EU informal 2007 proposal to liberalise 43 climate friendly goods identified by the World Bank and climate friendly services on an accelerated basis. Zero tariffs on these goods by 2013.
• Some Members have proposed a ‘review mechanism’ to identify and extend liberalisation benefits to new technologies that would evolve.

Climate-relevant Environmental Goods-What has been going on in the WTO?
• 43 products identified by World Bank from an earlier list of ‘153’ environmental goods identified by a few key WTO Members.
• Renewable Energy products include wind turbines and solar panels.
• Global trade in these products have doubled from USD 67 billion to USD 119 billion (2002-2005). Rapid growth in imports and exports.
• Bound and applied tariffs higher for developing countries.
Environmental Goods in the broader « 153 list »
Proposed by ‘ Friends of Environmental Goods’: Canada, the EU, Japan, Korea, New Zealand, Norway, Chinese Taipei, Switzerland and the US.
• Air pollution control• Management of solid and hazardous waste and recycling systems• Clean up or remediation of soil and water• Renewable Energy plant• Heat and Energy Management• Waste water management and potable water treatment• Environmentally preferable products (based on end use or disposal
charactersitics)• Natural risks management• Natural resources protection• Noise and vibration abatement
Climate-relevant

‘153’ List-Renewable Energy PlantTop 10 Global and Devg Country Exporters-2006
‘153’ List-Renewable Energy PlantTop 10 Global and Devg Importers-2006

Bound and Applied Tariffs on EGs as Defined in WTO 153 List in Top
10 Importers
0
5
10
15
20
25
30
35
40
USA
Germ
any
China
Mex
ico
Canad
a
Korea
Hong
Kong
Denm
ark
Mal
aysia
Russia
Ad
Val
ore
m T
arif
fs (
%)
Bound Applied Post DDA
Bound and Applied Tariffs on EGs as Defined in WTO 153 List in Top
10 Importing Developing Countries
0
5
10
15
20
25
30
35
40
45
China
Mex
ico
Korea
HongK
ong
Mal
aysia
Brazil
South
Afri
ca
Pakist
an
Colom
bia
Mor
occo
Ad
Val
ore
m T
arif
fs (
%)
Bound Applied Post DDA
Fairly low tariff protection unlikely to be significantly affected by Doha Round Negotiations (if not singled out for special treatment)
NSNS-1.66NS2.56-2.5Wate water
NSNSNot significant
9.671.09Not significant Noise
NSNS+0.005+0.00051.9-2.37Natural risk
NSNSNot significant
NSNSNSNatural Resources
NSNSNot significant
Not significantNot significant
NSEPP
+2.21NSNot significant
Not significant9.24-6.26Heat
NS+0.0036.26Not significant4.12-0.90Renewable energy
-0.05*NSNot significant
Not significant10.45-4.20Clean up
-2.72*-0.0021.50Not significant5.63-2.8Solid waste
NSNS0.26Not significant3.10.05Air Pollution
Env regulation
GDPFDIDegree of industrialisation
Bot sensitivity
Tariff sensitivity
Category of EGS
Regression Analysis: Factors Influencing Imports of Environmental Goods
(Source: Veena Jha-2007)
* Negative correlation may indicate an import substitution process as a result of the establishment of environmental regualtions

• Roughly 30% of products would be sensitive to tariffs. Compared to other goods in 153 list RE products are more sensitive to tariffs.
• Elasticity with respect to tariffs is low: one percent reduction in tariff leads to 0.15% increase in trade.
• Higher the Envtal Performance Index (EPI) ranking of the developing country, higher the trade in climate friendly products.
• Other factors such as FDI, GDP, more important in determining trade flows than tariffs.
• Correlation of trade in EGs to Tech Assistance projects is particularly high.
Source:http://ictsd.net/downloads/2008/11/ictsd-veena-jha_final-integrated-cover.pdf
Findings by Veena Jha for ICTSD (2007) on the 153/43 WTO List of EGs
Energy-Efficient Goods and Services
• Various studies estimate that upto 40 per-cent of savings needed to reach Kyoto targets would come from ‘energy-efficiency’.
• Many energy-efficient goods problematic to liberalise in WTO context. Eg: Difficult for energy efficient refrigerator vs less energy efficient one. Easier when products are physically distinct. Eg: LEDs vs incandescent lamps.
• Standard-setting and certification issues may be more relevant than tariffs to promote greater trade in EE products. Greater focus on NTBs?
• Relevant Services include designing and engineering for energy-efficiency (eg: buildings),installation and maintenance services for energy-efficient goods and technologies.
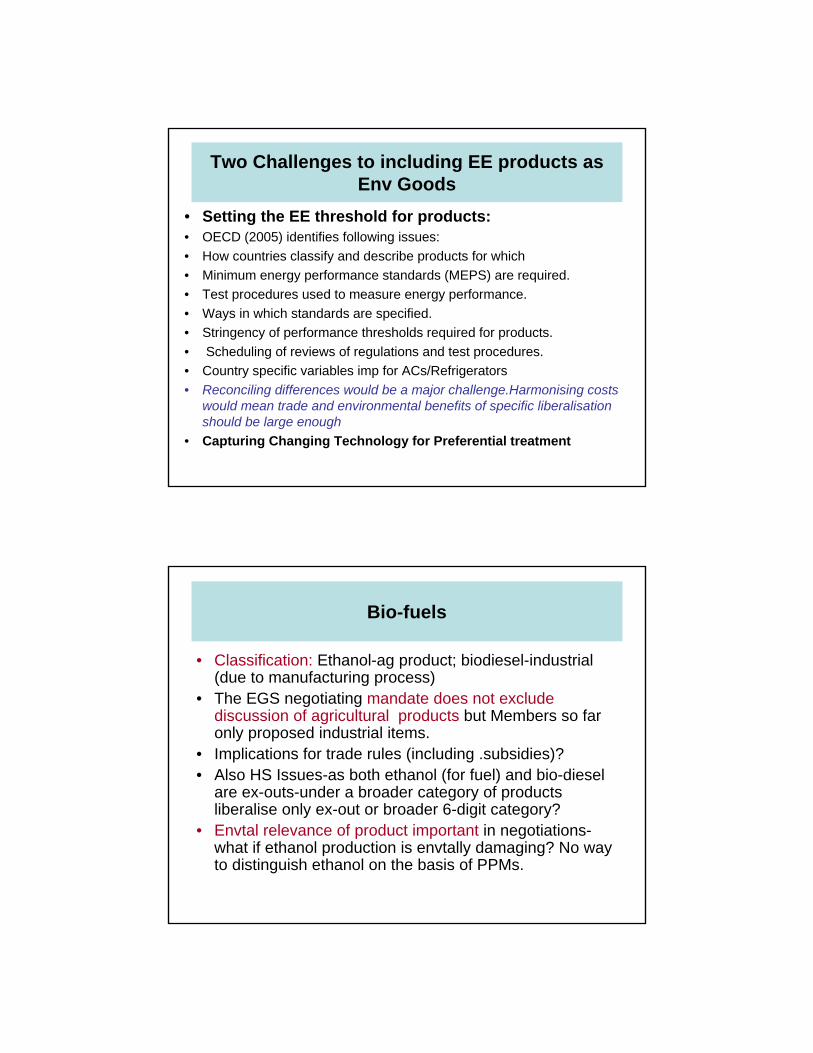
Two Challenges to including EE products asEnv Goods
• Setting the EE threshold for products:• OECD (2005) identifies following issues:
• How countries classify and describe products for which
• Minimum energy performance standards (MEPS) are required.
• Test procedures used to measure energy performance.
• Ways in which standards are specified.
• Stringency of performance thresholds required for products.
• Scheduling of reviews of regulations and test procedures.
• Country specific variables imp for ACs/Refrigerators
• Reconciling differences would be a major challenge.Harmonising costs would mean trade and environmental benefits of specific liberalisation should be large enough
• Capturing Changing Technology for Preferential treatment
Bio-fuels
• Classification: Ethanol-ag product; biodiesel-industrial (due to manufacturing process)
• The EGS negotiating mandate does not exclude discussion of agricultural products but Members so far only proposed industrial items.
• Implications for trade rules (including .subsidies)?• Also HS Issues-as both ethanol (for fuel) and bio-diesel
are ex-outs-under a broader category of products liberalise only ex-out or broader 6-digit category?
• Envtal relevance of product important in negotiations-what if ethanol production is envtally damaging? No way to distinguish ethanol on the basis of PPMs.

ICTSD’s Further Work on Trade Liberalisation in EGS
Technology mapping studies in 4 key mitigation sectors identified by the IPCC
Energy Building Transport Industry
Specification of technologies for mitigation and identification of corresponding goods
Definition of HS codes at 6 digit and beyond; options for new classification
Analysis of trade flows, tariff and non-tariff barriers, DCA, GHG mitigation potential
Research and analytical insight into UNFCCC negotiations on (potential for trade to enhance) transfer of technology
• Preliminary Findings from ICTSD Trade Analysis of 64
Products ( HS 6-digit Level) in the Renewable Energy Supply
Sector
• ICTSD Analytical Exercise conducted with support of
UNEP
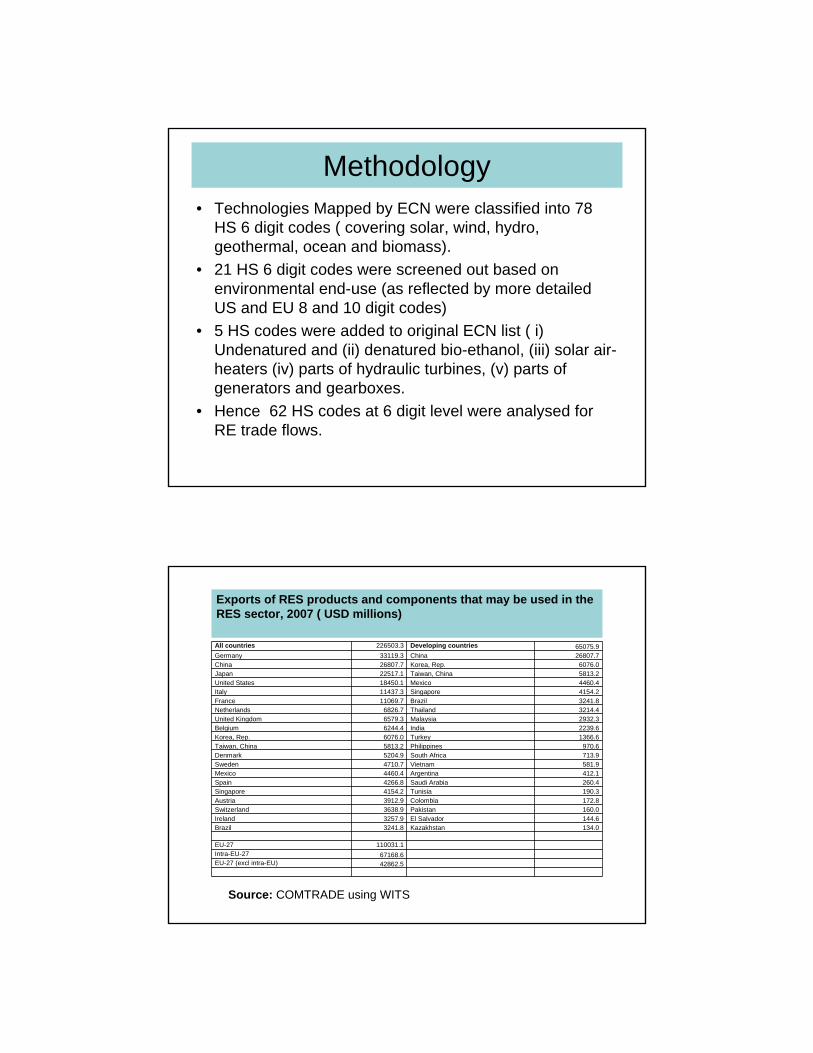
Methodology• Technologies Mapped by ECN were classified into 78
HS 6 digit codes ( covering solar, wind, hydro, geothermal, ocean and biomass).
• 21 HS 6 digit codes were screened out based on environmental end-use (as reflected by more detailed US and EU 8 and 10 digit codes)
• 5 HS codes were added to original ECN list ( i) Undenatured and (ii) denatured bio-ethanol, (iii) solar air-heaters (iv) parts of hydraulic turbines, (v) parts of generators and gearboxes.
• Hence 62 HS codes at 6 digit level were analysed for RE trade flows.
Exports of RES products and components that may be used in the RES sector, 2007 ( USD millions)
Source: COMTRADE using WITS
All countries 226503.3 Developing countries 65075.9Germany 33119.3 China 26807.7China 26807.7 Korea, Rep. 6076.0Japan 22517.1 Taiwan, China 5813.2United States 18450.1 Mexico 4460.4Italy 11437.3 Singapore 4154.2France 11069.7 Brazil 3241.8Netherlands 6826.7 Thailand 3214.4United Kingdom 6579.3 Malaysia 2932.3Belgium 6244.4 India 2239.6Korea, Rep. 6076.0 Turkey 1366.6Taiwan, China 5813.2 Philippines 970.6Denmark 5204.9 South Africa 713.9Sweden 4710.7 Vietnam 581.9Mexico 4460.4 Argentina 412.1Spain 4266.8 Saudi Arabia 260.4Singapore 4154.2 Tunisia 190.3Austria 3912.9 Colombia 172.8Switzerland 3638.9 Pakistan 160.0Ireland 3257.9 El Salvador 144.6Brazil 3241.8 Kazakhstan 134.0
EU-27 110031.1Intra-EU-27 67168.6EU-27 (excl intra-EU) 42862.5

Imports of RES products and components that may be used in the RES sector, 2007 ( USD millions)
Source: COMTRADE using WITS
All countries 234859.3 Developing countries 88905.3United States 29516.0 China 20652.9Germany 21458.6 Hong Kong, China 8830.9China 20652.9 Korea, Rep. 8355.1Hong Kong, China 8830.9 Mexico 6851.8Spain 8759.9 Taiwan, China 5493.9France 8519.5 Singapore 4293.8Korea, Rep. 8355.1 Thailand 3326.1Japan 8283.0 India 3265.2Italy 7426.5 Saudi Arabia 3044.7United Kingdom 7179.7 Malaysia 2528.7Mexico 6851.8 Brazil 2406.8Netherlands 6585.2 Turkey 2053.5Canada 6408.3 Vietnam 1890.4Taiwan, China 5493.9 South Africa 1329.9Belgium 5067.9 Qatar 1100.0Singapore 4293.8 Argentina 1018.0Russian Federation 4147.4 Kazakhstan 919.8Sweden 3393.0 Algeria 683.7Thailand 3326.1 Chile 650.1India 3265.2 Pakistan 588.5
EU-27 88179.5Intra-EU-27 58765.0EU-27 (excl intra-EU) 29414.5
Some comments on hydro, geo-thermal and ocean energy products
• Most cases main countries trading in relevant HS codes are not the main deployers of energy.
• This implies that mapping of technologies used in these energy sources to HS 6 digit may not be accurate and include a diverse range of products.
• Further on-site development and grid development may be more relevant to these forms of energy rather than tradeable parts.

Solar Energy Products and Components Used in Solar
Energy Generation
Top Twenty Exporters on Solar Energy Products and Components (in USD Millions)
All countries 93400.6 Developing countries 34615.7China 17589.5 China 17589.5Germany 12573.6 Taiwan, China 4254.1Japan 10806.1 Korea, Rep. 3258.7United States 8327.5 Thailand 2351.7Taiwan, China 4254.1 Singapore 1681.1Italy 3608.1 Malaysia 1558.5Korea, Rep. 3258.7 Mexico 1328.9France 3035.7 Philippines 915.1United Kingdom 2459.1 India 859.2Thailand 2351.7 South Africa 183.5Sweden 2301.7 Brazil 173.9Netherlands 2193.8 Turkey 157.0Switzerland 1956.6 Saudi Arabia 69.7Belgium 1791.9 Vietnam 60.2Singapore 1681.1 Argentina 43.8Malaysia 1558.5 Hong Kong, China 30.9Austria 1485.6 Costa Rica 13.3Mexico 1328.9 Macao 9.2Finland 1176.6 Tunisia 8.8Czech Republic 1124.3 Ghana 6.7
EU-27 35617.4
Source: COMTRADE using WITS

Top Twenty Importers on Solar Energy Products and Components (in USD Millions)
Source: COMTRADE using WITS
All countries 98832.9 Developing countries 39721.1United States 12426.1 China 11015.2China 11015.2 Hong Kong, China 5884.4Germany 9696.2 Korea, Rep. 4369.4Hong Kong, China 5884.4 Taiwan, China 2652.4Japan 4507.5 Mexico 2350.5Spain 4494.5 Singapore 1783.0Korea, Rep. 4369.4 Thailand 1445.1France 2868.4 Saudi Arabia 1356.1Taiwan, China 2652.4 Malaysia 1263.3Netherlands 2590.2 India 1048.2Italy 2495.8 Vietnam 798.0Canada 2462.4 Brazil 760.4United Kingdom 2401.6 Turkey 568.1Mexico 2350.5 Qatar 521.2Russian Federation 1989.6 United Arab Emirates 504.6Singapore 1783.0 South Africa 437.5Belgium 1551.3 Kazakhstan 332.1Thailand 1445.1 Argentina 316.2Saudi Arabia 1356.1 Pakistan 222.0
EU-27 34149.9
Tariffs on solar technology products
• The applied tariffs are in generally below 15%.
• Major importers have low or zero tariffs.
• Only Morocco which is not a major trader has high tariffs.
• When prices are falling, tariffs unlikely to be an important market driver. Feed-in tariffs may be more important.
0 10 20 30
EU
US
Japan
China
South Africa
Croatia
Brazil
India
Slovak Rep.
Hong Kong
Singapore
Slovenia
Argentina
Colombia
Korea Rep.
Malaysia
Lithuania
Estonia
Morocco
Series1

Analysis of exports and imports of solar-equipment
• The global photovoltaic (PV) industry faces an oversupply situation leading to falling prices along the supply chain by at least 20-40% in 2009.
• Further, the global PV market in 2009 is likely to decrease by around 10% in value terms over 2008. (SolarPlaza, Nov 2008)
• China is emerging as the largest player in PV with a substantial share of global trade (exports and imports) as well.
• China’s high share in trade in PV is also indicative of the fact that several components of solar technology have now become tradable.
Analysis of exports and imports of solar-equipment
• However largely ‘environmental end-use’ HS 6 digit category in solar seems to be 854140 where the ex-out of photosensitive semiconductor devices including photovoltaic cells makes up a large part of the trade.
• Main importers appear to be the main deployers.
• Costs of solar generation seem to be coming down and tariff reduction could further aid in lower cost of production.
• However subsidies still needed to ensure ‘grid-parity’with conventional electricity generation.

Wind Energy Products and Components Used in Wind
Energy Generation
Top 10 Wind Energy-Installed Capacity (until Dec 2008). Source: Global Wind Energy Council
Country MW %
US 25,170 20.8
Germany 23,903 19.8
Spain 16,754 13.9
China 12,210 10.1
India 9,645 8.0
Italy 3,736 3.1
France 3,404 2.8
UK 3,241 2.7
Denmark 3,180 2.6
Portugal 2,862 2.4
Rest of the World 16.686 13.8
Total Top 10 104,104 86.2
World Total 120,791 100.0

Top 10 Wind Energy-Installed Capacity (Jan-Dec 2008). Source: Global Wind Energy Council
Country MW %
US 8,358 31
China 6,300 23
India 1,800 7
Germany 1.655 6
Spain 1.609 6
Italy 1,010 4
France 950 4
UK 836 3
Portugal 712 3
Canada 523 2
Rest of the World 3,293 12
Total Top 10 23,763 88
World Total 27,056 100
Top Twenty Exporters of Wind Energy Supply Products and (in USD Millions)
Source: COMTRADE using WITS
All countries 102823.4 Developing countries 25042.7Germany 16110.3 China 7316.0Japan 8525.3 Mexico 4259.0United States 8263.7 Singapore 2385.3China 7316.0 Korea, Rep. 2244.7Italy 6236.3 Brazil 1522.1France 5608.6 India 1260.2Mexico 4259.0 Turkey 1129.2Denmark 3963.6 Taiwan, China 1030.3United Kingdom 3038.8 Malaysia 910.5Spain 2961.9 Thailand 758.3Belgium 2540.4 Vietnam 482.2Singapore 2385.3 South Africa 392.0Korea, Rep. 2244.7 Tunisia 181.7Austria 2159.0 Argentina 181.2Sweden 2028.3 Saudi Arabia 150.5Netherlands 1764.3 Colombia 145.3Hungary 1751.4 Morocco 126.1Canada 1750.1 Kazakhstan 108.4Brazil 1522.1 Syrian Arab Republic 96.1Finland 1387.6 Chile 57.2
EU-27 55426.6

Top Twenty Importers of Wind Energy Products and Components (in USD Millions)
Source: COMTRADE using WITS
All countries 109167.1 Developing countries 38504.7United States 16721.9 China 7532.3Germany 10095.1 Mexico 4269.1China 7532.3 Korea, Rep. 2481.3Mexico 4269.1 Hong Kong, China 2432.1France 4180.5 Singapore 2230.0United Kingdom 3840.3 India 1998.2Canada 3825.3 Brazil 1843.4Italy 3762.1 Thailand 1563.1Spain 3405.6 Saudi Arabia 1517.8Japan 2970.1 United Arab Emirates 1303.1Korea, Rep. 2481.3 Taiwan, China 1067.8Hong Kong, China 2432.1 Turkey 1025.6Belgium 2291.7 Malaysia 976.5Singapore 2230.0 South Africa 796.3Denmark 2161.0 Argentina 619.9India 1998.2 Vietnam 584.4Netherlands 1849.6 Qatar 538.9Brazil 1843.4 Kazakhstan 469.5Sweden 1803.7 Algeria 400.2Thailand 1563.1 Morocco 346.6
EU-27 41199.6
Analysis of wind energy exports and imports.
• A third of the world's wind capacity is now under the aegis of the top 20 wind farm owners.
• Two Chinese manufacturers (Goldwind & Sinovel) and one from India (Suzlon) in total now represent 18 % of the global supply.
• Apart from wind turbines, the top twenty exporters of components of wind energy supply goods are however not exactly the same as thetop twenty producers of wind energy. Eg: India.
• This shows the limitations of the mapping exercise where a number of components for wind energy may actually be dual use products.
• However more of a correlation between deployers and importers. India again an exception. Most components locally produced.
• Large producers such as India may also be producing for the local market, but where assembly is in third countries they may be importing components. China has built up significant capacity along supply chain.

Analysis of wind energy exports and imports.
• Localisation in some countries driven by incentives (such as tax-credits, feed-in tariffs) but also desire by firms to avoid import duties, transportation costs and logistical difficulties.
• Regression shows that feed-in tariffs affect imports of wind components.
• In wind-energy there is a ‘rare-gem’ or HS-6 digit category i.e. HS 850321 (other generating sets-wind powered). Mapping export flows in this HS code gives a better fit between the main producers and main deployers of wind energy.
Exports of wind-powered generating sets (HS 850231)
Exporter(all)
Exports ($million) Exporter(developing countries) Exports ($million)
World 3910.9 All developing countries* 524.8
Denmark 1718.6 India 335.8Germany 969.5 Vietnam 108.6
Japan 354.0 China 78.0India 335.8 Brazil 1.0
Spain 198.0
Vietnam 108.6China 78.0
Italy 44.5
Australia 36.9Netherlands 15.8
United Kingdom 15.2United States 14.2
Greece 5.1
France 4.4Czech Republic 2.2
Canada 2.2
Estonia 2.0Austria 1.4
Brazil 1.0
EU-total 2978.6
EU-total (excl intra-EU trade) 1860.2
Source: COMTRADE using WITS

Global Market Share of Top Original Equipment Manufacturers (OEM) of Wind Turbines.
Source: BTM Consult, International Wind Energy Development: World Market Update 2008, 24
Vestas (Denmark), 17.8%GE (United States) 16.7%Gamesa (Spain), 10.8%Enercon (Germany), 9.0%Sinovel (China), 4.5%Acciona (Spain), 4.1%Goldwind (China), 3.6%Nordex (Germany), 3.4%Dongfang (China), 3.4%Suzlon (India), 8.1%REpower (Germany), 3.0%Mitsubishi (Japan), 2.6%Others 6.8%Siemens (Germany), 6.2%
Tariffs of Major Importers of Wind Energy Products for 2007
Source: COMTRADE using WITS

Undenatured Bio-ethanol
Top 20 Exporters of Undenatured Bio-ethanol (HS 2207 10) in 2007 (in USD’000)
Reporter Name Exports ‘000
Brazil 1,439,175.318El Salvador 142,146.699South Africa 85,401.737European Union 70,869.879Jamaica 60,143.786China 53,415.032United States 50,516.835Canada 42,055.836Argentina 38,278.422Guatemala 38,001.383Costa Rica 29,438.829Bolivia 28,168.575Trinidad and Tobago 27,812.468Pakistan 23,171.072Thailand 20,340.420Ecuador 13,199.887Turkey 12,496.498Peru 9,035.767Kenya 7,366.704India 7,229.792

Top 20 Importers of Undenatured Bio-ethanol (HS 2207 10) in 2007 (in USD’000)
Source: WITS
Top 20 Importers of Undenatured Bio-ethanol (HS 2207 10) in 2007 (in USD’000)
Source: WITS

Ethanol Import Duties in Select Countries-2004
Analysis of bio-ethanol trade
• Targets an important driver though subsidies and tariffs also affect trade
• More export opportunities particularly for the lower-income developing countries.
• Many countries import and process undenatured ethanol and export it on to FTA partners. Carribean countries a good example.

Regression Analysis to Detect Drivers of Exports and Imports in Renewable Energy
Products• Export and Imports Taken as the Independent Variables
• Import Tariffs, Targets for Renewables, Proportion of Renewables in an Economy, Subsidies such as feed-in tariffs and Patents for RE Technology Registered by a Country taken as explanatory variables.
•Exports of RE products affected by a composite variable of subsidies and share of RE in Energy Mix as well as patents of RE technology registered by a country. Import Tariffs of country A not very significant in determining exports of country A.
•Imports of RE products affected more by import tariffs but perhaps more importantly by subsides and targets. No: of patents registered by a county also affect imports.
•Thus tariff liberalisation is important but may not be as influential as other market drivers in determining trade.
•Registration of patents appear to boost trade but this is again if foreign firms interested in commercialising technology in market. China has lion’s share of registered patents increasingly by Chinese companies
Summary of Findings from the Renewable Energy Sector by Veena Jha for ICTSD [forthcoming (2009)]
• Only a handful of players important in trade in renewables. Any negotiating proposal for liberalising trade will need to take account of this.
• No matter how careful the mapping exercise, translating renewables to six digit tariff lines has serious limitations. In most cases it would include multiple use products.
• Emerging economies important players, though their share of trade is less than half that of developed countries.
• Components for solar and wind appear more tradeable than for geothermal, hydro and ocean.

Summary of Findings from the Renewable Energy Sector by Veena Jha for ICTSD [forthcoming (2009)]
• Liberalizing tariffs alone may not guarantee a diffusion of these technologies or the creation of markets for products used in these technologies in developing countries.
• Subsidies, venture capital investment important drivers of exponential market growth in developed countries.
• Given the present grip of the economic and the financial crisis it is unlikely that such venture capital will come to developing countries.
• Other NTBs need to be addressed.
Concluding thoughts
• Trade liberalisation is only a part of the picture. RE Market creation and energy efficiency may need supportive measures outside WTO.
• The latter in turn may enhance trade further.
• Implications for trade and climate change negotiations?

Thank You