flows through school systems in southern africa: pa8erns
TRANSCRIPT

FlowsthroughschoolsystemsinSouthernAfrica:Pa8erns,
trendsandpolicies
ServaasvanderBerg&ChrisvanWyk
ReSEP,UniversityofStellenbosch
QuanGtaGveEducaGonResearchConference
Stellenbosch6September2018

ContentSixcountries:• Mozambique• Swaziland• Lesotho• SouthAfrica• Botswana• NamibiaThreeareasoffocus:• A>ainment(history)• A>endance(current),repeDDonanddrop-out• Quality(cogniDveoutcomes)Threedimensionsofinequality:• Bygender• BylocaDon(region/province/urban-rural)• Bywealthgrouping(socio-economicstatus,SES)
2

SOME CONTEXT
3

SCHOOLS
Geographical Distribution of Schools

Theissue:
CanincenGvesofN$20000peryearmoGvateteacherswithpost-graduateteacherqualificaGonstoteachinremoteareas…
Thepuzzle:WhydomorethanhalfofNamibia’squalifiedteachersteachinremoteareas,despitethelivingcondiGons?
withhousingcondiGonssuchas
this?

Namibia:Enrolmentbyhomelanguage,2014
0
20000
40000
60000
80000
100000
120000
140000
160000
180000Oshikwan
yama
OtherOshiwam
boLan
guages
Oshindo
nga
Khoe
khoe
gowab
(Nam
a/Da
mara)
Otjihe
rero
Afrik
aans
Rukw
angali
OtherLan
guages
OtherCap
riviLan
guages
Rugciriku
Thim
buku
shu
San
Silozi
English
Shisha
mbyu
Setswan
a
German
OtherEurop
eanLangua
ges
SignLan
guage
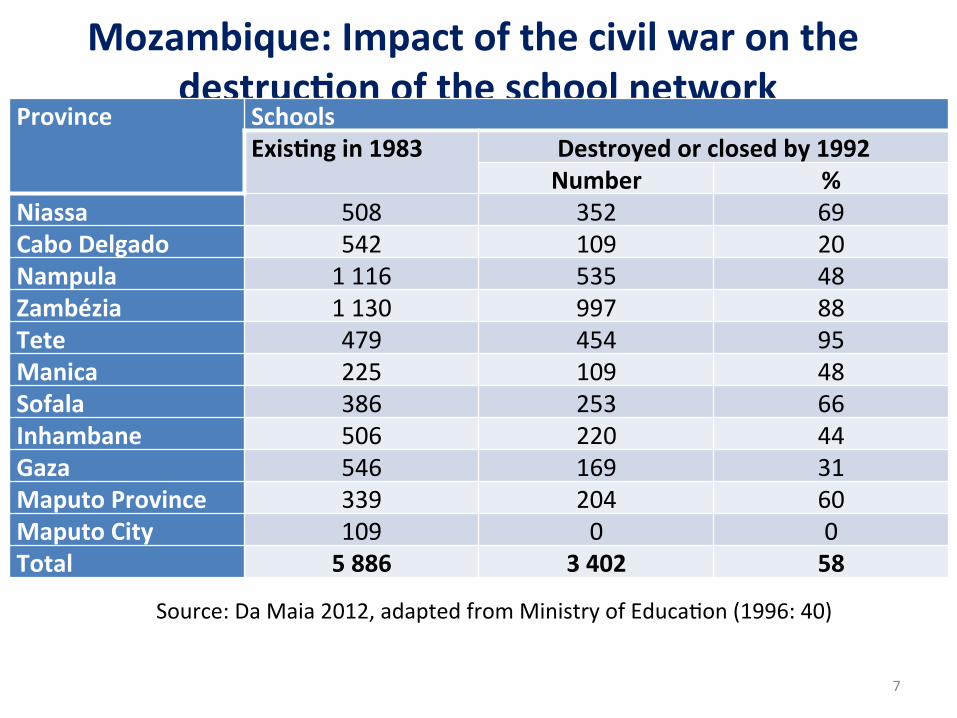
Mozambique:ImpactofthecivilwaronthedestrucGonoftheschoolnetwork
Province SchoolsExisGngin1983 Destroyedorclosedby1992
Number %Niassa 508 352 69CaboDelgado 542 109 20Nampula 1116 535 48Zambézia 1130 997 88Tete 479 454 95Manica 225 109 48Sofala 386 253 66Inhambane 506 220 44Gaza 546 169 31MaputoProvince 339 204 60MaputoCity 109 0 0Total 5886 3402 58
7
Source:DaMaia2012,adaptedfromMinistryofEducaDon(1996:40)

Mozambique:
8Source:OwncalculaGonsfromAnnualSchoolCensus(EMIS)
12 291 12 291 12 241 12 06811 387
7 3396 624
854 834 808 464 435
0
2000
4000
6000
8000
10000
12000
14000
Gr1 Gr2 Gr3 Gr4 Gr5 Gr6 Gr7 Gr8 Gr9 Gr10 Gr11 Gr12
InZambezia:3252schoolsofferGr1,only85Gr8,only40Gr12
0
200000
400000
600000
800000
1000000
1200000
1400000
1600000Enrolmentbyprovinceandgrade,2017
CidadedeMaputo
Maputo
Gaza
Inhambane
Sofala
Manica
Tete
Zambézia
Nampula
CaboDelgado
Niassa
Enrolmentbyprovinceandgrade,2017Numberofschoolsofferingvariousgrades,2017

PROGRESSINATTAINMENT
9
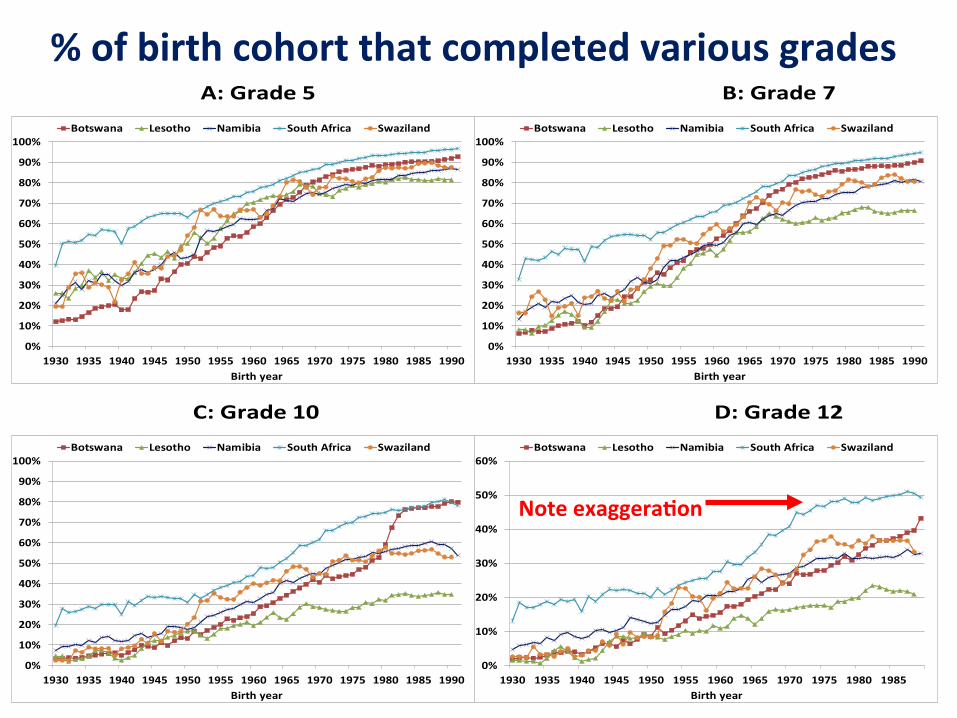
%ofbirthcohortthatcompletedvariousgradesA:Grade5 B:Grade7
C:Grade10 D:Grade12
0%
10%
20%
30%
40%
50%
60%
70%
80%
90%
100%
1930 1935 1940 1945 1950 1955 1960 1965 1970 1975 1980 1985 1990Birthyear
Botswana Lesotho Namibia SouthAfrica Swaziland
0%
10%
20%
30%
40%
50%
60%
70%
80%
90%
100%
1930 1935 1940 1945 1950 1955 1960 1965 1970 1975 1980 1985 1990Birthyear
Botswana Lesotho Namibia SouthAfrica Swaziland
0%
10%
20%
30%
40%
50%
60%
70%
80%
90%
100%
1930 1935 1940 1945 1950 1955 1960 1965 1970 1975 1980 1985 1990Birthyear
Botswana Lesotho Namibia SouthAfrica Swaziland
0%
10%
20%
30%
40%
50%
60%
1930 1935 1940 1945 1950 1955 1960 1965 1970 1975 1980 1985Birthyear
Botswana Lesotho Namibia SouthAfrica Swaziland
NoteexaggeraGon

Lesotho:%ofbirthcohortthathavereachedatleastGrades1,5,7,10&12
0%
10%
20%
30%
40%
50%
60%
70%
80%
90%
100%
1930 1940 1950 1960 1970 1980 1990Yearofbirth
Gr1
Gr5
Gr7
Gr10
Gr12
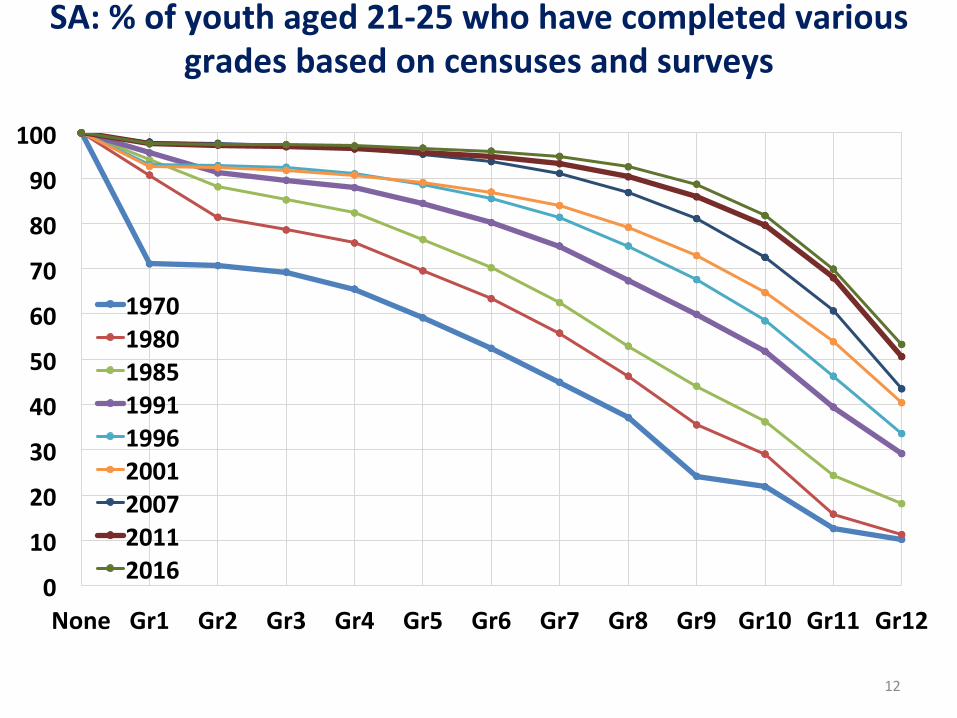
SA:%ofyouthaged21-25whohavecompletedvariousgradesbasedoncensusesandsurveys
12
0
10
20
30
40
50
60
70
80
90
100
None Gr1 Gr2 Gr3 Gr4 Gr5 Gr6 Gr7 Gr8 Gr9 Gr10 Gr11 Gr12
197019801985199119962001200720112016

Namibia:A8ainmentprofileages20to25,2001and2011

Lesotho:EnrolmentandpopulaGonesGmatesbyage,2017
0
10
20
30
40
50
60
5 10 15 20
Pop
ulat
ion
('000
)
Age
Population and enrolment 2017
UN Population Division estimates Census 2016 Enrolment

Namibia:%over-agedforgrade(olderthan7ingrade1,8ingrade2,etc.)
15
29%
42%49%
54%
63% 63% 63%
71% 72%66%
56%51%
0%
10%
20%
30%
40%
50%
60%
70%
80%
1 2 3 4 5 6 7 8 9 10 11 12Grade

Teachersvsenrolment
Category1 Category2 Category3 Category4 Total Cat.1-3%ofteacherswithpost-graduateteacherqualificaGons
2008 21.2% 22.3% 19.7% 27.2% 23.5% 20.8%2012 24.9% 26.2% 24.6% 30.0% 27.3% 25.1%
Pupil-teacherraGo2008 26.7 27.9 28.2 27.4 27.6 27.72012 24.2 24.8 24.8 25.5 25.1 24.7
Allteachersper1000enrolled2008 37.5 35.9 35.5 36.5 36.2 36.02012 41.2 40.3 40.3 39.2 39.9 40.5Growth 10% 12% 14% 7% 10% 12%
Teacherswithpost-graduateteacherqualificaGonsper1000students2008 7.9 8.0 7.0 9.9 8.5 7.52012 10.3 10.6 9.9 11.7 10.9 10.2
Growth 29% 32% 42% 19% 28% 36%
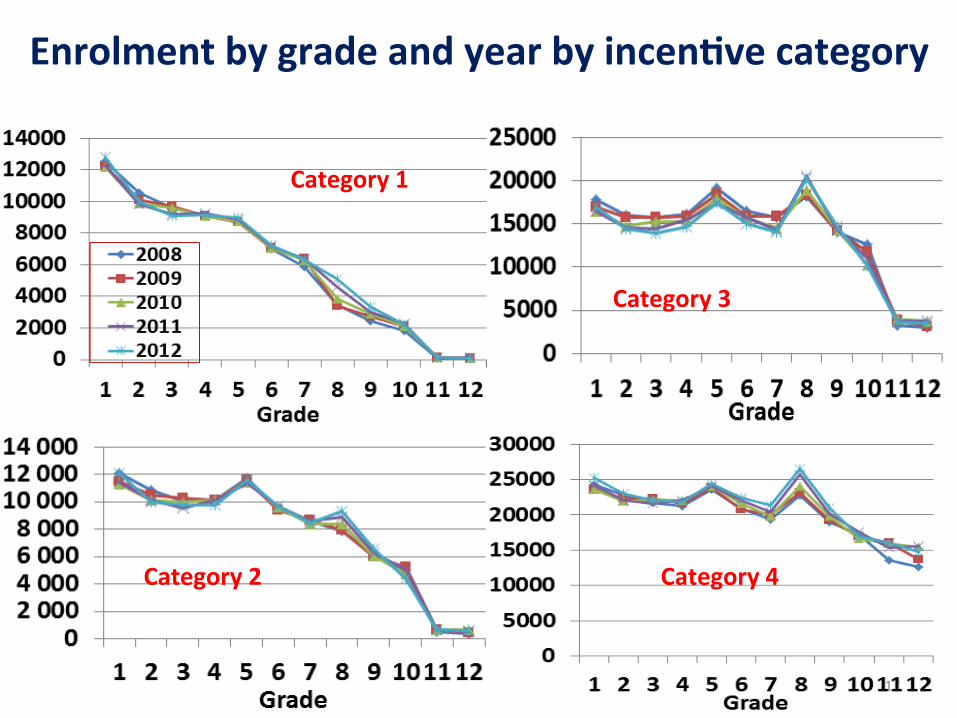
EnrolmentbygradeandyearbyincenGvecategory
17
Category1
Category3
Category2 Category4

‘Survivalrates’byincenGvecategory,2012
18
49%
17%
1%
70%
36%
5%
83%
60%
21%
84%
67%
58%
0%
10%
20%
30%
40%
50%
60%
70%
80%
90%
100%
Grade1 Grade5 Grade10 Grade12
Category1
Category2
Category3
Category4

ATTAINMENT AND ENROLMENT
19

Mozambique:Gr6pupils,SACMEQII&SACMEQIIIProvinces SACMEQII2000SACMEQIII2007 %-changeNiassa 5317 13944 162CaboDelgado 4660 21184 355Nampula 14514 40692 180Zambézia 13722 46396 238Tete 7269 23561 224Manica 7986 23786 198Sofala 9192 29861 225Inhambane 12531 29935 139Gaza 12063 27059 124MaputoProvince 10257 32397 216MaputoCity 24827 30429 23Total 122338 319243 161
20Source:DerivedfromSACMEQII&SACMEQIII
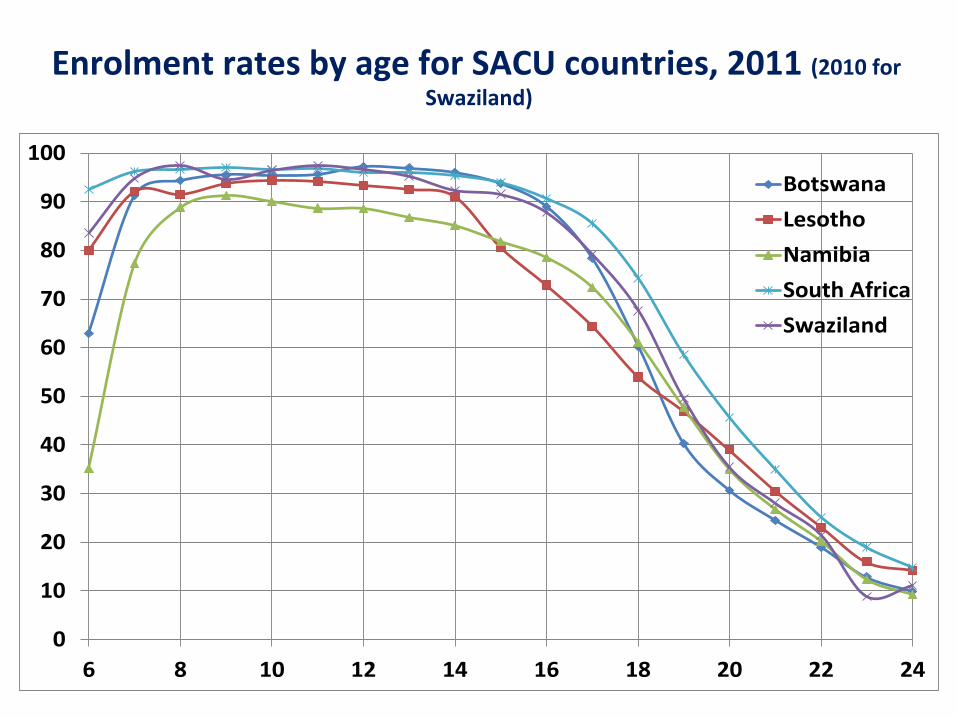
EnrolmentratesbyageforSACUcountries,2011(2010forSwaziland)
0
10
20
30
40
50
60
70
80
90
100
6 8 10 12 14 16 18 20 22 24
BotswanaLesothoNamibiaSouthAfricaSwaziland

Enrolment by grade and year
0
10000
20000
30000
40000
50000
60000std1
std2
std3
std4
std5
std6
std7
frm1
frm2
frm3
frm4
frm5
2007 20082009 20102011 20122013 2014
Botswana
01000020000300004000050000600007000080000
1 2 3 4 5 6 7 8 9 10 11 12Grade
20082009201020112012
Namibia
0
5000
10000
15000
20000
25000
30000
35000
40000
45000
Grade1
Grade2
Grade3
Grade4
Grade5
Grade6
Grade7
Form1
Form2
Form3
Form4
Form5
2009
2010
2011
2012
2013
2014
2015
2016
Swaziland

Mozambique:%ofpopulaGonwithnoeducaGonbybirthcohortbymainregion(PanelA),byprovince(PanelB)andbygender(PanelC)
23
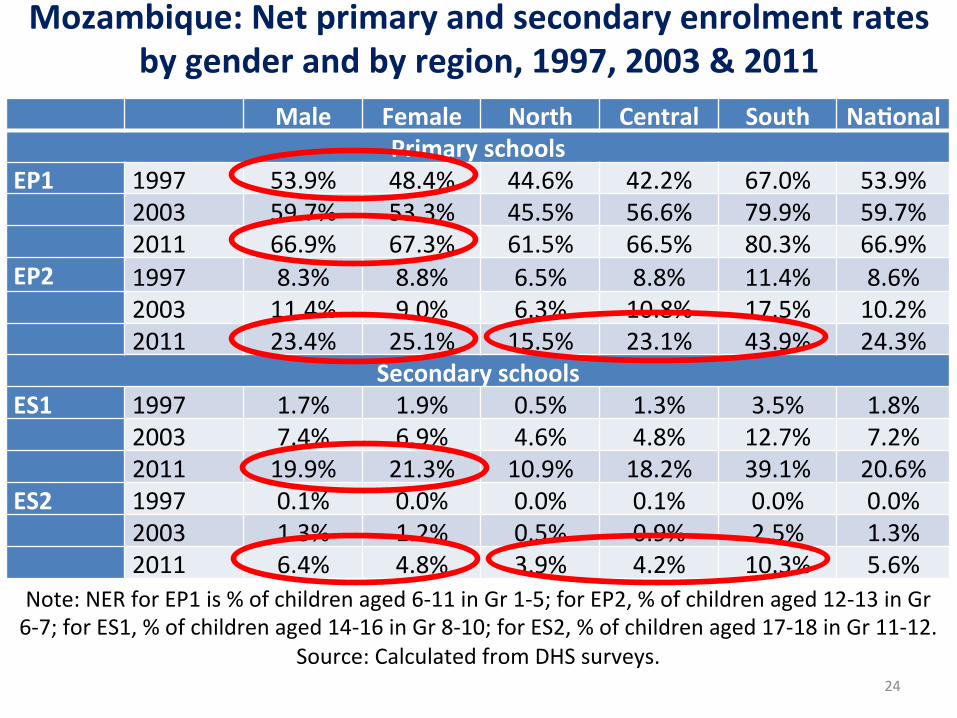
Mozambique:Netprimaryandsecondaryenrolmentratesbygenderandbyregion,1997,2003&2011
Male Female North Central South NaGonalPrimaryschools
EP1 1997 53.9% 48.4% 44.6% 42.2% 67.0% 53.9% 2003 59.7% 53.3% 45.5% 56.6% 79.9% 59.7% 2011 66.9% 67.3% 61.5% 66.5% 80.3% 66.9%EP2 1997 8.3% 8.8% 6.5% 8.8% 11.4% 8.6% 2003 11.4% 9.0% 6.3% 10.8% 17.5% 10.2% 2011 23.4% 25.1% 15.5% 23.1% 43.9% 24.3%
SecondaryschoolsES1 1997 1.7% 1.9% 0.5% 1.3% 3.5% 1.8% 2003 7.4% 6.9% 4.6% 4.8% 12.7% 7.2% 2011 19.9% 21.3% 10.9% 18.2% 39.1% 20.6%ES2 1997 0.1% 0.0% 0.0% 0.1% 0.0% 0.0% 2003 1.3% 1.2% 0.5% 0.9% 2.5% 1.3% 2011 6.4% 4.8% 3.9% 4.2% 10.3% 5.6%
24
Note:NERforEP1is%ofchildrenaged6-11inGr1-5;forEP2,%ofchildrenaged12-13inGr6-7;forES1,%ofchildrenaged14-16inGr8-10;forES2,%ofchildrenaged17-18inGr11-12.
Source:CalculatedfromDHSsurveys.

REPETITION,DROPOUTANDCONSTRAINTSTOACCESS
25

Swaziland:‘pseudo-cohorts’vsactualcohorts2009 2010 2011 2012 2013 2014 2015 2016
Grade1 37091 411843 37034 36348 36211 36305 34791 32491
Grade2 35805 36622 37631 35610 34696 35097 35412 33812
Grade3 37158 37457 38478 38889 37181 36833 36968 36873
Grade4 34822 35180 34831 36670 36896 36248 36003 35997
Grade5 32971 34078 34389 34074 35846 36888 35978 35680
Grade6 30081 31206 32085 32574 32419 34337 35886 35023
Grade7 23183 24260 24246 24254 25055 24324 25909 27679
Form1 22059 23800 24784 24940 25448 26975 27080 27664
Form2 20811 22303 22648 22451 22954 24182 25185 25214
Form3 14343 14952 14179 13994 15077 14185 15549 16873
Form4 15553 17293 18177 17398 17273 18901 19261 19836
Form5 10307 10626 10556 11093 11144 11134 12007 12753
26Cohort 2011:Age132012:Age142013:Age152014:Age162015:Age172016:Age18
Enrolled 27605 26002 24595 23147 21748 17357

Progression of 2007 Western Cape Gr 1 learners within primary school
2007 2008 2009 2010 2011 2012 2013
Gr1 92731 16214 514 78 18 3 4
Gr2 0 71069 21749 1695 145 31 8
Gr3 0 0 61795 23763 2419 226 29
Gr4 0 0 0 56649 27846 7815 712
Gr5 0 0 0 0 49785 24561 9189
Gr6 0 0 0 0 0 46259 23671
Gr7 0 0 0 0 0 0 44058
SGllinschool 92731 87283 84058 82185 80213 78895 77671
Repeaters 0 16214 22263 25536 30428 32636 33613
Dropout 0 5448 3225 1873 1972 1318 1224
Cum.Dropout 0 5448 8673 10546 12518 13836 15060

TeacherissuesinMozambique
• 45%ofteachersabsent,another21%notinclassteaching
• 44%ofprincipalsabsent• Only60%oflowerprimaryteacherscouldgivethecorrectanswertoasimplesubtracGonproblem,86–55
• TeacherpedagogyweakerthaninotherAfricancountrieswhereServiceDeliveryIndicatorsweremeasured
(Source:Molina&MarGn2015)
28

EDUCATIONQUALITY/COGNITIVEOUTCOMES
29

PerformanceininternaGonaleducaGonalevaluaGonsinPISAmetricsbypercapitaGDP(PPP$),2011
Botswana
Lesotho Namibia
South Africa
Swaziland
200
300
400
500
600
scor
e in
PIS
A-m
etric
s
6 8 10 12log of GDP per capita, 2011 PPP$
Score in PISA metricsSource: International performance in Pisa metrics based on estimates by Gustafsson

ReadingscoresinSACMEQIII
468 476495 497
535549
300
350
400
450
500
550
600Malaw
i
Zambia
Lesotho
Mozam
biqu
e
Ugand
a
SouthAfric
a
Nam
ibia
Zimba
bwe
SACM
EQIII
Botswan
a
Zanzibar
Kenya
Swaziland
Mau
riGus
Seyche
lles
Tanzan
ia
MeanRe
adingscore

Botswana:PerformanceinjointTIMSS/PIRLStest %whoreachhighinternaGonalbenchmark
(550)%whoreachlowinternaGonal
benchmark(400)
All3subjects
Reading Maths ScienceAll3
subjectsReading Maths Science
Australia 22 42 35 36 86 93 91 92CzechRepublic 21 50 30 45 92 98 93 96SlovakRepublic 21 44 30 44 89 96 91 94Lithuania 21 39 43 31 92 97 96 95Italy 18 46 28 37 90 98 93 95Sweden 18 47 25 44 91 98 93 95Romania 17 32 28 37 73 86 79 84Poland 12 39 17 29 83 95 87 91Spain 9 30 17 28 82 94 87 92UAE 6 14 12 14 48 64 64 61Iran 4 13 9 16 57 76 64 72Azerbaijan 3 9 21 13 55 82 72 65SaudiArabia 2 8 7 12 43 65 55 63Botswana(Gr.6) 3 9 7 7 37 56 60 43Honduras(Gr.6) 2 11 3 8 43 74 49 60Morocco(Gr.6) 0 1 2 1 8 21 26 15

PerformanceinPIRLS2006inEnglandandSA
0
10
20
30
40
50
60
70
80
90
100
0 100 200 300 400 500 600 700 800
CumulaG
ve%ofstude
nts
ScoreinPIRLS2006
SA
England

Mozambique:PerformanceinGr.3Portuguesetest(marksoutof24)
0.02
.04
.06
.08
Den
sity
0 5 10 15 20 25Scoreoutof24
North CentralSouth
33% 37%
6%
29%
15% 10%
10%
12%
33%24%
31%
29%
18%25%
46%
27%
1% 3% 7% 3%
0%
10%
20%
30%
40%
50%
60%
70%
80%
90%
100%
North Centre South Total
Level3
Level2
Level1
BelowLevel1
Absent
34
Source:Derivedfrom2016Grade3testdata

Namibia:RepeGGonanddropoutratesbygrade,2008-2011
0%
5%
10%
15%
20%
25%
30%
35%
40%
Gr1 Gr2 Gr3 Gr4 Gr5 Gr6 Gr7 Gr8 Gr9 Gr10
2008200920102011
0%
5%
10%
15%
20%
25%
30%
35%
40%
Gr1 Gr2 Gr3 Gr4 Gr5 Gr6 Gr7 Gr8 Gr9 Gr10

Namibia:Enrolmentbyageandgrade,2012
0
5000
10000
15000
20000
25000
30000
35000
40000
45000
05 06 07 08 09 10 11 12 13 14 15 16 17 18 19 20 21 22 23 24 25Age
Grade1
Grade2
Grade3
Grade4
Grade5
Grade6
Grade7
Grade8
Grade9
Grdae10
Grade11
Grade12

Lesotho:
Enrolmentbygradeanddistrict,2016
&NetenrolmentbyquinGleandgender,2009
37
0
10000
20000
30000
40000
50000
60000
std1 std2 std3 std4 std5 std6 std7 frm1 frm2 frm3 frm4 frm5
Districtsenrolmentbygrade,2016
THABA-TSEKA BUTHA-BUTHE LERIBE BEREA MASERU
MAFETENG MOHALESHOEK QUTHING QACHASNEK MOKHOTLONG
Primarynetenrolmentrate Secondarynetenrolmentrate
Male Female Total Male Female Total QuinDle1 87.0 94.3 90.5 6.7 14.8 10.7 QuinDle2 90.4 97.2 93.8 15.3 27.1 21.0 QuinDle3 94.2 96.7 95.4 24.9 38.1 33.2 QuinDle4 94.5 98.0 96.2 37.0 51.6 44.4 QuinDle5 97.8 97.0 97.4 59.9 61.8 61.0 Total 92.8 96.6 94.7 28.8 38.7 34.1

Someissues
• Reasonsfordropout• RepeDDonpolicy&primaryexaminaDons• Effectofdistance/remoteness:
– Boardingschools– Teacherassignment
• Shiasto“outcomesbased”curriculum• Salariesvsotherexpenditureslow• Teachersupplyandtraining,assignment• Technicalschooltrack?
38