flowserve corp form 10-k annual report filed 2012...
TRANSCRIPT
Business Address5215 N. O'CONNOR BLVD.SUITE 2300IRVING TX 750399724436500
Mailing Address5215 N. O'CONNOR BLVD.SUITE 2300IRVING TX 75039
SECURITIES AND EXCHANGE COMMISSION
FORM 10-KAnnual report pursuant to section 13 and 15(d)
Filing Date: 2012-02-22 | Period of Report: 2011-12-31SEC Accession No. 0000030625-12-000005
(HTML Version on secdatabase.com)
FILERFLOWSERVE CORPCIK:30625| IRS No.: 310267900 | State of Incorp.:NY | Fiscal Year End: 1231Type: 10-K | Act: 34 | File No.: 001-13179 | Film No.: 12630367SIC: 3561 Pumps & pumping equipment
Copyright © 2014 www.secdatabase.com. All Rights Reserved.Please Consider the Environment Before Printing This Document
UNITED STATES SECURITIES AND EXCHANGE COMMISSIONWashington, D.C. 20549
Form 10-K
þ ANNUAL REPORT PURSUANT TO SECTION 13 OR 15(d) OF THE SECURITIES EXCHANGE ACT OF 1934FOR THE FISCAL YEAR ENDED DECEMBER 31, 2011
OR
o TRANSITION REPORT PURSUANT TO SECTION 13 OR 15(d) OF THE SECURITIES EXCHANGE ACT OF 1934Commission file number 1-13179
FLOWSERVE CORPORATION(Exact name of registrant as specified in its charter)
New York 31-0267900(State or other jurisdiction of
incorporation or organization)(I.R.S. Employer
Identification No.)
5215 N. O’Connor Boulevard 75039Suite 2300, Irving, Texas
(Address of principal executive offices)
(Zip Code)
Registrant’s telephone number, including area code:(972) 443-6500
Securities registered pursuant to Section 12(b) of the Act:
Title of Each Class Name of Each Exchange on Which Registered
Common Stock, $1.25 Par Value New York Stock Exchange
Securities registered pursuant to Section 12(g) of the Act:None
Indicate by check mark if the registrant is a well-known seasoned issuer, as defined in Rule 405 of the Securities Act. Yes þ No o
Indicate by check mark if the registrant is not required to file reports pursuant to Section 13 or Section 15(d) of the Act. Yes o No þ
Indicate by check mark whether the registrant (1) has filed all reports required to be filed by Section 13 or 15(d) of the Securities Exchange Act of1934 during the preceding 12 months (or for such shorter period that the registrant was required to file such reports), and (2) has been subject to suchfiling requirements for the past 90 days. Yes þ No o
Indicate by check mark if disclosure of delinquent filers pursuant to Item 405 of Regulation S-K is not contained herein, and will not be contained,to the best of registrant’s knowledge, in definitive proxy or information statements incorporated by reference in Part III of this Form 10-K or anyamendment to this Form 10-K. þ
Indicate by check mark whether the registrant has submitted electronically and posted on its corporate Web site, if any, every Interactive Data Filerequired to be submitted and posted pursuant to Rule 405 of Regulation S-T (§ 232.405 of this chapter) during the preceding 12 months (or for suchshorter period that the registrant was required to submit and post such files). Yes þ No o
Indicate by check mark whether the registrant is a large accelerated filer, an accelerated filer, a non-accelerated filer, or a smaller reporting company.See the definitions of “large accelerated filer,” “accelerated filer” and “smaller reporting company” in Rule 12b-2 of the Exchange Act. (Check one):
Large accelerated filer þ Accelerated filer o Non-accelerated filer o Smaller Reporting company o
(Do not check if a smaller reporting company)
Indicate by check mark whether the registrant is a shell company. Yes o No þ
The aggregate market value of the common stock held by non-affiliates of the registrant, computed by reference to the closing price of the registrant’scommon stock as reported on June 30, 2011 (the last business day of the registrant’s most recently completed second fiscal quarter), was approximately
Copyright © 2013 www.secdatabase.com. All Rights Reserved.Please Consider the Environment Before Printing This Document

$5,056,000,000. For purposes of the foregoing calculation only, all directors, executive officers and known 5% beneficial owners have been deemedaffiliates.
Number of the registrant’s common shares outstanding as of February 16, 2012 was 54,497,352.
DOCUMENTS INCORPORATED BY REFERENCE
Certain information contained in the definitive proxy statement for the registrant’s 2012 Annual Meeting of Shareholders scheduled to be held onMay 17, 2012 is incorporated by reference into Part III hereof.
Copyright © 2013 www.secdatabase.com. All Rights Reserved.Please Consider the Environment Before Printing This Document
FLOWSERVE CORPORATIONFORM 10-K
TABLE OF CONTENTS
Page
PART IItem 1. Business 1Item 1A. Risk Factors 13Item 1B. Unresolved Staff Comments 20Item 2. Properties 20Item 3. Legal Proceedings 20Item 4. Mine Safety Disclosures 20
PART IIItem 5. Market for the Registrant’s Common Equity, Related Stockholder Matters and Issuer Purchases of Equity
Securities 21Item 6. Selected Financial Data 23Item 7. Management’s Discussion and Analysis of Financial Condition and Results of Operations 24Item 7A. Quantitative and Qualitative Disclosures About Market Risk 50Item 8. Financial Statements and Supplementary Data 52Item 9. Changes in and Disagreements with Accountants on Accounting and Financial Disclosure 99Item 9A. Controls and Procedures 100Item 9B. Other Information 100
PART IIIItem 10. Directors, Executive Officers and Corporate Governance 100Item 11. Executive Compensation 100Item 12. Security Ownership of Certain Beneficial Owners and Management and Related Stockholder Matters 101Item 13. Certain Relationships and Related Transactions, and Director Independence 101Item 14. Principal Accounting Fees and Services 101
PART IVItem 15. Exhibits, Financial Statement Schedules 102Signatures 103EX-31.1EX-31.2EX-32.1EX-32.2EX-101 INSTANCE DOCUMENTEX-101 SCHEMA DOCUMENTEX-101 CALCULATION LINKBASE DOCUMENTEX-101 LABELS LINKBASE DOCUMENTEX-101 PRESENTATION LINKBASE DOCUMENTEX-101 DEFINITION LINKBASE DOCUMENT
i
Copyright © 2013 www.secdatabase.com. All Rights Reserved.Please Consider the Environment Before Printing This Document
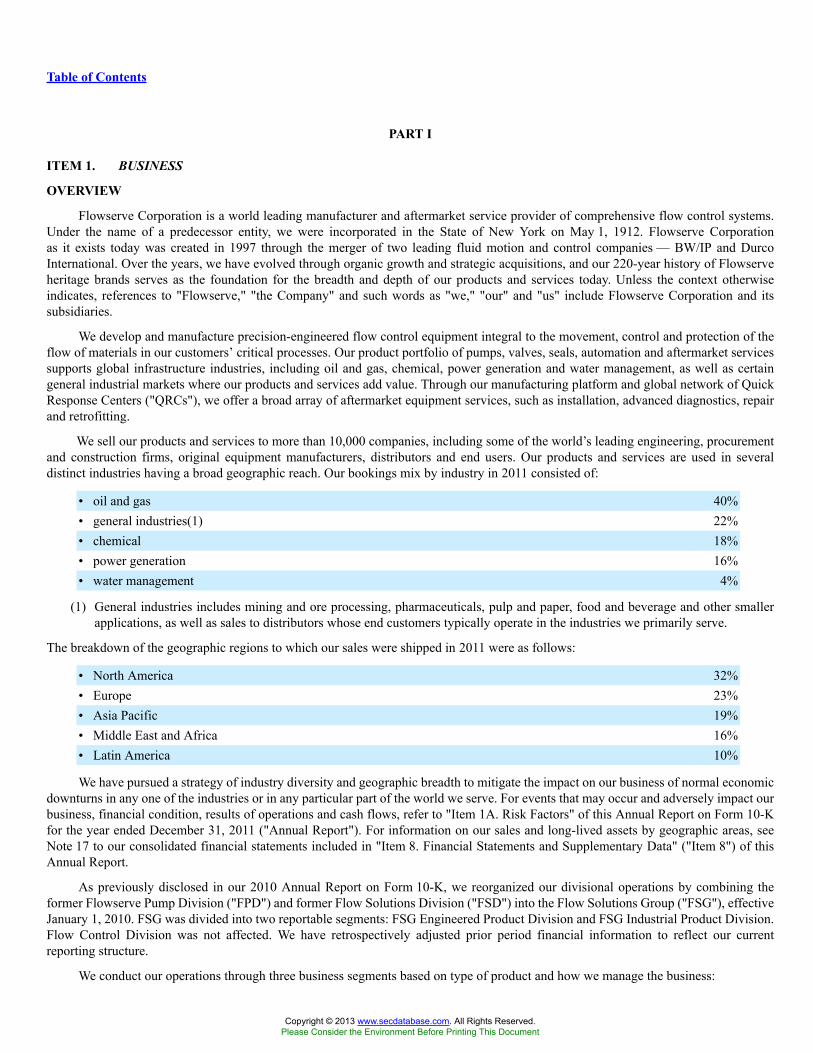
Table of Contents
PART I
ITEM 1. BUSINESS
OVERVIEW
Flowserve Corporation is a world leading manufacturer and aftermarket service provider of comprehensive flow control systems.Under the name of a predecessor entity, we were incorporated in the State of New York on May 1, 1912. Flowserve Corporationas it exists today was created in 1997 through the merger of two leading fluid motion and control companies — BW/IP and DurcoInternational. Over the years, we have evolved through organic growth and strategic acquisitions, and our 220-year history of Flowserveheritage brands serves as the foundation for the breadth and depth of our products and services today. Unless the context otherwiseindicates, references to "Flowserve," "the Company" and such words as "we," "our" and "us" include Flowserve Corporation and itssubsidiaries.
We develop and manufacture precision-engineered flow control equipment integral to the movement, control and protection of theflow of materials in our customers’ critical processes. Our product portfolio of pumps, valves, seals, automation and aftermarket servicessupports global infrastructure industries, including oil and gas, chemical, power generation and water management, as well as certaingeneral industrial markets where our products and services add value. Through our manufacturing platform and global network of QuickResponse Centers ("QRCs"), we offer a broad array of aftermarket equipment services, such as installation, advanced diagnostics, repairand retrofitting.
We sell our products and services to more than 10,000 companies, including some of the world’s leading engineering, procurementand construction firms, original equipment manufacturers, distributors and end users. Our products and services are used in severaldistinct industries having a broad geographic reach. Our bookings mix by industry in 2011 consisted of:
• oil and gas 40%• general industries(1) 22%• chemical 18%• power generation 16%• water management 4%
(1) General industries includes mining and ore processing, pharmaceuticals, pulp and paper, food and beverage and other smallerapplications, as well as sales to distributors whose end customers typically operate in the industries we primarily serve.
The breakdown of the geographic regions to which our sales were shipped in 2011 were as follows:
• North America 32%• Europe 23%• Asia Pacific 19%• Middle East and Africa 16%• Latin America 10%
We have pursued a strategy of industry diversity and geographic breadth to mitigate the impact on our business of normal economicdownturns in any one of the industries or in any particular part of the world we serve. For events that may occur and adversely impact ourbusiness, financial condition, results of operations and cash flows, refer to "Item 1A. Risk Factors" of this Annual Report on Form 10-Kfor the year ended December 31, 2011 ("Annual Report"). For information on our sales and long-lived assets by geographic areas, seeNote 17 to our consolidated financial statements included in "Item 8. Financial Statements and Supplementary Data" ("Item 8") of thisAnnual Report.
As previously disclosed in our 2010 Annual Report on Form 10-K, we reorganized our divisional operations by combining theformer Flowserve Pump Division ("FPD") and former Flow Solutions Division ("FSD") into the Flow Solutions Group ("FSG"), effectiveJanuary 1, 2010. FSG was divided into two reportable segments: FSG Engineered Product Division and FSG Industrial Product Division.Flow Control Division was not affected. We have retrospectively adjusted prior period financial information to reflect our currentreporting structure.
We conduct our operations through three business segments based on type of product and how we manage the business:
Copyright © 2013 www.secdatabase.com. All Rights Reserved.Please Consider the Environment Before Printing This Document
• FSG Engineered Product Division ("EPD") for long lead-time, custom and other highly-engineered pumps and pump systems,mechanical seals, auxiliary systems and replacement parts and related services;
1
Copyright © 2013 www.secdatabase.com. All Rights Reserved.Please Consider the Environment Before Printing This Document
Table of Contents
• FSG Industrial Product Division ("IPD") for pre-configured engineered pumps and pump systems and related products andservices; and
• Flow Control Division ("FCD") for engineered and industrial valves, control valves, actuators and controls and related services.
Our business segments share a focus on industrial flow control technology and have a high number of common customers. Thesesegments also have complementary product offerings and technologies that are often combined in applications which provide us a netcompetitive advantage. Our segments also benefit from our global footprint and our economies of scale in reducing administrative andoverhead costs to serve customers more cost effectively.
Strategies
Our overarching objective is to grow our position as a product and integrated solutions provider in the flow control industry. Thisobjective includes continuing to sell products by building on existing sales relationships and leveraging the power of our portfolio ofproducts and services. It also includes delivering specific end user solutions that help customers attain their business goals by ensuringmaximum reliability at a decreased cost of ownership. We seek to drive increasing enterprise value by using strategies that are wellcommunicated throughout the company. These strategies include: disciplined profitable growth, customer intimacy, innovation andportfolio management, strategic localization, operational excellence, employee focus and sustainable business model. The key elementsof these strategies are outlined below.
Disciplined Profitable Growth
Disciplined profitable growth is an important strategy focused on growing revenues profitably from our existing portfolio ofproducts and services, as well as through the development or acquisition of new customer-driven products and services. An overarchinggoal is to focus on opportunities that can maximize the organic growth from existing customers and to evaluate potential new customer-partnering initiatives that maximize the capture of the product’s total life cycle. We believe we are the largest major pump, valve and sealcompany that can offer customers a differentiated option of flow management products and services across a broad portfolio, as well asoffer additional options that include any combination of products and solution support packages.
We also seek to continue to review our substantial installed pump, valve and seal base as a means to expand the aftermarketparts and services business, as customers are increasingly using third-party aftermarket parts and service providers to reduce their fixedcosts and improve profitability. To date, the aftermarket business has provided us with a steady source of revenues and cash flows athigher margins than original equipment sales. Aftermarket sales in 2011 represented approximately 41% of total sales, as comparedwith approximately 39% of total sales for the same period in 2010. We are building on our established presence through an extensiveglobal QRC network to provide the immediate parts, service and technical support required to effectively manage and win the aftermarketbusiness created from our installed base.
Customer Intimacy
Customer intimacy defines our approach to being prepared to serve the needs of our current and future customers better than ourcompetition. Through our ongoing relationships with our customers, we seek to gain a rich understanding of their business objectives andhow our portfolio of offerings can help them succeed. We collaborate with our customers on the front end engineering and design workto drive flow management solutions that effectively generate the desired business outcomes. As we progress through original equipmentprojects, we work closely with our customers to understand and prepare for the long-term support needs for the operations with the intentof maximizing total life cycle value for our customers’ investments.
We seek to capture additional aftermarket business by creating mutually beneficial opportunities for us and our customers throughsourcing and maintenance alliance programs where we provide all or an agreed-upon portion of customers’ parts and servicing needs.These customer alliances enable us to develop long-term professional relationships with our customers and serve as an effective platformfor introducing new products and services to our customers and generating additional sales.
Innovation and Portfolio Management
The ongoing management of our portfolio of products and services is critical to our success. As part of managing our portfolio, wecontinue to rationalize our portfolio of products and services to ensure alignment with changing market requirements. We also continue toinvest in research and development ("R&D") to expand the scope of our product offerings and our deployment of advanced technologies.The infusion of advanced technologies into new products and services continues to play a critical role in the ongoing evolution of ourproduct portfolio. Our objective is to improve the percentage of revenue derived from new products as a function of overall sales, utilizingtechnological innovation to improve overall product life cycle and total cost of ownership for our customers.
Copyright © 2013 www.secdatabase.com. All Rights Reserved.Please Consider the Environment Before Printing This Document

2
Copyright © 2013 www.secdatabase.com. All Rights Reserved.Please Consider the Environment Before Printing This Document

Table of Contents
We employ a robust portfolio management and project execution process to seek out new product and technology opportunities,evaluate their potential return on investment and allocate resources to their development on a prioritized basis. Each project is reviewedon a routine basis for such performance measures as time to market, net present value, budget adherence, technical and commercial riskand compliance with customer requirements. Technical skill sets and knowledge are deployed across business unit boundaries to ensurethat we bring the best capabilities to bear for each project. Collectively, the R&D portfolio is a key to our ability to differentiate ourproduct and service offerings from other competitors in our target markets.
We are focused on exploring and commercializing new technologies. In many of our research areas, we are teaming withuniversities and experts in the appropriate scientific fields to accelerate the required learning and to shorten the development time inleveraging the value of applied technologies in our products and services. Our intent is to be a market leader in the application of advancedtechnology to improve product performance and return on investment for our customers.
Predictive diagnostics and asset management continue to be the biggest areas of effort for us across all our divisions. Buildingon the strength of our ValveSight and Technology Enabled Asset Management solutions introduced in late 2008, we have continued todeploy our diagnostics capabilities into more devices and expand on the number of host control systems and third party solutions withwhich we can achieve interoperability. These capabilities continue to provide a key source of competitive advantage in the market placeand are saving our customers time and money in keeping their operations running.
We continually evaluate acquisitions, joint ventures and other strategic investment opportunities to broaden our product portfolio,service capabilities, geographic presence and operational capabilities to meet the growing needs of our customers. We evaluate allinvestment opportunities through a decision filtering process to ensure a good strategic, financial and cultural fit.
In 2011, our acquisition activities focused on adjacent technology and product capabilities. Effective October 28, 2011, we acquiredfor inclusion in EPD, 100% of Lawrence Pumps, Inc. ("LPI"), a privately-owned, United States ("U.S.") based pump manufacturer, ina share purchase for cash of $89.6 million. LPI specializes in the design, development and manufacture of engineered centrifugal slurrypumps for critical services within the petroleum refining, petrochemical, pulp and paper and energy markets. In addition, in a separateand unrelated transaction, we acquired wireless technology solutions to allow us to offer an efficient and economical means of monitoringequipment and processes in tough industrial environments such as oil and gas, chemical, power generation and related industries, whichwill further enhance our product capabilities.
Strategic Localization
Strategic localization describes our global growth strategy. We recognize that as a multi-national company it will take more than afew years to become truly global. Therefore, our strategy focuses on advancing our presence appropriately in geographies deemed to becritical to our future success as a company. This business strategy focuses on the following areas:
• expanding our global presence to capture business in developing geographic market areas;
• utilizing low-cost sourcing opportunities to remain competitive in the global economy; and
• attracting and retaining the global intellectual capital required to support our growth plans in new geographical areas.
We believe there are attractive opportunities in international markets, particularly in China, India, the Middle East, Russia, Africaand Latin America, and we intend to continue to utilize our global presence and strategically invest to further penetrate these markets.In the aftermarket services business, we seek to strategically add QRC sites in order to provide rapid response, fast delivery and fieldrepair on a global scale for our customers. In 2011, we added six QRCs, expanding our ability to effectively deliver aftermarket supportglobally.
We believe that future success will be supported by investments made to establish indigenous operations to effectively serve thelocal market while taking advantage of low-cost manufacturing, competent engineering and strategic sourcing where practical. We believethat this positions us well to support our global customers from project conception through commissioning and throughout the life of theiroperations.
We continue to develop and increase our manufacturing, engineering and sourcing functions in lower-cost regions and emergingmarkets such as India, China, Mexico, Latin America, the Middle East and Eastern Europe as we drive higher value-add from our supplybase of materials and components and satisfy local content requirements. In 2011, these lower-cost regions supplied our divisions withdirect materials ranging from 17% to 40% of divisional spending.
Operational Excellence
The operational excellence strategy encapsulates ongoing programs that work to drive increased customer fulfillment and yieldinternal productivity. This initiative includes:
Copyright © 2013 www.secdatabase.com. All Rights Reserved.Please Consider the Environment Before Printing This Document

• driving improved customer fulfillment through metrics such as on-time delivery, cost reduction, quality, cycle time reductionand warranty cost reduction as a percentage of sales;
3
Copyright © 2013 www.secdatabase.com. All Rights Reserved.Please Consider the Environment Before Printing This Document
Table of Contents
• continuing to develop a culture of continuous improvement that delivers maximum productivity and cost efficiencies; and
• implementing global functional competencies to drive standardized processes.
We seek to increase our operational efficiency through our Continuous Improvement Process ("CIP") initiative, which utilizes toolssuch as value analysis, value engineering, six sigma methodology, lean manufacturing and capacity management to improve qualityand processes, reduce product cycle times and lower costs. Recognizing that employees are our most valuable resource in achievingoperational excellence goals, we have instituted CIP training tailored to maximize the impact on our business. To date, approximately1,600 active employees are CIP-trained or certified as "Green Belts," "Black Belts" or "Master Black Belts," and are deployed on CIPprojects throughout our company in operations, as well as in the front office of the business. As a result of the CIP initiative, wehave developed and implemented processes to reduce our engineering and manufacturing process cycle time, improve on-time deliveryand service response time, optimize inventory levels and reduce costs. We have also experienced success in sharing and applying bestpractices achieved in one business segment and deploying those ideas to other segments of the business.
We continue to rationalize existing Enterprise Resource Planning ("ERP") systems onto six strategic ERP systems. Going forward,these six strategic ERP systems will be maintained as core systems with standard tool sets, and will be enhanced as needed to meet thegrowing needs of the business in areas such as e-commerce, back office optimization and export compliance. Further investment in non-strategic ERP systems will be limited to compliance matters and conversion to strategic ERP systems.
We also seek to improve our working capital utilization, with a particular focus on management of accounts receivable andinventory. See further discussion in the "Liquidity and Capital Resources" section of "Item 7. Management’s Discussion and Analysis ofFinancial Condition and Results of Operations" of this Annual Report.
Employee Focus
We focus on several elements in our strategic efforts to continuously enhance our organizational capability, including:
• institutionalizing our succession planning along with our leadership competencies and performance management capabilities,with a focus on key positions and critical talent pools;
• utilizing these capabilities to drive employee engagement through our training initiatives and leadership development programsand facilitate our cross-divisional and functional development assignments;
• developing talent acquisition programs such as our engineering recruitment program to address critical talent needs to supportour emerging markets and global growth;
• capturing the intellectual capital in the current workforce, disseminating it throughout our company and sharing it withcustomers as a competitive advantage;
• creating a total compensation program that provides our associates with equitable opportunities that are competitive and linkedto business and individual performance while promoting employee behavior consistent with our code of business conduct andrisk tolerance; and
• building a diverse and globally inclusive organization with a strong ethical and compliance culture based on transparency andtrust.
We continue to focus on training through the distribution of electronic learning packages in multiple languages for our Code ofBusiness Conduct, workplace harassment, facility safety, anti-bribery, export compliance and other regulatory and compliance programs.We continue to drive our training and leadership development programs through the deployment of general management development,manager competencies and a series of multi-lingual "course-in-a-box" programs that focus on enhancing people management skills.
Sustainable Business Model
The sustainable business model initiative is focused on all of the areas that have the potential of adversely affecting our reputation,limiting our financial flexibility or creating unnecessary risk for any of our stakeholders. We proactively administer an enterprise riskmanagement program with regular reviews of high-level matters with our Board of Directors. We work with our capital sourcing partnersto ensure that our credit facilities and terms are appropriately aligned with our business strategy. We also train our associates on andmonitor matters of a legal or ethical nature to support understanding and compliance on a global basis.
4
Copyright © 2013 www.secdatabase.com. All Rights Reserved.Please Consider the Environment Before Printing This Document
Table of Contents
Competition
Despite consolidation activities in past years, the markets for our products remain highly competitive, with primary competitivedrivers being price, reputation, timeliness of delivery, quality, proximity to service centers and technical expertise, as well as contractualterms and previous installation history. In the pursuit of large capital projects, competitive drivers and competition vary depending onthe industry and products involved. Industries experiencing slow growth generally tend to have a competitive environment more heavilyinfluenced by price due to supply outweighing demand, and price competition tends to be more significant for original equipment ordersthan aftermarket services. Considering the domestic and global economic environments in 2011 and current forecasts for 2012, pricingwas and may continue to be a particularly influential competitive factor. The unique competitive environments in each of our threebusiness segments are discussed in more detail under the “Business Segments” heading below.
In the aftermarket portion of our business, we compete against large and well-established national and global competitors and,in some markets, against regional and local companies who produce low-cost replications of spare parts. In the oil and gas industry,the primary competitors for aftermarket services tend to be customers’ own in-house capabilities. In the nuclear power generationindustry, we possess certain competitive advantages due to our "N Stamp" certification, which is a prerequisite to serve customers in thatindustry, and our considerable base of proprietary knowledge. In other industries, the competitors for aftermarket services tend to be localindependent repair shops and low-cost replicators. Aftermarket competition for standardized products is aggressive due to the existenceof common standards allowing for easier replacement or repair of the installed products.
In the sale of aftermarket products and services, we benefit from our large installed base of pumps, valves and seals, whichcontinually require maintenance, repair and replacement parts due to the nature of the products and the conditions under which theyoperate. Timeliness of delivery, quality and the proximity of service centers are important customer considerations when selecting aprovider for aftermarket products and services. In geographic regions where we are locally positioned to provide a quick response,customers have traditionally relied on us, rather than our competitors, for aftermarket products relating to our highly engineered andcustomized products, although we are seeing increased competition in this area.
Generally, our customers attempt to reduce the number of vendors from which they purchase, thereby reducing the size anddiversity of their inventory. Although vendor reduction programs could adversely affect our business, we have been successful inestablishing long-term supply agreements with a number of customers. While the majority of these agreements do not provide us withexclusive rights, they can provide us a "preferred" status with our customers and thereby increase opportunities to win future business.We also utilize our LifeCycle Advantage program to establish fee-based contracts to manage customers’ aftermarket requirements. Theseprograms provide an opportunity to manage the customer’s installed base and expand the business relationship with the customer.
Our ability to use our portfolio of products, solutions and services to meet customer needs is a competitive strength. Our marketapproach is to create value for our customers throughout the life cycle of their investments in flow control management. We continueto explore and develop potential new offerings in conjunction with our customers. In the early phases of project design, we endeavor tocreate value in optimizing the selection of equipment for the customer’s specific application, as we are capable of providing technicalexpertise on product and system capabilities even outside the scope of our specific products, solutions and services. After the equipmentis constructed and delivered to the customer’s site, we continue to create value through our aftermarket capabilities by optimizing theperformance of the equipment over its operational life. Our skilled service personnel can provide these aftermarket services for ourproducts, as well as many competitors’ products, within the installed base. This value is further enhanced by the global reach of ourQRCs and, when combined with our other solutions for our customers’ flow control management needs, allows us to create value for ourcustomers during all phases of the capital expenditure cycle.
New Product Development
We spent $35.0 million, $29.5 million and $29.4 million during 2011, 2010 and 2009, respectively, on R&D initiatives. Our R&Dgroup consists of engineers involved in new product development and improvement of existing products. Additionally, we sponsorconsortium programs for research with various universities and jointly conduct limited development work with certain vendors, licenseesand customers. We believe current expenditures are adequate to sustain our ongoing and necessary future R&D activities. In addition, wework closely with our customers on customer-sponsored research activities to help execute their R&D initiatives in connection with ourproducts and services. New product development in each of our three business segments is discussed in more detail under the "BusinessSegments" heading below.
Customers
We sell to a wide variety of customers globally including leading engineering, procurement and construction firms, originalequipment manufacturers, distributors and end users in several distinct industries: oil and gas; chemical; power generation; watermanagement; and a number of other industries that are collectively referred to as "general industries." No individual customer
Copyright © 2013 www.secdatabase.com. All Rights Reserved.Please Consider the Environment Before Printing This Document

5
Copyright © 2013 www.secdatabase.com. All Rights Reserved.Please Consider the Environment Before Printing This Document

Table of Contents
accounted for more than 10% of our consolidated 2011 revenues. Customer information relating to each of our three business segmentsis discussed in more detail under the "Business Segments" heading below.
We are not normally required to carry unusually high amounts of inventory to meet customer delivery requirements, although higherbacklog levels and longer lead times generally require higher amounts of inventory. We receive advance cash payments from customerson longer lead time projects to help offset our investment in inventory. We have initiated programs targeted at improving our operationaleffectiveness to reduce our overall working capital needs. While we do provide cancellation policies through our contractual relationships,we generally do not provide rights of product return for our customers.
Selling and Distribution
We primarily distribute our products through direct sales by employees assigned to specific regions, industries or products. Inaddition, we use distributors and sales representatives to supplement our direct sales force in countries where it is more appropriate due tobusiness practices or customs, or whenever the use of direct sales staff is not economically efficient. We generate a majority of our salesleads through existing relationships with vendors, customers and prospects or through referrals.
Intellectual Property
We own a number of trademarks and patents relating to the names and designs of our products. We consider our trademarks andpatents to be valuable assets of our business. In addition, our pool of proprietary information, consisting of know-how and trade secretsrelated to the design, manufacture and operation of our products, is considered particularly valuable. Accordingly, we take proactivemeasures to protect such proprietary information. We generally own the rights to the products that we manufacture and sell and areunencumbered by licensing or franchise agreements. Our trademarks can typically be renewed indefinitely as long as they remain in use,whereas our existing patents generally expire 20 years from the dates they were filed, which has occurred at various times in the past.We do not believe that the expiration of any individual patent will have a material adverse impact on our business, financial condition orresult of operations.
Raw Materials
The principal raw materials used in manufacturing our products are readily available and include ferrous and non-ferrous metalsin the form of bar stock, machined castings, fasteners, forgings and motors, as well as silicon, carbon faces, gaskets and fluoropolymercomponents. A substantial volume of our raw materials are purchased from outside sources, and we have been able to develop a robustsupply chain and anticipate no significant shortages of such materials in the future. We continually monitor the business conditions ofour suppliers to manage competitive market conditions and to avoid potential supply disruptions. We continue to expand global sourcingto capitalize on localization in emerging markets and low-cost sources of purchased goods balanced with efficient consolidated andcompliant logistics.
We are a vertically-integrated manufacturer of certain pump and valve products. Certain corrosion-resistant castings for our pumpsand valves are manufactured at our foundries. Other metal castings are either manufactured at our foundries or purchased from qualifiedand approved foundry sources.
Concerning the products we supply to customers in the nuclear power generation industry, suppliers of raw materials for nuclearpower generation markets must be qualified to meet the requirements of nuclear industry standards and governmental regulations. Supplychannels for these materials are currently adequate, and we do not anticipate difficulty in obtaining such materials in the future.
Employees and Labor Relations
We have approximately 16,000 employees globally. In the U.S., a portion of the hourly employees at our pump manufacturingplant located in Vernon, California, our pump service center located in Cleveland, Ohio, our valve manufacturing plant located inLynchburg, Virginia and our foundry located in Dayton, Ohio, are represented by unions. Additionally, some employees at select facilitiesin the following countries are unionized or have employee works councils: Argentina, Australia, Austria, Brazil, Canada, Finland,France, Germany, Italy, Japan, Mexico, The Netherlands, Poland, Spain, Sweden and the United Kingdom. We believe relations with ouremployees throughout our operations are generally satisfactory, including those employees represented by unions and employee workscouncils. No unionized facility accounts for more than 10% of our revenues.
Environmental Regulations and Proceedings
We are subject to environmental laws and regulations in all jurisdictions in which we have operating facilities. These requirementsprimarily relate to the generation and disposal of waste, air emissions and waste water discharges. We periodically make capital
Copyright © 2013 www.secdatabase.com. All Rights Reserved.Please Consider the Environment Before Printing This Document

expenditures to enhance our compliance with environmental requirements, as well as to abate and control pollution. At present, we haveno plans for any material capital expenditures for environmental control equipment at any of our facilities.
6
Copyright © 2013 www.secdatabase.com. All Rights Reserved.Please Consider the Environment Before Printing This Document
Table of Contents
However, we have incurred and continue to incur operating costs relating to ongoing environmental compliance matters. Based onexisting and proposed environmental requirements and our anticipated production schedule, we believe that future environmentalcompliance expenditures will not have a material adverse effect on our financial condition, results of operations or cash flows.
We use hazardous substances and generate hazardous wastes in many of our manufacturing and foundry operations. Most of ourcurrent and former properties are or have been used for industrial purposes and some may require clean-up of historical contamination.During the due diligence phase of our acquisitions, we conduct environmental site assessments to identify potential environmentalliabilities and required clean-up measures. We are currently conducting follow-up investigation and/or remediation activities at thoselocations where we have known environmental concerns. We have cleaned up a majority of the sites with known historical contaminationand are addressing the remaining identified issues.
Over the years, we have been involved as one of many potentially responsible parties ("PRP") at former public waste disposal sitesthat are or were subject to investigation and remediation. We are currently involved as a PRP at seven Superfund sites. The sites are invarious stages of evaluation by government authorities. Our total projected "fair share" cost allocation at these seven sites is expected tobe immaterial. See "Item 3. Legal Proceedings" included in this Annual Report for more information.
We have established reserves that we currently believe to be adequate to cover our currently identified on-site and off-siteenvironmental liabilities.
Exports
Our export sales from the U.S. to foreign unaffiliated customers were $365.8 million in 2011, $300.3 million in 2010 and$339.6 million in 2009.
Licenses are required from U.S. and other government agencies to export certain products. In particular, products with nuclearpower generation and/or military applications are restricted, as are certain other pump, valve and seal products.
We voluntarily self-disclosed to applicable U.S. governmental authorities the results of an audit of our compliance with U.S. exportcontrol laws and, in September 2011, entered into settlement agreements with U.S. governmental authorities that resolved in full allmatters contained in our voluntary self-disclosures. See "Item 3. Legal Proceedings" included in this Annual Report for more information.
BUSINESS SEGMENTS
In addition to the business segment information presented below, Note 17 to our consolidated financial statements in Item 8 of thisAnnual Report contains additional financial information about our business segments and geographic areas in which we have conductedbusiness in 2011, 2010 and 2009.
FSG ENGINEERED PRODUCT DIVISION
Our largest business segment is EPD, through which we design, manufacture, distribute and service engineered pumps and pumpsystems, mechanical seals, auxiliary systems, replacement parts and related equipment. The business primarily consists of long lead-time,highly engineered, custom configured products, which require extensive test requirements and superior project management skills. EPDproducts and services are primarily used by companies that operate in the oil and gas, power generation, chemical, water managementand general industries. We market our pump and mechanical seal products through our worldwide sales force and our regional service andrepair centers or through independent distributors and sales representatives. A portion of our mechanical seal products are sold directlyto original equipment manufacturers for incorporation into rotating equipment requiring mechanical seals.
Our pump products are manufactured in a wide range of metal alloys and with a variety of configurations to meet the criticaloperating demands of our customers. Mechanical seals are critical to the reliable operation of rotating equipment in that they preventleakage and emissions of hazardous substances from the rotating equipment and reduce shaft wear on the equipment caused by the useof non-mechanical seals. We also manufacture a gas-lubricated mechanical seal that is used in high-speed compressors for gas pipelinesand in the oil and gas production and process markets. Our products are currently manufactured at 28 plants worldwide, nine of whichare located in Europe, 11 in North America, four in Asia Pacific and four in Latin America.
We also conduct business through strategic foreign joint ventures. We have six unconsolidated joint ventures that are locatedin China, India, Japan, Saudi Arabia, South Korea and the United Arab Emirates, where a portion of our products are manufactured,assembled or serviced in these territories. These relationships provide numerous strategic opportunities, including increased access toour current and new markets, access to additional manufacturing capacity and expansion of our operational platform to support low-costsourcing initiatives and capacity demands for other markets.
Copyright © 2013 www.secdatabase.com. All Rights Reserved.Please Consider the Environment Before Printing This Document

7
Copyright © 2013 www.secdatabase.com. All Rights Reserved.Please Consider the Environment Before Printing This Document
Table of Contents
EPD Products
We manufacture more than 40 different active types of pumps and approximately 185 different models of mechanical seals andsealing systems. The following is a summary list of our EPD products and globally recognized brands:
EPD Product Types
Between Bearings Pumps Overhung Pumps
• Single Case — Axially Split • API Process• Single Case — Radially Split• Double Case
Positive Displacement Pumps Mechanical Seals and Seal Support Systems
• Multiphase • Gas Barrier Seals• Reciprocating • Dry-Running Seals• Screw
Specialty Products
• Nuclear Pumps • Power Recovery — DWEER• Nuclear Seals • Power Recovery — Hydroturbine• Cryogenic Pumps • Energy Recovery Devices• Cryogenic Liquid Expander • CVP Concrete Volute Pumps• Hydraulic Decoking Systems • Wireless Transmitters• API Slurry Pumps
EPD Brand Names
• BW Seals • Lawrence• Byron Jackson • LifeCycle Advantage• Calder Energy Recovery Devices • Niigata Worthington• Cameron • QRC™
• Durametallic • Pacific• FEDD Wireless • Pacific Weits• Five Star Seal • Pac-Seal• Flowserve • ReadySeal• Flowstar • United Centrifugal• GASPAC™ • Western Land Roller• IDP • Wilson-Snyder• Interseal • Worthington• Jeumont-Schneider • Worthington-Simpson
EPD Services
We provide engineered aftermarket services through our global network of 120 QRCs, some of which are co-located inmanufacturing facilities, in 41 countries. Our EPD service personnel provide a comprehensive set of equipment services for flowmanagement control systems, including installation, commissioning, repair, advanced diagnostics, re-rate and retrofit programs,machining and comprehensive asset management solutions. We provide asset management services and condition monitoring for rotatingequipment through special contracts with many of our customers that reduce maintenance costs. A large portion of EPD’s service workis performed on a quick response basis, and we offer 24-hour service in all of our major markets.
EPD New Product Development
Copyright © 2013 www.secdatabase.com. All Rights Reserved.Please Consider the Environment Before Printing This Document
Our investments in new product R&D continue to focus on increasing the capability of our products as customer applicationsbecome more advanced, demanding greater levels of production (i.e., flow, power and pressure) and under more extreme conditionsbeyond the level of traditional technology. We continue to develop innovations that improve product performance and our competitiveposition in the engineered equipment industry, specifically targeting pipeline, off-shore and downstream applications for the oil and gasmarket. The emergence of extreme pressure applications prompted the development of an advanced stage
8
Copyright © 2013 www.secdatabase.com. All Rights Reserved.Please Consider the Environment Before Printing This Document
Table of Contents
design and construction of high pressure test capability necessary to validate the technology prior to introduction into the market.Successful completion of the multiphase testing, as part of the subsea product development, validated our design predictions andestablished the baseline for future advances in subsea and land-based designs of this product.
As new sources of energy generation are explored, we have been developing new product designs to support the most criticalapplications in the power generation market. New designs and qualification test programs continue to support the critical services foundin the modern nuclear power generation plant. In addition to nuclear pump product development, we have focused development efforts onan advanced seal design required to accommodate upset conditions recently identified by the nuclear industry. As Calder AG ("Calder")is now integrated into the product family, investment in work exchanger technology has led to development of advanced analyticalmethods for predicting performance and application on a new rotating valve design. This advanced technology is expected to improveour competitive position in the reverse osmosis water plant energy recovery application. Continued engagement with our end users isexemplified through completion of advancements in coke cutting technology, nozzle design and auxiliary equipment improvements, aswell as creation of an automated cutting system to improve operator safety.
We continue to address our core products with design enhancements to improve performance and the speed at which we can deliverour products. Application of advanced computational fluid dynamics methods utilizing unsteady flow analysis led to the development ofan advanced inlet chamber and impeller vane design for high energy injection water pumps. Our engineering teams continue to apply anddevelop sophisticated design technology and methods supporting continuous improvement of our proven technology.
In 2011, EPD continued to advance our Technology Advantage platform through the Integrated Solutions Organization ("ISO").This platform utilizes a combination of our developed technologies and leading edge technology partners to increase our assetmanagement and service capabilities for our end user customers. These technologies include intelligent devices, advanced communicationand security protocols, wireless and satellite communications and web-enabled data convergence.
None of these newly developed products or services required the investment of a material amount of our assets or was otherwisematerial.
EPD Customers
Our customer mix is diversified and includes leading engineering, procurement and construction firms, original equipmentmanufacturers, distributors and end users. Our sales mix of original equipment products and aftermarket products and services diversifiesour business and somewhat mitigates the impact of normal economic cycles on our business. Our sales are diversified among severalindustries, including oil and gas, power generation, chemical, water management and general industries.
EPD Competition
The pump and mechanical seal industry is highly fragmented, with hundreds of competitors. We compete, however, primarily witha limited number of large companies operating on a global scale. Competition among our closest competitors is generally driven bydelivery times, expertise, price, breadth of product offerings, contractual terms, previous installation history and reputation for quality.Some of our largest industry competitors include: Sulzer Pumps; Ebara Corp.; SPX Corp.; Eagle Burgmann, which is a joint venture oftwo traditional global seal manufacturers, A. W. Chesterton Co. and AES Corp.; John Crane Inc., a unit of Smiths Group Plc; and WeirGroup Plc.
The pump and mechanical seal industry continues to undergo considerable consolidation, which is primarily driven by (i) the needto lower costs through reduction of excess capacity and (ii) customers’ preference to align with global full service suppliers to simplifytheir supplier base. Despite the consolidation activity, the market remains highly competitive.
We believe that our strongest sources of competitive advantage rest with our extensive range of pumps for the oil and gas, chemicaland power generation industries, our large installed base, our strong customer relationships, our more than 200 years of legacy experiencein manufacturing and servicing pumping equipment, our reputation for providing quality engineering solutions and our ability to deliverengineered new seal product orders within 72 hours from the customer’s request through design, engineering, manufacturing, testing anddelivery.
EPD Backlog
EPD’s backlog of orders as of December 31, 2011 was $1.4 billion (including $19.9 million of interdivision backlog, which iseliminated and not included in consolidated backlog), compared with $1.4 billion (including $25.5 million of interdivision backlog) as ofDecember 31, 2010. We expect to ship 85% of December 31, 2011 backlog during 2012.
9
Copyright © 2013 www.secdatabase.com. All Rights Reserved.Please Consider the Environment Before Printing This Document
Table of Contents
FSG INDUSTRIAL PRODUCT DIVISION
Through IPD we design, manufacture, distribute and service pre-configured engineered pumps and pump systems, includingsubmersible motors, for industrial markets. Our globalized operating platform, low-cost sourcing and continuous improvement initiativesare essential aspects of this business. IPD’s standardized, general purpose pump products are primarily utilized by the oil and gas,chemical, water management, power generation and general industries. Our products are currently manufactured in 12 manufacturingfacilities, three of which are located in the U.S. and six in Europe. IPD operates 21 QRCs worldwide, including 11 sites in Europe andfour in the U.S., including those co-located in manufacturing facilities.
IPD Products
We manufacture approximately 40 different active types of pumps available in a wide range of metal alloys and non-metallics witha variety of configurations to meet the critical operating demands of our customers. The following is a summary list of our IPD productsand globally recognized brands:
IPD Pump Product Types
Overhung Between Bearings
• Chemical Process ANSI and ISO • Single Case — Axially Split• Industrial Process • Single Case — Radially Split• Slurry and Solids Handling
Specialty Products Vertical
• Molten Salt VTP Pump • Wet Pit• Submersible Pump • Deep Well Submersible Motor• Thruster • Slurry and Solids Handling• Geothermal Deepwell • Sump• Barge Pump
Positive Displacement
• Gear
IPD Brand Names
• Aldrich • Sier Bath• Durco • TKL• IDP • Western Land Roller• Pacific • Worthington• Pleuger • Worthington-Simpson• Scienco
IPD Services
We market our pump products through our worldwide sales force and our regional service and repair centers or through independentdistributors and sales representatives. We provide an array of aftermarket services including product installation and commissioningservices, spare parts, repairs, re-rate and upgrade solutions, advanced diagnostics and maintenance solutions through our global networkof QRCs.
IPD New Product Development
Our IPD development projects target product feature enhancements, design improvements and sourcing opportunities that willimprove the competitive position of our industrial pump product lines. A new product for the International Standards Organization (ISO)market is being developed for release in 2012 and is positioned to be a globally-accepted product supporting the chemical industry.
Copyright © 2013 www.secdatabase.com. All Rights Reserved.Please Consider the Environment Before Printing This Document

Investment in a modern multistage ring section design progressed through the year with advanced construction and prototype testing. Thenew design is expected to streamline our product portfolio.
10
Copyright © 2013 www.secdatabase.com. All Rights Reserved.Please Consider the Environment Before Printing This Document
Table of Contents
We continue to address our core products with design enhancements to improve performance and the speed at which we can deliver ourproducts. Successful testing of permanent magnet motor technology in our submersible motor products demonstrated improved productefficiency. In addition, canned motor technology utilizing a permanent magnet motor was demonstrated in our test facility. Cost reductionprojects incorporating product rationalization, value engineering, lean manufacturing and overhead reduction continue to be key driversfor IPD.
None of these newly developed products or services required the investment of a material amount of our assets or was otherwisematerial.
IPD Customers
Our customer mix is diversified and includes leading engineering, procurement and construction firms, original equipmentmanufacturers, distributors and end users. Our sales mix of original equipment products and aftermarket products and services diversifiesour business and helps mitigate the impact of normal economic cycles on our business. Our sales are diversified among several industries,including oil and gas, water management, chemical, power generation and general industries.
IPD Competition
The industrial pump industry is highly fragmented, with many competitors. We compete, however, primarily with a limited numberof large companies operating on a global scale. Competition among our closest competitors is generally driven by delivery times,expertise, price, breadth of product offerings, contractual terms, previous installation history and reputation for quality. Some of ourlargest industry competitors include ITT Industries, KSB Inc. and Sulzer Pumps.
We believe that our strongest sources of competitive advantage rest with our extensive range of pumps for the chemical industry,our large installed base, our strong customer relationships, our more than 200 years of legacy experience in manufacturing and servicingpumping equipment and our reputation for providing quality engineering solutions.
IPD Backlog
IPD’s backlog of orders as of December 31, 2011 was $567.8 million (including $56.7 million of interdivision backlog, which iseliminated and not included in consolidated backlog), compared with $568.0 million (including $38.5 million of interdivision backlog)as of December 31, 2010. We expect to ship 89% of December 31, 2011 backlog during 2012.
FLOW CONTROL DIVISION
FCD designs, manufactures, distributes and services a broad portfolio of industrial valve and automation solutions, includingisolation and control valves, actuation, controls and related equipment. In addition, FCD offers energy management products such assteam traps, boiler controls and condensate and energy recovery systems. FCD leverages its experience and application know-how byoffering a complete menu of engineering and project management services to complement its expansive product portfolio. FCD productsare used to control, direct and manage the flow of liquids and gases and are an integral part of any flow control system. Our valve productsare most often customized and engineered to perform specific functions within each customer’s unique flow control environment.
Our flow control products are primarily used by companies operating in the chemical (including pharmaceutical), power generation(nuclear, fossil and renewable), oil and gas, water management and general industries, including aerospace, pulp and paper and mining.FCD has 55 sites worldwide, including 25 principal manufacturing facilities (five of which are located in the U.S. and 14 of which arelocated in Europe) and 30 QRCs, including three consolidated joint ventures. A small portion of our valves are also produced through anunconsolidated foreign joint venture in India.
FCD Products
Our valve, automation and controls product and solutions portfolio represents one of the most comprehensive in the flow controlindustry. Our products are used in a wide variety of applications, from general service to the most severe and demanding services,including those involving high levels of corrosion, extreme temperatures and/or pressures, zero fugitive emissions and emergencyshutdown.
Our “smart” valve and diagnostic technologies integrate sensors, microprocessor controls and software into high performanceintegrated control valves, digital positioners and switchboxes for automated on/off valve assemblies and electric actuators. Thesetechnologies permit real-time system analysis, system warnings and remote indication of asset health. These technologies have beendeveloped in response to the growing demand for reduced maintenance, improved process control efficiency and digital communications
Copyright © 2013 www.secdatabase.com. All Rights Reserved.Please Consider the Environment Before Printing This Document

at the plant level. We are committed to further enhancing the quality of our product portfolio by continuing to upgrade our existingofferings with cutting-edge technologies.
11
Copyright © 2013 www.secdatabase.com. All Rights Reserved.Please Consider the Environment Before Printing This Document
Table of Contents
Our valve automation products encompass a broad range of pneumatic, electric, hydraulic and stored energy actuation designs totake advantage of whatever power source the customer has available. FCD’s actuation products can even utilize the process fluid flowingthrough the pipeline as a source of power to actuate the valve. Our actuation products also cover one of the widest ranges of output torquesin the industry, providing the ability to automate anything from the smallest linear globe valve to the largest multi-turn gate valve. Mostimportantly, FCD combines best-in-class mechanical designs with the latest in digital controls in order to provide complete integratedautomation solutions that optimize the combined valve-actuator-controls package.
The following is a summary list of our generally available valve and automation products and globally recognized brands:
FCD Product Types
• Valve Automation Systems • Digital Positioners• Control Valves • Pneumatic Positioners• Ball Valves • Intelligent Positioners• Gate Valves • Electric/Electronic Actuators• Globe Valves • Pneumatic Actuators• Check Valves • Hydraulic Actuators• Butterfly Valves • Diaphragm Actuators• Lined Plug Valves • Direct Gas and Gas-over-Oil Actuators• Lined Ball Valves • Limit Switches• Lubricated Plug Valves • Steam Traps• Non-Lubricated Plug Valves • Condensate and Energy Recovery Systems• Integrated Valve Controllers • Boiler Controls• Diagnostic Software • Digital Communications• Electro Pneumatic Positioners • Valve and Automation Repair Services
FCD Brand Names
• Accord • NAF• Anchor/Darling • NAVAL• Argus • Noble Alloy• Atomac • Norbro• Automax • Nordstrom• Durco • PMV• Edward • Serck Audco• Flowserve • Schmidt Armaturen• Gestra • Valbart• Kammer • Valtek• Limitorque • Vogt• McCANNA/MARPAC • Worcester Controls
FCD Services
Our service personnel provide comprehensive equipment maintenance services for flow control systems, including advanceddiagnostics, repair, installation, commissioning, retrofit programs and field machining capabilities. A large portion of our service workis performed on a quick response basis, which includes 24-hour service in all of our major markets. We also provide in-house repairand return manufacturing services worldwide through our manufacturing facilities. We believe our ability to offer comprehensive, quickturnaround services provides us with a unique competitive advantage and unparalleled access to our customers’ installed base of flowcontrol products.
FCD New Product Development
Copyright © 2013 www.secdatabase.com. All Rights Reserved.Please Consider the Environment Before Printing This Document
Our R&D investment is focused on areas that will advance our technological leadership and further differentiate our competitiveadvantage from a product perspective. Investment has been focused on significantly enhancing the digital integration and interoperabilityof valve top works (e.g., positioners, actuators, limit switches and associated accessories) with Distributed Control Systems ("DCS"). Wecontinue to pursue the development and deployment of next-generation hardware and software for
12
Copyright © 2013 www.secdatabase.com. All Rights Reserved.Please Consider the Environment Before Printing This Document
Table of Contents
valve diagnostics and the integration of the resulting device intelligence through the DCS to provide a practical and effective assetmanagement capability for the end user. In addition to developing these new capabilities and value-added services, our investments alsoinclude product portfolio expansion and fundamental research in material sciences in order to increase the temperature, pressure andcorrosion/erosion-resistance limits of existing products, as well as noise and cavitation reduction. These investments are made by addingnew resources and talent to the organization, as well as leveraging the experience of EPD and IPD and increasing our collaboration withthird parties. We expect to continue our R&D investments in the areas discussed above.
None of these newly developed valve products or services required the investment of a material amount of our assets or wasotherwise material.
FCD Customers
Our customer mix spans several markets, including the chemical, oil and gas, power generation, water management, pulp and paper,mining and other general industries. Our product mix includes original equipment and aftermarket parts and services. FCD contractswith a variety of customers, ranging from engineering, procurement and construction firms, to distributors, end users and other originalequipment manufacturers.
FCD Competition
While in recent years the valve market has undergone a significant amount of consolidation, the market remains highly fragmented.Some of the largest valve industry competitors include Tyco International Ltd., Cameron International Corp., Emerson Electric Co.,General Electric Co. and Crane Co.
Our market research and assessments indicate that the top 10 global valve manufacturers collectively comprise less than 25% of thetotal valve market. Based on independent industry sources, we believe that we are the fourth largest industrial valve supplier in the world.We believe that our strongest sources of competitive advantage rest with our comprehensive portfolio of valve products and services, ourfocus on execution and our expertise in severe corrosion and erosion applications.
FCD Backlog
FCD’s backlog of orders as of December 31, 2011 was $759.9 million, compared with $658.5 million as of December 31, 2010.We expect to ship 88% of December 31, 2011 backlog during 2012.
AVAILABLE INFORMATION
We maintain an Internet web site at www.flowserve.com. Our Annual Reports on Form 10-K, Quarterly Reports on Form 10-Q,Current Reports on Form 8-K and any amendments to those reports filed or furnished pursuant to Section 13(a) of the Securities ExchangeAct of 1934 are made available free of charge through the “Investor Relations” section of our Internet web site as soon as reasonablypracticable after we electronically file the reports with, or furnish the reports to, the U.S. Securities and Exchange Commission ("SEC").
Also available on our Internet web site are our Corporate Governance Guidelines for our Board of Directors and Code of Ethicsand Business Conduct, as well as the charters of the Audit, Finance, Organization and Compensation and Corporate Governance andNominating Committees of our Board of Directors and other important governance documents. All of the foregoing documents maybe obtained through our Internet web site as noted above and are available in print without charge to shareholders who request them.Information contained on or available through our Internet web site is not incorporated into this Annual Report or any other documentwe file with, or furnish to, the SEC.
ITEM 1A. RISK FACTORS
Any of the events discussed as risk factors below may occur. If they do, our business, financial condition, results of operationsand cash flows could be materially adversely affected. Additional risks and uncertainties not presently known to us, or that we currentlydeem immaterial, may also impair our business operations. Because of these risk factors, as well as other variables affecting our operatingresults, past financial performance may not be a reliable indicator of future performance, and historical trends should not be used toanticipate results or trends in future periods.
Our business depends on the levels of capital investment and maintenance expenditures by our customers, which in turn areaffected by numerous factors, including the state of domestic and global economies, global energy demand, the cyclical nature of theirmarkets, their liquidity and the condition of global credit and capital markets.
Copyright © 2013 www.secdatabase.com. All Rights Reserved.Please Consider the Environment Before Printing This Document

Demand for most of our products and services depends on the level of new capital investment and planned maintenance
13
Copyright © 2013 www.secdatabase.com. All Rights Reserved.Please Consider the Environment Before Printing This Document
Table of Contents
expenditures by our customers. The level of capital expenditures by our customers depends, in turn, on general economic conditions,availability of credit, economic conditions within their respective industries and expectations of future market behavior. Additionally,volatility in commodity prices can negatively affect the level of these activities and can result in postponement of capital spendingdecisions or the delay or cancellation of existing orders. The ability of our customers to finance capital investment and maintenance mayalso be affected by factors independent of the conditions in their industry, such as the condition of global credit and capital markets.
The businesses of many of our customers, particularly oil and gas companies, chemical companies and general industrialcompanies, are to varying degrees cyclical and have experienced periodic downturns. Our customers in these industries, particularly thosewhose demand for our products and services is primarily profit-driven, historically have tended to delay large capital projects, includingexpensive maintenance and upgrades, during economic downturns. For example, our chemical customers generally tend to reduce theirspending on capital investments and operate their facilities at lower levels in a soft economic environment, which reduces demand for ourproducts and services. Additionally, fluctuating energy demand forecasts and lingering uncertainty concerning commodity pricing cancause our customers to be more conservative in their capital planning, which may reduce demand for our products and services. Reduceddemand for our products and services could result in the delay or cancellation of existing orders or lead to excess manufacturing capacity,which unfavorably impacts our absorption of fixed manufacturing costs. This reduced demand may also erode average selling prices inour industry. Any of these results could adversely affect our business, financial condition, results of operations and cash flows.
Additionally, some of our customers may delay capital investment and maintenance even during favorable conditions in theirmarkets. The health of global credit and capital markets and our customers' ability to access such markets can have an impact oninvestment in large capital projects, including necessary maintenance and upgrades, even during favorable market conditions. In addition,the liquidity and financial position of our customers could impact their ability to pay in full and/or on a timely basis. Any of these factors,whether individually or in the aggregate, could have a material adverse effect on our customers and, in turn, our business, financialcondition, results of operations and cash flows.
Volatility in commodity prices, effects from credit and capital market disruptions and a sluggish global economic recovery couldprompt customers to delay or cancel existing orders, which could adversely affect the viability of our backlog and could impede ourability to realize revenues on our backlog.
Our backlog represents the value of uncompleted customer orders. While we cannot be certain that reported backlog will beindicative of future results, our ability to accurately value our backlog can be adversely affected by numerous factors, including the healthof our customers' businesses and their access to capital, volatility in commodity prices (e.g., copper, nickel, stainless steel) and economicuncertainty. While we attempt to mitigate the financial consequences of order delays and cancellations through contractual provisionsand other means, if we were to experience a significant increase in order delays or cancellations that can result from the aforementionedeconomic conditions or other factors beyond our control, it could impede or delay our ability to realize anticipated revenues on ourbacklog. Such a loss of anticipated revenues could have a material adverse effect on our business, financial condition, results of operationsand cash flows.
We may be unable to deliver our sizeable backlog on time, which could affect our revenues, future sales and profitability and ourrelationships with customers.
At December 31, 2011, backlog was $2.7 billion. In 2012, our ability to meet customer delivery schedules for backlog is dependenton a number of factors including, but not limited to, sufficient manufacturing plant capacity, adequate supply channel access to the rawmaterials and other inventory required for production, an adequately trained and capable workforce, project engineering expertise forcertain large projects and appropriate planning and scheduling of manufacturing resources. Many of the contracts we enter into with ourcustomers require long manufacturing lead times and contain penalty clauses related to on-time delivery. Failure to deliver in accordancewith customer expectations could subject us to financial penalties, may result in damage to existing customer relationships and couldhave a material adverse effect on our business, financial condition, results of operations and cash flows.
We sell our products in highly competitive markets, which results in pressure on our profit margins and limits our ability tomaintain or increase the market share of our products.
The markets for our products and services are geographically diverse and highly competitive. We compete against large and well-established national and global companies, as well as regional and local companies, low-cost replicators of spare parts and in-housemaintenance departments of our end user customers. We compete based on price, technical expertise, timeliness of delivery, contractualterms, previous installation history and reputation for quality and reliability. Competitive environments in slow growth industries and fororiginal equipment orders have been inherently more influenced by pricing and domestic and global economic conditions during 2011,and current economic forecasts suggest that the competitive influence of pricing has broadened.
Copyright © 2013 www.secdatabase.com. All Rights Reserved.Please Consider the Environment Before Printing This Document

14
Copyright © 2013 www.secdatabase.com. All Rights Reserved.Please Consider the Environment Before Printing This Document
Table of Contents
Additionally, some of our customers have been attempting to reduce the number of vendors from which they purchase in order toreduce the size and diversity of their inventory. To remain competitive, we must invest in manufacturing, marketing, customer serviceand support and our distribution networks. No assurances can be made that we will have sufficient resources to continue to make theinvestment required to maintain or increase our market share or that our investments will be successful. If we do not compete successfully,our business, financial condition, results of operations and cash flows could be materially adversely affected.
If we are unable to obtain raw materials at favorable prices, our operating margins and results of operations may be adverselyaffected.
We purchase substantially all electric power and other raw materials we use in the manufacturing of our products from outsidesources. The costs of these raw materials have been volatile historically and are influenced by factors that are outside our control. Inrecent years, the prices for energy, metal alloys, nickel and certain other of our raw materials have been volatile. While we strive tooffset our increased costs through supply chain management, contractual provisions and our CIP initiative, where gains are achieved inoperational efficiencies, our operating margins and results of operations and cash flows may be adversely affected if we are unable topass increases in the costs of our raw materials on to our customers or operational efficiencies are not achieved.
Economic, political and other risks associated with international operations could adversely affect our business.
A substantial portion of our operations is conducted and located outside the U.S. We have manufacturing, sales or service facilitiesin more than 50 countries and sell to customers in over 90 countries, in addition to the U.S. Moreover, we primarily outsource certainof our manufacturing and engineering functions to, and source our raw materials and components from, China, Eastern Europe, India,Latin America and Mexico. Accordingly, our business and results of operations are subject to risks associated with doing businessinternationally, including:
• instability in a specific country's or region's political or economic conditions, particularly economic conditions in Europe, andpolitical conditions in the Middle East, North Africa and other emerging markets;
• trade protection measures, such as tariff increases, and import and export licensing and control requirements;
• potentially negative consequences from changes in tax laws or tax examinations;
• difficulty in staffing and managing widespread operations;
• difficulty of enforcing agreements and collecting receivables through some foreign legal systems;
• differing and, in some cases, more stringent labor regulations;
• partial or total expropriation;
• differing protection of intellectual property;
• inability to repatriate income or capital; and
• difficulty in administering and enforcing corporate policies, which may be different than the customary business practices oflocal cultures.
For example, political unrest or work stoppages could negatively impact the demand for our products from customers in affectedcountries and other customers, such as U.S. oil refineries, that could be affected by the resulting disruption in the supply of crude oil.Similarly, military conflicts in the Middle East and North Africa and our customers' potential exposures to sovereign and non-sovereigndebt in Europe could soften the level of capital investment and demand for our products and services.
In order to manage our day-to-day operations, we must overcome cultural and language barriers and assimilate different businesspractices. In addition, we are required to create compensation programs, employment policies and other administrative programs thatcomply with laws of multiple countries. We also must communicate and monitor standards and directives across our global network. Ourfailure to successfully manage our geographically diverse operations could impair our ability to react quickly to changing business andmarket conditions and to enforce compliance with standards and procedures.
Our future success will depend, in large part, on our ability to anticipate and effectively manage these and other risks associatedwith our international operations. Any of these factors could, however, materially adversely affect our international operations and,consequently, our financial condition, results of operations and cash flows.
15
Copyright © 2013 www.secdatabase.com. All Rights Reserved.Please Consider the Environment Before Printing This Document
Table of Contents
Our international operations and foreign subsidiaries are subject to a variety of complex and continually changing laws andregulations.
Due to the international scope of our operations, the system of laws and regulations to which we are subject is complex and includes,without limitation, regulations issued by the U.S. Customs and Border Protection, the U.S. Department of Commerce's Bureau of Industryand Security, the U.S. Treasury Department's Office of Foreign Assets Control and various foreign governmental agencies, includingapplicable export controls, customs, currency exchange control and transfer pricing regulations, as applicable. No assurances can be madethat we will continue to be found to be operating in compliance with, or be able to detect violations of, any such laws or regulations. Inaddition, we cannot predict the nature, scope or effect of future regulatory requirements to which our international operations might besubject or the manner in which existing laws might be administered or interpreted.
We are also subject to risks associated with certain of our foreign subsidiaries autonomously making sales and providing relatedservices, under their own local authority, to customers in countries that have been designated by the U.S. State Department as statesponsors of terrorism, including Iran, Syria and Sudan. Due to the growing political uncertainties associated with these countries, in 2006,our foreign subsidiaries began a voluntary withdrawal, on a phased basis, from conducting new business in these countries. The aggregateamount of all business done by our foreign subsidiaries for customers in Iran, Syria and Sudan accounted for less than 0.3% of ourconsolidated revenue in 2011. Effective January 1, 2012, our foreign subsidiaries substantially completed the winding down of businessin these countries. Our foreign subsidiaries' remaining activities in Iran, Sudan and Syria are limited to ongoing wrap-up activities suchas attempts to collect accounts receivable, resolution of bank guarantee and bond issues, government mandated inspections and paymentof any outstanding agent commissions, which we plan to conclude as soon as possible.
Our international operations expose us to fluctuations in foreign currency exchange rates.
A significant portion of our revenue and certain of our costs, assets and liabilities, are denominated in currencies other than theU.S. dollar. The primary currencies to which we have exposure are the Euro, British pound, Mexican peso, Brazilian real, Indian rupee,Japanese yen, Singapore dollar, Argentine peso, Canadian dollar, Australian dollar, Chinese yuan, Colombian peso, Chilean peso andSouth African rand. Certain of the foreign currencies to which we have exposure, such as the Venezuelan bolivar, have undergonesignificant devaluation in the past, which can reduce the value of our local monetary assets, reduce the U.S. dollar value of our local cashflow, generate local currency losses that may impact our ability to pay future dividends from our subsidiary to the parent company andpotentially reduce the U.S. dollar value of future local net income. Although we enter into forward exchange contracts to economicallyhedge some of our risks associated with transactions denominated in certain foreign currencies, no assurances can be made that exchangerate fluctuations will not adversely affect our financial condition, results of operations and cash flows.
We could be adversely affected by violations of the U.S. Foreign Corrupt Practices Act and similar worldwide anti-bribery laws andregulations.
The U.S. Foreign Corrupt Practices Act ("FCPA") and similar anti-bribery laws and regulations (e.g., the UK Bribery Act) in otherjurisdictions generally prohibit companies and their intermediaries from making improper payments to non-U.S. government officialsfor the purpose of obtaining or retaining business or securing an improper business advantage. Our policies mandate compliance withthese anti-bribery laws worldwide. We operate in many parts of the world and sell to industries that have experienced corruption to somedegree. If we are found to be liable for FCPA or other similar anti-bribery law or regulatory violations, whether due to our or others'actions or inadvertence, we could be subject to civil and criminal penalties or other sanctions that could have a material adverse impacton our business, financial condition, results of operations and cash flows.
Terrorist acts, conflicts and wars may materially adversely affect our business, financial condition and results of operations andmay adversely affect the market for our common stock.
As a multi-national company with a large international footprint, we are subject to increased risk of damage or disruption to us,our employees, facilities, partners, suppliers, distributors, resellers or customers due to terrorist acts, conflicts and wars, wherever locatedaround the world. The potential for future attacks, the national and international responses to attacks or perceived threats to nationalsecurity, and other actual or potential conflicts or wars, including the Israeli-Hamas conflict and ongoing military operations in the MiddleEast at large, have created many economic and political uncertainties. In addition, as a multi-national company with headquarters andsignificant operations located in the U.S., actions against or by the U.S. may impact our business or employees. Although it is impossibleto predict the occurrences or consequences of any such events, they could result in a decrease in demand for our products, make it difficultor impossible to deliver products to our customers or to receive components from our suppliers, create delays and inefficiencies in oursupply chain and pose risks to our employees, resulting in the need to impose travel restrictions, any of which could adversely affect ourbusiness, financial condition, results of operations and cash flows.
Copyright © 2013 www.secdatabase.com. All Rights Reserved.Please Consider the Environment Before Printing This Document

16
Copyright © 2013 www.secdatabase.com. All Rights Reserved.Please Consider the Environment Before Printing This Document
Table of Contents
Environmental compliance costs and liabilities could adversely affect our financial condition, results of operations and cash flows.
Our operations and properties are subject to regulation under environmental laws, which can impose substantial sanctions forviolations. We must conform our operations to applicable regulatory requirements and adapt to changes in such requirements in allcountries in which we operate.
We use hazardous substances and generate hazardous wastes in many of our manufacturing and foundry operations. Most of ourcurrent and former properties are or have been used for industrial purposes, and some may require clean-up of historical contamination.We are currently conducting investigation and/or remediation activities at a number of locations where we have known environmentalconcerns. In addition, we have been identified as one of many PRPs at seven Superfund sites. The projected cost of remediation at thesesites, as well as our alleged "fair share" allocation, while not anticipated to be material, has been reserved. However, until all studies havebeen completed and the parties have either negotiated an amicable resolution or the matter has been judicially resolved, some degree ofuncertainty remains.
We have incurred, and expect to continue to incur, operating and capital costs to comply with environmental requirements. Inaddition, new laws and regulations, stricter enforcement of existing requirements, the discovery of previously unknown contaminationor the imposition of new clean-up requirements could require us to incur costs or become the basis for new or increased liabilities.Moreover, environmental and sustainability initiatives, practices, rules and regulations are under increasing scrutiny of both governmentaland non-governmental bodies, which can cause rapid change in operational practices, standards and expectations and, in turn, increaseour compliance costs. Any of these factors could have a material adverse effect on our financial condition, results of operations and cashflows.
We are party to asbestos-containing product litigation that could adversely affect our financial condition, results of operations andcash flows.
We are a defendant in a substantial number of lawsuits that seek to recover damages for personal injury allegedly resultingfrom exposure to asbestos-containing products formerly manufactured and/or distributed by us. Such products were used as internalcomponents of process equipment, and we do not believe that there was any significant emission of asbestos-containing fibers duringthe use of this equipment. Although we are defending these allegations vigorously and believe that a high percentage of these lawsuitsare covered by insurance or indemnities from other companies, there can be no assurance that we will prevail or that payments made byinsurance or such other companies would be adequate. Unfavorable rulings, judgments or settlement terms could have a material adverseimpact on our business, financial condition, results of operations and cash flows.
Our business may be adversely impacted by work stoppages and other labor matters.
As of December 31, 2011, we had approximately 16,000 employees, of which approximately 5,000 were located in the U.S.Approximately 7% of our U.S. employees are represented by unions. We also have unionized employees or employee work councils inArgentina, Australia, Austria, Brazil, Canada, Finland, France, Germany, Italy, Japan, Mexico, The Netherlands, Poland, Spain, Swedenand the United Kingdom ("U.K."). No unionized facility produces more than 10% of our revenues. Although we believe that our relationswith our employees are strong and we have not experienced any material strikes or work stoppages recently, no assurances can be madethat we will not in the future experience these and other types of conflicts with labor unions, works councils, other groups representingemployees or our employees generally, or that any future negotiations with our labor unions will not result in significant increases in ourcost of labor.
Inability to protect our intellectual property could negatively affect our competitive position.
We rely on a combination of patents, copyrights, trademarks, trade secrets, confidentiality provisions and licensing arrangementsto establish and protect our proprietary rights. We cannot guarantee, however, that the steps we have taken to protect our intellectualproperty will be adequate to prevent infringement of our rights or misappropriation of our technology. For example, effective patent,trademark, copyright and trade secret protection may be unavailable or limited in some of the foreign countries in which we operate. Inaddition, while we generally enter into confidentiality agreements with our employees and third parties to protect our intellectual property,such confidentiality agreements could be breached or otherwise may not provide meaningful protection for our trade secrets and know-how related to the design, manufacture or operation of our products. If it became necessary for us to resort to litigation to protect ourintellectual property rights, any proceedings could be burdensome and costly, and we may not prevail. Further, adequate remedies may notbe available in the event of an unauthorized use or disclosure of our trade secrets and manufacturing expertise. If we fail to successfullyenforce our intellectual property rights, our competitive position could suffer, which could harm our business, financial condition, resultsof operations and cash flows.
Copyright © 2013 www.secdatabase.com. All Rights Reserved.Please Consider the Environment Before Printing This Document

17
Copyright © 2013 www.secdatabase.com. All Rights Reserved.Please Consider the Environment Before Printing This Document
Table of Contents
Significant changes in pension fund investment performance or assumptions changes may have a material effect on the valuationof our obligations under our defined benefit pension plans, the funded status of these plans and our pension expense.
We maintain defined benefit pension plans that are required to be funded in the U.S., India, Japan, Mexico, The Netherlands andthe U.K., and defined benefit plans that are not required to be funded in Austria, France, Germany and Sweden. Our pension liabilityis materially affected by the discount rate used to measure our pension obligations and, in the case of the plans that are required to befunded, the level of plan assets available to fund those obligations and the expected long-term rate of return on plan assets. A change inthe discount rate can result in a significant increase or decrease in the valuation of pension obligations, affecting the reported status ofour pension plans and our pension expense. Significant changes in investment performance or a change in the portfolio mix of investedassets, for example the significant concentration of U.K. equity and fixed income securities in our non-U.S. defined benefit plans, canresult in increases and decreases in the valuation of plan assets or in a change of the expected rate of return on plan assets. Changes in theexpected return on plan assets assumption can result in significant changes in our pension expense and future funding requirements.
We continually review our funding policy related to our U.S. pension plan in accordance with applicable laws and regulations. Theimpact of the performance of global financial markets in recent years has reduced the value of investments held in trust to support pensionplans. Additionally, U.S. regulations are continually increasing the minimum level of funding for U.S pension plans. The combinedimpact of these changes has required significant contributions to our pension plans in recent years, which is likely to continue, albeitto a lesser extent, in 2012. Contributions to our pension plans reduce the availability of our cash flows to fund working capital, capitalexpenditures, R&D efforts and other general corporate purposes.
We may incur material costs as a result of product liability and warranty claims, which could adversely affect our financialcondition, results of operations and cash flows.
We may be exposed to product liability and warranty claims in the event that the use of one of our products results in, or is allegedto result in, bodily injury and/or property damage or our products actually or allegedly fail to perform as expected. While we maintaininsurance coverage with respect to certain product liability claims, we may not be able to obtain such insurance on acceptable terms in thefuture, and any such insurance may not provide adequate coverage against product liability claims. In addition, product liability claimscan be expensive to defend and can divert the attention of management and other personnel for significant periods of time, regardlessof the ultimate outcome. An unsuccessful defense of a product liability claim could have an adverse effect on our business, financialcondition, results of operations and cash flows. Even if we are successful in defending against a claim relating to our products, claims ofthis nature could cause our customers to lose confidence in our products and our company. Warranty claims are not generally covered byinsurance, and we may incur significant warranty costs in the future for which we would not be reimbursed.
The recording of increased deferred tax asset valuation allowances in the future could affect our operating results.
We currently have significant net deferred tax assets resulting from tax credit carryforwards, net operating losses and otherdeductible temporary differences that are available to reduce taxable income in future periods. Based on our assessment of our deferredtax assets, we determined, based on projected future income and certain available tax planning strategies, that approximately $239 millionof our deferred tax assets will more likely than not be realized in the future, and no valuation allowance is currently required for thisportion of our deferred tax assets. Should we determine in the future that these assets will not be realized, we will be required to recordan additional valuation allowance in connection with these deferred tax assets and our operating results would be adversely affected inthe period such determination is made.
Our outstanding indebtedness and the restrictive covenants in the agreements governing our indebtedness limit our operating andfinancial flexibility.
We are required to make scheduled repayments and, under certain events of default, mandatory repayments on our outstandingindebtedness, which may require us to dedicate a substantial portion of our cash flows from operations to payments on our indebtedness,thereby reducing the availability of our cash flows to fund working capital, capital expenditures, research and development efforts andother general corporate purposes, such as dividend payments and share repurchases, and could generally limit our flexibility in planningfor, or reacting to, changes in our business and industry.
In addition, the agreements governing our bank credit facilities impose certain operating and financial restrictions on us andsomewhat limit management's discretion in operating our businesses. These agreements limit or restrict our ability, among other things,to: incur additional debt; change fiscal year; pay dividends and make other distributions; prepay subordinated debt, make investments andother restricted payments; create liens; sell assets; and enter into transactions with affiliates.
Our bank credit facilities also contain covenants requiring us to deliver to lenders certificates of compliance with leverage andinterest coverage financial covenants and our audited annual and unaudited quarterly financial statements. Our ability to
Copyright © 2013 www.secdatabase.com. All Rights Reserved.Please Consider the Environment Before Printing This Document

18
Copyright © 2013 www.secdatabase.com. All Rights Reserved.Please Consider the Environment Before Printing This Document
Table of Contents
comply with these covenants may be affected by events beyond our control. Failure to comply with these covenants could result inan event of default which, if not cured or waived, may have a material adverse effect on our business, financial condition, results ofoperations and cash flows.
We may not be able to continue to expand our market presence through acquisitions, and any future acquisitions may presentunforeseen integration difficulties or costs.
Since 1997, we have expanded through a number of acquisitions, and we may pursue strategic acquisitions of businesses inthe future. Our ability to implement this growth strategy will be limited by our ability to identify appropriate acquisition candidates,covenants in our credit agreement and other debt agreements and our financial resources, including available cash and borrowingcapacity. Acquisitions may require additional debt financing, resulting in higher leverage and an increase in interest expense. In addition,acquisitions may require large one-time charges and can result in the incurrence of contingent liabilities, adverse tax consequences,substantial depreciation or deferred compensation charges, the amortization of identifiable purchased intangible assets or impairment ofgoodwill, any of which could have a material adverse effect on our business, financial condition, results of operations and cash flows.
Should we acquire another business, the process of integrating acquired operations into our existing operations may create operatingdifficulties and may require significant financial and managerial resources that would otherwise be available for the ongoing developmentor expansion of existing operations. Some of the more common challenges associated with acquisitions that we may experience include:
• loss of key employees or customers of the acquired company;
• conforming the acquired company's standards, processes, procedures and controls, including accounting systems and controls,with our operations, which could cause deficiencies related to our internal control over financial reporting;
• coordinating operations that are increased in scope, geographic diversity and complexity;
• retooling and reprogramming of equipment;
• hiring additional management and other critical personnel; and
• the diversion of management's attention from our day-to-day operations.
Further, no guarantees can be made that we would realize the cost savings, synergies or revenue enhancements that we mayanticipate from any acquisition, or that we will realize such benefits within the time frame that we expect. If we are not able to timelyaddress the challenges associated with acquisitions and successfully integrate acquired businesses, or if our integrated product and serviceofferings fail to achieve market acceptance, our business could be adversely affected.
Forward-Looking Information is Subject to Risk and Uncertainty
This Annual Report and other written reports and oral statements we make from time-to-time include “forward-looking statements”within the meaning of Section 27A of the Securities Act of 1933, Section 21E of the Securities Exchange Act of 1934 and the PrivateSecurities Litigation Reform Act of 1995. All statements other than statements of historical facts included in this Annual Report regardingour financial position, business strategy, plans and objectives of management for future operations, industry conditions, market conditionsand indebtedness covenant compliance are forward-looking statements. In some cases forward looking statements can be identifiedby terms such as "may," "should," "expects," "could," "intends," "projects," "predicts," "plans," "anticipates," "estimates," "believes,""forecasts" or other comparable terminology. These statements are not historical facts or guarantees of future performance, but insteadare based on current expectations and are subject to significant risks, uncertainties and other factors, many of which are outside of ourcontrol.
We have identified factors that could cause actual plans or results to differ materially from those included in any forward-lookingstatements. These factors include those described above under this "Risk Factors" heading, or as may be identified in our other SECfilings from time to time. These uncertainties are beyond our ability to control, and in many cases, it is not possible to foresee or identifyall the factors that may affect our future performance or any forward-looking information, and new risk factors can emerge from timeto time. Given these risks and uncertainties, undue reliance should not be placed on forward-looking statements as a prediction of actualresults.
All forward-looking statements included in this Annual Report are based on information available to us on the date of this AnnualReport and the risk that actual results will differ materially from expectations expressed in this report will increase with the passage oftime. We undertake no obligation, and disclaim any duty, to publicly update or revise any forward-looking statement or disclose any facts,events or circumstances that occur after the date hereof that may affect the accuracy of any forward-looking statement, whether as a resultof new information, future events, changes in our expectations or otherwise. This discussion is
Copyright © 2013 www.secdatabase.com. All Rights Reserved.Please Consider the Environment Before Printing This Document

19
Copyright © 2013 www.secdatabase.com. All Rights Reserved.Please Consider the Environment Before Printing This Document
Table of Contents
provided as permitted by the Private Securities Litigation Reform Act of 1995 and all of our forward-looking statements are expresslyqualified in their entirety by the cautionary statements contained or referenced in this section.
ITEM 1B. UNRESOLVED STAFF COMMENTS
None.
ITEM 2. PROPERTIES
Our principal executive offices, including our global headquarters, are located at 5215 N. O'Connor Boulevard, Suite 2300, Irving,Texas 75039. Our global headquarters is a leased facility, which we began to occupy on January 1, 2004. In September 2011, we extendedour original lease term an additional 10 years making the new termination date December 31, 2023. We have the option to renew thecurrent lease for two additional five-year periods. We currently occupy 125,000 square feet at this facility.
Our major manufacturing facilities (those with 50,000 or more square feet of manufacturing capacity) operating at December 31,2011 are presented in the table below. See "Item 1. Business" in this Annual Report for further information with respect to all of ourmanufacturing and operational facilities, including QRCs.
Numberof Plants
ApproximateSquare Footage
EPDU.S. 4 725,000Non-U.S. 15 2,004,000
IPDU.S. 3 566,000Non-U.S. 6 1,529,000
FCDU.S. 5 1,027,000Non-U.S. 12 1,410,000
We own the majority of our manufacturing facilities, and those manufacturing facilities we do not own are leased. We also maintaina substantial network of U.S. and foreign service centers and sales offices, most of which are leased. Our various leased facilities aregenerally covered by leases with terms in excess of seven years, with individual lease terms generally varying based on the facilities’primary usage. We believe we will be able to extend leases on our various facilities as necessary, as they expire.
We believe that our current facilities are adequate to meet the requirements of our present and foreseeable future operations. Wecontinue to review our capacity requirements as part of our strategy to optimize our global manufacturing efficiency. See Note 11 toour consolidated financial statements included in Item 8 of this Annual Report for additional information regarding our operating leaseobligations.
ITEM 3. LEGAL PROCEEDINGS
We are party to the legal proceedings that are described in Note 13 to our consolidated financial statements included in Item 8 of thisAnnual Report, and such disclosure is incorporated by reference into this Item 3. In addition to the foregoing, we and our subsidiaries arenamed defendants in certain other routine lawsuits incidental to our business and are involved from time to time as parties to governmentalproceedings, all arising in the ordinary course of business. Although the outcome of lawsuits or other proceedings involving us and oursubsidiaries cannot be predicted with certainty, and the amount of any liability that could arise with respect to such lawsuits or otherproceedings cannot be predicted accurately, management does not currently expect these matters, either individually or in the aggregate,to have a material effect on our financial position, results of operations or cash flows. We have established reserves covering exposuresrelating to contingencies to the extent believed to be reasonably estimable and probable based on past experience and available facts.
Copyright © 2013 www.secdatabase.com. All Rights Reserved.Please Consider the Environment Before Printing This Document

ITEM 4. MINE SAFETY DISCLOSURES
Not applicable.
20
Copyright © 2013 www.secdatabase.com. All Rights Reserved.Please Consider the Environment Before Printing This Document
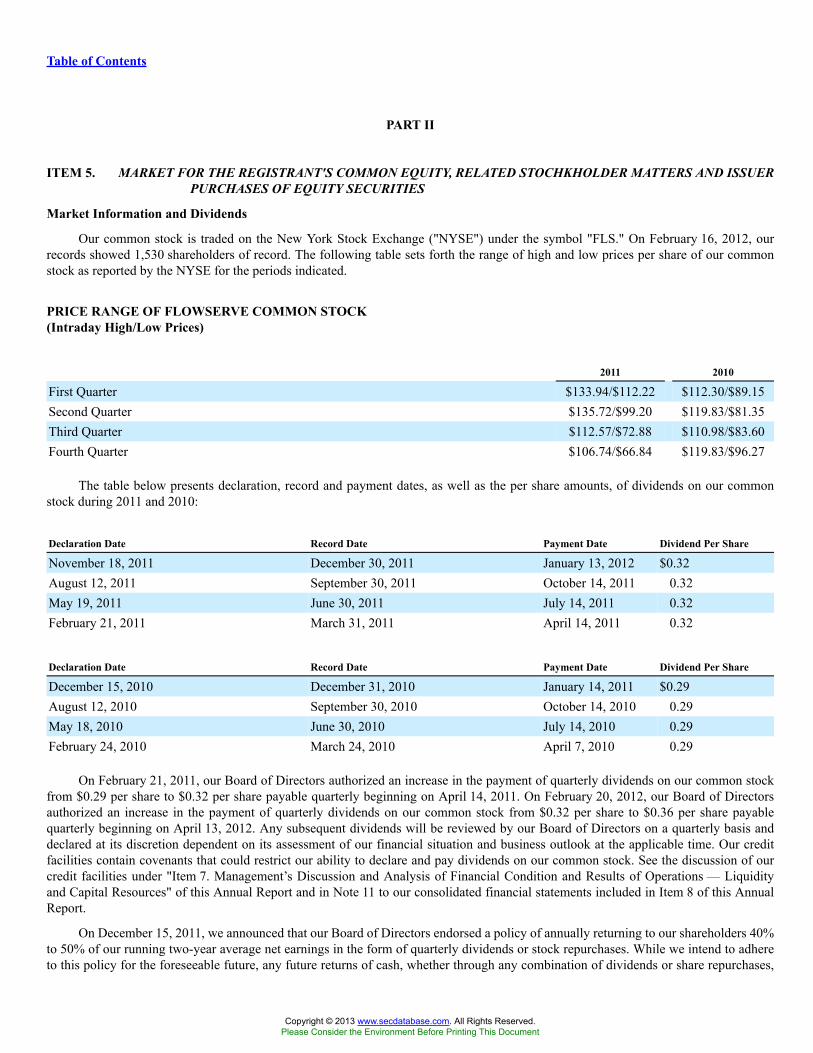
Table of Contents
PART II
ITEM 5. MARKET FOR THE REGISTRANT'S COMMON EQUITY, RELATED STOCHKHOLDER MATTERS AND ISSUERPURCHASES OF EQUITY SECURITIES
Market Information and Dividends
Our common stock is traded on the New York Stock Exchange ("NYSE") under the symbol "FLS." On February 16, 2012, ourrecords showed 1,530 shareholders of record. The following table sets forth the range of high and low prices per share of our commonstock as reported by the NYSE for the periods indicated.
PRICE RANGE OF FLOWSERVE COMMON STOCK(Intraday High/Low Prices)
2011 2010
First Quarter $133.94/$112.22 $112.30/$89.15Second Quarter $135.72/$99.20 $119.83/$81.35Third Quarter $112.57/$72.88 $110.98/$83.60Fourth Quarter $106.74/$66.84 $119.83/$96.27
The table below presents declaration, record and payment dates, as well as the per share amounts, of dividends on our commonstock during 2011 and 2010:
Declaration Date Record Date Payment Date Dividend Per Share
November 18, 2011 December 30, 2011 January 13, 2012 $0.32August 12, 2011 September 30, 2011 October 14, 2011 0.32May 19, 2011 June 30, 2011 July 14, 2011 0.32February 21, 2011 March 31, 2011 April 14, 2011 0.32
Declaration Date Record Date Payment Date Dividend Per Share
December 15, 2010 December 31, 2010 January 14, 2011 $0.29August 12, 2010 September 30, 2010 October 14, 2010 0.29May 18, 2010 June 30, 2010 July 14, 2010 0.29February 24, 2010 March 24, 2010 April 7, 2010 0.29
On February 21, 2011, our Board of Directors authorized an increase in the payment of quarterly dividends on our common stockfrom $0.29 per share to $0.32 per share payable quarterly beginning on April 14, 2011. On February 20, 2012, our Board of Directorsauthorized an increase in the payment of quarterly dividends on our common stock from $0.32 per share to $0.36 per share payablequarterly beginning on April 13, 2012. Any subsequent dividends will be reviewed by our Board of Directors on a quarterly basis anddeclared at its discretion dependent on its assessment of our financial situation and business outlook at the applicable time. Our creditfacilities contain covenants that could restrict our ability to declare and pay dividends on our common stock. See the discussion of ourcredit facilities under "Item 7. Management’s Discussion and Analysis of Financial Condition and Results of Operations — Liquidityand Capital Resources" of this Annual Report and in Note 11 to our consolidated financial statements included in Item 8 of this AnnualReport.
On December 15, 2011, we announced that our Board of Directors endorsed a policy of annually returning to our shareholders 40%to 50% of our running two-year average net earnings in the form of quarterly dividends or stock repurchases. While we intend to adhereto this policy for the foreseeable future, any future returns of cash, whether through any combination of dividends or share repurchases,
Copyright © 2013 www.secdatabase.com. All Rights Reserved.Please Consider the Environment Before Printing This Document
will be reviewed individually, declared by our Board of Directors and implemented by management at its discretion, depending on ourfinancial condition, business opportunities at the time and market conditions.
21
Copyright © 2013 www.secdatabase.com. All Rights Reserved.Please Consider the Environment Before Printing This Document
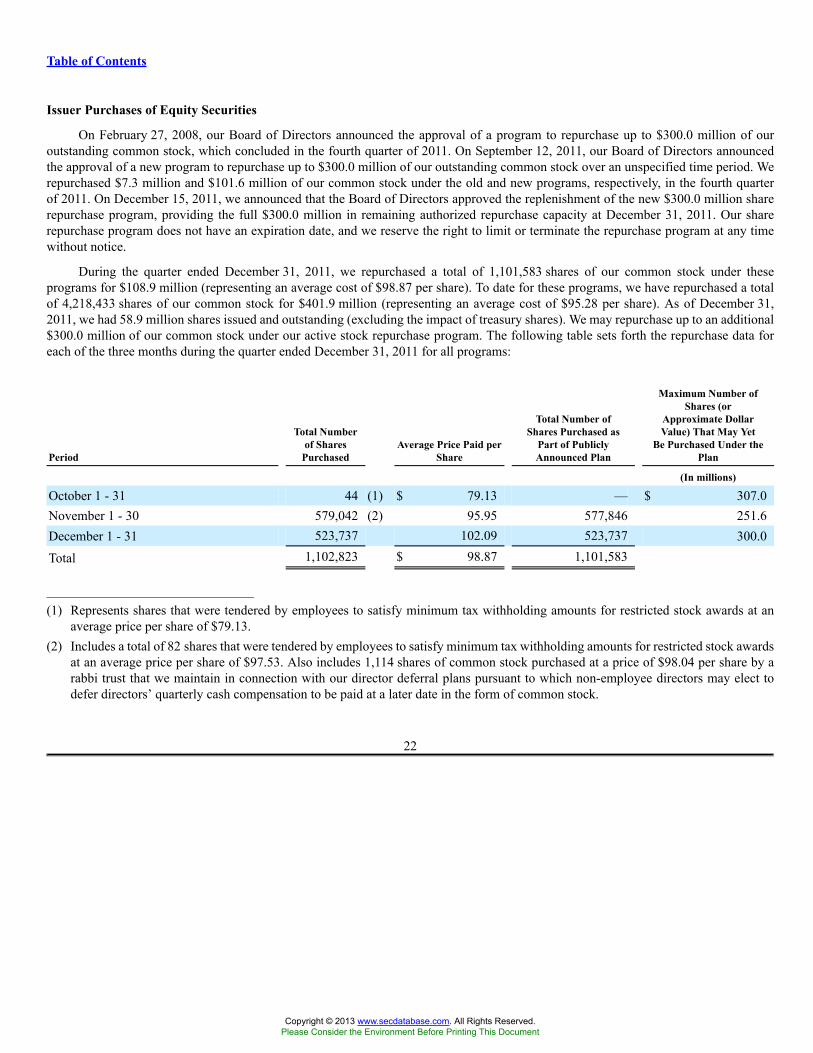
Table of Contents
Issuer Purchases of Equity Securities
On February 27, 2008, our Board of Directors announced the approval of a program to repurchase up to $300.0 million of ouroutstanding common stock, which concluded in the fourth quarter of 2011. On September 12, 2011, our Board of Directors announcedthe approval of a new program to repurchase up to $300.0 million of our outstanding common stock over an unspecified time period. Werepurchased $7.3 million and $101.6 million of our common stock under the old and new programs, respectively, in the fourth quarterof 2011. On December 15, 2011, we announced that the Board of Directors approved the replenishment of the new $300.0 million sharerepurchase program, providing the full $300.0 million in remaining authorized repurchase capacity at December 31, 2011. Our sharerepurchase program does not have an expiration date, and we reserve the right to limit or terminate the repurchase program at any timewithout notice.
During the quarter ended December 31, 2011, we repurchased a total of 1,101,583 shares of our common stock under theseprograms for $108.9 million (representing an average cost of $98.87 per share). To date for these programs, we have repurchased a totalof 4,218,433 shares of our common stock for $401.9 million (representing an average cost of $95.28 per share). As of December 31,2011, we had 58.9 million shares issued and outstanding (excluding the impact of treasury shares). We may repurchase up to an additional$300.0 million of our common stock under our active stock repurchase program. The following table sets forth the repurchase data foreach of the three months during the quarter ended December 31, 2011 for all programs:
Period
Total Numberof Shares
PurchasedAverage Price Paid per
Share
Total Number ofShares Purchased as
Part of PubliclyAnnounced Plan
Maximum Number ofShares (or
Approximate DollarValue) That May Yet
Be Purchased Under thePlan
(In millions)
October 1 - 31 44 (1) $ 79.13 — $ 307.0November 1 - 30 579,042 (2) 95.95 577,846 251.6December 1 - 31 523,737 102.09 523,737 300.0
Total 1,102,823 $ 98.87 1,101,583
_______________________________________
(1) Represents shares that were tendered by employees to satisfy minimum tax withholding amounts for restricted stock awards at anaverage price per share of $79.13.
(2) Includes a total of 82 shares that were tendered by employees to satisfy minimum tax withholding amounts for restricted stock awardsat an average price per share of $97.53. Also includes 1,114 shares of common stock purchased at a price of $98.04 per share by arabbi trust that we maintain in connection with our director deferral plans pursuant to which non-employee directors may elect todefer directors’ quarterly cash compensation to be paid at a later date in the form of common stock.
22
Copyright © 2013 www.secdatabase.com. All Rights Reserved.Please Consider the Environment Before Printing This Document

Table of Contents
Stock Performance Graph
The following graph depicts the most recent five-year performance of our common stock with the S&P 500 Index and S&P 500Industrial Machinery. The graph assumes an investment of $100 on December 31, 2006, and assumes the reinvestment of any dividendsover the following five years. The stock price performance shown in the graph is not necessarily indicative of future price performance.
Company/IndexBase Period
2006 2007 2008 2009 2010 2011
Flowserve Corporation $100.00 $192.19 $104.12 $193.76 $247.11 $208.54S&P 500 Index 100.00 105.49 66.46 84.05 96.71 98.75S&P 500 Industrial Machinery 100.00 121.21 72.67 101.54 138.03 125.21
23
Copyright © 2013 www.secdatabase.com. All Rights Reserved.Please Consider the Environment Before Printing This Document
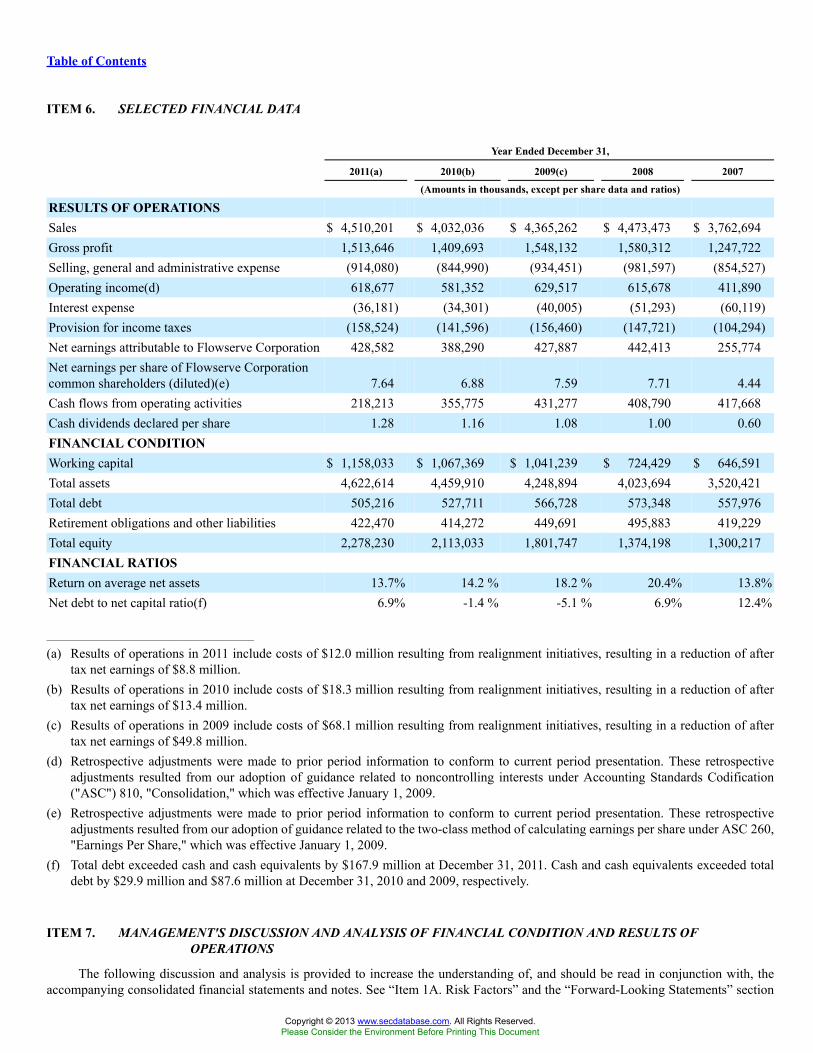
Table of Contents
ITEM 6. SELECTED FINANCIAL DATA
Year Ended December 31,
2011(a) 2010(b) 2009(c) 2008 2007
(Amounts in thousands, except per share data and ratios)
RESULTS OF OPERATIONSSales $ 4,510,201 $ 4,032,036 $ 4,365,262 $ 4,473,473 $ 3,762,694Gross profit 1,513,646 1,409,693 1,548,132 1,580,312 1,247,722Selling, general and administrative expense (914,080) (844,990) (934,451) (981,597) (854,527)Operating income(d) 618,677 581,352 629,517 615,678 411,890Interest expense (36,181) (34,301) (40,005) (51,293) (60,119)Provision for income taxes (158,524) (141,596) (156,460) (147,721) (104,294)Net earnings attributable to Flowserve Corporation 428,582 388,290 427,887 442,413 255,774Net earnings per share of Flowserve Corporationcommon shareholders (diluted)(e) 7.64 6.88 7.59 7.71 4.44Cash flows from operating activities 218,213 355,775 431,277 408,790 417,668Cash dividends declared per share 1.28 1.16 1.08 1.00 0.60FINANCIAL CONDITIONWorking capital $ 1,158,033 $ 1,067,369 $ 1,041,239 $ 724,429 $ 646,591Total assets 4,622,614 4,459,910 4,248,894 4,023,694 3,520,421Total debt 505,216 527,711 566,728 573,348 557,976Retirement obligations and other liabilities 422,470 414,272 449,691 495,883 419,229Total equity 2,278,230 2,113,033 1,801,747 1,374,198 1,300,217FINANCIAL RATIOSReturn on average net assets 13.7% 14.2 % 18.2 % 20.4% 13.8%Net debt to net capital ratio(f) 6.9% -1.4 % -5.1 % 6.9% 12.4%
_______________________________________
(a) Results of operations in 2011 include costs of $12.0 million resulting from realignment initiatives, resulting in a reduction of aftertax net earnings of $8.8 million.
(b) Results of operations in 2010 include costs of $18.3 million resulting from realignment initiatives, resulting in a reduction of aftertax net earnings of $13.4 million.
(c) Results of operations in 2009 include costs of $68.1 million resulting from realignment initiatives, resulting in a reduction of aftertax net earnings of $49.8 million.
(d) Retrospective adjustments were made to prior period information to conform to current period presentation. These retrospectiveadjustments resulted from our adoption of guidance related to noncontrolling interests under Accounting Standards Codification("ASC") 810, "Consolidation," which was effective January 1, 2009.
(e) Retrospective adjustments were made to prior period information to conform to current period presentation. These retrospectiveadjustments resulted from our adoption of guidance related to the two-class method of calculating earnings per share under ASC 260,"Earnings Per Share," which was effective January 1, 2009.
(f) Total debt exceeded cash and cash equivalents by $167.9 million at December 31, 2011. Cash and cash equivalents exceeded totaldebt by $29.9 million and $87.6 million at December 31, 2010 and 2009, respectively.
ITEM 7. MANAGEMENT'S DISCUSSION AND ANALYSIS OF FINANCIAL CONDITION AND RESULTS OFOPERATIONS
The following discussion and analysis is provided to increase the understanding of, and should be read in conjunction with, theaccompanying consolidated financial statements and notes. See “Item 1A. Risk Factors” and the “Forward-Looking Statements” section
Copyright © 2013 www.secdatabase.com. All Rights Reserved.Please Consider the Environment Before Printing This Document

therein for a discussion of the risks, uncertainties and assumptions associated with these statements. Unless otherwise noted, all amountsdiscussed herein are consolidated.
24
Copyright © 2013 www.secdatabase.com. All Rights Reserved.Please Consider the Environment Before Printing This Document
Table of Contents
EXECUTIVE OVERVIEW
Our Company
We believe that we are a world-leading manufacturer and aftermarket service provider of comprehensive flow control systems. Wedevelop and manufacture precision-engineered flow control equipment integral to the movement, control and protection of the flow ofmaterials in our customers’ critical processes. Our product portfolio of pumps, valves, seals, automation and aftermarket services supportsglobal infrastructure industries, including oil and gas, chemical, power generation and water management, as well as general industrialmarkets where our products and services add value. Through our manufacturing platform and global network of Quick Response Centers("QRCs"), we offer a broad array of aftermarket equipment services, such as installation, advanced diagnostics, repair and retrofitting.We currently employ approximately 16,000 employees in more than 50 countries.
Our business model is significantly influenced by the capital spending of global infrastructure industries for the placement of newproducts into service and aftermarket services for existing operations. The worldwide installed base of our products is an important sourceof aftermarket revenue, where products are expected to ensure the maximum operating time of many key industrial processes. Overthe past several years, we have significantly invested in our aftermarket strategy to provide local support to maximize our customers’investment in our offerings, as well as to provide business stability during various economic periods. The aftermarket business, which isserved by our network of 171 QRCs located around the globe, provides a variety of service offerings for our customers including spareparts, service solutions, product life cycle solutions and other value-added services, and is generally a higher margin business and a keycomponent of our profitable growth strategy.
Our operations are conducted through three business segments that are referenced throughout this Management’s Discussion andAnalysis of Financial Condition and Results of Operations ("MD&A"):
• FSG Engineered Product Division ("EPD") for long lead-time, custom and other highly-engineered pumps and pump systems,mechanical seals, auxiliary systems and replacement parts and related services;
• FSG Industrial Product Division ("IPD") for pre-configured engineered pumps and pump systems and related products andservices; and
• Flow Control Division ("FCD") for engineered and industrial valves, control valves, actuators and controls and related services.
Our business segments share a focus on industrial flow control technology and have a high number of common customers. Thesesegments also have complementary product offerings and technologies that are often combined in applications which provide us a netcompetitive advantage. Our segments also benefit from our global footprint and our economies of scale in reducing administrative andoverhead costs to serve customers more cost effectively.
The reputation of our product portfolio is built on more than 50 well-respected brand names such as Worthington, IDP, Valtek,Limitorque and Durametallic, which we believe to be one of the most comprehensive in the industry. Our products and services aresold either directly or through designated channels to more than 10,000 companies, including some of the world’s leading engineering,procurement and construction firms, original equipment manufacturers, distributors and end users.
We continue to build on our geographic breadth through our QRC network with the goal to be positioned as near to our customersas possible for service and support throughout the product life cycle in order to capture this important aftermarket business. Alongwith ensuring that we have the local capability to sell, install and service our equipment in remote regions, it is equally imperative tocontinuously improve our global operations. We continue to expand our global supply chain capability to meet global customer demandsand ensure the quality and timely delivery of our products. We continue to devote resources to improving the supply chain processesacross our divisions to find areas of synergy and cost reduction and to improve our supply chain management capability to ensure it canmeet global customer demands. We continue to focus on improving on-time delivery and quality, while managing warranty costs as apercentage of sales across our global operations, through the assistance of a focused Continuous Improvement Process ("CIP") initiative.The goal of the CIP initiative, which includes lean manufacturing, six sigma business management strategy and value engineering, is tomaximize service fulfillment to customers through on-time delivery, reduced cycle time and quality at the highest internal productivity.
We experienced improved demand for original equipment in 2011 as compared with 2010. As the effects from the global recessionbegan to diminish, several demand forecasts improved, which promoted increased capital investment spending and planning. The oil andgas industry saw improved conditions as the developing regions’ economic growth plans rekindled projections of demand growth for oiland natural gas. Pipeline and refining investments were driven by infrastructure expansion plans in these growing regions. The developingregions also experienced improved conditions in the investment in chemical processing and general industries. In the mature regions, allthree of these industries experienced a moderate increase in levels of investment, although overcapacity in oil refining affected capitalinvestments. In the area of power generation, uncertainty over environmental
Copyright © 2013 www.secdatabase.com. All Rights Reserved.Please Consider the Environment Before Printing This Document

25
Copyright © 2013 www.secdatabase.com. All Rights Reserved.Please Consider the Environment Before Printing This Document
Table of Contents
regulations challenged spending levels, while the water management industry displayed weakness in its spending levels, as planneddesalination projects continue to be delayed as governments evaluated fiscal priorities.
A critical component of our growth strategy remains our investment in expanding our aftermarket capabilities to provide localsupport to maximize our customers’ investment in our offerings, as well as to provide stability for our business during various economicperiods. In 2011, we experienced improved demand in our global aftermarket business as compared with 2010. This was driven byour customers’ need to maintain continuing operations and the expansion of our aftermarket capabilities provided through our newintegrated solutions offerings. Customers’ desire to gain operational efficiencies and increase throughput from existing facilities providedopportunities to leverage our engineering knowledge and technological capabilities to design solutions that produce the desired businessresult. In 2011, we continued to execute on our strategy to increase our presence in all regions of our global market to capture aftermarketopportunities.
We believe that with our customer relationships, our global presence and our highly regarded technical capabilities, we willcontinue to have opportunities in our core industries; however, we face challenges affecting many companies in our industry with asignificant multi-national presence, such as economic, political, currency and other risks.
Our Markets
The following discussion should be read in conjunction with the "Outlook for 2012" section included in this MD&A.
Our products and services are used in several distinct industries: oil and gas; chemical; power generation; water management; anda number of other industries that are collectively referred to as "general industries."
Demand for most of our products depends on the level of new capital investment and planned and unplanned maintenanceexpenditures by our customers. The level of new capital investment depends, in turn, on capital infrastructure projects driven by the needfor oil and gas, power generation and water management, as well as general economic conditions. These drivers are generally related tothe phase of the business cycle in their respective industries and the expectations of future market behavior. The levels of maintenanceexpenditures are additionally driven by the reliability of equipment, planned and unplanned downtime for maintenance and the requiredcapacity utilization of the process.
Our customers include engineering, procurement and construction firms, original equipment manufacturers, end users anddistributors. Sales to engineering, procurement and construction firms and original equipment manufacturers are typically for large projectorders and critical applications, as are certain sales to distributors. Project orders are typically procured for customers either directly fromus or indirectly through contractors for new construction projects or facility enhancement projects.
The quick turnaround business, which we also refer to as "book and ship," is defined as orders that are received from the customer(booked) and shipped within three months of receipt. These orders are typically for more standardized, general purpose products, parts orservices. Each of our three business segments generates certain levels of this type of business.
In the sale of aftermarket products and services, we benefit from a large installed base of our original equipment, which requiresmaintenance, repair and replacement parts. We use our manufacturing platform and global network of QRCs to offer a broad array ofaftermarket equipment services, such as installation, advanced diagnostics, repair and retrofitting. In geographic regions where we arepositioned to provide quick response, we believe customers have traditionally relied on us, rather than our competitors, for aftermarketproducts due to our highly engineered and customized products. However, the aftermarket for standard products is competitive, as theexistence of common standards allows for easier replacement of the installed products. As proximity of service centers, timeliness ofdelivery and quality are important considerations for all aftermarket products and services, we continue to expand our global QRCnetwork to improve our ability to capture this important aftermarket business.
Oil and Gas
The oil and gas industry, which represented approximately 40% and 42% of our bookings in 2011 and 2010, respectively,experienced a stable level of capital spending in 2011 compared to the previous year due to the need to continue building infrastructurein order to bring future capacity on line to meet future demand expectations. The majority of investment by the major oil companiescontinued to focus on upstream production activities; however, there were improved levels of spending in both mid-stream pipeline anddownstream refining operations, particularly in the developing markets. Refining overcapacity remained a concern throughout the year inthe mature regions, as overall demand for oil remained volatile throughout the year. Aftermarket opportunities in this industry improvedthroughout the year, with our integrated solutions offering helping to offset a reduction in service-related business, as many refineriesperformed this work with their own personnel.
The outlook for the oil and gas industry is heavily dependent on the demand growth from both mature markets and developinggeographies. We believe oil and gas companies will continue with upstream and downstream investment plans that are in line with
Copyright © 2013 www.secdatabase.com. All Rights Reserved.Please Consider the Environment Before Printing This Document

projections of future demand growth and the production declines of existing operations. A projected decline in demand could cause oiland gas companies to reduce their overall level of spending, which could decrease demand for our products and services.
26
Copyright © 2013 www.secdatabase.com. All Rights Reserved.Please Consider the Environment Before Printing This Document
Table of Contents
However, we believe the long-term fundamentals for this industry remain solid based on current supply, projected depletion ratesof existing fields and forecasted long-term demand growth. With our long-standing reputation in providing successful solutions forupstream, mid-stream and downstream applications, along with the advancements in our portfolio of offerings, we believe that wecontinue to be well-positioned to pursue the opportunities in this industry around the globe.
Chemical
The chemical industry represented approximately 18% and 16% of our bookings in 2011 and 2010, respectively. Capital spendingin the chemical industry rebounded in 2011 with the expansion of existing facilities and the approval of new projects around the world.The Middle East and Asia have seen significant growth in chemical projects as countries in those regions try to access the higher marginsavailable downstream in the petrochemical markets. Additionally, North America has seen a revival in the chemical industry, where shalegas has changed the economics of production allowing for a lower cost abundant feedstock to drive high value chemical projects. Theaftermarket opportunities improved for the majority of the year with indications that the improvements will continue into 2012.
Despite a strong year, the outlook for the chemical industry remains heavily dependent on global economic conditions. As globaleconomies stabilize and unemployment conditions improve, a rise in consumer spending should follow. An increase in spending woulddrive greater demand for chemical-based products supporting improved levels of capital investment. We believe the chemical industryin the near-term will continue to invest in maintenance and upgrades for optimization of existing assets and that developing regionswill continue investing in capital infrastructure to meet current and future indigenous demand. We believe our global presence and ourlocalized aftermarket capabilities are well-positioned to serve the potential growth opportunities in this industry.
Power Generation
The power generation industry represented approximately 16% and 17% of our bookings in 2011 and 2010, respectively. In 2011,the power generation industry continued to experience some softness in capital spending in the mature regions driven by the uncertaintyrelated to environmental regulations, as well as potential regulatory impacts to the overall civilian nuclear market. In the developingregions, capital investment remained in place driven by increased demand forecasts for electricity in countries such as China and India.Global concerns about the environment continue to support an increase in desired future capacity from renewable energy sources. Themajority of the active and planned construction throughout 2011 continued to utilize designs based on fossil fuels. Natural gas increasedits percentage of utilization driven by market prices for gas remaining low and relatively stable. With the potential of unconventionalsources of gas, such as shale gas, the power generation industry is forecasting an increased use of this form of fuel for power generationplants.
We believe the outlook for the power generation industry remains favorable. Current legislative efforts to limit the emissions ofcarbon dioxide may have an adverse effect on investment plans depending on the potential requirements imposed and the timing ofcompliance by country. However, we believe that proposed methods of limiting carbon dioxide emissions offer business opportunitiesfor our products and services. We believe the long-term fundamentals for the power generation industry remain solid based on projectedincreases in demand for electricity driven by global population growth, advancements of industrialization and growth of urbanization indeveloping markets. We also believe that our long-standing reputation in the power generation industry, our portfolio of offerings for thevarious generating methods, our advancements in serving the renewable energy market and carbon capture methodologies, as well as ourglobal service and support structure, position us well for the future opportunities in this important industry.
Water Management
The water management industry represented approximately 4% and 5% of our bookings in 2011 and 2010, respectively. Althoughthe water management industry displayed weakness in spending levels in 2011 as desalination projects continued to be delayed,worldwide demand for fresh water and water treatment continues to create requirements for new facilities or for upgrades of existingsystems, many of which require products that we offer, particularly pumps. We believe that the persistent demand for fresh water duringall economic cycles supports continuing investments.
The water management industry is facing a future supply/demand challenge relative to forecasted global population growth coupledwith the advancement of industrialization and urbanization. Due to the limitations of usable fresh water around the globe, there continuesto be an increased investment in desalination. This investment is forecasted to significantly increase over the next several decades. Webelieve we are a global leader in the desalination market, which is already an important source of fresh water in the Mediterranean regionand the Middle East. We expect that this trend in desalination will expand from these traditional areas to other coastal areas around theglobe, which we believe presents a significant market opportunity for pumps, valves, actuation products and energy recovery devices.
27
Copyright © 2013 www.secdatabase.com. All Rights Reserved.Please Consider the Environment Before Printing This Document
Table of Contents
General Industries
General industries comprises a variety of different businesses, including mining and ore processing, pharmaceuticals, pulp andpaper, food and beverage and other smaller applications, none of which individually represented more than 5% of total bookings in 2011and 2010. General industries also includes sales to distributors, whose end customers operate in the industries we primarily serve. Generalindustries represented, in the aggregate, approximately 22% and 20% of our bookings in 2011 and 2010, respectively.
In 2011, we saw improving conditions in the majority of these businesses. Pulp and paper, mining and ore processing and food andbeverage all saw improved conditions in 2011 compared with 2010. This was generally supported by the improving economic conditionsin several parts of the world. We also experienced increased business levels through our distribution network, as business conditionsimproved and inventory levels required replenishment.
The outlook for this group of industries is heavily dependent upon the condition of global economies and consumer confidencelevels. The long-term fundamentals of many of these industries remain sound as many of the products produced by these industries arecommon staples of industrialized and urbanized economies. We believe that our specialty product offerings designed for these industriesand our aftermarket service capabilities will provide future business opportunities.
OUR RESULTS OF OPERATIONS
Throughout this discussion of our results of operations, we discuss the impact of fluctuations in foreign currency exchange rates.We have calculated currency effects by translating current year results on a monthly basis at prior year exchange rates for the sameperiods.
As discussed in Note 1 to our consolidated financial statements included in "Item 8. Financial Statements and Supplementary Data"("Item 8") of this Annual Report on Form 10-K for the year ended December 31, 2011 ("Annual Report"), ongoing political and economicconditions in North Africa have caused us to experience shipment delays to this region. We estimate that the shipments to this region thathave been delayed resulted in lost or delayed opportunities for operating income of $11.2 million ($8.0 million for EPD and $3.2 millionfor IPD) for 2011. The preponderance of our physical assets in the region are located in the Kingdom of Saudi Arabia and the UnitedArab Emirates and have, to date, not been significantly affected by the unrest elsewhere in the region.
We continue to assess the conditions and potential adverse impacts of the earthquake and tsunami in Japan in early 2011, inparticular as they relate to our customers and suppliers in the impacted regions, as well as announced and potential regulatory impacts tothe global nuclear power market. During 2011, we did not experience any significant adverse impacts due to shipment delays, collectionissues or supply chain disruptions related to these events. We are also closely monitoring the effects of the Japan crisis on the globalnuclear power industry. While it is difficult to estimate the long-term effect of the Fukushima plant shutdown on the global nuclear powermarket, we have continued to ship nuclear orders in our backlog without significant disruption. We believe that there has been a relatedreduction in nuclear orders that could continue in the near term, though other parts of our overall power generation business could benefitas nuclear power priorities are reevaluated.
Other than broad, macro-level economic impacts, we did not experience any direct or measurable disruptions in 2011 due to theEuropean sovereign debt crisis. We will continue to monitor and evaluate the impact of any future developments in the region on ourcurrent business, our customers and suppliers and the state of the global economy. Additional adverse developments could potentiallyimpact our customers’ exposures to sovereign and non-sovereign European debt and could soften the level of capital investment anddemand for our products and services.
As discussed in Note 2 to our consolidated financial statements included in Item 8 of this Annual Report, effective October 28,2011, we acquired for inclusion in EPD, Lawrence Pumps, Inc. ("LPI"), a privately-owned, United States ("U.S.") based companyspecializing in the design, development and manufacture of engineered centrifugal slurry pumps for critical services within the petroleumrefining, petrochemical, pulp and paper and energy markets. LPI was acquired in a cash transaction valued at $89.6 million, subjectto final adjustments. We acquired for inclusion in FCD, Valbart Srl ("Valbart"), a privately-owned Italian valve manufacturer, effectiveJuly 16, 2010. We acquired for inclusion in EPD, Calder AG ("Calder"), a Swiss supplier of energy recovery technology, effectiveApril 21, 2009. The results of operations of LPI, Valbart and Calder have been consolidated since the respective dates of acquisition. Nopro forma information has been provided for these acquisitions due to immateriality.
As discussed in Note 7 to our consolidated financial statements included in Item 8 of this Annual Report, beginning in 2009, weinitiated realignment programs to reduce and optimize certain non-strategic manufacturing facilities and our overall cost structure byimproving our operating efficiency, reducing redundancies, maximizing global consistency and driving improved financial performance,as well as expanding our efforts to optimize assets, respond to reduced orders and drive an enhanced customer-facing organization("Realignment Programs"). These programs are substantially complete. We currently expect total Realignment Program charges will beapproximately $93 million for approved plans, of which $91.2 million has been incurred through December 31, 2011.
Copyright © 2013 www.secdatabase.com. All Rights Reserved.Please Consider the Environment Before Printing This Document

28
Copyright © 2013 www.secdatabase.com. All Rights Reserved.Please Consider the Environment Before Printing This Document
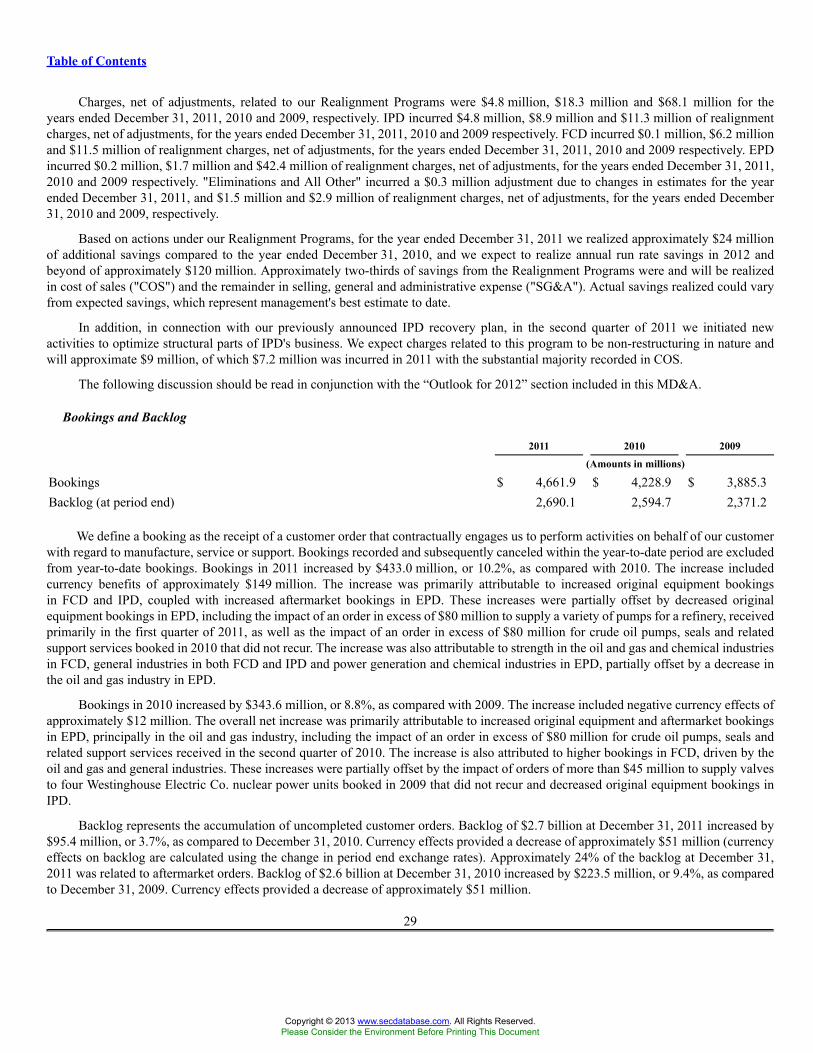
Table of Contents
Charges, net of adjustments, related to our Realignment Programs were $4.8 million, $18.3 million and $68.1 million for theyears ended December 31, 2011, 2010 and 2009, respectively. IPD incurred $4.8 million, $8.9 million and $11.3 million of realignmentcharges, net of adjustments, for the years ended December 31, 2011, 2010 and 2009 respectively. FCD incurred $0.1 million, $6.2 millionand $11.5 million of realignment charges, net of adjustments, for the years ended December 31, 2011, 2010 and 2009 respectively. EPDincurred $0.2 million, $1.7 million and $42.4 million of realignment charges, net of adjustments, for the years ended December 31, 2011,2010 and 2009 respectively. "Eliminations and All Other" incurred a $0.3 million adjustment due to changes in estimates for the yearended December 31, 2011, and $1.5 million and $2.9 million of realignment charges, net of adjustments, for the years ended December31, 2010 and 2009, respectively.
Based on actions under our Realignment Programs, for the year ended December 31, 2011 we realized approximately $24 millionof additional savings compared to the year ended December 31, 2010, and we expect to realize annual run rate savings in 2012 andbeyond of approximately $120 million. Approximately two-thirds of savings from the Realignment Programs were and will be realizedin cost of sales ("COS") and the remainder in selling, general and administrative expense ("SG&A"). Actual savings realized could varyfrom expected savings, which represent management's best estimate to date.
In addition, in connection with our previously announced IPD recovery plan, in the second quarter of 2011 we initiated newactivities to optimize structural parts of IPD's business. We expect charges related to this program to be non-restructuring in nature andwill approximate $9 million, of which $7.2 million was incurred in 2011 with the substantial majority recorded in COS.
The following discussion should be read in conjunction with the “Outlook for 2012” section included in this MD&A.
Bookings and Backlog
2011 2010 2009
(Amounts in millions)
Bookings $ 4,661.9 $ 4,228.9 $ 3,885.3Backlog (at period end) 2,690.1 2,594.7 2,371.2
We define a booking as the receipt of a customer order that contractually engages us to perform activities on behalf of our customerwith regard to manufacture, service or support. Bookings recorded and subsequently canceled within the year-to-date period are excludedfrom year-to-date bookings. Bookings in 2011 increased by $433.0 million, or 10.2%, as compared with 2010. The increase includedcurrency benefits of approximately $149 million. The increase was primarily attributable to increased original equipment bookingsin FCD and IPD, coupled with increased aftermarket bookings in EPD. These increases were partially offset by decreased originalequipment bookings in EPD, including the impact of an order in excess of $80 million to supply a variety of pumps for a refinery, receivedprimarily in the first quarter of 2011, as well as the impact of an order in excess of $80 million for crude oil pumps, seals and relatedsupport services booked in 2010 that did not recur. The increase was also attributable to strength in the oil and gas and chemical industriesin FCD, general industries in both FCD and IPD and power generation and chemical industries in EPD, partially offset by a decrease inthe oil and gas industry in EPD.
Bookings in 2010 increased by $343.6 million, or 8.8%, as compared with 2009. The increase included negative currency effects ofapproximately $12 million. The overall net increase was primarily attributable to increased original equipment and aftermarket bookingsin EPD, principally in the oil and gas industry, including the impact of an order in excess of $80 million for crude oil pumps, seals andrelated support services received in the second quarter of 2010. The increase is also attributed to higher bookings in FCD, driven by theoil and gas and general industries. These increases were partially offset by the impact of orders of more than $45 million to supply valvesto four Westinghouse Electric Co. nuclear power units booked in 2009 that did not recur and decreased original equipment bookings inIPD.
Backlog represents the accumulation of uncompleted customer orders. Backlog of $2.7 billion at December 31, 2011 increased by$95.4 million, or 3.7%, as compared to December 31, 2010. Currency effects provided a decrease of approximately $51 million (currencyeffects on backlog are calculated using the change in period end exchange rates). Approximately 24% of the backlog at December 31,2011 was related to aftermarket orders. Backlog of $2.6 billion at December 31, 2010 increased by $223.5 million, or 9.4%, as comparedto December 31, 2009. Currency effects provided a decrease of approximately $51 million.
29
Copyright © 2013 www.secdatabase.com. All Rights Reserved.Please Consider the Environment Before Printing This Document

Table of Contents
Sales
2011 2010 2009
(Amounts in millions)
Sales $ 4,510.2 $ 4,032.0 $ 4,365.3
Sales in 2011 increased by $478.2 million, or 11.9%, as compared with 2010. The increase included currency benefits ofapproximately $144 million. The increase was primarily due to FCD, which had increased original equipment sales in Europe, the MiddleEast and Africa ("EMA"), reflecting continued recovery in the oil and gas industry and increased sales attributable to Valbart of $74.6million. Aftermarket sales in EPD, driven by North America and Latin America, also contributed to the overall increase in sales and werepartially offset by decreased original equipment sales in EPD, primarily in EMA. North America sales in IPD also contributed to theoverall increase, primarily driven by original equipment.
Sales in 2010 decreased by $333.3 million, or 7.6%, as compared with 2009. The decrease included negative currency effects ofapproximately $32 million. The decrease was primarily attributable to decreased original equipment orders across all divisions, primarilydriven by lower beginning backlog in the oil and gas and general industries for 2010, as compared with 2009, reflecting lower demandand customer-driven project delays due to a significant decrease in the rate of general global economic growth in 2009. These decreaseswere slightly offset by increased aftermarket sales in EPD, driven by Latin America and Asia Pacific, and in FCD by sales provided byValbart of $38.3 million.
Sales to international customers, including export sales from the U.S., were approximately 73% of sales in 2011, 2010 and 2009.Sales to EMA were approximately 39%, 40% and 40% of total sales in 2011, 2010 and 2009, respectively. Sales to Asia Pacific wereapproximately 19%, 18% and 20% of total sales in 2011, 2010 and 2009, respectively. Sales to Latin America were approximately 10%,10% and 9% of total sales in 2011, 2010 and 2009, respectively.
Gross Profit and Gross Profit Margin
2011 2010 2009
(Amounts in millions, except percentages)
Gross profit $ 1,513.6 $ 1,409.7 $ 1,548.1Gross profit margin 33.6% 35.0% 35.5%
Gross profit in 2011 increased by $103.9 million, or 7.4%, as compared with 2010. The increase included the effect ofapproximately $13 million in increased savings realized and $9.9 million of decreased charges resulting from our Realignment Programs,partially offset by $6.8 million in charges related to the IPD recovery plan, as compared with 2010. Gross profit margin in 2011 of 33.6%decreased from 35.0% in 2010. The decrease was primarily attributable to lower margins on certain large projects primarily in beginningof year backlog, the negative impact of currency on margins of U.S. dollar-denominated sales produced in some of our non-U.S. facilities,incremental charges associated with certain projects that have not shipped or shipped late in EPD, charges related to the IPD recovery planand increased material costs in FCD. The decrease was partially offset by a mix shift to higher margin aftermarket sales in all divisions.As a result of the sales mix shift, aftermarket sales increased to approximately 41% of total sales, as compared with approximately 39%of total sales for the same period in 2010.
Gross profit in 2010 decreased by $138.4 million, or 8.9%, as compared with 2009. The decrease included the effect ofapproximately $37 million in increased savings realized and a decrease of $27.0 million in charges resulting from our RealignmentPrograms as compared with 2009. Gross profit margin in 2010 of 35.0% decreased from 35.5% in 2009. The decrease was primarilyattributable to less favorable pricing from beginning of year backlog in EPD and IPD as compared with 2009 and the negative impactof decreased sales on our absorption of fixed manufacturing costs, the effects of which were partially offset by a sales mix shift towardhigher margin aftermarket sales in EPD and IPD, increased utilization of low-cost regions by FCD, positive impacts of our RealignmentPrograms and various CIP initiatives. Aftermarket sales increased to approximately 39% of total sales in 2010, as compared withapproximately 36% of total sales in 2009.
30
Copyright © 2013 www.secdatabase.com. All Rights Reserved.Please Consider the Environment Before Printing This Document
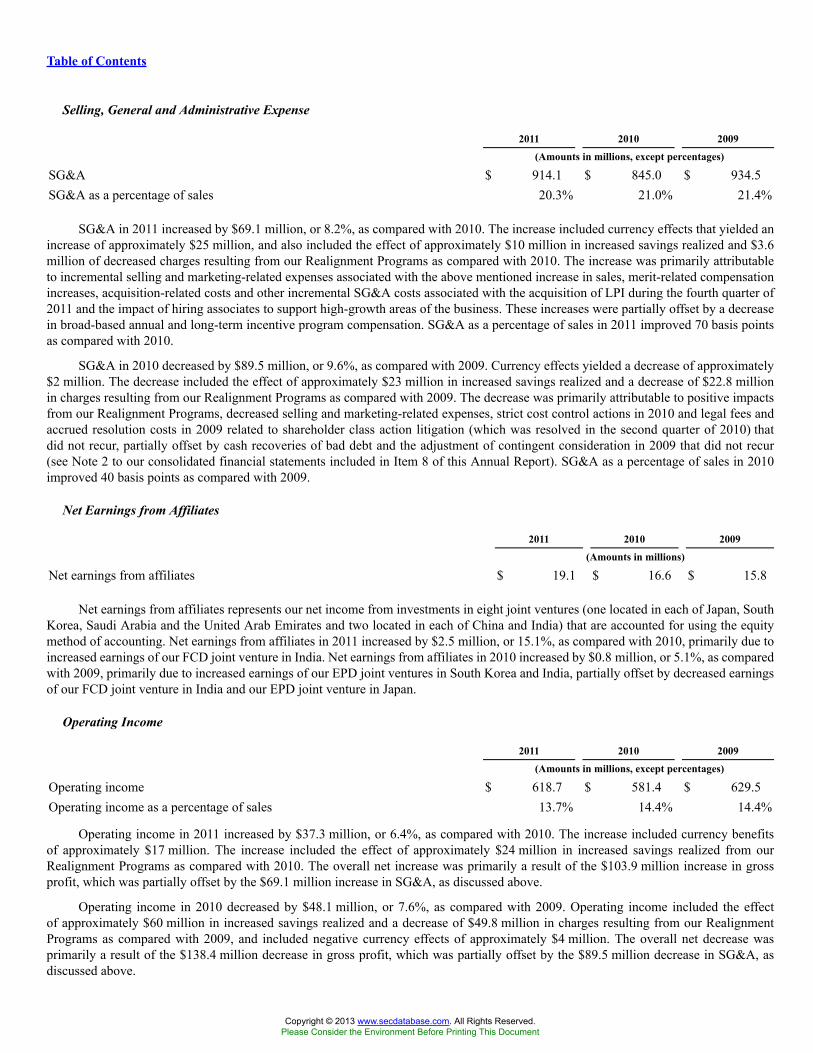
Table of Contents
Selling, General and Administrative Expense
2011 2010 2009
(Amounts in millions, except percentages)
SG&A $ 914.1 $ 845.0 $ 934.5SG&A as a percentage of sales 20.3% 21.0% 21.4%
SG&A in 2011 increased by $69.1 million, or 8.2%, as compared with 2010. The increase included currency effects that yielded anincrease of approximately $25 million, and also included the effect of approximately $10 million in increased savings realized and $3.6million of decreased charges resulting from our Realignment Programs as compared with 2010. The increase was primarily attributableto incremental selling and marketing-related expenses associated with the above mentioned increase in sales, merit-related compensationincreases, acquisition-related costs and other incremental SG&A costs associated with the acquisition of LPI during the fourth quarter of2011 and the impact of hiring associates to support high-growth areas of the business. These increases were partially offset by a decreasein broad-based annual and long-term incentive program compensation. SG&A as a percentage of sales in 2011 improved 70 basis pointsas compared with 2010.
SG&A in 2010 decreased by $89.5 million, or 9.6%, as compared with 2009. Currency effects yielded a decrease of approximately$2 million. The decrease included the effect of approximately $23 million in increased savings realized and a decrease of $22.8 millionin charges resulting from our Realignment Programs as compared with 2009. The decrease was primarily attributable to positive impactsfrom our Realignment Programs, decreased selling and marketing-related expenses, strict cost control actions in 2010 and legal fees andaccrued resolution costs in 2009 related to shareholder class action litigation (which was resolved in the second quarter of 2010) thatdid not recur, partially offset by cash recoveries of bad debt and the adjustment of contingent consideration in 2009 that did not recur(see Note 2 to our consolidated financial statements included in Item 8 of this Annual Report). SG&A as a percentage of sales in 2010improved 40 basis points as compared with 2009.
Net Earnings from Affiliates
2011 2010 2009
(Amounts in millions)
Net earnings from affiliates $ 19.1 $ 16.6 $ 15.8
Net earnings from affiliates represents our net income from investments in eight joint ventures (one located in each of Japan, SouthKorea, Saudi Arabia and the United Arab Emirates and two located in each of China and India) that are accounted for using the equitymethod of accounting. Net earnings from affiliates in 2011 increased by $2.5 million, or 15.1%, as compared with 2010, primarily due toincreased earnings of our FCD joint venture in India. Net earnings from affiliates in 2010 increased by $0.8 million, or 5.1%, as comparedwith 2009, primarily due to increased earnings of our EPD joint ventures in South Korea and India, partially offset by decreased earningsof our FCD joint venture in India and our EPD joint venture in Japan.
Operating Income
2011 2010 2009
(Amounts in millions, except percentages)
Operating income $ 618.7 $ 581.4 $ 629.5Operating income as a percentage of sales 13.7% 14.4% 14.4%
Operating income in 2011 increased by $37.3 million, or 6.4%, as compared with 2010. The increase included currency benefitsof approximately $17 million. The increase included the effect of approximately $24 million in increased savings realized from ourRealignment Programs as compared with 2010. The overall net increase was primarily a result of the $103.9 million increase in grossprofit, which was partially offset by the $69.1 million increase in SG&A, as discussed above.
Operating income in 2010 decreased by $48.1 million, or 7.6%, as compared with 2009. Operating income included the effectof approximately $60 million in increased savings realized and a decrease of $49.8 million in charges resulting from our RealignmentPrograms as compared with 2009, and included negative currency effects of approximately $4 million. The overall net decrease wasprimarily a result of the $138.4 million decrease in gross profit, which was partially offset by the $89.5 million decrease in SG&A, asdiscussed above.
Copyright © 2013 www.secdatabase.com. All Rights Reserved.Please Consider the Environment Before Printing This Document

31
Copyright © 2013 www.secdatabase.com. All Rights Reserved.Please Consider the Environment Before Printing This Document

Table of Contents
Interest Expense and Interest Income
2011 2010 2009
(Amounts in millions)
Interest expense $ (36.2) $ (34.3) $ (40.0)Interest income 1.6 1.6 3.2
Interest expense in 2011 increased by $1.9 million as compared with 2010 primarily due to increased interest expense on localborrowings to fund short-term cash needs in support of growth in emerging markets and the impact of the refinancing of our creditfacilities in late 2010. Interest expense decreased by $5.7 million in 2010 as compared with 2009, as a result of decreased interest rates.At December 31, 2011, approximately 70% of our debt was at fixed rates, including the effects of $330.0 million of notional interest rateswaps.
Interest income in 2011 was consistent with 2010. Interest income in 2010 decreased by $1.6 million as compared with 2009 dueprimarily to decreased interest rates.
Other Income (Expense), net
2011 2010 2009
(Amounts in millions)
Other income (expense), net $ 3.7 $ (18.3) $ (8.0)
Other income (expense), net in 2011 increased $22.0 million to income of $3.7 million, as compared to expense of $18.3 million in2010, primarily due to a $23.9 million increase in gains arising from transactions in currencies other than our sites' functional currencies,which reflect the relative strengthening of the U.S. dollar versus the Euro during 2011 as compared with 2010. Currency losses in 2010included the impact of the $7.6 million net loss recorded as a result of Venezuela's currency devaluation and the settlement of U.S. dollardenominated liabilities at the more favorable essential items rate of 2.60 Bolivars to the U.S. dollar. These losses were partially offset bya $3.1 million gain on the sale of an investment in a joint venture in 2010 that was accounted for under the cost method.
Other income (expense), net in 2010 increased $10.3 million, or 128.8%, to expense of $18.3 million, as compared with 2009,primarily due to a $13.9 million increase in losses on forward exchange contracts and a $4.8 million increase in losses arising fromtransactions in currencies other than our sites’ functional currencies. Both of the above-mentioned changes primarily reflected thestrengthening of the U.S. dollar exchange rate versus the Euro. Also included in the increase in losses arising from transactions incurrencies other than our site’s functional currencies is the impact of the $7.6 million net loss recorded as a result of Venezuela’sdevaluation of the Bolivar and the settlement of U.S. dollar denominated liabilities at the more favorable essential items rate. See Note 1to our consolidated financial statements included in Item 8 of this Annual Report for additional details on the impact of Venezuela’scurrency devaluation. In addition, we expensed $1.6 million in loan costs associated with the refinancing of our credit facilities in thefourth quarter of 2010. The above losses were partially offset by miscellaneous gains and income, the largest of which was a $3.1 milliongain on the sale of an investment in a joint venture in 2010 that was accounted for under the cost method.
Tax Expense and Tax Rate
2011 2010 2009
(Amounts in millions, except percentages)
Provision for income taxes $ 158.5 $ 141.6 $ 156.5Effective tax rate 27.0% 26.7% 26.8%
The 2011, 2010 and 2009 effective tax rates differed from the federal statutory rate of 35% primarily due to the net impact of foreignoperations, which included the impacts of lower foreign tax rates, and changes in our reserves established for uncertain tax positions.
On May 17, 2006, the Tax Increase Prevention and Reconciliation Act of 2005 was signed into law, creating an exclusion fromU.S. taxable income for certain types of foreign related party payments of dividends, interest, rents and royalties that, prior to 2006, hadbeen subject to U.S. taxation. This exclusion is effective for the years 2006 through 2011, and applies to certain of our related partypayments.
Copyright © 2013 www.secdatabase.com. All Rights Reserved.Please Consider the Environment Before Printing This Document

Our effective tax rate is based upon current earnings and estimates of future taxable earnings for each domestic and internationallocation. Changes in any of these and other factors, including our ability to utilize foreign tax credits and net operating
32
Copyright © 2013 www.secdatabase.com. All Rights Reserved.Please Consider the Environment Before Printing This Document

Table of Contents
losses or results from tax audits, could impact the tax rate in future periods. As of December 31, 2011, we have foreign tax credits of$43.4 million, expiring in 2018 through 2020 against which we recorded no valuation allowances. Additionally, we have recorded othernet deferred tax assets of $38.6 million, which relate to net operating losses, tax credits and other deductible temporary differences thatare available to reduce taxable income in future periods, most of which do not have a definite expiration. Should we not be able to utilizeall or a portion of these credits and losses, our effective tax rate would increase.
Net Earnings and Earnings Per Share
2011 2010 2009
(Amounts in millions, except per share amounts)
Net earnings attributable to Flowserve Corporation $ 428.6 $ 388.3 $ 427.9Net earnings per share — diluted $ 7.64 $ 6.88 $ 7.59Average diluted shares 56.1 56.4 56.4
Net earnings in 2011 increased by $40.3 million to $428.6 million, or to $7.64 per diluted share, as compared with 2010. Theincrease was primarily attributable to $37.3 million increase in operating income and a $22.0 million increase in other income (expense),net, partially offset by a $1.9 million increase in interest expense and a $16.9 million increase in tax expense.
Net earnings in 2010 decreased by $39.6 million to $388.3 million, or to $6.88 per diluted share, as compared with 2009. Thedecrease was primarily attributable to $48.1 million decrease in operating income and a $10.3 million increase in other income (expense),net, partially offset by a $5.7 million decrease in interest expense and a $14.9 million decrease in tax expense.
Other Comprehensive (Expense) Income
2011 2010 2009
(Amounts in millions)
Other comprehensive (expense) income $ (65.6) $ (1.4) $ 63.0
Other comprehensive (expense) income in 2011 increased by $64.2 million, primarily reflecting the strengthening of the U.S. dollarexchange rate versus the Euro at December 31, 2011 as compared with December 31, 2010.
Other comprehensive (expense) income in 2010 decreased by $64.4 million to expense of $1.4 million, primarily reflecting thestrengthening of the U.S. dollar exchange rate versus the Euro at December 31, 2010 as compared with December 31, 2009, partiallyoffset by a decrease in pension and other postretirement expense in 2010.
Business Segments
We conduct our operations through three business segments based on type of product and how we manage the business. We evaluatesegment performance and allocate resources based on each segment’s operating income. See Note 17 to our consolidated financialstatements included in Item 8 of this Annual Report for further discussion of our segments. The key operating results for our threebusiness segments, EPD, IPD and FCD, are discussed below.
FSG Engineered Product Division Segment Results
Our largest business segment is EPD, through which we design, manufacture, distribute and service custom and other highly-engineered pumps and pump systems, mechanical seals, auxiliary systems and replacement parts (collectively referred to as "originalequipment"). EPD includes longer lead-time, highly-engineered pump products, and shorter cycle engineered pumps and mechanicalseals that are generally manufactured much more quickly. EPD also manufactures replacement parts and related equipment and providesa full array of replacement parts, repair and support services (collectively referred to as "aftermarket"). EPD primarily operates in theoil and gas, power generation, chemical, water management and general industries. EPD operates in 41 countries with 28 manufacturingfacilities worldwide, nine of which are located in Europe, 11 in North America, four in Asia and four in Latin America, and it has 120QRCs, including those co-located in manufacturing facilities.
33
Copyright © 2013 www.secdatabase.com. All Rights Reserved.Please Consider the Environment Before Printing This Document
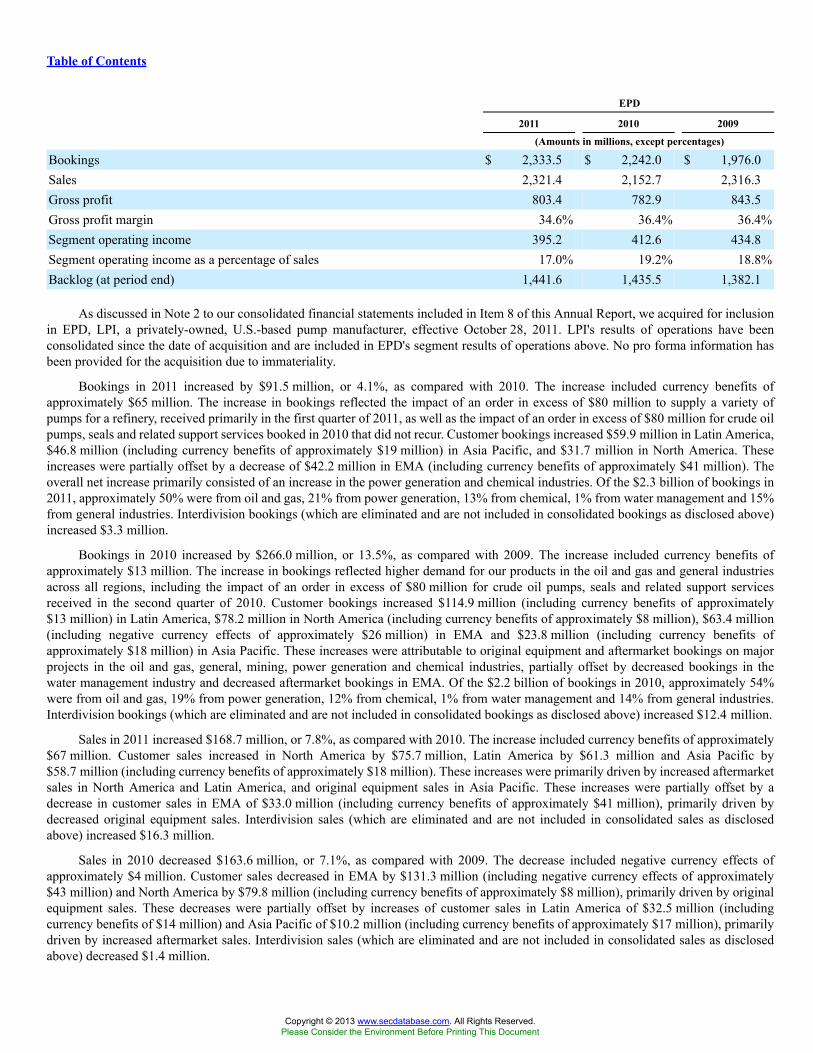
Table of Contents
EPD
2011 2010 2009
(Amounts in millions, except percentages)
Bookings $ 2,333.5 $ 2,242.0 $ 1,976.0Sales 2,321.4 2,152.7 2,316.3Gross profit 803.4 782.9 843.5Gross profit margin 34.6% 36.4% 36.4%Segment operating income 395.2 412.6 434.8Segment operating income as a percentage of sales 17.0% 19.2% 18.8%Backlog (at period end) 1,441.6 1,435.5 1,382.1
As discussed in Note 2 to our consolidated financial statements included in Item 8 of this Annual Report, we acquired for inclusionin EPD, LPI, a privately-owned, U.S.-based pump manufacturer, effective October 28, 2011. LPI's results of operations have beenconsolidated since the date of acquisition and are included in EPD's segment results of operations above. No pro forma information hasbeen provided for the acquisition due to immateriality.
Bookings in 2011 increased by $91.5 million, or 4.1%, as compared with 2010. The increase included currency benefits ofapproximately $65 million. The increase in bookings reflected the impact of an order in excess of $80 million to supply a variety ofpumps for a refinery, received primarily in the first quarter of 2011, as well as the impact of an order in excess of $80 million for crude oilpumps, seals and related support services booked in 2010 that did not recur. Customer bookings increased $59.9 million in Latin America,$46.8 million (including currency benefits of approximately $19 million) in Asia Pacific, and $31.7 million in North America. Theseincreases were partially offset by a decrease of $42.2 million in EMA (including currency benefits of approximately $41 million). Theoverall net increase primarily consisted of an increase in the power generation and chemical industries. Of the $2.3 billion of bookings in2011, approximately 50% were from oil and gas, 21% from power generation, 13% from chemical, 1% from water management and 15%from general industries. Interdivision bookings (which are eliminated and are not included in consolidated bookings as disclosed above)increased $3.3 million.
Bookings in 2010 increased by $266.0 million, or 13.5%, as compared with 2009. The increase included currency benefits ofapproximately $13 million. The increase in bookings reflected higher demand for our products in the oil and gas and general industriesacross all regions, including the impact of an order in excess of $80 million for crude oil pumps, seals and related support servicesreceived in the second quarter of 2010. Customer bookings increased $114.9 million (including currency benefits of approximately$13 million) in Latin America, $78.2 million in North America (including currency benefits of approximately $8 million), $63.4 million(including negative currency effects of approximately $26 million) in EMA and $23.8 million (including currency benefits ofapproximately $18 million) in Asia Pacific. These increases were attributable to original equipment and aftermarket bookings on majorprojects in the oil and gas, general, mining, power generation and chemical industries, partially offset by decreased bookings in thewater management industry and decreased aftermarket bookings in EMA. Of the $2.2 billion of bookings in 2010, approximately 54%were from oil and gas, 19% from power generation, 12% from chemical, 1% from water management and 14% from general industries.Interdivision bookings (which are eliminated and are not included in consolidated bookings as disclosed above) increased $12.4 million.
Sales in 2011 increased $168.7 million, or 7.8%, as compared with 2010. The increase included currency benefits of approximately$67 million. Customer sales increased in North America by $75.7 million, Latin America by $61.3 million and Asia Pacific by$58.7 million (including currency benefits of approximately $18 million). These increases were primarily driven by increased aftermarketsales in North America and Latin America, and original equipment sales in Asia Pacific. These increases were partially offset by adecrease in customer sales in EMA of $33.0 million (including currency benefits of approximately $41 million), primarily driven bydecreased original equipment sales. Interdivision sales (which are eliminated and are not included in consolidated sales as disclosedabove) increased $16.3 million.
Sales in 2010 decreased $163.6 million, or 7.1%, as compared with 2009. The decrease included negative currency effects ofapproximately $4 million. Customer sales decreased in EMA by $131.3 million (including negative currency effects of approximately$43 million) and North America by $79.8 million (including currency benefits of approximately $8 million), primarily driven by originalequipment sales. These decreases were partially offset by increases of customer sales in Latin America of $32.5 million (includingcurrency benefits of $14 million) and Asia Pacific of $10.2 million (including currency benefits of approximately $17 million), primarilydriven by increased aftermarket sales. Interdivision sales (which are eliminated and are not included in consolidated sales as disclosedabove) decreased $1.4 million.
Copyright © 2013 www.secdatabase.com. All Rights Reserved.Please Consider the Environment Before Printing This Document
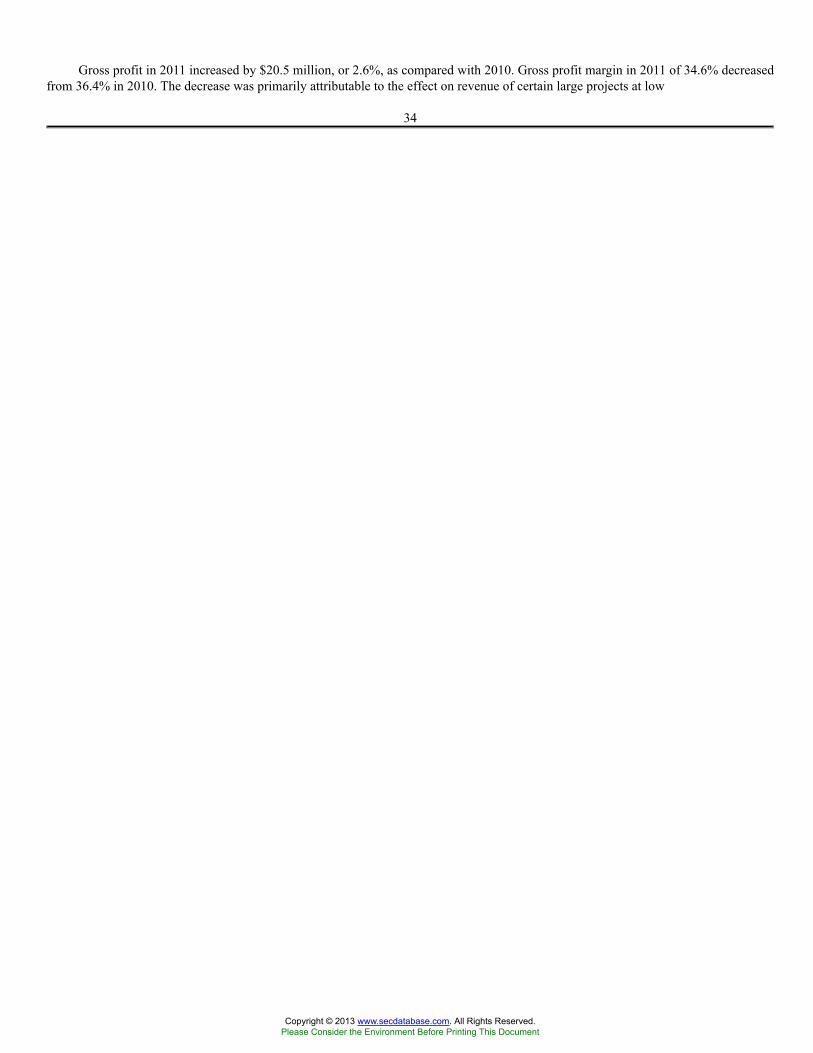
Gross profit in 2011 increased by $20.5 million, or 2.6%, as compared with 2010. Gross profit margin in 2011 of 34.6% decreasedfrom 36.4% in 2010. The decrease was primarily attributable to the effect on revenue of certain large projects at low
34
Copyright © 2013 www.secdatabase.com. All Rights Reserved.Please Consider the Environment Before Printing This Document
Table of Contents
margins primarily in beginning of year backlog, the negative impact of currency on margins of U.S. dollar denominated sales producedin some of our non-U.S. facilities and incremental charges associated with certain projects that have not shipped or shipped late, partiallyoffset by a sales mix shift towards higher margin aftermarket sales.
Gross profit in 2010 decreased by $60.6 million, or 7.2%, as compared with 2009. Gross profit margin in 2010 of 36.4% wascomparable with the same period in 2009. Gross profit margin was negatively impacted by less favorable pricing from beginning ofyear backlog as compared with 2009 and the negative impact of decreased sales on our absorption of fixed manufacturing costs. Thedecrease in gross profit margin was mostly offset by a sales mix shift towards higher margin aftermarket sales, increased savings realizedand decreased charges resulting from our Realignment Programs as compared with 2009, as well as operational efficiencies and savingsrealized from our supply chain initiatives.
Operating income in 2011 decreased by $17.4 million, or 4.2%, as compared with 2010. The decrease included currency benefitsof approximately $9 million. The overall net decrease was due primarily to increased SG&A of $37.9 million (including increases due tocurrency effects of approximately $12 million), partially offset by increased gross profit of $20.5 million, as discussed above. IncreasedSG&A was attributable to incremental selling and marketing-related expenses associated with the above mentioned increase in sales,merit-related compensation increases, the impact of hiring associates to support high-growth areas of the business, acquisition-relatedand other incremental SG&A costs associated with the acquisition of LPI in the fourth quarter of 2011 and a $3.9 million penalty thatwas assessed by a Spanish regulatory commission in the second quarter of 2011. These increases were partially offset by a decrease inbroad-based annual and long-term incentive program compensation.
Operating income in 2010 decreased by $22.2 million, or 5.1%, as compared with 2009. The decrease included negative currencyeffects of less than $1 million. The overall net decrease was due primarily to reduced gross profit of $60.6 million, as discussed above,partially offset by decreased SG&A of $36.0 million, which was due to increased savings realized and a decrease in charges resultingfrom our Realignment Programs as compared with 2009, decreased selling and marketing-related expenses and strict cost control actionsin 2010. Additionally, the $4.4 million benefit from the adjustment of contingent consideration in 2009 related to the acquisition of Calderdid not recur (see Note 2 to our consolidated financial statements included in Item 8 of this Annual Report).
Backlog of $1.4 billion at December 31, 2011 increased by $6.1 million, or 0.4%, as compared to December 31, 2010. Currencyeffects provided a decrease of approximately $14 million. Backlog of $1.4 billion at December 31, 2011 included $19.9 million ofinterdivision backlog (which is eliminated and not included in consolidated backlog as disclosed above). Backlog of $1.4 billion atDecember 31, 2010 increased by $53.4 million, or 3.9%, as compared to December 31, 2009. Currency effects provided a decrease ofapproximately $14 million. Backlog at December 31, 2010 includes $25.5 million of interdivision backlog (which is eliminated and notincluded in consolidated backlog as disclosed above).
FSG Industrial Product Division Segment Results
Through IPD we design, manufacture, distribute and service engineered, pre-configured industrial pumps and pump systems,including submersible motors and specialty products (e.g., thrusters), collectively referred to as "original equipment." Additionally,IPD manufactures replacement parts and related equipment, and provides a full array of support services (collectively referred to as"aftermarket"). IPD primarily operates in the oil and gas, chemical, water management, power generation and general industries. IPDoperates 12 manufacturing facilities, three of which are located in the U.S and six in Europe, and it operates 21 QRCs worldwide,including 11 sites in Europe and four in the U.S., including those co-located in manufacturing facilities.
IPD
2011 2010 2009
(Amounts in millions, except percentages)
Bookings $ 905.4 $ 827.5 $ 823.1Sales 878.2 800.2 971.0Gross profit 197.5 204.7 262.5Gross profit margin 22.5% 25.6% 27.0%Segment operating income 62.9 68.5 107.9Segment operating income as a percentage of sales 7.2% 8.6% 11.1%Backlog (at period end) 567.8 568.0 555.6
Bookings in 2011 increased by $77.9 million, or 9.4%, as compared with 2010. The increase included currency benefits ofapproximately $29 million. The increase was primarily driven by increased customer bookings of $45.4 million (including currency
Copyright © 2013 www.secdatabase.com. All Rights Reserved.Please Consider the Environment Before Printing This Document
benefits of approximately $20 million) in EMA and Australia. Increased customer bookings were driven by general and chemicalindustries, partially offset by decreased customer bookings in the water management industry. Interdivision bookings (which are
35
Copyright © 2013 www.secdatabase.com. All Rights Reserved.Please Consider the Environment Before Printing This Document
Table of Contents
eliminated and are not included in consolidated bookings as disclosed above) increased $32.2 million. Of the $905.4 million of bookingsin 2011, approximately 29% were from oil and gas, 19% from water management, 11% from chemical, 8% from power generation and33% from general industries.
Bookings in 2010 increased by $4.4 million, or 0.5%, as compared with 2009. The increase included negative currency effects ofapproximately $11 million. The overall net increase was primarily driven by an increase in customer bookings of $57.1 million in theAmericas and an increase in interdivision bookings (which are eliminated and are not included in consolidated bookings as disclosedabove) of $20.2 million, mostly offset by decreased customer bookings of $74.3 million in EMA and Australia. The overall net decreasein customer bookings was primarily driven by decreased orders of original equipment in the power generation, mining and chemicalindustries, partially offset by increased customer bookings in the oil and gas markets, primarily in Europe. Of the $827.5 million ofbookings in 2010, approximately 31% were from oil and gas, 21% from water management, 10% from chemical, 9% from powergeneration and 29% from general industries.
Sales in 2011 increased by $78.0 million, or 9.7%, as compared with 2010. The increase included currency benefits ofapproximately $29 million. The increase in customer sales was driven by an increase of $64.2 million in the Americas, partially offsetby a decrease of $16.1 million (including currency benefits of approximately $21 million) in EMA and Australia. The increase in theAmericas was primarily driven by original equipment sales. The decline in EMA and Australia was primarily attributable to decreasedoriginal equipment sales, which resulted from lower beginning of year original equipment backlog as compared with 2010. Interdivisionsales (which are eliminated and are not included in consolidated sales as disclosed above) increased $30.0 million.
Sales in 2010 decreased by $170.8 million, or 17.6%, as compared with 2009. The decrease included negative currency effectsof approximately $9 million. The decreases in customer sales was primarily attributable to a decline in sales of $133.0 million in EMAand Australia and $30.5 million in the Americas. The declines, primarily in the power generation, mining and chemical industries, wereattributable to lower backlog as compared with 2009 and included the impact of thruster sales for orders booked in 2008 that did not recurin 2010. Interdivision sales (which are eliminated and are not included in consolidated sales as disclosed above) decreased $6.3 million.
Gross profit in 2011 decreased by $7.2 million, or 3.5%, as compared with 2010. Gross profit margin in 2011 of 22.5% decreasedfrom 25.6% in 2010. The decrease is primarily attributable to less favorable pricing on projects shipped from backlog, increased materialcosts, charges related to the IPD recovery plan and incremental charges resulting from operational efficiency issues in certain sites,partially offset by increased savings realized from our Realignment Programs, as compared with the same period in 2010, and a mix shiftto higher margin aftermarket sales.
Gross profit in 2010 decreased by $57.8 million, or 22.0%, as compared with 2009. Gross profit margin in 2010 of 25.6% decreasedfrom 27.0% in 2009. The decrease was primarily attributable to the negative impact of decreased sales on our absorption of fixedmanufacturing costs and less favorable pricing from backlog as compared with 2009, partially offset by a sales mix shift toward moreprofitable aftermarket sales and increased savings realized and lower charges resulting from our Realignment Programs as compared withthe same period in 2009.
Operating income for 2011 decreased by $5.6 million, or 8.2%, as compared with 2010. The decrease included currency benefits ofapproximately $2 million. The overall net decrease is due to the $7.2 million decrease in gross profit discussed above, partially offset bya $1.6 million decrease in SG&A.
Operating income for 2010 decreased by $39.4 million, or 36.5%, as compared with 2009. The decrease included negative currencyeffects of approximately $3 million. The decrease is due to the $57.8 million decrease in gross profit discussed above, partially offset byan $18.4 million decrease in SG&A. The decrease in SG&A is due to decreased selling-related expenses, strict cost control actions in2010 and increased savings realized and lower charges resulting from our Realignment Programs as compared with 2009.
Backlog of $567.8 million at December 31, 2011 remained flat, as compared to December 31, 2010. Currency effects provideda decrease of approximately $13 million. Backlog at December 31, 2011 included $56.7 million of interdivision backlog (which iseliminated and not included in consolidated backlog as disclosed above). Backlog of $568.0 million at December 31, 2010 increased by$12.4 million, or 2.2%, as compared to December 31, 2009. Currency effects provided a decrease of approximately $24 million. Backlogat December 31, 2010 included $38.5 million of interdivision backlog (which is eliminated and not included in consolidated backlog asdisclosed above).
Flow Control Division Segment Results
Our second largest business segment is FCD, which designs, manufactures and distributes a broad portfolio of engineered-to-orderand configured-to-order isolation valves, control valves, valve automation products, boiler controls and related services. FCD leveragesits experience and application know-how by offering a complete menu of engineered services to complement its
36
Copyright © 2013 www.secdatabase.com. All Rights Reserved.Please Consider the Environment Before Printing This Document
Table of Contents
expansive product portfolio. FCD has a total of 55 manufacturing facilities and QRCs in 23 countries around the world, with five of its25 manufacturing operations located in the U.S. and 14 located in Europe. Based on independent industry sources, we believe that we arethe fourth largest industrial valve supplier on a global basis.
FCD
2011 2010 2009
(Amounts in millions, except percentages)
Bookings $ 1,603.0 $ 1,306.6 $ 1,198.3Sales 1,473.3 1,197.5 1,203.2Gross profit 511.5 422.3 445.2Gross profit margin 34.7% 35.3% 37.0%Segment operating income 233.3 180.4 204.1Segment operating income as a percentage of sales 15.8% 15.1% 17.0%Backlog (at period end) 759.9 658.5 485.3
As discussed in Note 2 to our consolidated financial statements included in Item 8 of this Annual Report, we acquired forinclusion in FCD, Valbart, a privately-owned Italian valve manufacturer, effective July 16, 2010. Valbart’s results of operations have beenconsolidated since the date of acquisition and are included in FCD’s segment results of operations above. No pro forma information hasbeen provided for the acquisition due to immateriality.
Bookings in 2011 increased $296.4 million, or 22.7%, as compared with 2010. The increase included currency benefits ofapproximately $54 million and increased Valbart bookings of $110.4 million. The increase in bookings was primarily attributable tostrength in the oil and gas industry, primarily in EMA and Asia Pacific, and increased bookings in the chemical and general industries.Increased bookings were partially offset by decreases in the power generation industry due primarily to a slowdown in global nuclearpower projects. Of the $1.6 billion of bookings in 2011, approximately 31% were from oil and gas, 27% from chemical, 27% from generalindustries 14% from power generation and 1% from water management.
Bookings in 2010 increased $108.3 million, or 9.0%, as compared with 2009. The increase included negative currency effectsof approximately $14 million. The overall net increase in bookings was attributable to bookings provided by Valbart of $54.6 million,strength in the oil and gas industry, primarily in EMA and North America, increased bookings in general industries, driven by growthin the district heating market in Russia, and growing aftermarket repair and replacement orders. Inventory restocking orders fromdistributors were a key driver in the North American market recovery. Increased bookings were partially offset by decreases in the powergeneration industry, driven by orders of more than $45 million to supply valves to four Westinghouse Electric Co. nuclear power unitsbooked in the same period in 2009 that did not recur, and customer-driven large project delays in the chemical and oil and gas industries.Of the $1.3 billion of bookings in 2010, approximately 27% were from oil and gas, 27% from chemical, 26% from general industries18% from power generation and 2% from water management.
Sales in 2011 increased $275.8 million, or 23.0%, as compared with 2010. The increase included currency benefits ofapproximately $48 million. Customer sales increased by approximately $172 million (including currency benefits of approximately$39 million) in EMA, reflecting continued recovery in the oil and gas industry and included increased Valbart sales of $74.6 million.Customer sales increased by approximately $50 million in Asia Pacific, $47 million in North America and $10 million in Latin America.
Sales in 2010 decreased $5.7 million, or 0.5%, as compared with 2009. The decrease included negative currency effects ofapproximately $19 million. A decrease in customer sales in EMA of approximately $27 million, which included the impact of customersales provided by Valbart of $38.3 million, was primarily driven by a decline in customer sales in the chemical industry, as well ascustomer-driven delays in large projects in the oil and gas industry. This decrease was partially offset by an increase in customer sales ofapproximately $17 million in Asia Pacific, primarily driven by the nuclear and fossil power markets in China.
Gross profit in 2011 increased by $89.2 million, or 21.1% as compared with 2010. Gross profit margin in 2011 of 34.7% decreasedfrom 35.3% for the same period in 2010. The decrease was attributable to increased material costs, partially offset by increased sales,which favorably impacted our absorption of fixed manufacturing costs, and various CIP initiatives.
Gross profit in 2010 decreased by $22.9 million, or 5.1% as compared with 2009. Gross profit margin in 2010 of 35.3% decreasedfrom 37.0% for the same period in 2009. The decrease was primarily attributable to the negative impact of low margins on acquiredValbart backlog, as well as decreased sales on our absorption of fixed manufacturing costs, partially offset by favorable product mix andincreased savings realized and decreased charges resulting from our Realignment Programs as compared with 2009, as well as variousCIP initiatives and improved utilization of low-cost regions.
Copyright © 2013 www.secdatabase.com. All Rights Reserved.Please Consider the Environment Before Printing This Document

Operating income in 2011 increased by $52.9 million, or 29.3%, as compared with 2010. The increase included currency
37
Copyright © 2013 www.secdatabase.com. All Rights Reserved.Please Consider the Environment Before Printing This Document
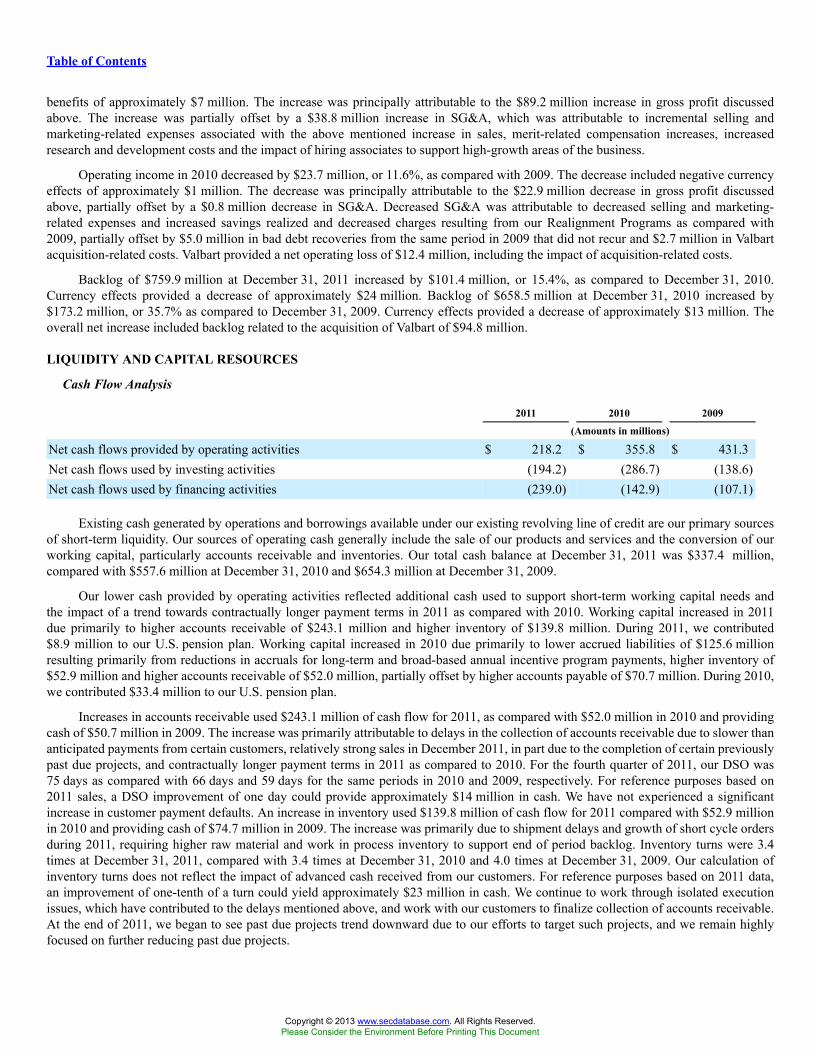
Table of Contents
benefits of approximately $7 million. The increase was principally attributable to the $89.2 million increase in gross profit discussedabove. The increase was partially offset by a $38.8 million increase in SG&A, which was attributable to incremental selling andmarketing-related expenses associated with the above mentioned increase in sales, merit-related compensation increases, increasedresearch and development costs and the impact of hiring associates to support high-growth areas of the business.
Operating income in 2010 decreased by $23.7 million, or 11.6%, as compared with 2009. The decrease included negative currencyeffects of approximately $1 million. The decrease was principally attributable to the $22.9 million decrease in gross profit discussedabove, partially offset by a $0.8 million decrease in SG&A. Decreased SG&A was attributable to decreased selling and marketing-related expenses and increased savings realized and decreased charges resulting from our Realignment Programs as compared with2009, partially offset by $5.0 million in bad debt recoveries from the same period in 2009 that did not recur and $2.7 million in Valbartacquisition-related costs. Valbart provided a net operating loss of $12.4 million, including the impact of acquisition-related costs.
Backlog of $759.9 million at December 31, 2011 increased by $101.4 million, or 15.4%, as compared to December 31, 2010.Currency effects provided a decrease of approximately $24 million. Backlog of $658.5 million at December 31, 2010 increased by$173.2 million, or 35.7% as compared to December 31, 2009. Currency effects provided a decrease of approximately $13 million. Theoverall net increase included backlog related to the acquisition of Valbart of $94.8 million.
LIQUIDITY AND CAPITAL RESOURCES
Cash Flow Analysis
2011 2010 2009
(Amounts in millions)
Net cash flows provided by operating activities $ 218.2 $ 355.8 $ 431.3Net cash flows used by investing activities (194.2) (286.7) (138.6)Net cash flows used by financing activities (239.0) (142.9) (107.1)
Existing cash generated by operations and borrowings available under our existing revolving line of credit are our primary sourcesof short-term liquidity. Our sources of operating cash generally include the sale of our products and services and the conversion of ourworking capital, particularly accounts receivable and inventories. Our total cash balance at December 31, 2011 was $337.4 million,compared with $557.6 million at December 31, 2010 and $654.3 million at December 31, 2009.
Our lower cash provided by operating activities reflected additional cash used to support short-term working capital needs andthe impact of a trend towards contractually longer payment terms in 2011 as compared with 2010. Working capital increased in 2011due primarily to higher accounts receivable of $243.1 million and higher inventory of $139.8 million. During 2011, we contributed$8.9 million to our U.S. pension plan. Working capital increased in 2010 due primarily to lower accrued liabilities of $125.6 millionresulting primarily from reductions in accruals for long-term and broad-based annual incentive program payments, higher inventory of$52.9 million and higher accounts receivable of $52.0 million, partially offset by higher accounts payable of $70.7 million. During 2010,we contributed $33.4 million to our U.S. pension plan.
Increases in accounts receivable used $243.1 million of cash flow for 2011, as compared with $52.0 million in 2010 and providingcash of $50.7 million in 2009. The increase was primarily attributable to delays in the collection of accounts receivable due to slower thananticipated payments from certain customers, relatively strong sales in December 2011, in part due to the completion of certain previouslypast due projects, and contractually longer payment terms in 2011 as compared to 2010. For the fourth quarter of 2011, our DSO was75 days as compared with 66 days and 59 days for the same periods in 2010 and 2009, respectively. For reference purposes based on2011 sales, a DSO improvement of one day could provide approximately $14 million in cash. We have not experienced a significantincrease in customer payment defaults. An increase in inventory used $139.8 million of cash flow for 2011 compared with $52.9 millionin 2010 and providing cash of $74.7 million in 2009. The increase was primarily due to shipment delays and growth of short cycle ordersduring 2011, requiring higher raw material and work in process inventory to support end of period backlog. Inventory turns were 3.4times at December 31, 2011, compared with 3.4 times at December 31, 2010 and 4.0 times at December 31, 2009. Our calculation ofinventory turns does not reflect the impact of advanced cash received from our customers. For reference purposes based on 2011 data,an improvement of one-tenth of a turn could yield approximately $23 million in cash. We continue to work through isolated executionissues, which have contributed to the delays mentioned above, and work with our customers to finalize collection of accounts receivable.At the end of 2011, we began to see past due projects trend downward due to our efforts to target such projects, and we remain highlyfocused on further reducing past due projects.
Copyright © 2013 www.secdatabase.com. All Rights Reserved.Please Consider the Environment Before Printing This Document
Cash outflows for investing activities were $194.2 million, $286.7 million and $138.6 million in 2011, 2010 and 2009, respectively,due primarily to capital expenditures and cash paid for acquisitions. Cash outflows for 2011 included $89.6 million for the acquisition ofLPI, as discussed below in "Payments for Acquisitions." Capital expenditures during 2011 were
38
Copyright © 2013 www.secdatabase.com. All Rights Reserved.Please Consider the Environment Before Printing This Document

Table of Contents
$108.0 million, an increase of $6.0 million as compared with 2010. In 2011, our capital expenditures have been focused on strategicinitiatives to pursue new markets, geographic expansion, enterprise resource planning application upgrades, information technologyinfrastructure and cost reduction opportunities.
Cash outflows for financing activities were $239.0 million in 2011 compared with $142.9 million in 2010 and $107.1 millionin 2009. Cash outflows during 2011 resulted primarily from the repurchase of $150.0 million of our common stock, payment of$69.6 million in dividends and $25.0 million of payments on long-term debt. Cash outflows during 2010 resulted primarily from thepayment of $63.6 million in dividends, $46.0 million for the repurchase of our common stock and approximately $40 million to liquidatedebt in completing a new credit agreement in December 2010.
On February 21, 2011, our Board of Directors authorized an increase in the payment of quarterly dividends on our common stockfrom $0.29 per share to $0.32 per share payable quarterly beginning on April 14, 2011. On February 20, 2012, our Board of Directorsauthorized an increase in the payment of quarterly dividends on our common stock from $0.32 per share to $0.36 per share payablequarterly beginning on April 13, 2012. Generally, our dividend date-of-record is in the last month of the quarter, and the dividend is paidthe following month.
On February 27, 2008, our Board of Directors announced the approval of a program to repurchase up to $300.0 million of ouroutstanding common stock, which concluded in the fourth quarter of 2011. On September 12, 2011, our Board of Directors announcedthe approval of a new program to repurchase up to $300.0 million of our outstanding common stock over an unspecified time period. Werepurchased $7.3 million and $101.6 million of our common stock under the old and new programs, respectively, in the fourth quarterof 2011. On December 15, 2011, we announced that the Board of Directors approved the replenishment of the new $300.0 million sharerepurchase program, providing the full $300.0 million in remaining authorized repurchase capacity at December 31, 2011. Our sharerepurchase program does not have an expiration date, and we reserve the right to limit or terminate the repurchase program at any timewithout notice.
We repurchased 1,482,833, 450,000 and 544,500 shares for $150.0 million, $46.0 million and $40.9 million during 2011, 2010 and2009, respectively. To date, we have repurchased a total of 4,218,433 shares for $401.9 million under these programs.
On December 15, 2011, we announced that our Board of Directors endorsed a policy of annually returning to our shareholders 40%to 50% of our running two-year average net earnings in the form of quarterly dividends or stock repurchases. While we intend to adhereto this policy for the foreseeable future, any future returns of cash, whether through any combination of dividends or share repurchases,will be reviewed individually, declared by our Board of Directors and implemented by management at its discretion, depending on ourfinancial condition, business opportunities at the time and market conditions.
Our cash needs for the next 12 months are expected to be consistent with 2011, resulting from the impact of anticipated sharerepurchases, an expected improvement in working capital utilization and a small decrease in incentive compensation payments, offset byanticipated increases in pension contributions, capital expenditures and cash dividends. We believe cash flows from operating activities,combined with availability under our revolving line of credit and our existing cash balances, will be sufficient to enable us to meet ourcash flow needs for the next 12 months. However, cash flows from operations could be adversely affected by a decrease in the rate ofgeneral global economic growth, as well as economic, political and other risks associated with sales of our products, operational factors,competition, regulatory actions, fluctuations in foreign currency exchange rates and fluctuations in interest rates, among other factors. Webelieve that cash flows from operating activities and our expectation of continuing availability to draw upon our credit agreements arealso sufficient to meet our cash flow needs for periods beyond the next 12 months.
Payments for Acquisitions
We regularly evaluate acquisition opportunities of various sizes. The cost and terms of any financing to be raised in conjunctionwith any acquisition, including our ability to raise economical capital, is a critical consideration in any such evaluation.
As discussed in Note 2 to our consolidated financial statements included in Item 8 of this Annual Report, effective October 28,2011, we acquired for inclusion in EPD, 100% of LPI, a privately-owned, U.S.-based pump manufacturer, in a share purchase for cash of$89.6 million, subject to final adjustments. LPI specializes in the design, development and manufacture of engineered centrifugal slurrypumps for critical services within the petroleum refining, petrochemical, pulp and paper and energy markets.
Effective July 16, 2010, we acquired for inclusion in FCD, 100% of Valbart, a privately-owned Italian valve manufacturer, in ashare purchase for cash of $199.4 million, which included $33.8 million of existing Valbart net debt (defined as Valbart’s third party debtless cash on hand) that was repaid at closing.
39
Copyright © 2013 www.secdatabase.com. All Rights Reserved.Please Consider the Environment Before Printing This Document
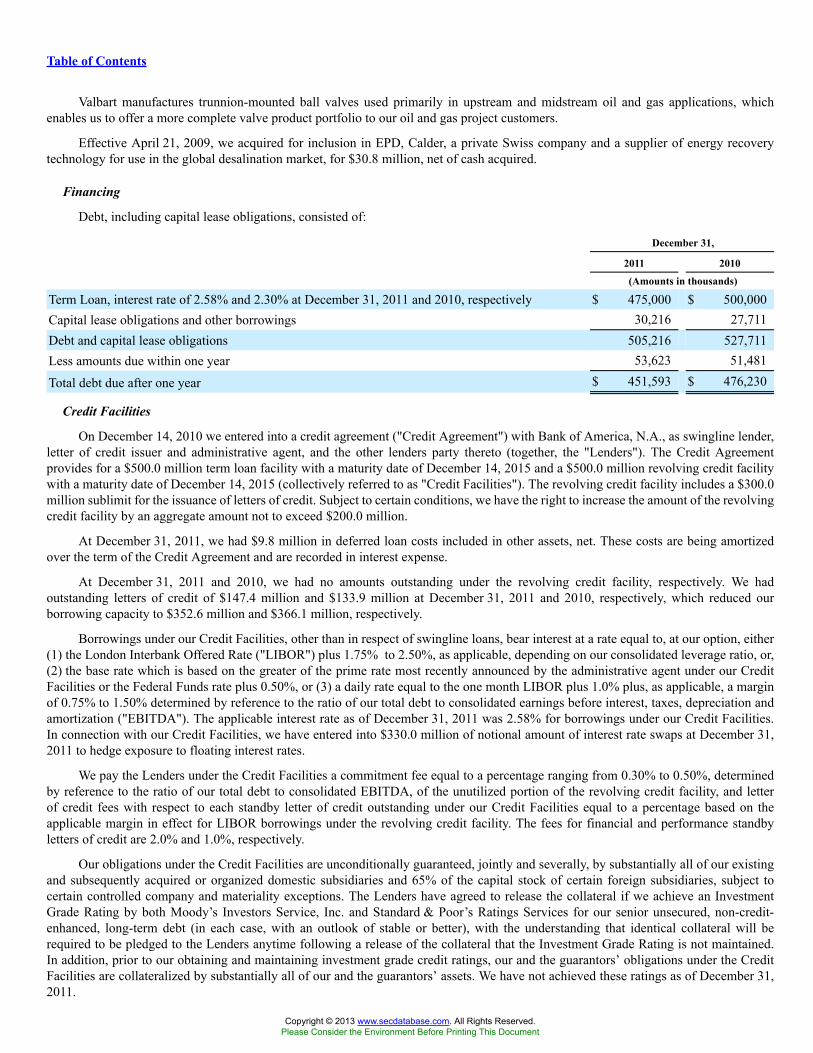
Table of Contents
Valbart manufactures trunnion-mounted ball valves used primarily in upstream and midstream oil and gas applications, whichenables us to offer a more complete valve product portfolio to our oil and gas project customers.
Effective April 21, 2009, we acquired for inclusion in EPD, Calder, a private Swiss company and a supplier of energy recoverytechnology for use in the global desalination market, for $30.8 million, net of cash acquired.
Financing
Debt, including capital lease obligations, consisted of:
December 31,
2011 2010
(Amounts in thousands)
Term Loan, interest rate of 2.58% and 2.30% at December 31, 2011 and 2010, respectively $ 475,000 $ 500,000Capital lease obligations and other borrowings 30,216 27,711Debt and capital lease obligations 505,216 527,711Less amounts due within one year 53,623 51,481
Total debt due after one year $ 451,593 $ 476,230
Credit Facilities
On December 14, 2010 we entered into a credit agreement ("Credit Agreement") with Bank of America, N.A., as swingline lender,letter of credit issuer and administrative agent, and the other lenders party thereto (together, the "Lenders"). The Credit Agreementprovides for a $500.0 million term loan facility with a maturity date of December 14, 2015 and a $500.0 million revolving credit facilitywith a maturity date of December 14, 2015 (collectively referred to as "Credit Facilities"). The revolving credit facility includes a $300.0million sublimit for the issuance of letters of credit. Subject to certain conditions, we have the right to increase the amount of the revolvingcredit facility by an aggregate amount not to exceed $200.0 million.
At December 31, 2011, we had $9.8 million in deferred loan costs included in other assets, net. These costs are being amortizedover the term of the Credit Agreement and are recorded in interest expense.
At December 31, 2011 and 2010, we had no amounts outstanding under the revolving credit facility, respectively. We hadoutstanding letters of credit of $147.4 million and $133.9 million at December 31, 2011 and 2010, respectively, which reduced ourborrowing capacity to $352.6 million and $366.1 million, respectively.
Borrowings under our Credit Facilities, other than in respect of swingline loans, bear interest at a rate equal to, at our option, either(1) the London Interbank Offered Rate ("LIBOR") plus 1.75% to 2.50%, as applicable, depending on our consolidated leverage ratio, or,(2) the base rate which is based on the greater of the prime rate most recently announced by the administrative agent under our CreditFacilities or the Federal Funds rate plus 0.50%, or (3) a daily rate equal to the one month LIBOR plus 1.0% plus, as applicable, a marginof 0.75% to 1.50% determined by reference to the ratio of our total debt to consolidated earnings before interest, taxes, depreciation andamortization ("EBITDA"). The applicable interest rate as of December 31, 2011 was 2.58% for borrowings under our Credit Facilities.In connection with our Credit Facilities, we have entered into $330.0 million of notional amount of interest rate swaps at December 31,2011 to hedge exposure to floating interest rates.
We pay the Lenders under the Credit Facilities a commitment fee equal to a percentage ranging from 0.30% to 0.50%, determinedby reference to the ratio of our total debt to consolidated EBITDA, of the unutilized portion of the revolving credit facility, and letterof credit fees with respect to each standby letter of credit outstanding under our Credit Facilities equal to a percentage based on theapplicable margin in effect for LIBOR borrowings under the revolving credit facility. The fees for financial and performance standbyletters of credit are 2.0% and 1.0%, respectively.
Our obligations under the Credit Facilities are unconditionally guaranteed, jointly and severally, by substantially all of our existingand subsequently acquired or organized domestic subsidiaries and 65% of the capital stock of certain foreign subsidiaries, subject tocertain controlled company and materiality exceptions. The Lenders have agreed to release the collateral if we achieve an InvestmentGrade Rating by both Moody’s Investors Service, Inc. and Standard & Poor’s Ratings Services for our senior unsecured, non-credit-enhanced, long-term debt (in each case, with an outlook of stable or better), with the understanding that identical collateral will berequired to be pledged to the Lenders anytime following a release of the collateral that the Investment Grade Rating is not maintained.In addition, prior to our obtaining and maintaining investment grade credit ratings, our and the guarantors’ obligations under the CreditFacilities are collateralized by substantially all of our and the guarantors’ assets. We have not achieved these ratings as of December 31,2011.
Copyright © 2013 www.secdatabase.com. All Rights Reserved.Please Consider the Environment Before Printing This Document

40
Copyright © 2013 www.secdatabase.com. All Rights Reserved.Please Consider the Environment Before Printing This Document
Table of Contents
European Letter of Credit Facilities
On October 30, 2009, we entered into a new 364-day unsecured European Letter of Credit Facility (“New European LOC Facility”)with an initial commitment of €125.0 million. The New European LOC Facility is renewable annually and, consistent with our previousEuropean Letter of Credit Facility ("Old European LOC Facility"), is used for contingent obligations in respect of surety and performancebonds, bank guarantees and similar obligations with maturities up to five years. We renewed the New European LOC Facility in October2011 consistent with its terms for an additional 364-day period. We pay fees between 1.10% and 1.35% for utilized capacity and 0.40%for unutilized capacity under our New European LOC Facility. We had outstanding letters of credit drawn on the New European LOCFacility of €81.0 million ($105.0 million) and €55.7 million ($74.5 million) as of December 31, 2011 and 2010, respectively.
Our ability to issue additional letters of credit under our Old European LOC Facility, which had a commitment of €110.0 million,expired November 9, 2009. We paid annual and fronting fees of 0.875% and 0.10%, respectively, for letters of credit written against theOld European LOC Facility. We had outstanding letters of credit written against the Old European LOC Facility of €12.2 million ($15.8million) and €33.3 million ($44.5 million) as of December 31, 2011 and 2010, respectively.
Certain banks are parties to both facilities and are managing their exposures on an aggregated basis. As such, the commitment underthe New European LOC Facility is reduced by the face amount of existing letters of credit written against the Old European LOC Facilityprior to its expiration. These existing letters of credit will remain outstanding, and accordingly offset the €125.0 million capacity of theNew European LOC Facility until their maturity, which, as of December 31, 2011, was approximately one year for the majority of theoutstanding existing letters of credit. After consideration of outstanding commitments under both facilities, the available capacity underthe New European LOC Facility was €116.7 million as of December 31, 2011, of which €81.0 million has been utilized.
Debt Prepayments and Repayments
We made total scheduled repayments under our current Credit Agreement and previous credit agreement of $25.0 million, $4.3million, and $5.7 million in 2011, 2010 and 2009, respectively. We made no mandatory repayments or optional prepayments in 2011, 2010or 2009, with the exception of the proceeds advanced under the term loan facility of our Credit Agreement, along with approximately$40 million of cash on hand that were used to repay all previously outstanding indebtedness under our previous credit agreement, whichincluded a $600.0 million term loan and $400.0 million revolving line of credit.
We may prepay loans under our Credit Facilities in whole or in part, without premium or penalty, at any time.
Debt Covenants and Other Matters
Our Credit Agreement contains, among other things, covenants defining our and our subsidiaries’ ability to dispose of assets,merge, pay dividends, repurchase or redeem capital stock and indebtedness, incur indebtedness and guarantees, create liens, enter intoagreements with negative pledge clauses, make certain investments or acquisitions, enter into transactions with affiliates or engage in anybusiness activity other than our existing business. Our Credit Agreement also contains covenants requiring us to deliver to lenders ourleverage and interest coverage financial covenant certificates of compliance. The maximum permitted leverage ratio is 3.25 times debt tototal consolidated EBITDA. The minimum interest coverage is 3.25 times consolidated EBITDA to total interest expense. Compliancewith these financial covenants under our Credit Agreement is tested quarterly. We complied with the covenants through December 31,2011.
Our Credit Agreement includes customary events of default, including nonpayment of principal or interest, violation of covenants,incorrectness of representations and warranties, cross defaults and cross acceleration, bankruptcy, material judgments, EmployeeRetirement Income Security Act of 1974, as amended ("ERISA"), events, actual or asserted invalidity of the guarantees or the securitydocuments, and certain changes of control of our company. The occurrence of any event of default could result in the acceleration of ourand the guarantors’ obligations under the Credit Facilities.
Our European letter of credit facilities contain covenants restricting the ability of certain foreign subsidiaries to issue debt, incurliens, sell assets, merge, consolidate, make certain investments, pay dividends, enter into agreements with negative pledge clauses orengage in any business activity other than our existing business. The European letter of credit facilities also incorporate by reference thecovenants contained in our Credit Facilities.
Our European letter of credit facilities include events of default usual for these types of letter of credit facilities, includingnonpayment of any fee or obligation, violation of covenants, incorrectness of representations and warranties, cross defaults and crossacceleration, bankruptcy, material judgments, ERISA events, actual or asserted invalidity of the guarantees and certain changes of controlof our company. The occurrence of any event of default could result in the termination of the commitments and an acceleration of ourobligations under the European letter of credit facilities. We complied with all covenants under our European letter of credit facilitiesthrough December 31, 2011.
Copyright © 2013 www.secdatabase.com. All Rights Reserved.Please Consider the Environment Before Printing This Document

41
Copyright © 2013 www.secdatabase.com. All Rights Reserved.Please Consider the Environment Before Printing This Document

Table of Contents
Liquidity Analysis
Our cash balance decreased by $220.2 million to $337.4 million as of December 31, 2011 as compared with December 31, 2010.The cash usage included the funding of increased working capital requirements, reductions in advanced cash received from customers,$150.0 million of share repurchases, $108.0 million in capital expenditures, the acquisition of LPI for $89.6 million and $69.6 million individend payments. We monitor the depository institutions that hold our cash and cash equivalents on a regular basis, and we believe thatwe have placed our deposits with creditworthy financial institutions.
Approximately 5% of our term loan is due to mature in 2012 and approximately 11% in 2013. As noted above, our term loan and ourrevolving line of credit both mature in December 2015. After the effects of $330.0 million of notional interest rate swaps, approximately70% of our term debt was at fixed rates at December 31, 2011. As of December 31, 2011, we had a borrowing capacity of $352.6 millionon our $500.0 million revolving line of credit (due to outstanding letters of credit), and we had net available capacity under the NewEuropean LOC Facility of €35.7 million. Our Credit Facilities and our New European LOC Facility are committed and are held by adiversified group of financial institutions.
At December 31, 2011 and 2010, as a result of increases in values of the plan’s assets and our contributions to the plan, ourU.S. pension plan was fully funded as defined by applicable law. After consideration of our intent to maintain fully funded status, wecontributed $8.9 million to our U.S. pension plan in 2011, excluding direct benefits paid. We continue to maintain an asset allocationconsistent with our strategy to maximize total return, while reducing portfolio risks through asset class diversification.
At December 31, 2011, $188.4 million of our total cash balance of $337.4 million was held by foreign subsidiaries, $149.9 millionof which we consider permanently reinvested outside the U.S. Based on the expected 2012 liquidity needs of our various geographies, wecurrently do not anticipate the need to repatriate any permanently reinvested cash to fund domestic operations that would generate adversetax results. However, in the event this cash is needed to fund domestic operations, we estimate the $149.9 million could be repatriatedwithout resulting in a material U.S. tax liability.
At December 31, 2011, we had no direct investments in European sovereign or non-sovereign debt. However, certain of our definedbenefit plans hold investments in European equity and fixed income securities as discussed in Note 12 to our consolidated financialstatements included in Item 8 of this Annual Report. Other than broad, macro-level economic impacts, we did not experience any director measurable disruptions in 2011 due to the European sovereign debt crisis. We will continue to monitor and evaluate the impact of anyfuture developments in the region on our current business, our customers and suppliers and the state of the global economy. Additionaladverse developments could potentially impact our customers’ exposures to sovereign and non-sovereign European debt and could softenthe level of capital investment and demand for our products and services.
OUTLOOK FOR 2012
Our future results of operations and other forward-looking statements contained in this Annual Report, including this MD&A,involve a number of risks and uncertainties — in particular, the statements regarding our goals and strategies, new product introductions,plans to cultivate new businesses, future economic conditions, revenue, pricing, gross profit margin and costs, capital spending,depreciation and amortization, research and development expenses, potential impairment of investments, tax rate and pending tax andlegal proceedings. Our future results of operations may also be affected by the amount, type and valuation of share-based awards granted,as well as the amount of awards forfeited due to employee turnover. In addition to the various important factors discussed above, a numberof other factors could cause actual results to differ materially from our expectations. See the risks described in "Item 1A. Risk Factors"of this Annual Report.
Our bookings increased 10.2% in 2011 as compared with 2010, and our backlog at December 31, 2011 increased 3.7% as comparedto December 31, 2010, which is expected to generate increased revenue in 2012 as compared with 2011, excluding the impact of currencyfluctuations. Because a booking represents a contract that can be, in certain circumstances, modified or canceled, and can include varyinglengths between the time of booking and the time of revenue recognition, there is no guarantee that the increase in bookings will result ina comparable increase in revenues or otherwise be indicative of future results.
We expect a continued competitive economic environment in 2012; however, we anticipate benefits from planned increases inshipments from existing backlog, the continuation of our end user strategy, the strength of our high margin aftermarket business,continued disciplined cost management and our diverse customer base, broad product portfolio and unified operating platform. During thefirst half of 2012, we expect our results to be impacted by our efforts to further reduce our past due backlog and some large, low marginlate project shipments, as well as a reduced level of aftermarket shipments as compared to the fourth quarter of 2011. This is expected toresult in our 2012 performance being weighted towards the second half of the year. While we believe that our primary markets continueto provide opportunities, as evidenced by eight consecutive quarters of over $1 billion in bookings and the year-over-year increase in
Copyright © 2013 www.secdatabase.com. All Rights Reserved.Please Consider the Environment Before Printing This Document

our backlog, we remain cautious in our outlook for 2012 given the continuing uncertainty of global economic conditions. For additionaldiscussion on our markets and our opportunities, see the "Business Overview — Our Markets" section of this MD&A.
42
Copyright © 2013 www.secdatabase.com. All Rights Reserved.Please Consider the Environment Before Printing This Document
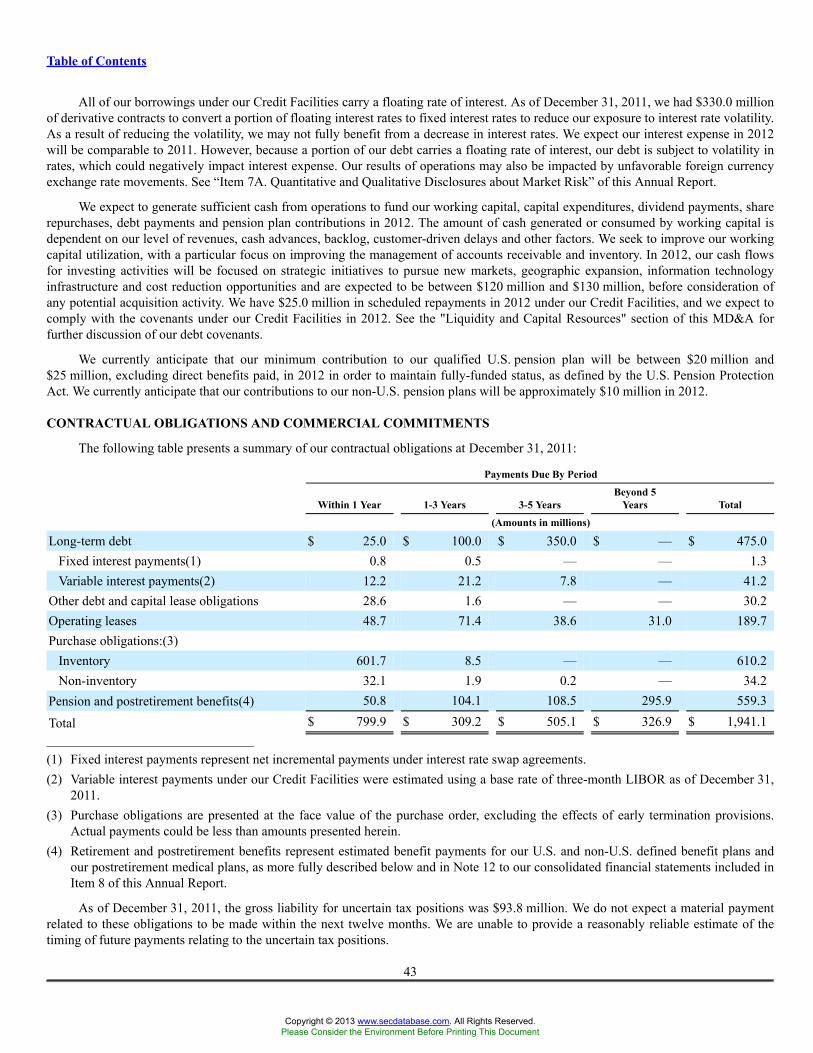
Table of Contents
All of our borrowings under our Credit Facilities carry a floating rate of interest. As of December 31, 2011, we had $330.0 millionof derivative contracts to convert a portion of floating interest rates to fixed interest rates to reduce our exposure to interest rate volatility.As a result of reducing the volatility, we may not fully benefit from a decrease in interest rates. We expect our interest expense in 2012will be comparable to 2011. However, because a portion of our debt carries a floating rate of interest, our debt is subject to volatility inrates, which could negatively impact interest expense. Our results of operations may also be impacted by unfavorable foreign currencyexchange rate movements. See “Item 7A. Quantitative and Qualitative Disclosures about Market Risk” of this Annual Report.
We expect to generate sufficient cash from operations to fund our working capital, capital expenditures, dividend payments, sharerepurchases, debt payments and pension plan contributions in 2012. The amount of cash generated or consumed by working capital isdependent on our level of revenues, cash advances, backlog, customer-driven delays and other factors. We seek to improve our workingcapital utilization, with a particular focus on improving the management of accounts receivable and inventory. In 2012, our cash flowsfor investing activities will be focused on strategic initiatives to pursue new markets, geographic expansion, information technologyinfrastructure and cost reduction opportunities and are expected to be between $120 million and $130 million, before consideration ofany potential acquisition activity. We have $25.0 million in scheduled repayments in 2012 under our Credit Facilities, and we expect tocomply with the covenants under our Credit Facilities in 2012. See the "Liquidity and Capital Resources" section of this MD&A forfurther discussion of our debt covenants.
We currently anticipate that our minimum contribution to our qualified U.S. pension plan will be between $20 million and$25 million, excluding direct benefits paid, in 2012 in order to maintain fully-funded status, as defined by the U.S. Pension ProtectionAct. We currently anticipate that our contributions to our non-U.S. pension plans will be approximately $10 million in 2012.
CONTRACTUAL OBLIGATIONS AND COMMERCIAL COMMITMENTS
The following table presents a summary of our contractual obligations at December 31, 2011:
Payments Due By Period
Within 1 Year 1-3 Years 3-5 YearsBeyond 5
Years Total
(Amounts in millions)
Long-term debt $ 25.0 $ 100.0 $ 350.0 $ — $ 475.0Fixed interest payments(1) 0.8 0.5 — — 1.3Variable interest payments(2) 12.2 21.2 7.8 — 41.2
Other debt and capital lease obligations 28.6 1.6 — — 30.2Operating leases 48.7 71.4 38.6 31.0 189.7Purchase obligations:(3)
Inventory 601.7 8.5 — — 610.2Non-inventory 32.1 1.9 0.2 — 34.2
Pension and postretirement benefits(4) 50.8 104.1 108.5 295.9 559.3
Total $ 799.9 $ 309.2 $ 505.1 $ 326.9 $ 1,941.1_______________________________________
(1) Fixed interest payments represent net incremental payments under interest rate swap agreements.(2) Variable interest payments under our Credit Facilities were estimated using a base rate of three-month LIBOR as of December 31,
2011.(3) Purchase obligations are presented at the face value of the purchase order, excluding the effects of early termination provisions.
Actual payments could be less than amounts presented herein.(4) Retirement and postretirement benefits represent estimated benefit payments for our U.S. and non-U.S. defined benefit plans and
our postretirement medical plans, as more fully described below and in Note 12 to our consolidated financial statements included inItem 8 of this Annual Report.
As of December 31, 2011, the gross liability for uncertain tax positions was $93.8 million. We do not expect a material paymentrelated to these obligations to be made within the next twelve months. We are unable to provide a reasonably reliable estimate of thetiming of future payments relating to the uncertain tax positions.
43
Copyright © 2013 www.secdatabase.com. All Rights Reserved.Please Consider the Environment Before Printing This Document
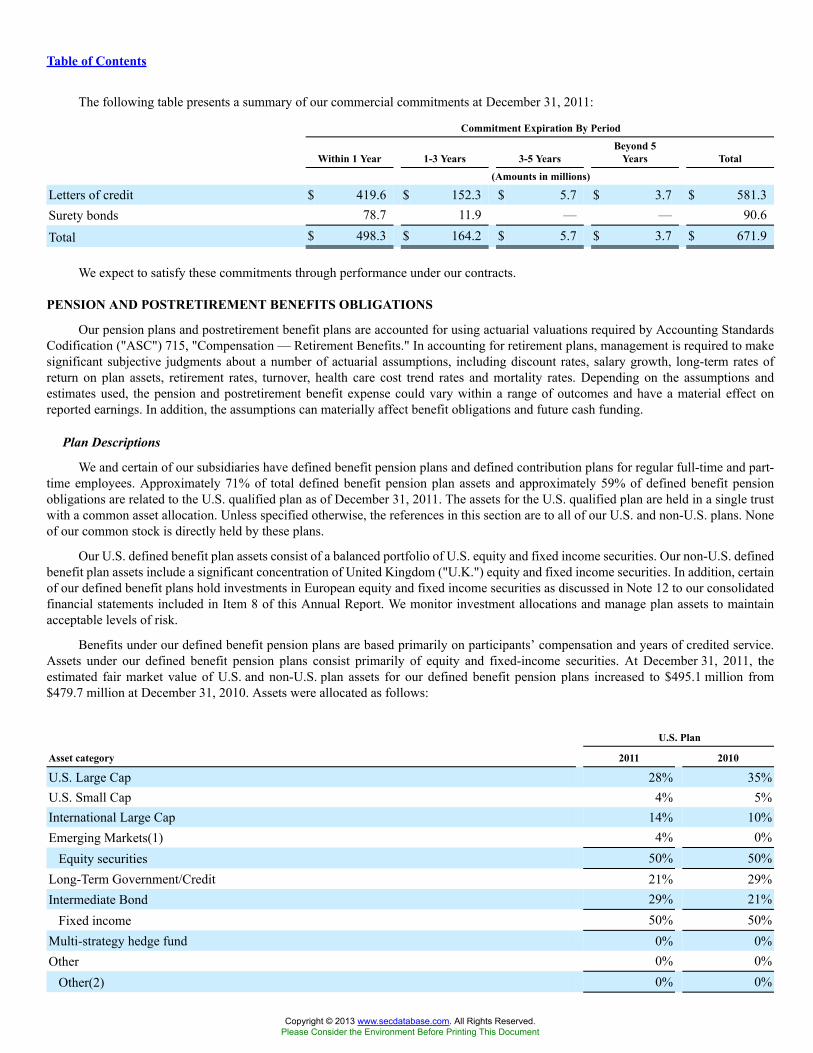
Table of Contents
The following table presents a summary of our commercial commitments at December 31, 2011:
Commitment Expiration By Period
Within 1 Year 1-3 Years 3-5 YearsBeyond 5
Years Total
(Amounts in millions)
Letters of credit $ 419.6 $ 152.3 $ 5.7 $ 3.7 $ 581.3Surety bonds 78.7 11.9 — — 90.6
Total $ 498.3 $ 164.2 $ 5.7 $ 3.7 $ 671.9
We expect to satisfy these commitments through performance under our contracts.
PENSION AND POSTRETIREMENT BENEFITS OBLIGATIONS
Our pension plans and postretirement benefit plans are accounted for using actuarial valuations required by Accounting StandardsCodification ("ASC") 715, "Compensation — Retirement Benefits." In accounting for retirement plans, management is required to makesignificant subjective judgments about a number of actuarial assumptions, including discount rates, salary growth, long-term rates ofreturn on plan assets, retirement rates, turnover, health care cost trend rates and mortality rates. Depending on the assumptions andestimates used, the pension and postretirement benefit expense could vary within a range of outcomes and have a material effect onreported earnings. In addition, the assumptions can materially affect benefit obligations and future cash funding.
Plan Descriptions
We and certain of our subsidiaries have defined benefit pension plans and defined contribution plans for regular full-time and part-time employees. Approximately 71% of total defined benefit pension plan assets and approximately 59% of defined benefit pensionobligations are related to the U.S. qualified plan as of December 31, 2011. The assets for the U.S. qualified plan are held in a single trustwith a common asset allocation. Unless specified otherwise, the references in this section are to all of our U.S. and non-U.S. plans. Noneof our common stock is directly held by these plans.
Our U.S. defined benefit plan assets consist of a balanced portfolio of U.S. equity and fixed income securities. Our non-U.S. definedbenefit plan assets include a significant concentration of United Kingdom ("U.K.") equity and fixed income securities. In addition, certainof our defined benefit plans hold investments in European equity and fixed income securities as discussed in Note 12 to our consolidatedfinancial statements included in Item 8 of this Annual Report. We monitor investment allocations and manage plan assets to maintainacceptable levels of risk.
Benefits under our defined benefit pension plans are based primarily on participants’ compensation and years of credited service.Assets under our defined benefit pension plans consist primarily of equity and fixed-income securities. At December 31, 2011, theestimated fair market value of U.S. and non-U.S. plan assets for our defined benefit pension plans increased to $495.1 million from$479.7 million at December 31, 2010. Assets were allocated as follows:
U.S. Plan
Asset category 2011 2010
U.S. Large Cap 28% 35%U.S. Small Cap 4% 5%International Large Cap 14% 10%Emerging Markets(1) 4% 0%
Equity securities 50% 50%Long-Term Government/Credit 21% 29%Intermediate Bond 29% 21%
Fixed income 50% 50%Multi-strategy hedge fund 0% 0%Other 0% 0%
Other(2) 0% 0%
Copyright © 2013 www.secdatabase.com. All Rights Reserved.Please Consider the Environment Before Printing This Document
_______________________________________
(1) Less than 1% of holdings are in Emerging Markets category in 2010.(2) Less than 1% of holdings are in Other category in 2011 and 2010.
44
Copyright © 2013 www.secdatabase.com. All Rights Reserved.Please Consider the Environment Before Printing This Document

Table of Contents
Non-U.S. Plans
Asset category 2011 2010
North American Companies 5% 5%U.K. Companies 20% 26%European Companies 6% 7%Asian Pacific Companies 5% 6%Global Equity 1% 3%Emerging Markets(1) 0% 0%
Equity securities 37% 47%U.K. Government Gilt Index 21% 18%U.K. Corporate Bond Index 17% 15%Global Fixed Income Bond 23% 18%
Fixed income 61% 51%Other 2% 2%
_______________________________________
(1) Less than 1% of holdings are in the Emerging Markets category in 2010.
The projected benefit obligation ("Benefit Obligation") for our defined benefit pension plans was $658.8 million and $625.7 millionas of December 31, 2011 and 2010, respectively.
The estimated prior service benefit for the defined benefit pension plans that will be amortized from accumulated othercomprehensive loss into net pension expense in 2012 is $1.2 million. The estimated actuarial net loss for the defined benefit pensionplans that will be amortized from accumulated other comprehensive loss into net pension expense in 2012 is $16.1 million. We amortizeestimated prior service benefits and estimated net losses over the remaining expected service period or over the remaining expectedlifetime for plans with only inactive participants.
We sponsor defined benefit postretirement medical plans covering certain current retirees and a limited number of future retireesin the U.S. These plans provide for medical and dental benefits and are administered through insurance companies. We fund the plansas benefits are paid, such that the plans hold no assets in any period presented. Accordingly, we have no investment strategy or targetedallocations for plan assets. The benefits under the plans are not available to new employees or most existing employees.
The Benefit Obligation for our defined benefit postretirement medical plans was $35.0 million and $39.1 million as ofDecember 31, 2011 and 2010, respectively. The estimated prior service benefit for the defined benefit postretirement medical plans thatwill be amortized from accumulated other comprehensive loss into net pension expense in 2012 is less than $0.1 million. The estimatedactuarial net gain for the defined benefit postretirement medical plans that will be amortized from accumulated other comprehensive lossinto net pension expense in 2012 is $2.0 million. We amortize estimated prior service benefits and estimated net gain over the remainingexpected service period of approximately three years.
Accrual Accounting and Significant Assumptions
We account for pension benefits using the accrual method, recognizing pension expense before the payment of benefits to retirees.The accrual method of accounting for pension benefits requires actuarial assumptions concerning future events that will determine theamount and timing of the benefit payments.
Our key assumptions used in calculating our cost of pension benefits are the discount rate, the rate of compensation increase and theexpected long-term rate of return on plan assets. We, in consultation with our actuaries, evaluate the key actuarial assumptions and otherassumptions used in calculating the cost of pension and postretirement benefits, such as discount rates, expected return on plan assetsfor funded plans, mortality rates, retirement rates and assumed rate of compensation increases, and determine such assumptions as ofDecember 31 of each year to calculate liability information as of that date and pension and postretirement expense for the following year.Depending on the assumptions used, the pension and postretirement expense could vary within a range of outcomes and have a materialeffect on reported earnings. In addition, the assumptions can materially affect Benefit Obligations and future cash funding. Actual results
Copyright © 2013 www.secdatabase.com. All Rights Reserved.Please Consider the Environment Before Printing This Document

in any given year may differ from those estimated because of economic and other factors. See discussion of our assumptions related topension and postretirement benefits in the “Our Critical Accounting Estimates” section of this MD&A.
45
Copyright © 2013 www.secdatabase.com. All Rights Reserved.Please Consider the Environment Before Printing This Document
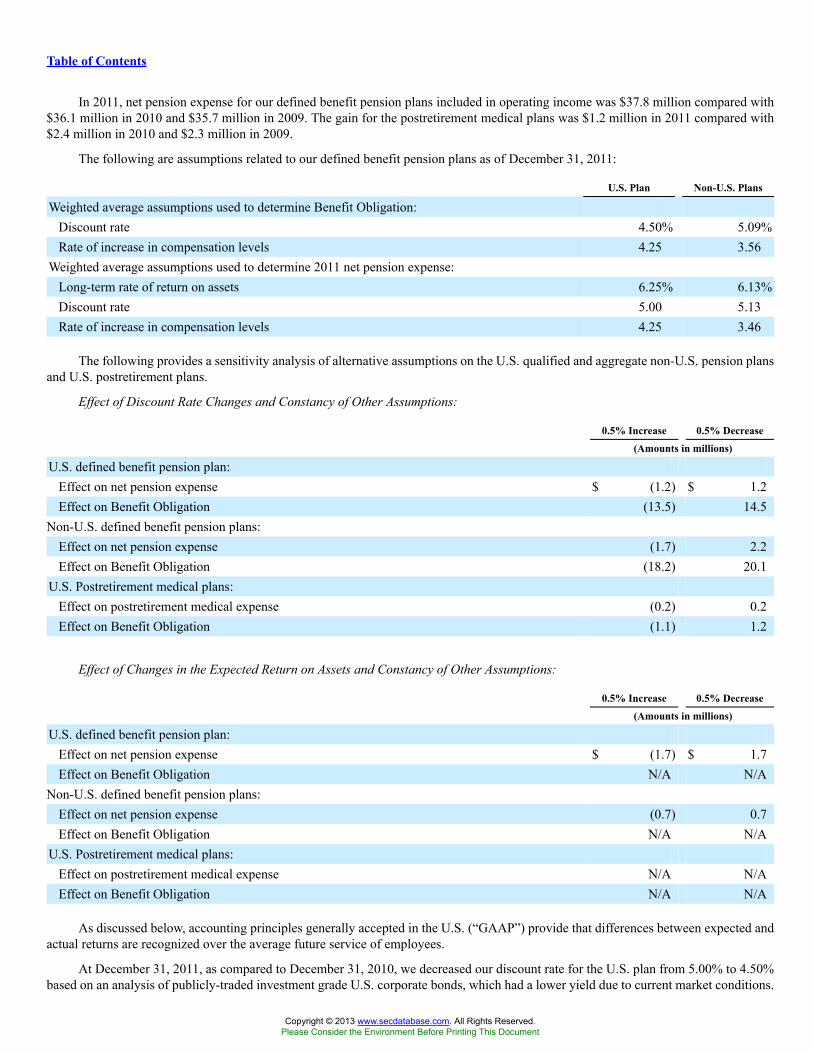
Table of Contents
In 2011, net pension expense for our defined benefit pension plans included in operating income was $37.8 million compared with$36.1 million in 2010 and $35.7 million in 2009. The gain for the postretirement medical plans was $1.2 million in 2011 compared with$2.4 million in 2010 and $2.3 million in 2009.
The following are assumptions related to our defined benefit pension plans as of December 31, 2011:
U.S. Plan Non-U.S. Plans
Weighted average assumptions used to determine Benefit Obligation:Discount rate 4.50% 5.09%Rate of increase in compensation levels 4.25 3.56
Weighted average assumptions used to determine 2011 net pension expense:Long-term rate of return on assets 6.25% 6.13%Discount rate 5.00 5.13Rate of increase in compensation levels 4.25 3.46
The following provides a sensitivity analysis of alternative assumptions on the U.S. qualified and aggregate non-U.S. pension plansand U.S. postretirement plans.
Effect of Discount Rate Changes and Constancy of Other Assumptions:
0.5% Increase 0.5% Decrease
(Amounts in millions)
U.S. defined benefit pension plan:Effect on net pension expense $ (1.2) $ 1.2Effect on Benefit Obligation (13.5) 14.5
Non-U.S. defined benefit pension plans:Effect on net pension expense (1.7) 2.2Effect on Benefit Obligation (18.2) 20.1
U.S. Postretirement medical plans:Effect on postretirement medical expense (0.2) 0.2Effect on Benefit Obligation (1.1) 1.2
Effect of Changes in the Expected Return on Assets and Constancy of Other Assumptions:
0.5% Increase 0.5% Decrease
(Amounts in millions)
U.S. defined benefit pension plan:Effect on net pension expense $ (1.7) $ 1.7Effect on Benefit Obligation N/A N/A
Non-U.S. defined benefit pension plans:Effect on net pension expense (0.7) 0.7Effect on Benefit Obligation N/A N/A
U.S. Postretirement medical plans:Effect on postretirement medical expense N/A N/AEffect on Benefit Obligation N/A N/A
As discussed below, accounting principles generally accepted in the U.S. (“GAAP”) provide that differences between expected andactual returns are recognized over the average future service of employees.
At December 31, 2011, as compared to December 31, 2010, we decreased our discount rate for the U.S. plan from 5.00% to 4.50%based on an analysis of publicly-traded investment grade U.S. corporate bonds, which had a lower yield due to current market conditions.
Copyright © 2013 www.secdatabase.com. All Rights Reserved.Please Consider the Environment Before Printing This Document
We decreased our average discount rate for non-U.S. plans from 5.13% to 5.09% based primarily on lower applicable corporate AA-graded bond yields for the U.K., partially offset by higher corporate AA-graded bond yields for the Euro zone. The average assumed rateof compensation remained constant at 4.25% for the U.S. plan and increased from 3.46% to 3.56% for our non-U.S. plans. To determinethe 2011 pension expense, we decreased the expected rate of return on U.S. plan assets from
46
Copyright © 2013 www.secdatabase.com. All Rights Reserved.Please Consider the Environment Before Printing This Document

Table of Contents
7.00% to 6.25% and we decreased our average rate of return on non-U.S. plan assets from 6.21% to 6.13%, primarily as a result of thedecrease in the U.K. rate of return on assets. As the expected rate of return on plan assets is long-term in nature, short-term marketchanges do not significantly impact the rates.
We expect that the net pension expense for our defined benefit pension plans included in earnings before income taxes will beapproximately $3 million higher in 2012 than the $37.8 million in 2011, reflecting, among other things, the increased amortization ofthe actuarial net loss. We expect the 2012 net pension benefit for the postretirement medical plans to be $0.6 million lower than the$1.2 million in 2011, primarily reflecting decreased amortization of the unrecognized prior service benefit.
We have used discount rates of 4.50%, 5.09% and 4.25% at December 31, 2011, in calculating our estimated 2012 net pensionexpense for U.S. pension plans, non-U.S. pension plans and other postretirement plans, respectively.
The assumed ranges for the annual rates of increase in health care costs were 8.5% for 2011, 9.0% for 2010 and 9.0% for 2009, witha gradual decrease to 5.0% for 2032 and future years. If actual costs are higher than those assumed, this will likely put modest upwardpressure on our expense for retiree health care.
Plan Funding
Our funding policy for defined benefit plans is to contribute at least the amounts required under applicable laws and local customs.We contributed $27.0 million, $50.2 million and $101.2 million to our defined benefit plans in 2011, 2010 and 2009, respectively.After consideration of our intent to remain fully-funded based on standards set by law, we currently anticipate that our contributionto our U.S. pension plan in 2012 will be between $20 million and $25 million, excluding direct benefits paid. We expect to contributeapproximately $10 million to our non-U.S. pension plans in 2012.
For further discussions on pension and postretirement benefits, see Note 12 to our consolidated financial statements included inItem 8 of this Annual Report.
OUR CRITICAL ACCOUNTING ESTIMATES
The process of preparing financial statements in conformity with U.S. GAAP requires the use of estimates and assumptions todetermine reported amounts of certain assets, liabilities, revenues and expenses and the disclosure of related contingent assets andliabilities. These estimates and assumptions are based upon information available at the time of the estimates or assumptions, includingour historical experience, where relevant. The most significant estimates made by management include: timing and amount of revenuerecognition; deferred taxes, tax valuation allowances and tax reserves; reserves for contingent losses; retirement and postretirementbenefits; and valuation of goodwill, indefinite-lived intangible assets and other long-lived assets. The significant estimates are reviewedquarterly by management, and management presents its views to the Audit Committee of our Board of Directors. Because of theuncertainty of factors surrounding the estimates, assumptions and judgments used in the preparation of our financial statements, actualresults may differ from the estimates, and the difference may be material.
Our critical accounting policies are those policies that are both most important to our financial condition and results of operationsand require the most difficult, subjective or complex judgments on the part of management in their application, often as a result of theneed to make estimates about the effect of matters that are inherently uncertain. We believe that the following represent our criticalaccounting policies. For a summary of all of our significant accounting policies, see Note 1 to our consolidated financial statementsincluded in Item 8 of this Annual Report. Management and our external auditors have discussed our critical accounting policies with theAudit Committee of our Board of Directors.
Revenue Recognition
Revenues for product sales are recognized when the risks and rewards of ownership are transferred to the customers, which istypically based on the contractual delivery terms agreed to with the customer and fulfillment of all but inconsequential or perfunctoryactions. In addition, our policy requires persuasive evidence of an arrangement, a fixed or determinable sales price and reasonableassurance of collectability. We defer the recognition of revenue when advance payments are received from customers before performanceobligations have been completed and/or services have been performed. Freight charges billed to customers are included in sales and therelated shipping costs are included in cost of sales in our consolidated statements of income. Our contracts typically include cancellationprovisions that require customers to reimburse us for costs incurred up to the date of cancellation, as well as any contractual cancellationpenalties.
We enter into certain contracts with multiple deliverables that may include any combination of designing, developing,manufacturing, modifying, installing and commissioning of flow management equipment and providing services related to theperformance of such products. Delivery of these products and services typically occurs within a one to two-year period, although many
Copyright © 2013 www.secdatabase.com. All Rights Reserved.Please Consider the Environment Before Printing This Document

arrangements, such as "book and ship" type orders, have a shorter timeframe for delivery. We aggregate or separate deliverables into unitsof accounting based on whether the deliverable(s) have standalone value to the customer and when no
47
Copyright © 2013 www.secdatabase.com. All Rights Reserved.Please Consider the Environment Before Printing This Document
Table of Contents
general right of return exists. Contract value is allocated ratably to the units of accounting in the arrangement based on their relativeselling prices determined as if the deliverables were sold separately.
Revenues for long-term contracts that exceed certain internal thresholds regarding the size and duration of the project and providefor the receipt of progress billings from the customer are recorded on the percentage of completion method with progress measured on acost-to-cost basis. Percentage of completion revenue represents less than 9% of our consolidated sales for each year presented.
Revenue on service and repair contracts is recognized after services have been agreed to by the customer and rendered. Revenuesgenerated under fixed fee service and repair contracts are recognized on a ratable basis over the term of the contract. These contracts canrange in duration, but generally extend for up to five years. Fixed fee service contracts represent aproximately 1% of consolidated salesfor each year presented.
In certain instances, we provide guaranteed completion dates under the terms of our contracts. Failure to meet contractual deliverydates can result in late delivery penalties or non-recoverable costs. In instances where the payment of such costs are deemed to beprobable, we perform a project profitability analysis, accounting for such costs as a reduction of realizable revenues, which couldpotentially cause estimated total project costs to exceed projected total revenues realized from the project. In such instances, we wouldrecord reserves to cover such excesses in the period they are determined. In circumstances where the total projected revenues still exceedtotal projected costs, the incurrence of unrealized incentive fees or non-recoverable costs generally reduces profitability of the project atthe time of subsequent revenue recognition. Our reported results would change if different estimates were used for contract costs or ifdifferent estimates were used for contractual contingencies.
Deferred Taxes, Tax Valuation Allowances and Tax Reserves
We recognize valuation allowances to reduce the carrying value of deferred tax assets to amounts that we expect are more likelythan not to be realized. Our valuation allowances primarily relate to the deferred tax assets established for certain tax credit carryforwardsand net operating loss carryforwards for non-U.S. subsidiaries, and we evaluate the realizability of our deferred tax assets by assessingthe related valuation allowance and by adjusting the amount of these allowances, if necessary. We assess such factors as our forecast offuture taxable income and available tax planning strategies that could be implemented to realize the net deferred tax assets in determiningthe sufficiency of our valuation allowances. Failure to achieve forecasted taxable income in the applicable tax jurisdictions could affectthe ultimate realization of deferred tax assets and could result in an increase in our effective tax rate on future earnings. Implementationof different tax structures in certain jurisdictions could, if successful, result in future reductions of certain valuation allowances.
The amount of income taxes we pay is subject to ongoing audits by federal, state and foreign tax authorities, which often result inproposed assessments. Significant judgment is required in determining income tax provisions and evaluating tax positions. We establishreserves for open tax years for uncertain tax positions that may be subject to challenge by various tax authorities. The consolidatedtax provision and related accruals include the impact of such reasonably estimable losses and related interest and penalties as deemedappropriate. Tax benefits recognized in the financial statements from uncertain tax positions are measured based on the largest benefitthat has a greater than fifty percent likelihood of being realized upon ultimate settlement.
While we believe we have adequately provided for any reasonably foreseeable outcome related to these matters, our future resultsmay include favorable or unfavorable adjustments to our estimated tax liabilities. To the extent that the expected tax outcome of thesematters changes, such changes in estimate will impact the income tax provision in the period in which such determination is made.
Reserves for Contingent Loss
Liabilities are recorded for various contingencies arising in the normal course of business when it is both probable that a losshas been incurred and such loss is estimable. Assessments of reserves are based on information obtained from our independent and in-house experts, including recent legal decisions and loss experience in similar situations. The recorded legal reserves are susceptible tochanges due to new developments regarding the facts and circumstances of each matter, changes in political environments, legal venueand other factors. Recorded environmental reserves could change based on further analysis of our properties, technological innovationand regulatory environment changes.
Estimates of liabilities for unsettled asbestos-related claims are based on known claims and on our experience during the precedingtwo years for claims filed, settled and dismissed, with adjustments for events deemed unusual and unlikely to recur, and are included inretirement obligations and other liabilities in our consolidated balance sheets. A substantial majority of our asbestos-related claims arecovered by insurance or indemnities. Estimated indemnities and receivables from insurance carriers for unsettled claims and receivablesfor settlements and legal fees paid by us for asbestos-related claims are estimated using our historical experience with insurance recoveryrates and estimates of future recoveries, which include estimates of coverage and financial viability of our insurance carriers. Estimatedreceivables are included in other assets, net in our consolidated balance
Copyright © 2013 www.secdatabase.com. All Rights Reserved.Please Consider the Environment Before Printing This Document

48
Copyright © 2013 www.secdatabase.com. All Rights Reserved.Please Consider the Environment Before Printing This Document
Table of Contents
sheets. In one asbestos insurance related matter, we have a claim in litigation against relevant insurers substantially in excess of therecorded receivable. If our claim is resolved more favorably than reflected in this receivable, we would benefit from a one-time gainin the amount of such excess. We are currently unable to estimate the impact, if any, of unasserted asbestos-related claims, althoughfuture claims would also be subject to existing indemnities and insurance coverage. Changes in claims filed, settled and dismissed anddifferences between actual and estimated settlement costs and insurance or indemnity recoveries could impact future expense.
Pension and Postretirement Benefits
We provide pension and postretirement benefits to certain of our employees, including former employees, and their beneficiaries.The assets, liabilities and expenses we recognize and disclosures we make about plan actuarial and financial information are dependenton the assumptions and estimates used in calculating such amounts. The assumptions include factors such as discount rates, health carecost trend rates, inflation, expected rates of return on plan assets, retirement rates, mortality rates, rates of compensation increases andother factors.
The assumptions utilized to compute expense and benefit obligations are shown in Note 12 to our consolidated financial statementsincluded in Item 8 of this Annual Report. These assumptions are assessed annually in consultation with independent actuaries andinvestment advisors as of December 31 and adjustments are made as needed. We evaluate prevailing market conditions and local lawsand requirements in countries where plans are maintained, including appropriate rates of return, interest rates and medical inflation rates.We also compare our significant assumptions with our peers. The methodology to set our assumptions includes:
• Discount rates are estimated using high quality debt securities based on corporate or government bond yields with a durationmatching the expected benefit payments. For the U.S. the discount rate is obtained from an analysis of publicly-tradedinvestment-grade corporate bonds to establish a weighted average discount rate. For plans in the United Kingdom and theEURO zone we use the discount rate obtained from an analysis of AA-graded corporate bonds used to generate a yieldcurve. For other countries or regions without a corporate AA bond market, government bond rates are used. Our discount rateassumptions are impacted by changes in general economic and market conditions that affect interest rates on long-term high-quality debt securities, as well as the duration of our plans’ liabilities.
• Inflation assumptions are based upon both actual inflation rates and nationally expected trends.
• The expected rates of return on plan assets are derived from reviews of asset allocation strategies, expected long-termperformance of asset classes, risks and other factors adjusted for our specific investment strategy. These rates are impacted bychanges in general market conditions, but because they are long-term in nature, short-term market changes do not significantlyimpact the rates. Changes to our target asset allocation also impact these rates.
• Retirement rates are based upon actual and projected plan experience.
• Mortality rates are based on published actuarial tables relevant to the countries in which we have plans.
• The expected rates of compensation increase reflect estimates of the change in future compensation levels due to general pricelevels, seniority, age and other factors.
• Health care cost trend rates are developed based upon historical retiree cost trend data, long-term health care outlook andindustry benchmarks.
We evaluate the funded status of each retirement plan using current assumptions and determine the appropriate funding levelconsidering applicable regulatory requirements, tax deductibility, reporting considerations, cash flow requirements and other factors. Wediscuss our funding assumptions with the Finance Committee of our Board of Directors.
Valuation of Goodwill, Indefinite-Lived Intangible Assets and Other Long-Lived Assets
The initial recording of goodwill and intangible assets requires subjective judgments concerning estimates of the fair value of theacquired assets. We test the value of goodwill and indefinite-lived intangible assets for impairment as of December 31 each year orwhenever events or circumstances indicate such assets may be impaired.
The test for goodwill impairment involves significant judgment in estimating projections of fair value generated through futureperformance of each of the reporting units. In connection with our segment reorganization in 2010, we reallocated goodwill to ourredefined reporting units and evaluated goodwill for impairment. The identification of our reporting units began at the operating segmentlevel: EPD, IPD and FCD, and considered whether components one level below the operating segment levels should be identified asreporting units for purpose of testing goodwill for impairment based on certain conditions. These conditions included, among otherfactors, (i) the extent to which a component represents a business and (ii) the aggregation of economically similar components within theoperating segments and resulted in nine reporting units. Other factors that were considered in
Copyright © 2013 www.secdatabase.com. All Rights Reserved.Please Consider the Environment Before Printing This Document

49
Copyright © 2013 www.secdatabase.com. All Rights Reserved.Please Consider the Environment Before Printing This Document
Table of Contents
determining whether the aggregation of components was appropriate included the similarity of the nature of the products and services,the nature of the production processes, the methods of distribution and the types of industries served.
Impairment losses for goodwill are recognized whenever the implied fair value of goodwill is less than the carrying value. Weestimate the fair value of our reporting units based on an income approach, whereby we calculate the fair value of a reporting unitbased on the present value of estimated future cash flows. A discounted cash flow analysis requires us to make various judgmentalassumptions about future sales, operating margins, growth rates and discount rates, which are based on our budgets, business plans,economic projections, anticipated future cash flows and market participants. Assumptions are also made for varying perpetual growthrates for periods beyond the long-term business plan period. We did not record an impairment of goodwill in 2011, 2010 or 2009.
We also consider our market capitalization in our evaluation of the fair value of our goodwill. Although our market capitalizationdeclined compared with 2010, it did not decline to a level that indicated a potential impairment of our goodwill as of December 31, 2011.
Impairment losses for indefinite-lived intangible assets are recognized whenever the estimated fair value is less than the carryingvalue. Fair values are calculated for trademarks using a "relief from royalty" method, which estimates the fair value of the trademarksby determining the present value of the royalty payments that are avoided as a result of owning the trademark. This method includesjudgmental assumptions about sales growth and discount rates that have a significant impact on the fair value and are substantiallyconsistent with the assumptions used to determine the fair value of our reporting units discussed above. We did not record a materialimpairment of our trademarks in 2011, 2010 or 2009.
The net realizable value of other long-lived assets, including property, plant and equipment and finite-lived intangible assets, isreviewed periodically, when indicators of potential impairments are present, based upon an assessment of the estimated future cash flowsrelated to those assets, utilizing a methodology similar to that for goodwill. Additional considerations related to our long-lived assetsinclude expected maintenance and improvements, changes in expected uses and ongoing operating performance and utilization.
Due to uncertain market conditions and potential changes in strategy and product portfolio, it is possible that forecasts used tosupport asset carrying values may change in the future, which could result in non-cash charges that would adversely affect our financialcondition and results of operations.
ACCOUNTING DEVELOPMENTS
We have presented the information about accounting pronouncements not yet implemented in Note 1 to our consolidated financialstatements included in Item 8 of this Annual Report.
ITEM 7A. QUANTITATIVE AND QUALITATIVE DISCLOSURES ABOUT MARKET RISK
We have market risk exposure arising from changes in interest rates and foreign currency exchange rate movements. We areexposed to credit-related losses in the event of non-performance by counterparties to financial instruments, including interest rate swapsand forward exchange contracts, but we currently expect all counterparties will continue to meet their obligations given their currentcreditworthiness.
Interest Rate Risk
Our earnings are impacted by changes in short-term interest rates as a result of borrowings under our Credit Facilities, whichbear interest based on floating rates. At December 31, 2011, after the effect of interest rate swaps, we had $145.0 million of variablerate debt obligations outstanding under our Credit Facilities with a weighted average interest rate of 2.58%. A hypothetical change of100 basis points in the interest rate for these borrowings, assuming constant variable rate debt levels, would have changed interest expenseby $1.5 million for the year ended December 31, 2011. At December 31, 2011 and 2010, we had $330.0 million and $350.0 million,respectively, of notional amount in outstanding interest rate swaps with third parties with varying maturities through June 2014.
Foreign Currency Exchange Rate Risk
A substantial portion of our operations are conducted by our subsidiaries outside of the U.S. in currencies other than the U.S. dollar.Almost all of our non-U.S. subsidiaries conduct their business primarily in their local currencies, which are also their functionalcurrencies. Foreign currency exposures arise from translation of foreign-denominated assets and liabilities into U.S. dollars and fromtransactions, including firm commitments and anticipated transactions, denominated in a currency other than a non-U.S. subsidiary’sfunctional currency. Generally, we view our investments in foreign subsidiaries from a long-term perspective and, therefore, do not hedgethese investments. We use capital structuring techniques to manage our investment in
Copyright © 2013 www.secdatabase.com. All Rights Reserved.Please Consider the Environment Before Printing This Document

50
Copyright © 2013 www.secdatabase.com. All Rights Reserved.Please Consider the Environment Before Printing This Document
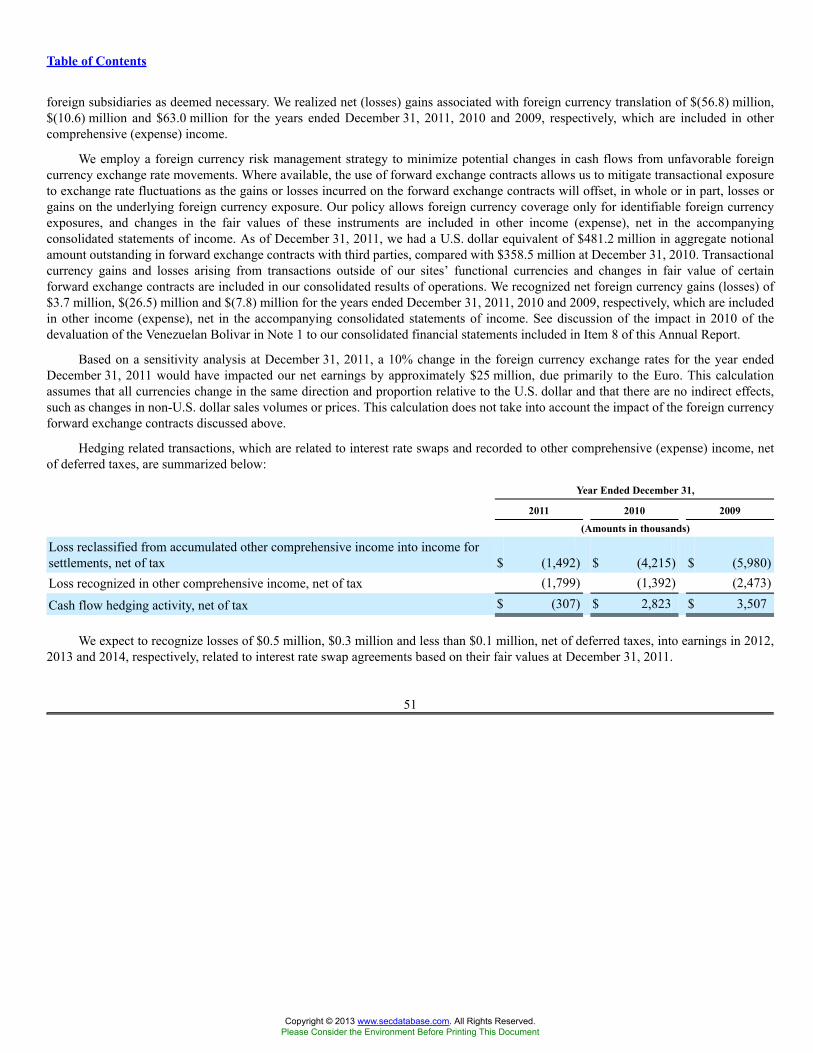
Table of Contents
foreign subsidiaries as deemed necessary. We realized net (losses) gains associated with foreign currency translation of $(56.8) million,$(10.6) million and $63.0 million for the years ended December 31, 2011, 2010 and 2009, respectively, which are included in othercomprehensive (expense) income.
We employ a foreign currency risk management strategy to minimize potential changes in cash flows from unfavorable foreigncurrency exchange rate movements. Where available, the use of forward exchange contracts allows us to mitigate transactional exposureto exchange rate fluctuations as the gains or losses incurred on the forward exchange contracts will offset, in whole or in part, losses orgains on the underlying foreign currency exposure. Our policy allows foreign currency coverage only for identifiable foreign currencyexposures, and changes in the fair values of these instruments are included in other income (expense), net in the accompanyingconsolidated statements of income. As of December 31, 2011, we had a U.S. dollar equivalent of $481.2 million in aggregate notionalamount outstanding in forward exchange contracts with third parties, compared with $358.5 million at December 31, 2010. Transactionalcurrency gains and losses arising from transactions outside of our sites’ functional currencies and changes in fair value of certainforward exchange contracts are included in our consolidated results of operations. We recognized net foreign currency gains (losses) of$3.7 million, $(26.5) million and $(7.8) million for the years ended December 31, 2011, 2010 and 2009, respectively, which are includedin other income (expense), net in the accompanying consolidated statements of income. See discussion of the impact in 2010 of thedevaluation of the Venezuelan Bolivar in Note 1 to our consolidated financial statements included in Item 8 of this Annual Report.
Based on a sensitivity analysis at December 31, 2011, a 10% change in the foreign currency exchange rates for the year endedDecember 31, 2011 would have impacted our net earnings by approximately $25 million, due primarily to the Euro. This calculationassumes that all currencies change in the same direction and proportion relative to the U.S. dollar and that there are no indirect effects,such as changes in non-U.S. dollar sales volumes or prices. This calculation does not take into account the impact of the foreign currencyforward exchange contracts discussed above.
Hedging related transactions, which are related to interest rate swaps and recorded to other comprehensive (expense) income, netof deferred taxes, are summarized below:
Year Ended December 31,
2011 2010 2009
(Amounts in thousands)
Loss reclassified from accumulated other comprehensive income into income forsettlements, net of tax $ (1,492) $ (4,215) $ (5,980)Loss recognized in other comprehensive income, net of tax (1,799) (1,392) (2,473)
Cash flow hedging activity, net of tax $ (307) $ 2,823 $ 3,507
We expect to recognize losses of $0.5 million, $0.3 million and less than $0.1 million, net of deferred taxes, into earnings in 2012,2013 and 2014, respectively, related to interest rate swap agreements based on their fair values at December 31, 2011.
51
Copyright © 2013 www.secdatabase.com. All Rights Reserved.Please Consider the Environment Before Printing This Document
Table of Contents
ITEM 8. FINANCIAL STATEMENTS AND SUPPLEMENTARY DATA
REPORT OF INDEPENDENT REGISTERED PUBLIC ACCOUNTING FIRM
To The Board of Directors and Shareholders of Flowserve Corporation:
In our opinion, the consolidated financial statements listed in the index appearing under Item 15(a)(1) present fairly, in all materialrespects, the financial position of Flowserve Corporation and its subsidiaries at December 31, 2011 and 2010, and the results of theiroperations and their cash flows for each of the three years in the period ended December 31, 2011 in conformity with accountingprinciples generally accepted in the United States of America. In addition, in our opinion, the financial statement schedule listed inthe accompanying index appearing under Item 15(a)(2) presents fairly, in all material respects, the information set forth therein whenread in conjunction with the related consolidated financial statements. Also in our opinion, the Company maintained, in all materialrespects, effective internal control over financial reporting as of December 31, 2011, based on criteria established in Internal Control- Integrated Framework issued by the Committee of Sponsoring Organizations of the Treadway Commission (COSO). The Company'smanagement is responsible for these financial statements and financial statement schedule, for maintaining effective internal controlover financial reporting and for its assessment of the effectiveness of internal control over financial reporting, included in Management'sReport on Internal Control Over Financial Reporting appearing under Item 9A. Our responsibility is to express opinions on these financialstatements, on the financial statement schedule, and on the Company's internal control over financial reporting based on our integratedaudits. We conducted our audits in accordance with the standards of the Public Company Accounting Oversight Board (United States).Those standards require that we plan and perform the audits to obtain reasonable assurance about whether the financial statements arefree of material misstatement and whether effective internal control over financial reporting was maintained in all material respects. Ouraudits of the financial statements included examining, on a test basis, evidence supporting the amounts and disclosures in the financialstatements, assessing the accounting principles used and significant estimates made by management, and evaluating the overall financialstatement presentation. Our audit of internal control over financial reporting included obtaining an understanding of internal control overfinancial reporting, assessing the risk that a material weakness exists, and testing and evaluating the design and operating effectiveness ofinternal control based on the assessed risk. Our audits also included performing such other procedures as we considered necessary in thecircumstances. We believe that our audits provide a reasonable basis for our opinions.
A company's internal control over financial reporting is a process designed to provide reasonable assurance regarding the reliabilityof financial reporting and the preparation of financial statements for external purposes in accordance with generally accepted accountingprinciples. A company's internal control over financial reporting includes those policies and procedures that (i) pertain to the maintenanceof records that, in reasonable detail, accurately and fairly reflect the transactions and dispositions of the assets of the company; (ii) providereasonable assurance that transactions are recorded as necessary to permit preparation of financial statements in accordance with generallyaccepted accounting principles, and that receipts and expenditures of the company are being made only in accordance with authorizationsof management and directors of the company; and (iii) provide reasonable assurance regarding prevention or timely detection ofunauthorized acquisition, use, or disposition of the company's assets that could have a material effect on the financial statements.
Because of its inherent limitations, internal control over financial reporting may not prevent or detect misstatements. Also,projections of any evaluation of effectiveness to future periods are subject to the risk that controls may become inadequate because ofchanges in conditions, or that the degree of compliance with the policies or procedures may deteriorate.
/s/ PricewaterhouseCoopers LLPPricewaterhouseCoopers LLPDallas, TexasFebruary 22, 2012
52
Copyright © 2013 www.secdatabase.com. All Rights Reserved.Please Consider the Environment Before Printing This Document
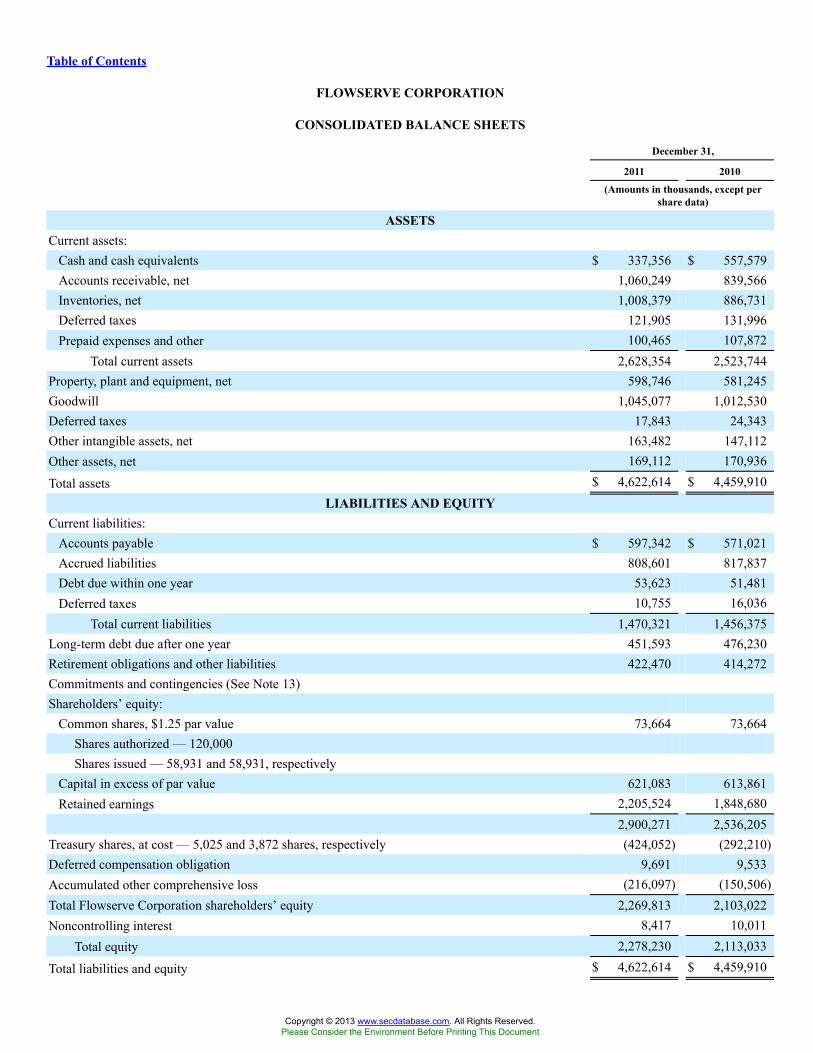
Table of Contents
FLOWSERVE CORPORATION
CONSOLIDATED BALANCE SHEETS
December 31,
2011 2010
(Amounts in thousands, except pershare data)
ASSETSCurrent assets:
Cash and cash equivalents $ 337,356 $ 557,579Accounts receivable, net 1,060,249 839,566Inventories, net 1,008,379 886,731Deferred taxes 121,905 131,996Prepaid expenses and other 100,465 107,872
Total current assets 2,628,354 2,523,744Property, plant and equipment, net 598,746 581,245Goodwill 1,045,077 1,012,530Deferred taxes 17,843 24,343Other intangible assets, net 163,482 147,112Other assets, net 169,112 170,936
Total assets $ 4,622,614 $ 4,459,910LIABILITIES AND EQUITY
Current liabilities:Accounts payable $ 597,342 $ 571,021Accrued liabilities 808,601 817,837Debt due within one year 53,623 51,481Deferred taxes 10,755 16,036
Total current liabilities 1,470,321 1,456,375Long-term debt due after one year 451,593 476,230Retirement obligations and other liabilities 422,470 414,272Commitments and contingencies (See Note 13)Shareholders’ equity:
Common shares, $1.25 par value 73,664 73,664Shares authorized — 120,000Shares issued — 58,931 and 58,931, respectively
Capital in excess of par value 621,083 613,861Retained earnings 2,205,524 1,848,680
2,900,271 2,536,205Treasury shares, at cost — 5,025 and 3,872 shares, respectively (424,052) (292,210)Deferred compensation obligation 9,691 9,533Accumulated other comprehensive loss (216,097) (150,506)Total Flowserve Corporation shareholders’ equity 2,269,813 2,103,022Noncontrolling interest 8,417 10,011
Total equity 2,278,230 2,113,033
Total liabilities and equity $ 4,622,614 $ 4,459,910
Copyright © 2013 www.secdatabase.com. All Rights Reserved.Please Consider the Environment Before Printing This Document

See accompanying notes to consolidated financial statements.
53
Copyright © 2013 www.secdatabase.com. All Rights Reserved.Please Consider the Environment Before Printing This Document

Table of Contents
FLOWSERVE CORPORATION
CONSOLIDATED STATEMENTS OF INCOME
Year Ended December 31,
2011 2010 2009
(Amounts in thousands, except per share data)
Sales $ 4,510,201 $ 4,032,036 $ 4,365,262Cost of sales (2,996,555) (2,622,343) (2,817,130)Gross profit 1,513,646 1,409,693 1,548,132
Selling, general and administrative expense (914,080) (844,990) (934,451)Net earnings from affiliates 19,111 16,649 15,836
Operating income 618,677 581,352 629,517Interest expense (36,181) (34,301) (40,005)Interest income 1,581 1,575 3,247Other income (expense), net 3,678 (18,349) (7,968)
Earnings before income taxes 587,755 530,277 584,791Provision for income taxes (158,524) (141,596) (156,460)Net earnings, including noncontrolling interests 429,231 388,681 428,331
Less: Net earnings attributable to noncontrolling interests (649) (391) (444)
Net earnings attributable to Flowserve Corporation $ 428,582 $ 388,290 $ 427,887Net earnings per share attributable to Flowserve Corporation commonshareholders:
Basic $ 7.72 $ 6.96 $ 7.66Diluted 7.64 6.88 7.59
Cash dividends declared per share $ 1.28 $ 1.16 $ 1.08
See accompanying notes to consolidated financial statements.
54
Copyright © 2013 www.secdatabase.com. All Rights Reserved.Please Consider the Environment Before Printing This Document
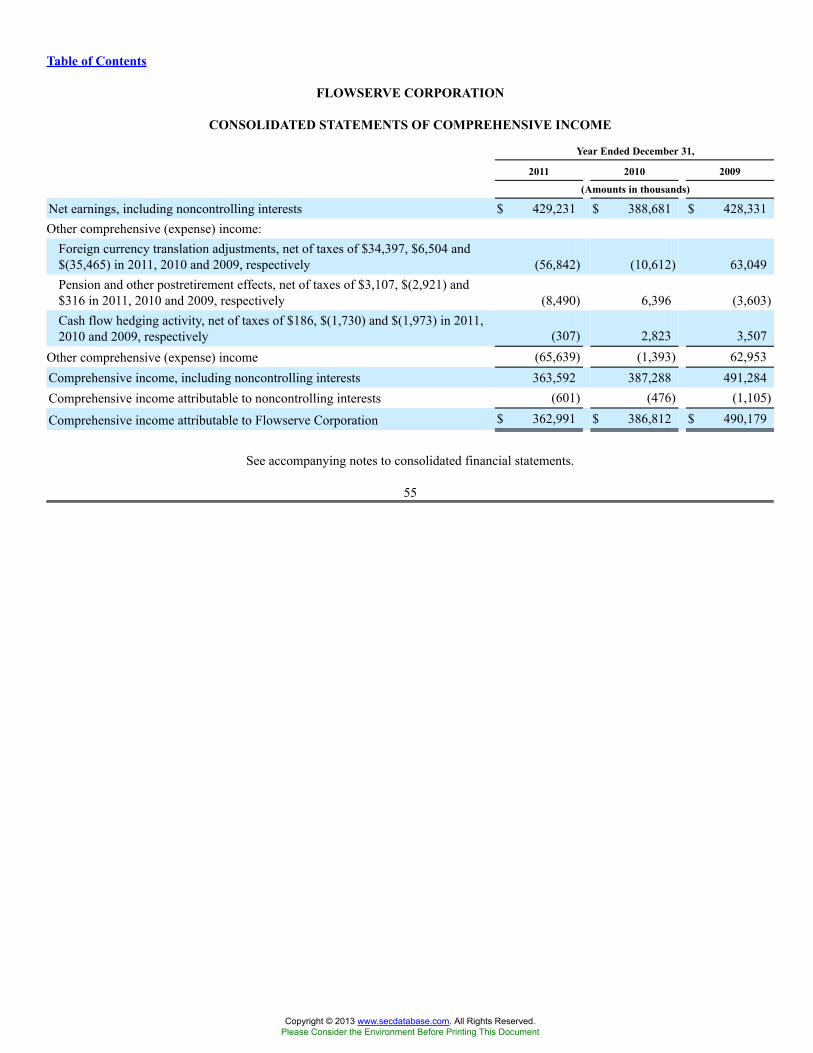
Table of Contents
FLOWSERVE CORPORATION
CONSOLIDATED STATEMENTS OF COMPREHENSIVE INCOME
Year Ended December 31,
2011 2010 2009
(Amounts in thousands)
Net earnings, including noncontrolling interests $ 429,231 $ 388,681 $ 428,331Other comprehensive (expense) income:
Foreign currency translation adjustments, net of taxes of $34,397, $6,504 and$(35,465) in 2011, 2010 and 2009, respectively (56,842) (10,612) 63,049Pension and other postretirement effects, net of taxes of $3,107, $(2,921) and$316 in 2011, 2010 and 2009, respectively (8,490) 6,396 (3,603)Cash flow hedging activity, net of taxes of $186, $(1,730) and $(1,973) in 2011,2010 and 2009, respectively (307) 2,823 3,507
Other comprehensive (expense) income (65,639) (1,393) 62,953Comprehensive income, including noncontrolling interests 363,592 387,288 491,284Comprehensive income attributable to noncontrolling interests (601) (476) (1,105)
Comprehensive income attributable to Flowserve Corporation $ 362,991 $ 386,812 $ 490,179
See accompanying notes to consolidated financial statements.
55
Copyright © 2013 www.secdatabase.com. All Rights Reserved.Please Consider the Environment Before Printing This Document
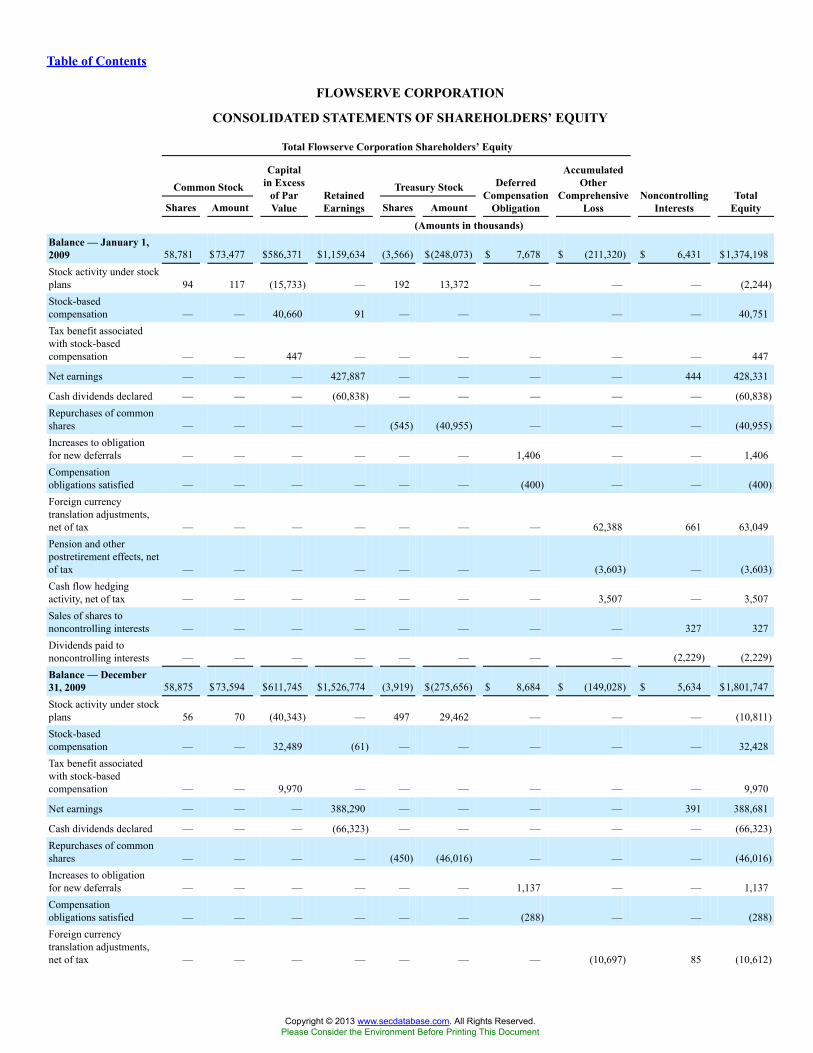
Table of Contents
FLOWSERVE CORPORATION
CONSOLIDATED STATEMENTS OF SHAREHOLDERS’ EQUITY
Total Flowserve Corporation Shareholders’ Equity
Common Stock Treasury Stock
Shares Amount
Capitalin Excess
of ParValue
RetainedEarnings Shares Amount
DeferredCompensation
Obligation
AccumulatedOther
ComprehensiveLoss
NoncontrollingInterests
TotalEquity
(Amounts in thousands)Balance — January 1,2009 58,781 $73,477 $586,371 $1,159,634 (3,566) $(248,073) $ 7,678 $ (211,320) $ 6,431 $1,374,198Stock activity under stockplans 94 117 (15,733) — 192 13,372 — — — (2,244)Stock-basedcompensation — — 40,660 91 — — — — — 40,751Tax benefit associatedwith stock-basedcompensation — — 447 — — — — — — 447
Net earnings — — — 427,887 — — — — 444 428,331
Cash dividends declared — — — (60,838) — — — — — (60,838)Repurchases of commonshares — — — — (545) (40,955) — — — (40,955)Increases to obligationfor new deferrals — — — — — — 1,406 — — 1,406Compensationobligations satisfied — — — — — — (400) — — (400)Foreign currencytranslation adjustments,net of tax — — — — — — — 62,388 661 63,049Pension and otherpostretirement effects, netof tax — — — — — — — (3,603) — (3,603)Cash flow hedgingactivity, net of tax — — — — — — — 3,507 — 3,507Sales of shares tononcontrolling interests — — — — — — — — 327 327Dividends paid tononcontrolling interests — — — — — — — — (2,229) (2,229)Balance — December31, 2009 58,875 $73,594 $611,745 $1,526,774 (3,919) $(275,656) $ 8,684 $ (149,028) $ 5,634 $1,801,747Stock activity under stockplans 56 70 (40,343) — 497 29,462 — — — (10,811)Stock-basedcompensation — — 32,489 (61) — — — — — 32,428Tax benefit associatedwith stock-basedcompensation — — 9,970 — — — — — — 9,970
Net earnings — — — 388,290 — — — — 391 388,681
Cash dividends declared — — — (66,323) — — — — — (66,323)Repurchases of commonshares — — — — (450) (46,016) — — — (46,016)Increases to obligationfor new deferrals — — — — — — 1,137 — — 1,137Compensationobligations satisfied — — — — — — (288) — — (288)Foreign currencytranslation adjustments,net of tax — — — — — — — (10,697) 85 (10,612)
Copyright © 2013 www.secdatabase.com. All Rights Reserved.Please Consider the Environment Before Printing This Document
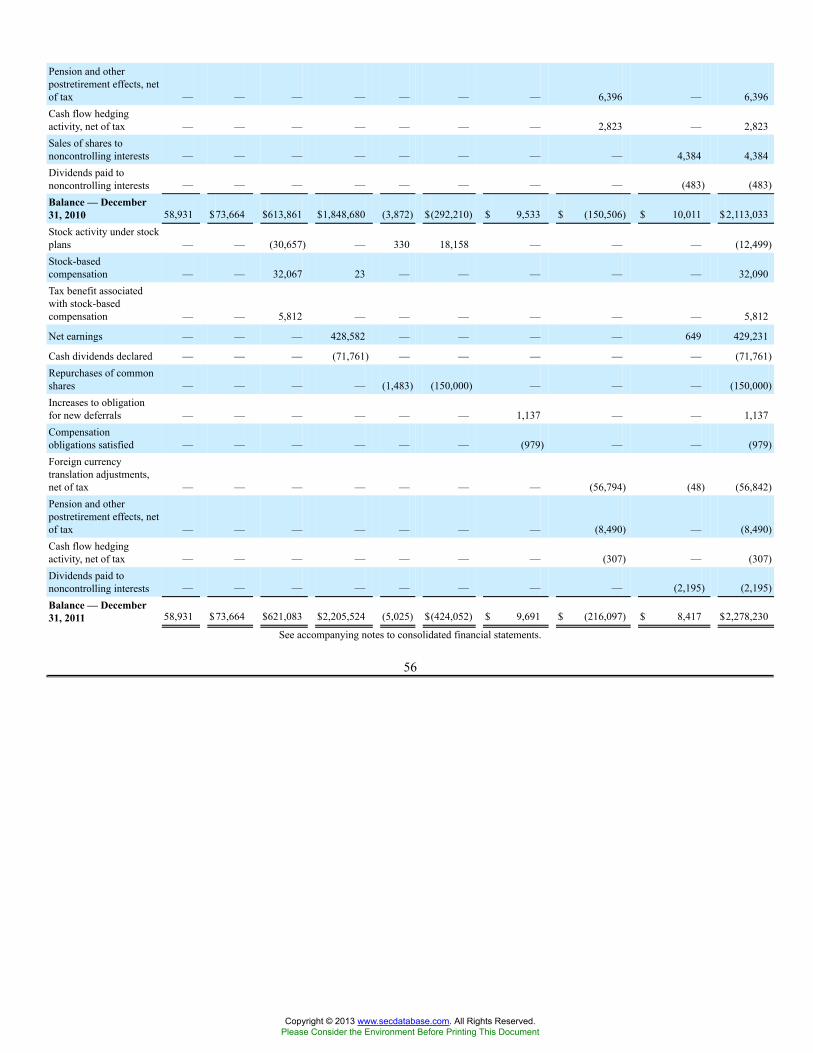
Pension and otherpostretirement effects, netof tax — — — — — — — 6,396 — 6,396Cash flow hedgingactivity, net of tax — — — — — — — 2,823 — 2,823Sales of shares tononcontrolling interests — — — — — — — — 4,384 4,384Dividends paid tononcontrolling interests — — — — — — — — (483) (483)Balance — December31, 2010 58,931 $73,664 $613,861 $1,848,680 (3,872) $(292,210) $ 9,533 $ (150,506) $ 10,011 $2,113,033Stock activity under stockplans — — (30,657) — 330 18,158 — — — (12,499)Stock-basedcompensation — — 32,067 23 — — — — — 32,090Tax benefit associatedwith stock-basedcompensation — — 5,812 — — — — — — 5,812
Net earnings — — — 428,582 — — — — 649 429,231
Cash dividends declared — — — (71,761) — — — — — (71,761)Repurchases of commonshares — — — — (1,483) (150,000) — — — (150,000)Increases to obligationfor new deferrals — — — — — — 1,137 — — 1,137Compensationobligations satisfied — — — — — — (979) — — (979)Foreign currencytranslation adjustments,net of tax — — — — — — — (56,794) (48) (56,842)Pension and otherpostretirement effects, netof tax — — — — — — — (8,490) — (8,490)Cash flow hedgingactivity, net of tax — — — — — — — (307) — (307)Dividends paid tononcontrolling interests — — — — — — — — (2,195) (2,195)Balance — December31, 2011 58,931 $73,664 $621,083 $2,205,524 (5,025) $(424,052) $ 9,691 $ (216,097) $ 8,417 $2,278,230
See accompanying notes to consolidated financial statements.
56
Copyright © 2013 www.secdatabase.com. All Rights Reserved.Please Consider the Environment Before Printing This Document

Table of Contents
FLOWSERVE CORPORATION
CONSOLIDATED STATEMENTS OF CASH FLOWS
Year Ended December 31,
2011 2010 2009
(Amounts in thousands)
Cash flows — Operating activities:Net earnings, including noncontrolling interests $ 429,231 $ 388,681 $ 428,331Adjustments to reconcile net earnings to net cash provided by operating activities:
Depreciation 90,653 90,509 85,585Amortization of intangible and other assets 14,168 10,785 9,860Amortization of deferred loan costs 2,740 3,247 2,208Loss on early extinguishment of debt — 1,601 —Net (gain) loss on the disposition of assets (149) 356 864Acquisition-related non-cash gains — — (4,448)Gain on sale of investment — (3,993) —Excess tax benefits from stock-based payment arrangements (5,668) (10,048) (1,174)Stock-based compensation 32,090 32,428 40,751Net earnings from affiliates, net of dividends received (5,213) (9,990) (4,189)Change in assets and liabilities, net of acquisitions:
Accounts receivable, net (243,118) (51,974) 50,730Inventories, net (139,754) (52,905) 74,674Prepaid expenses and other (12,227) (2,363) 20,840Other assets, net (3,629) 6,763 1,559Accounts payable 45,845 70,741 (104,679)Accrued liabilities and income taxes payable (6,901) (125,591) (106,810)Retirement obligations and other liabilities 6,682 (20,296) (71,623)Net deferred taxes 13,463 27,824 8,798
Net cash flows provided by operating activities 218,213 355,775 431,277Cash flows — Investing activities:
Capital expenditures (107,967) (102,002) (108,448)Payments for acquisitions, net of cash acquired (90,505) (199,396) (30,750)Proceeds from disposal of assets 4,269 11,030 556Affiliate investment activity, net — 3,651 —
Net cash flows used by investing activities (194,203) (286,717) (138,642)Cash flows — Financing activities:
Excess tax benefits from stock-based payment arrangements 5,668 10,048 1,174Payments on long-term debt (25,000) (544,016) (5,682)Proceeds from issuance of long-term debt — 500,000 —Payments of deferred loan costs — (11,596) (2,764)Net borrowings (payments) under other financing arrangements 1,581 2,421 (684)Repurchases of common shares (150,000) (46,015) (40,955)Payments of dividends (69,557) (63,582) (59,204)Proceeds from stock option activity 547 5,926 2,939Dividends paid to noncontrolling interests (2,195) (483) (2,229)
Copyright © 2013 www.secdatabase.com. All Rights Reserved.Please Consider the Environment Before Printing This Document
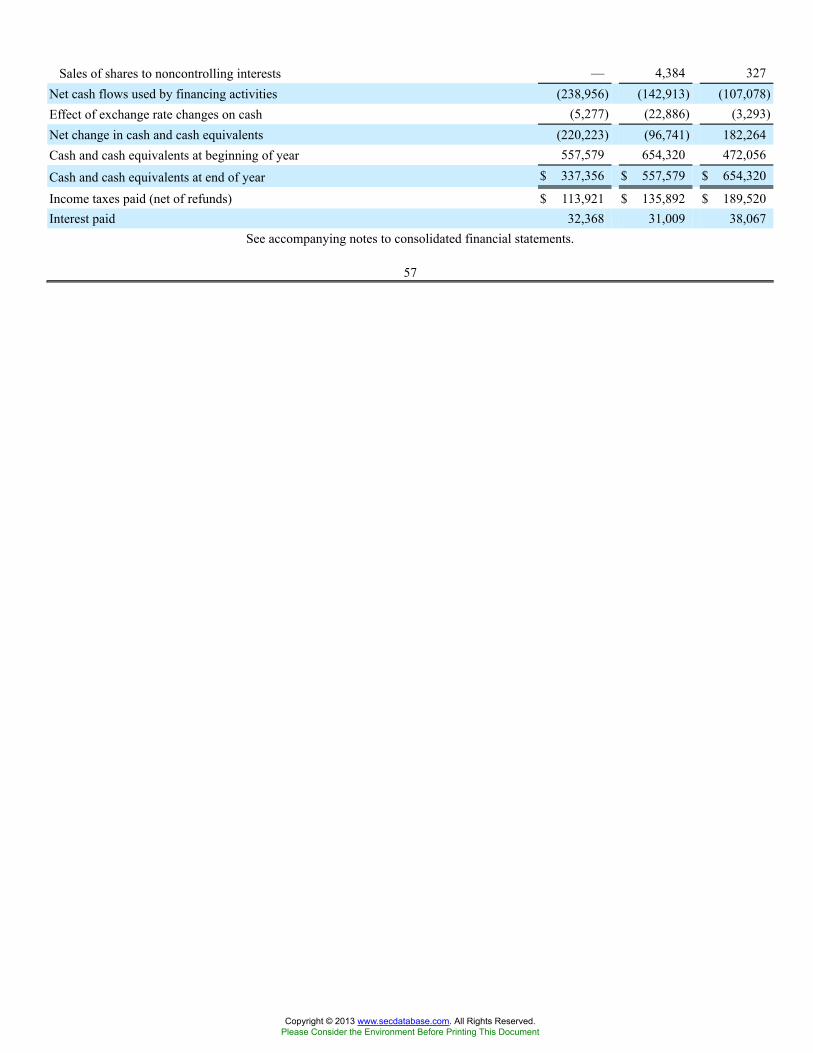
Sales of shares to noncontrolling interests — 4,384 327Net cash flows used by financing activities (238,956) (142,913) (107,078)Effect of exchange rate changes on cash (5,277) (22,886) (3,293)Net change in cash and cash equivalents (220,223) (96,741) 182,264Cash and cash equivalents at beginning of year 557,579 654,320 472,056
Cash and cash equivalents at end of year $ 337,356 $ 557,579 $ 654,320
Income taxes paid (net of refunds) $ 113,921 $ 135,892 $ 189,520Interest paid 32,368 31,009 38,067
See accompanying notes to consolidated financial statements.
57
Copyright © 2013 www.secdatabase.com. All Rights Reserved.Please Consider the Environment Before Printing This Document
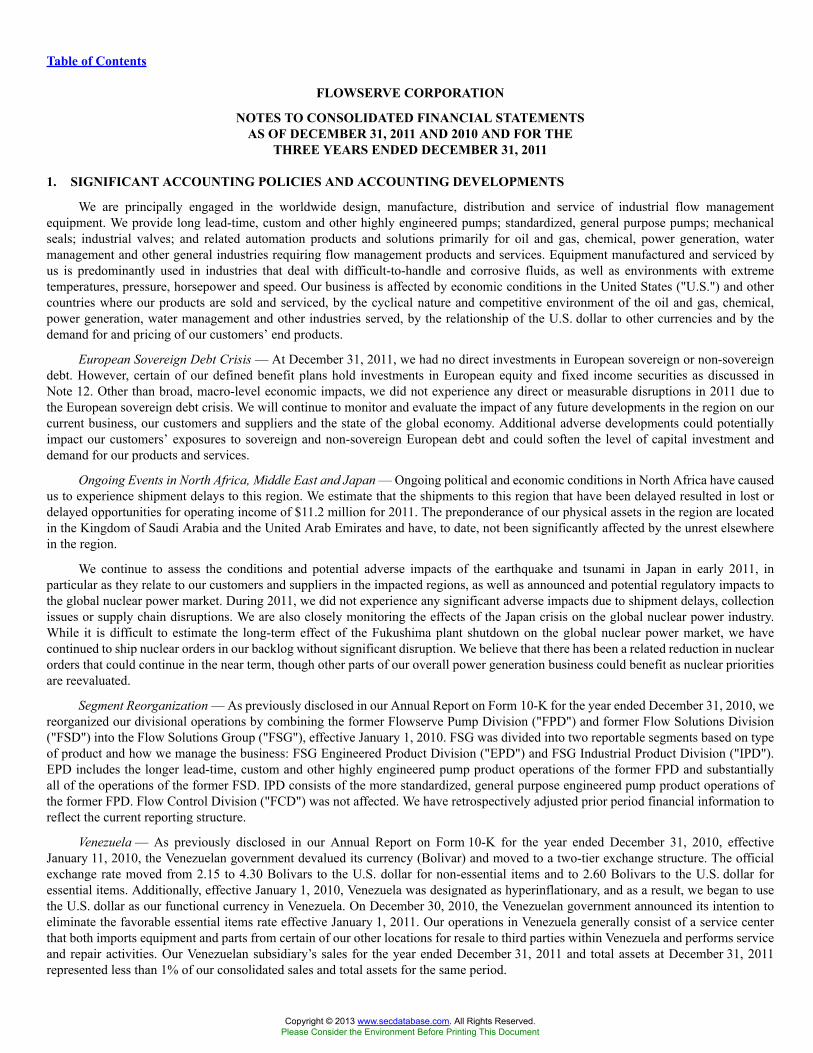
Table of Contents
FLOWSERVE CORPORATION
NOTES TO CONSOLIDATED FINANCIAL STATEMENTSAS OF DECEMBER 31, 2011 AND 2010 AND FOR THE
THREE YEARS ENDED DECEMBER 31, 2011
1. SIGNIFICANT ACCOUNTING POLICIES AND ACCOUNTING DEVELOPMENTS
We are principally engaged in the worldwide design, manufacture, distribution and service of industrial flow managementequipment. We provide long lead-time, custom and other highly engineered pumps; standardized, general purpose pumps; mechanicalseals; industrial valves; and related automation products and solutions primarily for oil and gas, chemical, power generation, watermanagement and other general industries requiring flow management products and services. Equipment manufactured and serviced byus is predominantly used in industries that deal with difficult-to-handle and corrosive fluids, as well as environments with extremetemperatures, pressure, horsepower and speed. Our business is affected by economic conditions in the United States ("U.S.") and othercountries where our products are sold and serviced, by the cyclical nature and competitive environment of the oil and gas, chemical,power generation, water management and other industries served, by the relationship of the U.S. dollar to other currencies and by thedemand for and pricing of our customers’ end products.
European Sovereign Debt Crisis — At December 31, 2011, we had no direct investments in European sovereign or non-sovereigndebt. However, certain of our defined benefit plans hold investments in European equity and fixed income securities as discussed inNote 12. Other than broad, macro-level economic impacts, we did not experience any direct or measurable disruptions in 2011 due tothe European sovereign debt crisis. We will continue to monitor and evaluate the impact of any future developments in the region on ourcurrent business, our customers and suppliers and the state of the global economy. Additional adverse developments could potentiallyimpact our customers’ exposures to sovereign and non-sovereign European debt and could soften the level of capital investment anddemand for our products and services.
Ongoing Events in North Africa, Middle East and Japan — Ongoing political and economic conditions in North Africa have causedus to experience shipment delays to this region. We estimate that the shipments to this region that have been delayed resulted in lost ordelayed opportunities for operating income of $11.2 million for 2011. The preponderance of our physical assets in the region are locatedin the Kingdom of Saudi Arabia and the United Arab Emirates and have, to date, not been significantly affected by the unrest elsewherein the region.
We continue to assess the conditions and potential adverse impacts of the earthquake and tsunami in Japan in early 2011, inparticular as they relate to our customers and suppliers in the impacted regions, as well as announced and potential regulatory impacts tothe global nuclear power market. During 2011, we did not experience any significant adverse impacts due to shipment delays, collectionissues or supply chain disruptions. We are also closely monitoring the effects of the Japan crisis on the global nuclear power industry.While it is difficult to estimate the long-term effect of the Fukushima plant shutdown on the global nuclear power market, we havecontinued to ship nuclear orders in our backlog without significant disruption. We believe that there has been a related reduction in nuclearorders that could continue in the near term, though other parts of our overall power generation business could benefit as nuclear prioritiesare reevaluated.
Segment Reorganization — As previously disclosed in our Annual Report on Form 10-K for the year ended December 31, 2010, wereorganized our divisional operations by combining the former Flowserve Pump Division ("FPD") and former Flow Solutions Division("FSD") into the Flow Solutions Group ("FSG"), effective January 1, 2010. FSG was divided into two reportable segments based on typeof product and how we manage the business: FSG Engineered Product Division ("EPD") and FSG Industrial Product Division ("IPD").EPD includes the longer lead-time, custom and other highly engineered pump product operations of the former FPD and substantiallyall of the operations of the former FSD. IPD consists of the more standardized, general purpose engineered pump product operations ofthe former FPD. Flow Control Division ("FCD") was not affected. We have retrospectively adjusted prior period financial information toreflect the current reporting structure.
Venezuela — As previously disclosed in our Annual Report on Form 10-K for the year ended December 31, 2010, effectiveJanuary 11, 2010, the Venezuelan government devalued its currency (Bolivar) and moved to a two-tier exchange structure. The officialexchange rate moved from 2.15 to 4.30 Bolivars to the U.S. dollar for non-essential items and to 2.60 Bolivars to the U.S. dollar foressential items. Additionally, effective January 1, 2010, Venezuela was designated as hyperinflationary, and as a result, we began to usethe U.S. dollar as our functional currency in Venezuela. On December 30, 2010, the Venezuelan government announced its intention toeliminate the favorable essential items rate effective January 1, 2011. Our operations in Venezuela generally consist of a service centerthat both imports equipment and parts from certain of our other locations for resale to third parties within Venezuela and performs serviceand repair activities. Our Venezuelan subsidiary’s sales for the year ended December 31, 2011 and total assets at December 31, 2011represented less than 1% of our consolidated sales and total assets for the same period.
Copyright © 2013 www.secdatabase.com. All Rights Reserved.Please Consider the Environment Before Printing This Document

58
Copyright © 2013 www.secdatabase.com. All Rights Reserved.Please Consider the Environment Before Printing This Document
Table of Contents
FLOWSERVE CORPORATION
NOTES TO CONSOLIDATED FINANCIAL STATEMENTS — (Continued)
Although approvals by Venezuela’s Commission for the Administration of Foreign Exchange have slowed, we have historicallybeen able to remit dividends and other payments at the official rate, and we currently anticipate doing so in the future. Accordingly, weused the official rate of 4.30 Bolivars to the U.S. dollar for re-measurement of our Venezuelan financial statements into U.S. dollars forall periods presented.
As a result of the currency devaluation, we recognized a net loss of $7.6 million in 2010. The loss was reported in other income(expense), net in our consolidated statement of income and resulted in no tax benefit. The elimination of the favorable essential itemsrate, effective January 1, 2011, had no impact on our consolidated financial position or results of operations as of and for the year endedDecember 31, 2011 included in this Annual Report on Form 10-K for the year ended December 31, 2011 ("Annual Report").
We have evaluated the carrying value of related assets and concluded that there is no current impairment. We are continuing toassess and monitor the ongoing impact of the currency devaluations on our Venezuelan operations and imports into the market, includingour Venezuelan subsidiary’s ability to remit cash for dividends and other payments at the official rate, as well as further actions of theVenezuelan government and economic conditions in Venezuela that may adversely impact our future consolidated financial condition orresults of operations.
Principles of Consolidation — The consolidated financial statements include the accounts of our company and our wholly andmajority-owned subsidiaries. In addition, we consolidate any variable interest entities for which we are deemed to be the primarybeneficiary. Noncontrolling interests of non-affiliated parties have been recognized for all majority-owned consolidated subsidiaries.Intercompany profits, transactions and balances among consolidated entities have been eliminated from our consolidated financialstatements. Investments in unconsolidated affiliated companies, which represent noncontrolling ownership interests between 20% and50%, are accounted for using the equity method, which approximates our equity interest in their underlying equivalent net book valueunder accounting principles generally accepted in the U.S. ("GAAP"). Investments in interests where we own less than 20% of theinvestee are accounted for by the cost method, whereby income is only recognized in the event of dividend receipt. Investments accountedfor by the cost method are tested annually for impairment. We recorded a $3.1 million gain in 2010 on the sale of an investment in a jointventure that was accounted for under the cost method.
Use of Estimates — The process of preparing financial statements in conformity with GAAP requires management to makeestimates and assumptions that affect reported amounts of certain assets, liabilities, revenues and expenses. Management believes itsestimates and assumptions are reasonable; however, actual results may differ materially from such estimates. The most significantestimates and assumptions made by management are used in determining:
• Revenue recognition, net of liquidated damages and other delivery penalties;
• Income taxes, deferred taxes, tax valuation allowances and tax reserves;
• Reserves for contingent loss;
• Retirement and postretirement benefits; and
• Valuation of goodwill, indefinite-lived intangible assets and other long-lived assets.
Revenue Recognition — Revenues for product sales are recognized when the risks and rewards of ownership are transferredto the customers, which is typically based on the contractual delivery terms agreed to with the customer and fulfillment of all butinconsequential or perfunctory actions. In addition, our policy requires persuasive evidence of an arrangement, a fixed or determinablesales price and reasonable assurance of collectability. We defer the recognition of revenue when advance payments are received fromcustomers before performance obligations have been completed and/or services have been performed. Freight charges billed to customersare included in sales and the related shipping costs are included in cost of sales in our consolidated statements of income. Our contractstypically include cancellation provisions that require customers to reimburse us for costs incurred up to the date of cancellation, as wellas any contractual cancellation penalties.
We enter into certain contracts with multiple deliverables that may include any combination of designing, developing,manufacturing, modifying, installing and commissioning of flow management equipment and providing services related to theperformance of such products. Delivery of these products and services typically occurs within a one to two-year period, although manyarrangements, such as "book and ship" type orders, have a shorter timeframe for delivery. We aggregate or separate deliverables intounits of accounting based on whether the deliverable(s) have standalone value to the customer and when no general right of return exists.
Copyright © 2013 www.secdatabase.com. All Rights Reserved.Please Consider the Environment Before Printing This Document
Contract value is allocated ratably to the units of accounting in the arrangement based on their relative selling prices determined as if thedeliverables were sold separately.
Revenues for long-term contracts that exceed certain internal thresholds regarding the size and duration of the project and
59
Copyright © 2013 www.secdatabase.com. All Rights Reserved.Please Consider the Environment Before Printing This Document
Table of Contents
FLOWSERVE CORPORATION
NOTES TO CONSOLIDATED FINANCIAL STATEMENTS — (Continued)
provide for the receipt of progress billings from the customer are recorded on the percentage of completion method with progressmeasured on a cost-to-cost basis. Percentage of completion revenue represents less than 9% of our consolidated sales for each yearpresented.
Revenue on service and repair contracts is recognized after services have been agreed to by the customer and rendered. Revenuesgenerated under fixed fee service and repair contracts are recognized on a ratable basis over the term of the contract. These contracts canrange in duration, but generally extend for up to five years. Fixed fee service contracts represent aproximately 1% of consolidated salesfor each year presented.
In certain instances, we provide guaranteed completion dates under the terms of our contracts. Failure to meet contractual deliverydates can result in late delivery penalties or non-recoverable costs. In instances where the payment of such costs are deemed to beprobable, we perform a project profitability analysis, accounting for such costs as a reduction of realizable revenues, which couldpotentially cause estimated total project costs to exceed projected total revenues realized from the project. In such instances, we wouldrecord reserves to cover such excesses in the period they are determined. In circumstances where the total projected revenues still exceedtotal projected costs, the incurrence of unrealized incentive fees or non-recoverable costs generally reduces profitability of the project atthe time of subsequent revenue recognition.
Cash and Cash Equivalents — We place temporary cash investments with financial institutions and, by policy, invest in thoseinstitutions and instruments that have minimal credit risk and market risk. These investments, with an original maturity of three monthsor less when purchased, are classified as cash equivalents. They are highly liquid and principal values are not subject to significant riskof change due to interest rate fluctuations.
Allowance for Doubtful Accounts and Credit Risk — The allowance for doubtful accounts is established based on estimates of theamount of uncollectible accounts receivable, which is determined principally based upon the aging of the accounts receivable, but alsocustomer credit history, industry and market segment information, economic trends and conditions and credit reports. Customer creditissues, customer bankruptcies or general economic conditions may also impact our estimates.
Credit risks are mitigated by the diversity of our customer base across many different geographic regions and industries andby performing creditworthiness analyses on our customers. Additionally, we mitigate credit risk through letters of credit and advancepayments received from our customers. As of December 31, 2011 and 2010, we do not believe that we have any significant concentrationsof credit risk.
Inventories and Related Reserves — Inventories are stated at the lower-of-cost or market. Cost is determined by the first-in, first-out method. Reserves for excess and obsolete inventories are based upon our assessment of market conditions for our products determinedby historical usage and estimated future demand. Due to the long life cycles of our products, we carry spare parts inventories that havehistorically low usage rates and provide reserves for such inventory based on demonstrated usage and aging criteria.
Income Taxes, Deferred Taxes, Tax Valuation Allowances and Tax Reserves — We account for income taxes under the asset andliability method. Deferred tax assets and liabilities are recognized for the future tax consequences attributable to differences betweenthe financial statement carrying amounts of existing assets and liabilities and their respective tax bases and operating loss and tax creditcarryforwards. Deferred tax assets and liabilities are calculated using enacted tax rates expected to apply to taxable income in the yearsin which those temporary differences are expected to be recovered or settled. The effect on deferred tax assets and liabilities of a changein tax rates is recognized in the period that includes the enactment date. We record valuation allowances to reflect the estimated amountof deferred tax assets that may not be realized based upon our analysis of existing deferred tax assets, net operating losses and tax creditsby jurisdiction and expectations of our ability to utilize these tax attributes through a review of past, current and estimated future taxableincome and establishment of tax strategies.
We provide deferred taxes for the temporary differences associated with our investment in foreign subsidiaries that have a financialreporting basis that exceeds tax basis, unless we can assert permanent reinvestment in foreign jurisdictions. Financial reporting basis andtax basis differences in investments in foreign subsidiaries consist of both unremitted earnings and losses, as well as foreign currencytranslation adjustments.
The amount of income taxes we pay is subject to ongoing audits by federal, state, and foreign tax authorities, which often result inproposed assessments. We establish reserves for open tax years for uncertain tax positions that may be subject to challenge by varioustax authorities. The consolidated tax provision and related accruals include the impact of such reasonably estimable losses and relatedinterest and penalties as deemed appropriate.
Copyright © 2013 www.secdatabase.com. All Rights Reserved.Please Consider the Environment Before Printing This Document
We recognize the tax benefit from an uncertain tax position only if it is more likely than not that the tax position will be sustainedon examination by the taxing authorities. The determination is based on the technical merits of the position and presumes
60
Copyright © 2013 www.secdatabase.com. All Rights Reserved.Please Consider the Environment Before Printing This Document
Table of Contents
FLOWSERVE CORPORATION
NOTES TO CONSOLIDATED FINANCIAL STATEMENTS — (Continued)
that each uncertain tax position will be examined by the relevant taxing authority that has full knowledge of all relevant information. Thetax benefits recognized in the financial statements from such a position are measured based on the largest benefit that has a greater thanfifty percent likelihood of being realized upon ultimate settlement.
While we believe we have adequately provided for any reasonably foreseeable outcome related to these matters, our future resultsmay include favorable or unfavorable adjustments to our estimated tax liabilities. To the extent that the expected tax outcome of thesematters changes, such changes in estimate will impact the income tax provision in the period in which such determination is made.
Legal and Environmental Accruals — Legal and environmental reserves are recorded based upon a case-by-case analysis of therelevant facts and circumstances and an assessment of potential legal obligations and costs. Amounts relating to legal and environmentalliabilities are recorded when it is probable that a loss has been incurred and such loss is estimable. Assessments of legal and environmentalcosts are based on information obtained from our independent and in-house experts and our loss experience in similar situations.Estimates are updated as applicable when new information regarding the facts and circumstances of each matter becomes available. Legalfees associated with legal and environmental liabilities are expensed as incurred.
Estimates of liabilities for unsettled asbestos-related claims are based on known claims and on our experience during the precedingtwo years for claims filed, settled and dismissed, with adjustments for events deemed unusual and unlikely to recur, and are included inretirement obligations and other liabilities in our consolidated balance sheets. A substantial majority of our asbestos-related claims arecovered by insurance or indemnities. Estimated indemnities and receivables from insurance carriers for unsettled claims and receivablesfor settlements and legal fees paid by us for asbestos-related claims are estimated using our historical experience with insurance recoveryrates and estimates of future recoveries, which include estimates of coverage and financial viability of our insurance carriers. Estimatedreceivables are included in other assets, net in our consolidated balance sheets. In one asbestos insurance related matter, we have a claimin litigation against relevant insurers substantially in excess of the recorded receivable. If our claim is resolved more favorably thanreflected in this receivable, we would benefit from a one-time gain in the amount of such excess. We are currently unable to estimate theimpact, if any, of unasserted asbestos-related claims, although future claims would also be subject to existing indemnities and insurancecoverage.
Warranty Accruals — Warranty obligations are based upon product failure rates, materials usage, service delivery costs, an analysisof all identified or expected claims and an estimate of the cost to resolve such claims. The estimates of expected claims are generally afactor of historical claims and known product issues. Warranty obligations based on these factors are adjusted based on historical salestrends for the preceding 24 months.
Insurance Accruals — Insurance accruals are recorded for wholly or partially self-insured risks such as medical benefits andworkers’ compensation and are based upon an analysis of our claim loss history, insurance deductibles, policy limits and other relevantfactors and are included in accrued liabilities in our consolidated balance sheets. The estimates are based upon information receivedfrom actuaries, insurance company adjusters, independent claims administrators or other independent sources. Changes in claims anddifferences between actual and expected claim losses could impact future accruals. Receivables from insurance carriers are estimatedusing our historical experience with insurance recovery rates and estimates of future recoveries, which include estimates of coverageand financial viability of our insurance carriers. Estimated receivables are included in accounts receivable, net and other assets, net, asapplicable, in our consolidated balance sheets.
Pension and Postretirement Obligations — Determination of pension and postretirement benefits obligations is based on estimatesmade by management in consultation with independent actuaries and investment advisors. Inherent in these valuations are assumptionsincluding discount rates, expected rates of return on plan assets, retirement rates, mortality rates and rates of compensation increase andother factors. Current market conditions, including changes in rates of return, interest rates and medical inflation rates, are considered inselecting these assumptions.
Actuarial gains and losses and prior service costs are recognized in accumulated other comprehensive loss as they arise and weamortize these costs into net pension expense over the remaining expected service period.
Valuation of Goodwill, Indefinite-Lived Intangible Assets and Other Long-Lived Assets — The value of goodwill and indefinite-lived intangible assets is tested for impairment as of December 31 each year or whenever events or circumstances indicate such assetsmay be impaired. In connection with our segment reorganization in 2010, we reallocated goodwill to our redefined reporting units andevaluated goodwill for impairment. The identification of our reporting units began at the operating segment level: EPD, IPD and FCD,and considered whether components one level below the operating segment levels should be identified as reporting units for purposeof testing goodwill for impairment based on certain conditions. These conditions included, among other factors, (i) the extent to whicha component represents a business and (ii) the aggregation of economically similar components within the operating segments and
Copyright © 2013 www.secdatabase.com. All Rights Reserved.Please Consider the Environment Before Printing This Document
resulted in nine reporting units. Other factors that were considered in determining whether the aggregation of components was appropriateincluded the similarity of the nature of the products and services, the
61
Copyright © 2013 www.secdatabase.com. All Rights Reserved.Please Consider the Environment Before Printing This Document
Table of Contents
FLOWSERVE CORPORATION
NOTES TO CONSOLIDATED FINANCIAL STATEMENTS — (Continued)
nature of the production processes, the methods of distribution and the types of industries served.
Impairment losses for goodwill are recognized whenever the implied fair value of goodwill is less than the carrying value. Weestimate the fair value of our reporting units based on an income approach, whereby we calculate the fair value of a reporting unitbased on the present value of estimated future cash flows. A discounted cash flow analysis requires us to make various judgmentalassumptions about future sales, operating margins, growth rates and discount rates, which are based on our budgets, business plans,economic projections, anticipated future cash flows and market participants. Assumptions are also made for varying perpetual growthrates for periods beyond the long-term business plan period. We did not record an impairment of goodwill in 2011, 2010 or 2009.
We also consider our market capitalization in our evaluation of the fair value of our goodwill. Although our market capitalizationdeclined compared with 2010, it did not decline to a level that indicated a potential impairment of our goodwill as of December 31, 2011.
Impairment losses for indefinite-lived intangible assets are recognized whenever the estimated fair value is less than the carryingvalue. Fair values are calculated for trademarks using a "relief from royalty" method, which estimates the fair value of the trademarksby determining the present value of the royalty payments that are avoided as a result of owning the trademark. This method includesjudgmental assumptions about sales growth and discount rates that have a significant impact on the fair value and are substantiallyconsistent with the assumptions used to determine the fair value of our reporting units discussed above. We did not record a materialimpairment of our trademarks in 2011, 2010 or 2009.
The net realizable value of other long-lived assets, including property, plant and equipment and finite-lived intangible assets, isreviewed periodically, when indicators of potential impairments are present, based upon an assessment of the estimated future cash flowsrelated to those assets, utilizing a methodology similar to that for goodwill. Additional considerations related to our long-lived assetsinclude expected maintenance and improvements, changes in expected uses and ongoing operating performance and utilization.
Property, Plant and Equipment and Depreciation — Property, plant and equipment are stated at historical cost, less accumulateddepreciation. If asset retirement obligations exist, they are capitalized as part of the carrying amount of the asset and depreciated over theremaining useful life of the asset. The useful lives of leasehold improvements are the lesser of the remaining lease term or the useful lifeof the improvement. When assets are retired or otherwise disposed of, their costs and related accumulated depreciation are removed fromthe accounts and any resulting gains or losses are included in income from operations for the period. Depreciation is computed by thestraight-line method based on the estimated useful lives of the depreciable assets. Generally, the estimated useful lives of the assets are:
Buildings and improvements 10 to 40 yearsFurniture and fixtures 3 to 7 yearsMachinery and equipment 3 to 14 yearsCapital leases (based on lease term) 3 to 25 years
Costs related to routine repairs and maintenance are expensed as incurred.
Internally Developed Software — We capitalize certain costs associated with the development of internal-use software. Generally,these costs are related to significant software development projects and are amortized over their estimated useful life, typically three tofive years, upon implementation of the software.
Intangible Assets — Intangible assets, excluding trademarks (which are considered to have an indefinite life), consist primarily ofengineering drawings, distribution networks, existing customer relationships, software, patents and other items that are being amortizedover their estimated useful lives generally ranging from 3 to 40 years. These assets are reviewed for impairment whenever events andcircumstances indicate impairment may have occurred.
Deferred Loan Costs — Deferred loan costs, consisting of fees and other expenses associated with debt financing, are amortizedover the term of the associated debt using the effective interest method. Additional amortization is recorded in periods where optionalprepayments on debt are made.
Fair Values of Financial Instruments — The carrying amounts of our financial instruments approximated fair value atDecember 31, 2011 and 2010.
Assets and liabilities recorded at fair value in our consolidated balance sheets are categorized based upon the level of judgmentassociated with the inputs used to measure their fair values. Hierarchical levels, as defined by Accounting Standards Codification
Copyright © 2013 www.secdatabase.com. All Rights Reserved.Please Consider the Environment Before Printing This Document

62
Copyright © 2013 www.secdatabase.com. All Rights Reserved.Please Consider the Environment Before Printing This Document
Table of Contents
FLOWSERVE CORPORATION
NOTES TO CONSOLIDATED FINANCIAL STATEMENTS — (Continued)
("ASC") 820, "Fair Value Measurements and Disclosures," are directly related to the amount of subjectivity associated with the inputs tofair valuation of these assets and liabilities. An asset or a liability’s categorization within the fair value hierarchy is based on the lowestlevel of significant input to its valuation. Hierarchical levels are as follows:
Level I — Inputs are unadjusted, quoted prices in active markets for identical assets or liabilities at the measurement date.
Level II — Inputs (other than quoted prices included in Level I) are either directly or indirectly observable for the asset orliability through correlation with market data at the measurement date and for the duration of the instrument’s anticipated life.
Level III — Inputs reflect management’s best estimate of what market participants would use in pricing the asset or liabilityat the measurement date. Consideration is given to the risk inherent in the valuation technique and the risk inherent in the inputs tothe model.
Derivatives and Hedging Activities — As part of our risk management strategy, we enter into derivative contracts to mitigate certainfinancial risks related to foreign currencies and interest rates. We have a risk-management and derivatives policy outlining the conditionsunder which we can enter into financial derivative transactions.
We employ a foreign currency economic hedging strategy to minimize potential losses in earnings or cash flows from unfavorableforeign currency exchange rate movements. This strategy also minimizes potential gains from favorable exchange rate movements.Foreign currency exposures arise from transactions, including firm commitments and anticipated transactions, denominated in a currencyother than an entity’s functional currency and from translation of foreign-denominated assets and liabilities into U.S. dollars. The primarycurrencies in which we operate, in addition to the U.S. dollar, are the Argentine peso, Australian dollar, Brazilian real, British pound,Canadian dollar, Chinese yuan, Colombian peso, Euro, Indian rupee, Japanese yen, Mexican peso, Singapore dollar, Swedish krona andVenezuelan bolivar. We enter into interest rate swap agreements for the purpose of hedging our exposure to floating interest rates oncertain portions of our debt.
Our policy to achieve hedge accounting treatment requires us to document all relationships between hedging instruments andhedged items, our risk management objective and strategy for entering into hedges and whether we intend to designate a formal hedgeaccounting relationship. This process includes linking all derivatives that are designated in a formal hedge accounting relationship as fairvalue, cash flow or foreign currency hedges of (1) specific assets and liabilities on the balance sheet or (2) specific firm commitmentsor forecasted transactions. In cases where we designate a hedge, we assess (both at the inception of the hedge and on an ongoing basis)whether the derivatives have been highly effective in offsetting changes in the fair value or cash flows of hedged items and whether thosederivatives may be expected to remain highly effective in future periods. Failure to demonstrate effectiveness in offsetting exposuresretroactively or prospectively would cause us to deem the hedge ineffective.
All derivatives are recognized on the balance sheet at their fair values. For derivatives that do not qualify for hedge accounting orfor which we have not elected to apply hedge accounting, which includes substantially all of our forward exchange contracts, the changesin the fair values of these derivatives are recognized in other income (expense), net in the consolidated statements of income.
At the inception of a new derivative contract for which formal hedge accounting has been elected, our policy requires us todesignate the derivative as a hedge of (a) a forecasted transaction or (b) the variability of cash flows that are to be received or paid inconnection with a recognized asset or liability (a "cash flow" hedge). We have not historically entered into hedges of fair values. Changesin the fair value of a derivative that is highly effective, documented, designated and qualified as a cash flow hedge, to the extent thatthe hedge is effective, are recorded in other comprehensive (expense) income, until earnings are affected by the variability of cash flowsof the hedged transaction. Upon settlement, realized gains and losses are recognized in other income (expense), net in the consolidatedstatements of income. Any hedge ineffectiveness (which represents the amount by which the changes in the fair value of the derivativedo not mirror the change in the cash flow of the forecasted transaction) is recorded in current period earnings.
We discontinue hedge accounting when:
• we deem the hedge to be ineffective and determine that the designation of the derivative as a hedging instrument is no longerappropriate;
• the derivative no longer effectively offsets changes in the cash flows of a hedged item (such as firm commitments or contracts);
• the derivative expires, terminates or is sold; or
63
Copyright © 2013 www.secdatabase.com. All Rights Reserved.Please Consider the Environment Before Printing This Document
Table of Contents
FLOWSERVE CORPORATION
NOTES TO CONSOLIDATED FINANCIAL STATEMENTS — (Continued)
• occurrence of the contracted or committed transaction is no longer probable, or will not occur in the originally expected period.
When hedge accounting is discontinued and the derivative remains outstanding, we carry the derivative at its estimated fair valueon the balance sheet, recognizing changes in the fair value in current period earnings. If a cash flow hedge becomes ineffective, anydeferred gains or losses on the cash flow hedge remain in accumulated other comprehensive loss until the exposure relating to the itemunderlying the hedge is recognized. If it becomes probable that a hedged forecasted transaction will not occur, deferred gains or losses onthe hedging instrument are recognized in earnings immediately.
Foreign Currency Translation — Assets and liabilities of our foreign subsidiaries are translated to U.S. dollars at exchange ratesprevailing at the balance sheet date, while income and expenses are translated at average rates for each month. Translation gains andlosses are reported as a component of accumulated other comprehensive loss.
Transaction and translation gains and losses arising from intercompany balances are reported as a component of accumulated othercomprehensive loss when the underlying transaction stems from a long-term equity investment or from debt designated as not due inthe foreseeable future. Otherwise, we recognize transaction gains and losses arising from intercompany transactions as a componentof income. Where intercompany balances are not long-term investment related or not designated as due beyond the foreseeable future,we may mitigate risk associated with foreign currency fluctuations by entering into forward exchange contracts. See Note 6 for furtherdiscussion of these forward exchange contracts.
Transactional currency gains and losses arising from transactions in currencies other than our sites’ functional currencies andchanges in fair value of forward exchange contracts that do not qualify for hedge accounting are included in our consolidated results ofoperations. For the years ended December 31, 2011, 2010 and 2009, we recognized net gains (losses) of $3.7 million, $(26.5) million and$(7.8) million, respectively, of such amounts in other income (expense), net in the accompanying consolidated statements of income.
Stock-Based Compensation — Stock-based compensation is measured at the grant-date fair value. The exercise price of stockoption awards and the value of restricted share, restricted share unit and performance-based unit awards (collectively referred to as"Restricted Shares") are set at the closing price of our common stock on the New York Stock Exchange on the date of grant, which is thedate such grants are authorized by our Board of Directors. Restricted share units and performance-based units refer to restricted awardsthat do not have voting rights and accrue dividends, which are forfeited if vesting does not occur.
Options are expensed using the graded vesting model, whereby we recognize compensation cost over the requisite service periodfor each separately vesting tranche of the award. We adjust share-based compensation at least annually for changes to the estimateof expected equity award forfeitures based on actual forfeiture experience. The intrinsic value of Restricted Shares, which is typicallythe product of share price at the date of grant and the number of Restricted Shares granted, is amortized on a straight-line basis tocompensation expense over the periods in which the restrictions lapse based on the expected number of shares that will vest. Theforfeiture rate is based on unvested Restricted Shares forfeited compared with original total Restricted Shares granted over a 4-yearperiod, excluding significant forfeiture events that are not expected to recur.
Earnings Per Share — We use the two-class method of calculating Earnings Per Share ("EPS"). The "two-class" method is anearnings allocation formula that determines earnings per share for each class of common stock and participating security as if all earningsfor the period had been distributed. Unvested restricted share awards that earn non-forfeitable dividend rights qualify as participatingsecurities and, accordingly, are included in the basic computation as such. Our unvested restricted shares participate on an equal basiswith common shares; therefore, there is no difference in undistributed earnings allocated to each participating security. Accordingly, thepresentation below is prepared on a combined basis and is presented as earnings per common share. The following is a reconciliation ofnet earnings of Flowserve Corporation and weighted average shares for calculating basic net earnings per common share.
64
Copyright © 2013 www.secdatabase.com. All Rights Reserved.Please Consider the Environment Before Printing This Document
Table of Contents
FLOWSERVE CORPORATION
NOTES TO CONSOLIDATED FINANCIAL STATEMENTS — (Continued)
Earnings per weighted average common share outstanding was calculated as follows:
Year Ended December 31,
2011 2010 2009
(Amounts in thousands, except per share data)
Net earnings of Flowserve Corporation $ 428,582 $ 388,290 $ 427,887Dividends on restricted shares not expected to vest 15 16 23
Earnings attributable to common and participating shareholders $ 428,597 $ 388,306 $ 427,910
Weighted average shares:Common stock 55,273 55,434 55,400Participating securities 270 330 440Denominator for basic earnings per common share 55,543 55,764 55,840Effect of potentially dilutive securities 559 651 522
Denominator for diluted earnings per common share 56,102 56,415 56,362Net earnings per share attributable to Flowserve Corporation commonshareholders:
Basic $ 7.72 $ 6.96 $ 7.66Diluted 7.64 6.88 7.59
Diluted earnings per share above is based upon the weighted average number of shares as determined for basic earnings per shareplus shares potentially issuable in conjunction with stock options and Restricted Shares.
For each of the three years ended December 31, 2011, 2010 and 2009, we had no options to purchase common stock that wereexcluded from the computations of potentially dilutive securities.
Research and Development Expense — Research and development costs are charged to expense when incurred. Aggregate researchand development costs included in selling, general and administrative expenses ("SG&A") were $35.0 million, $29.5 million and$29.4 million in 2011, 2010 and 2009, respectively. Costs incurred for research and development primarily include salaries and benefitsand consumable supplies, as well as rent, professional fees, utilities and the depreciation of property and equipment used in research anddevelopment activities.
Business Combinations — All business combinations referred to in these financial statements used the purchase method ofaccounting, under which we allocate the purchase price to the identifiable tangible and intangible assets and liabilities, recognizinggoodwill when the purchase price exceeds fair value of such identifiable assets acquired, net of liabilities assumed.
Accounting Developments
Pronouncements Implemented
In January 2010, the Financial Accounting Standards Board ("FASB") issued Accounting Standards Update ("ASU") No. 2010-06,"Fair Value Measurements and Disclosures (ASC 820): Improving Disclosures about Fair Value Measurements," which requiresadditional disclosures on transfers in and out of Level I and Level II and on activity for Level III fair value measurements. The newdisclosures and clarifications of existing disclosures are effective for interim and annual reporting periods beginning after December 15,2009, except for the disclosures of Level III activity, which are effective for fiscal years beginning after December 15, 2010 and forinterim periods within those fiscal years. Our adoption of ASU No. 2010-06 had no material impact on our consolidated financialcondition or results of operations.
In September 2009, the FASB issued ASU No. 2009-13, "Revenue Recognition (ASC 605): Multiple-Deliverable RevenueArrangements - a consensus of the FASB Emerging Issues Task Force," which addresses the accounting for multiple-deliverablearrangements to enable vendors to account for products or services separately rather than as a combined unit and requires expandedrevenue recognition policy disclosures. This amendment addresses how to separate deliverables and how to measure and allocate
Copyright © 2013 www.secdatabase.com. All Rights Reserved.Please Consider the Environment Before Printing This Document

arrangement consideration to one or more units of accounting. Our adoption of ASU No. 2009-13, effective January 1, 2011, had noimpact on our consolidated financial condition or results of operations.
In December 2010, the FASB issued ASU No. 2010-28, "Intangibles - Goodwill and Other (ASC 350): When to Perform Step 2 ofthe Goodwill Impairment Test for Reporting Units with Zero or Negative Carrying Amounts - a consensus of the FASB
65
Copyright © 2013 www.secdatabase.com. All Rights Reserved.Please Consider the Environment Before Printing This Document
Table of Contents
FLOWSERVE CORPORATION
NOTES TO CONSOLIDATED FINANCIAL STATEMENTS — (Continued)
Emerging Issues Task Force," which modifies Step 1 of the goodwill impairment test for reporting units with zero or negative carryingamounts. This amendment requires an entity to perform Step 2 of the goodwill impairment test if it is more likely than not that a goodwillimpairment exists and to consider whether there are any adverse qualitative factors indicating that an impairment may exist. Our adoptionof ASU No. 2010-28, effective January 1, 2011, had no impact on our consolidated financial condition or results of operations.
In December 2010, the FASB issued ASU No. 2010-29, "Business Combinations (ASC 805): Disclosure of Supplementary ProForma Information for Business Combinations - a consensus of the FASB Emerging Issues Task Force," which specifies that if a publicentity presents comparative financial statements, the entity should disclose revenue and earnings of the combined entity as though thebusiness combination that occurred during the current year had occurred as of the beginning of the comparable prior annual reportingperiod only. This amendment also expands the supplemental pro forma disclosures under ASC 805 to include a description of the natureand amount of material, nonrecurring pro forma adjustments directly attributable to the business combination included in the reported proforma revenue and earnings. Our adoption of ASU No. 2010-29, effective January 1, 2011, had no material impact on our consolidatedfinancial condition or results of operations.
Pronouncements Not Yet Implemented
In June 2011, the FASB issued ASU No. 2011-05, "Comprehensive Income (ASC 220): Presentation of Comprehensive Income,"which specifies that an entity has the option to present the total of comprehensive income, the components of net income, and thecomponents of other comprehensive income either in a single continuous statement of comprehensive income or in two separate butconsecutive statements. This amendment also requires an entity to present on the face of the financial statements reclassificationadjustments for items that are reclassified from other comprehensive income to net income. In December 2011, the FASB issued ASUNo. 2011-12 to defer the requirement to present on the face of the financial statements reclassification adjustments for items thatare reclassified from other comprehensive income to net income. ASU No. 2011-05 and 2011-12 are effective for fiscal years, andinterim periods within those years, beginning after December 15, 2011. The presentation and disclosure requirements shall be appliedretrospectively for all periods presented. The adoption of ASU No. 2011-05 and 2011-12 will not have an impact on our consolidatedfinancial condition and results of operations.
In September 2011, the FASB issued ASU No. 2011-08, "Intangibles - Goodwill and Other (ASC 350): Testing Goodwill forImpairment," which specifies that an entity has the option to first assess qualitative factors to determine whether it is more likely thannot that the fair value of a reporting unit is less than its carrying amount as a basis for determining whether it is necessary to performthe two-step goodwill impairment test. An entity is not required to calculate the fair value of a reporting unit unless the entity determinesthat it is more likely than not that its fair value is less than its carrying amount. ASU No. 2011-08 is effective for fiscal years, and interimperiods within those years, beginning after December 15, 2011. We do not expect the adoption of ASU No. 2011-08 to have a materialimpact on our consolidated financial condition and results of operations.
In December 2011, the FASB issued ASU No. 2011-11, "Disclosures about Offsetting Assets and Liabilities," which requiresenhanced disclosures about financial instruments and derivative instruments that are either (1) offset in accordance with either ASC210-20-45, "Balance Sheet - Offsetting," or ASC 815-10-45, "Derivatives and Hedging - Overall," or (2) subject to an enforceable masternetting arrangement or similar agreement, irrespective of whether they are offset in accordance with either ASC 210-20-45 or ASC815-10-45. The adoption of ASU No. 2011-11 will not have an impact on our consolidated financial condition and results of operations.
2. ACQUISITIONS
Lawrence Pumps, Inc.
Effective October 28, 2011, we acquired for inclusion in EPD, 100% of Lawrence Pumps, Inc. ("LPI"), a privately-owned, U.S.-based pump manufacturer, in a share purchase for cash of $89.6 million, subject to final adjustments. LPI specializes in the design,development and manufacture of engineered centrifugal slurry pumps for critical services within the petroleum refining, petrochemical,pulp and paper and energy markets. Under the terms of the purchase agreement, we deposited $1.5 million into escrow to be heldand applied against any breach of representations, warranties or indemnities for 24 months. Additionally, we have the right to makeindemnification claims up to 15% of the purchase price for 18 months. At the expiration of the escrow period, any residual amounts shallbe released to the sellers in satisfaction of the purchase price.
66
Copyright © 2013 www.secdatabase.com. All Rights Reserved.Please Consider the Environment Before Printing This Document
Table of Contents
FLOWSERVE CORPORATION
NOTES TO CONSOLIDATED FINANCIAL STATEMENTS — (Continued)
The purchase price was allocated on a preliminary basis to the assets acquired and liabilities assumed based on estimates of fairvalues at the date of acquisition and is summarized below:
(Amounts in millions)
Current assets $ 28.0Property, plant and equipment 8.9Intangible assets 30.0Current liabilities (16.6)Net tangible and intangible assets 50.3Goodwill 39.3
Purchase price $ 89.6
The excess of the acquisition date fair value of the total purchase price over the estimated fair value of the net tangible andintangible assets was recorded as goodwill. Goodwill represents the value expected to be obtained from the ability to be more competitivethrough the offering of a more complete pump product portfolio and from leveraging our current sales, distribution and service network.LPI products have proprietary niche applications that strategically complement our product portfolio. The goodwill related to thisacquisition is recorded in the EPD segment and is not expected to be deductible for tax purposes. Finite-lived intangible assets haveexpected weighted average useful lives of ten years.
Subsequent to October 28, 2011, the revenues and expenses of LPI have been included in our consolidated statements of income.No pro forma information has been provided due to immateriality. LPI generated approximately $44 million in sales during its fiscal yearended December 31, 2010.
Valbart Srl
Effective July 16, 2010, we acquired for inclusion in FCD, 100% of Valbart Srl ("Valbart"), a privately-owned Italian valvemanufacturer, in a share purchase for cash of $199.4 million, which included $33.8 million of existing Valbart net debt (defined asValbart’s third party debt less cash on hand) that was repaid at closing. Valbart manufactures trunnion-mounted ball valves used primarilyin upstream and midstream oil and gas applications, which enables us to offer a more complete valve product portfolio to our oil and gasproject customers. The acquisition included Valbart’s portion of the joint venture with us that we entered into in December 2009 that wasnot operational during 2010. Under the terms of the purchase agreement, we deposited $5.8 million into escrow to be held and appliedagainst any breach of representations, warranties or indemnities for 30 months. At the expiration of the escrow, any residual amountsshall be released to the sellers in satisfaction of the purchase price.
67
Copyright © 2013 www.secdatabase.com. All Rights Reserved.Please Consider the Environment Before Printing This Document

Table of Contents
FLOWSERVE CORPORATION
NOTES TO CONSOLIDATED FINANCIAL STATEMENTS — (Continued)
The purchase price was allocated to the assets acquired and liabilities assumed based on estimates of fair values at the date ofacquisition and is summarized below:
(Amounts in millions)
Accounts receivable $ 12.2Inventories 39.6Deferred taxes 8.7Prepaid expenses and other 1.0Intangible assets
Existing customer relationships 16.3Trademarks 11.5Non-compete agreements 2.7Engineering drawings 2.3
Property, plant and equipment 10.1Current liabilities (36.8)Noncurrent liabilities (13.6)Net tangible and intangible assets 54.0Goodwill 145.4
Purchase price $ 199.4
The excess of the acquisition date fair value of the total purchase price over the estimated fair value of the net tangible andintangible assets was recorded as goodwill. Goodwill represents the value expected to be obtained from the ability to be more competitivethrough the offering of a more complete valve product portfolio and from leveraging our current sales, distribution and service network.The goodwill related to this acquisition is recorded in the FCD segment and is not expected to be deductible for tax purposes. Trademarksare indefinite-lived intangible assets. Existing customer relationships, non-compete agreements and engineering drawings have expectedweighted average useful lives of five years, four years and ten years, respectively. In total, amortizable intangible assets have a weightedaverage useful life of approximately five years.
Subsequent to July 16, 2010, the revenues and expenses of Valbart have been included in our consolidated statements of income.No pro forma information has been provided due to immateriality.
Calder AG
Effective April 21, 2009, we acquired for inclusion in EPD, Calder AG ("Calder"), a private Swiss company and a supplier ofenergy recovery technology for use in the global desalination market, for up to $44.1 million, net of cash acquired. Of the total purchaseprice, $28.4 million was paid at closing and $2.4 million was paid after the working capital valuation was completed in early July 2009.The remaining $13.3 million of the total purchase price was contingent upon Calder achieving certain performance metrics during thetwelve months following the acquisition, and, to the extent achieved, was expected to be paid in cash within 12 months of the acquisitiondate. We initially recognized a liability of $4.4 million as an estimate of the acquisition date fair value of the contingent consideration,which was based on the weighted probability of achievement of the performance metrics over a specified period of time as of the date ofthe acquisition.
The purchase price was allocated to the assets acquired and liabilities assumed based on estimates of fair values at the date ofacquisition. The excess of the acquisition date fair value of the total purchase price over the estimated fair value of the net tangible andintangible assets was recorded as goodwill. No pro forma information has been provided due to immateriality.
During the second half of 2009, the estimated fair value of the contingent consideration was reduced to $0 based on 2009 resultsand an updated weighted probability of achievement of the performance metrics. The resulting gain was included in SG&A in ourconsolidated statement of income. The final measurement date of the performance metrics was March 31, 2010. The performance metricswere not met, resulting in no payment of contingent consideration.
Copyright © 2013 www.secdatabase.com. All Rights Reserved.Please Consider the Environment Before Printing This Document

68
Copyright © 2013 www.secdatabase.com. All Rights Reserved.Please Consider the Environment Before Printing This Document
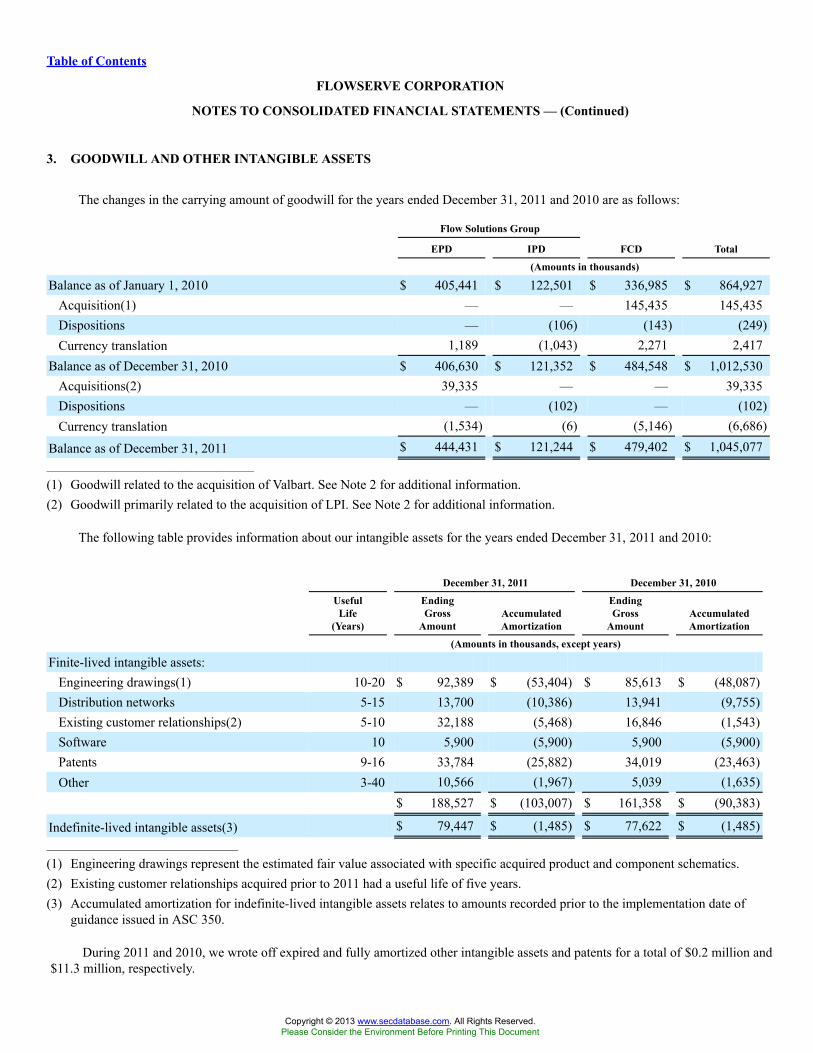
Table of Contents
FLOWSERVE CORPORATION
NOTES TO CONSOLIDATED FINANCIAL STATEMENTS — (Continued)
3. GOODWILL AND OTHER INTANGIBLE ASSETS
The changes in the carrying amount of goodwill for the years ended December 31, 2011 and 2010 are as follows:
Flow Solutions Group
EPD IPD FCD Total
(Amounts in thousands)
Balance as of January 1, 2010 $ 405,441 $ 122,501 $ 336,985 $ 864,927Acquisition(1) — — 145,435 145,435Dispositions — (106) (143) (249)Currency translation 1,189 (1,043) 2,271 2,417
Balance as of December 31, 2010 $ 406,630 $ 121,352 $ 484,548 $ 1,012,530Acquisitions(2) 39,335 — — 39,335Dispositions — (102) — (102)Currency translation (1,534) (6) (5,146) (6,686)
Balance as of December 31, 2011 $ 444,431 $ 121,244 $ 479,402 $ 1,045,077_______________________________________
(1) Goodwill related to the acquisition of Valbart. See Note 2 for additional information.(2) Goodwill primarily related to the acquisition of LPI. See Note 2 for additional information.
The following table provides information about our intangible assets for the years ended December 31, 2011 and 2010:
December 31, 2011 December 31, 2010
UsefulLife
(Years)
EndingGross
AmountAccumulatedAmortization
EndingGross
AmountAccumulatedAmortization
(Amounts in thousands, except years)
Finite-lived intangible assets:Engineering drawings(1) 10-20 $ 92,389 $ (53,404) $ 85,613 $ (48,087)Distribution networks 5-15 13,700 (10,386) 13,941 (9,755)Existing customer relationships(2) 5-10 32,188 (5,468) 16,846 (1,543)Software 10 5,900 (5,900) 5,900 (5,900)Patents 9-16 33,784 (25,882) 34,019 (23,463)Other 3-40 10,566 (1,967) 5,039 (1,635)
$ 188,527 $ (103,007) $ 161,358 $ (90,383)
Indefinite-lived intangible assets(3) $ 79,447 $ (1,485) $ 77,622 $ (1,485)____________________________________
(1) Engineering drawings represent the estimated fair value associated with specific acquired product and component schematics.(2) Existing customer relationships acquired prior to 2011 had a useful life of five years.(3) Accumulated amortization for indefinite-lived intangible assets relates to amounts recorded prior to the implementation date of
guidance issued in ASC 350.
During 2011 and 2010, we wrote off expired and fully amortized other intangible assets and patents for a total of $0.2 million and$11.3 million, respectively.
Copyright © 2013 www.secdatabase.com. All Rights Reserved.Please Consider the Environment Before Printing This Document

69
Copyright © 2013 www.secdatabase.com. All Rights Reserved.Please Consider the Environment Before Printing This Document
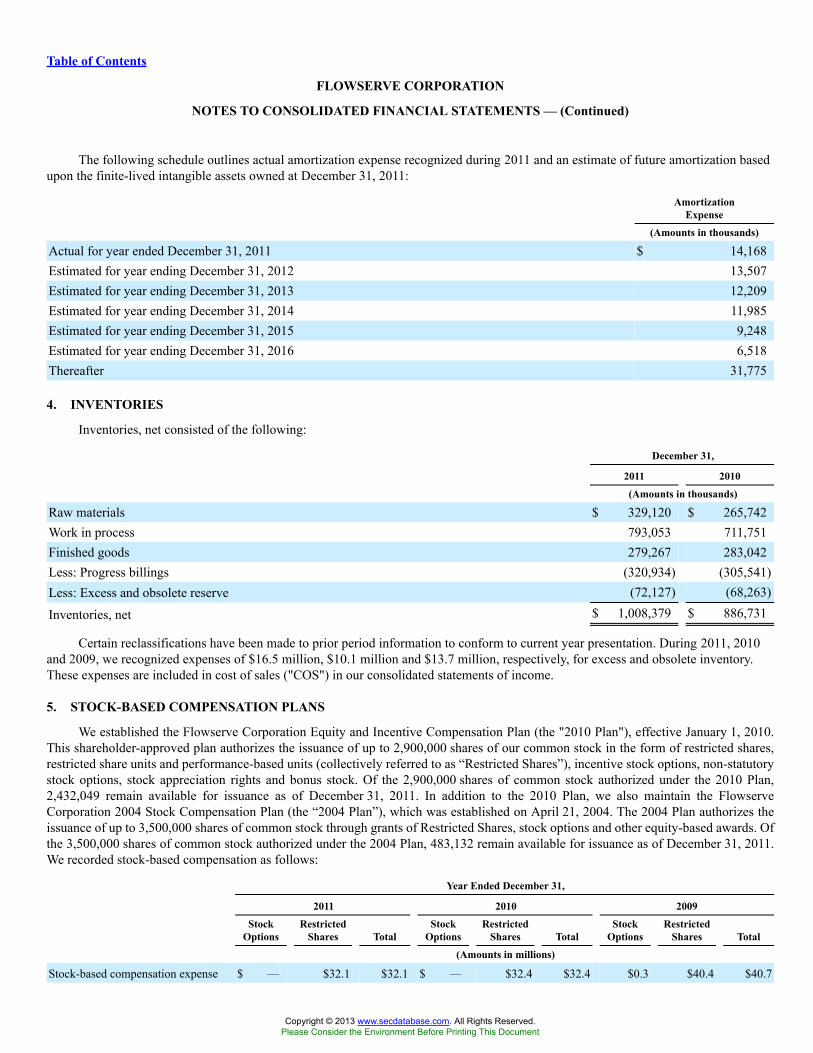
Table of Contents
FLOWSERVE CORPORATION
NOTES TO CONSOLIDATED FINANCIAL STATEMENTS — (Continued)
The following schedule outlines actual amortization expense recognized during 2011 and an estimate of future amortization basedupon the finite-lived intangible assets owned at December 31, 2011:
AmortizationExpense
(Amounts in thousands)
Actual for year ended December 31, 2011 $ 14,168Estimated for year ending December 31, 2012 13,507Estimated for year ending December 31, 2013 12,209Estimated for year ending December 31, 2014 11,985Estimated for year ending December 31, 2015 9,248Estimated for year ending December 31, 2016 6,518Thereafter 31,775
4. INVENTORIES
Inventories, net consisted of the following:
December 31,
2011 2010
(Amounts in thousands)
Raw materials $ 329,120 $ 265,742Work in process 793,053 711,751Finished goods 279,267 283,042Less: Progress billings (320,934) (305,541)Less: Excess and obsolete reserve (72,127) (68,263)
Inventories, net $ 1,008,379 $ 886,731
Certain reclassifications have been made to prior period information to conform to current year presentation. During 2011, 2010and 2009, we recognized expenses of $16.5 million, $10.1 million and $13.7 million, respectively, for excess and obsolete inventory.These expenses are included in cost of sales ("COS") in our consolidated statements of income.
5. STOCK-BASED COMPENSATION PLANS
We established the Flowserve Corporation Equity and Incentive Compensation Plan (the "2010 Plan"), effective January 1, 2010.This shareholder-approved plan authorizes the issuance of up to 2,900,000 shares of our common stock in the form of restricted shares,restricted share units and performance-based units (collectively referred to as “Restricted Shares”), incentive stock options, non-statutorystock options, stock appreciation rights and bonus stock. Of the 2,900,000 shares of common stock authorized under the 2010 Plan,2,432,049 remain available for issuance as of December 31, 2011. In addition to the 2010 Plan, we also maintain the FlowserveCorporation 2004 Stock Compensation Plan (the “2004 Plan”), which was established on April 21, 2004. The 2004 Plan authorizes theissuance of up to 3,500,000 shares of common stock through grants of Restricted Shares, stock options and other equity-based awards. Ofthe 3,500,000 shares of common stock authorized under the 2004 Plan, 483,132 remain available for issuance as of December 31, 2011.We recorded stock-based compensation as follows:
Year Ended December 31,
2011 2010 2009
StockOptions
RestrictedShares Total
StockOptions
RestrictedShares Total
StockOptions
RestrictedShares Total
(Amounts in millions)
Stock-based compensation expense $ — $32.1 $32.1 $ — $32.4 $32.4 $0.3 $40.4 $40.7
Copyright © 2013 www.secdatabase.com. All Rights Reserved.Please Consider the Environment Before Printing This Document
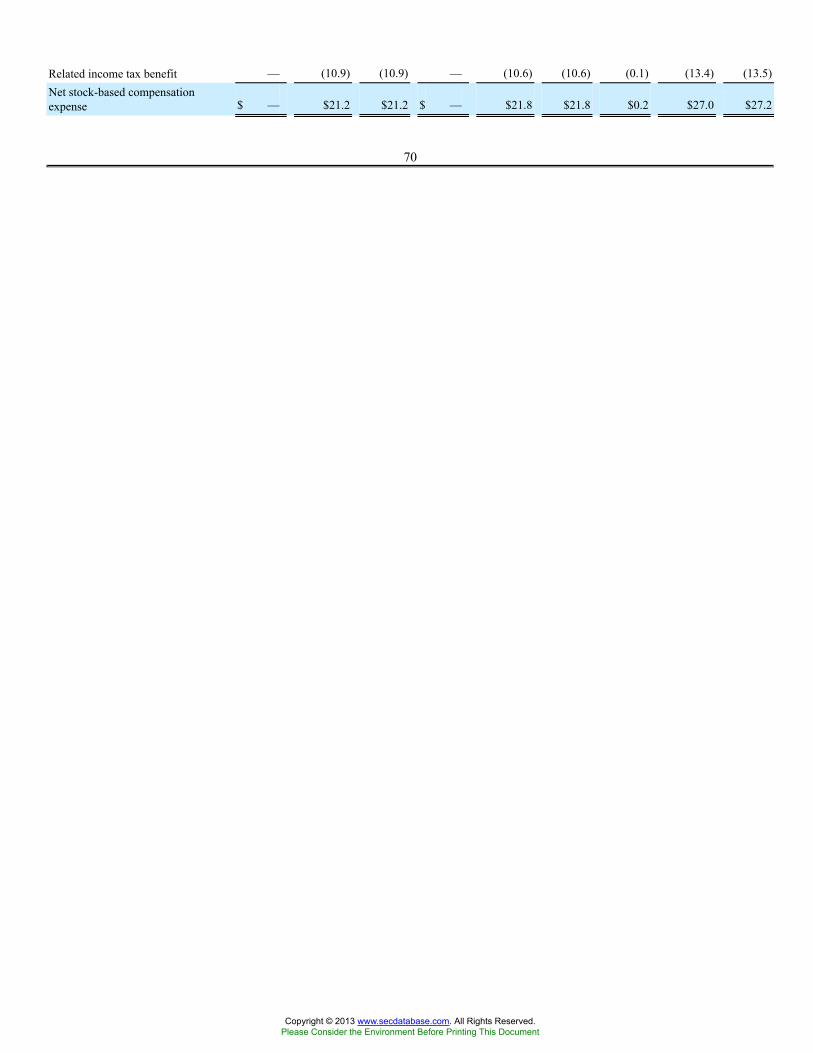
Related income tax benefit — (10.9) (10.9) — (10.6) (10.6) (0.1) (13.4) (13.5)Net stock-based compensationexpense $ — $21.2 $21.2 $ — $21.8 $21.8 $0.2 $27.0 $27.2
70
Copyright © 2013 www.secdatabase.com. All Rights Reserved.Please Consider the Environment Before Printing This Document
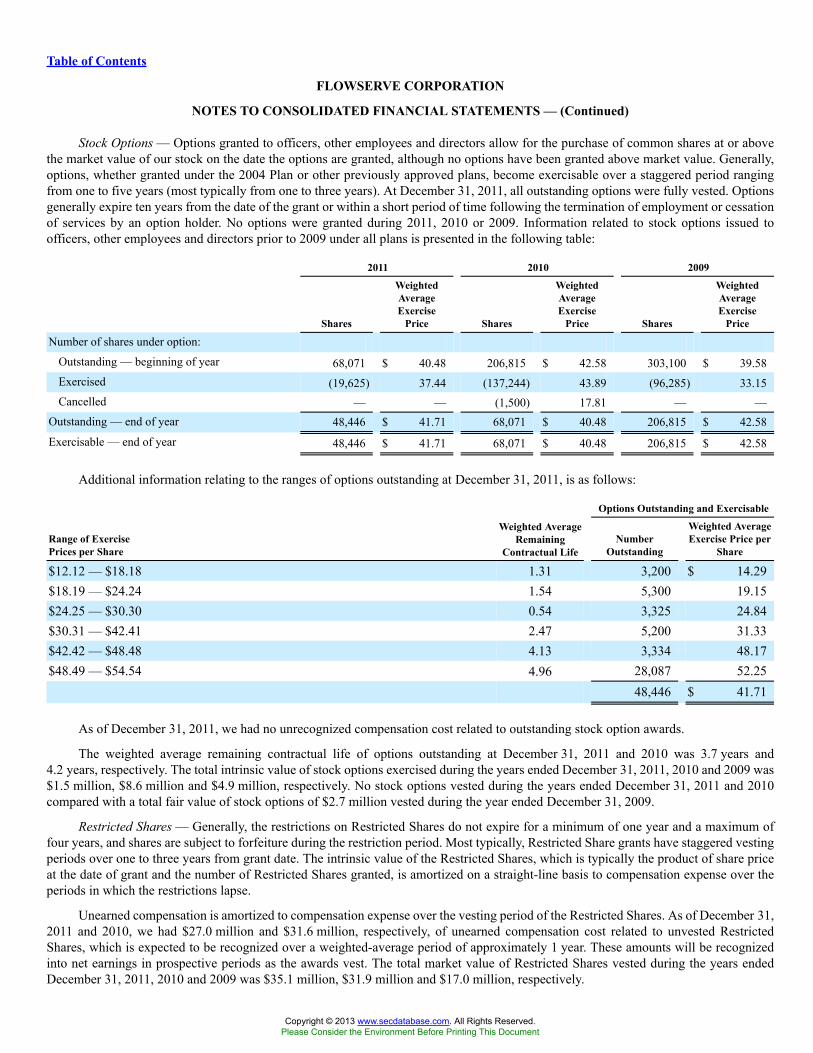
Table of Contents
FLOWSERVE CORPORATION
NOTES TO CONSOLIDATED FINANCIAL STATEMENTS — (Continued)
Stock Options — Options granted to officers, other employees and directors allow for the purchase of common shares at or abovethe market value of our stock on the date the options are granted, although no options have been granted above market value. Generally,options, whether granted under the 2004 Plan or other previously approved plans, become exercisable over a staggered period rangingfrom one to five years (most typically from one to three years). At December 31, 2011, all outstanding options were fully vested. Optionsgenerally expire ten years from the date of the grant or within a short period of time following the termination of employment or cessationof services by an option holder. No options were granted during 2011, 2010 or 2009. Information related to stock options issued toofficers, other employees and directors prior to 2009 under all plans is presented in the following table:
2011 2010 2009
Shares
WeightedAverageExercise
Price Shares
WeightedAverageExercise
Price Shares
WeightedAverageExercise
Price
Number of shares under option:
Outstanding — beginning of year 68,071 $ 40.48 206,815 $ 42.58 303,100 $ 39.58Exercised (19,625) 37.44 (137,244) 43.89 (96,285) 33.15Cancelled — — (1,500) 17.81 — —
Outstanding — end of year 48,446 $ 41.71 68,071 $ 40.48 206,815 $ 42.58
Exercisable — end of year 48,446 $ 41.71 68,071 $ 40.48 206,815 $ 42.58
Additional information relating to the ranges of options outstanding at December 31, 2011, is as follows:
Options Outstanding and Exercisable
Range of ExercisePrices per Share
Weighted AverageRemaining
Contractual LifeNumber
Outstanding
Weighted AverageExercise Price per
Share
$12.12 — $18.18 1.31 3,200 $ 14.29$18.19 — $24.24 1.54 5,300 19.15$24.25 — $30.30 0.54 3,325 24.84$30.31 — $42.41 2.47 5,200 31.33$42.42 — $48.48 4.13 3,334 48.17$48.49 — $54.54 4.96 28,087 52.25
48,446 $ 41.71
As of December 31, 2011, we had no unrecognized compensation cost related to outstanding stock option awards.
The weighted average remaining contractual life of options outstanding at December 31, 2011 and 2010 was 3.7 years and4.2 years, respectively. The total intrinsic value of stock options exercised during the years ended December 31, 2011, 2010 and 2009 was$1.5 million, $8.6 million and $4.9 million, respectively. No stock options vested during the years ended December 31, 2011 and 2010compared with a total fair value of stock options of $2.7 million vested during the year ended December 31, 2009.
Restricted Shares — Generally, the restrictions on Restricted Shares do not expire for a minimum of one year and a maximum offour years, and shares are subject to forfeiture during the restriction period. Most typically, Restricted Share grants have staggered vestingperiods over one to three years from grant date. The intrinsic value of the Restricted Shares, which is typically the product of share priceat the date of grant and the number of Restricted Shares granted, is amortized on a straight-line basis to compensation expense over theperiods in which the restrictions lapse.
Unearned compensation is amortized to compensation expense over the vesting period of the Restricted Shares. As of December 31,2011 and 2010, we had $27.0 million and $31.6 million, respectively, of unearned compensation cost related to unvested RestrictedShares, which is expected to be recognized over a weighted-average period of approximately 1 year. These amounts will be recognizedinto net earnings in prospective periods as the awards vest. The total market value of Restricted Shares vested during the years endedDecember 31, 2011, 2010 and 2009 was $35.1 million, $31.9 million and $17.0 million, respectively.
Copyright © 2013 www.secdatabase.com. All Rights Reserved.Please Consider the Environment Before Printing This Document

71
Copyright © 2013 www.secdatabase.com. All Rights Reserved.Please Consider the Environment Before Printing This Document

Table of Contents
FLOWSERVE CORPORATION
NOTES TO CONSOLIDATED FINANCIAL STATEMENTS — (Continued)
The following table summarizes information regarding Restricted Shares:
Year Ended December 31, 2011
Shares
Weighted AverageGrant-Date Fair
Value
Number of unvested Restricted Shares:Outstanding — beginning of year 1,259,377 $ 77.05Granted 245,127 130.15Vested (395,434) 88.72Cancelled (56,871) 84.72
Outstanding — ending of year 1,052,199 $ 84.62
Unvested Restricted Shares outstanding as of December 31, 2011, includes 415,000 units with performance-based vestingprovisions. Performance-based units are issuable in common stock and vest upon the achievement of pre-defined performance targets,primarily based on our average annual return on net assets over a three-year period as compared with the same measure for a defined peergroup for the same period. Most units were granted in three annual grants since January 1, 2009 and have a vesting percentage between0% and 200% depending on the achievement of the specific performance targets. Compensation expense is recognized over a 36-monthcliff vesting period based on the fair market value of our common stock on the date of grant, as adjusted for anticipated forfeitures.During the performance period, earned and unearned compensation expense is adjusted based on changes in the expected achievement ofthe performance targets. Vesting provisions range from 0 to 817,000 shares based on performance targets. As of December 31, 2011, weestimate vesting of 744,000 shares based on expected achievement of performance targets.
6. DERIVATIVES AND HEDGING ACTIVITIES
Our risk management and derivatives policy specifies the conditions under which we may enter into derivative contracts. SeeNote 1 for additional information on our purpose for entering into derivatives not designated as hedging instruments and our overallrisk management strategies. We enter into forward exchange contracts to hedge our risks associated with transactions denominatedin currencies other than the local currency of the operation engaging in the transaction. At December 31, 2011 and 2010, we had$481.2 million and $358.5 million, respectively, of notional amount in outstanding forward exchange contracts with third parties. AtDecember 31, 2011, the length of forward exchange contracts currently in place ranged from 3 days to 19 months.
Also as part of our risk management program, we enter into interest rate swap agreements to hedge exposure to floating interestrates on certain portions of our debt. At December 31, 2011 and 2010, we had $330.0 million and $350.0 million, respectively, of notionalamount in outstanding interest rate swaps with third parties. All interest rate swaps are 100% effective. At December 31, 2011, themaximum remaining length of any interest rate contract in place was approximately 30 months.
We are exposed to risk from credit-related losses resulting from nonperformance by counterparties to our financial instruments.We perform credit evaluations of our counterparties under forward exchange contracts and interest rate swap agreements and expect allcounterparties to meet their obligations. We have not experienced credit losses from our counterparties.
The fair value of forward exchange contracts not designated as hedging instruments are summarized below:
Year Ended December 31,
2011 2010
(Amounts in thousands)
Current derivative assets $ 2,330 $ 4,397Noncurrent derivative assets 10 50Current derivative liabilities 11,196 2,949Noncurrent derivative liabilities 516 473
72
Copyright © 2013 www.secdatabase.com. All Rights Reserved.Please Consider the Environment Before Printing This Document

Copyright © 2013 www.secdatabase.com. All Rights Reserved.Please Consider the Environment Before Printing This Document
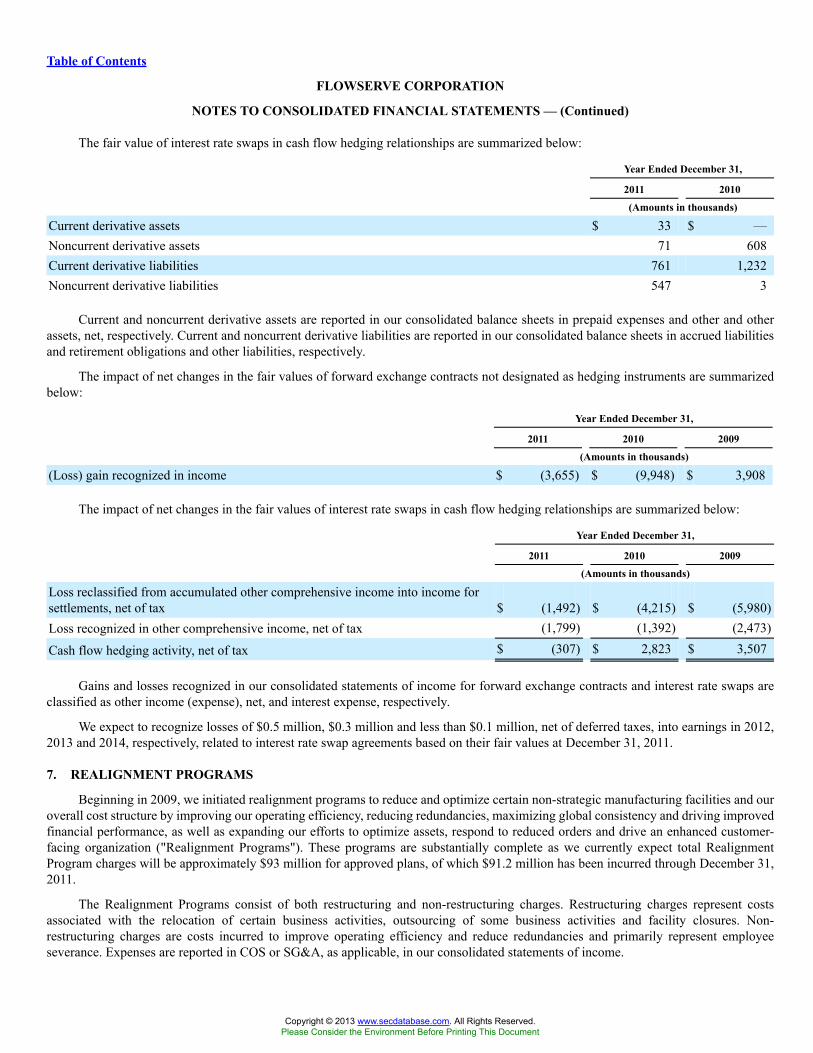
Table of Contents
FLOWSERVE CORPORATION
NOTES TO CONSOLIDATED FINANCIAL STATEMENTS — (Continued)
The fair value of interest rate swaps in cash flow hedging relationships are summarized below:
Year Ended December 31,
2011 2010
(Amounts in thousands)
Current derivative assets $ 33 $ —Noncurrent derivative assets 71 608Current derivative liabilities 761 1,232Noncurrent derivative liabilities 547 3
Current and noncurrent derivative assets are reported in our consolidated balance sheets in prepaid expenses and other and otherassets, net, respectively. Current and noncurrent derivative liabilities are reported in our consolidated balance sheets in accrued liabilitiesand retirement obligations and other liabilities, respectively.
The impact of net changes in the fair values of forward exchange contracts not designated as hedging instruments are summarizedbelow:
Year Ended December 31,
2011 2010 2009
(Amounts in thousands)
(Loss) gain recognized in income $ (3,655) $ (9,948) $ 3,908
The impact of net changes in the fair values of interest rate swaps in cash flow hedging relationships are summarized below:
Year Ended December 31,
2011 2010 2009
(Amounts in thousands)
Loss reclassified from accumulated other comprehensive income into income forsettlements, net of tax $ (1,492) $ (4,215) $ (5,980)Loss recognized in other comprehensive income, net of tax (1,799) (1,392) (2,473)
Cash flow hedging activity, net of tax $ (307) $ 2,823 $ 3,507
Gains and losses recognized in our consolidated statements of income for forward exchange contracts and interest rate swaps areclassified as other income (expense), net, and interest expense, respectively.
We expect to recognize losses of $0.5 million, $0.3 million and less than $0.1 million, net of deferred taxes, into earnings in 2012,2013 and 2014, respectively, related to interest rate swap agreements based on their fair values at December 31, 2011.
7. REALIGNMENT PROGRAMS
Beginning in 2009, we initiated realignment programs to reduce and optimize certain non-strategic manufacturing facilities and ouroverall cost structure by improving our operating efficiency, reducing redundancies, maximizing global consistency and driving improvedfinancial performance, as well as expanding our efforts to optimize assets, respond to reduced orders and drive an enhanced customer-facing organization ("Realignment Programs"). These programs are substantially complete as we currently expect total RealignmentProgram charges will be approximately $93 million for approved plans, of which $91.2 million has been incurred through December 31,2011.
The Realignment Programs consist of both restructuring and non-restructuring charges. Restructuring charges represent costsassociated with the relocation of certain business activities, outsourcing of some business activities and facility closures. Non-restructuring charges are costs incurred to improve operating efficiency and reduce redundancies and primarily represent employeeseverance. Expenses are reported in COS or SG&A, as applicable, in our consolidated statements of income.
Copyright © 2013 www.secdatabase.com. All Rights Reserved.Please Consider the Environment Before Printing This Document
Charges, net of adjustments, related to our Realignment Programs were $4.8 million, $18.3 million and $68.1 million for year endedDecember 31, 2011, 2010 and 2009, respectively.
Generally, the aforementioned charges were or will be paid in cash, except for asset write-downs, which are non-cash charges.Asset write-down charges of $3.0 million, $6.4 million and $6.1 million were recorded during 2011, 2010 and 2009, respectively.
73
Copyright © 2013 www.secdatabase.com. All Rights Reserved.Please Consider the Environment Before Printing This Document
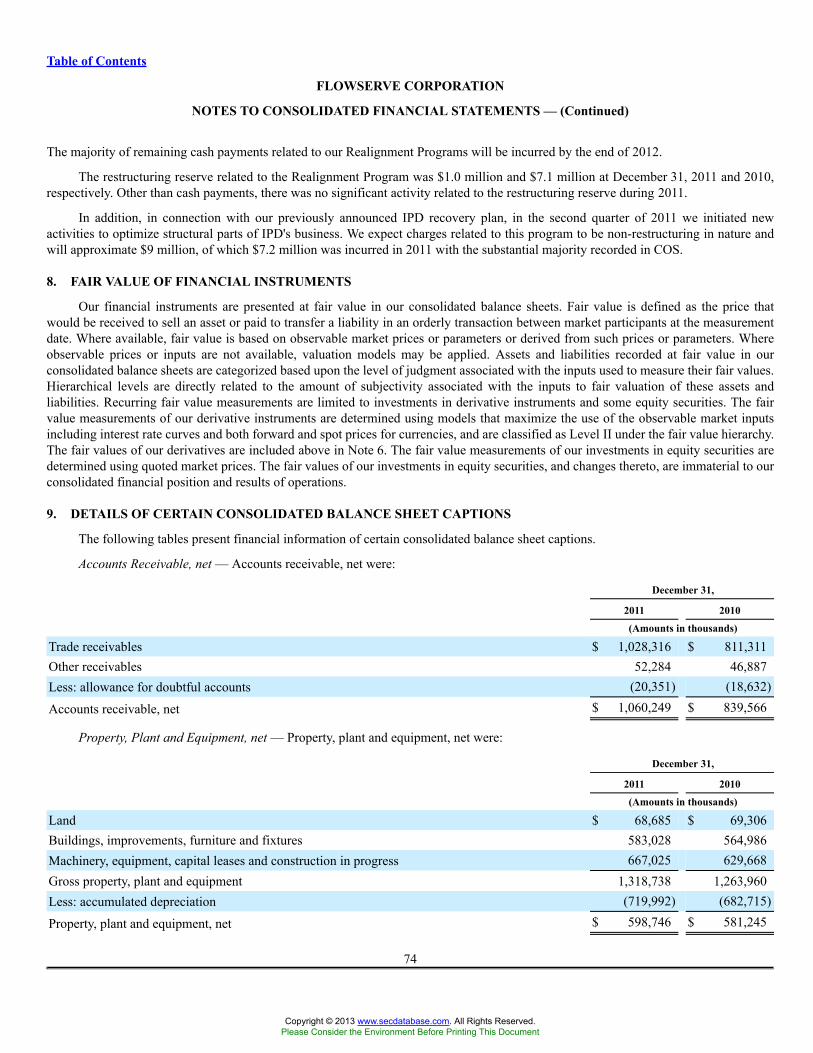
Table of Contents
FLOWSERVE CORPORATION
NOTES TO CONSOLIDATED FINANCIAL STATEMENTS — (Continued)
The majority of remaining cash payments related to our Realignment Programs will be incurred by the end of 2012.
The restructuring reserve related to the Realignment Program was $1.0 million and $7.1 million at December 31, 2011 and 2010,respectively. Other than cash payments, there was no significant activity related to the restructuring reserve during 2011.
In addition, in connection with our previously announced IPD recovery plan, in the second quarter of 2011 we initiated newactivities to optimize structural parts of IPD's business. We expect charges related to this program to be non-restructuring in nature andwill approximate $9 million, of which $7.2 million was incurred in 2011 with the substantial majority recorded in COS.
8. FAIR VALUE OF FINANCIAL INSTRUMENTS
Our financial instruments are presented at fair value in our consolidated balance sheets. Fair value is defined as the price thatwould be received to sell an asset or paid to transfer a liability in an orderly transaction between market participants at the measurementdate. Where available, fair value is based on observable market prices or parameters or derived from such prices or parameters. Whereobservable prices or inputs are not available, valuation models may be applied. Assets and liabilities recorded at fair value in ourconsolidated balance sheets are categorized based upon the level of judgment associated with the inputs used to measure their fair values.Hierarchical levels are directly related to the amount of subjectivity associated with the inputs to fair valuation of these assets andliabilities. Recurring fair value measurements are limited to investments in derivative instruments and some equity securities. The fairvalue measurements of our derivative instruments are determined using models that maximize the use of the observable market inputsincluding interest rate curves and both forward and spot prices for currencies, and are classified as Level II under the fair value hierarchy.The fair values of our derivatives are included above in Note 6. The fair value measurements of our investments in equity securities aredetermined using quoted market prices. The fair values of our investments in equity securities, and changes thereto, are immaterial to ourconsolidated financial position and results of operations.
9. DETAILS OF CERTAIN CONSOLIDATED BALANCE SHEET CAPTIONS
The following tables present financial information of certain consolidated balance sheet captions.
Accounts Receivable, net — Accounts receivable, net were:
December 31,
2011 2010
(Amounts in thousands)
Trade receivables $ 1,028,316 $ 811,311Other receivables 52,284 46,887Less: allowance for doubtful accounts (20,351) (18,632)
Accounts receivable, net $ 1,060,249 $ 839,566
Property, Plant and Equipment, net — Property, plant and equipment, net were:
December 31,
2011 2010
(Amounts in thousands)
Land $ 68,685 $ 69,306Buildings, improvements, furniture and fixtures 583,028 564,986Machinery, equipment, capital leases and construction in progress 667,025 629,668Gross property, plant and equipment 1,318,738 1,263,960Less: accumulated depreciation (719,992) (682,715)
Property, plant and equipment, net $ 598,746 $ 581,245
74
Copyright © 2013 www.secdatabase.com. All Rights Reserved.Please Consider the Environment Before Printing This Document
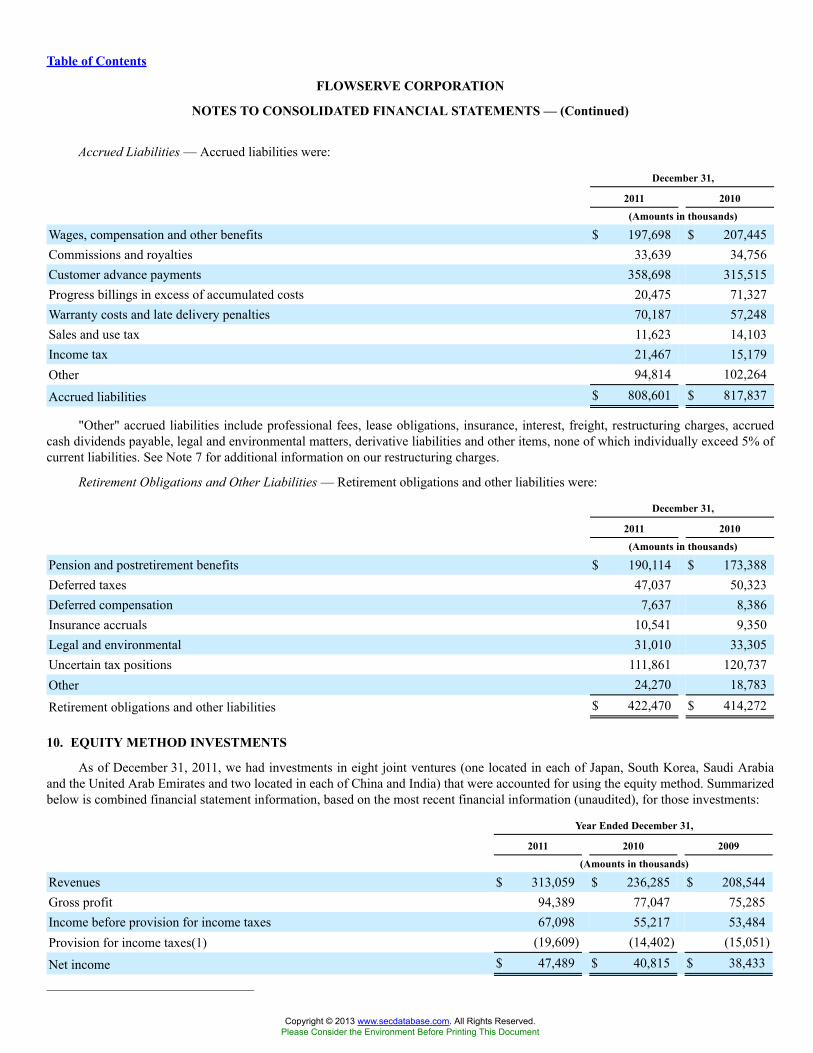
Table of Contents
FLOWSERVE CORPORATION
NOTES TO CONSOLIDATED FINANCIAL STATEMENTS — (Continued)
Accrued Liabilities — Accrued liabilities were:
December 31,
2011 2010
(Amounts in thousands)
Wages, compensation and other benefits $ 197,698 $ 207,445Commissions and royalties 33,639 34,756Customer advance payments 358,698 315,515Progress billings in excess of accumulated costs 20,475 71,327Warranty costs and late delivery penalties 70,187 57,248Sales and use tax 11,623 14,103Income tax 21,467 15,179Other 94,814 102,264
Accrued liabilities $ 808,601 $ 817,837
"Other" accrued liabilities include professional fees, lease obligations, insurance, interest, freight, restructuring charges, accruedcash dividends payable, legal and environmental matters, derivative liabilities and other items, none of which individually exceed 5% ofcurrent liabilities. See Note 7 for additional information on our restructuring charges.
Retirement Obligations and Other Liabilities — Retirement obligations and other liabilities were:
December 31,
2011 2010
(Amounts in thousands)
Pension and postretirement benefits $ 190,114 $ 173,388Deferred taxes 47,037 50,323Deferred compensation 7,637 8,386Insurance accruals 10,541 9,350Legal and environmental 31,010 33,305Uncertain tax positions 111,861 120,737Other 24,270 18,783
Retirement obligations and other liabilities $ 422,470 $ 414,272
10. EQUITY METHOD INVESTMENTS
As of December 31, 2011, we had investments in eight joint ventures (one located in each of Japan, South Korea, Saudi Arabiaand the United Arab Emirates and two located in each of China and India) that were accounted for using the equity method. Summarizedbelow is combined financial statement information, based on the most recent financial information (unaudited), for those investments:
Year Ended December 31,
2011 2010 2009
(Amounts in thousands)
Revenues $ 313,059 $ 236,285 $ 208,544Gross profit 94,389 77,047 75,285Income before provision for income taxes 67,098 55,217 53,484Provision for income taxes(1) (19,609) (14,402) (15,051)
Net income $ 47,489 $ 40,815 $ 38,433_______________________________________
Copyright © 2013 www.secdatabase.com. All Rights Reserved.Please Consider the Environment Before Printing This Document

(1) The provision for income taxes is based on the tax laws and rates in the countries in which our investees operate. The taxationregimes vary not only by their nominal rates, but also by the allowability of deductions, credits and other benefits.
75
Copyright © 2013 www.secdatabase.com. All Rights Reserved.Please Consider the Environment Before Printing This Document
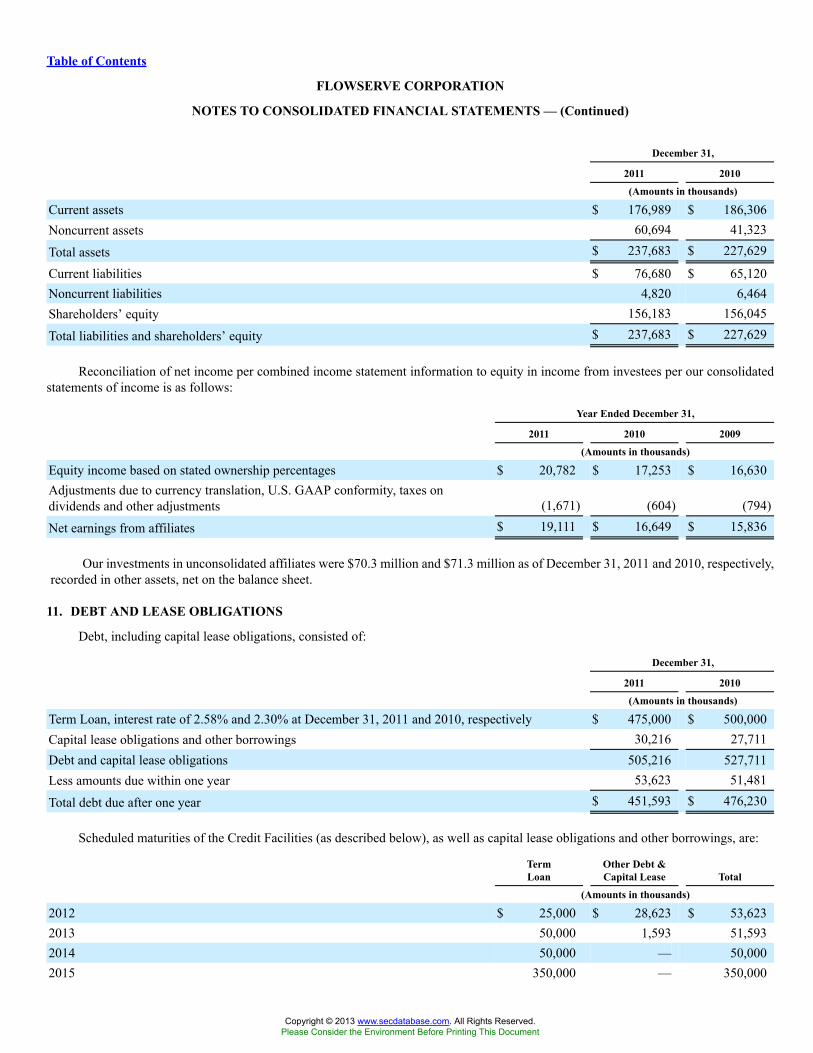
Table of Contents
FLOWSERVE CORPORATION
NOTES TO CONSOLIDATED FINANCIAL STATEMENTS — (Continued)
December 31,
2011 2010
(Amounts in thousands)
Current assets $ 176,989 $ 186,306Noncurrent assets 60,694 41,323
Total assets $ 237,683 $ 227,629
Current liabilities $ 76,680 $ 65,120Noncurrent liabilities 4,820 6,464Shareholders’ equity 156,183 156,045
Total liabilities and shareholders’ equity $ 237,683 $ 227,629
Reconciliation of net income per combined income statement information to equity in income from investees per our consolidatedstatements of income is as follows:
Year Ended December 31,
2011 2010 2009
(Amounts in thousands)
Equity income based on stated ownership percentages $ 20,782 $ 17,253 $ 16,630Adjustments due to currency translation, U.S. GAAP conformity, taxes ondividends and other adjustments (1,671) (604) (794)
Net earnings from affiliates $ 19,111 $ 16,649 $ 15,836
Our investments in unconsolidated affiliates were $70.3 million and $71.3 million as of December 31, 2011 and 2010, respectively,recorded in other assets, net on the balance sheet.
11. DEBT AND LEASE OBLIGATIONS
Debt, including capital lease obligations, consisted of:
December 31,
2011 2010
(Amounts in thousands)
Term Loan, interest rate of 2.58% and 2.30% at December 31, 2011 and 2010, respectively $ 475,000 $ 500,000Capital lease obligations and other borrowings 30,216 27,711Debt and capital lease obligations 505,216 527,711Less amounts due within one year 53,623 51,481
Total debt due after one year $ 451,593 $ 476,230
Scheduled maturities of the Credit Facilities (as described below), as well as capital lease obligations and other borrowings, are:
TermLoan
Other Debt &Capital Lease Total
(Amounts in thousands)
2012 $ 25,000 $ 28,623 $ 53,6232013 50,000 1,593 51,5932014 50,000 — 50,0002015 350,000 — 350,000
Copyright © 2013 www.secdatabase.com. All Rights Reserved.Please Consider the Environment Before Printing This Document
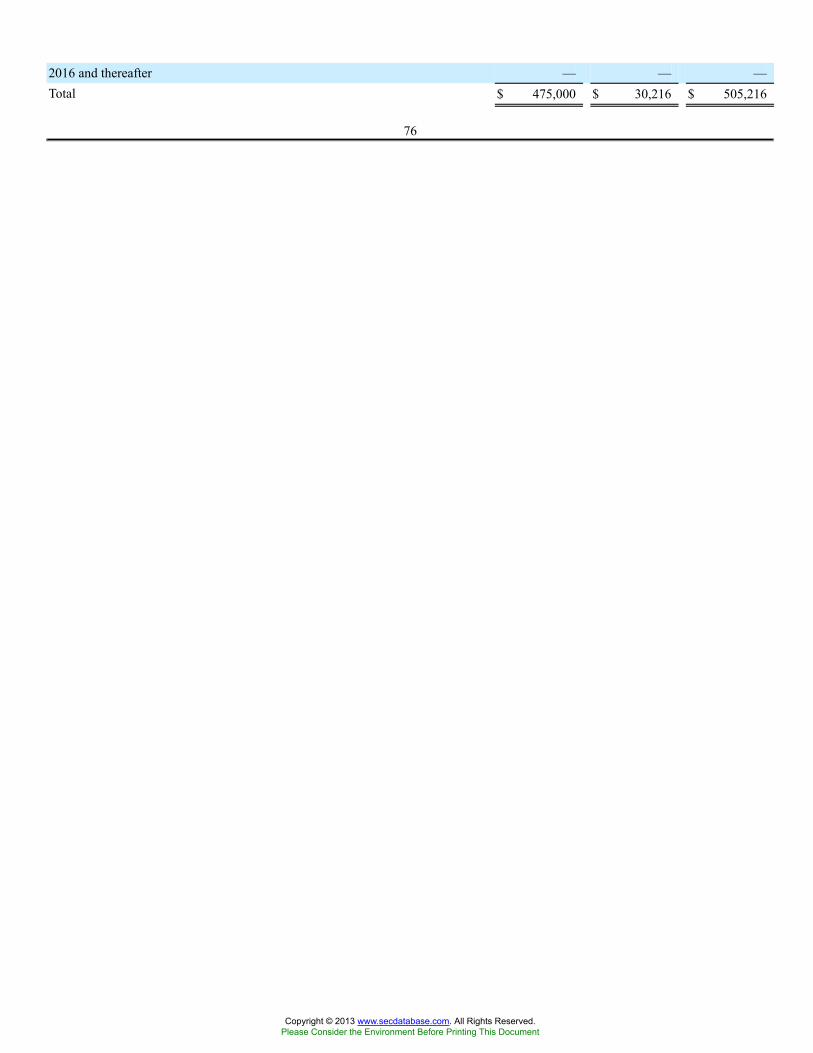
2016 and thereafter — — —Total $ 475,000 $ 30,216 $ 505,216
76
Copyright © 2013 www.secdatabase.com. All Rights Reserved.Please Consider the Environment Before Printing This Document
Table of Contents
FLOWSERVE CORPORATION
NOTES TO CONSOLIDATED FINANCIAL STATEMENTS — (Continued)
Credit Facilities
On December 14, 2010 we entered into a credit agreement ("Credit Agreement") with Bank of America, N.A., as swingline lender,letter of credit issuer and administrative agent, and the other lenders party thereto (together, the "Lenders"). The Credit Agreementprovides for a $500.0 million term loan facility with a maturity date of December 14, 2015 and a $500.0 million revolving credit facilitywith a maturity date of December 14, 2015 (collectively referred to as "Credit Facilities"). The revolving credit facility includes a $300.0million sublimit for the issuance of letters of credit. Subject to certain conditions, we have the right to increase the amount of the revolvingcredit facility by an aggregate amount not to exceed $200.0 million.
At December 31, 2011 we had $9.8 million in deferred loan costs included in other assets, net. These costs are being amortizedover the term of the Credit Agreement and are recorded in interest expense.
At December 31, 2011 and 2010, we had no amounts outstanding under the revolving credit facility, respectively. We hadoutstanding letters of credit of $147.4 million and $133.9 million at December 31, 2011 and 2010, respectively, which reduced ourborrowing capacity to $352.6 million and $366.1 million, respectively.
Borrowings under our Credit Facilities, other than in respect of swingline loans, bear interest at a rate equal to, at our option, either(1) the London Interbank Offered Rate ("LIBOR") plus 1.75% to 2.50%, as applicable, depending on our consolidated leverage ratio, or,(2) the base rate which is based on the greater of the prime rate most recently announced by the administrative agent under our CreditFacilities or the Federal Funds rate plus 0.50%, or (3) a daily rate equal to the one month LIBOR plus 1.0% plus an applicable marginof 0.75% to 1.50% determined by reference to the ratio of our total debt to consolidated earnings before interest, taxes, depreciationand amortization ("EBITDA"). The applicable interest rate as of December 31, 2011 was 2.58% for borrowings under our New CreditFacilities. In connection with our Credit Facilities, we have entered into $330.0 million of notional amount of interest rate swaps atDecember 31, 2011 to hedge exposure to floating interest rates.
We pay the Lenders under the Credit Facilities a commitment fee equal to a percentage ranging from 0.30% to 0.50%, determinedby reference to the ratio of our total debt to consolidated EBITDA, of the unutilized portion of the revolving credit facility, and letterof credit fees with respect to each standby letter of credit outstanding under our Credit Facilities equal to a percentage based on theapplicable margin in effect for LIBOR borrowings under the revolving credit facility. The fees for financial and performance standbyletters of credit are 2.0% and 1.0%, respectively.
Our obligations under the Credit Facilities are unconditionally guaranteed, jointly and severally, by substantially all of our existingand subsequently acquired or organized domestic subsidiaries and 65% of the capital stock of certain foreign subsidiaries, subject tocertain controlled company and materiality exceptions. The Lenders have agreed to release the collateral if we achieve an InvestmentGrade Rating by both Moody’s Investors Service, Inc. and Standard & Poor’s Ratings Services for our senior unsecured, non-credit-enhanced, long-term debt (in each case, with an outlook of stable or better), with the understanding that identical collateral will berequired to be pledged to the Lenders anytime following a release of the collateral that the Investment Grade Rating is not maintained.In addition, prior to our obtaining and maintaining investment grade credit ratings, our and the guarantors’ obligations under the CreditFacilities are collateralized by substantially all of our and the guarantors’ assets. We have not achieved these ratings as of December 31,2011.
Our Credit Agreement contains, among other things, covenants defining our and our subsidiaries’ ability to dispose of assets,merge, pay dividends, repurchase or redeem capital stock and indebtedness, incur indebtedness and guarantees, create liens, enter intoagreements with negative pledge clauses, make certain investments or acquisitions, enter into transactions with affiliates or engage in anybusiness activity other than our existing business. Our Credit Agreement also contains covenants requiring us to deliver to lenders ourleverage and interest coverage financial covenant certificates of compliance. The maximum permitted leverage ratio is 3.25 times debt tototal consolidated EBITDA. The minimum interest coverage is 3.25 times consolidated EBITDA to total interest expense. Compliancewith these financial covenants under our Credit Agreement is tested quarterly. We complied with the covenants through December 31,2011.
Our Credit Agreement includes customary events of default, including nonpayment of principal or interest, violation of covenants,incorrectness of representations and warranties, cross defaults and cross acceleration, bankruptcy, material judgments, EmployeeRetirement Income Security Act of 1974, as amended ("ERISA"), events, actual or asserted invalidity of the guarantees or the securitydocuments, and certain changes of control of our company. The occurrence of any event of default could result in the acceleration of ourand the guarantors’ obligations under the Credit Facilities.
Repayment of Obligations — We made total scheduled repayments under our current Credit Agreement and previous creditagreement of $25.0 million, $4.3 million, and $5.7 million in 2011, 2010 and 2009, respectively. We made no mandatory repayments
Copyright © 2013 www.secdatabase.com. All Rights Reserved.Please Consider the Environment Before Printing This Document

or optional prepayments in 2011, 2010 or 2009, with the exception of the proceeds advanced under the term loan facility of our CreditAgreement, along with approximately $40 million of cash on hand that were used to repay all previously outstanding
77
Copyright © 2013 www.secdatabase.com. All Rights Reserved.Please Consider the Environment Before Printing This Document
Table of Contents
FLOWSERVE CORPORATION
NOTES TO CONSOLIDATED FINANCIAL STATEMENTS — (Continued)
indebtedness under our previous credit agreement, which included a $600.0 million term loan and $400.0 million revolving line of credit.
We may prepay loans under our Credit Facilities in whole or in part, without premium or penalty, at any time.
European Letter of Credit Facilities — On October 30, 2009, we entered into a new 364-day unsecured European Letter of CreditFacility ("New European LOC Facility") with an initial commitment of €125.0 million. The New European LOC Facility is renewableannually and, consistent with our previous European Letter of Credit Facility ("Old European LOC Facility"), is used for contingentobligations in respect of surety and performance bonds, bank guarantees and similar obligations with maturities up to five years. Werenewed the New European LOC Facility in October 2011 consistent with its terms for an additional 364-day period. We pay fees between1.10% and 1.35% for utilized capacity and 0.40% for unutilized capacity under our New European LOC Facility. We had outstandingletters of credit drawn on the New European LOC Facility of €81.0 million ($105.0 million) and €55.7 million ($74.5 million) as ofDecember 31, 2011 and 2010, respectively.
Our ability to issue additional letters of credit under our Old European LOC Facility, which had a commitment of €110.0 million,expired November 9, 2009. We paid annual and fronting fees of 0.875% and 0.10%, respectively, for letters of credit written against theOld European LOC Facility. We had outstanding letters of credit written against the Old European LOC Facility of €12.2 million ($15.8million) and €33.3 million ($44.5 million) as of December 31, 2011 and 2010, respectively.
Certain banks are parties to both facilities and are managing their exposures on an aggregated basis. As such, the commitment underthe New European LOC Facility is reduced by the face amount of existing letters of credit written against the Old European LOC Facilityprior to its expiration. These existing letters of credit will remain outstanding, and accordingly offset the €125.0 million capacity of theNew European LOC Facility until their maturity, which, as of December 31, 2011, was approximately one year for the majority of theoutstanding existing letters of credit. After consideration of outstanding commitments under both facilities, the available capacity underthe New European LOC Facility was €116.7 million as of December 31, 2011, of which €81.0 million has been utilized.
Operating Leases — We have non-cancelable operating leases for certain offices, service and quick response centers, certainmanufacturing and operating facilities, machinery, equipment and automobiles. Rental expense relating to operating leases was $52.8million, $46.9 million and $49.0 million in 2011, 2010 and 2009, respectively.
The future minimum lease payments due under non-cancelable operating leases are (amounts in thousands):
Year Ended December 31,
2012 $ 48,6722013 41,0422014 30,3332015 22,0832016 16,502Thereafter 31,020
Total minimum lease payments $ 189,652
12. PENSION AND POSTRETIREMENT BENEFITS
We sponsor several noncontributory defined benefit pension plans, covering substantially all U.S. employees and certain non-U.S. employees, which provide benefits based on years of service, age, job grade levels and type of compensation. Retirement benefitsfor all other covered employees are provided through contributory pension plans, cash balance pension plans and government-sponsoredretirement programs. All funded defined benefit pension plans receive funding based on independent actuarial valuations to provide forcurrent service and an amount sufficient to amortize unfunded prior service over periods not to exceed 30 years, with funding fallingwithin the legal limits prescribed by prevailing regulation. We also maintain unfunded defined benefit plans that, as permitted by localregulations, receive funding only when benefits become due.
Our defined benefit plan strategy is to ensure that current and future benefit obligations are adequately funded in a cost-effectivemanner. Additionally, our investing objective is to achieve the highest level of investment performance that is compatible with our risktolerance and prudent investment practices. Because of the long-term nature of our defined benefit plan liabilities, our funding strategy isbased on a long-term perspective for formulating and implementing investment policies and evaluating their investment performance.
Copyright © 2013 www.secdatabase.com. All Rights Reserved.Please Consider the Environment Before Printing This Document

78
Copyright © 2013 www.secdatabase.com. All Rights Reserved.Please Consider the Environment Before Printing This Document
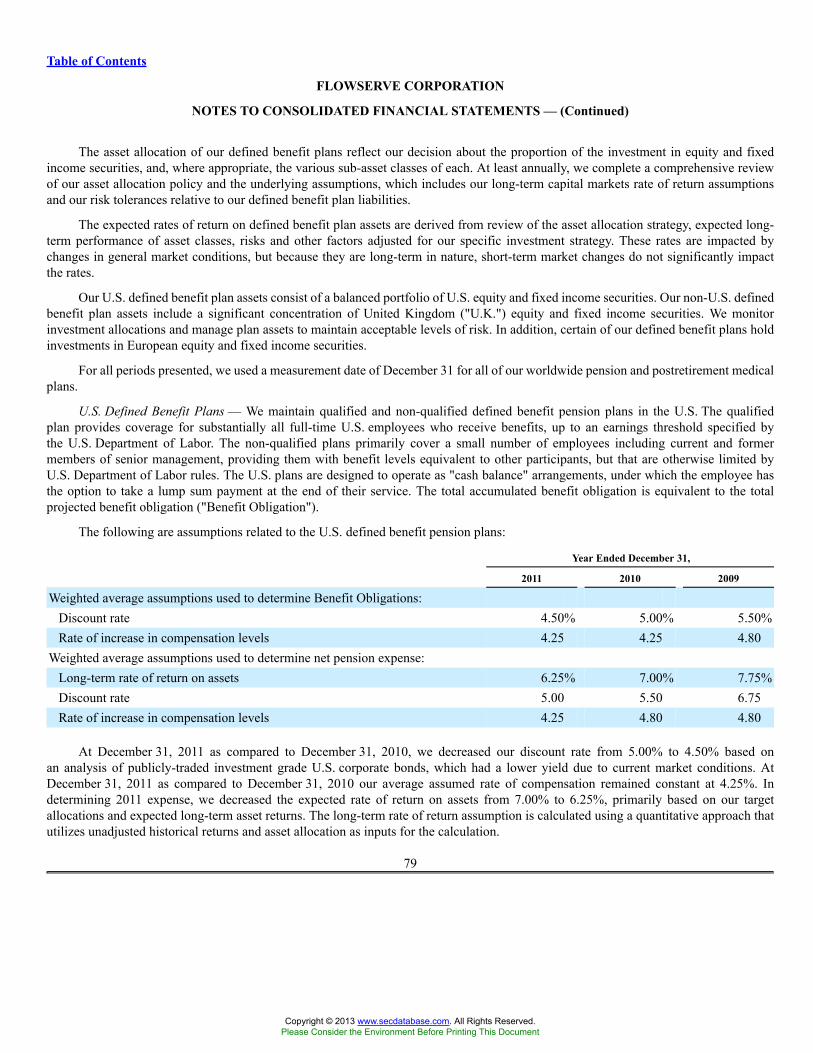
Table of Contents
FLOWSERVE CORPORATION
NOTES TO CONSOLIDATED FINANCIAL STATEMENTS — (Continued)
The asset allocation of our defined benefit plans reflect our decision about the proportion of the investment in equity and fixedincome securities, and, where appropriate, the various sub-asset classes of each. At least annually, we complete a comprehensive reviewof our asset allocation policy and the underlying assumptions, which includes our long-term capital markets rate of return assumptionsand our risk tolerances relative to our defined benefit plan liabilities.
The expected rates of return on defined benefit plan assets are derived from review of the asset allocation strategy, expected long-term performance of asset classes, risks and other factors adjusted for our specific investment strategy. These rates are impacted bychanges in general market conditions, but because they are long-term in nature, short-term market changes do not significantly impactthe rates.
Our U.S. defined benefit plan assets consist of a balanced portfolio of U.S. equity and fixed income securities. Our non-U.S. definedbenefit plan assets include a significant concentration of United Kingdom ("U.K.") equity and fixed income securities. We monitorinvestment allocations and manage plan assets to maintain acceptable levels of risk. In addition, certain of our defined benefit plans holdinvestments in European equity and fixed income securities.
For all periods presented, we used a measurement date of December 31 for all of our worldwide pension and postretirement medicalplans.
U.S. Defined Benefit Plans — We maintain qualified and non-qualified defined benefit pension plans in the U.S. The qualifiedplan provides coverage for substantially all full-time U.S. employees who receive benefits, up to an earnings threshold specified bythe U.S. Department of Labor. The non-qualified plans primarily cover a small number of employees including current and formermembers of senior management, providing them with benefit levels equivalent to other participants, but that are otherwise limited byU.S. Department of Labor rules. The U.S. plans are designed to operate as "cash balance" arrangements, under which the employee hasthe option to take a lump sum payment at the end of their service. The total accumulated benefit obligation is equivalent to the totalprojected benefit obligation ("Benefit Obligation").
The following are assumptions related to the U.S. defined benefit pension plans:
Year Ended December 31,
2011 2010 2009
Weighted average assumptions used to determine Benefit Obligations:Discount rate 4.50% 5.00% 5.50%Rate of increase in compensation levels 4.25 4.25 4.80
Weighted average assumptions used to determine net pension expense:Long-term rate of return on assets 6.25% 7.00% 7.75%Discount rate 5.00 5.50 6.75Rate of increase in compensation levels 4.25 4.80 4.80
At December 31, 2011 as compared to December 31, 2010, we decreased our discount rate from 5.00% to 4.50% based onan analysis of publicly-traded investment grade U.S. corporate bonds, which had a lower yield due to current market conditions. AtDecember 31, 2011 as compared to December 31, 2010 our average assumed rate of compensation remained constant at 4.25%. Indetermining 2011 expense, we decreased the expected rate of return on assets from 7.00% to 6.25%, primarily based on our targetallocations and expected long-term asset returns. The long-term rate of return assumption is calculated using a quantitative approach thatutilizes unadjusted historical returns and asset allocation as inputs for the calculation.
79
Copyright © 2013 www.secdatabase.com. All Rights Reserved.Please Consider the Environment Before Printing This Document
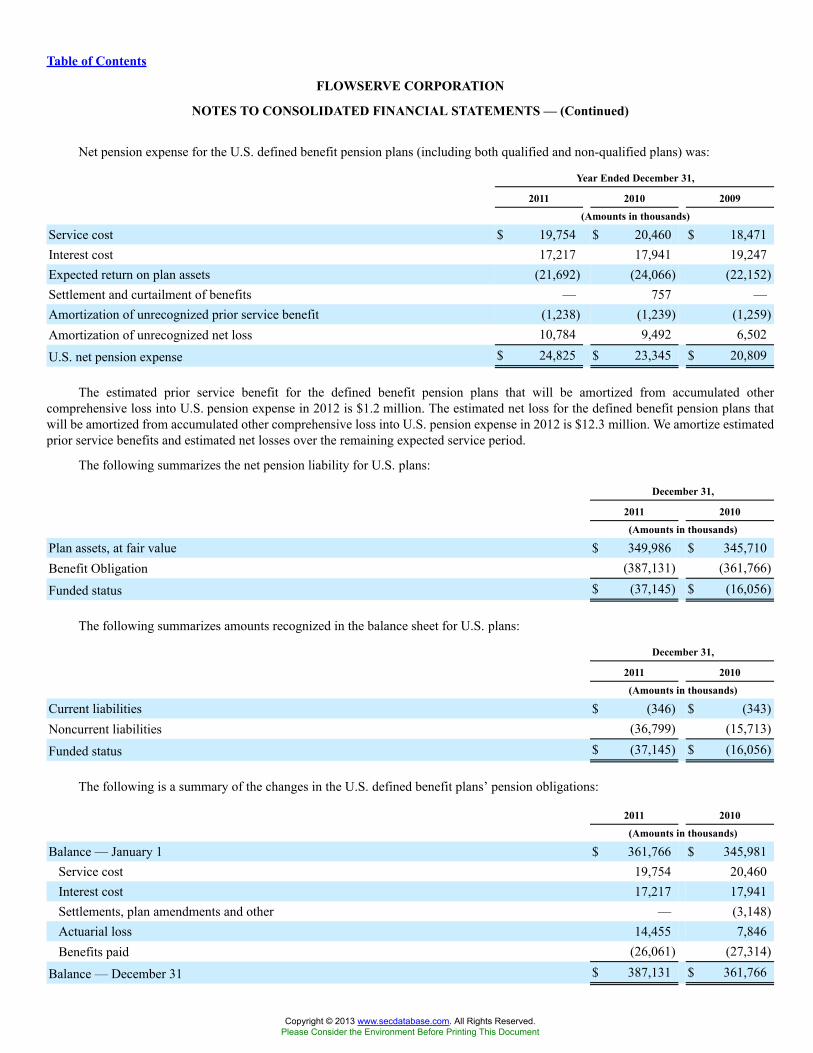
Table of Contents
FLOWSERVE CORPORATION
NOTES TO CONSOLIDATED FINANCIAL STATEMENTS — (Continued)
Net pension expense for the U.S. defined benefit pension plans (including both qualified and non-qualified plans) was:
Year Ended December 31,
2011 2010 2009
(Amounts in thousands)
Service cost $ 19,754 $ 20,460 $ 18,471Interest cost 17,217 17,941 19,247Expected return on plan assets (21,692) (24,066) (22,152)Settlement and curtailment of benefits — 757 —Amortization of unrecognized prior service benefit (1,238) (1,239) (1,259)Amortization of unrecognized net loss 10,784 9,492 6,502
U.S. net pension expense $ 24,825 $ 23,345 $ 20,809
The estimated prior service benefit for the defined benefit pension plans that will be amortized from accumulated othercomprehensive loss into U.S. pension expense in 2012 is $1.2 million. The estimated net loss for the defined benefit pension plans thatwill be amortized from accumulated other comprehensive loss into U.S. pension expense in 2012 is $12.3 million. We amortize estimatedprior service benefits and estimated net losses over the remaining expected service period.
The following summarizes the net pension liability for U.S. plans:
December 31,
2011 2010
(Amounts in thousands)
Plan assets, at fair value $ 349,986 $ 345,710Benefit Obligation (387,131) (361,766)
Funded status $ (37,145) $ (16,056)
The following summarizes amounts recognized in the balance sheet for U.S. plans:
December 31,
2011 2010
(Amounts in thousands)
Current liabilities $ (346) $ (343)Noncurrent liabilities (36,799) (15,713)
Funded status $ (37,145) $ (16,056)
The following is a summary of the changes in the U.S. defined benefit plans’ pension obligations:
2011 2010
(Amounts in thousands)
Balance — January 1 $ 361,766 $ 345,981Service cost 19,754 20,460Interest cost 17,217 17,941Settlements, plan amendments and other — (3,148)Actuarial loss 14,455 7,846Benefits paid (26,061) (27,314)
Balance — December 31 $ 387,131 $ 361,766
Copyright © 2013 www.secdatabase.com. All Rights Reserved.Please Consider the Environment Before Printing This Document

Accumulated benefit obligations at December 31 $ 387,131 $ 361,766
80
Copyright © 2013 www.secdatabase.com. All Rights Reserved.Please Consider the Environment Before Printing This Document
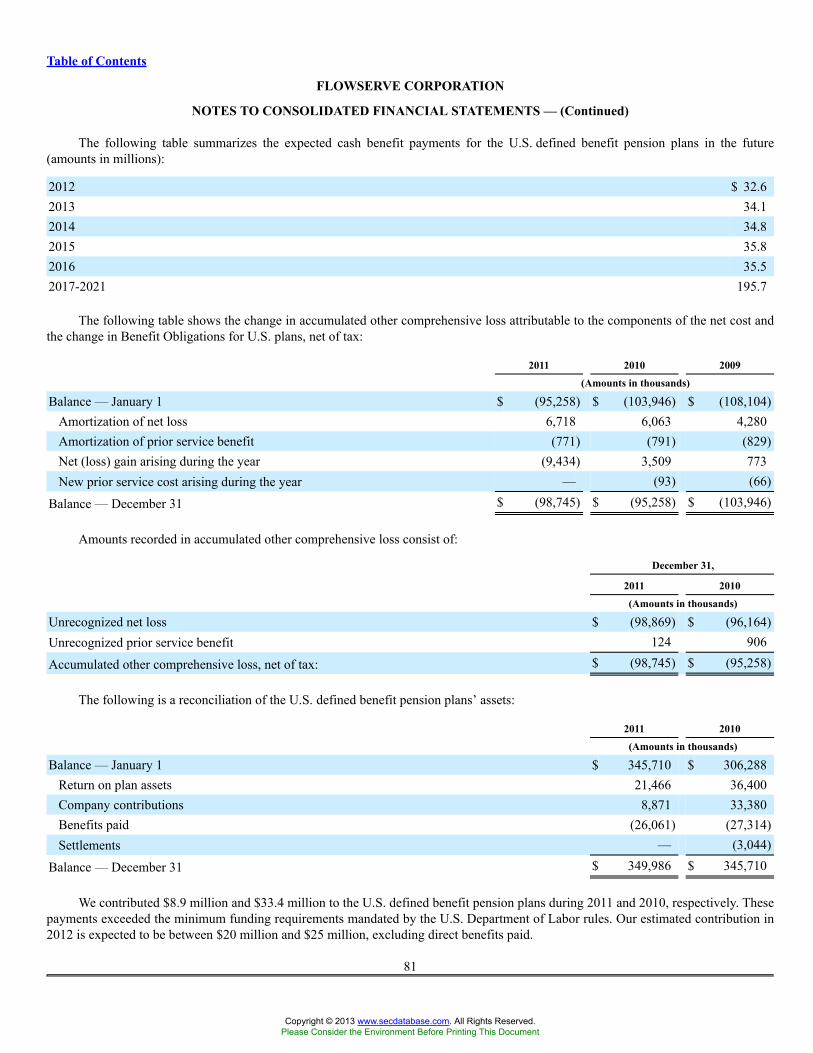
Table of Contents
FLOWSERVE CORPORATION
NOTES TO CONSOLIDATED FINANCIAL STATEMENTS — (Continued)
The following table summarizes the expected cash benefit payments for the U.S. defined benefit pension plans in the future(amounts in millions):
2012 $ 32.62013 34.12014 34.82015 35.82016 35.52017-2021 195.7
The following table shows the change in accumulated other comprehensive loss attributable to the components of the net cost andthe change in Benefit Obligations for U.S. plans, net of tax:
2011 2010 2009
(Amounts in thousands)
Balance — January 1 $ (95,258) $ (103,946) $ (108,104)Amortization of net loss 6,718 6,063 4,280Amortization of prior service benefit (771) (791) (829)Net (loss) gain arising during the year (9,434) 3,509 773New prior service cost arising during the year — (93) (66)
Balance — December 31 $ (98,745) $ (95,258) $ (103,946)
Amounts recorded in accumulated other comprehensive loss consist of:
December 31,
2011 2010
(Amounts in thousands)
Unrecognized net loss $ (98,869) $ (96,164)Unrecognized prior service benefit 124 906
Accumulated other comprehensive loss, net of tax: $ (98,745) $ (95,258)
The following is a reconciliation of the U.S. defined benefit pension plans’ assets:
2011 2010
(Amounts in thousands)
Balance — January 1 $ 345,710 $ 306,288Return on plan assets 21,466 36,400Company contributions 8,871 33,380Benefits paid (26,061) (27,314)Settlements — (3,044)
Balance — December 31 $ 349,986 $ 345,710
We contributed $8.9 million and $33.4 million to the U.S. defined benefit pension plans during 2011 and 2010, respectively. Thesepayments exceeded the minimum funding requirements mandated by the U.S. Department of Labor rules. Our estimated contribution in2012 is expected to be between $20 million and $25 million, excluding direct benefits paid.
81
Copyright © 2013 www.secdatabase.com. All Rights Reserved.Please Consider the Environment Before Printing This Document
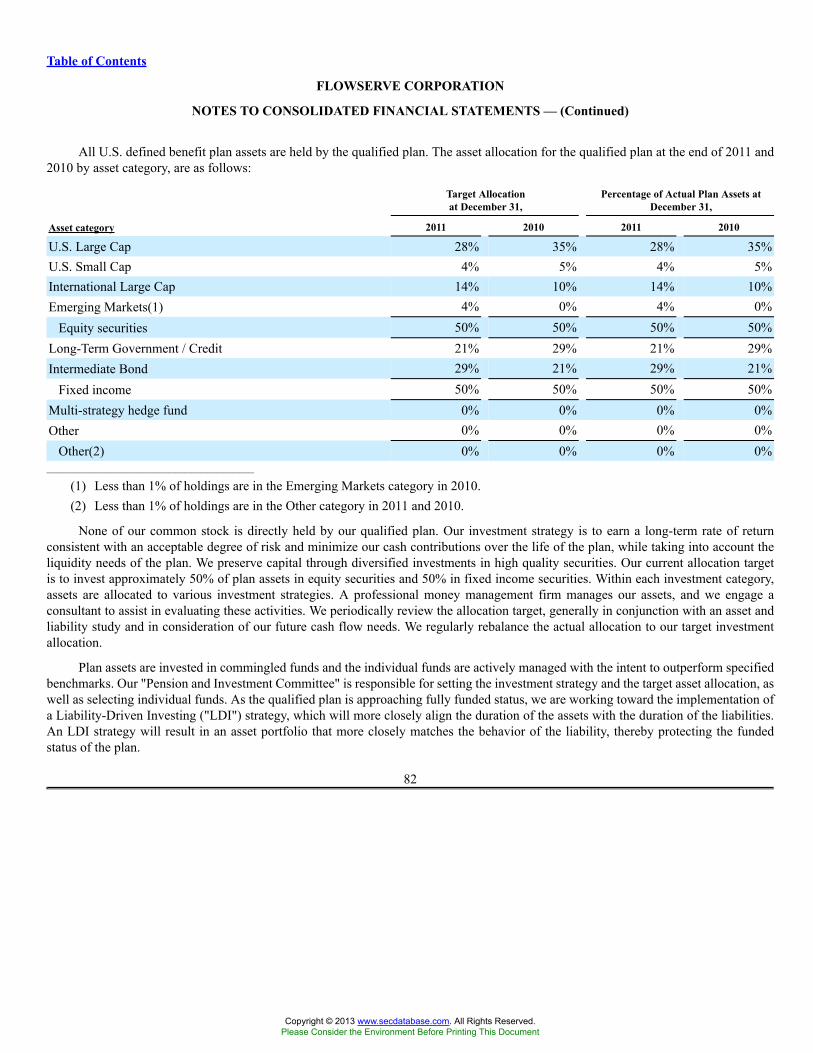
Table of Contents
FLOWSERVE CORPORATION
NOTES TO CONSOLIDATED FINANCIAL STATEMENTS — (Continued)
All U.S. defined benefit plan assets are held by the qualified plan. The asset allocation for the qualified plan at the end of 2011 and2010 by asset category, are as follows:
Target Allocationat December 31,
Percentage of Actual Plan Assets atDecember 31,
Asset category 2011 2010 2011 2010
U.S. Large Cap 28% 35% 28% 35%U.S. Small Cap 4% 5% 4% 5%International Large Cap 14% 10% 14% 10%Emerging Markets(1) 4% 0% 4% 0%
Equity securities 50% 50% 50% 50%Long-Term Government / Credit 21% 29% 21% 29%Intermediate Bond 29% 21% 29% 21%
Fixed income 50% 50% 50% 50%Multi-strategy hedge fund 0% 0% 0% 0%Other 0% 0% 0% 0%
Other(2) 0% 0% 0% 0%_______________________________________
(1) Less than 1% of holdings are in the Emerging Markets category in 2010.(2) Less than 1% of holdings are in the Other category in 2011 and 2010.
None of our common stock is directly held by our qualified plan. Our investment strategy is to earn a long-term rate of returnconsistent with an acceptable degree of risk and minimize our cash contributions over the life of the plan, while taking into account theliquidity needs of the plan. We preserve capital through diversified investments in high quality securities. Our current allocation targetis to invest approximately 50% of plan assets in equity securities and 50% in fixed income securities. Within each investment category,assets are allocated to various investment strategies. A professional money management firm manages our assets, and we engage aconsultant to assist in evaluating these activities. We periodically review the allocation target, generally in conjunction with an asset andliability study and in consideration of our future cash flow needs. We regularly rebalance the actual allocation to our target investmentallocation.
Plan assets are invested in commingled funds and the individual funds are actively managed with the intent to outperform specifiedbenchmarks. Our "Pension and Investment Committee" is responsible for setting the investment strategy and the target asset allocation, aswell as selecting individual funds. As the qualified plan is approaching fully funded status, we are working toward the implementation ofa Liability-Driven Investing ("LDI") strategy, which will more closely align the duration of the assets with the duration of the liabilities.An LDI strategy will result in an asset portfolio that more closely matches the behavior of the liability, thereby protecting the fundedstatus of the plan.
82
Copyright © 2013 www.secdatabase.com. All Rights Reserved.Please Consider the Environment Before Printing This Document
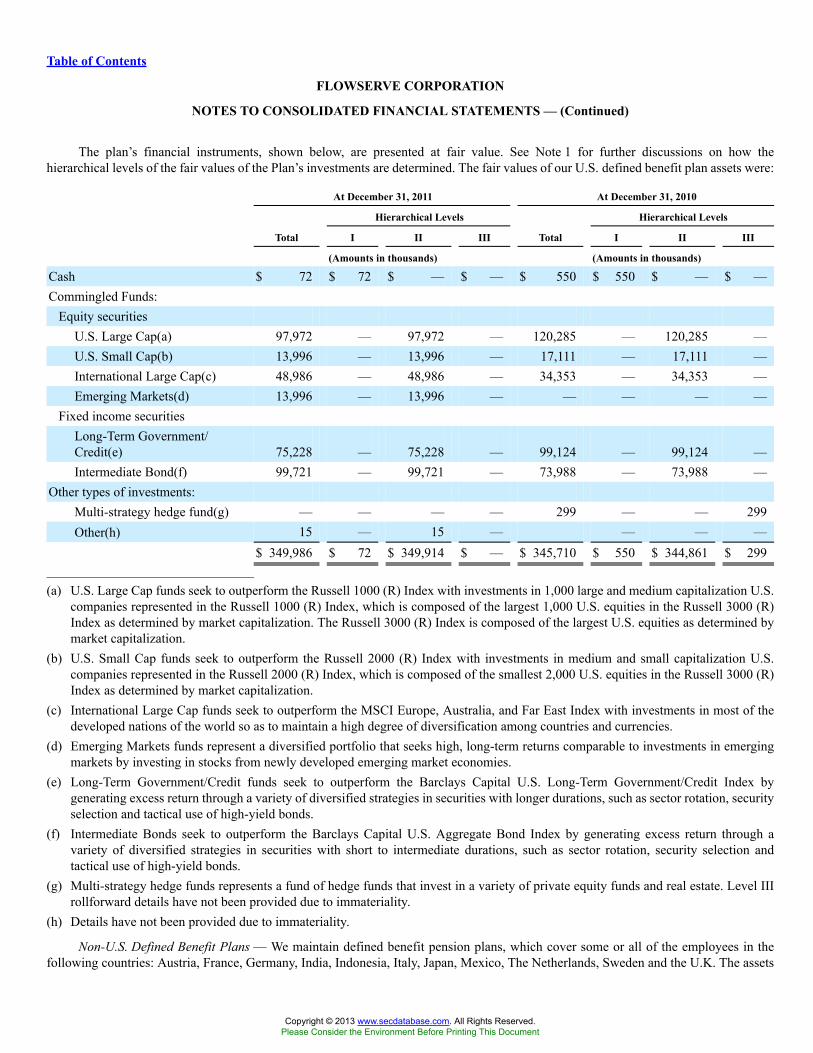
Table of Contents
FLOWSERVE CORPORATION
NOTES TO CONSOLIDATED FINANCIAL STATEMENTS — (Continued)
The plan’s financial instruments, shown below, are presented at fair value. See Note 1 for further discussions on how thehierarchical levels of the fair values of the Plan’s investments are determined. The fair values of our U.S. defined benefit plan assets were:
At December 31, 2011 At December 31, 2010
Hierarchical Levels Hierarchical Levels
Total I II III Total I II III
(Amounts in thousands) (Amounts in thousands)
Cash $ 72 $ 72 $ — $ — $ 550 $ 550 $ — $ —Commingled Funds:
Equity securitiesU.S. Large Cap(a) 97,972 — 97,972 — 120,285 — 120,285 —U.S. Small Cap(b) 13,996 — 13,996 — 17,111 — 17,111 —International Large Cap(c) 48,986 — 48,986 — 34,353 — 34,353 —Emerging Markets(d) 13,996 — 13,996 — — — — —
Fixed income securitiesLong-Term Government/Credit(e) 75,228 — 75,228 — 99,124 — 99,124 —Intermediate Bond(f) 99,721 — 99,721 — 73,988 — 73,988 —
Other types of investments:Multi-strategy hedge fund(g) — — — — 299 — — 299Other(h) 15 — 15 — — — —
$ 349,986 $ 72 $ 349,914 $ — $ 345,710 $ 550 $ 344,861 $ 299_______________________________________
(a) U.S. Large Cap funds seek to outperform the Russell 1000 (R) Index with investments in 1,000 large and medium capitalization U.S.companies represented in the Russell 1000 (R) Index, which is composed of the largest 1,000 U.S. equities in the Russell 3000 (R)Index as determined by market capitalization. The Russell 3000 (R) Index is composed of the largest U.S. equities as determined bymarket capitalization.
(b) U.S. Small Cap funds seek to outperform the Russell 2000 (R) Index with investments in medium and small capitalization U.S.companies represented in the Russell 2000 (R) Index, which is composed of the smallest 2,000 U.S. equities in the Russell 3000 (R)Index as determined by market capitalization.
(c) International Large Cap funds seek to outperform the MSCI Europe, Australia, and Far East Index with investments in most of thedeveloped nations of the world so as to maintain a high degree of diversification among countries and currencies.
(d) Emerging Markets funds represent a diversified portfolio that seeks high, long-term returns comparable to investments in emergingmarkets by investing in stocks from newly developed emerging market economies.
(e) Long-Term Government/Credit funds seek to outperform the Barclays Capital U.S. Long-Term Government/Credit Index bygenerating excess return through a variety of diversified strategies in securities with longer durations, such as sector rotation, securityselection and tactical use of high-yield bonds.
(f) Intermediate Bonds seek to outperform the Barclays Capital U.S. Aggregate Bond Index by generating excess return through avariety of diversified strategies in securities with short to intermediate durations, such as sector rotation, security selection andtactical use of high-yield bonds.
(g) Multi-strategy hedge funds represents a fund of hedge funds that invest in a variety of private equity funds and real estate. Level IIIrollforward details have not been provided due to immateriality.
(h) Details have not been provided due to immateriality.
Non-U.S. Defined Benefit Plans — We maintain defined benefit pension plans, which cover some or all of the employees in thefollowing countries: Austria, France, Germany, India, Indonesia, Italy, Japan, Mexico, The Netherlands, Sweden and the U.K. The assets
Copyright © 2013 www.secdatabase.com. All Rights Reserved.Please Consider the Environment Before Printing This Document

in the U.K. (two plans) and The Netherlands (one plan) represent 98% of the total non-U.S. plan assets ("non-U.S. assets"). Details ofother countries’ assets have not been provided due to immateriality.
83
Copyright © 2013 www.secdatabase.com. All Rights Reserved.Please Consider the Environment Before Printing This Document
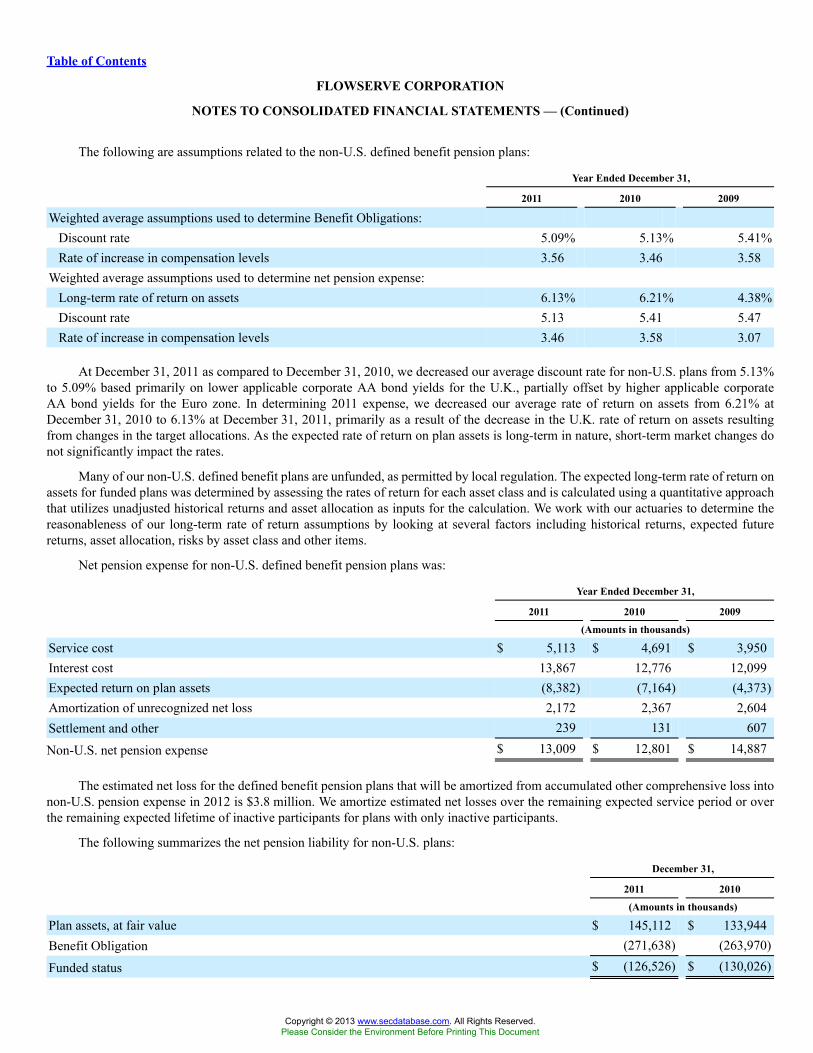
Table of Contents
FLOWSERVE CORPORATION
NOTES TO CONSOLIDATED FINANCIAL STATEMENTS — (Continued)
The following are assumptions related to the non-U.S. defined benefit pension plans:
Year Ended December 31,
2011 2010 2009
Weighted average assumptions used to determine Benefit Obligations:Discount rate 5.09% 5.13% 5.41%Rate of increase in compensation levels 3.56 3.46 3.58
Weighted average assumptions used to determine net pension expense:Long-term rate of return on assets 6.13% 6.21% 4.38%Discount rate 5.13 5.41 5.47Rate of increase in compensation levels 3.46 3.58 3.07
At December 31, 2011 as compared to December 31, 2010, we decreased our average discount rate for non-U.S. plans from 5.13%to 5.09% based primarily on lower applicable corporate AA bond yields for the U.K., partially offset by higher applicable corporateAA bond yields for the Euro zone. In determining 2011 expense, we decreased our average rate of return on assets from 6.21% atDecember 31, 2010 to 6.13% at December 31, 2011, primarily as a result of the decrease in the U.K. rate of return on assets resultingfrom changes in the target allocations. As the expected rate of return on plan assets is long-term in nature, short-term market changes donot significantly impact the rates.
Many of our non-U.S. defined benefit plans are unfunded, as permitted by local regulation. The expected long-term rate of return onassets for funded plans was determined by assessing the rates of return for each asset class and is calculated using a quantitative approachthat utilizes unadjusted historical returns and asset allocation as inputs for the calculation. We work with our actuaries to determine thereasonableness of our long-term rate of return assumptions by looking at several factors including historical returns, expected futurereturns, asset allocation, risks by asset class and other items.
Net pension expense for non-U.S. defined benefit pension plans was:
Year Ended December 31,
2011 2010 2009
(Amounts in thousands)
Service cost $ 5,113 $ 4,691 $ 3,950Interest cost 13,867 12,776 12,099Expected return on plan assets (8,382) (7,164) (4,373)Amortization of unrecognized net loss 2,172 2,367 2,604Settlement and other 239 131 607
Non-U.S. net pension expense $ 13,009 $ 12,801 $ 14,887
The estimated net loss for the defined benefit pension plans that will be amortized from accumulated other comprehensive loss intonon-U.S. pension expense in 2012 is $3.8 million. We amortize estimated net losses over the remaining expected service period or overthe remaining expected lifetime of inactive participants for plans with only inactive participants.
The following summarizes the net pension liability for non-U.S. plans:
December 31,
2011 2010
(Amounts in thousands)
Plan assets, at fair value $ 145,112 $ 133,944Benefit Obligation (271,638) (263,970)
Funded status $ (126,526) $ (130,026)
Copyright © 2013 www.secdatabase.com. All Rights Reserved.Please Consider the Environment Before Printing This Document

84
Copyright © 2013 www.secdatabase.com. All Rights Reserved.Please Consider the Environment Before Printing This Document
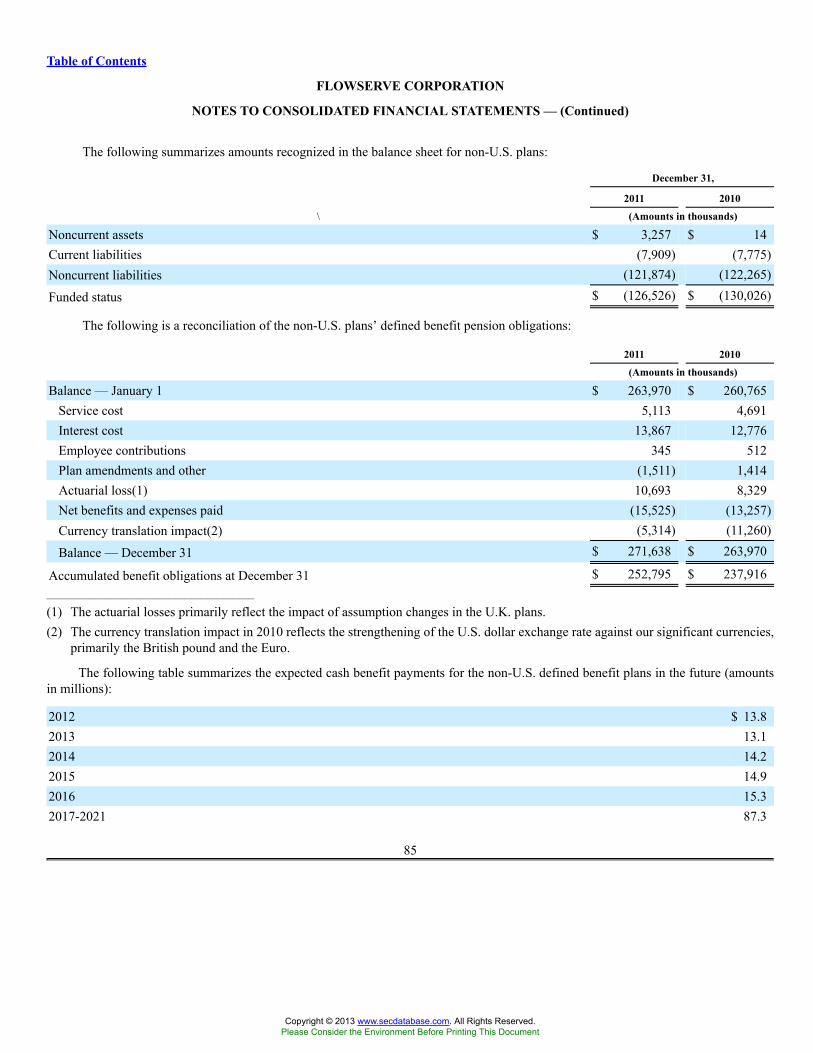
Table of Contents
FLOWSERVE CORPORATION
NOTES TO CONSOLIDATED FINANCIAL STATEMENTS — (Continued)
The following summarizes amounts recognized in the balance sheet for non-U.S. plans:
December 31,
2011 2010
\ (Amounts in thousands)
Noncurrent assets $ 3,257 $ 14Current liabilities (7,909) (7,775)Noncurrent liabilities (121,874) (122,265)
Funded status $ (126,526) $ (130,026)
The following is a reconciliation of the non-U.S. plans’ defined benefit pension obligations:
2011 2010
(Amounts in thousands)
Balance — January 1 $ 263,970 $ 260,765Service cost 5,113 4,691Interest cost 13,867 12,776Employee contributions 345 512Plan amendments and other (1,511) 1,414Actuarial loss(1) 10,693 8,329Net benefits and expenses paid (15,525) (13,257)Currency translation impact(2) (5,314) (11,260)
Balance — December 31 $ 271,638 $ 263,970
Accumulated benefit obligations at December 31 $ 252,795 $ 237,916_______________________________________
(1) The actuarial losses primarily reflect the impact of assumption changes in the U.K. plans.(2) The currency translation impact in 2010 reflects the strengthening of the U.S. dollar exchange rate against our significant currencies,
primarily the British pound and the Euro.
The following table summarizes the expected cash benefit payments for the non-U.S. defined benefit plans in the future (amountsin millions):
2012 $ 13.82013 13.12014 14.22015 14.92016 15.32017-2021 87.3
85
Copyright © 2013 www.secdatabase.com. All Rights Reserved.Please Consider the Environment Before Printing This Document
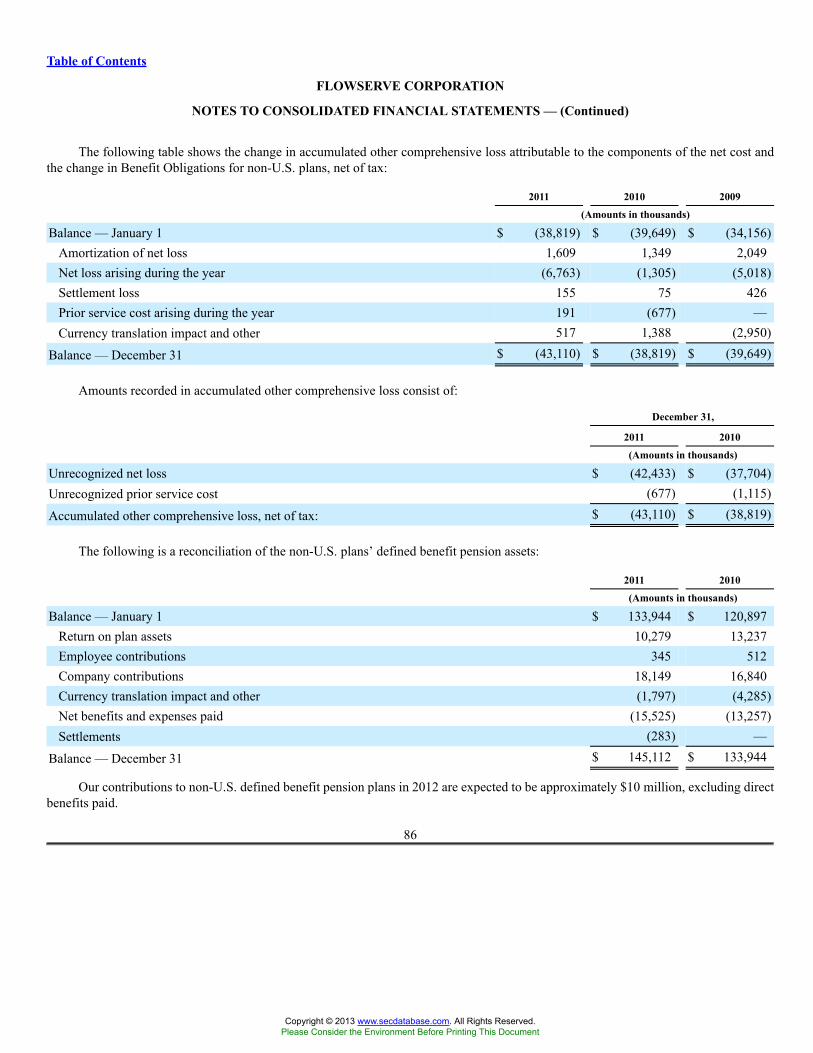
Table of Contents
FLOWSERVE CORPORATION
NOTES TO CONSOLIDATED FINANCIAL STATEMENTS — (Continued)
The following table shows the change in accumulated other comprehensive loss attributable to the components of the net cost andthe change in Benefit Obligations for non-U.S. plans, net of tax:
2011 2010 2009
(Amounts in thousands)
Balance — January 1 $ (38,819) $ (39,649) $ (34,156)Amortization of net loss 1,609 1,349 2,049Net loss arising during the year (6,763) (1,305) (5,018)Settlement loss 155 75 426Prior service cost arising during the year 191 (677) —Currency translation impact and other 517 1,388 (2,950)
Balance — December 31 $ (43,110) $ (38,819) $ (39,649)
Amounts recorded in accumulated other comprehensive loss consist of:
December 31,
2011 2010
(Amounts in thousands)
Unrecognized net loss $ (42,433) $ (37,704)Unrecognized prior service cost (677) (1,115)
Accumulated other comprehensive loss, net of tax: $ (43,110) $ (38,819)
The following is a reconciliation of the non-U.S. plans’ defined benefit pension assets:
2011 2010
(Amounts in thousands)
Balance — January 1 $ 133,944 $ 120,897Return on plan assets 10,279 13,237Employee contributions 345 512Company contributions 18,149 16,840Currency translation impact and other (1,797) (4,285)Net benefits and expenses paid (15,525) (13,257)Settlements (283) —
Balance — December 31 $ 145,112 $ 133,944
Our contributions to non-U.S. defined benefit pension plans in 2012 are expected to be approximately $10 million, excluding directbenefits paid.
86
Copyright © 2013 www.secdatabase.com. All Rights Reserved.Please Consider the Environment Before Printing This Document
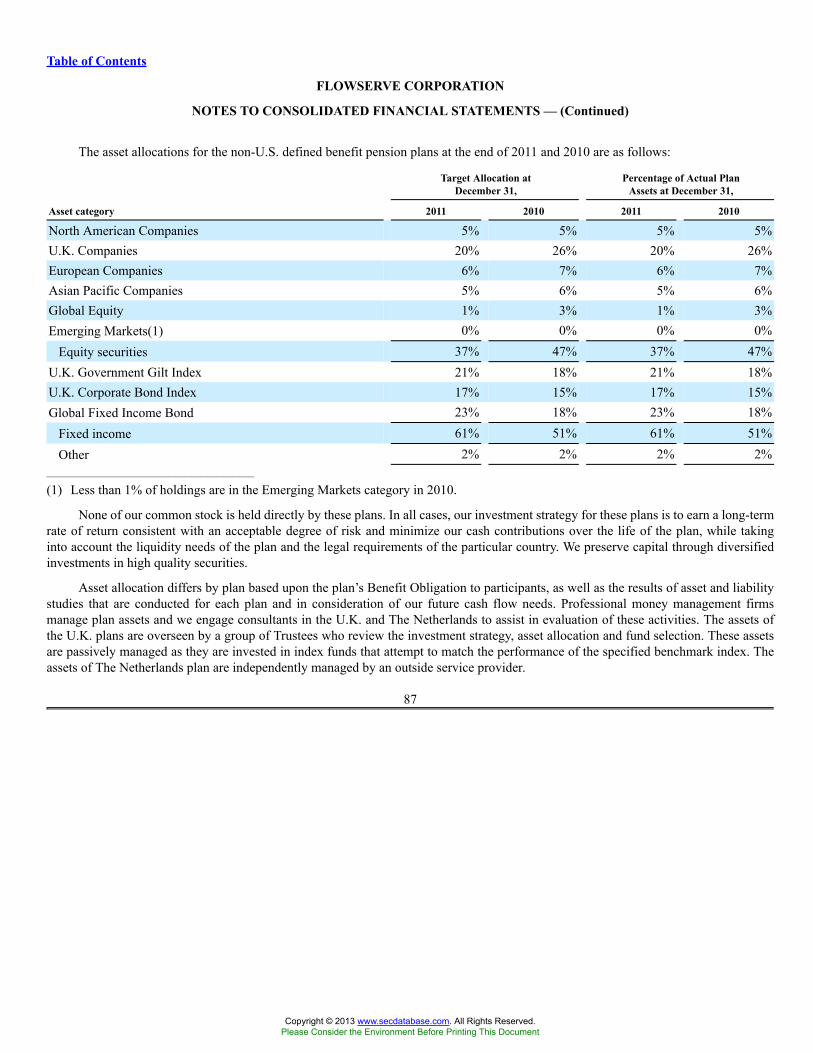
Table of Contents
FLOWSERVE CORPORATION
NOTES TO CONSOLIDATED FINANCIAL STATEMENTS — (Continued)
The asset allocations for the non-U.S. defined benefit pension plans at the end of 2011 and 2010 are as follows:
Target Allocation atDecember 31,
Percentage of Actual PlanAssets at December 31,
Asset category 2011 2010 2011 2010
North American Companies 5% 5% 5% 5%U.K. Companies 20% 26% 20% 26%European Companies 6% 7% 6% 7%Asian Pacific Companies 5% 6% 5% 6%Global Equity 1% 3% 1% 3%Emerging Markets(1) 0% 0% 0% 0%
Equity securities 37% 47% 37% 47%U.K. Government Gilt Index 21% 18% 21% 18%U.K. Corporate Bond Index 17% 15% 17% 15%Global Fixed Income Bond 23% 18% 23% 18%
Fixed income 61% 51% 61% 51%Other 2% 2% 2% 2%
_______________________________________
(1) Less than 1% of holdings are in the Emerging Markets category in 2010.
None of our common stock is held directly by these plans. In all cases, our investment strategy for these plans is to earn a long-termrate of return consistent with an acceptable degree of risk and minimize our cash contributions over the life of the plan, while takinginto account the liquidity needs of the plan and the legal requirements of the particular country. We preserve capital through diversifiedinvestments in high quality securities.
Asset allocation differs by plan based upon the plan’s Benefit Obligation to participants, as well as the results of asset and liabilitystudies that are conducted for each plan and in consideration of our future cash flow needs. Professional money management firmsmanage plan assets and we engage consultants in the U.K. and The Netherlands to assist in evaluation of these activities. The assets ofthe U.K. plans are overseen by a group of Trustees who review the investment strategy, asset allocation and fund selection. These assetsare passively managed as they are invested in index funds that attempt to match the performance of the specified benchmark index. Theassets of The Netherlands plan are independently managed by an outside service provider.
87
Copyright © 2013 www.secdatabase.com. All Rights Reserved.Please Consider the Environment Before Printing This Document
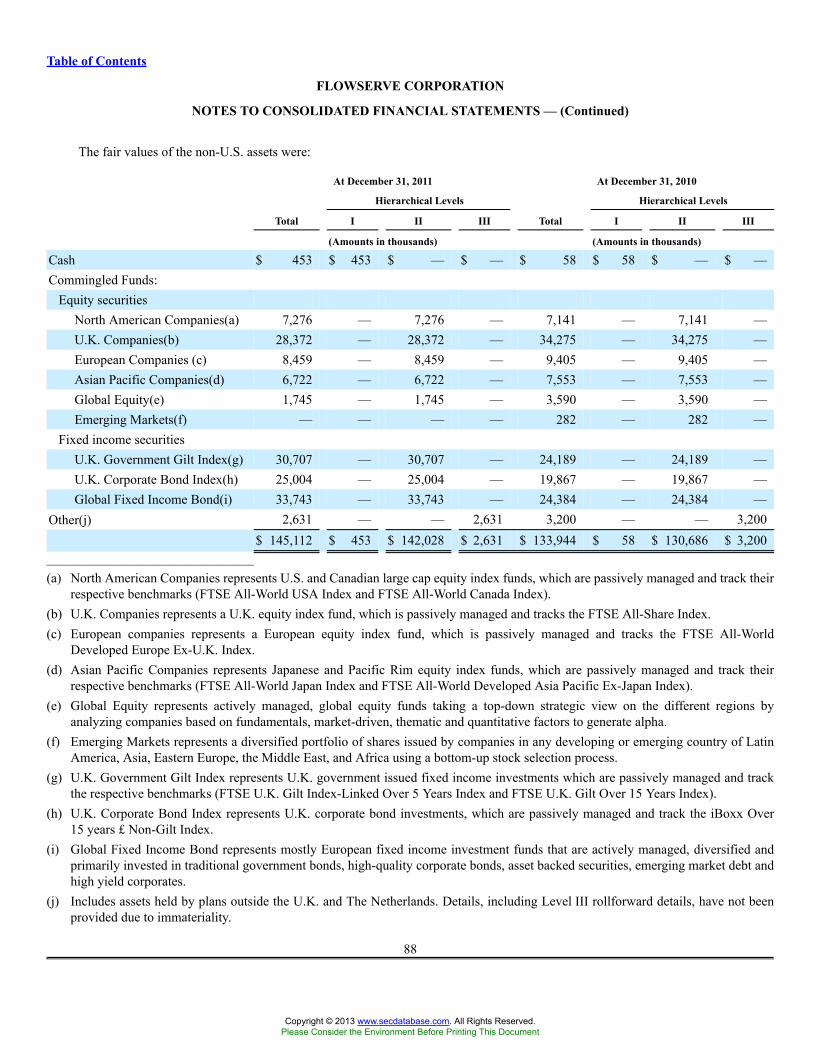
Table of Contents
FLOWSERVE CORPORATION
NOTES TO CONSOLIDATED FINANCIAL STATEMENTS — (Continued)
The fair values of the non-U.S. assets were:
At December 31, 2011 At December 31, 2010
Hierarchical Levels Hierarchical Levels
Total I II III Total I II III
(Amounts in thousands) (Amounts in thousands)
Cash $ 453 $ 453 $ — $ — $ 58 $ 58 $ — $ —Commingled Funds:
Equity securitiesNorth American Companies(a) 7,276 — 7,276 — 7,141 — 7,141 —U.K. Companies(b) 28,372 — 28,372 — 34,275 — 34,275 —European Companies (c) 8,459 — 8,459 — 9,405 — 9,405 —Asian Pacific Companies(d) 6,722 — 6,722 — 7,553 — 7,553 —Global Equity(e) 1,745 — 1,745 — 3,590 — 3,590 —Emerging Markets(f) — — — — 282 — 282 —
Fixed income securitiesU.K. Government Gilt Index(g) 30,707 — 30,707 — 24,189 — 24,189 —U.K. Corporate Bond Index(h) 25,004 — 25,004 — 19,867 — 19,867 —Global Fixed Income Bond(i) 33,743 — 33,743 — 24,384 — 24,384 —
Other(j) 2,631 — — 2,631 3,200 — — 3,200$ 145,112 $ 453 $ 142,028 $ 2,631 $ 133,944 $ 58 $ 130,686 $ 3,200
_______________________________________
(a) North American Companies represents U.S. and Canadian large cap equity index funds, which are passively managed and track theirrespective benchmarks (FTSE All-World USA Index and FTSE All-World Canada Index).
(b) U.K. Companies represents a U.K. equity index fund, which is passively managed and tracks the FTSE All-Share Index.(c) European companies represents a European equity index fund, which is passively managed and tracks the FTSE All-World
Developed Europe Ex-U.K. Index.(d) Asian Pacific Companies represents Japanese and Pacific Rim equity index funds, which are passively managed and track their
respective benchmarks (FTSE All-World Japan Index and FTSE All-World Developed Asia Pacific Ex-Japan Index).(e) Global Equity represents actively managed, global equity funds taking a top-down strategic view on the different regions by
analyzing companies based on fundamentals, market-driven, thematic and quantitative factors to generate alpha.(f) Emerging Markets represents a diversified portfolio of shares issued by companies in any developing or emerging country of Latin
America, Asia, Eastern Europe, the Middle East, and Africa using a bottom-up stock selection process.(g) U.K. Government Gilt Index represents U.K. government issued fixed income investments which are passively managed and track
the respective benchmarks (FTSE U.K. Gilt Index-Linked Over 5 Years Index and FTSE U.K. Gilt Over 15 Years Index).(h) U.K. Corporate Bond Index represents U.K. corporate bond investments, which are passively managed and track the iBoxx Over
15 years £ Non-Gilt Index.(i) Global Fixed Income Bond represents mostly European fixed income investment funds that are actively managed, diversified and
primarily invested in traditional government bonds, high-quality corporate bonds, asset backed securities, emerging market debt andhigh yield corporates.
(j) Includes assets held by plans outside the U.K. and The Netherlands. Details, including Level III rollforward details, have not beenprovided due to immateriality.
88
Copyright © 2013 www.secdatabase.com. All Rights Reserved.Please Consider the Environment Before Printing This Document
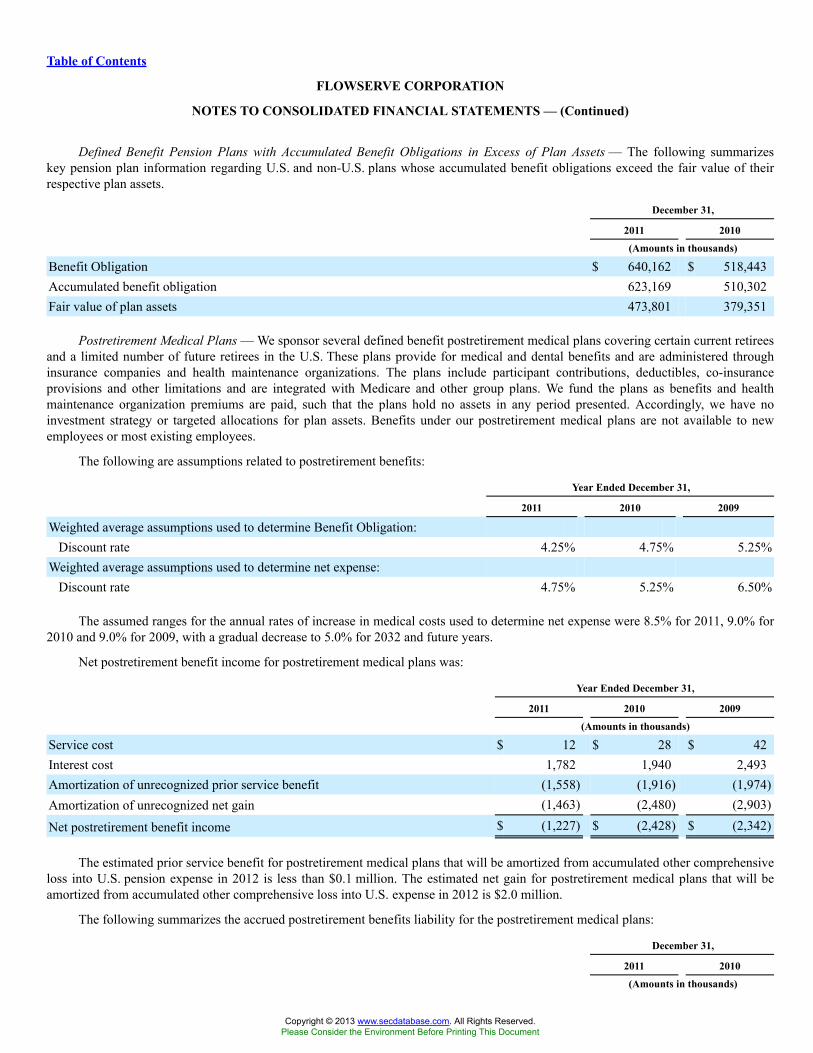
Table of Contents
FLOWSERVE CORPORATION
NOTES TO CONSOLIDATED FINANCIAL STATEMENTS — (Continued)
Defined Benefit Pension Plans with Accumulated Benefit Obligations in Excess of Plan Assets — The following summarizeskey pension plan information regarding U.S. and non-U.S. plans whose accumulated benefit obligations exceed the fair value of theirrespective plan assets.
December 31,
2011 2010
(Amounts in thousands)
Benefit Obligation $ 640,162 $ 518,443Accumulated benefit obligation 623,169 510,302Fair value of plan assets 473,801 379,351
Postretirement Medical Plans — We sponsor several defined benefit postretirement medical plans covering certain current retireesand a limited number of future retirees in the U.S. These plans provide for medical and dental benefits and are administered throughinsurance companies and health maintenance organizations. The plans include participant contributions, deductibles, co-insuranceprovisions and other limitations and are integrated with Medicare and other group plans. We fund the plans as benefits and healthmaintenance organization premiums are paid, such that the plans hold no assets in any period presented. Accordingly, we have noinvestment strategy or targeted allocations for plan assets. Benefits under our postretirement medical plans are not available to newemployees or most existing employees.
The following are assumptions related to postretirement benefits:
Year Ended December 31,
2011 2010 2009
Weighted average assumptions used to determine Benefit Obligation:Discount rate 4.25% 4.75% 5.25%
Weighted average assumptions used to determine net expense:Discount rate 4.75% 5.25% 6.50%
The assumed ranges for the annual rates of increase in medical costs used to determine net expense were 8.5% for 2011, 9.0% for2010 and 9.0% for 2009, with a gradual decrease to 5.0% for 2032 and future years.
Net postretirement benefit income for postretirement medical plans was:
Year Ended December 31,
2011 2010 2009
(Amounts in thousands)
Service cost $ 12 $ 28 $ 42Interest cost 1,782 1,940 2,493Amortization of unrecognized prior service benefit (1,558) (1,916) (1,974)Amortization of unrecognized net gain (1,463) (2,480) (2,903)
Net postretirement benefit income $ (1,227) $ (2,428) $ (2,342)
The estimated prior service benefit for postretirement medical plans that will be amortized from accumulated other comprehensiveloss into U.S. pension expense in 2012 is less than $0.1 million. The estimated net gain for postretirement medical plans that will beamortized from accumulated other comprehensive loss into U.S. expense in 2012 is $2.0 million.
The following summarizes the accrued postretirement benefits liability for the postretirement medical plans:
December 31,
2011 2010
(Amounts in thousands)
Copyright © 2013 www.secdatabase.com. All Rights Reserved.Please Consider the Environment Before Printing This Document
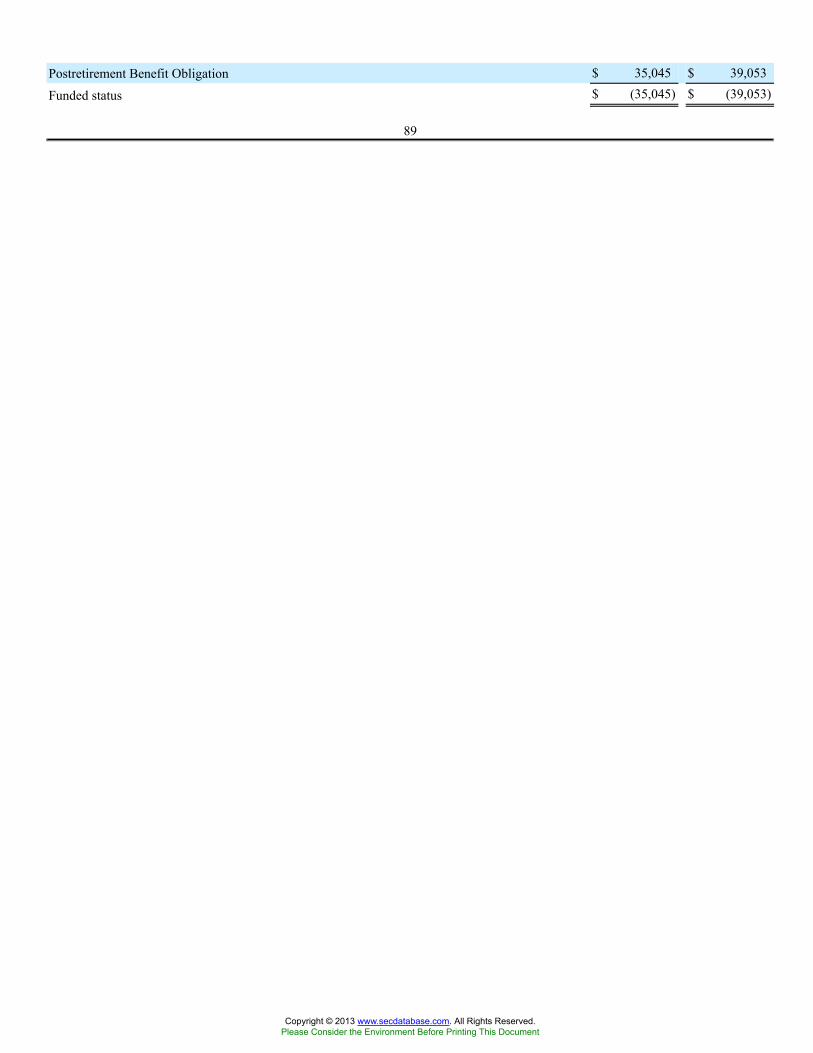
Postretirement Benefit Obligation $ 35,045 $ 39,053
Funded status $ (35,045) $ (39,053)
89
Copyright © 2013 www.secdatabase.com. All Rights Reserved.Please Consider the Environment Before Printing This Document
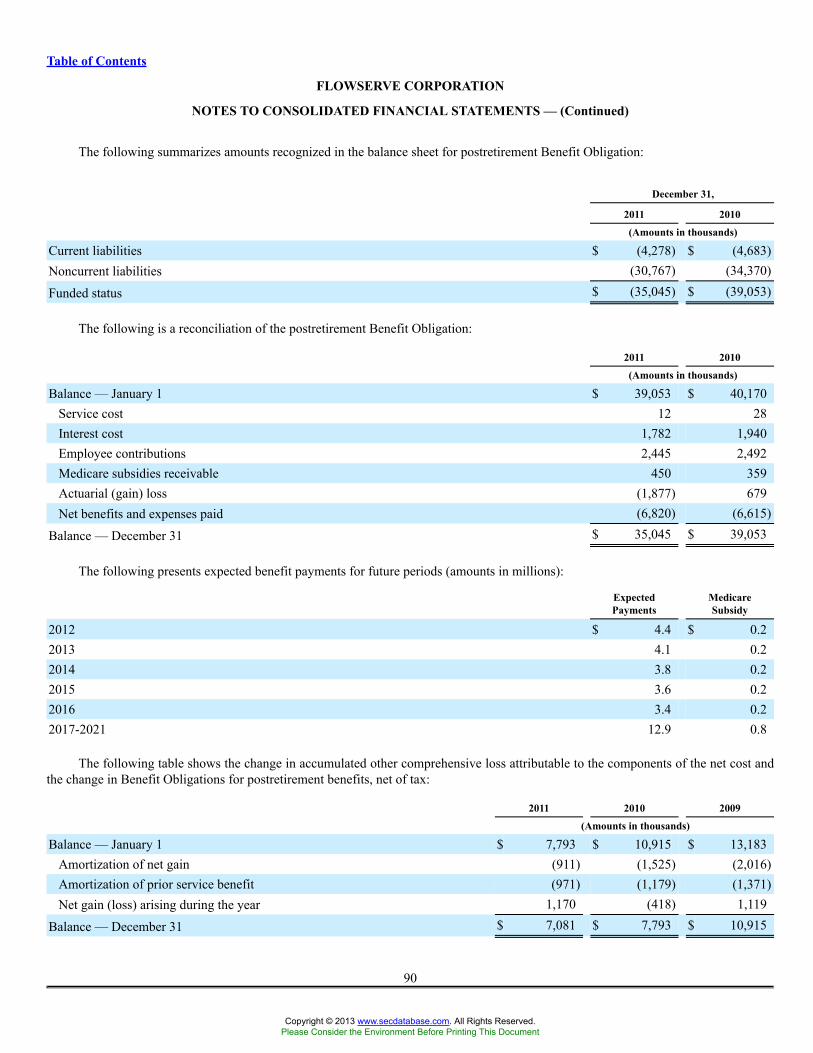
Table of Contents
FLOWSERVE CORPORATION
NOTES TO CONSOLIDATED FINANCIAL STATEMENTS — (Continued)
The following summarizes amounts recognized in the balance sheet for postretirement Benefit Obligation:
December 31,
2011 2010
(Amounts in thousands)
Current liabilities $ (4,278) $ (4,683)Noncurrent liabilities (30,767) (34,370)
Funded status $ (35,045) $ (39,053)
The following is a reconciliation of the postretirement Benefit Obligation:
2011 2010
(Amounts in thousands)
Balance — January 1 $ 39,053 $ 40,170Service cost 12 28Interest cost 1,782 1,940Employee contributions 2,445 2,492Medicare subsidies receivable 450 359Actuarial (gain) loss (1,877) 679Net benefits and expenses paid (6,820) (6,615)
Balance — December 31 $ 35,045 $ 39,053
The following presents expected benefit payments for future periods (amounts in millions):
ExpectedPayments
MedicareSubsidy
2012 $ 4.4 $ 0.22013 4.1 0.22014 3.8 0.22015 3.6 0.22016 3.4 0.22017-2021 12.9 0.8
The following table shows the change in accumulated other comprehensive loss attributable to the components of the net cost andthe change in Benefit Obligations for postretirement benefits, net of tax:
2011 2010 2009
(Amounts in thousands)
Balance — January 1 $ 7,793 $ 10,915 $ 13,183Amortization of net gain (911) (1,525) (2,016)Amortization of prior service benefit (971) (1,179) (1,371)Net gain (loss) arising during the year 1,170 (418) 1,119
Balance — December 31 $ 7,081 $ 7,793 $ 10,915
90
Copyright © 2013 www.secdatabase.com. All Rights Reserved.Please Consider the Environment Before Printing This Document
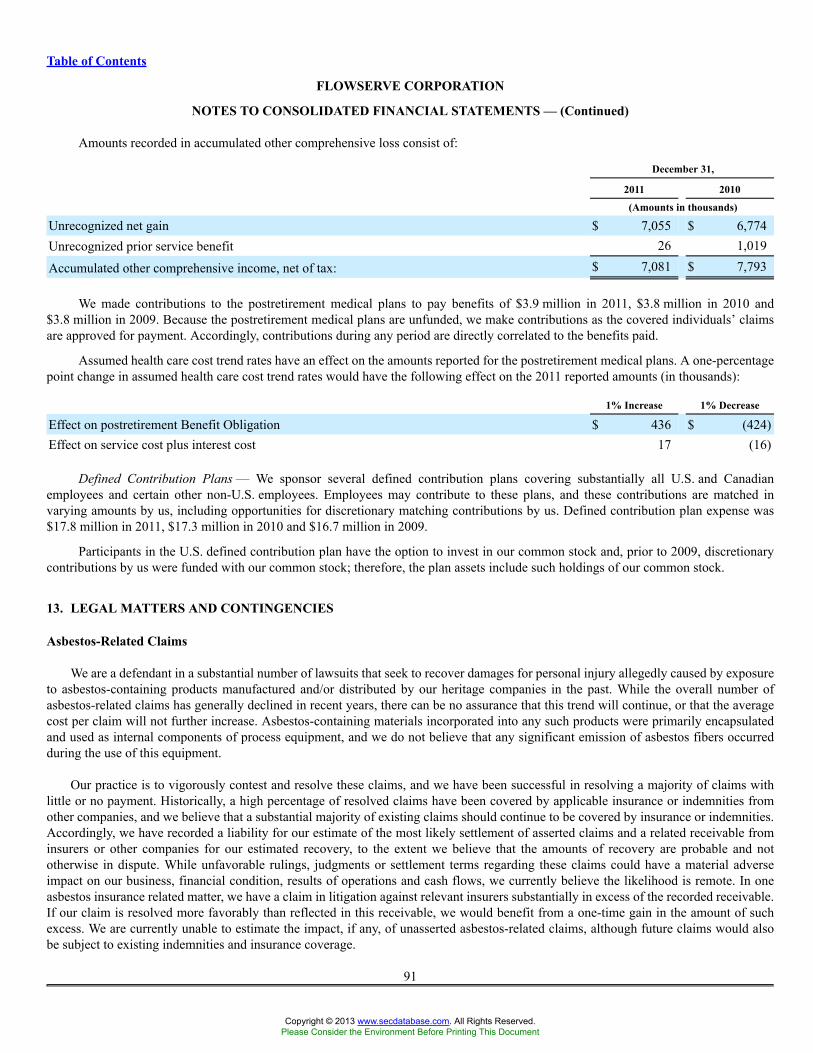
Table of Contents
FLOWSERVE CORPORATION
NOTES TO CONSOLIDATED FINANCIAL STATEMENTS — (Continued)
Amounts recorded in accumulated other comprehensive loss consist of:
December 31,
2011 2010
(Amounts in thousands)
Unrecognized net gain $ 7,055 $ 6,774Unrecognized prior service benefit 26 1,019
Accumulated other comprehensive income, net of tax: $ 7,081 $ 7,793
We made contributions to the postretirement medical plans to pay benefits of $3.9 million in 2011, $3.8 million in 2010 and$3.8 million in 2009. Because the postretirement medical plans are unfunded, we make contributions as the covered individuals’ claimsare approved for payment. Accordingly, contributions during any period are directly correlated to the benefits paid.
Assumed health care cost trend rates have an effect on the amounts reported for the postretirement medical plans. A one-percentagepoint change in assumed health care cost trend rates would have the following effect on the 2011 reported amounts (in thousands):
1% Increase 1% Decrease
Effect on postretirement Benefit Obligation $ 436 $ (424)Effect on service cost plus interest cost 17 (16)
Defined Contribution Plans — We sponsor several defined contribution plans covering substantially all U.S. and Canadianemployees and certain other non-U.S. employees. Employees may contribute to these plans, and these contributions are matched invarying amounts by us, including opportunities for discretionary matching contributions by us. Defined contribution plan expense was$17.8 million in 2011, $17.3 million in 2010 and $16.7 million in 2009.
Participants in the U.S. defined contribution plan have the option to invest in our common stock and, prior to 2009, discretionarycontributions by us were funded with our common stock; therefore, the plan assets include such holdings of our common stock.
13. LEGAL MATTERS AND CONTINGENCIES
Asbestos-Related Claims
We are a defendant in a substantial number of lawsuits that seek to recover damages for personal injury allegedly caused by exposureto asbestos-containing products manufactured and/or distributed by our heritage companies in the past. While the overall number ofasbestos-related claims has generally declined in recent years, there can be no assurance that this trend will continue, or that the averagecost per claim will not further increase. Asbestos-containing materials incorporated into any such products were primarily encapsulatedand used as internal components of process equipment, and we do not believe that any significant emission of asbestos fibers occurredduring the use of this equipment.
Our practice is to vigorously contest and resolve these claims, and we have been successful in resolving a majority of claims withlittle or no payment. Historically, a high percentage of resolved claims have been covered by applicable insurance or indemnities fromother companies, and we believe that a substantial majority of existing claims should continue to be covered by insurance or indemnities.Accordingly, we have recorded a liability for our estimate of the most likely settlement of asserted claims and a related receivable frominsurers or other companies for our estimated recovery, to the extent we believe that the amounts of recovery are probable and nototherwise in dispute. While unfavorable rulings, judgments or settlement terms regarding these claims could have a material adverseimpact on our business, financial condition, results of operations and cash flows, we currently believe the likelihood is remote. In oneasbestos insurance related matter, we have a claim in litigation against relevant insurers substantially in excess of the recorded receivable.If our claim is resolved more favorably than reflected in this receivable, we would benefit from a one-time gain in the amount of suchexcess. We are currently unable to estimate the impact, if any, of unasserted asbestos-related claims, although future claims would alsobe subject to existing indemnities and insurance coverage.
91
Copyright © 2013 www.secdatabase.com. All Rights Reserved.Please Consider the Environment Before Printing This Document
Table of Contents
FLOWSERVE CORPORATION
NOTES TO CONSOLIDATED FINANCIAL STATEMENTS — (Continued)
United Nations Oil-for-Food Program
In mid-2006, French authorities began an investigation of over 170 French companies, of which our French subsidiary was included,concerning suspected inappropriate activities conducted in connection with the United Nations Oil for Food Program. As anticipatedand as previously disclosed, the French investigation of our French subsidiary was formally opened in the first quarter of 2010, and ourFrench subsidiary has filed a formal response with the French court. We currently do not expect to incur additional case resolution costsof a material amount in this matter; however, if the French authorities take enforcement action against our French subsidiary regarding itsinvestigation, we may be subject to monetary and non-monetary penalties, which we currently do not believe will have a material adverseeffect on our company.
In addition to the governmental investigation referenced above, on June 27, 2008, the Republic of Iraq filed a civil suit in federalcourt in New York against 93 participants in the United Nations Oil-for-Food Program, including us and our two foreign subsidiaries thatparticipated in the program. There have been no material developments in this case since it was initially filed. We intend to vigorouslycontest the suit, and we believe that we have valid defenses to the claims asserted. While we cannot predict the outcome of the suit at thepresent time, we do not currently believe the resolution of this suit will have a material adverse financial impact on our company.
Export Compliance
As previously reported, in March 2006, we initiated a voluntary systematic process to determine our compliance with respect to U.S.export control and economic sanctions laws and regulations. Our process included the onsite review of approximately 40 sites globallyand addressed the period of October 1, 2002 through October 1, 2007. At the end of 2008, we completed comprehensive disclosures tothe Commerce Department's Bureau of Industry and Security ("BIS") and the Treasury Department's Office of Foreign Assets Control("OFAC") regarding the results of our review process, and we continued to work closely with authorities over the next several years tosupplement and clarify specific aspects of our voluntary disclosures.
Based on the results of our review process, we determined and voluntarily self-disclosed that certain of our domestic and foreignaffiliates engaged in unlicensed exports and reexports of pumps, valves and related components to Iran, Syria, Sudan, Cuba and variousother countries. As previously disclosed in our Quarterly Report on Form 10-Q for the quarter ended September 30, 2011, and as disclosedin the public releases of both BIS and OFAC, in late September 2011, we entered into settlement agreements with both BIS and OFACthat resolved in full all matters contained in our voluntary self-disclosures. Under the settlements, we agreed to pay a civil penalty of $2.5million to BIS to settle 228 charges of unlicensed exports and reexports to Iran, Syria and various other countries and $0.5 million toOFAC to settle charges alleging 58 violations of OFAC's Iranian, Cuban and Sudanese sanctioned programs. As a part of our settlementwith BIS, we also agreed to conduct a one-time, post-settlement compliance audit of 16 company sites located in the U.S. and overseas.The full amount of the civil penalties and the expected cost of the audit approximated the reserve previously established for the matter.As disclosed, effective January 1, 2012, our foreign subsidiaries substantially completed the voluntary winding down of business in thesecountries.
Other
We are currently involved as a potentially responsible party at seven former public waste disposal sites in various stages of evaluationor remediation. The projected cost of remediation at these sites, as well as our alleged “fair share” allocation, will remain uncertain untilall studies have been completed and the parties have either negotiated an amicable resolution or the matter has been judicially resolved.At each site, there are many other parties who have similarly been identified. Many of the other parties identified are financially strongand solvent companies that appear able to pay their share of the remediation costs. Based on our information about the waste disposalpractices at these sites and the environmental regulatory process in general, we believe that it is likely that ultimate remediation liabilitycosts for each site will be apportioned among all liable parties, including site owners and waste transporters, according to the volumesand/or toxicity of the wastes shown to have been disposed of at the sites. We believe that our exposure for existing disposal sites will notbe material.
We are also a defendant in a number of other lawsuits, including product liability claims, that are insured, subject to the applicabledeductibles, arising in the ordinary course of business, and we are also involved in other uninsured routine litigation incidental to ourbusiness. We currently believe none of such litigation, either individually or in the aggregate, is material to our business, operationsor overall financial condition. However, litigation is inherently unpredictable, and resolutions or dispositions of claims or lawsuits by
Copyright © 2013 www.secdatabase.com. All Rights Reserved.Please Consider the Environment Before Printing This Document

settlement or otherwise could have an adverse impact on our financial position, results of operations or cash flows for the reporting periodin which any such resolution or disposition occurs.
92
Copyright © 2013 www.secdatabase.com. All Rights Reserved.Please Consider the Environment Before Printing This Document
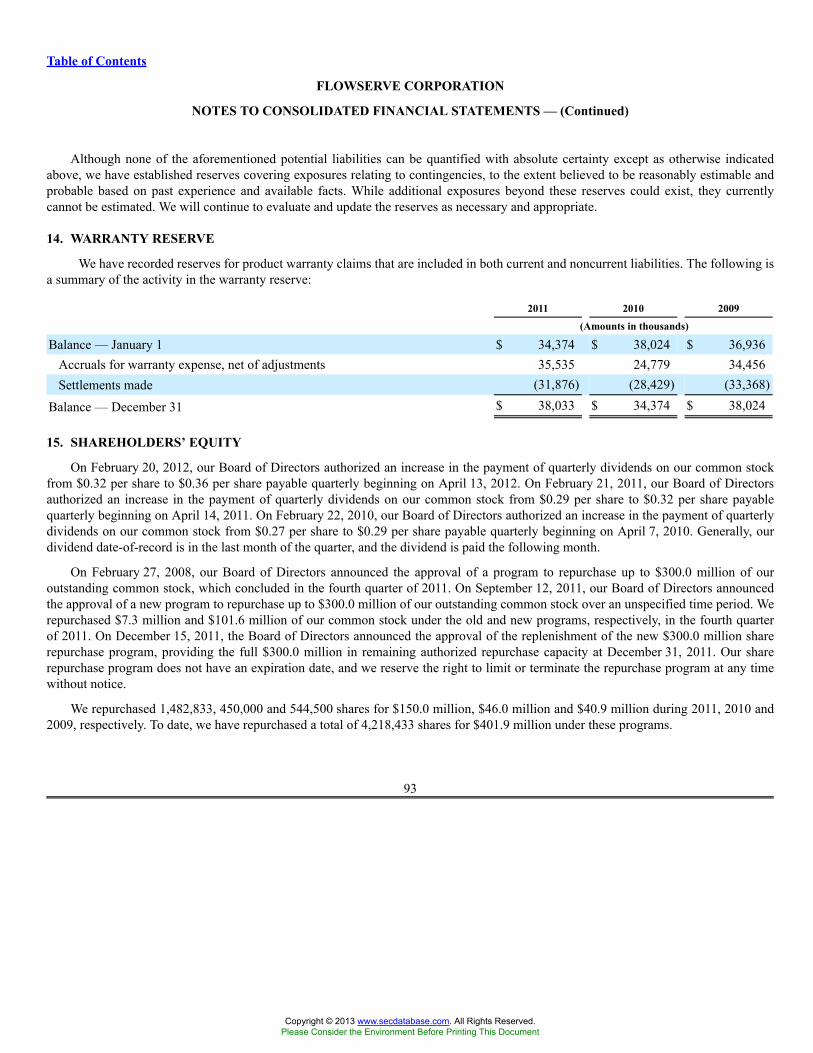
Table of Contents
FLOWSERVE CORPORATION
NOTES TO CONSOLIDATED FINANCIAL STATEMENTS — (Continued)
Although none of the aforementioned potential liabilities can be quantified with absolute certainty except as otherwise indicatedabove, we have established reserves covering exposures relating to contingencies, to the extent believed to be reasonably estimable andprobable based on past experience and available facts. While additional exposures beyond these reserves could exist, they currentlycannot be estimated. We will continue to evaluate and update the reserves as necessary and appropriate.
14. WARRANTY RESERVE
We have recorded reserves for product warranty claims that are included in both current and noncurrent liabilities. The following isa summary of the activity in the warranty reserve:
2011 2010 2009
(Amounts in thousands)
Balance — January 1 $ 34,374 $ 38,024 $ 36,936Accruals for warranty expense, net of adjustments 35,535 24,779 34,456Settlements made (31,876) (28,429) (33,368)
Balance — December 31 $ 38,033 $ 34,374 $ 38,024
15. SHAREHOLDERS’ EQUITY
On February 20, 2012, our Board of Directors authorized an increase in the payment of quarterly dividends on our common stockfrom $0.32 per share to $0.36 per share payable quarterly beginning on April 13, 2012. On February 21, 2011, our Board of Directorsauthorized an increase in the payment of quarterly dividends on our common stock from $0.29 per share to $0.32 per share payablequarterly beginning on April 14, 2011. On February 22, 2010, our Board of Directors authorized an increase in the payment of quarterlydividends on our common stock from $0.27 per share to $0.29 per share payable quarterly beginning on April 7, 2010. Generally, ourdividend date-of-record is in the last month of the quarter, and the dividend is paid the following month.
On February 27, 2008, our Board of Directors announced the approval of a program to repurchase up to $300.0 million of ouroutstanding common stock, which concluded in the fourth quarter of 2011. On September 12, 2011, our Board of Directors announcedthe approval of a new program to repurchase up to $300.0 million of our outstanding common stock over an unspecified time period. Werepurchased $7.3 million and $101.6 million of our common stock under the old and new programs, respectively, in the fourth quarterof 2011. On December 15, 2011, the Board of Directors announced the approval of the replenishment of the new $300.0 million sharerepurchase program, providing the full $300.0 million in remaining authorized repurchase capacity at December 31, 2011. Our sharerepurchase program does not have an expiration date, and we reserve the right to limit or terminate the repurchase program at any timewithout notice.
We repurchased 1,482,833, 450,000 and 544,500 shares for $150.0 million, $46.0 million and $40.9 million during 2011, 2010 and2009, respectively. To date, we have repurchased a total of 4,218,433 shares for $401.9 million under these programs.
93
Copyright © 2013 www.secdatabase.com. All Rights Reserved.Please Consider the Environment Before Printing This Document
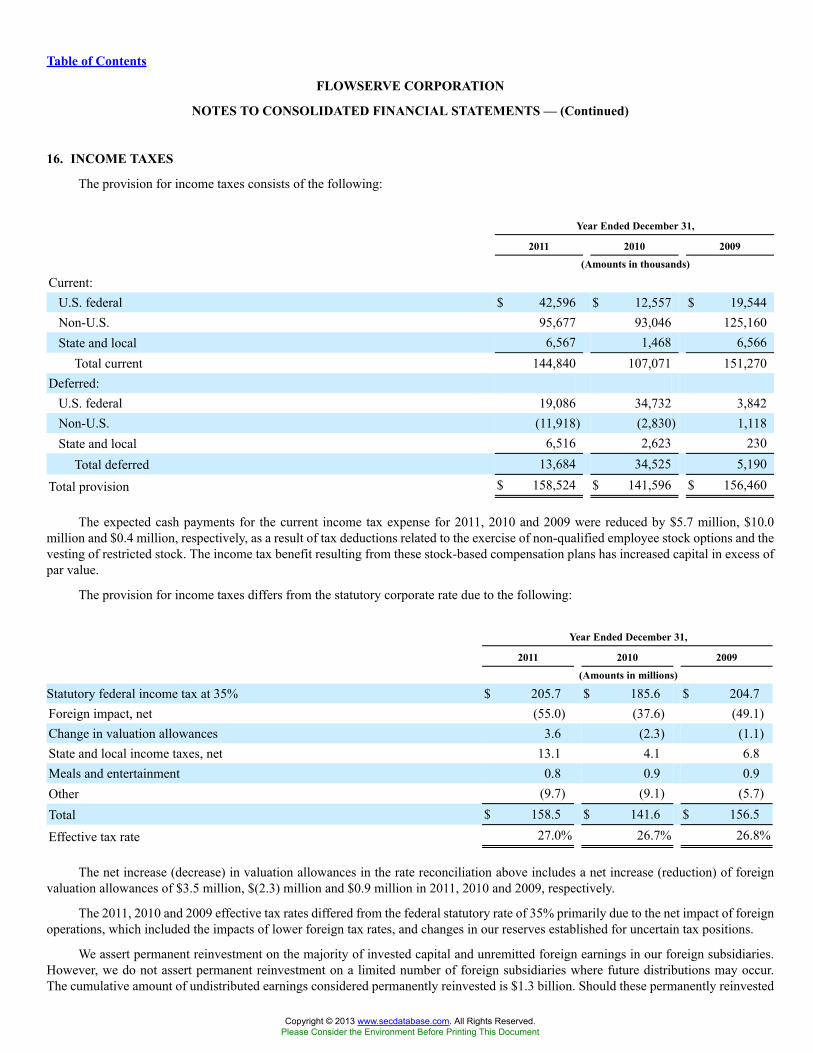
Table of Contents
FLOWSERVE CORPORATION
NOTES TO CONSOLIDATED FINANCIAL STATEMENTS — (Continued)
16. INCOME TAXES
The provision for income taxes consists of the following:
Year Ended December 31,
2011 2010 2009
(Amounts in thousands)
Current:U.S. federal $ 42,596 $ 12,557 $ 19,544Non-U.S. 95,677 93,046 125,160State and local 6,567 1,468 6,566
Total current 144,840 107,071 151,270Deferred:
U.S. federal 19,086 34,732 3,842Non-U.S. (11,918) (2,830) 1,118State and local 6,516 2,623 230
Total deferred 13,684 34,525 5,190
Total provision $ 158,524 $ 141,596 $ 156,460
The expected cash payments for the current income tax expense for 2011, 2010 and 2009 were reduced by $5.7 million, $10.0million and $0.4 million, respectively, as a result of tax deductions related to the exercise of non-qualified employee stock options and thevesting of restricted stock. The income tax benefit resulting from these stock-based compensation plans has increased capital in excess ofpar value.
The provision for income taxes differs from the statutory corporate rate due to the following:
Year Ended December 31,
2011 2010 2009
(Amounts in millions)
Statutory federal income tax at 35% $ 205.7 $ 185.6 $ 204.7Foreign impact, net (55.0) (37.6) (49.1)Change in valuation allowances 3.6 (2.3) (1.1)State and local income taxes, net 13.1 4.1 6.8Meals and entertainment 0.8 0.9 0.9Other (9.7) (9.1) (5.7)Total $ 158.5 $ 141.6 $ 156.5
Effective tax rate 27.0% 26.7% 26.8%
The net increase (decrease) in valuation allowances in the rate reconciliation above includes a net increase (reduction) of foreignvaluation allowances of $3.5 million, $(2.3) million and $0.9 million in 2011, 2010 and 2009, respectively.
The 2011, 2010 and 2009 effective tax rates differed from the federal statutory rate of 35% primarily due to the net impact of foreignoperations, which included the impacts of lower foreign tax rates, and changes in our reserves established for uncertain tax positions.
We assert permanent reinvestment on the majority of invested capital and unremitted foreign earnings in our foreign subsidiaries.However, we do not assert permanent reinvestment on a limited number of foreign subsidiaries where future distributions may occur.The cumulative amount of undistributed earnings considered permanently reinvested is $1.3 billion. Should these permanently reinvested
Copyright © 2013 www.secdatabase.com. All Rights Reserved.Please Consider the Environment Before Printing This Document
earnings be repatriated in a future period in the form of dividends or otherwise, our provision for income taxes may increase materiallyin that period. During each of the three years reported in the period ended December 31,
94
Copyright © 2013 www.secdatabase.com. All Rights Reserved.Please Consider the Environment Before Printing This Document
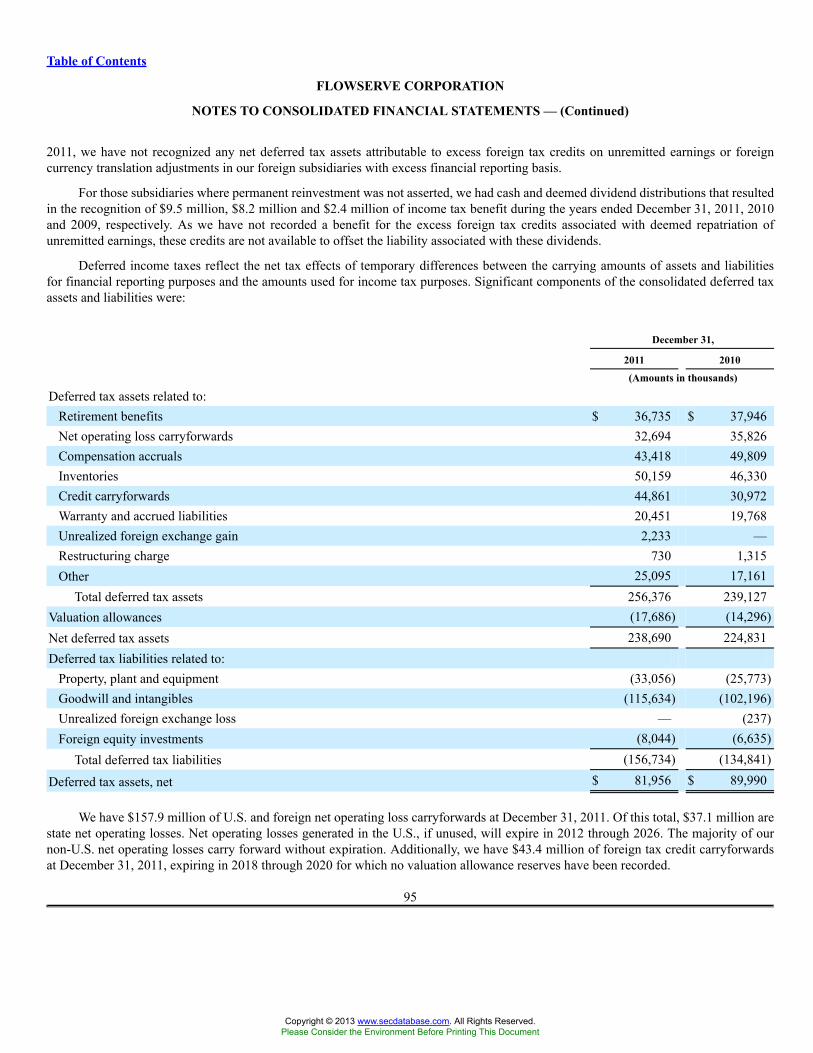
Table of Contents
FLOWSERVE CORPORATION
NOTES TO CONSOLIDATED FINANCIAL STATEMENTS — (Continued)
2011, we have not recognized any net deferred tax assets attributable to excess foreign tax credits on unremitted earnings or foreigncurrency translation adjustments in our foreign subsidiaries with excess financial reporting basis.
For those subsidiaries where permanent reinvestment was not asserted, we had cash and deemed dividend distributions that resultedin the recognition of $9.5 million, $8.2 million and $2.4 million of income tax benefit during the years ended December 31, 2011, 2010and 2009, respectively. As we have not recorded a benefit for the excess foreign tax credits associated with deemed repatriation ofunremitted earnings, these credits are not available to offset the liability associated with these dividends.
Deferred income taxes reflect the net tax effects of temporary differences between the carrying amounts of assets and liabilitiesfor financial reporting purposes and the amounts used for income tax purposes. Significant components of the consolidated deferred taxassets and liabilities were:
December 31,
2011 2010
(Amounts in thousands)
Deferred tax assets related to:Retirement benefits $ 36,735 $ 37,946Net operating loss carryforwards 32,694 35,826Compensation accruals 43,418 49,809Inventories 50,159 46,330Credit carryforwards 44,861 30,972Warranty and accrued liabilities 20,451 19,768Unrealized foreign exchange gain 2,233 —Restructuring charge 730 1,315Other 25,095 17,161
Total deferred tax assets 256,376 239,127Valuation allowances (17,686) (14,296)Net deferred tax assets 238,690 224,831Deferred tax liabilities related to:
Property, plant and equipment (33,056) (25,773)Goodwill and intangibles (115,634) (102,196)Unrealized foreign exchange loss — (237)Foreign equity investments (8,044) (6,635)
Total deferred tax liabilities (156,734) (134,841)
Deferred tax assets, net $ 81,956 $ 89,990
We have $157.9 million of U.S. and foreign net operating loss carryforwards at December 31, 2011. Of this total, $37.1 million arestate net operating losses. Net operating losses generated in the U.S., if unused, will expire in 2012 through 2026. The majority of ournon-U.S. net operating losses carry forward without expiration. Additionally, we have $43.4 million of foreign tax credit carryforwardsat December 31, 2011, expiring in 2018 through 2020 for which no valuation allowance reserves have been recorded.
95
Copyright © 2013 www.secdatabase.com. All Rights Reserved.Please Consider the Environment Before Printing This Document
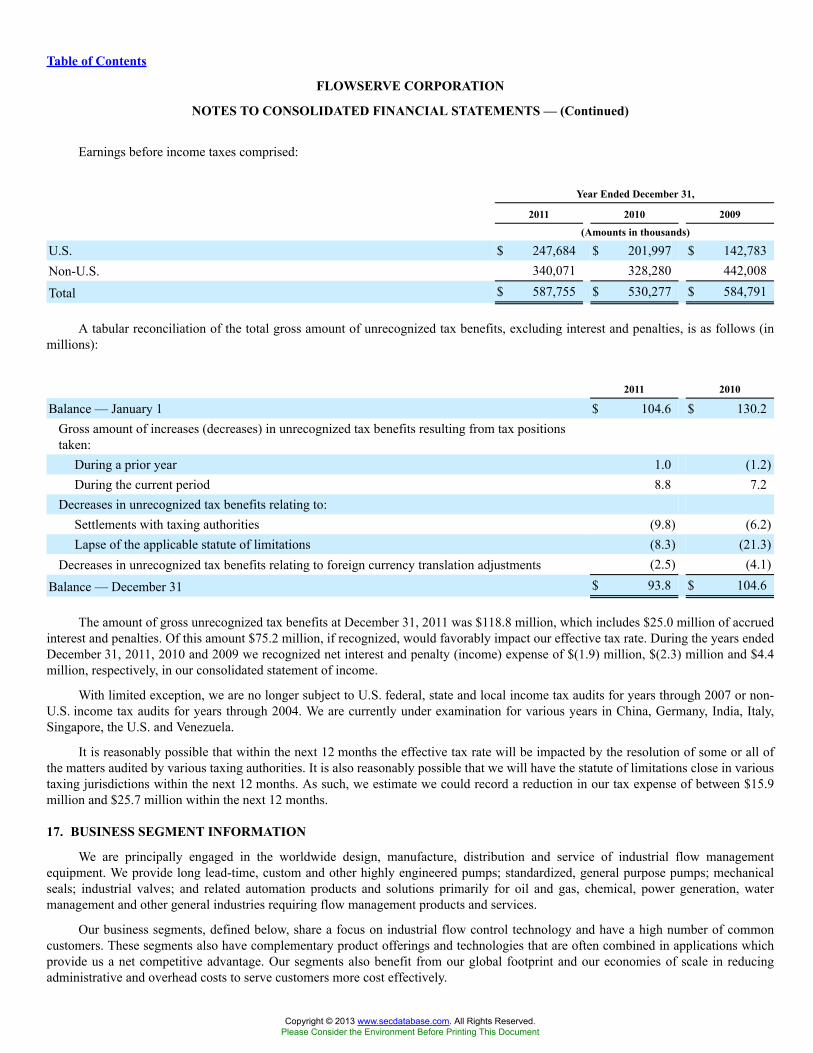
Table of Contents
FLOWSERVE CORPORATION
NOTES TO CONSOLIDATED FINANCIAL STATEMENTS — (Continued)
Earnings before income taxes comprised:
Year Ended December 31,
2011 2010 2009
(Amounts in thousands)
U.S. $ 247,684 $ 201,997 $ 142,783Non-U.S. 340,071 328,280 442,008
Total $ 587,755 $ 530,277 $ 584,791
A tabular reconciliation of the total gross amount of unrecognized tax benefits, excluding interest and penalties, is as follows (inmillions):
2011 2010
Balance — January 1 $ 104.6 $ 130.2Gross amount of increases (decreases) in unrecognized tax benefits resulting from tax positionstaken:
During a prior year 1.0 (1.2)During the current period 8.8 7.2
Decreases in unrecognized tax benefits relating to:Settlements with taxing authorities (9.8) (6.2)Lapse of the applicable statute of limitations (8.3) (21.3)
Decreases in unrecognized tax benefits relating to foreign currency translation adjustments (2.5) (4.1)
Balance — December 31 $ 93.8 $ 104.6
The amount of gross unrecognized tax benefits at December 31, 2011 was $118.8 million, which includes $25.0 million of accruedinterest and penalties. Of this amount $75.2 million, if recognized, would favorably impact our effective tax rate. During the years endedDecember 31, 2011, 2010 and 2009 we recognized net interest and penalty (income) expense of $(1.9) million, $(2.3) million and $4.4million, respectively, in our consolidated statement of income.
With limited exception, we are no longer subject to U.S. federal, state and local income tax audits for years through 2007 or non-U.S. income tax audits for years through 2004. We are currently under examination for various years in China, Germany, India, Italy,Singapore, the U.S. and Venezuela.
It is reasonably possible that within the next 12 months the effective tax rate will be impacted by the resolution of some or all ofthe matters audited by various taxing authorities. It is also reasonably possible that we will have the statute of limitations close in varioustaxing jurisdictions within the next 12 months. As such, we estimate we could record a reduction in our tax expense of between $15.9million and $25.7 million within the next 12 months.
17. BUSINESS SEGMENT INFORMATION
We are principally engaged in the worldwide design, manufacture, distribution and service of industrial flow managementequipment. We provide long lead-time, custom and other highly engineered pumps; standardized, general purpose pumps; mechanicalseals; industrial valves; and related automation products and solutions primarily for oil and gas, chemical, power generation, watermanagement and other general industries requiring flow management products and services.
Our business segments, defined below, share a focus on industrial flow control technology and have a high number of commoncustomers. These segments also have complementary product offerings and technologies that are often combined in applications whichprovide us a net competitive advantage. Our segments also benefit from our global footprint and our economies of scale in reducingadministrative and overhead costs to serve customers more cost effectively.
Copyright © 2013 www.secdatabase.com. All Rights Reserved.Please Consider the Environment Before Printing This Document

We conduct our operations through these three business segments based on type of product and how we manage the business:• FSG EPD for long lead-time, custom and other highly-engineered pumps and pump systems, mechanical seals, auxiliary systems
and replacement parts and related services;• FSG IPD for engineered and pre-configured industrial pumps and pump systems and related products and services; and
96
Copyright © 2013 www.secdatabase.com. All Rights Reserved.Please Consider the Environment Before Printing This Document
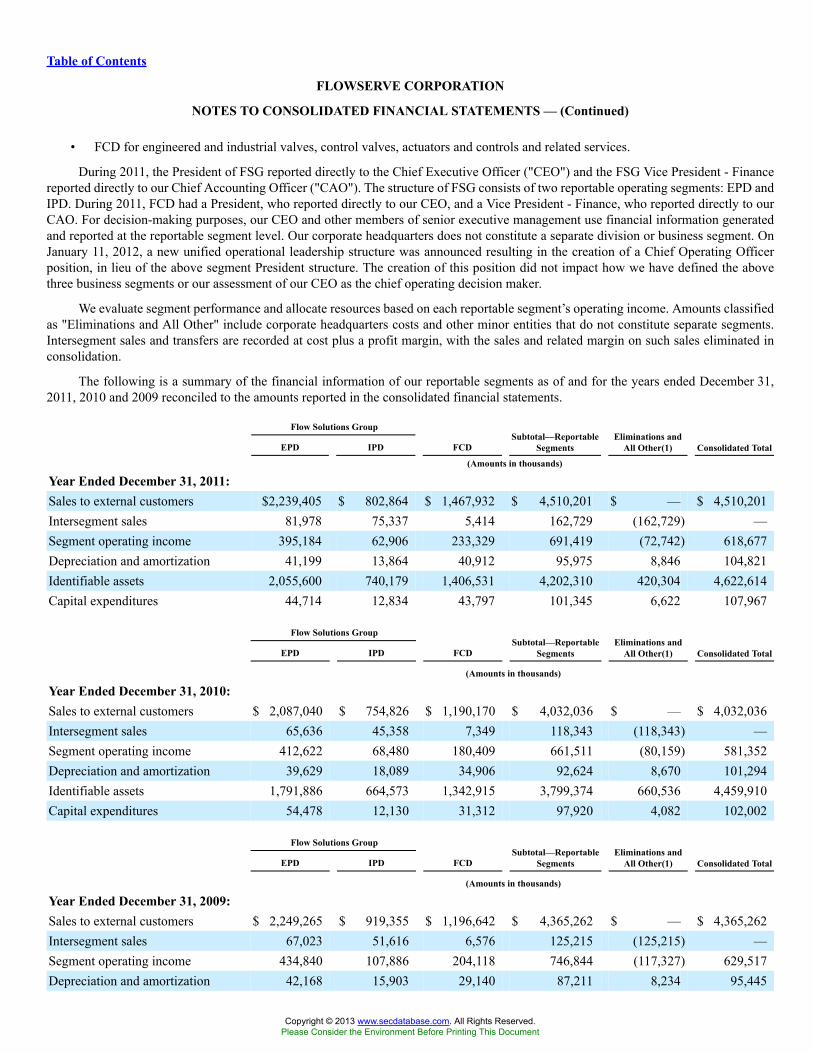
Table of Contents
FLOWSERVE CORPORATION
NOTES TO CONSOLIDATED FINANCIAL STATEMENTS — (Continued)
• FCD for engineered and industrial valves, control valves, actuators and controls and related services.
During 2011, the President of FSG reported directly to the Chief Executive Officer ("CEO") and the FSG Vice President - Financereported directly to our Chief Accounting Officer ("CAO"). The structure of FSG consists of two reportable operating segments: EPD andIPD. During 2011, FCD had a President, who reported directly to our CEO, and a Vice President - Finance, who reported directly to ourCAO. For decision-making purposes, our CEO and other members of senior executive management use financial information generatedand reported at the reportable segment level. Our corporate headquarters does not constitute a separate division or business segment. OnJanuary 11, 2012, a new unified operational leadership structure was announced resulting in the creation of a Chief Operating Officerposition, in lieu of the above segment President structure. The creation of this position did not impact how we have defined the abovethree business segments or our assessment of our CEO as the chief operating decision maker.
We evaluate segment performance and allocate resources based on each reportable segment’s operating income. Amounts classifiedas "Eliminations and All Other" include corporate headquarters costs and other minor entities that do not constitute separate segments.Intersegment sales and transfers are recorded at cost plus a profit margin, with the sales and related margin on such sales eliminated inconsolidation.
The following is a summary of the financial information of our reportable segments as of and for the years ended December 31,2011, 2010 and 2009 reconciled to the amounts reported in the consolidated financial statements.
Flow Solutions Group
EPD IPD FCDSubtotal—Reportable
SegmentsEliminations and
All Other(1) Consolidated Total
(Amounts in thousands)
Year Ended December 31, 2011:Sales to external customers $2,239,405 $ 802,864 $ 1,467,932 $ 4,510,201 $ — $ 4,510,201Intersegment sales 81,978 75,337 5,414 162,729 (162,729) —Segment operating income 395,184 62,906 233,329 691,419 (72,742) 618,677Depreciation and amortization 41,199 13,864 40,912 95,975 8,846 104,821Identifiable assets 2,055,600 740,179 1,406,531 4,202,310 420,304 4,622,614Capital expenditures 44,714 12,834 43,797 101,345 6,622 107,967
Flow Solutions Group
EPD IPD FCDSubtotal—Reportable
SegmentsEliminations and
All Other(1) Consolidated Total
(Amounts in thousands)
Year Ended December 31, 2010:Sales to external customers $ 2,087,040 $ 754,826 $ 1,190,170 $ 4,032,036 $ — $ 4,032,036Intersegment sales 65,636 45,358 7,349 118,343 (118,343) —Segment operating income 412,622 68,480 180,409 661,511 (80,159) 581,352Depreciation and amortization 39,629 18,089 34,906 92,624 8,670 101,294Identifiable assets 1,791,886 664,573 1,342,915 3,799,374 660,536 4,459,910Capital expenditures 54,478 12,130 31,312 97,920 4,082 102,002
Flow Solutions Group
EPD IPD FCDSubtotal—Reportable
SegmentsEliminations and
All Other(1) Consolidated Total
(Amounts in thousands)
Year Ended December 31, 2009:Sales to external customers $ 2,249,265 $ 919,355 $ 1,196,642 $ 4,365,262 $ — $ 4,365,262Intersegment sales 67,023 51,616 6,576 125,215 (125,215) —Segment operating income 434,840 107,886 204,118 746,844 (117,327) 629,517Depreciation and amortization 42,168 15,903 29,140 87,211 8,234 95,445
Copyright © 2013 www.secdatabase.com. All Rights Reserved.Please Consider the Environment Before Printing This Document
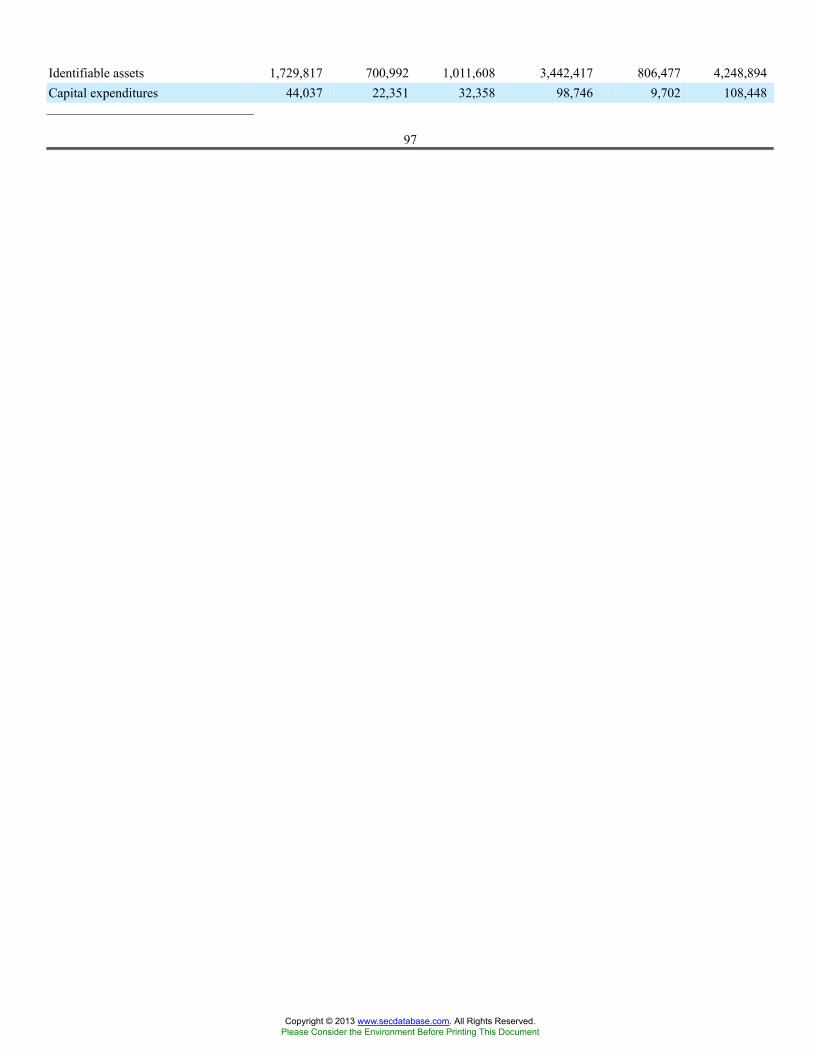
Identifiable assets 1,729,817 700,992 1,011,608 3,442,417 806,477 4,248,894Capital expenditures 44,037 22,351 32,358 98,746 9,702 108,448_______________________________________
97
Copyright © 2013 www.secdatabase.com. All Rights Reserved.Please Consider the Environment Before Printing This Document
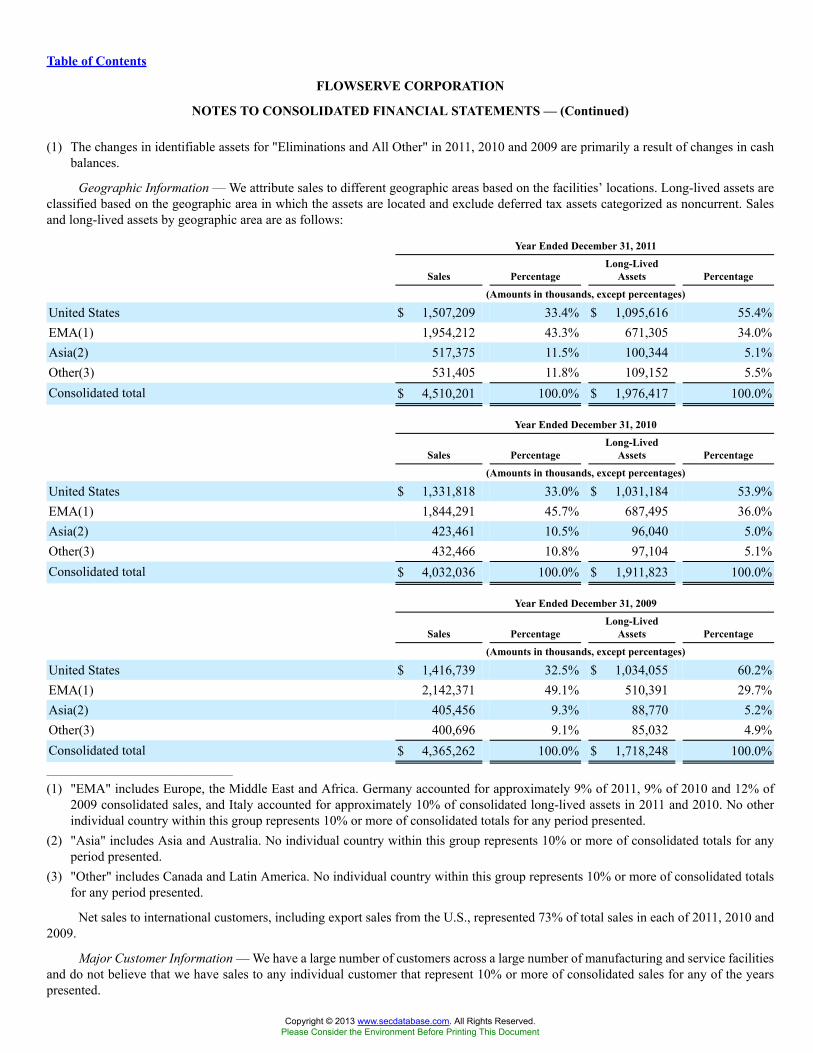
Table of Contents
FLOWSERVE CORPORATION
NOTES TO CONSOLIDATED FINANCIAL STATEMENTS — (Continued)
(1) The changes in identifiable assets for "Eliminations and All Other" in 2011, 2010 and 2009 are primarily a result of changes in cashbalances.
Geographic Information — We attribute sales to different geographic areas based on the facilities’ locations. Long-lived assets areclassified based on the geographic area in which the assets are located and exclude deferred tax assets categorized as noncurrent. Salesand long-lived assets by geographic area are as follows:
Year Ended December 31, 2011
Sales PercentageLong-Lived
Assets Percentage
(Amounts in thousands, except percentages)
United States $ 1,507,209 33.4% $ 1,095,616 55.4%EMA(1) 1,954,212 43.3% 671,305 34.0%Asia(2) 517,375 11.5% 100,344 5.1%Other(3) 531,405 11.8% 109,152 5.5%Consolidated total $ 4,510,201 100.0% $ 1,976,417 100.0%
Year Ended December 31, 2010
Sales PercentageLong-Lived
Assets Percentage
(Amounts in thousands, except percentages)
United States $ 1,331,818 33.0% $ 1,031,184 53.9%EMA(1) 1,844,291 45.7% 687,495 36.0%Asia(2) 423,461 10.5% 96,040 5.0%Other(3) 432,466 10.8% 97,104 5.1%Consolidated total $ 4,032,036 100.0% $ 1,911,823 100.0%
Year Ended December 31, 2009
Sales PercentageLong-Lived
Assets Percentage
(Amounts in thousands, except percentages)
United States $ 1,416,739 32.5% $ 1,034,055 60.2%EMA(1) 2,142,371 49.1% 510,391 29.7%Asia(2) 405,456 9.3% 88,770 5.2%Other(3) 400,696 9.1% 85,032 4.9%Consolidated total $ 4,365,262 100.0% $ 1,718,248 100.0%___________________________________
(1) "EMA" includes Europe, the Middle East and Africa. Germany accounted for approximately 9% of 2011, 9% of 2010 and 12% of2009 consolidated sales, and Italy accounted for approximately 10% of consolidated long-lived assets in 2011 and 2010. No otherindividual country within this group represents 10% or more of consolidated totals for any period presented.
(2) "Asia" includes Asia and Australia. No individual country within this group represents 10% or more of consolidated totals for anyperiod presented.
(3) "Other" includes Canada and Latin America. No individual country within this group represents 10% or more of consolidated totalsfor any period presented.
Net sales to international customers, including export sales from the U.S., represented 73% of total sales in each of 2011, 2010 and2009.
Major Customer Information — We have a large number of customers across a large number of manufacturing and service facilitiesand do not believe that we have sales to any individual customer that represent 10% or more of consolidated sales for any of the yearspresented.
Copyright © 2013 www.secdatabase.com. All Rights Reserved.Please Consider the Environment Before Printing This Document

98
Copyright © 2013 www.secdatabase.com. All Rights Reserved.Please Consider the Environment Before Printing This Document
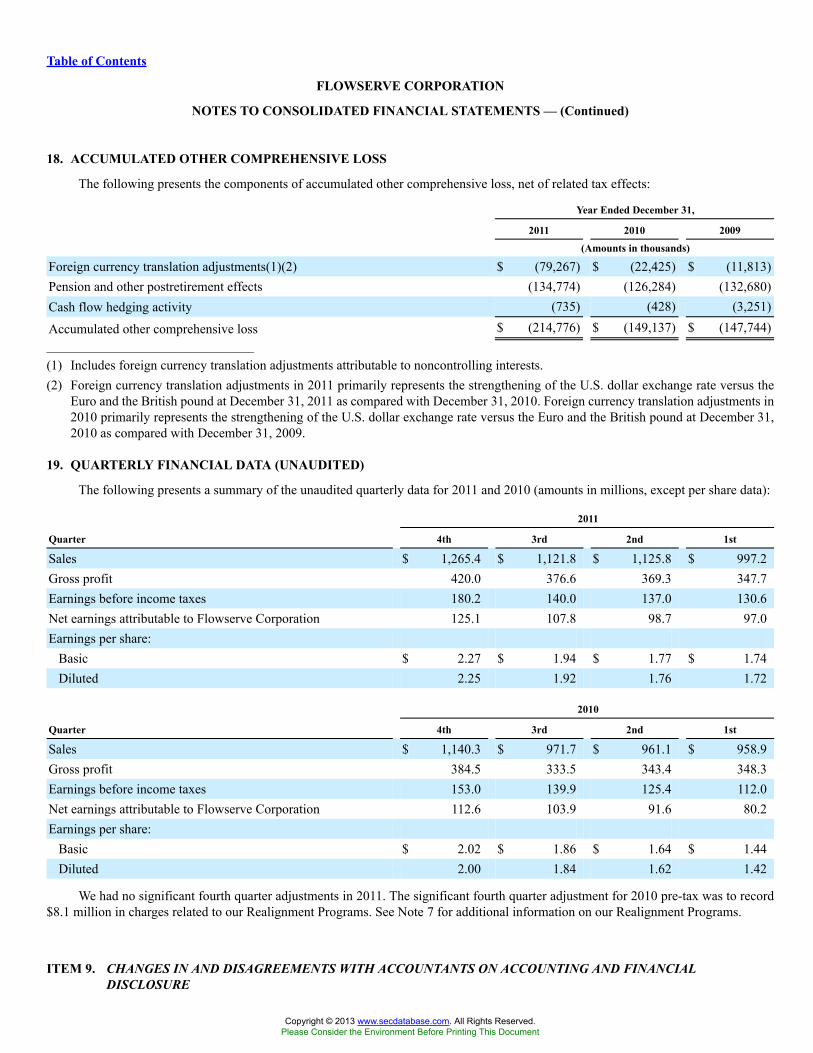
Table of Contents
FLOWSERVE CORPORATION
NOTES TO CONSOLIDATED FINANCIAL STATEMENTS — (Continued)
18. ACCUMULATED OTHER COMPREHENSIVE LOSS
The following presents the components of accumulated other comprehensive loss, net of related tax effects:
Year Ended December 31,
2011 2010 2009
(Amounts in thousands)
Foreign currency translation adjustments(1)(2) $ (79,267) $ (22,425) $ (11,813)Pension and other postretirement effects (134,774) (126,284) (132,680)Cash flow hedging activity (735) (428) (3,251)
Accumulated other comprehensive loss $ (214,776) $ (149,137) $ (147,744)_______________________________________
(1) Includes foreign currency translation adjustments attributable to noncontrolling interests.(2) Foreign currency translation adjustments in 2011 primarily represents the strengthening of the U.S. dollar exchange rate versus the
Euro and the British pound at December 31, 2011 as compared with December 31, 2010. Foreign currency translation adjustments in2010 primarily represents the strengthening of the U.S. dollar exchange rate versus the Euro and the British pound at December 31,2010 as compared with December 31, 2009.
19. QUARTERLY FINANCIAL DATA (UNAUDITED)
The following presents a summary of the unaudited quarterly data for 2011 and 2010 (amounts in millions, except per share data):
2011
Quarter 4th 3rd 2nd 1st
Sales $ 1,265.4 $ 1,121.8 $ 1,125.8 $ 997.2Gross profit 420.0 376.6 369.3 347.7Earnings before income taxes 180.2 140.0 137.0 130.6Net earnings attributable to Flowserve Corporation 125.1 107.8 98.7 97.0Earnings per share:
Basic $ 2.27 $ 1.94 $ 1.77 $ 1.74Diluted 2.25 1.92 1.76 1.72
2010
Quarter 4th 3rd 2nd 1st
Sales $ 1,140.3 $ 971.7 $ 961.1 $ 958.9Gross profit 384.5 333.5 343.4 348.3Earnings before income taxes 153.0 139.9 125.4 112.0Net earnings attributable to Flowserve Corporation 112.6 103.9 91.6 80.2Earnings per share:
Basic $ 2.02 $ 1.86 $ 1.64 $ 1.44Diluted 2.00 1.84 1.62 1.42
We had no significant fourth quarter adjustments in 2011. The significant fourth quarter adjustment for 2010 pre-tax was to record$8.1 million in charges related to our Realignment Programs. See Note 7 for additional information on our Realignment Programs.
ITEM 9. CHANGES IN AND DISAGREEMENTS WITH ACCOUNTANTS ON ACCOUNTING AND FINANCIALDISCLOSURE
Copyright © 2013 www.secdatabase.com. All Rights Reserved.Please Consider the Environment Before Printing This Document

None.
99
Copyright © 2013 www.secdatabase.com. All Rights Reserved.Please Consider the Environment Before Printing This Document
Table of Contents
ITEM 9A. CONTROLS AND PROCEDURES
Disclosure Controls and Procedures
Our disclosure controls and procedures (as defined in Rule 13a-15(e) under the Securities Exchange Act of 1934 (the "ExchangeAct")) are designed to ensure that the information, which we are required to disclose in the reports that we file or submit under theExchange Act, is recorded, processed, summarized and reported within the time periods specified in the United States ("U.S.") Securitiesand Exchange Commission's ("SEC") rules and forms, and that such information is accumulated and communicated to our management,including our Principal Executive Officer and Principal Financial Officer, as appropriate to allow timely decisions regarding requireddisclosure.
In connection with the preparation of this Annual Report on Form 10-K ("Annual Report") for the year ended December 31, 2011,our management, under the supervision and with the participation of our Principal Executive Officer and our Principal Financial Officer,carried out an evaluation of the effectiveness of the design and operation of our disclosure controls and procedures as of December 31,2011. Based on this evaluation, our Principal Executive Officer and Principal Financial Officer concluded that our disclosure controls andprocedures were effective at the reasonable assurance level as of December 31, 2011.
Management’s Report on Internal Control Over Financial Reporting
Our management, under the supervision and with the participation of our Principal Executive Officer and Principal FinancialOfficer, is responsible for establishing and maintaining adequate internal control over financial reporting, as such term is definedin Rules 13a-15(f) and 15d-15(f) under the Exchange Act. Internal control over financial reporting is a process designed to providereasonable assurance regarding the reliability of financial reporting and the preparation of financial statements for external purposesin accordance with accounting principles generally accepted in the U.S. ("GAAP"). Internal control over financial reporting includespolicies and procedures that: (i) pertain to the maintenance of records that, in reasonable detail, accurately and fairly reflect thetransactions and dispositions of our assets; (ii) provide reasonable assurance that transactions are recorded as necessary to permitpreparation of financial statements in accordance with GAAP, and that our receipts and expenditures are being made only in accordancewith authorizations of our management and directors; and (iii) provide reasonable assurance regarding prevention or timely detection ofunauthorized acquisition, use or disposition of our assets that could have a material effect on the financial statements.
Because of its inherent limitations, internal control over financial reporting may not prevent or detect misstatements. Also,projections of any evaluation of effectiveness to future periods are subject to the risk that controls may become inadequate because ofchanges in conditions, or that the degree of compliance with existing policies or procedures may deteriorate.
Under the supervision and with the participation of our Principal Executive Officer and Principal Financial Officer, our managementconducted an assessment of our internal control over financial reporting as of December 31, 2011, based on the criteria established inInternal Control - Integrated Framework, issued by the Committee of Sponsoring Organizations of the Treadway Commission. Based onthis assessment, our management has concluded that as of December 31, 2011, our internal control over financial reporting was effective.
The effectiveness of our internal control over financial reporting as of December 31, 2011, has been audited byPricewaterhouseCoopers LLP, our independent registered public accounting firm, as stated in their report, which is included herein.
Changes in Internal Control Over Financial Reporting
There were no changes in our internal control over financial reporting during the quarter ended December 31, 2011 that havematerially affected, or are reasonably likely to materially affect, our internal control over financial reporting.
ITEM 9B. OTHER INFORMATION
None.
PART III
ITEM 10. DIRECTORS, EXECUTIVE OFFICERS AND CORPORATE GOVERNANCE
Copyright © 2013 www.secdatabase.com. All Rights Reserved.Please Consider the Environment Before Printing This Document

The information required in this Item 10 is incorporated by reference to our definitive Proxy Statement relating to our 2012 annualmeeting of shareholders to be held on May 17, 2012. The Proxy Statement will be filed with the SEC no later than April 30, 2012.
100
Copyright © 2013 www.secdatabase.com. All Rights Reserved.Please Consider the Environment Before Printing This Document
Table of Contents
ITEM 11. EXECUTIVE COMPENSATION
The information required in this Item 11 is incorporated by reference to our definitive Proxy Statement relating to our 2012 annualmeeting of shareholders to be held on May 17, 2012. The Proxy Statement will be filed with the SEC no later than April 30, 2012.
ITEM 12. SECURITY OWNERSHIP OF CERTAIN BENEFICIAL OWNERS AND MANAGEMENT AND RELATEDSTOCKHOLDER MATTERS
The information required in this Item 12 is incorporated by reference to our definitive Proxy Statement relating to our 2012 annualmeeting of shareholders to be held on May 17, 2012. The Proxy Statement will be filed with the SEC no later than April 30, 2012.
ITEM 13. CERTAIN RELATIONSHIPS AND RELATED TRANSACTIONS, AND DIRECTOR INDEPENDENCE
The information required in this Item 13 is incorporated by reference to our definitive Proxy Statement relating to our 2012 annualmeeting of shareholders to be held on May 17, 2012. The Proxy Statement will be filed with the SEC no later than April 30, 2012.
ITEM 14. PRINCIPAL ACCOUNTING FEES AND SERVICES
The information required in this Item 14 is incorporated by reference to our definitive Proxy Statement relating to our 2012 annualmeeting of shareholders to be held on May 17, 2012. The Proxy Statement will be filed with the SEC no later than April 30, 2012.
101
Copyright © 2013 www.secdatabase.com. All Rights Reserved.Please Consider the Environment Before Printing This Document

Table of Contents
PART IV
ITEM 15. EXHIBITS, FINANCIAL STATEMENT SCHEDULES
(a) Documents filed as a part of this Annual Report:
1. Consolidated Financial Statements
The following consolidated financial statements and notes thereto are filed as part of this Annual Report:
Report of Independent Registered Public Accounting Firm
Flowserve Corporation Consolidated Financial Statements:
Consolidated Balance Sheets at December 31, 2011 and 2010
For each of the three years in the period ended December 31, 2011:
Consolidated Statements of Income
Consolidated Statements of Comprehensive Income
Consolidated Statements of Shareholders’ Equity
Consolidated Statements of Cash Flows
Notes to Consolidated Financial Statements
2. Consolidated Financial Statement Schedules
The following consolidated financial statement schedule is filed as part of this Annual Report:
Schedule II — Valuation and Qualifying Accounts F-1
Financial statement schedules not included in this Annual Report have been omitted because they are not applicable or therequired information is shown in the consolidated financial statements or notes thereto.
3. Exhibits
See Index to Exhibits to this Annual Report.
102
Copyright © 2013 www.secdatabase.com. All Rights Reserved.Please Consider the Environment Before Printing This Document
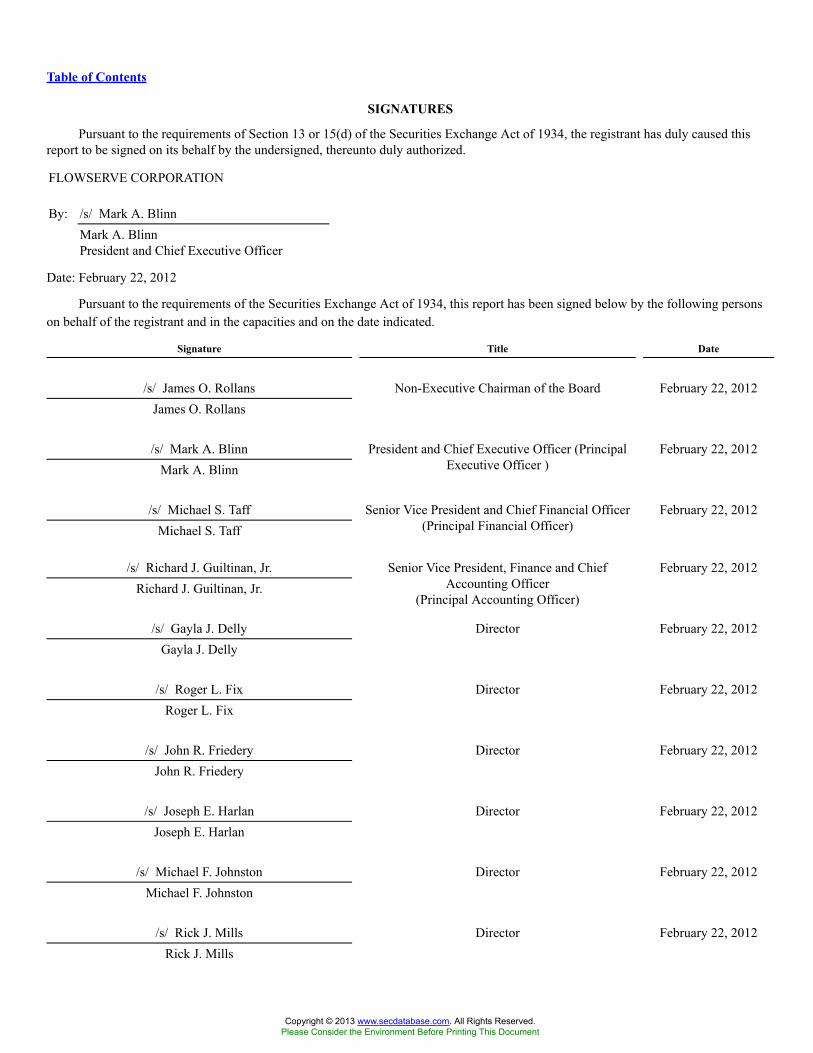
Table of Contents
SIGNATURES
Pursuant to the requirements of Section 13 or 15(d) of the Securities Exchange Act of 1934, the registrant has duly caused thisreport to be signed on its behalf by the undersigned, thereunto duly authorized.
FLOWSERVE CORPORATION
By: /s/ Mark A. BlinnMark A. BlinnPresident and Chief Executive Officer
Date: February 22, 2012
Pursuant to the requirements of the Securities Exchange Act of 1934, this report has been signed below by the following personson behalf of the registrant and in the capacities and on the date indicated.
Signature Title Date
/s/ James O. Rollans Non-Executive Chairman of the Board February 22, 2012James O. Rollans
/s/ Mark A. Blinn February 22, 2012Mark A. Blinn
President and Chief Executive Officer (PrincipalExecutive Officer )
/s/ Michael S. Taff February 22, 2012Michael S. Taff
Senior Vice President and Chief Financial Officer(Principal Financial Officer)
/s/ Richard J. Guiltinan, Jr. February 22, 2012Richard J. Guiltinan, Jr.
Senior Vice President, Finance and ChiefAccounting Officer
(Principal Accounting Officer)
/s/ Gayla J. Delly Director February 22, 2012Gayla J. Delly
/s/ Roger L. Fix Director February 22, 2012Roger L. Fix
/s/ John R. Friedery Director February 22, 2012John R. Friedery
/s/ Joseph E. Harlan Director February 22, 2012Joseph E. Harlan
/s/ Michael F. Johnston Director February 22, 2012Michael F. Johnston
/s/ Rick J. Mills Director February 22, 2012Rick J. Mills
Copyright © 2013 www.secdatabase.com. All Rights Reserved.Please Consider the Environment Before Printing This Document

/s/ Charles M. Rampacek Director February 22, 2012Charles M. Rampacek
/s/ David E. Roberts Director February 22, 2012David E. Roberts
/s/ William C. Rusnack Director February 22, 2012
William C. Rusnack
103
Copyright © 2013 www.secdatabase.com. All Rights Reserved.Please Consider the Environment Before Printing This Document
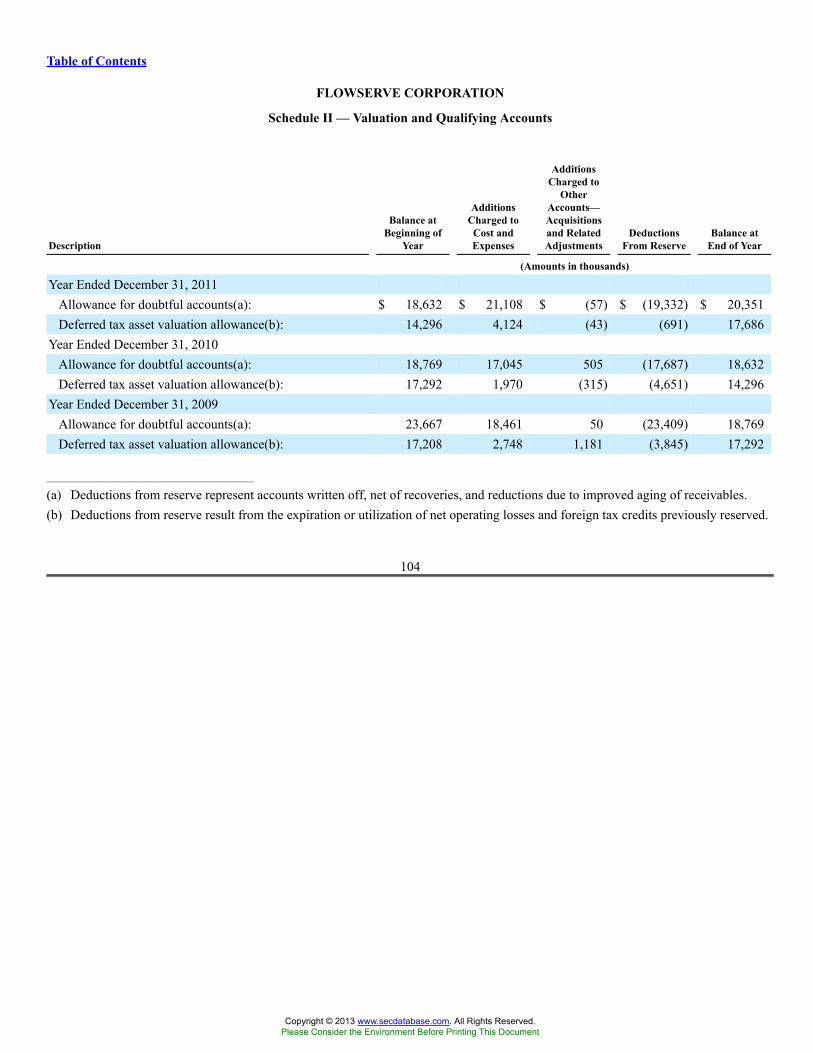
Table of Contents
FLOWSERVE CORPORATION
Schedule II — Valuation and Qualifying Accounts
Description
Balance atBeginning of
Year
AdditionsCharged toCost andExpenses
AdditionsCharged to
OtherAccounts—Acquisitionsand RelatedAdjustments
DeductionsFrom Reserve
Balance atEnd of Year
(Amounts in thousands)
Year Ended December 31, 2011Allowance for doubtful accounts(a): $ 18,632 $ 21,108 $ (57) $ (19,332) $ 20,351Deferred tax asset valuation allowance(b): 14,296 4,124 (43) (691) 17,686
Year Ended December 31, 2010Allowance for doubtful accounts(a): 18,769 17,045 505 (17,687) 18,632Deferred tax asset valuation allowance(b): 17,292 1,970 (315) (4,651) 14,296
Year Ended December 31, 2009Allowance for doubtful accounts(a): 23,667 18,461 50 (23,409) 18,769Deferred tax asset valuation allowance(b): 17,208 2,748 1,181 (3,845) 17,292
_______________________________________
(a) Deductions from reserve represent accounts written off, net of recoveries, and reductions due to improved aging of receivables.(b) Deductions from reserve result from the expiration or utilization of net operating losses and foreign tax credits previously reserved.
104
Copyright © 2013 www.secdatabase.com. All Rights Reserved.Please Consider the Environment Before Printing This Document

Table of Contents
INDEX TO EXHIBITS
ExhibitNo. Description
3.1 Restated Certificate of Incorporation of Flowserve Corporation (incorporated by reference to Exhibit 3.1 to the Registrant'sQuarterly Report on Form 10-Q for the quarter ended September 30, 2011).
3.2 Flowserve Corporation By-Laws, as amended and restated effective November 17, 2011 (incorporated by reference to Exhibit3.1 to the Registrant's Current Report on Form 8-K, dated November 21, 2011).
10.1 Credit Agreement, dated December 14, 2010, among the Company, Bank of America, N.A., as swingline lender, letter ofcredit issuer and administrative agent and the other lenders referred to therein (incorporated by reference to Exhibit 10.1 to theRegistrant's Current Report on Form 8-K, dated December 14, 2010).
10.2 Letter of Credit Agreement, dated as of September 14, 2007 among Flowserve B.V., as an Applicant, Flowserve Corporation,as an Applicant and as Guarantor, the Additional Applicants from time to time as a party thereto, the various Lenders fromtime to time as a party thereto, and ABN AMRO Bank, N.V., as Administrative Agent and an Issuing Bank (incorporated byreference to Exhibit 10.1 to the Registrant's Current Report on Form 8-K, dated September 19, 2007).
10.3 First Amendment to Letter of Credit Agreement, dated as of September 11, 2008 among Flowserve Corporation, FlowserveB.V. and other subsidiaries of the Company party thereto, ABN AMRO Bank, N.V., as Administrative Agent and an IssuingBank, and the other financial institutions party thereto (incorporated by reference to Exhibit 10.1 to the Registrant's CurrentReport on Form 8-K, dated September 16, 2008).
10.4 Second Amendment to Letter of Credit Agreement, dated as of September 9, 2009 among Flowserve Corporation, FlowserveB.V. and other subsidiaries of the Company party thereto, ABN AMRO Bank, N.V., as Administrative Agent and an IssuingBank, and the other financial institutions party thereto (incorporated by reference to Exhibit 10.1 to the Registrant's CurrentReport on Form 8-K dated September 11, 2009).
10.5 Letter of Credit Agreement, dated October 30, 2009, among Flowserve Corporation, Flowserve B.V. and other subsidiaries ofthe Company party thereto, Calyon, as Mandated Lead Arranger, Administrative Agent and an Issuing Bank, and the otherfinancial institutions party thereto (incorporated by reference to Exhibit 10.1 to the Registrant's Current Report on Form 8-Kdated November 5, 2009).
10.6 Amended and Restated Flowserve Corporation Director Cash Deferral Plan, effective January 1, 2009 (incorporated byreference to Exhibit 10.7 to the Registrant's Annual Report on Form 10-K for the year ended December 31, 2008).*
10.7 Amended and Restated Flowserve Corporation Director Stock Deferral Plan, dated effective January 1, 2009 (incorporated byreference to Exhibit 10.8 to the Registrant's Annual Report on Form 10-K for the year ended December 31, 2008).*
10.8 Trust for Non-Qualified Deferred Compensation Benefit Plans, dated February 10, 2011 (incorporated by reference to Exhibit10.8 to the Registrant’s Annual Report on Form 10-K for the year ended December 31, 2010).*
10.9 2007 Flowserve Corporation Long-Term Stock Incentive Plan, as amended and restated effective January 1, 2010(incorporated by reference to Exhibit 10.20 to the Registrant's Annual Report on Form 10-K for the year ended December 31,2009).*
10.10 2007 Flowserve Corporation Annual Incentive Plan, as amended and restated effective January 1, 2010 (incorporated byreference to Exhibit 10.23 to the Registrant's Annual Report on Form 10-K for the year ended December 31, 2009).*
10.11 Flowserve Corporation Deferred Compensation Plan (incorporated by reference to Exhibit 10.23 to the Registrant's AnnualReport on Form 10-K for the year ended December 31, 2000).*
10.12 Amendment No. 1 to the Flowserve Corporation Deferred Compensation Plan, as amended and restated, effective June 1, 2000(incorporated by reference to Exhibit 10.50 to the Registrant's Annual Report on Form 10-K for the year ended December 31,2002).*
10.13 Amendment to the Flowserve Corporation Deferred Compensation Plan, dated December 14, 2005 (incorporated by referenceto Exhibit 10.70 to the Registrant's Annual Report on Form 10-K for the year ended December 31, 2004).*
10.14 Amendment No. 3 to the Flowserve Corporation Deferred Compensation Plan, as amended and restated effective June 1, 2000(incorporated by reference to Exhibit 10.22 to the Registrant's Annual Report on Form 10-K for the year ended December 31,2007).*
105
Copyright © 2013 www.secdatabase.com. All Rights Reserved.Please Consider the Environment Before Printing This Document
Table of Contents
ExhibitNo. Description
10.15 Flowserve Corporation 1999 Stock Option Plan (incorporated by reference to Exhibit A to the Registrant's 1999 ProxyStatement, filed on March 15, 1999).*
10.16 Amendment No. 1 to the Flowserve Corporation 1999 Stock Option Plan (incorporated by reference to Exhibit 10.31 to theRegistrant's Annual Report on Form 10-K for the year ended December 31, 1999).*
10.17 Amendment No. 2 to the Flowserve Corporation 1999 Stock Option Plan (incorporated by reference to Exhibit 10.32 to theRegistrant's Annual Report on Form 10-K for the year ended December 31, 2000).*
10.18 Amendment No. 3 to the Flowserve Corporation 1999 Stock Option Plan (incorporated by reference to Exhibit 10.12 to theRegistrant's Quarterly Report on Form 10-Q for the quarter ended March 31, 2008).*
10.19 Flowserve Corporation Officer Severance Plan, amended and restated effective January 1, 2010 (incorporated by referenceto Exhibit 10.32 to the Registrant's Annual Report on Form 10-K for the year ended December 31, 2009).*
10.20 Flowserve Corporation Executive Officer Change In Control Severance Plan, amended and restated effective November12, 2007 (incorporated by reference to Exhibit 10.38 to the Registrant's Annual Report on Form 10-K for the year endedDecember 31, 2007).*
10.21 First Amendment to the Flowserve Corporation Executive Officer Change In Control Severance Plan, effective January1, 2011 (incorporated by reference to Exhibit 10.21 to the Registrant’s Annual Report on Form 10-K for the year endedDecember 31, 2010).*
10.22 Flowserve Corporation Officer Change In Control Severance Plan, amended and restated effective November 12, 2007(incorporated by reference to Exhibit 10.39 to the Registrant's Annual Report on Form 10-K for the year ended December31, 2007).*
10.23 First Amendment to the Flowserve Corporation Officer Change In Control Severance Plan, effective January 1, 2011(incorporated by reference to Exhibit 10.23 to the Registrant’s Annual Report on Form 10-K for the year ended December31, 2010).*
10.24 Flowserve Corporation Key Management Change In Control Severance Plan, amended and restated effective November12, 2007 (incorporated by reference to Exhibit 10.40 to the Registrant's Annual Report on Form 10-K for the year endedDecember 31, 2007).*
10.25 First Amendment to the Flowserve Corporation Key Management Change In Control Severance Plan, effective January1, 2011 (incorporated by reference to Exhibit 10.25 to the Registrant’s Annual Report on Form 10-K for the year endedDecember 31, 2010).*
10.26 Flowserve Corporation Senior Management Retirement Plan, amended and restated effective January 1, 2008 (incorporatedby reference to Exhibit 10.42 to the Registrant's Annual Report on Form 10-K for the year ended December 31, 2007).*
10.27 Flowserve Corporation Supplemental Executive Retirement Plan, amended and restated effective November 12, 2007(incorporated by reference to Exhibit 10.43 to the Registrant's Annual Report on Form 10-K for the year ended December31, 2007).*
10.28 Letter Agreement, dated August 31, 2009, between Mark A. Blinn and Flowserve Corporation (incorporated by reference toExhibit 10.1 to the Registrant's Current Report on Form 8-K dated August 31, 2009).*
10.29+ Transition Agreement and Release, dated January 25, 2012, among Thomas E. Ferguson, Flowserve Corporation, FlowserveManagement Company and Flowserve US Inc.
10.30 Flowserve Corporation 2004 Stock Compensation Plan, effective April 21, 2004 (incorporated by reference to Appendix Ato the Registrant's 2004 Proxy Statement, dated May 10, 2004).*
10.31 Amendment Number One to the Flowserve Corporation 2004 Stock Compensation Plan, effective March 6, 2008(incorporated by reference to Exhibit 10.10 to the Registrant's Quarterly Report on Form 10-Q for the quarter ended March31, 2008).*
10.32 Amendment Number Two to the Flowserve Corporation 2004 Stock Compensation Plan, effective March 7, 2008(incorporated by reference to Exhibit 10.11 to the Registrant's Quarterly Report on Form 10-Q for the quarter ended March31, 2008).*
10.33 Form of Incentive Stock Option Agreement pursuant to the Flowserve Corporation 2004 Stock Compensation Plan(incorporated by reference to Exhibit 10.60 to the Registrant's Annual Report on Form 10-K for the year ended December31, 2004).*
Copyright © 2013 www.secdatabase.com. All Rights Reserved.Please Consider the Environment Before Printing This Document

106
Copyright © 2013 www.secdatabase.com. All Rights Reserved.Please Consider the Environment Before Printing This Document
Table of Contents
ExhibitNo. Description
10.34 Form of Non-Qualified Stock Option Agreement pursuant to the Flowserve Corporation 2004 Stock Compensation Plan(incorporated by reference to Exhibit 10.61 to the Registrant's Annual Report on Form 10-K for the year ended December31, 2004).*
10.35 Form of Incentive Stock Option Agreement for certain officers pursuant to the Flowserve Corporation 2004 StockCompensation Plan (incorporated by reference to Exhibit 10.4 to the Registrant's Current Report on Form 8-K, dated March9, 2006).*
10.36 Form A of Performance Restricted Stock Unit Agreement pursuant to Flowserve Corporation's 2004 Stock CompensationPlan (incorporated by reference to Exhibit 10.3 to the Registrant's Quarterly Report on Form 10-Q for the quarter endedMarch 31, 2008).*
10.37 Form B of Performance Restricted Stock Unit Agreement pursuant to Flowserve Corporation's 2004 Stock CompensationPlan (incorporated by reference to Exhibit 10.4 to the Registrant's Quarterly Report on Form 10-Q for the quarter endedMarch 31, 2008).*
10.38 Amendment Number One to the Form A and Form B Performance Restricted Stock Unit Agreements pursuant to FlowserveCorporation's 2004 Stock Compensation Plan, dated March 27, 2008 (incorporated by reference to Exhibit 10.5 to theRegistrant's Quarterly Report on Form 10-Q for the quarter ended March 31, 2008).*
10.39 Form A of Restricted Stock Unit Agreement pursuant to Flowserve Corporation's 2004 Stock Compensation Plan(incorporated by reference to Exhibit 10.6 to the Registrant's Quarterly Report on Form 10-Q for the quarter ended March31, 2008).*
10.40 Form B of Restricted Stock Unit Agreement pursuant to Flowserve Corporation's 2004 Stock Compensation Plan(incorporated by reference to Exhibit 10.7 to the Registrant's Quarterly Report on Form 10-Q for the quarter ended March31, 2008).*
10.41 Form A of Restricted Stock Agreement pursuant to Flowserve Corporation's 2004 Stock Compensation Plan (incorporatedby reference to Exhibit 10.8 to the Registrant's Quarterly Report on Form 10-Q for the quarter ended March 31, 2008).*
10.42 Form B of Restricted Stock Agreement pursuant to Flowserve Corporation's 2004 Stock Compensation Plan (incorporatedby reference to Exhibit 10.9 to the Registrant's Quarterly Report on Form 10-Q for the quarter ended March 31, 2008).*
10.43 Flowserve Corporation Equity and Incentive Compensation Plan (incorporated by reference to Appendix A to theRegistrant's Proxy Statement on Schedule 14A dated April 3, 2009).*
10.44 Form A of Restricted Stock Agreement pursuant to the Flowserve Corporation Equity and Incentive Compensation Plan(incorporated by reference to Exhibit 10.66 to the Registrant's Annual Report on Form 10-K for the year ended December31, 2009).*
10.45 Form B of Restricted Stock Agreement pursuant to the Flowserve Corporation Equity and Incentive Compensation Plan(incorporated by reference to Exhibit 10.67 to the Registrant's Annual Report on Form 10-K for the year ended December31, 2009).*
10.46 Form A of Restricted Stock Unit Agreement pursuant to the Flowserve Corporation Equity and Incentive CompensationPlan (incorporated by reference to Exhibit 10.68 to the Registrant's Annual Report on Form 10-K for the year endedDecember 31, 2009).*
10.47 Form B of Restricted Stock Unit Agreement pursuant to the Flowserve Corporation Equity and Incentive CompensationPlan (incorporated by reference to Exhibit 10.69 to the Registrant's Annual Report on Form 10-K for the year endedDecember 31, 2009).*
10.48 Form A of Performance Restricted Stock Unit Agreement pursuant to the Flowserve Corporation Equity and IncentiveCompensation Plan (incorporated by reference to Exhibit 10.70 to the Registrant's Annual Report on Form 10-K for theyear ended December 31, 2009).*
10.49 Form B of Performance Restricted Stock Unit Agreement pursuant to the Flowserve Corporation Equity and IncentiveCompensation Plan (incorporated by reference to Exhibit 10.71 to the Registrant's Annual Report on Form 10-K for theyear ended December 31, 2009).*
10.50 Form of Restrictive Covenants Agreement for Officers (incorporated by reference to Exhibit 10.1 to the Registrant's CurrentReport on Form 8-K, dated as of March 9, 2006).*
Copyright © 2013 www.secdatabase.com. All Rights Reserved.Please Consider the Environment Before Printing This Document
14.1 Flowserve Financial Management Code of Ethics adopted by the Flowserve Corporation principal executive officer andCEO, principal financial officer and CFO, principal accounting officer and controller, and other senior financial managers(incorporated by reference to Exhibit 14.1 to the Registrant's Annual Report on Form 10-K for the year ended December31, 2002).
107
Copyright © 2013 www.secdatabase.com. All Rights Reserved.Please Consider the Environment Before Printing This Document
Table of Contents
ExhibitNo. Description
21.1+ Subsidiaries of the Registrant.23.1+ Consent of PricewaterhouseCoopers LLP.31.1+ Certification of Principal Executive Officer pursuant to Exchange Act Rules 13a-14(a) and 15d-14(a), as adopted pursuant
to Section 302 of the Sarbanes-Oxley Act of 2002.31.2+ Certification of Principal Financial Officer pursuant to Exchange Act Rules 13a-14(a) and 15d-14(a), as adopted pursuant
to Section 302 of the Sarbanes-Oxley Act of 2002.32.1++ Certification of Principal Executive Officer pursuant to 18 U.S.C. Section 1350, as adopted pursuant to Section 906 of the
Sarbanes-Oxley Act of 2002.32.2++ Certification of Principal Financial Officer pursuant to 18 U.S.C. Section 1350, as adopted pursuant to Section 906 of the
Sarbanes-Oxley Act of 2002.101.INS XBRL Instance Document101.SCH XBRL Taxonomy Extension Schema Document101.CAL XBRL Taxonomy Extension Calculation Linkbase Document101.LAB XBRL Taxonomy Extension Label Linkbase Document101.PRE XBRL Taxonomy Extension Presentation Linkbase Document101.DEF XBRL Taxonomy Extension Definition Linkbase Document
_______________________________________
* Management contracts and compensatory plans and arrangements required to be filed as exhibits to this Annual Report onForm 10-K.
+ Filed herewith.++ Furnished herewith.
108
Copyright © 2013 www.secdatabase.com. All Rights Reserved.Please Consider the Environment Before Printing This Document
EXHIBIT 10.29
TRANSITION AGREEMENT AND RELEASE
This Transition Agreement and Release (“Agreement”) is entered into by Flowserve Corporation, FlowserveManagement Company and Flowserve US Inc. (collectively referred to as “Flowserve”) and TOM FERGUSON(“Executive”) (collectively, the “Parties”). The Parties desire to enter into this Agreement and a SeparationAgreement and Release that amicably resolve the employment relationship between them and any disputesthat now or may exist between them concerning Executive's hiring, employment and termination from Flowserveincluding disputes regarding Executive's compensation or benefits. Accordingly, in exchange for good andvaluable consideration, the receipt of which is hereby acknowledged, the Parties agree:
1. End of Employment. Executive's last day of employment with Flowserve shall be December 31, 2012(“Separation Date”).
a. Earned Salary and Accrued Vacation. Executive shall receive payment for all earned but unpaidsalary and any accrued but unused vacation through the Separation Date. Except as stated in thisAgreement or as required by law, all other benefits which relate to Executive's employment withFlowserve shall cease as of the Separation Date.
b. OSP. Executive's separation from service with Flowserve is not governed by the FlowserveCorporation Amended and Restated Officer Severance Plan (the “Severance Plan”) because hisseparation from service is due to his “retirement” within the meaning of the Severance Plan, andExecutive acknowledges that he is not and shall not be entitled to any benefits under the SeverancePlan.
c. §409A. Executive's separation of employment from Flowserve constitutes a separation from servicewithin the meaning of §409A of the Internal Revenue Code, as amended (“IRC”) and regulationsissued thereunder.
2. Transition Period. Executive shall provide Flowserve a letter, in a form acceptable to Flowserve,resigning Executive's Senior Vice President and President positions and shall execute any and all otherdocuments required by Flowserve to effectuate such resignation. Upon Executive's resignation from theSenior Vice President and President positions, Executive shall serve as a special advisor to Mark Blinn(“Special Advisor”) until the Separation Date.
a. Salary. Executive shall receive the same base salary, less required withholdings, for the performanceof the Special Advisor job duties as he was receiving at the time he tendered his resignation fromthe Senior Vice President and President positions. Executive's salary shall be paid in accordance withFlowserve's regular payroll procedures.
b. Special Advisor Duties. From the date that Executive signs this Agreement until the SeparationDate (“Transition Period”), Executive shall perform the Special Advisor job duties, as assigned byFlowserve, in a diligent, trustworthy, and business‑like manner. Mark Blinn will provide Executiveadditional details regarding Executive's duties during the Transition Period.
c. Policies. During the Transition Period, Executive must act in the best interests of Flowserve at alltimes, which, includes, but is not limited to: (i) promptly handling all responsibilities Flowserve assignsto Executive from time to time; (ii) not contacting any Flowserve customers,
Copyright © 2013 www.secdatabase.com. All Rights Reserved.Please Consider the Environment Before Printing This Document

1
Copyright © 2013 www.secdatabase.com. All Rights Reserved.Please Consider the Environment Before Printing This Document
suppliers, agents, agents or joint venture partners without first receiving written permission from MarkBlinn allowing such contact; (iii) not using or disclosing Flowserve's confidential business informationand/or trade secrets without first having written permission from Mark Blinn to engage in such conduct;and (iv) not interfering in any way with Flowserve's business, operations, customers or employees orany opportunity available to Flowserve. During the Transition Period, Executive must also comply withFlowserve's policies and procedures as they as may be amended from time to time by Flowserve,including, without limitation, Flowserve's Code of Business Conduct, Insider Trading Policy andInvestor Relations Disclosure Policy.
3. Severance Benefits. In consideration for entering into this Agreement (including the Release in Sections10 and 11), Executive's compliance with the promises and obligations made in this Agreement, andExecutive's promises and obligations related to the Restrictive Covenants Agreement, Flowserve shallprovide Executive the following compensation and benefits (collectively, “Severance Benefits”). SeveranceBenefits are not considered compensation or wages under any retirement or bonus plan. However, allcompensation Flowserve pays to Executive under this Agreement or the Separation Agreement andRelease are subject to normal payroll withholdings and taxes. Severance Benefits hereunder shall beforfeited, and Executive shall have no right thereto, if Executive revokes this Agreement.
a. AIP Bonus for 2012. Executive shall remain eligible for a bonus under the Flowserve Corporation'sAnnual Incentive Plan (“AIP”) for the 2012 performance year. Whether a bonus is issued, and, ifso, how much is issued will be dependent on Flowserve's financial performance and the decision ofthe Organization and Compensation Committee of Flowserve's Board of Directors. The terms andconditions of the AIP control all aspects of whether Executive is eligible to receive a payment or awardunder the AIP, and the amount and timing of such payment, if any. This Agreement does not alter anyof the terms or conditions of the AIP, and this Agreement does not guarantee Executive will receivean AIP bonus for the 2012 performance year. If earned, this AIP bonus, less required withholdings,will be paid in 2013 in accordance with the AIP terms and conditions and Flowserve's normal payrollpractices.
b. Performance Shares & Restricted Stock: All restricted stock awards under Flowserve's LongTerm Incentive Plan (“LTIP”) granted to Executive that are scheduled to vest in 2012 will vest inaccordance with the applicable stock award agreement. Executive forfeits all other restricted stockawards under Flowserve's LTIP and the Flowserve Equity and Incentive Compensation Plan that havenot vested prior to the Separation Date, including, without limitation, the 10,000 restricted sharesgranted to Executive on February 18, 2010 (“10,000 Restricted Shares”). Contemporaneously withExecutive's signing of this Agreement, Executive shall sign the revised Restricted Stock Agreementfor the 10,000 Restricted Shares and shall release all claims to that stock. Executive is entitled toremain eligible to vest in the 4,820 unvested performance shares granted to Executive on February18, 2010. This includes any corresponding shares purchased through automatic reinvestment ofthe dividends derived from those performance shares. Whether the performance shares (includingthe corresponding shares purchased through automatic dividend reinvestment) vest, and, if so, howmany of the performance shares vest, is contingent upon Flowserve's financial performance and thedetermination of the Organization and Compensation Committee of Flowserve's Board of Directors,as the administrator of the LTIP, and shall be governed and subject to the terms of the LTIP. All otherperformance shares granted to Executive that have not vested as of the Separation Date will expire.Nothing in this Agreement automatically entitles Executive to any stock, restricted stock, performanceshares, dividends or payment in lieu of stock.
2
Copyright © 2013 www.secdatabase.com. All Rights Reserved.Please Consider the Environment Before Printing This Document
c. Stock Options. For informational purposes only, Executive is reminded that he must exercise anyvested stock options within 90 days of the Separation Date or such options shall be forever forfeited.
d. Eligibility for Severance Benefits. To receive the severance benefits described in Section 2 of thisAgreement: (i) Executive must sign this Agreement and return the signed copy to Flowserve; (ii)Executive and his immediate family, as discussed in Section 15 of this Agreement, must comply withall provisions of this Agreement and all provisions of the Separation Agreement and Release; (iii)Executive must sign the Separation Agreement and Release and return the signed copy to Flowserve;(v) Executive must not revoke all or any portion of this Agreement or the Separation Agreement andRelease; and (vi) Executive must comply with the Restrictive Covenants Agreement (defined below).
e. COBRA. After the Separation Date, Executive may continue applicable medical and/or dental benefitcoverage pursuant to the Consolidated Omnibus Budget Reconciliation Act of 1985, as amended(“COBRA”) or elect to obtain retiree medical benefits as provided in, and subject to the terms andconditions of, Flowserve's applicable medical coverage plan. Flowserve or its delegate will provideExecutive information regarding the election of COBRA at Executive's home address. Executive issolely responsible for the entire COBRA premium.
4. Separation Agreement and Release. Flowserve shall pay Executive Separation Pay described in theSeparation Agreement and Release, attached as Exhibit “B”, pursuant to the terms and conditions inthe Separation Agreement and Release; provided that Executive signs the Separation Agreement andRelease after his Separation Date but before January 7, 2013. THE SEPARATION AGREEMENT ANDRELEASE MAY NOT BE SIGNED BEFORE THE SEPARATION DATE. Executive may sign and returnthe Separation Agreement and Release at any time between January 1, 2013 and January 7, 2013.If Executive has not signed and returned the Separation Agreement and Release by the close of normalbusiness on January 7, 2013, or if Executive revokes the Separation Agreement and Release, the offers,terms and conditions described in the Separation Agreement and Release shall be withdrawn and void.
5. Executive's Participation in Company Benefit Plans. After the Separation Date, except as specified inthis Agreement, Executive shall not be entitled to any additional payments or benefits under any benefitplan or bonus or incentive program established by Flowserve. Any vested benefit held by Executive inthe Flowserve Corporation Retirement Savings Plan and/or the Flowserve Corporation Pension Plan, andany other plans in which Executive participates (collectively, the “Retirement Plans”), shall be distributedin accordance with the participant's direction and the terms of the appropriate plan and applicable law.Flowserve will separately provide Executive at Executive's home address, information necessary and asrequired by law to facilitate the distribution or rollover of Executive's vested benefits, if any, from theRetirement Plans.
6. Restrictive Covenants Agreement. Executive and Flowserve entered into a Restrictive CovenantsAgreement dated March 12, 2009, a copy of which is attached as Exhibit “A,” and which is incorporatedinto this Agreement for all purposes (“Restrictive Covenants Agreement”). Flowserve and Executiveagree that the Restrictive Covenants Agreement is in full force and effect. Executive understands thathe must comply with all provisions in the Restrictive Covenants Agreement and that Flowserve shallenforce the restrictive covenants contained in the Restrictive Covenants Agreement. Executive agreesand understands that Flowserve provided Executive Confidential Information (as defined in the RestrictiveCovenants Agreement). The Parties understand and agree that the Non-Competition Period applies toall of the restrictive covenants in the Restrictive Covenants Agreement, including non-competition, non-solicitation of customers
3
Copyright © 2013 www.secdatabase.com. All Rights Reserved.Please Consider the Environment Before Printing This Document

and non-recruitment of employees.
7. Cooperation. Executive agrees to cooperate fully with Flowserve regarding the transition of Executive'sjob duties as requested by Flowserve. Executive also agrees that after the Separation Date Executiveshall be available to answer any questions regarding Executive's job and job duties. This includes but isnot limited to testifying (and preparing to testify) as a witness in any proceeding or otherwise providinginformation or reasonable assistance to Flowserve in connection with any investigation, claim or suit, andcooperating with Flowserve regarding any litigation, claims or other disputed items involving Flowservethat relate to matters within the knowledge or responsibility of Executive during Executive's employment.Specifically, Executive agrees (i) to meet with Flowserve's representatives, its counsel or other designeesat reasonable times and places with respect to any items within the scope of this provision; (ii) toprovide truthful testimony regarding same to any court, agency or other adjudicatory body; (iii) to provideFlowserve with immediate notice of contact or subpoena by any non-governmental adverse party (knownto Executive to be adverse to Flowserve or its interests); and (iv) to not voluntarily assist any such non-governmental adverse party or such non-governmental adverse party's representatives.
8. Executive's Breach of Agreement. In the event Executive breaches any portion of this Agreement or theRestrictive Covenants Agreement, then:
a. Flowserve may, at its sole discretion, terminate this Agreement. If Flowserve terminates thisAgreement pursuant to this Section, the following provisions survive and continue in full effect, unlessspecifically identified by Flowserve in writing as being terminated: Sections 6, 7, 8, 9, 10, 11, 12, 13,14, 15, 16, 17, 18, 19, 23, 24, 26 and 27;
b. Flowserve shall cease paying or providing Executive, and Executive shall not be entitled to receiveany further, Severance Benefits; and
c. Flowserve may recover, at its sole discretion, all of the Severance Benefits already paid or providedto Executive (except for the sum of $1,000) as well as any attorney's fees Flowserve incurs in suchrecovery and all other relief to which Flowserve is entitled.
9. Return of Flowserve Property. Executive may retain his current work computer, Blackberry and cellphone number through the Transition Period and after the Separation Date. Executive will return all otherFlowserve equipment and property after the Separation Date, unless requested earlier by Flowserve.Flowserve's equipment and property includes, but is not limited to, computer software, computer accesscodes, computers (other the Executive's current work computer), personal data assistants, electronicequipment, Blackberries (other than Executive's current Blackberry), iPad, cell phones, company creditcards, keys, access cards, and all original and copies of notes, documents, files or programs storedelectronically or otherwise, that relate or refer to Flowserve, its customers, its financial statements, itsbusiness contacts, or sales.
10. Release. Executive knowingly and voluntarily releases and forever discharges, to the full extent permittedby law, Flowserve and any of its parents, predecessors, successors, assigns, subsidiaries, affiliates orrelated companies and organizations, and former or current officers, directors, shareholders, employees,attorneys, and agents, (collectively referred to throughout the remainder of this Agreement as“Flowserve”), from any and all claims, controversies, allegations, matters, disputes, causes of action,losses, obligations, liabilities, damages, judgments, costs, expenses (including attorney's fees) of any kindwhatsoever, known or unknown, asserted and unasserted, Executive has or may have against Flowserveas of the date of execution of this Agreement, including but not limited to those arising out of, or basedupon:
a. Executive's hiring, employment or termination of employment with Flowserve, or arising out
Copyright © 2013 www.secdatabase.com. All Rights Reserved.Please Consider the Environment Before Printing This Document

4
Copyright © 2013 www.secdatabase.com. All Rights Reserved.Please Consider the Environment Before Printing This Document
of any act committed or omitted during or after the existence of such employment relationship,including, but not limited to, any disputes regarding compensation, benefits or bonuses Executive mayor may not have received during employment with Flowserve, specifically including but not limited toany AIP or AIP Equivalent award or amount;
b. Any federal, state or local law, rule or ordinance relating to any aspect of Executive's employmentrelationship with Flowserve, including, but not limited to, discrimination, wages, hours worked,benefits, leave from employment due to illness or injury for Executive or Executive's family, claimsfor wrongful discharge, retaliation, fraud, breach of express or implied contract or implied covenant ofgood faith and fair dealing, and all other laws and regulations of any kind, including, but not limited to:Title VII of the Civil Rights Act of 1964; the Civil Rights Act of 1991; §§ 1981 through 1988 of Title 42 ofthe United States Code; the Fair Labor Standards Act; the Lilly Ledbetter Fair Pay Act; the EmployeeRetirement Income Security Act of 1974; the Immigration Reform and Control Act; the Americans withDisabilities Act of 1990; the Age Discrimination in Employment Act of 1967; the Older Worker BenefitProtection Act; the Workers Adjustment and Retraining Notification Act; the Occupational Safety andHealth Act; the Sarbanes-Oxley Act of 2002, the Genetic Information and Nondiscrimination Act;the Employment Non-Discrimination Act; the National Labor Relations Act; the Labor ManagementRelations Act; the Texas Payday Law; the Texas Labor Code; the Texas Commission on Human RightsAct or Chapter 21;or as any of these laws are amended. Furthermore, Executive agrees and herebyrelinquishes any right to re-employment with Flowserve;
c. Any other federal, state or local civil or human rights law or any other local, state or federal law,regulation or ordinance of any kind;
d. Any public policy, contract, tort, constitutional or common law claim, or claim for damages due toemotional distress or mental anguish; or
e. Any claim for costs, fees, or other expenses including attorneys' fees incurred in connection with thesubject matter of this Agreement; however,
f. Notwithstanding any other provision in this Agreement, Executive does not waive or release:Executive's right to enforce the terms of this Agreement; Executive's right to file a Charge ofDiscrimination with the EEOC or similar state agency; or claims that may arise after the expiration ofthe Revocation Period in Section 23;
11. Release of Age Claims. By signing this Agreement, Executive is expressly waiving and fully releasingany claim that relates to age discrimination, the Age Discrimination in Employment Act, and the OlderWorkers' Benefits Protection Act, for any claim that may have arisen prior to the date of signature of thisAgreement. Accordingly,
a. Executive acknowledges and agrees that Executive has read and understands the terms of thisAgreement;
b. Executive is encouraged to consult with an attorney before executing this Agreement, Executive hasobtained and considered such legal counsel as Executive deems necessary, and Executive enters intothis Agreement freely, knowingly, and voluntarily; and
c. Executive acknowledges that Executive has been given at least twenty one (21) days in which toconsider whether or not to enter into this Agreement.
Notwithstanding any other provision in this Agreement, this Agreement does not waive or release anyrights or claims that Executive may have under the Age Discrimination in Employment Act or OlderWorkers' Benefits Protection Act that arise after the execution of this Agreement.
Copyright © 2013 www.secdatabase.com. All Rights Reserved.Please Consider the Environment Before Printing This Document

5
Copyright © 2013 www.secdatabase.com. All Rights Reserved.Please Consider the Environment Before Printing This Document
12. Later Discovered Facts. Executive may later discover facts different from or in addition to thoseExecutive now knows or believes to be true regarding the matters released or described in this Agreement,and even so Executive agrees that the releases and agreements contained in this Agreement remaineffective in all respects notwithstanding any later discovery of any different or additional facts. Executiveassumes any and all risk of any mistake in connection with the true facts involved in the matters, disputes,or controversies released or described in this Agreement or with regard to any facts now unknown toExecutive relating thereto.
13. Executive Affirmations. Executive affirms that:
a. Executive has been paid and/or has received all leave (paid or unpaid), compensation, wages,bonuses, AIP awards, meal and/or rest breaks, commissions, and/or benefits to which Executivemay be entitled and that no other leave (paid or unpaid), compensation, wages, bonuses, breaks,commissions and/or benefits are due to Executive, except as specifically provided in this Agreement;
b. Executive has been provided and/or has not been denied any leave requested under the Family andMedical Leave Act, or any other family or medical leave;
c. Executive is not aware of any claim against or involving Flowserve, and is not aware of any violationof any law by Flowserve, including any securities laws.
d. At all times during Executive's employment with Flowserve, such employment is and was “at-will,”unless Executive's employment is specifically described as something other than “at-will” as evidencedby a written document signed by a Flowserve representative with authority, such as a contract foremployment.
14. Maintaining Confidential Information. Executive agrees that Executive will not disclose in any waybusiness information maintained in confidence by Flowserve, such as, but not limited to, financialinformation, business plans, strategic plans and marketing strategies or any trade secrets of Flowserve,except as required by law or judicial process, or otherwise knowingly make any use thereof. This includes,without limitation, business information, such as contracts, customers, suppliers, partners, joint venturers,and the like. Executive also may not disclose or release any information which is, or is alleged or could bealleged by any governmental agency to be, a violation of Regulation FD of the Securities and ExchangeCommission.
15. Non-Disparagement. Executive agrees that neither Executive nor Executive's immediate family shall,directly or indirectly, make, disclose, communicate or publish any negative, defamatory, libelous, criticalor disparaging statements, whether verbal or in writing, concerning Flowserve, or any of its existing orformer executives, officers, directors, subsidiaries, employees, affiliates, customers or clients, products,operations, technology, proprietary or technical information, strategies or business whatsoever or causeothers to disclose, communicate, or publish any disparaging information concerning any of the sameexcept as required by court order or provided by law (provided Executive has provided Flowserve withadvance notice). Flowserve agrees that Flowserve's current officers will not make any defamatory, libelousor disparaging statements, whether verbal or in writing, concerning Executive or Executive's work, exceptas required by court order or provided by law (provided Flowserve has provided Executive with advancenotice).
16. Insider Trading. Executive shall comply at all times with Flowserve's Media and Investor RelationsDisclosure Policy and Insider Trading Policy, as may be amended from time to time by Flowserve,including without limitation, the provisions of such policies relating to compliance with Regulation FD andthe treatment of material non-public information by Flowserve insiders
Copyright © 2013 www.secdatabase.com. All Rights Reserved.Please Consider the Environment Before Printing This Document

6
Copyright © 2013 www.secdatabase.com. All Rights Reserved.Please Consider the Environment Before Printing This Document
under the U.S. federal security laws.
17. No Admission of Wrongdoing. This Agreement is not in any way an admission by either Party of anyacts of wrongdoing, violation of any statute, law or legal or contractual right.
18. Voluntary Execution of the Agreement. Executive and Flowserve represent and agree that they havehad an opportunity to review all aspects of this Agreement, and that they fully understand all the provisionsof the Agreement and are voluntarily entering into the Agreement. Executive further represents thatExecutive has not transferred or assigned to any person or entity any claim involving Flowserve or anyportion thereof or interest therein.
19. Confidentiality. Executive agrees to keep confidential the existence of and the specific terms of thisAgreement and will not disclose same to any person except Executive's financial, tax and legal advisors.Before sharing the Agreement or its terms with Executive's financial, tax and legal advisors, Executiveagrees to provide them notice of this confidentiality requirement. If Executive or Flowserve is requiredto disclose the Agreement to others by legal process, Executive will, to the extent practical under thecircumstance, first give notice to Flowserve in order that Flowserve may have an opportunity to seek aprotective order. Executive will cooperate with Flowserve should it decide to seek a protective order.
20. Binding Effect. This Agreement is binding upon Flowserve and upon Executive and Executive's heirs,administrators, representatives, executors, successors and assigns.
21. Enforceability. Should any provision of this Agreement be declared or determined to be illegal or invalidby any government agency or court of competent jurisdiction, the validity of the remaining parts, terms orprovisions of this Agreement will not be affected and such provisions remain in full force and effect.
22. Entire Agreement. This Agreement, including attachment A, sets forth the entire agreement between theParties, and fully supersedes any and all prior agreements, understandings, or representations betweenthe Parties pertaining to Executive's employment with Flowserve, the subject matter of this Agreementor any other term or condition of the relationship between Flowserve and Executive. No oral statementsor other prior written material not specifically incorporated into this Agreement shall be of any force andeffect, and no changes in or additions to this Agreement shall be recognized, unless incorporated intothis Agreement by written amendment, such amendment to become effective on the date stipulated init. Any amendment to this Agreement must be signed by all parties to this Agreement. This Agreementfully supersedes any and all prior oral or written agreements, understandings, promises, representationsor inducements between the Flowserve and Executive pertaining to the subject matter of this Agreement.Further, Executive represents and acknowledges that in executing this Agreement, Employee is notrelying on, and has not relied on, any prior oral or written agreements, understandings, promises,inducements, or representations by Flowserve, except as expressly contained in this Agreement, andExecutive expressly disclaims any reliance on any prior oral or written agreements, understandings,promises, inducements, or representations in entering into this Agreement.
23. Time to Consider and Right to Review by Counsel. Executive received this Agreement on January10, 2012. The deadline for Executive's signature and return of this Agreement is January 31, 2012.Accordingly, Executive may sign and return the Agreement at any time between January 10, 2012and January 31, 2012. If Executive has not signed and returned the Agreement by the close of normalbusiness on January 31, 2012, the offers, terms and conditions described in this Agreement are withdrawnand void. Executive acknowledges he has had at least twenty one (21) days to consider this Agreementprior to signing. Executive's
7
Copyright © 2013 www.secdatabase.com. All Rights Reserved.Please Consider the Environment Before Printing This Document
employment ends on the Separation Date regardless of whether Executive has signed this Agreement.Executive affirms Executive has been given a sufficient period of time to review and consider thisAgreement, and encouraged to consult with an attorney of Executive's choosing, before signing thisAgreement. Executive understands that whether or not to consult with an attorney is Executive's decision.
24. Executive's Right to Revoke the Agreement. Executive may revoke this Agreement at any time upto seven (7) days after signing (“Revocation Period”). This Agreement does not become effective orenforceable until the Revocation Period has expired. If the last day of the Revocation Period is a Saturday,Sunday, or legal holiday, then the Revocation Period does not expire until the next following day which isnot a Saturday, Sunday, or legal holiday. If Executive fails to timely revoke this Agreement, this Agreementbecomes effective upon the expiration of the Revocation Period.
25. Notices. All notices and other communications will be in writing.
If to Executive: If to Flowserve:
Tom Ferguson6909 Peters PathColleyville, TX 76034
Ron ShuffGeneral CounselFlowserve Corporation5215 North O'Connor Blvd., Suite 2300Irving, Texas 75039
A Party may send any notice or other communication to the other at the address above by any normalmeans (e.g., personal delivery, courier, messenger service, fax, ordinary mail or electronic mail), butthe notice or communication is not deemed to be delivered until it is actually received by the intendedrecipient. A notice or other communication is deemed to be delivered three days after it is sent byregistered or certified mail, return receipt requested, postage prepaid, and addressed to the intendedrecipient to the address listed above. A party can change the address to which notices and othercommunications are to be delivered by giving the other party notice.
26. Governing Law. This Agreement shall be governed by the laws of the State of Texas without reference toits choice of law rules.
27. Counterparts. This Agreement may be executed in counterparts, each of which when executed anddelivered (which deliveries may be by facsimile) shall be deemed an original and all of which togethershall constitute one and the same instrument.
28. Section 409A. Flowserve intends that all of the severance benefits provided to Executive as describedin this Agreement will either comply with or be exempt from the requirements of §409A of the IRC.However, nothing contained in this Agreement shall be construed as a representation, guarantee or otherundertaking on the part of Flowserve that the severance benefits are, or will be found to be, exempt fromor compliant with the requirements of §409A of the IRC. Executive is solely responsible for determiningthe tax consequences to Executive of any and all payments made pursuant to this Agreement, including,without limitation, any possible tax consequences under §409A of the IRC.
PLEASE READ CAREFULLY - THIS AGREEMENT INCLUDES A RELEASE OF ALL LEGALCLAIMS, INCLUDING CLAIMS UNDER THE AGE DISCRIMINATION IN EMPLOYMENT ACT
8
Copyright © 2013 www.secdatabase.com. All Rights Reserved.Please Consider the Environment Before Printing This Document
S I G N A T U R E SBy Executive:
I ACKNOWLEDGE THAT I HAVE CAREFULLY READ THE FOREGOING AGREEMENT, THAT IUNDERSTAND ALL OF ITS TERMS, THAT I UNDERSTAND THAT I AM RELEASING CLAIMS AGAINSTFLOWSERVE, AND THAT I AM ENTERING INTO IT VOLUNTARILY.
/s/ Tom Ferguson 1/25/2012TOM FERGUSON Date
On Behalf of Flowserve:
BY: /s/ Mark Dailey 2/1/2012Signature Date
SVP and Chief Administrative Officer
9
Copyright © 2013 www.secdatabase.com. All Rights Reserved.Please Consider the Environment Before Printing This Document
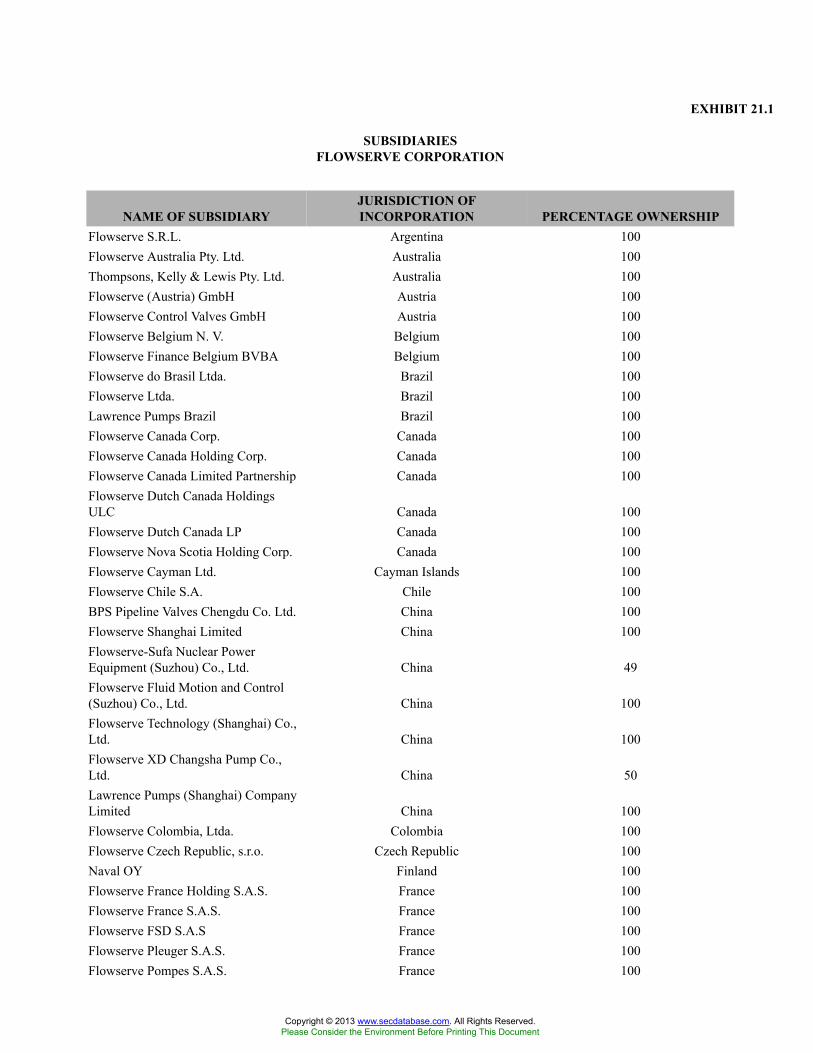
EXHIBIT 21.1
SUBSIDIARIESFLOWSERVE CORPORATION
NAME OF SUBSIDIARYJURISDICTION OFINCORPORATION PERCENTAGE OWNERSHIP
Flowserve S.R.L. Argentina 100Flowserve Australia Pty. Ltd. Australia 100Thompsons, Kelly & Lewis Pty. Ltd. Australia 100Flowserve (Austria) GmbH Austria 100Flowserve Control Valves GmbH Austria 100Flowserve Belgium N. V. Belgium 100Flowserve Finance Belgium BVBA Belgium 100Flowserve do Brasil Ltda. Brazil 100Flowserve Ltda. Brazil 100Lawrence Pumps Brazil Brazil 100Flowserve Canada Corp. Canada 100Flowserve Canada Holding Corp. Canada 100Flowserve Canada Limited Partnership Canada 100Flowserve Dutch Canada HoldingsULC Canada 100Flowserve Dutch Canada LP Canada 100Flowserve Nova Scotia Holding Corp. Canada 100Flowserve Cayman Ltd. Cayman Islands 100Flowserve Chile S.A. Chile 100BPS Pipeline Valves Chengdu Co. Ltd. China 100Flowserve Shanghai Limited China 100Flowserve-Sufa Nuclear PowerEquipment (Suzhou) Co., Ltd. China 49Flowserve Fluid Motion and Control(Suzhou) Co., Ltd. China 100Flowserve Technology (Shanghai) Co.,Ltd. China 100Flowserve XD Changsha Pump Co.,Ltd. China 50Lawrence Pumps (Shanghai) CompanyLimited China 100Flowserve Colombia, Ltda. Colombia 100Flowserve Czech Republic, s.r.o. Czech Republic 100Naval OY Finland 100Flowserve France Holding S.A.S. France 100Flowserve France S.A.S. France 100Flowserve FSD S.A.S France 100Flowserve Pleuger S.A.S. France 100Flowserve Pompes S.A.S. France 100
Copyright © 2013 www.secdatabase.com. All Rights Reserved.Please Consider the Environment Before Printing This Document

Flowserve Sales International S.A.S. France 100
Copyright © 2013 www.secdatabase.com. All Rights Reserved.Please Consider the Environment Before Printing This Document
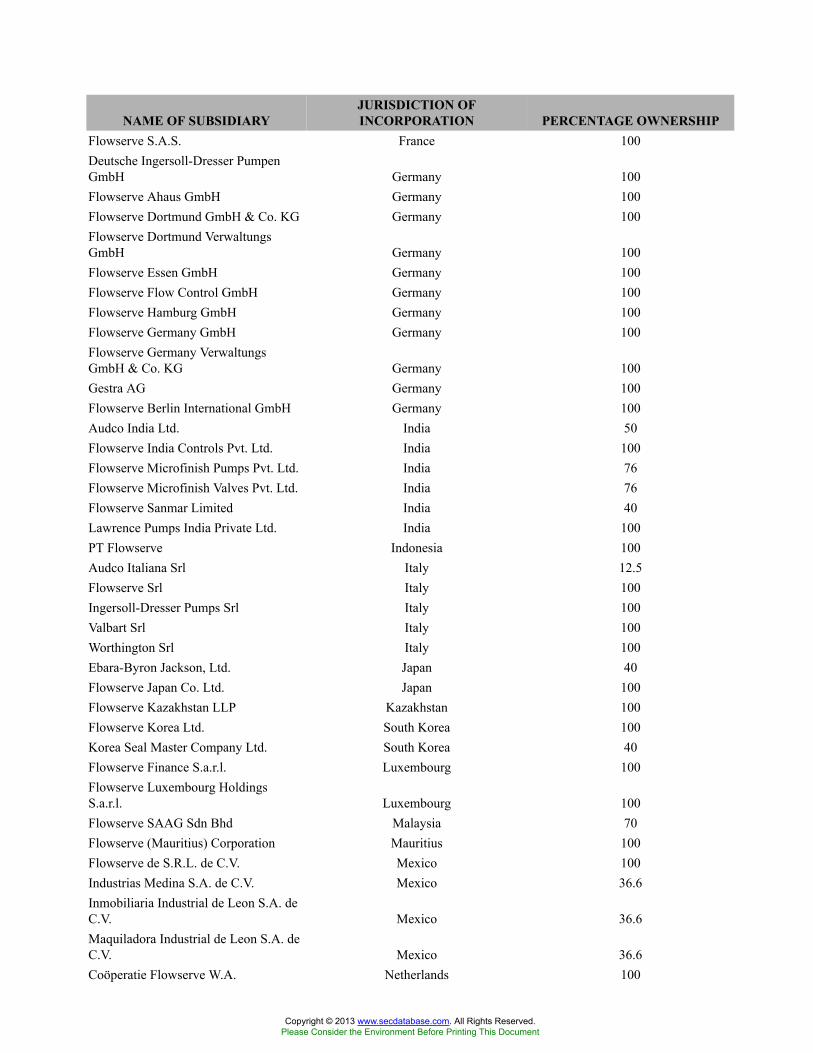
NAME OF SUBSIDIARYJURISDICTION OFINCORPORATION PERCENTAGE OWNERSHIP
Flowserve S.A.S. France 100Deutsche Ingersoll-Dresser PumpenGmbH Germany 100Flowserve Ahaus GmbH Germany 100Flowserve Dortmund GmbH & Co. KG Germany 100Flowserve Dortmund VerwaltungsGmbH Germany 100Flowserve Essen GmbH Germany 100Flowserve Flow Control GmbH Germany 100Flowserve Hamburg GmbH Germany 100Flowserve Germany GmbH Germany 100Flowserve Germany VerwaltungsGmbH & Co. KG Germany 100Gestra AG Germany 100Flowserve Berlin International GmbH Germany 100Audco India Ltd. India 50Flowserve India Controls Pvt. Ltd. India 100Flowserve Microfinish Pumps Pvt. Ltd. India 76Flowserve Microfinish Valves Pvt. Ltd. India 76Flowserve Sanmar Limited India 40Lawrence Pumps India Private Ltd. India 100PT Flowserve Indonesia 100Audco Italiana Srl Italy 12.5Flowserve Srl Italy 100Ingersoll-Dresser Pumps Srl Italy 100Valbart Srl Italy 100Worthington Srl Italy 100Ebara-Byron Jackson, Ltd. Japan 40Flowserve Japan Co. Ltd. Japan 100Flowserve Kazakhstan LLP Kazakhstan 100Flowserve Korea Ltd. South Korea 100Korea Seal Master Company Ltd. South Korea 40Flowserve Finance S.a.r.l. Luxembourg 100Flowserve Luxembourg HoldingsS.a.r.l. Luxembourg 100Flowserve SAAG Sdn Bhd Malaysia 70Flowserve (Mauritius) Corporation Mauritius 100Flowserve de S.R.L. de C.V. Mexico 100Industrias Medina S.A. de C.V. Mexico 36.6Inmobiliaria Industrial de Leon S.A. deC.V. Mexico 36.6Maquiladora Industrial de Leon S.A. deC.V. Mexico 36.6Coöperatie Flowserve W.A. Netherlands 100
Copyright © 2013 www.secdatabase.com. All Rights Reserved.Please Consider the Environment Before Printing This Document

Copyright © 2013 www.secdatabase.com. All Rights Reserved.Please Consider the Environment Before Printing This Document

NAME OF SUBSIDIARYJURISDICTION OFINCORPORATION PERCENTAGE OWNERSHIP
Flow Holdings VI C.V. Netherlands 100Flowserve B.V. Netherlands 100Flowserve Dutch Canada CoöperatifU.A. Netherlands 100Flowserve EMA V C.V. Netherlands 100Flowserve Finance B.V. Netherlands 100Flowserve Flow Control Benelux B.V. Netherlands 100Flowserve Netherlands C.V. Netherlands 100Flowserve Europe C.V. Netherlands 100Flowserve Netherlands ManagementB.V. Netherlands 100Flowserve International B.V. Netherlands 100FLS Dutch III C.V. Netherlands 100FLS Dutch IV C.V. Netherlands 100FLS Dutch VII C.V. Netherlands 100Lawrence Pumps Europe B.V. Netherlands 100Flowserve New Zealand Limited New Zealand 100Flowserve Norway A.S. Norway 100Flowserve Peru S.A.C. Peru 100Gestra Polonia SP. z.o.o. Poland 100Flowserve Portuguesa Mecanismos deControlo de Fluxos, Lda. Portugal 100OOO Flowserve Russia 100Arabian Seals Company, Ltd. Saudi Arabia 40Flowserve Abahsain Co. Ltd. Saudi Arabia 60Flowserve/Abahsain Flow Control Co.Ltd. Saudi Arabia 60Flowserve-Al Rushaid Company Ltd. Saudi Arabia 51Flowserve Pte. Ltd. Singapore 100Lawrence Pumps Asia Pte. Ltd. Singapore 100Flowserve South Africa (Proprietary)Limited South Africa 100Flowserve S.A. Spain 100Flowserve Spain S.L. Spain 100Gestra Espanola, S.A. Spain 100Flowserve Sweden AB Sweden 100NAF AB Sweden 100Palmstierna International AB Sweden 100Calder GmbH Switzerland 100Flowserve (Thailand) Limited Thailand 100Flowserve Al Mansoori ServicesCompany Limited United Arab Emirates 49Flowserve Gulf FZE United Arab Emirates 100Audco Limited United Kingdom 100
Copyright © 2013 www.secdatabase.com. All Rights Reserved.Please Consider the Environment Before Printing This Document

Flowserve International Limited United Kingdom 100
Copyright © 2013 www.secdatabase.com. All Rights Reserved.Please Consider the Environment Before Printing This Document
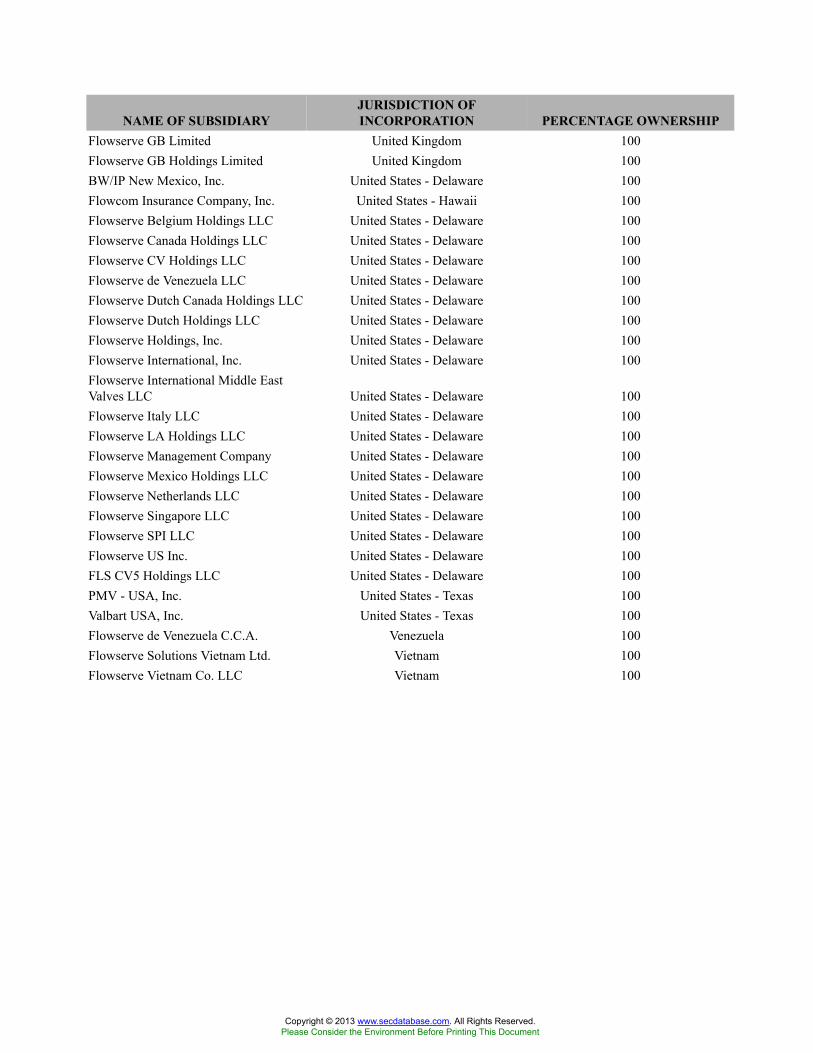
NAME OF SUBSIDIARYJURISDICTION OFINCORPORATION PERCENTAGE OWNERSHIP
Flowserve GB Limited United Kingdom 100Flowserve GB Holdings Limited United Kingdom 100BW/IP New Mexico, Inc. United States - Delaware 100Flowcom Insurance Company, Inc. United States - Hawaii 100Flowserve Belgium Holdings LLC United States - Delaware 100Flowserve Canada Holdings LLC United States - Delaware 100Flowserve CV Holdings LLC United States - Delaware 100Flowserve de Venezuela LLC United States - Delaware 100Flowserve Dutch Canada Holdings LLC United States - Delaware 100Flowserve Dutch Holdings LLC United States - Delaware 100Flowserve Holdings, Inc. United States - Delaware 100Flowserve International, Inc. United States - Delaware 100Flowserve International Middle EastValves LLC United States - Delaware 100Flowserve Italy LLC United States - Delaware 100Flowserve LA Holdings LLC United States - Delaware 100Flowserve Management Company United States - Delaware 100Flowserve Mexico Holdings LLC United States - Delaware 100Flowserve Netherlands LLC United States - Delaware 100Flowserve Singapore LLC United States - Delaware 100Flowserve SPI LLC United States - Delaware 100Flowserve US Inc. United States - Delaware 100FLS CV5 Holdings LLC United States - Delaware 100PMV - USA, Inc. United States - Texas 100Valbart USA, Inc. United States - Texas 100Flowserve de Venezuela C.C.A. Venezuela 100Flowserve Solutions Vietnam Ltd. Vietnam 100Flowserve Vietnam Co. LLC Vietnam 100
Copyright © 2013 www.secdatabase.com. All Rights Reserved.Please Consider the Environment Before Printing This Document
EXHIBIT 23.1CONSENT OF INDEPENDENT REGISTERED PUBLIC ACCOUNTING FIRM
We hereby consent to the incorporation by reference in the Registration Statements on Form S-8 (Nos. 333-137706, 333-163251 and333-82081) of Flowserve Corporation of our report dated February 22, 2012 relating to the financial statements, financial statementschedule and the effectiveness of internal control over financial reporting, which appears in this Form 10-K.
/s/ PricewaterhouseCoopers LLPPricewaterhouseCoopers LLPDallas, TexasFebruary 22, 2012
Copyright © 2013 www.secdatabase.com. All Rights Reserved.Please Consider the Environment Before Printing This Document
EXHIBIT 31.1
CERTIFICATION OF PRINCIPAL EXECUTIVE OFFICERPURSUANT TO SECTION 302
OF THE SARBANES-OXLEY ACT OF 2002
I, Mark A. Blinn, certify that:
1. I have reviewed this Annual Report on Form 10-K for the fiscal year ended December 31, 2011 of Flowserve Corporation;
2. Based on my knowledge, this report does not contain any untrue statement of a material fact or omit to state a material factnecessary to make the statements made, in light of the circumstances under which such statements were made, not misleading withrespect to the period covered by this report;
3. Based on my knowledge, the financial statements, and other financial information included in this report, fairly present in allmaterial respects the consolidated financial condition, results of operations and cash flows of the registrant as of, and for, the periodspresented in this report;
4. The registrant’s other certifying officer and I are responsible for establishing and maintaining disclosure controls andprocedures (as defined in Exchange Act Rules 13a-15(e) and 15d-15(e)) and internal control over financial reporting (as defined inExchange Act Rules 13a-15(f) and 15d-15(f)) for the registrant and have:
(a) Designed such disclosure controls and procedures, or caused such disclosure controls and procedures to be designedunder our supervision, to ensure that material information relating to the registrant, including its consolidated subsidiaries, is madeknown to us by others within those entities, particularly during the period in which this report is being prepared;
(b) Designed such internal control over financial reporting, or caused such internal control over financial reporting to bedesigned under our supervision, to provide reasonable assurance regarding the reliability of financial reporting and the preparationof financial statements for external purposes in accordance with generally accepted accounting principles;
(c) Evaluated the effectiveness of the registrant’s disclosure controls and procedures and presented in this report ourconclusions about the effectiveness of the disclosure controls and procedures, as of the end of the period covered by this reportbased on such evaluation; and
(d) Disclosed in this report any change in the registrant’s internal control over financial reporting that occurred during theregistrant’s most recent fiscal quarter (the registrant’s fourth fiscal quarter in the case of an annual report) that has materiallyaffected, or is reasonably likely to materially affect, the registrant’s internal control over financial reporting; and
5. The registrant’s other certifying officer and I have disclosed, based on our most recent evaluation of internal control overfinancial reporting, to the registrant’s auditors and the audit committee of the registrant’s board of directors (or persons performingthe equivalent functions):
(a) All significant deficiencies and material weaknesses in the design or operation of internal control over financialreporting which are reasonably likely to adversely affect the registrant’s ability to record, process, summarize and report financialinformation; and
(b) Any fraud, whether or not material, that involves management or other employees who have a significant role in theregistrant’s internal control over financial reporting.
/s/ Mark A. BlinnMark A. BlinnPresident and Chief Executive Officer(Principal Executive Officer)
Date: February 22, 2012
Copyright © 2013 www.secdatabase.com. All Rights Reserved.Please Consider the Environment Before Printing This Document
EXHIBIT 31.2
CERTIFICATION OF PRINCIPAL FINANCIAL OFFICERPURSUANT TO SECTION 302
OF THE SARBANES-OXLEY ACT OF 2002
I, Michael S. Taff, certify that:
1. I have reviewed this Annual Report on Form 10-K for the fiscal year ended December 31, 2011 of Flowserve Corporation;
2. Based on my knowledge, this report does not contain any untrue statement of a material fact or omit to state a material factnecessary to make the statements made, in light of the circumstances under which such statements were made, not misleading withrespect to the period covered by this report;
3. Based on my knowledge, the financial statements, and other financial information included in this report, fairly present in allmaterial respects the consolidated financial condition, results of operations and cash flows of the registrant as of, and for, the periodspresented in this report;
4. The registrant’s other certifying officer and I are responsible for establishing and maintaining disclosure controls andprocedures (as defined in Exchange Act Rules 13a-15(e) and 15d-15(e)) and internal control over financial reporting (as defined inExchange Act Rules 13a-15(f) and 15d-15(f)) for the registrant and have:
(a) Designed such disclosure controls and procedures, or caused such disclosure controls and procedures to be designedunder our supervision, to ensure that material information relating to the registrant, including its consolidated subsidiaries, is madeknown to us by others within those entities, particularly during the period in which this report is being prepared;
(b) Designed such internal control over financial reporting, or caused such internal control over financial reporting to bedesigned under our supervision, to provide reasonable assurance regarding the reliability of financial reporting and the preparationof financial statements for external purposes in accordance with generally accepted accounting principles;
(c) Evaluated the effectiveness of the registrant’s disclosure controls and procedures and presented in this report ourconclusions about the effectiveness of the disclosure controls and procedures, as of the end of the period covered by this reportbased on such evaluation; and
(d) Disclosed in this report any change in the registrant’s internal control over financial reporting that occurred during theregistrant’s most recent fiscal quarter (the registrant’s fourth fiscal quarter in the case of an annual report) that has materiallyaffected, or is reasonably likely to materially affect, the registrant’s internal control over financial reporting; and
5. The registrant’s other certifying officer and I have disclosed, based on our most recent evaluation of internal control overfinancial reporting, to the registrant’s auditors and the audit committee of the registrant’s board of directors (or persons performingthe equivalent functions):
(a) All significant deficiencies and material weaknesses in the design or operation of internal control over financialreporting which are reasonably likely to adversely affect the registrant’s ability to record, process, summarize and report financialinformation; and
(b) Any fraud, whether or not material, that involves management or other employees who have a significant role in theregistrant’s internal control over financial reporting.
/s/ Michael S. TaffMichael S. Taff, Senior Vice President andChief Financial Officer(Principal Financial Officer)
Date: February 22, 2012
Copyright © 2013 www.secdatabase.com. All Rights Reserved.Please Consider the Environment Before Printing This Document
EXHIBIT 32.1
CERTIFICATION PURSUANT TO18 U.S.C. SECTION 1350
AS ADOPTED PURSUANT TOSECTION 906 OF THE SARBANES-OXLEY ACT OF 2002
I, Mark A. Blinn, President and Chief Executive Officer of Flowserve Corporation (the “Company”), certify, pursuant to 18 U.S.C.Section 1350, as adopted pursuant to Section 906 of the Sarbanes-Oxley Act of 2002, that to my knowledge:
(1) the Annual Report on Form 10-K of the Company for the period ended December 31, 2011, as filed with the Securities andExchange Commission on the date hereof (the “Annual Report”), fully complies with the requirements of Section 13(a) or 15(d) ofthe Securities Exchange Act of 1934; and
(2) the information contained in the Annual Report fairly presents, in all material respects, the consolidated financial conditionand results of operations of the Company.
/s/ Mark A. BlinnMark A. BlinnPresident and Chief Executive Officer(Principal Executive Officer)
Date: February 22, 2012
Copyright © 2013 www.secdatabase.com. All Rights Reserved.Please Consider the Environment Before Printing This Document
EXHIBIT 32.2
CERTIFICATION PURSUANT TO18 U.S.C. SECTION 1350
AS ADOPTED PURSUANT TOSECTION 906 OF THE SARBANES-OXLEY ACT OF 2002
I, Michael S. Taff, Senior Vice President and Chief Financial Officer of Flowserve Corporation (the “Company”), certify, pursuant to18 U.S.C. Section 1350, as adopted pursuant to Section 906 of the Sarbanes-Oxley Act of 2002, that to my knowledge:
(1) the Annual Report on Form 10-K of the Company for the period ended December 31, 2011, as filed with the Securities andExchange Commission on the date hereof (the “Annual Report”), fully complies with the requirements of Section 13(a) or 15(d) ofthe Securities Exchange Act of 1934; and
(2) the information contained in the Annual Report fairly presents, in all material respects, the consolidated financial conditionand results of operations of the Company.
/s/ Michael S. TaffMichael S. TaffSenior Vice President andChief Financial Officer(Principal Financial Officer)
Date: February 22, 2012
Copyright © 2013 www.secdatabase.com. All Rights Reserved.Please Consider the Environment Before Printing This Document

12 Months EndedPension and PostretirementBenefits (Tables) Dec. 31, 2011
Defined Benefit Plans andOther Postretirement BenefitPlans Table Text Block [LineItems]Schedule of Benefit PensionPlans with AccumulatedBenefit Obligations in Excessof Plan Assets
The following summarizes key pension plan information regarding U.S. and non-U.S. planswhose accumulated benefit obligations exceed the fair value of their respective plan assets.
December 31,
2011 2010
(Amounts in thousands)
Benefit Obligation $ 640,162 $ 518,443Accumulated benefit obligation 623,169 510,302Fair value of plan assets 473,801 379,351
U.S Defined Benefit Plans[Member]Defined Benefit Plans andOther Postretirement BenefitPlans Table Text Block [LineItems]Schedule of AssumptionsRelated to Plans
The following are assumptions related to the U.S. defined benefit pension plans:
Year Ended December 31,
2011 2010 2009
Weighted average assumptions used to determineBenefit Obligations:
Discount rate 4.50% 5.00% 5.50%Rate of increase in compensation levels 4.25 4.25 4.80
Weighted average assumptions used to determine netpension expense:
Long-term rate of return on assets 6.25% 7.00% 7.75%Discount rate 5.00 5.50 6.75Rate of increase in compensation levels 4.25 4.80 4.80
Components of Net PeriodicCost for Pension andPostretirement Benefits
Net pension expense for the U.S. defined benefit pension plans (including both qualified andnon-qualified plans) was:
Year Ended December 31,
2011 2010 2009
(Amounts in thousands)
Service cost $ 19,754 $ 20,460 $ 18,471Interest cost 17,217 17,941 19,247Expected return on plan assets (21,692) (24,066) (22,152)Settlement and curtailment of benefits — 757 —Amortization of unrecognized prior service benefit (1,238) (1,239) (1,259)Amortization of unrecognized net loss 10,784 9,492 6,502
U.S. net pension expense $ 24,825 $ 23,345 $ 20,809
Copyright © 2013 www.secdatabase.com. All Rights Reserved.Please Consider the Environment Before Printing This Document
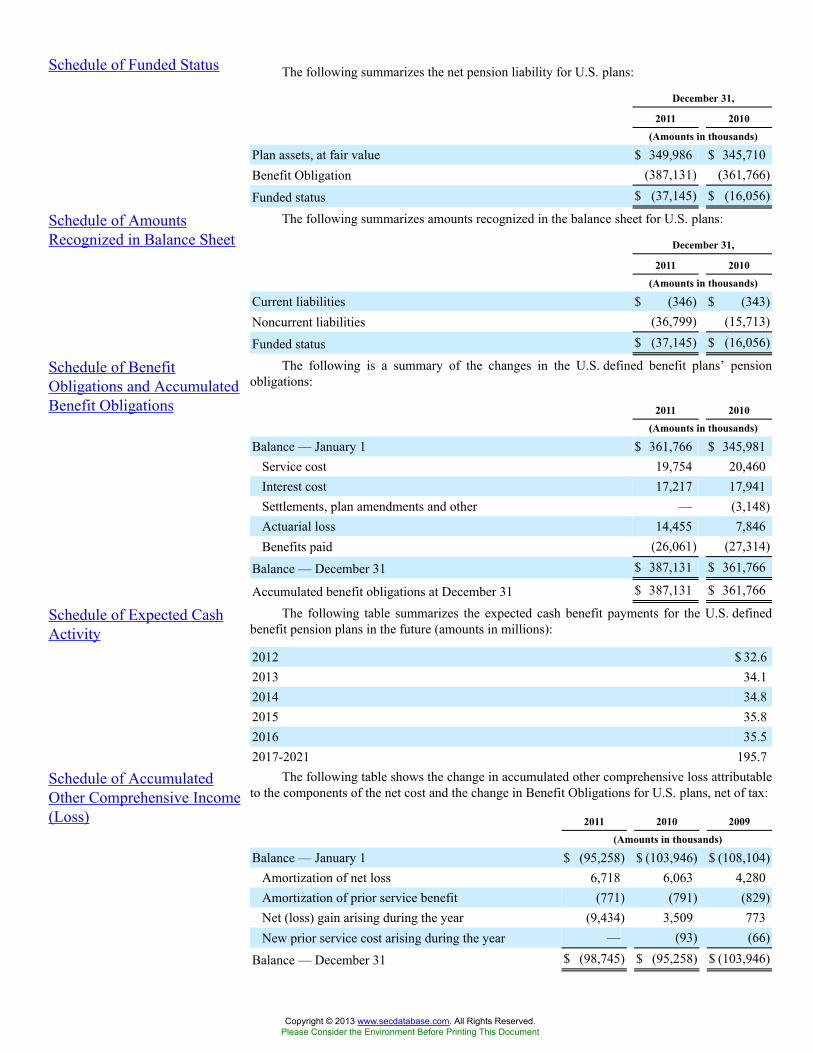
Schedule of Funded Status The following summarizes the net pension liability for U.S. plans:
December 31,
2011 2010
(Amounts in thousands)
Plan assets, at fair value $ 349,986 $ 345,710Benefit Obligation (387,131) (361,766)
Funded status $ (37,145) $ (16,056)
Schedule of AmountsRecognized in Balance Sheet
The following summarizes amounts recognized in the balance sheet for U.S. plans:
December 31,
2011 2010
(Amounts in thousands)
Current liabilities $ (346) $ (343)Noncurrent liabilities (36,799) (15,713)
Funded status $ (37,145) $ (16,056)
Schedule of BenefitObligations and AccumulatedBenefit Obligations
The following is a summary of the changes in the U.S. defined benefit plans’ pensionobligations:
2011 2010
(Amounts in thousands)
Balance — January 1 $ 361,766 $ 345,981Service cost 19,754 20,460Interest cost 17,217 17,941Settlements, plan amendments and other — (3,148)Actuarial loss 14,455 7,846Benefits paid (26,061) (27,314)
Balance — December 31 $ 387,131 $ 361,766
Accumulated benefit obligations at December 31 $ 387,131 $ 361,766
Schedule of Expected CashActivity
The following table summarizes the expected cash benefit payments for the U.S. definedbenefit pension plans in the future (amounts in millions):
2012 $ 32.62013 34.12014 34.82015 35.82016 35.52017-2021 195.7
Schedule of AccumulatedOther Comprehensive Income(Loss)
The following table shows the change in accumulated other comprehensive loss attributableto the components of the net cost and the change in Benefit Obligations for U.S. plans, net of tax:
2011 2010 2009
(Amounts in thousands)
Balance — January 1 $ (95,258) $ (103,946) $ (108,104)Amortization of net loss 6,718 6,063 4,280Amortization of prior service benefit (771) (791) (829)Net (loss) gain arising during the year (9,434) 3,509 773New prior service cost arising during the year — (93) (66)
Balance — December 31 $ (98,745) $ (95,258) $ (103,946)
Copyright © 2013 www.secdatabase.com. All Rights Reserved.Please Consider the Environment Before Printing This Document
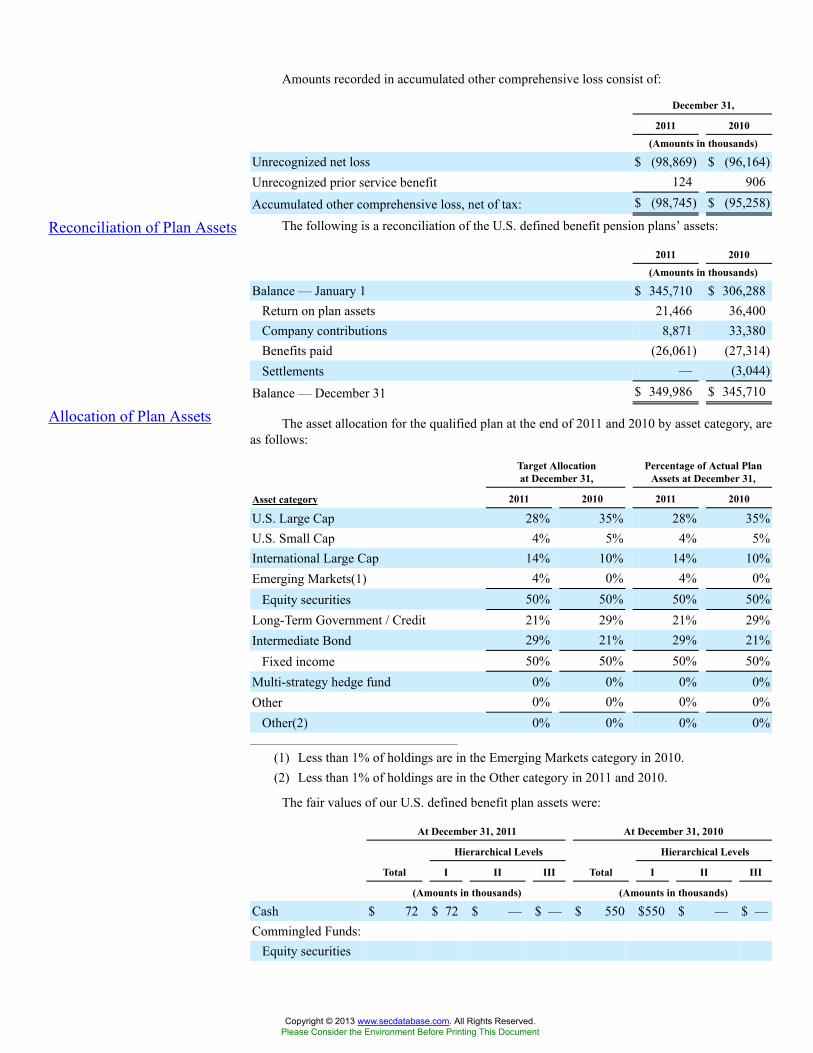
Amounts recorded in accumulated other comprehensive loss consist of:
December 31,
2011 2010
(Amounts in thousands)
Unrecognized net loss $ (98,869) $ (96,164)Unrecognized prior service benefit 124 906
Accumulated other comprehensive loss, net of tax: $ (98,745) $ (95,258)
Reconciliation of Plan Assets The following is a reconciliation of the U.S. defined benefit pension plans’ assets:
2011 2010
(Amounts in thousands)
Balance — January 1 $ 345,710 $ 306,288Return on plan assets 21,466 36,400Company contributions 8,871 33,380Benefits paid (26,061) (27,314)Settlements — (3,044)
Balance — December 31 $ 349,986 $ 345,710
Allocation of Plan Assets The asset allocation for the qualified plan at the end of 2011 and 2010 by asset category, areas follows:
Target Allocationat December 31,
Percentage of Actual PlanAssets at December 31,
Asset category 2011 2010 2011 2010
U.S. Large Cap 28% 35% 28% 35%U.S. Small Cap 4% 5% 4% 5%International Large Cap 14% 10% 14% 10%Emerging Markets(1) 4% 0% 4% 0%
Equity securities 50% 50% 50% 50%Long-Term Government / Credit 21% 29% 21% 29%Intermediate Bond 29% 21% 29% 21%
Fixed income 50% 50% 50% 50%Multi-strategy hedge fund 0% 0% 0% 0%Other 0% 0% 0% 0%
Other(2) 0% 0% 0% 0%_______________________________________
(1) Less than 1% of holdings are in the Emerging Markets category in 2010.(2) Less than 1% of holdings are in the Other category in 2011 and 2010.
The fair values of our U.S. defined benefit plan assets were:
At December 31, 2011 At December 31, 2010
Hierarchical Levels Hierarchical Levels
Total I II III Total I II III
(Amounts in thousands) (Amounts in thousands)
Cash $ 72 $ 72 $ — $ — $ 550 $550 $ — $ —Commingled Funds:
Equity securities
Copyright © 2013 www.secdatabase.com. All Rights Reserved.Please Consider the Environment Before Printing This Document
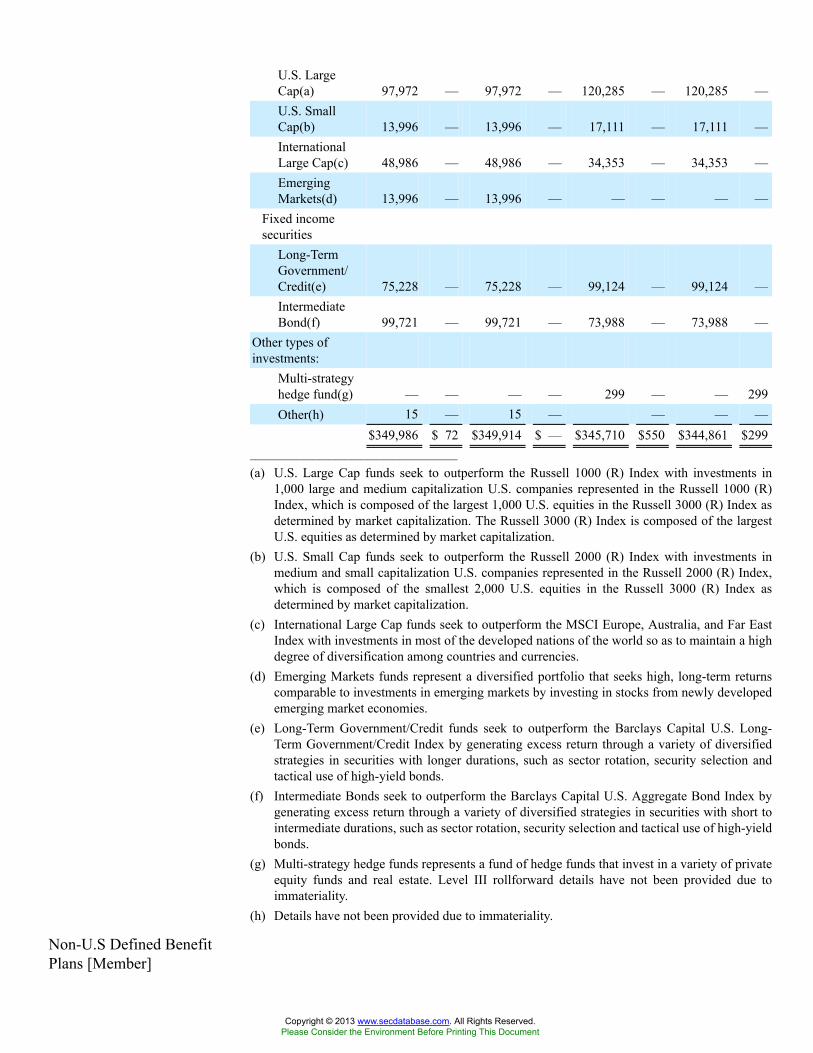
U.S. LargeCap(a) 97,972 — 97,972 — 120,285 — 120,285 —U.S. SmallCap(b) 13,996 — 13,996 — 17,111 — 17,111 —InternationalLarge Cap(c) 48,986 — 48,986 — 34,353 — 34,353 —EmergingMarkets(d) 13,996 — 13,996 — — — — —
Fixed incomesecurities
Long-TermGovernment/Credit(e) 75,228 — 75,228 — 99,124 — 99,124 —IntermediateBond(f) 99,721 — 99,721 — 73,988 — 73,988 —
Other types ofinvestments:
Multi-strategyhedge fund(g) — — — — 299 — — 299Other(h) 15 — 15 — — — —
$349,986 $ 72 $349,914 $ — $345,710 $550 $344,861 $299_______________________________________
(a) U.S. Large Cap funds seek to outperform the Russell 1000 (R) Index with investments in1,000 large and medium capitalization U.S. companies represented in the Russell 1000 (R)Index, which is composed of the largest 1,000 U.S. equities in the Russell 3000 (R) Index asdetermined by market capitalization. The Russell 3000 (R) Index is composed of the largestU.S. equities as determined by market capitalization.
(b) U.S. Small Cap funds seek to outperform the Russell 2000 (R) Index with investments inmedium and small capitalization U.S. companies represented in the Russell 2000 (R) Index,which is composed of the smallest 2,000 U.S. equities in the Russell 3000 (R) Index asdetermined by market capitalization.
(c) International Large Cap funds seek to outperform the MSCI Europe, Australia, and Far EastIndex with investments in most of the developed nations of the world so as to maintain a highdegree of diversification among countries and currencies.
(d) Emerging Markets funds represent a diversified portfolio that seeks high, long-term returnscomparable to investments in emerging markets by investing in stocks from newly developedemerging market economies.
(e) Long-Term Government/Credit funds seek to outperform the Barclays Capital U.S. Long-Term Government/Credit Index by generating excess return through a variety of diversifiedstrategies in securities with longer durations, such as sector rotation, security selection andtactical use of high-yield bonds.
(f) Intermediate Bonds seek to outperform the Barclays Capital U.S. Aggregate Bond Index bygenerating excess return through a variety of diversified strategies in securities with short tointermediate durations, such as sector rotation, security selection and tactical use of high-yieldbonds.
(g) Multi-strategy hedge funds represents a fund of hedge funds that invest in a variety of privateequity funds and real estate. Level III rollforward details have not been provided due toimmateriality.
(h) Details have not been provided due to immateriality.
Non-U.S Defined BenefitPlans [Member]
Copyright © 2013 www.secdatabase.com. All Rights Reserved.Please Consider the Environment Before Printing This Document
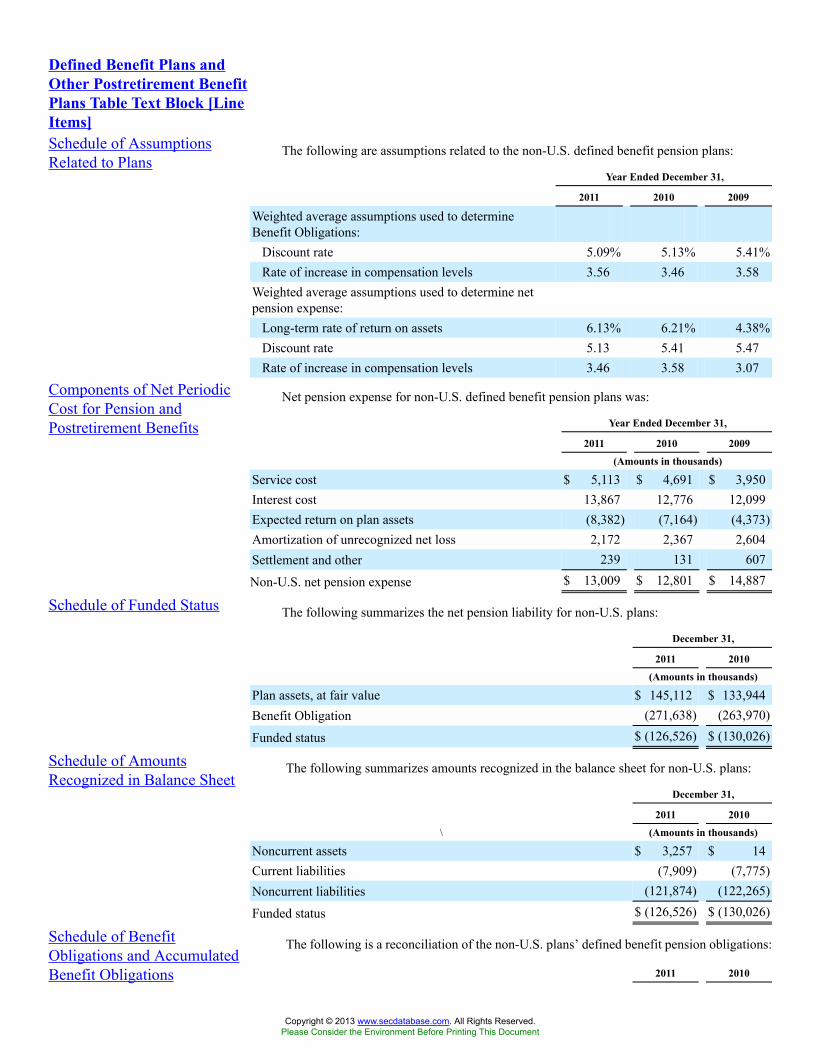
Defined Benefit Plans andOther Postretirement BenefitPlans Table Text Block [LineItems]Schedule of AssumptionsRelated to Plans
The following are assumptions related to the non-U.S. defined benefit pension plans:
Year Ended December 31,
2011 2010 2009
Weighted average assumptions used to determineBenefit Obligations:
Discount rate 5.09% 5.13% 5.41%Rate of increase in compensation levels 3.56 3.46 3.58
Weighted average assumptions used to determine netpension expense:
Long-term rate of return on assets 6.13% 6.21% 4.38%Discount rate 5.13 5.41 5.47Rate of increase in compensation levels 3.46 3.58 3.07
Components of Net PeriodicCost for Pension andPostretirement Benefits
Net pension expense for non-U.S. defined benefit pension plans was:
Year Ended December 31,
2011 2010 2009
(Amounts in thousands)
Service cost $ 5,113 $ 4,691 $ 3,950Interest cost 13,867 12,776 12,099Expected return on plan assets (8,382) (7,164) (4,373)Amortization of unrecognized net loss 2,172 2,367 2,604Settlement and other 239 131 607
Non-U.S. net pension expense $ 13,009 $ 12,801 $ 14,887
Schedule of Funded Status The following summarizes the net pension liability for non-U.S. plans:
December 31,
2011 2010
(Amounts in thousands)
Plan assets, at fair value $ 145,112 $ 133,944Benefit Obligation (271,638) (263,970)
Funded status $ (126,526) $ (130,026)
Schedule of AmountsRecognized in Balance Sheet
The following summarizes amounts recognized in the balance sheet for non-U.S. plans:
December 31,
2011 2010
\ (Amounts in thousands)
Noncurrent assets $ 3,257 $ 14Current liabilities (7,909) (7,775)Noncurrent liabilities (121,874) (122,265)
Funded status $ (126,526) $ (130,026)
Schedule of BenefitObligations and AccumulatedBenefit Obligations
The following is a reconciliation of the non-U.S. plans’ defined benefit pension obligations:
2011 2010
Copyright © 2013 www.secdatabase.com. All Rights Reserved.Please Consider the Environment Before Printing This Document
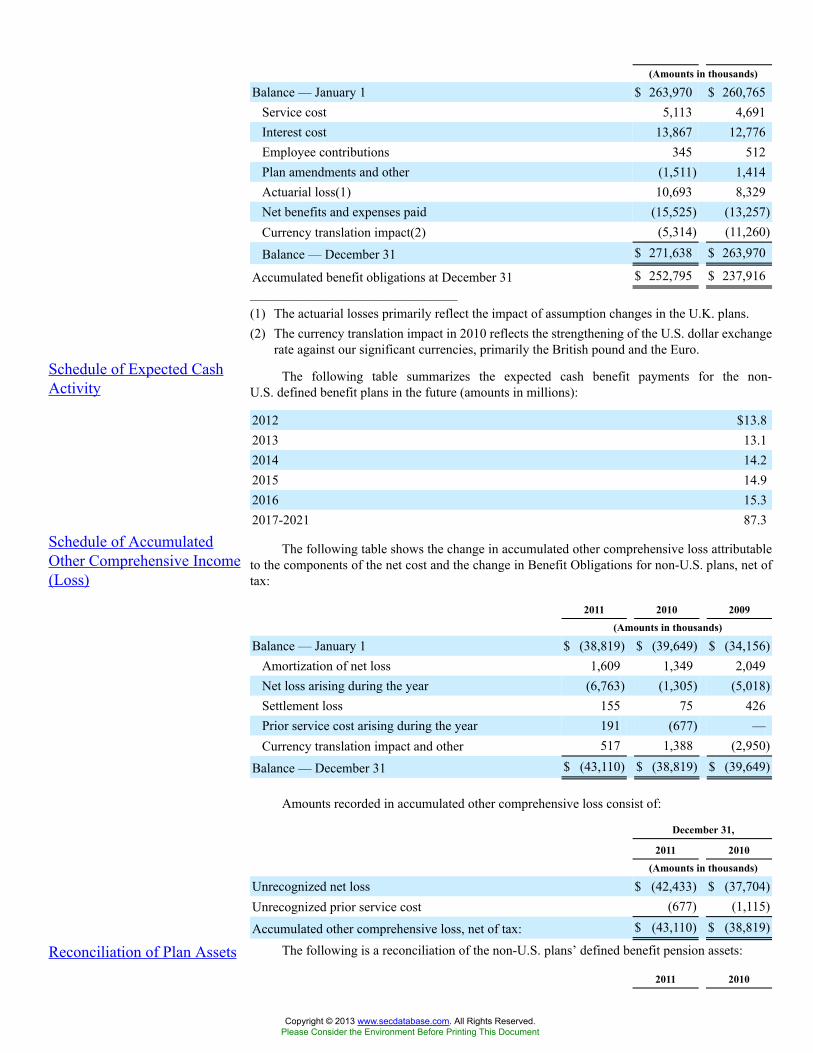
(Amounts in thousands)
Balance — January 1 $ 263,970 $ 260,765Service cost 5,113 4,691Interest cost 13,867 12,776Employee contributions 345 512Plan amendments and other (1,511) 1,414Actuarial loss(1) 10,693 8,329Net benefits and expenses paid (15,525) (13,257)Currency translation impact(2) (5,314) (11,260)
Balance — December 31 $ 271,638 $ 263,970
Accumulated benefit obligations at December 31 $ 252,795 $ 237,916_______________________________________
(1) The actuarial losses primarily reflect the impact of assumption changes in the U.K. plans.(2) The currency translation impact in 2010 reflects the strengthening of the U.S. dollar exchange
rate against our significant currencies, primarily the British pound and the Euro.Schedule of Expected CashActivity
The following table summarizes the expected cash benefit payments for the non-U.S. defined benefit plans in the future (amounts in millions):
2012 $13.82013 13.12014 14.22015 14.92016 15.32017-2021 87.3
Schedule of AccumulatedOther Comprehensive Income(Loss)
The following table shows the change in accumulated other comprehensive loss attributableto the components of the net cost and the change in Benefit Obligations for non-U.S. plans, net oftax:
2011 2010 2009
(Amounts in thousands)
Balance — January 1 $ (38,819) $ (39,649) $ (34,156)Amortization of net loss 1,609 1,349 2,049Net loss arising during the year (6,763) (1,305) (5,018)Settlement loss 155 75 426Prior service cost arising during the year 191 (677) —Currency translation impact and other 517 1,388 (2,950)
Balance — December 31 $ (43,110) $ (38,819) $ (39,649)
Amounts recorded in accumulated other comprehensive loss consist of:
December 31,
2011 2010
(Amounts in thousands)
Unrecognized net loss $ (42,433) $ (37,704)Unrecognized prior service cost (677) (1,115)
Accumulated other comprehensive loss, net of tax: $ (43,110) $ (38,819)
Reconciliation of Plan Assets The following is a reconciliation of the non-U.S. plans’ defined benefit pension assets:
2011 2010
Copyright © 2013 www.secdatabase.com. All Rights Reserved.Please Consider the Environment Before Printing This Document
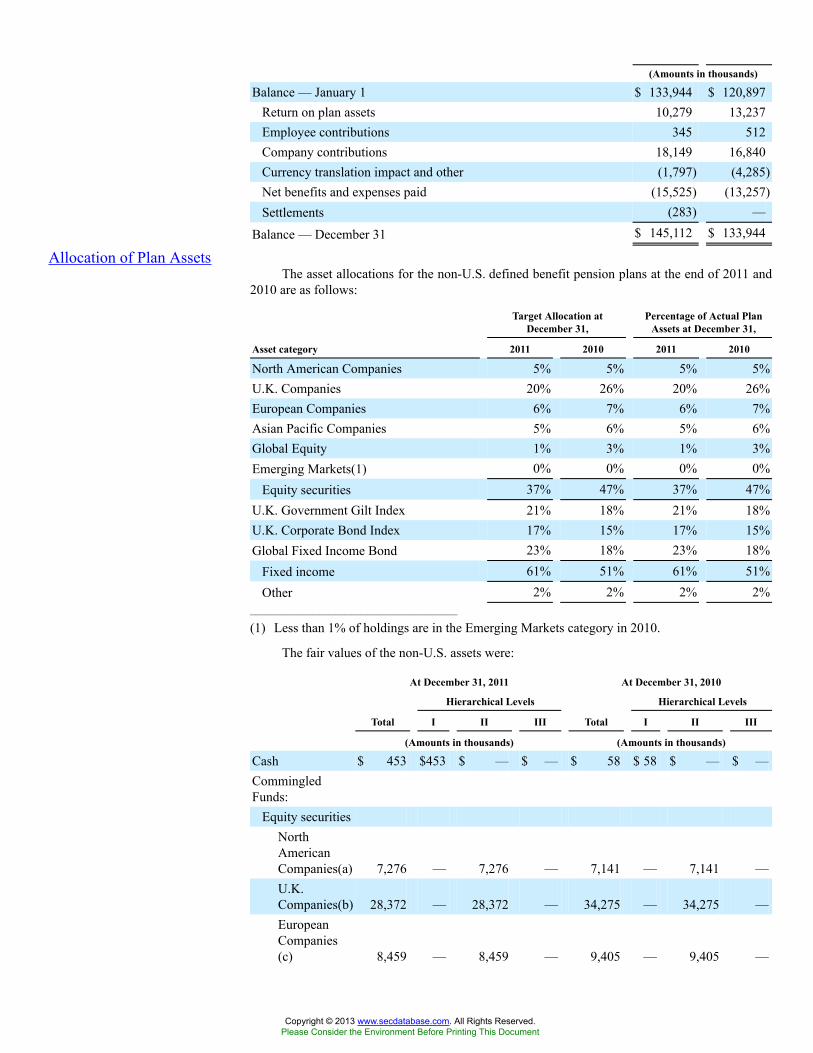
(Amounts in thousands)
Balance — January 1 $ 133,944 $ 120,897Return on plan assets 10,279 13,237Employee contributions 345 512Company contributions 18,149 16,840Currency translation impact and other (1,797) (4,285)Net benefits and expenses paid (15,525) (13,257)Settlements (283) —
Balance — December 31 $ 145,112 $ 133,944
Allocation of Plan AssetsThe asset allocations for the non-U.S. defined benefit pension plans at the end of 2011 and
2010 are as follows:
Target Allocation atDecember 31,
Percentage of Actual PlanAssets at December 31,
Asset category 2011 2010 2011 2010
North American Companies 5% 5% 5% 5%U.K. Companies 20% 26% 20% 26%European Companies 6% 7% 6% 7%Asian Pacific Companies 5% 6% 5% 6%Global Equity 1% 3% 1% 3%Emerging Markets(1) 0% 0% 0% 0%
Equity securities 37% 47% 37% 47%U.K. Government Gilt Index 21% 18% 21% 18%U.K. Corporate Bond Index 17% 15% 17% 15%Global Fixed Income Bond 23% 18% 23% 18%
Fixed income 61% 51% 61% 51%Other 2% 2% 2% 2%
_______________________________________
(1) Less than 1% of holdings are in the Emerging Markets category in 2010.
The fair values of the non-U.S. assets were:
At December 31, 2011 At December 31, 2010
Hierarchical Levels Hierarchical Levels
Total I II III Total I II III
(Amounts in thousands) (Amounts in thousands)
Cash $ 453 $453 $ — $ — $ 58 $ 58 $ — $ —CommingledFunds:
Equity securitiesNorthAmericanCompanies(a) 7,276 — 7,276 — 7,141 — 7,141 —U.K.Companies(b) 28,372 — 28,372 — 34,275 — 34,275 —EuropeanCompanies(c) 8,459 — 8,459 — 9,405 — 9,405 —
Copyright © 2013 www.secdatabase.com. All Rights Reserved.Please Consider the Environment Before Printing This Document
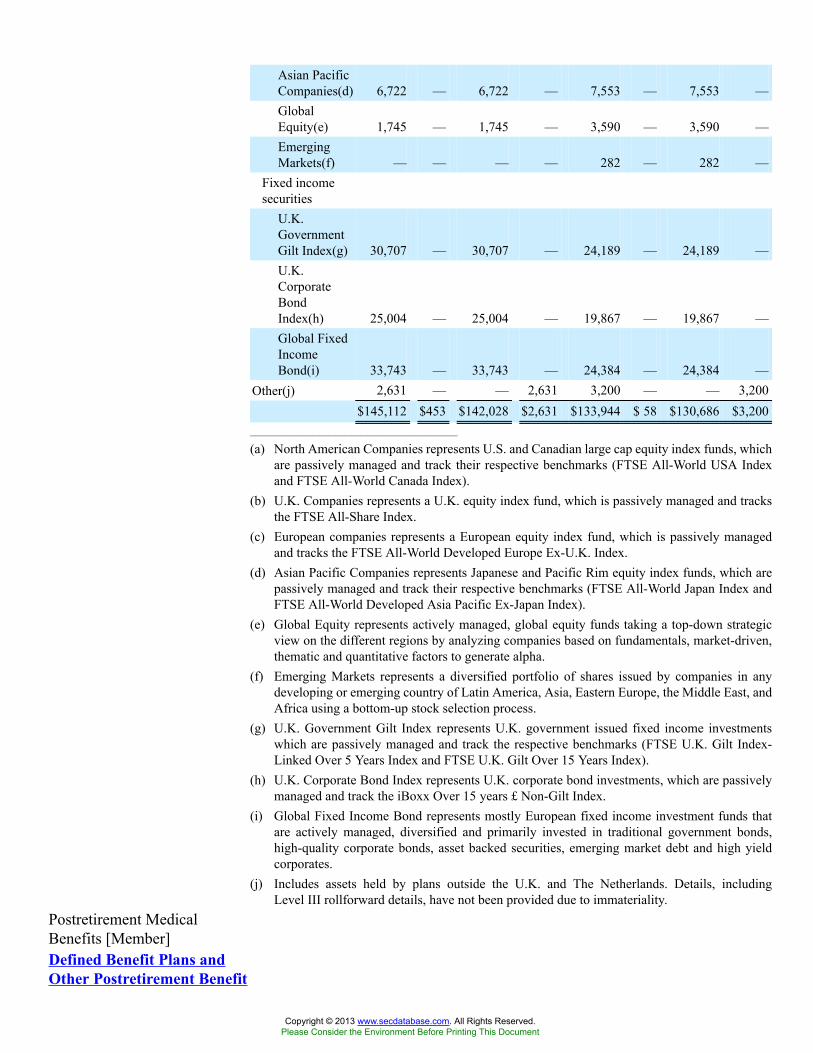
Asian PacificCompanies(d) 6,722 — 6,722 — 7,553 — 7,553 —GlobalEquity(e) 1,745 — 1,745 — 3,590 — 3,590 —EmergingMarkets(f) — — — — 282 — 282 —
Fixed incomesecurities
U.K.GovernmentGilt Index(g) 30,707 — 30,707 — 24,189 — 24,189 —U.K.CorporateBondIndex(h) 25,004 — 25,004 — 19,867 — 19,867 —Global FixedIncomeBond(i) 33,743 — 33,743 — 24,384 — 24,384 —
Other(j) 2,631 — — 2,631 3,200 — — 3,200$145,112 $453 $142,028 $2,631 $133,944 $ 58 $130,686 $3,200
_______________________________________
(a) North American Companies represents U.S. and Canadian large cap equity index funds, whichare passively managed and track their respective benchmarks (FTSE All-World USA Indexand FTSE All-World Canada Index).
(b) U.K. Companies represents a U.K. equity index fund, which is passively managed and tracksthe FTSE All-Share Index.
(c) European companies represents a European equity index fund, which is passively managedand tracks the FTSE All-World Developed Europe Ex-U.K. Index.
(d) Asian Pacific Companies represents Japanese and Pacific Rim equity index funds, which arepassively managed and track their respective benchmarks (FTSE All-World Japan Index andFTSE All-World Developed Asia Pacific Ex-Japan Index).
(e) Global Equity represents actively managed, global equity funds taking a top-down strategicview on the different regions by analyzing companies based on fundamentals, market-driven,thematic and quantitative factors to generate alpha.
(f) Emerging Markets represents a diversified portfolio of shares issued by companies in anydeveloping or emerging country of Latin America, Asia, Eastern Europe, the Middle East, andAfrica using a bottom-up stock selection process.
(g) U.K. Government Gilt Index represents U.K. government issued fixed income investmentswhich are passively managed and track the respective benchmarks (FTSE U.K. Gilt Index-Linked Over 5 Years Index and FTSE U.K. Gilt Over 15 Years Index).
(h) U.K. Corporate Bond Index represents U.K. corporate bond investments, which are passivelymanaged and track the iBoxx Over 15 years £ Non-Gilt Index.
(i) Global Fixed Income Bond represents mostly European fixed income investment funds thatare actively managed, diversified and primarily invested in traditional government bonds,high-quality corporate bonds, asset backed securities, emerging market debt and high yieldcorporates.
(j) Includes assets held by plans outside the U.K. and The Netherlands. Details, includingLevel III rollforward details, have not been provided due to immateriality.
Postretirement MedicalBenefits [Member]Defined Benefit Plans andOther Postretirement Benefit
Copyright © 2013 www.secdatabase.com. All Rights Reserved.Please Consider the Environment Before Printing This Document
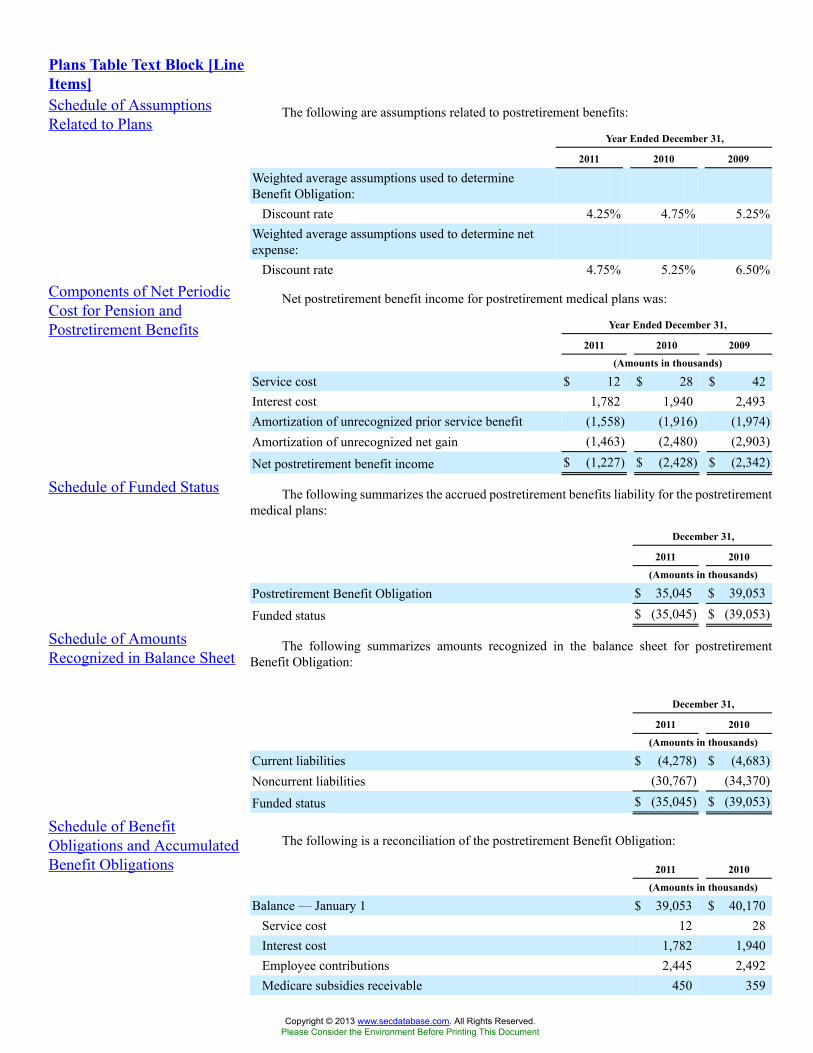
Plans Table Text Block [LineItems]Schedule of AssumptionsRelated to Plans
The following are assumptions related to postretirement benefits:
Year Ended December 31,
2011 2010 2009
Weighted average assumptions used to determineBenefit Obligation:
Discount rate 4.25% 4.75% 5.25%Weighted average assumptions used to determine netexpense:
Discount rate 4.75% 5.25% 6.50%
Components of Net PeriodicCost for Pension andPostretirement Benefits
Net postretirement benefit income for postretirement medical plans was:
Year Ended December 31,
2011 2010 2009
(Amounts in thousands)
Service cost $ 12 $ 28 $ 42Interest cost 1,782 1,940 2,493Amortization of unrecognized prior service benefit (1,558) (1,916) (1,974)Amortization of unrecognized net gain (1,463) (2,480) (2,903)
Net postretirement benefit income $ (1,227) $ (2,428) $ (2,342)
Schedule of Funded Status The following summarizes the accrued postretirement benefits liability for the postretirementmedical plans:
December 31,
2011 2010
(Amounts in thousands)
Postretirement Benefit Obligation $ 35,045 $ 39,053
Funded status $ (35,045) $ (39,053)
Schedule of AmountsRecognized in Balance Sheet
The following summarizes amounts recognized in the balance sheet for postretirementBenefit Obligation:
December 31,
2011 2010
(Amounts in thousands)
Current liabilities $ (4,278) $ (4,683)Noncurrent liabilities (30,767) (34,370)
Funded status $ (35,045) $ (39,053)
Schedule of BenefitObligations and AccumulatedBenefit Obligations
The following is a reconciliation of the postretirement Benefit Obligation:
2011 2010
(Amounts in thousands)
Balance — January 1 $ 39,053 $ 40,170Service cost 12 28Interest cost 1,782 1,940Employee contributions 2,445 2,492Medicare subsidies receivable 450 359
Copyright © 2013 www.secdatabase.com. All Rights Reserved.Please Consider the Environment Before Printing This Document

Actuarial (gain) loss (1,877) 679Net benefits and expenses paid (6,820) (6,615)
Balance — December 31 $ 35,045 $ 39,053
Schedule of Expected CashActivity
The following presents expected benefit payments for future periods (amounts in millions):
ExpectedPayments
MedicareSubsidy
2012 $ 4.4 $ 0.22013 4.1 0.22014 3.8 0.22015 3.6 0.22016 3.4 0.22017-2021 12.9 0.8
Schedule of AccumulatedOther Comprehensive Income(Loss)
The following table shows the change in accumulated other comprehensive loss attributableto the components of the net cost and the change in Benefit Obligations for postretirement benefits,net of tax:
2011 2010 2009
(Amounts in thousands)
Balance — January 1 $ 7,793 $ 10,915 $ 13,183Amortization of net gain (911) (1,525) (2,016)Amortization of prior service benefit (971) (1,179) (1,371)Net gain (loss) arising during the year 1,170 (418) 1,119
Balance — December 31 $ 7,081 $ 7,793 $ 10,915
Amounts recorded in accumulated other comprehensive loss consist of:
December 31,
2011 2010
(Amounts in thousands)
Unrecognized net gain $ 7,055 $ 6,774Unrecognized prior service benefit 26 1,019
Accumulated other comprehensive income, net of tax: $ 7,081 $ 7,793
Schedule of Effect of One-Percentage Point Change inAssumed Health Care CostTrend Rates
A one-percentage point change in assumed health care cost trend rates would have thefollowing effect on the 2011 reported amounts (in thousands):
1% Increase 1% Decrease
Effect on postretirement Benefit Obligation $ 436 $ (424)Effect on service cost plus interest cost 17 (16)
Copyright © 2013 www.secdatabase.com. All Rights Reserved.Please Consider the Environment Before Printing This Document
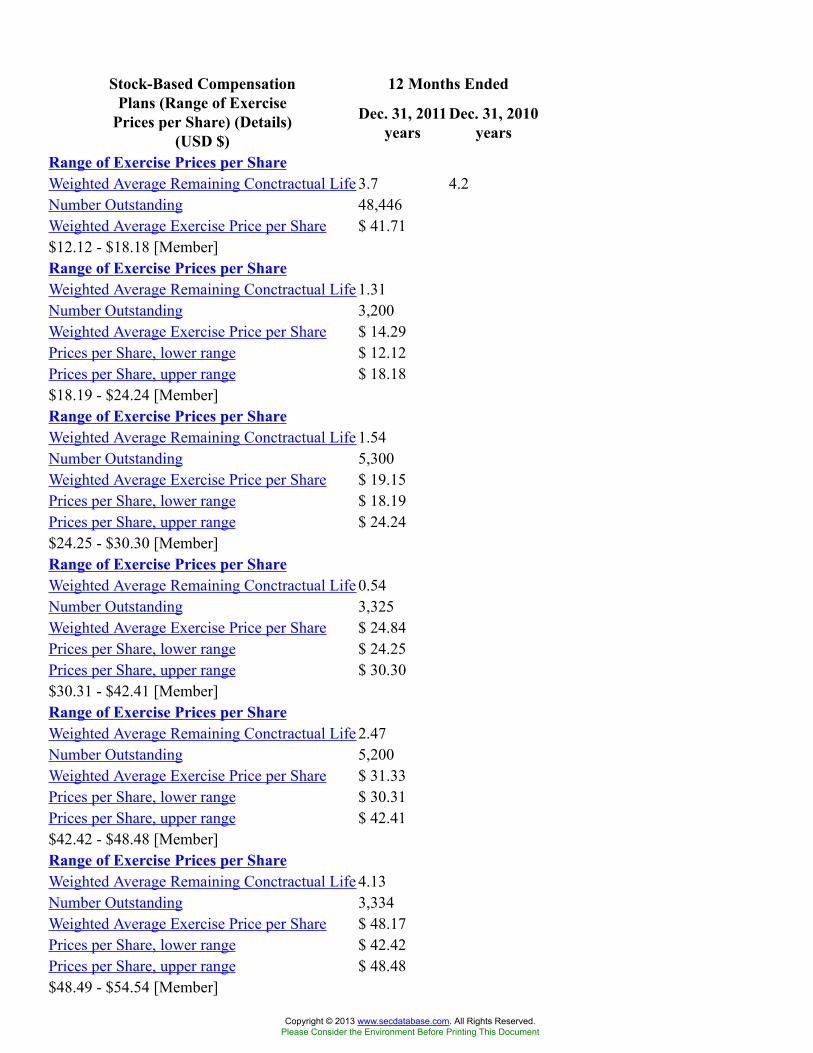
12 Months EndedStock-Based CompensationPlans (Range of Exercise
Prices per Share) (Details)(USD $)
Dec. 31, 2011years
Dec. 31, 2010years
Range of Exercise Prices per ShareWeighted Average Remaining Conctractual Life 3.7 4.2Number Outstanding 48,446Weighted Average Exercise Price per Share $ 41.71$12.12 - $18.18 [Member]Range of Exercise Prices per ShareWeighted Average Remaining Conctractual Life 1.31Number Outstanding 3,200Weighted Average Exercise Price per Share $ 14.29Prices per Share, lower range $ 12.12Prices per Share, upper range $ 18.18$18.19 - $24.24 [Member]Range of Exercise Prices per ShareWeighted Average Remaining Conctractual Life 1.54Number Outstanding 5,300Weighted Average Exercise Price per Share $ 19.15Prices per Share, lower range $ 18.19Prices per Share, upper range $ 24.24$24.25 - $30.30 [Member]Range of Exercise Prices per ShareWeighted Average Remaining Conctractual Life 0.54Number Outstanding 3,325Weighted Average Exercise Price per Share $ 24.84Prices per Share, lower range $ 24.25Prices per Share, upper range $ 30.30$30.31 - $42.41 [Member]Range of Exercise Prices per ShareWeighted Average Remaining Conctractual Life 2.47Number Outstanding 5,200Weighted Average Exercise Price per Share $ 31.33Prices per Share, lower range $ 30.31Prices per Share, upper range $ 42.41$42.42 - $48.48 [Member]Range of Exercise Prices per ShareWeighted Average Remaining Conctractual Life 4.13Number Outstanding 3,334Weighted Average Exercise Price per Share $ 48.17Prices per Share, lower range $ 42.42Prices per Share, upper range $ 48.48$48.49 - $54.54 [Member]
Copyright © 2013 www.secdatabase.com. All Rights Reserved.Please Consider the Environment Before Printing This Document
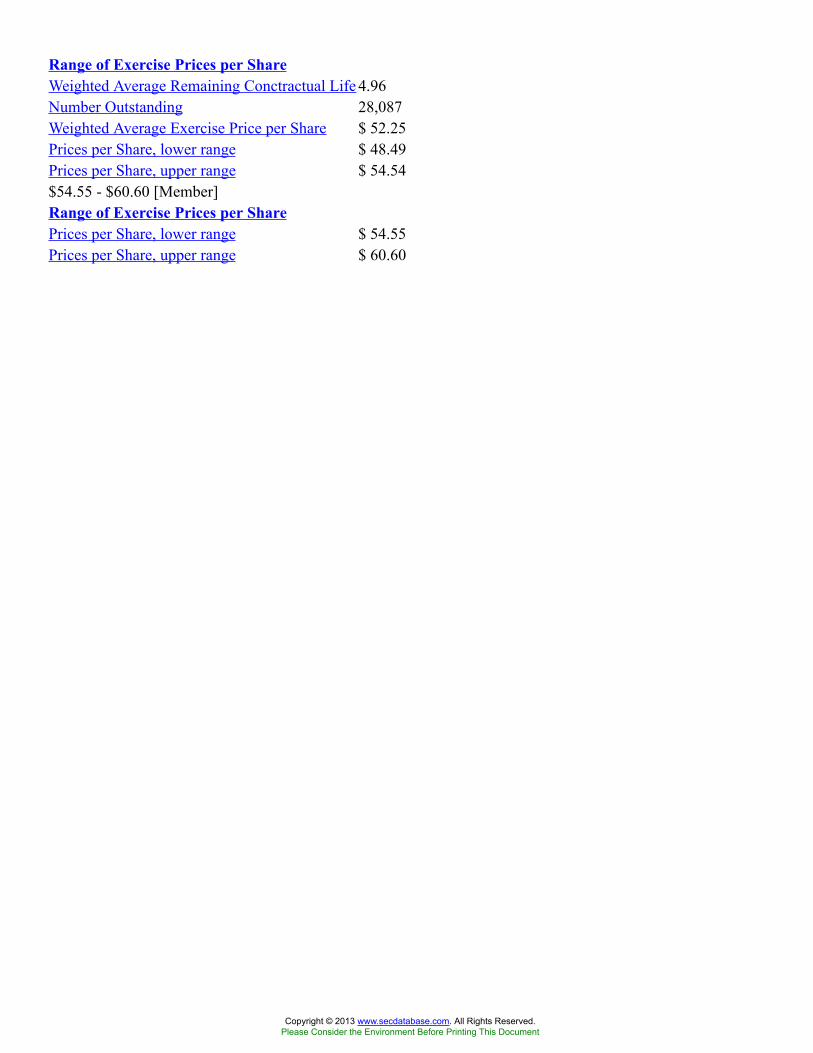
Range of Exercise Prices per ShareWeighted Average Remaining Conctractual Life 4.96Number Outstanding 28,087Weighted Average Exercise Price per Share $ 52.25Prices per Share, lower range $ 48.49Prices per Share, upper range $ 54.54$54.55 - $60.60 [Member]Range of Exercise Prices per SharePrices per Share, lower range $ 54.55Prices per Share, upper range $ 60.60
Copyright © 2013 www.secdatabase.com. All Rights Reserved.Please Consider the Environment Before Printing This Document
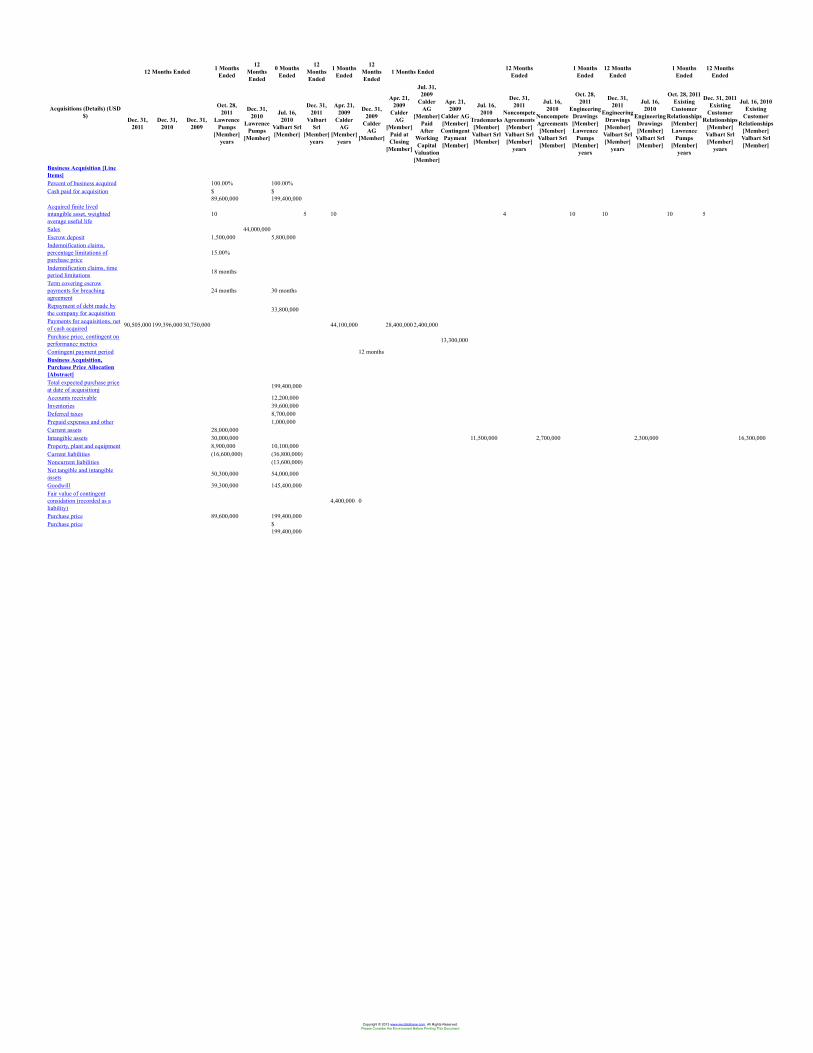
12 Months Ended 1 MonthsEnded
12MonthsEnded
0 MonthsEnded
12MonthsEnded
1 MonthsEnded
12MonthsEnded
1 Months Ended 12 MonthsEnded
1 MonthsEnded
12 MonthsEnded
1 MonthsEnded
12 MonthsEnded
Acquisitions (Details) (USD$) Dec. 31,
2011Dec. 31,
2010Dec. 31,
2009
Oct. 28,2011
LawrencePumps
[Member]years
Dec. 31,2010
LawrencePumps
[Member]
Jul. 16,2010
Valbart Srl[Member]
Dec. 31,2011
ValbartSrl
[Member]years
Apr. 21,2009
CalderAG
[Member]years
Dec. 31,2009
CalderAG
[Member]
Apr. 21,2009
CalderAG
[Member]Paid atClosing
[Member]
Jul. 31,2009
CalderAG
[Member]PaidAfter
WorkingCapital
Valuation[Member]
Apr. 21,2009
Calder AG[Member]Contingent
Payment[Member]
Jul. 16,2010
Trademarks[Member]Valbart Srl[Member]
Dec. 31,2011
NoncompeteAgreements[Member]Valbart Srl[Member]
years
Jul. 16,2010
NoncompeteAgreements[Member]Valbart Srl[Member]
Oct. 28,2011
EngineeringDrawings[Member]Lawrence
Pumps[Member]
years
Dec. 31,2011
EngineeringDrawings[Member]Valbart Srl[Member]
years
Jul. 16,2010
EngineeringDrawings[Member]Valbart Srl[Member]
Oct. 28, 2011Existing
CustomerRelationships
[Member]Lawrence
Pumps[Member]
years
Dec. 31, 2011Existing
CustomerRelationships
[Member]Valbart Srl[Member]
years
Jul. 16, 2010Existing
CustomerRelationships
[Member]Valbart Srl[Member]
Business Acquisition [LineItems]Percent of business acquired 100.00% 100.00%Cash paid for acquisition $
89,600,000$199,400,000
Acquired finite livedintangible asset, weightedaverage useful life
10 5 10 4 10 10 10 5
Sales 44,000,000Escrow deposit 1,500,000 5,800,000Indemnification claims,percentage limitations ofpurchase price
15.00%
Indemnification claims, timeperiod limitations 18 months
Term covering escrowpayments for breachingagreement
24 months 30 months
Repayment of debt made bythe company for acquisition 33,800,000
Payments for acquisitions, netof cash acquired 90,505,000199,396,00030,750,000 44,100,000 28,400,0002,400,000
Purchase price, contingent onperformance metrics 13,300,000
Contingent payment period 12 monthsBusiness Acquisition,Purchase Price Allocation[Abstract]Total expected purchase priceat date of acquisitionj 199,400,000
Accounts receivable 12,200,000Inventories 39,600,000Deferred taxes 8,700,000Prepaid expenses and other 1,000,000Current assets 28,000,000Intangible assets 30,000,000 11,500,000 2,700,000 2,300,000 16,300,000Property, plant and equipment 8,900,000 10,100,000Current liabilities (16,600,000) (36,800,000)Noncurrent liabilities (13,600,000)Net tangible and intangibleassets 50,300,000 54,000,000
Goodwill 39,300,000 145,400,000Fair value of contingentconsidation (recorded as aliability)
4,400,000 0
Purchase price 89,600,000 199,400,000Purchase price $
199,400,000
Copyright © 2013 www.secdatabase.com. All Rights Reserved.Please Consider the Environment Before Printing This Document
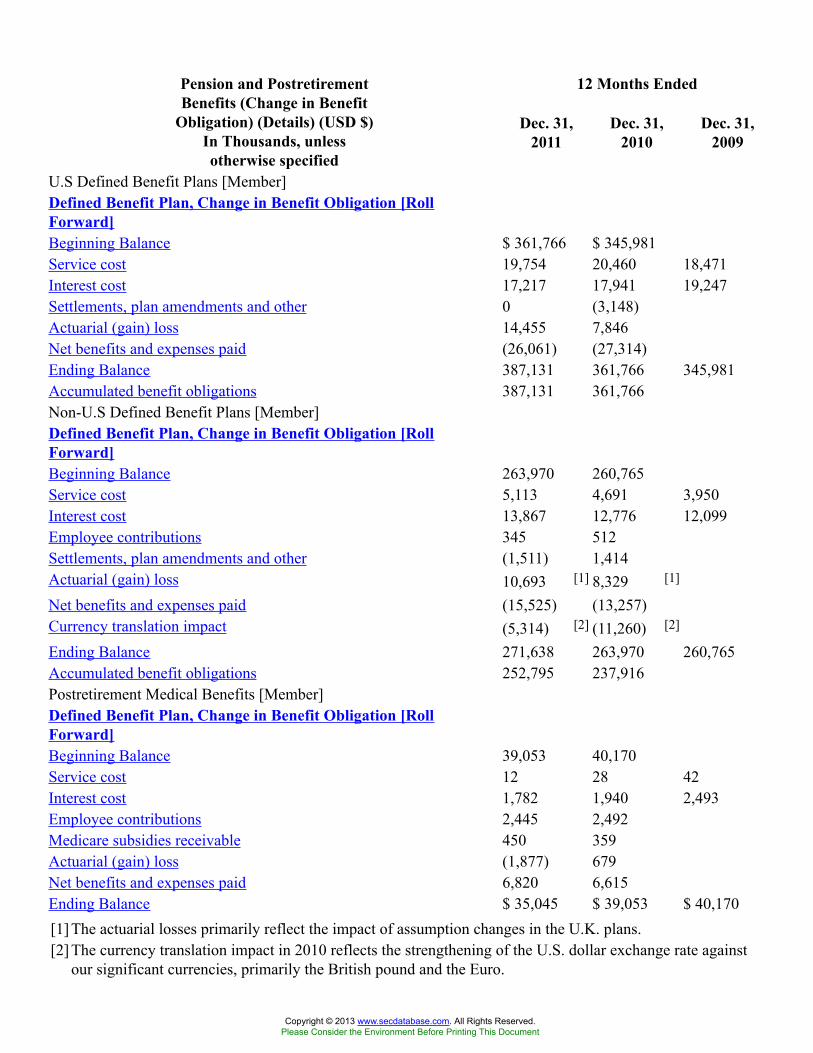
12 Months EndedPension and PostretirementBenefits (Change in Benefit
Obligation) (Details) (USD $)In Thousands, unlessotherwise specified
Dec. 31,2011
Dec. 31,2010
Dec. 31,2009
U.S Defined Benefit Plans [Member]Defined Benefit Plan, Change in Benefit Obligation [RollForward]Beginning Balance $ 361,766 $ 345,981Service cost 19,754 20,460 18,471Interest cost 17,217 17,941 19,247Settlements, plan amendments and other 0 (3,148)Actuarial (gain) loss 14,455 7,846Net benefits and expenses paid (26,061) (27,314)Ending Balance 387,131 361,766 345,981Accumulated benefit obligations 387,131 361,766Non-U.S Defined Benefit Plans [Member]Defined Benefit Plan, Change in Benefit Obligation [RollForward]Beginning Balance 263,970 260,765Service cost 5,113 4,691 3,950Interest cost 13,867 12,776 12,099Employee contributions 345 512Settlements, plan amendments and other (1,511) 1,414Actuarial (gain) loss 10,693 [1] 8,329 [1]
Net benefits and expenses paid (15,525) (13,257)Currency translation impact (5,314) [2] (11,260) [2]
Ending Balance 271,638 263,970 260,765Accumulated benefit obligations 252,795 237,916Postretirement Medical Benefits [Member]Defined Benefit Plan, Change in Benefit Obligation [RollForward]Beginning Balance 39,053 40,170Service cost 12 28 42Interest cost 1,782 1,940 2,493Employee contributions 2,445 2,492Medicare subsidies receivable 450 359Actuarial (gain) loss (1,877) 679Net benefits and expenses paid 6,820 6,615Ending Balance $ 35,045 $ 39,053 $ 40,170[1] The actuarial losses primarily reflect the impact of assumption changes in the U.K. plans.[2] The currency translation impact in 2010 reflects the strengthening of the U.S. dollar exchange rate against
our significant currencies, primarily the British pound and the Euro.
Copyright © 2013 www.secdatabase.com. All Rights Reserved.Please Consider the Environment Before Printing This Document
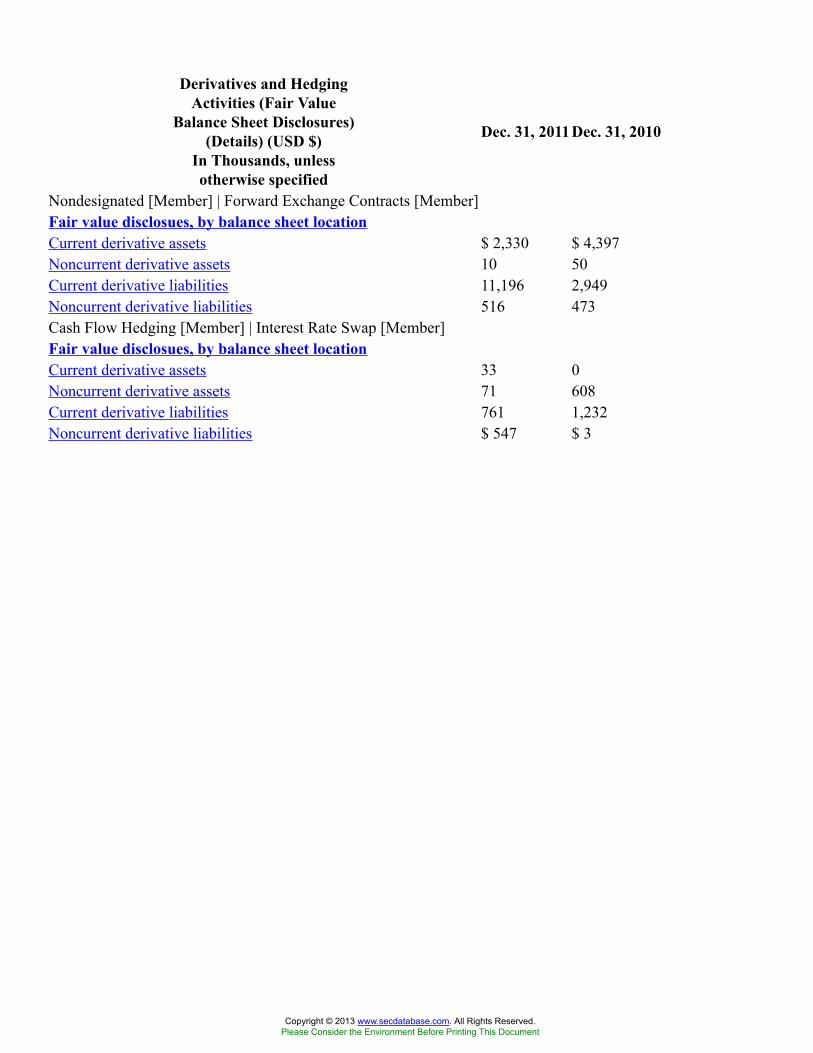
Derivatives and HedgingActivities (Fair Value
Balance Sheet Disclosures)(Details) (USD $)
In Thousands, unlessotherwise specified
Dec. 31, 2011Dec. 31, 2010
Nondesignated [Member] | Forward Exchange Contracts [Member]Fair value disclosues, by balance sheet locationCurrent derivative assets $ 2,330 $ 4,397Noncurrent derivative assets 10 50Current derivative liabilities 11,196 2,949Noncurrent derivative liabilities 516 473Cash Flow Hedging [Member] | Interest Rate Swap [Member]Fair value disclosues, by balance sheet locationCurrent derivative assets 33 0Noncurrent derivative assets 71 608Current derivative liabilities 761 1,232Noncurrent derivative liabilities $ 547 $ 3
Copyright © 2013 www.secdatabase.com. All Rights Reserved.Please Consider the Environment Before Printing This Document

12 Months Ended 3 Months Ended
Shareholders' Equity(Details) (USD $) Dec. 31,
2011Dec. 31,
2010Dec. 31,
2009Dec. 15,
2011Sep. 12,
2011
Feb.21,
2011
Feb.22,
2010
Feb. 27,2008
Feb. 20,2012
DividendDeclared
[Member]
Dec. 31,2011
ShareRepurchase
Program2008
[Member]
Dec. 31,2011
ShareRepurchase
Program2011
[Member]Shareholders' Equity [LineItems]Dividends on Common Stock,minimum
$0.29
$0.27 $ 0.32
Dividends on Common Stock,maximum
$0.32
$0.29 $ 0.36
Repurchase of shares 1,482,833 450,000 544,500Repurchases of shares, value $
150,000,000$46,016,000
$40,955,000 $ 7,300,000 $
101,600,000Maximum value of sharesauthorized to be repurchasedunder share repurchaseprogram
300,000,000 300,000,000
Approved replenishment forstock repurchases 300,000,000
Remaining authorizedrepuchase capacity 300,000,000
Number of shares repurchasedto date 4,218,433
Shares repurchased to date,value
$401,900,000
Copyright © 2013 www.secdatabase.com. All Rights Reserved.Please Consider the Environment Before Printing This Document
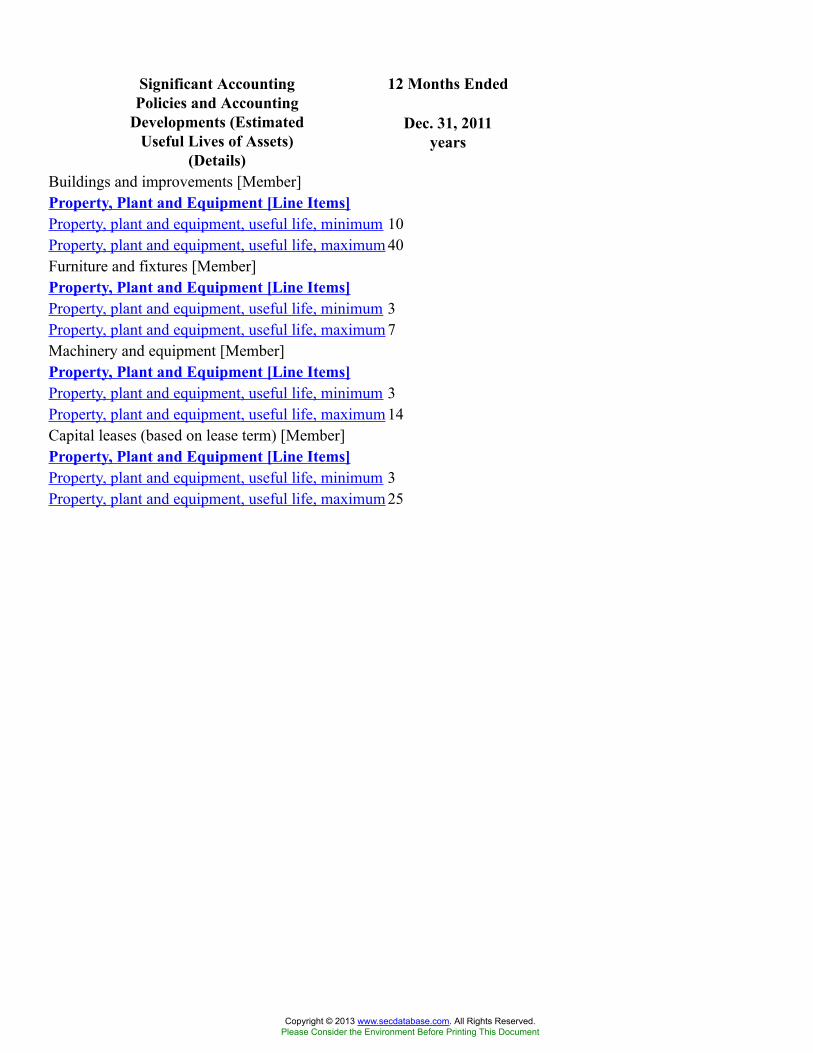
12 Months EndedSignificant AccountingPolicies and Accounting
Developments (EstimatedUseful Lives of Assets)
(Details)
Dec. 31, 2011years
Buildings and improvements [Member]Property, Plant and Equipment [Line Items]Property, plant and equipment, useful life, minimum 10Property, plant and equipment, useful life, maximum 40Furniture and fixtures [Member]Property, Plant and Equipment [Line Items]Property, plant and equipment, useful life, minimum 3Property, plant and equipment, useful life, maximum 7Machinery and equipment [Member]Property, Plant and Equipment [Line Items]Property, plant and equipment, useful life, minimum 3Property, plant and equipment, useful life, maximum 14Capital leases (based on lease term) [Member]Property, Plant and Equipment [Line Items]Property, plant and equipment, useful life, minimum 3Property, plant and equipment, useful life, maximum 25
Copyright © 2013 www.secdatabase.com. All Rights Reserved.Please Consider the Environment Before Printing This Document
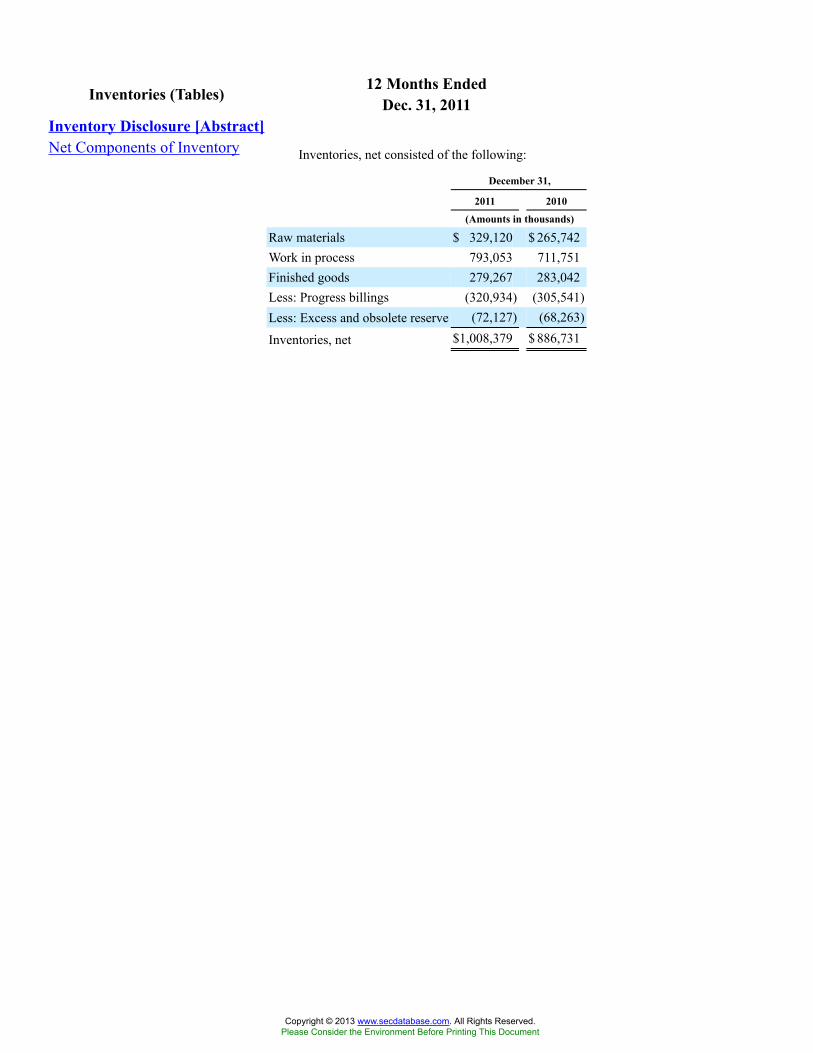
12 Months EndedInventories (Tables) Dec. 31, 2011Inventory Disclosure [Abstract]Net Components of Inventory Inventories, net consisted of the following:
December 31,
2011 2010
(Amounts in thousands)
Raw materials $ 329,120 $ 265,742Work in process 793,053 711,751Finished goods 279,267 283,042Less: Progress billings (320,934) (305,541)Less: Excess and obsolete reserve (72,127) (68,263)
Inventories, net $1,008,379 $ 886,731
Copyright © 2013 www.secdatabase.com. All Rights Reserved.Please Consider the Environment Before Printing This Document
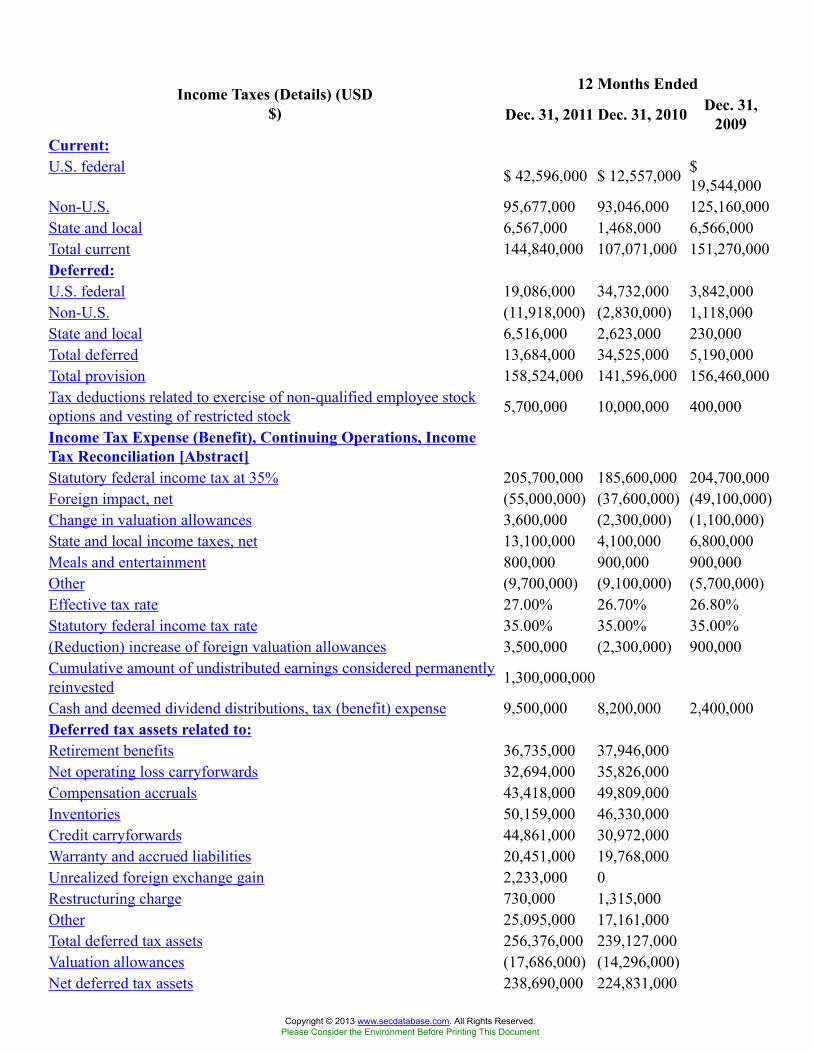
12 Months EndedIncome Taxes (Details) (USD$) Dec. 31, 2011 Dec. 31, 2010 Dec. 31,
2009Current:U.S. federal $ 42,596,000 $ 12,557,000 $
19,544,000Non-U.S. 95,677,000 93,046,000 125,160,000State and local 6,567,000 1,468,000 6,566,000Total current 144,840,000 107,071,000 151,270,000Deferred:U.S. federal 19,086,000 34,732,000 3,842,000Non-U.S. (11,918,000) (2,830,000) 1,118,000State and local 6,516,000 2,623,000 230,000Total deferred 13,684,000 34,525,000 5,190,000Total provision 158,524,000 141,596,000 156,460,000Tax deductions related to exercise of non-qualified employee stockoptions and vesting of restricted stock 5,700,000 10,000,000 400,000
Income Tax Expense (Benefit), Continuing Operations, IncomeTax Reconciliation [Abstract]Statutory federal income tax at 35% 205,700,000 185,600,000 204,700,000Foreign impact, net (55,000,000) (37,600,000) (49,100,000)Change in valuation allowances 3,600,000 (2,300,000) (1,100,000)State and local income taxes, net 13,100,000 4,100,000 6,800,000Meals and entertainment 800,000 900,000 900,000Other (9,700,000) (9,100,000) (5,700,000)Effective tax rate 27.00% 26.70% 26.80%Statutory federal income tax rate 35.00% 35.00% 35.00%(Reduction) increase of foreign valuation allowances 3,500,000 (2,300,000) 900,000Cumulative amount of undistributed earnings considered permanentlyreinvested 1,300,000,000
Cash and deemed dividend distributions, tax (benefit) expense 9,500,000 8,200,000 2,400,000Deferred tax assets related to:Retirement benefits 36,735,000 37,946,000Net operating loss carryforwards 32,694,000 35,826,000Compensation accruals 43,418,000 49,809,000Inventories 50,159,000 46,330,000Credit carryforwards 44,861,000 30,972,000Warranty and accrued liabilities 20,451,000 19,768,000Unrealized foreign exchange gain 2,233,000 0Restructuring charge 730,000 1,315,000Other 25,095,000 17,161,000Total deferred tax assets 256,376,000 239,127,000Valuation allowances (17,686,000) (14,296,000)Net deferred tax assets 238,690,000 224,831,000
Copyright © 2013 www.secdatabase.com. All Rights Reserved.Please Consider the Environment Before Printing This Document
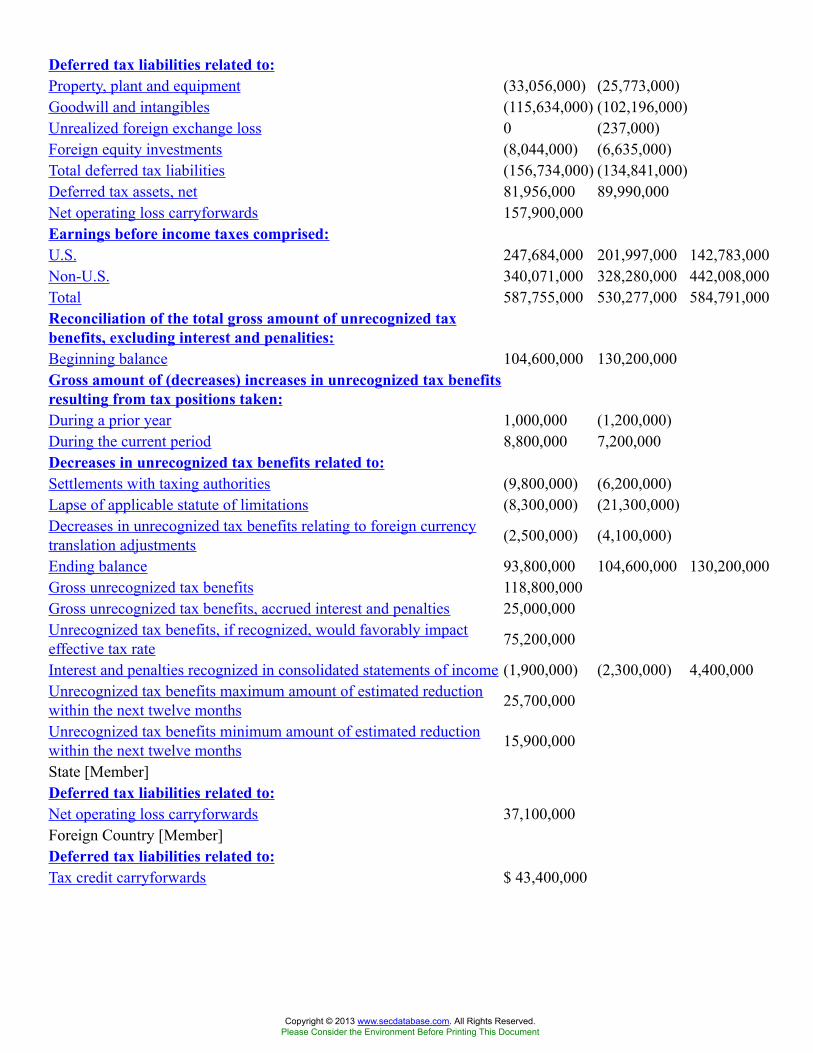
Deferred tax liabilities related to:Property, plant and equipment (33,056,000) (25,773,000)Goodwill and intangibles (115,634,000) (102,196,000)Unrealized foreign exchange loss 0 (237,000)Foreign equity investments (8,044,000) (6,635,000)Total deferred tax liabilities (156,734,000) (134,841,000)Deferred tax assets, net 81,956,000 89,990,000Net operating loss carryforwards 157,900,000Earnings before income taxes comprised:U.S. 247,684,000 201,997,000 142,783,000Non-U.S. 340,071,000 328,280,000 442,008,000Total 587,755,000 530,277,000 584,791,000Reconciliation of the total gross amount of unrecognized taxbenefits, excluding interest and penalities:Beginning balance 104,600,000 130,200,000Gross amount of (decreases) increases in unrecognized tax benefitsresulting from tax positions taken:During a prior year 1,000,000 (1,200,000)During the current period 8,800,000 7,200,000Decreases in unrecognized tax benefits related to:Settlements with taxing authorities (9,800,000) (6,200,000)Lapse of applicable statute of limitations (8,300,000) (21,300,000)Decreases in unrecognized tax benefits relating to foreign currencytranslation adjustments (2,500,000) (4,100,000)
Ending balance 93,800,000 104,600,000 130,200,000Gross unrecognized tax benefits 118,800,000Gross unrecognized tax benefits, accrued interest and penalties 25,000,000Unrecognized tax benefits, if recognized, would favorably impacteffective tax rate 75,200,000
Interest and penalties recognized in consolidated statements of income (1,900,000) (2,300,000) 4,400,000Unrecognized tax benefits maximum amount of estimated reductionwithin the next twelve months 25,700,000
Unrecognized tax benefits minimum amount of estimated reductionwithin the next twelve months 15,900,000
State [Member]Deferred tax liabilities related to:Net operating loss carryforwards 37,100,000Foreign Country [Member]Deferred tax liabilities related to:Tax credit carryforwards $ 43,400,000
Copyright © 2013 www.secdatabase.com. All Rights Reserved.Please Consider the Environment Before Printing This Document
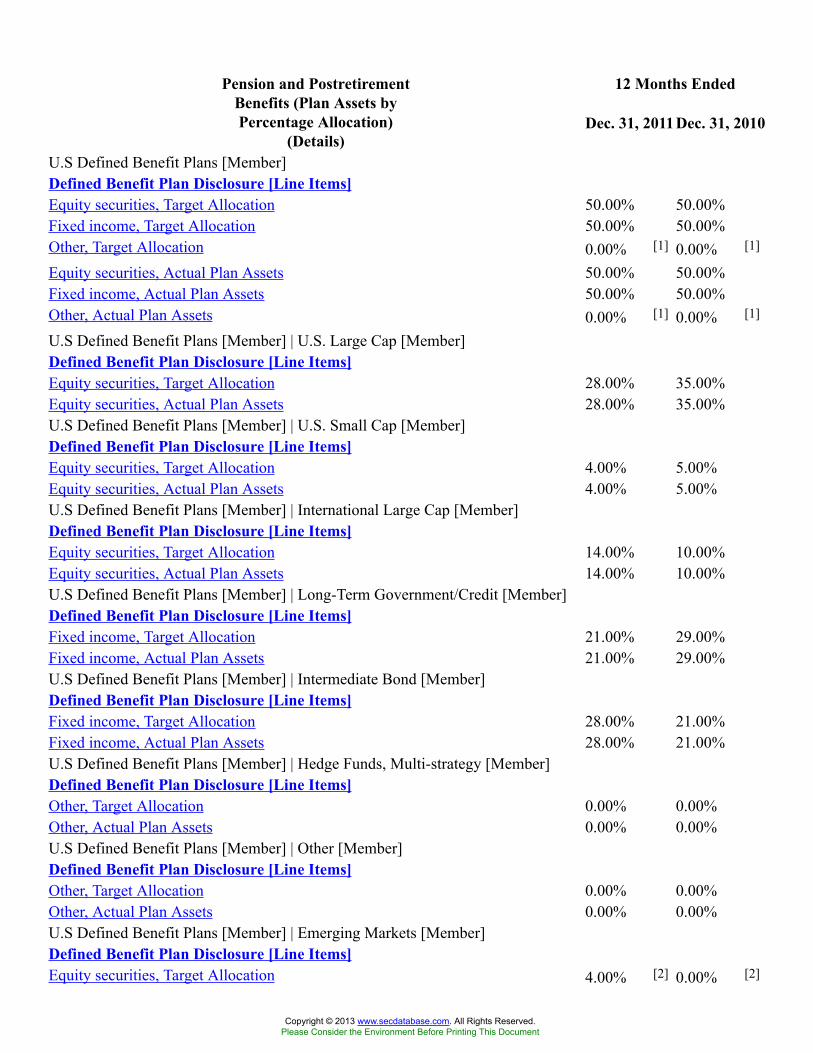
12 Months EndedPension and PostretirementBenefits (Plan Assets byPercentage Allocation)
(Details)Dec. 31, 2011Dec. 31, 2010
U.S Defined Benefit Plans [Member]Defined Benefit Plan Disclosure [Line Items]Equity securities, Target Allocation 50.00% 50.00%Fixed income, Target Allocation 50.00% 50.00%Other, Target Allocation 0.00% [1] 0.00% [1]
Equity securities, Actual Plan Assets 50.00% 50.00%Fixed income, Actual Plan Assets 50.00% 50.00%Other, Actual Plan Assets 0.00% [1] 0.00% [1]
U.S Defined Benefit Plans [Member] | U.S. Large Cap [Member]Defined Benefit Plan Disclosure [Line Items]Equity securities, Target Allocation 28.00% 35.00%Equity securities, Actual Plan Assets 28.00% 35.00%U.S Defined Benefit Plans [Member] | U.S. Small Cap [Member]Defined Benefit Plan Disclosure [Line Items]Equity securities, Target Allocation 4.00% 5.00%Equity securities, Actual Plan Assets 4.00% 5.00%U.S Defined Benefit Plans [Member] | International Large Cap [Member]Defined Benefit Plan Disclosure [Line Items]Equity securities, Target Allocation 14.00% 10.00%Equity securities, Actual Plan Assets 14.00% 10.00%U.S Defined Benefit Plans [Member] | Long-Term Government/Credit [Member]Defined Benefit Plan Disclosure [Line Items]Fixed income, Target Allocation 21.00% 29.00%Fixed income, Actual Plan Assets 21.00% 29.00%U.S Defined Benefit Plans [Member] | Intermediate Bond [Member]Defined Benefit Plan Disclosure [Line Items]Fixed income, Target Allocation 28.00% 21.00%Fixed income, Actual Plan Assets 28.00% 21.00%U.S Defined Benefit Plans [Member] | Hedge Funds, Multi-strategy [Member]Defined Benefit Plan Disclosure [Line Items]Other, Target Allocation 0.00% 0.00%Other, Actual Plan Assets 0.00% 0.00%U.S Defined Benefit Plans [Member] | Other [Member]Defined Benefit Plan Disclosure [Line Items]Other, Target Allocation 0.00% 0.00%Other, Actual Plan Assets 0.00% 0.00%U.S Defined Benefit Plans [Member] | Emerging Markets [Member]Defined Benefit Plan Disclosure [Line Items]Equity securities, Target Allocation 4.00% [2] 0.00% [2]
Copyright © 2013 www.secdatabase.com. All Rights Reserved.Please Consider the Environment Before Printing This Document
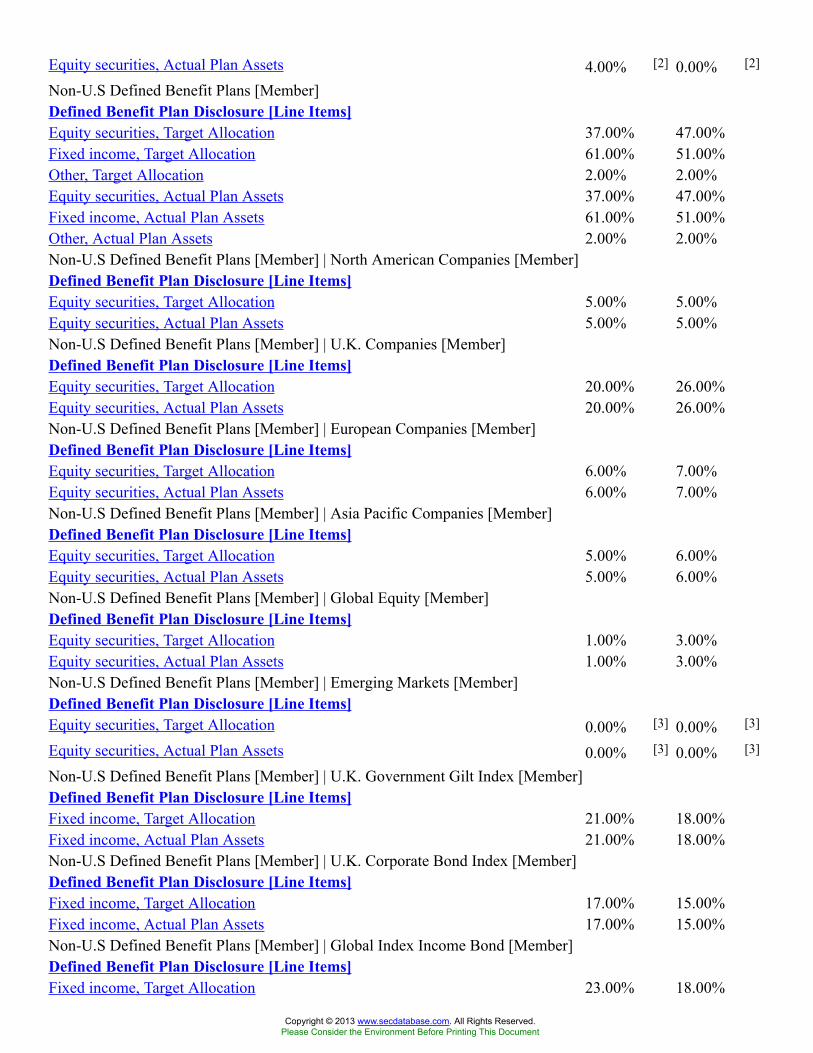
Equity securities, Actual Plan Assets 4.00% [2] 0.00% [2]
Non-U.S Defined Benefit Plans [Member]Defined Benefit Plan Disclosure [Line Items]Equity securities, Target Allocation 37.00% 47.00%Fixed income, Target Allocation 61.00% 51.00%Other, Target Allocation 2.00% 2.00%Equity securities, Actual Plan Assets 37.00% 47.00%Fixed income, Actual Plan Assets 61.00% 51.00%Other, Actual Plan Assets 2.00% 2.00%Non-U.S Defined Benefit Plans [Member] | North American Companies [Member]Defined Benefit Plan Disclosure [Line Items]Equity securities, Target Allocation 5.00% 5.00%Equity securities, Actual Plan Assets 5.00% 5.00%Non-U.S Defined Benefit Plans [Member] | U.K. Companies [Member]Defined Benefit Plan Disclosure [Line Items]Equity securities, Target Allocation 20.00% 26.00%Equity securities, Actual Plan Assets 20.00% 26.00%Non-U.S Defined Benefit Plans [Member] | European Companies [Member]Defined Benefit Plan Disclosure [Line Items]Equity securities, Target Allocation 6.00% 7.00%Equity securities, Actual Plan Assets 6.00% 7.00%Non-U.S Defined Benefit Plans [Member] | Asia Pacific Companies [Member]Defined Benefit Plan Disclosure [Line Items]Equity securities, Target Allocation 5.00% 6.00%Equity securities, Actual Plan Assets 5.00% 6.00%Non-U.S Defined Benefit Plans [Member] | Global Equity [Member]Defined Benefit Plan Disclosure [Line Items]Equity securities, Target Allocation 1.00% 3.00%Equity securities, Actual Plan Assets 1.00% 3.00%Non-U.S Defined Benefit Plans [Member] | Emerging Markets [Member]Defined Benefit Plan Disclosure [Line Items]Equity securities, Target Allocation 0.00% [3] 0.00% [3]
Equity securities, Actual Plan Assets 0.00% [3] 0.00% [3]
Non-U.S Defined Benefit Plans [Member] | U.K. Government Gilt Index [Member]Defined Benefit Plan Disclosure [Line Items]Fixed income, Target Allocation 21.00% 18.00%Fixed income, Actual Plan Assets 21.00% 18.00%Non-U.S Defined Benefit Plans [Member] | U.K. Corporate Bond Index [Member]Defined Benefit Plan Disclosure [Line Items]Fixed income, Target Allocation 17.00% 15.00%Fixed income, Actual Plan Assets 17.00% 15.00%Non-U.S Defined Benefit Plans [Member] | Global Index Income Bond [Member]Defined Benefit Plan Disclosure [Line Items]Fixed income, Target Allocation 23.00% 18.00%
Copyright © 2013 www.secdatabase.com. All Rights Reserved.Please Consider the Environment Before Printing This Document

Fixed income, Actual Plan Assets 23.00% 18.00%[1] Less than 1% of holdings are in the Other category in 2011 and 2010.[2] Less than 1% of holdings are in the Emerging Markets category in 2010.[3] Less than 1% of holdings are in the Emerging Markets category in 2010
Copyright © 2013 www.secdatabase.com. All Rights Reserved.Please Consider the Environment Before Printing This Document
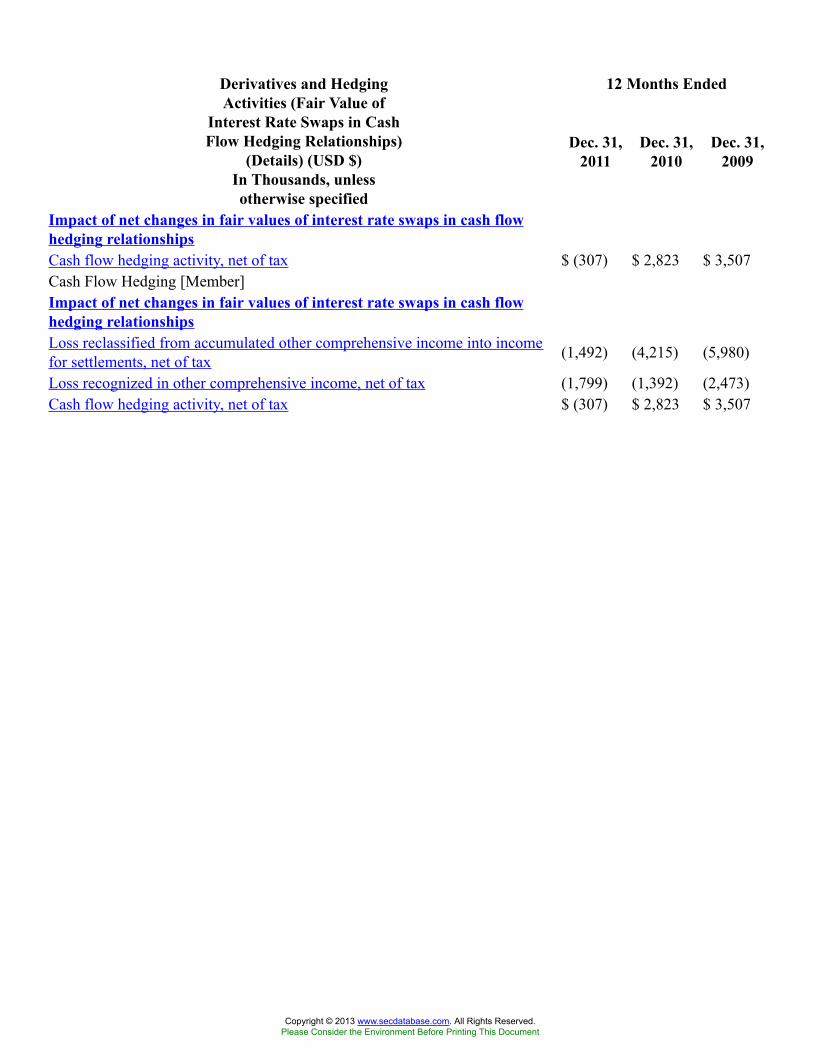
12 Months EndedDerivatives and HedgingActivities (Fair Value of
Interest Rate Swaps in CashFlow Hedging Relationships)
(Details) (USD $)In Thousands, unlessotherwise specified
Dec. 31,2011
Dec. 31,2010
Dec. 31,2009
Impact of net changes in fair values of interest rate swaps in cash flowhedging relationshipsCash flow hedging activity, net of tax $ (307) $ 2,823 $ 3,507Cash Flow Hedging [Member]Impact of net changes in fair values of interest rate swaps in cash flowhedging relationshipsLoss reclassified from accumulated other comprehensive income into incomefor settlements, net of tax (1,492) (4,215) (5,980)
Loss recognized in other comprehensive income, net of tax (1,799) (1,392) (2,473)Cash flow hedging activity, net of tax $ (307) $ 2,823 $ 3,507
Copyright © 2013 www.secdatabase.com. All Rights Reserved.Please Consider the Environment Before Printing This Document
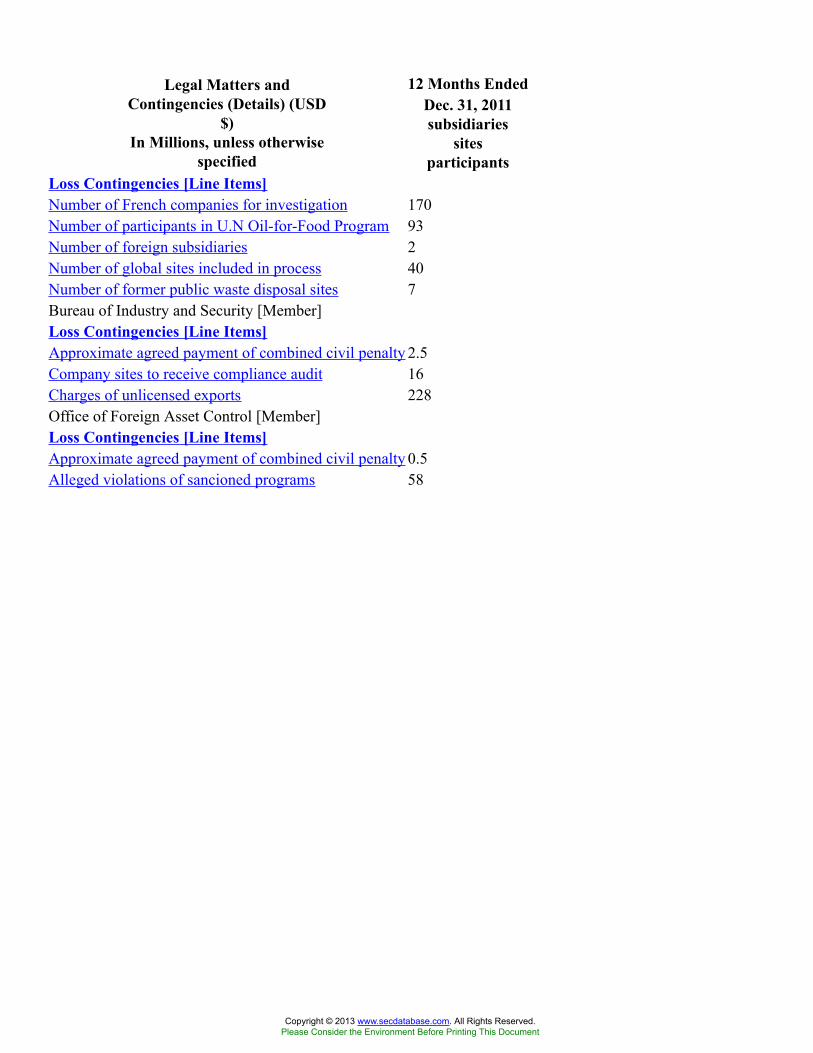
12 Months EndedLegal Matters andContingencies (Details) (USD
$)In Millions, unless otherwise
specified
Dec. 31, 2011subsidiaries
sitesparticipants
Loss Contingencies [Line Items]Number of French companies for investigation 170Number of participants in U.N Oil-for-Food Program 93Number of foreign subsidiaries 2Number of global sites included in process 40Number of former public waste disposal sites 7Bureau of Industry and Security [Member]Loss Contingencies [Line Items]Approximate agreed payment of combined civil penalty 2.5Company sites to receive compliance audit 16Charges of unlicensed exports 228Office of Foreign Asset Control [Member]Loss Contingencies [Line Items]Approximate agreed payment of combined civil penalty 0.5Alleged violations of sancioned programs 58
Copyright © 2013 www.secdatabase.com. All Rights Reserved.Please Consider the Environment Before Printing This Document
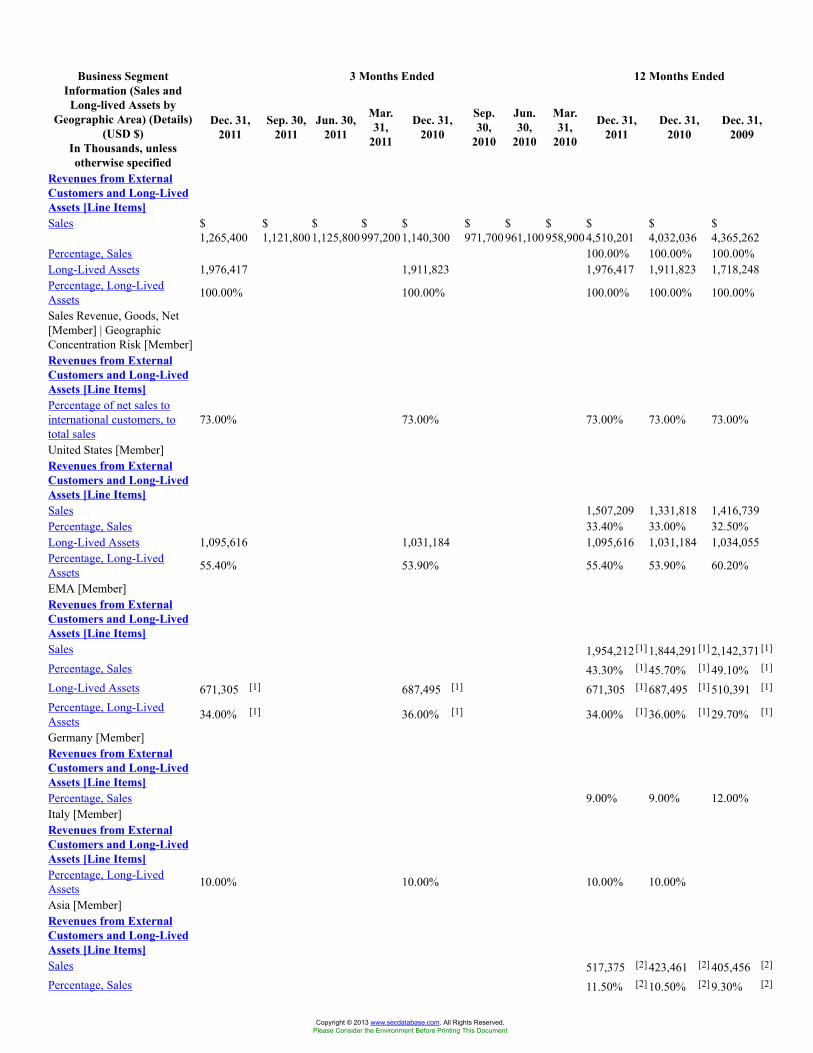
3 Months Ended 12 Months EndedBusiness SegmentInformation (Sales andLong-lived Assets by
Geographic Area) (Details)(USD $)
In Thousands, unlessotherwise specified
Dec. 31,2011
Sep. 30,2011
Jun. 30,2011
Mar.31,
2011
Dec. 31,2010
Sep.30,
2010
Jun.30,
2010
Mar.31,
2010
Dec. 31,2011
Dec. 31,2010
Dec. 31,2009
Revenues from ExternalCustomers and Long-LivedAssets [Line Items]Sales $
1,265,400$1,121,800
$1,125,800
$997,200
$1,140,300
$971,700
$961,100
$958,900
$4,510,201
$4,032,036
$4,365,262
Percentage, Sales 100.00% 100.00% 100.00%Long-Lived Assets 1,976,417 1,911,823 1,976,417 1,911,823 1,718,248Percentage, Long-LivedAssets 100.00% 100.00% 100.00% 100.00% 100.00%
Sales Revenue, Goods, Net[Member] | GeographicConcentration Risk [Member]Revenues from ExternalCustomers and Long-LivedAssets [Line Items]Percentage of net sales tointernational customers, tototal sales
73.00% 73.00% 73.00% 73.00% 73.00%
United States [Member]Revenues from ExternalCustomers and Long-LivedAssets [Line Items]Sales 1,507,209 1,331,818 1,416,739Percentage, Sales 33.40% 33.00% 32.50%Long-Lived Assets 1,095,616 1,031,184 1,095,616 1,031,184 1,034,055Percentage, Long-LivedAssets 55.40% 53.90% 55.40% 53.90% 60.20%
EMA [Member]Revenues from ExternalCustomers and Long-LivedAssets [Line Items]Sales 1,954,212 [1] 1,844,291 [1] 2,142,371 [1]
Percentage, Sales 43.30% [1] 45.70% [1] 49.10% [1]
Long-Lived Assets 671,305 [1] 687,495 [1] 671,305 [1] 687,495 [1] 510,391 [1]
Percentage, Long-LivedAssets 34.00% [1] 36.00% [1] 34.00% [1] 36.00% [1] 29.70% [1]
Germany [Member]Revenues from ExternalCustomers and Long-LivedAssets [Line Items]Percentage, Sales 9.00% 9.00% 12.00%Italy [Member]Revenues from ExternalCustomers and Long-LivedAssets [Line Items]Percentage, Long-LivedAssets 10.00% 10.00% 10.00% 10.00%
Asia [Member]Revenues from ExternalCustomers and Long-LivedAssets [Line Items]Sales 517,375 [2] 423,461 [2] 405,456 [2]
Percentage, Sales 11.50% [2] 10.50% [2] 9.30% [2]
Copyright © 2013 www.secdatabase.com. All Rights Reserved.Please Consider the Environment Before Printing This Document
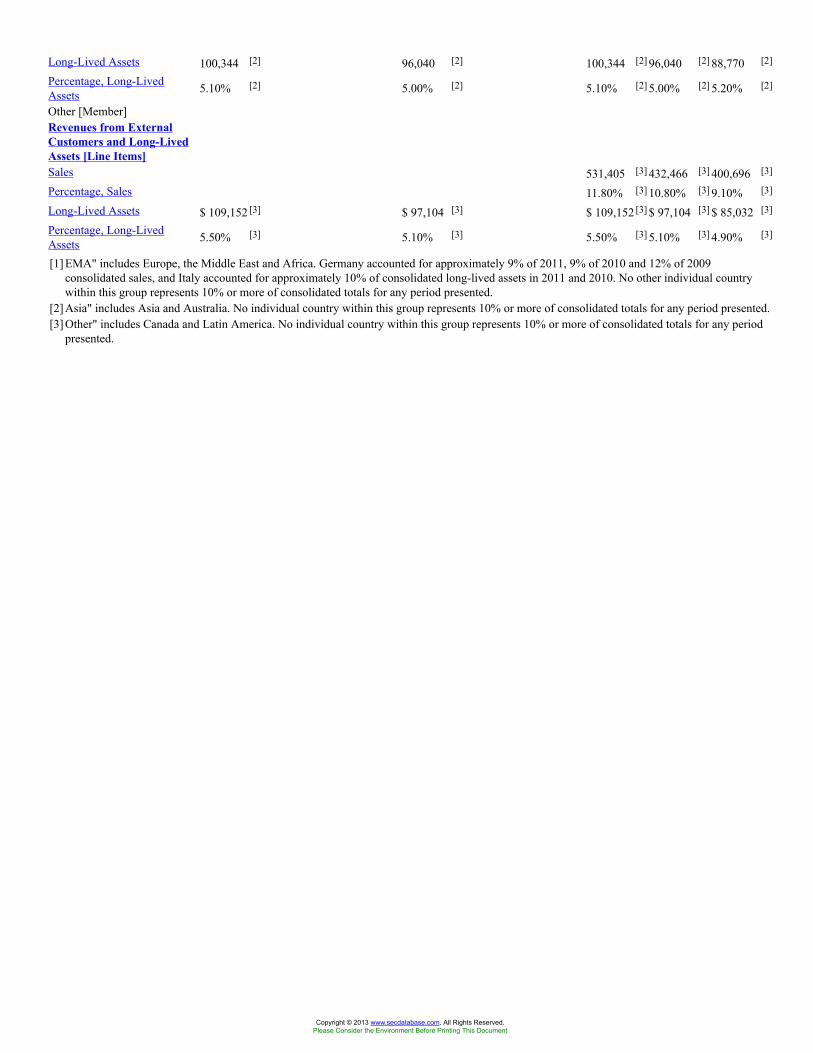
Long-Lived Assets 100,344 [2] 96,040 [2] 100,344 [2] 96,040 [2] 88,770 [2]
Percentage, Long-LivedAssets 5.10% [2] 5.00% [2] 5.10% [2] 5.00% [2] 5.20% [2]
Other [Member]Revenues from ExternalCustomers and Long-LivedAssets [Line Items]Sales 531,405 [3] 432,466 [3] 400,696 [3]
Percentage, Sales 11.80% [3] 10.80% [3] 9.10% [3]
Long-Lived Assets $ 109,152 [3] $ 97,104 [3] $ 109,152 [3] $ 97,104 [3] $ 85,032 [3]
Percentage, Long-LivedAssets 5.50% [3] 5.10% [3] 5.50% [3] 5.10% [3] 4.90% [3]
[1] EMA" includes Europe, the Middle East and Africa. Germany accounted for approximately 9% of 2011, 9% of 2010 and 12% of 2009consolidated sales, and Italy accounted for approximately 10% of consolidated long-lived assets in 2011 and 2010. No other individual countrywithin this group represents 10% or more of consolidated totals for any period presented.
[2] Asia" includes Asia and Australia. No individual country within this group represents 10% or more of consolidated totals for any period presented.[3] Other" includes Canada and Latin America. No individual country within this group represents 10% or more of consolidated totals for any period
presented.
Copyright © 2013 www.secdatabase.com. All Rights Reserved.Please Consider the Environment Before Printing This Document
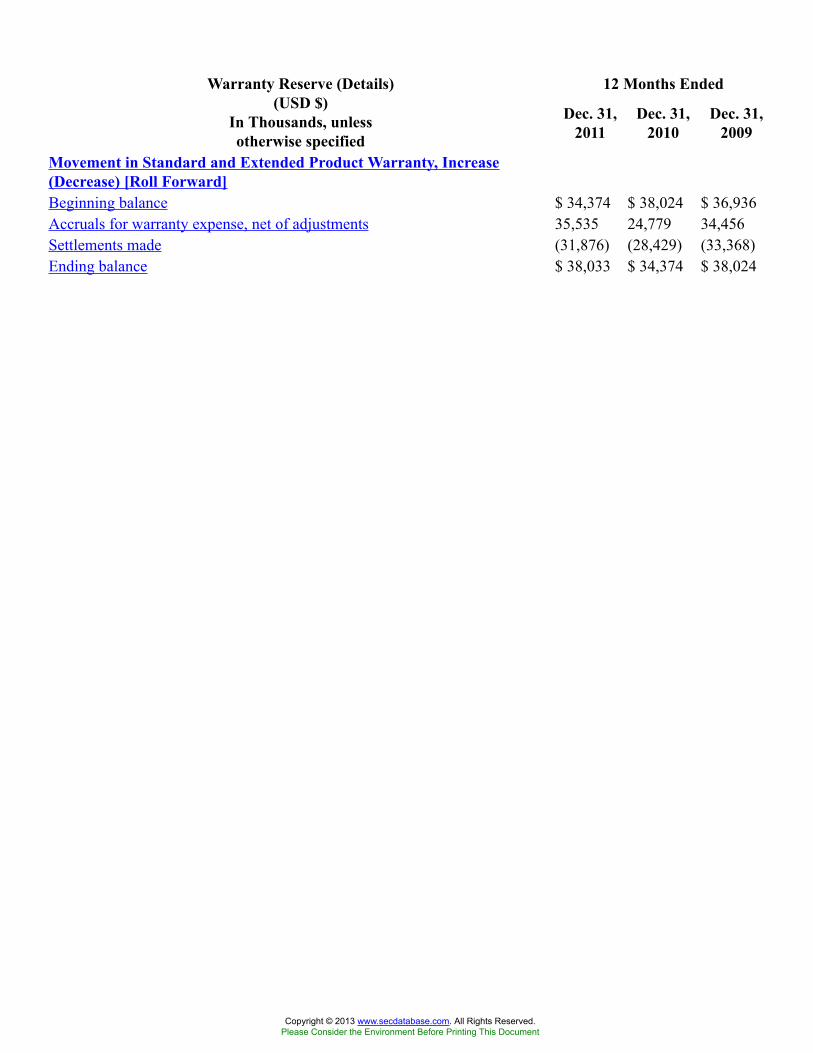
12 Months EndedWarranty Reserve (Details)(USD $)
In Thousands, unlessotherwise specified
Dec. 31,2011
Dec. 31,2010
Dec. 31,2009
Movement in Standard and Extended Product Warranty, Increase(Decrease) [Roll Forward]Beginning balance $ 34,374 $ 38,024 $ 36,936Accruals for warranty expense, net of adjustments 35,535 24,779 34,456Settlements made (31,876) (28,429) (33,368)Ending balance $ 38,033 $ 34,374 $ 38,024
Copyright © 2013 www.secdatabase.com. All Rights Reserved.Please Consider the Environment Before Printing This Document
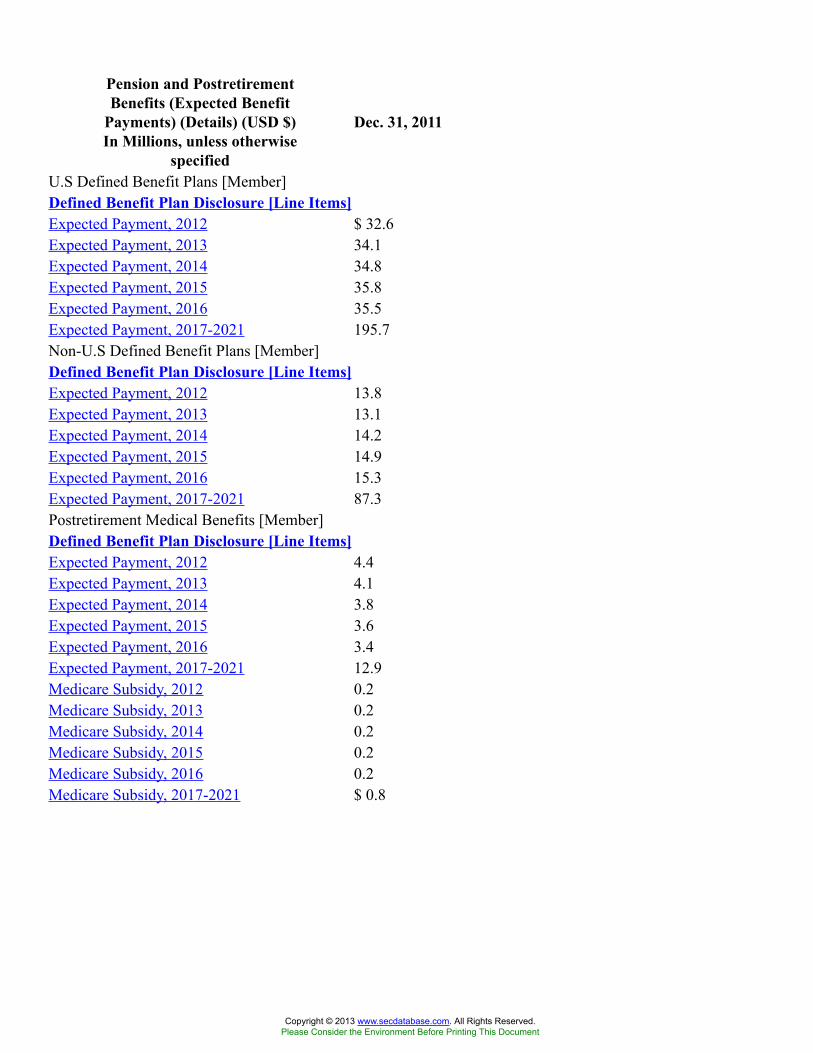
Pension and PostretirementBenefits (Expected Benefit
Payments) (Details) (USD $)In Millions, unless otherwise
specified
Dec. 31, 2011
U.S Defined Benefit Plans [Member]Defined Benefit Plan Disclosure [Line Items]Expected Payment, 2012 $ 32.6Expected Payment, 2013 34.1Expected Payment, 2014 34.8Expected Payment, 2015 35.8Expected Payment, 2016 35.5Expected Payment, 2017-2021 195.7Non-U.S Defined Benefit Plans [Member]Defined Benefit Plan Disclosure [Line Items]Expected Payment, 2012 13.8Expected Payment, 2013 13.1Expected Payment, 2014 14.2Expected Payment, 2015 14.9Expected Payment, 2016 15.3Expected Payment, 2017-2021 87.3Postretirement Medical Benefits [Member]Defined Benefit Plan Disclosure [Line Items]Expected Payment, 2012 4.4Expected Payment, 2013 4.1Expected Payment, 2014 3.8Expected Payment, 2015 3.6Expected Payment, 2016 3.4Expected Payment, 2017-2021 12.9Medicare Subsidy, 2012 0.2Medicare Subsidy, 2013 0.2Medicare Subsidy, 2014 0.2Medicare Subsidy, 2015 0.2Medicare Subsidy, 2016 0.2Medicare Subsidy, 2017-2021 $ 0.8
Copyright © 2013 www.secdatabase.com. All Rights Reserved.Please Consider the Environment Before Printing This Document

12 Months EndedBusiness SegmentInformation Dec. 31, 2011
Segment Reporting[Abstract]Business Segment Information BUSINESS SEGMENT INFORMATION
We are principally engaged in the worldwide design, manufacture, distribution and serviceof industrial flow management equipment. We provide long lead-time, custom and other highlyengineered pumps; standardized, general purpose pumps; mechanical seals; industrial valves; andrelated automation products and solutions primarily for oil and gas, chemical, power generation,water management and other general industries requiring flow management products and services.
Our business segments, defined below, share a focus on industrial flow control technologyand have a high number of common customers. These segments also have complementary productofferings and technologies that are often combined in applications which provide us a netcompetitive advantage. Our segments also benefit from our global footprint and our economies ofscale in reducing administrative and overhead costs to serve customers more cost effectively.
We conduct our operations through these three business segments based on type of productand how we manage the business:
• FSG EPD for long lead-time, custom and other highly-engineered pumps and pumpsystems, mechanical seals, auxiliary systems and replacement parts and related services;
• FSG IPD for engineered and pre-configured industrial pumps and pump systems andrelated products and services; and
• FCD for engineered and industrial valves, control valves, actuators and controls andrelated services.
During 2011, the President of FSG reported directly to the Chief Executive Officer ("CEO")and the FSG Vice President - Finance reported directly to our Chief Accounting Officer ("CAO").The structure of FSG consists of two reportable operating segments: EPD and IPD. During 2011,FCD had a President, who reported directly to our CEO, and a Vice President - Finance, whoreported directly to our CAO. For decision-making purposes, our CEO and other members ofsenior executive management use financial information generated and reported at the reportablesegment level. Our corporate headquarters does not constitute a separate division or businesssegment. On January 11, 2012, a new unified operational leadership structure was announcedresulting in the creation of a Chief Operating Officer position, in lieu of the above segmentPresident structure. The creation of this position did not impact how we have defined the abovethree business segments or our assessment of our CEO as the chief operating decision maker.
We evaluate segment performance and allocate resources based on each reportable segment’soperating income. Amounts classified as "Eliminations and All Other" include corporateheadquarters costs and other minor entities that do not constitute separate segments. Intersegmentsales and transfers are recorded at cost plus a profit margin, with the sales and related margin onsuch sales eliminated in consolidation.
The following is a summary of the financial information of our reportable segments as ofand for the years ended December 31, 2011, 2010 and 2009 reconciled to the amounts reported inthe consolidated financial statements.
Flow Solutions Group
EPD IPD FCDSubtotal—Reportable
Segments
Eliminationsand All
Other(1)Consolidated
Total
(Amounts in thousands)
Year EndedDecember31, 2011:
Copyright © 2013 www.secdatabase.com. All Rights Reserved.Please Consider the Environment Before Printing This Document
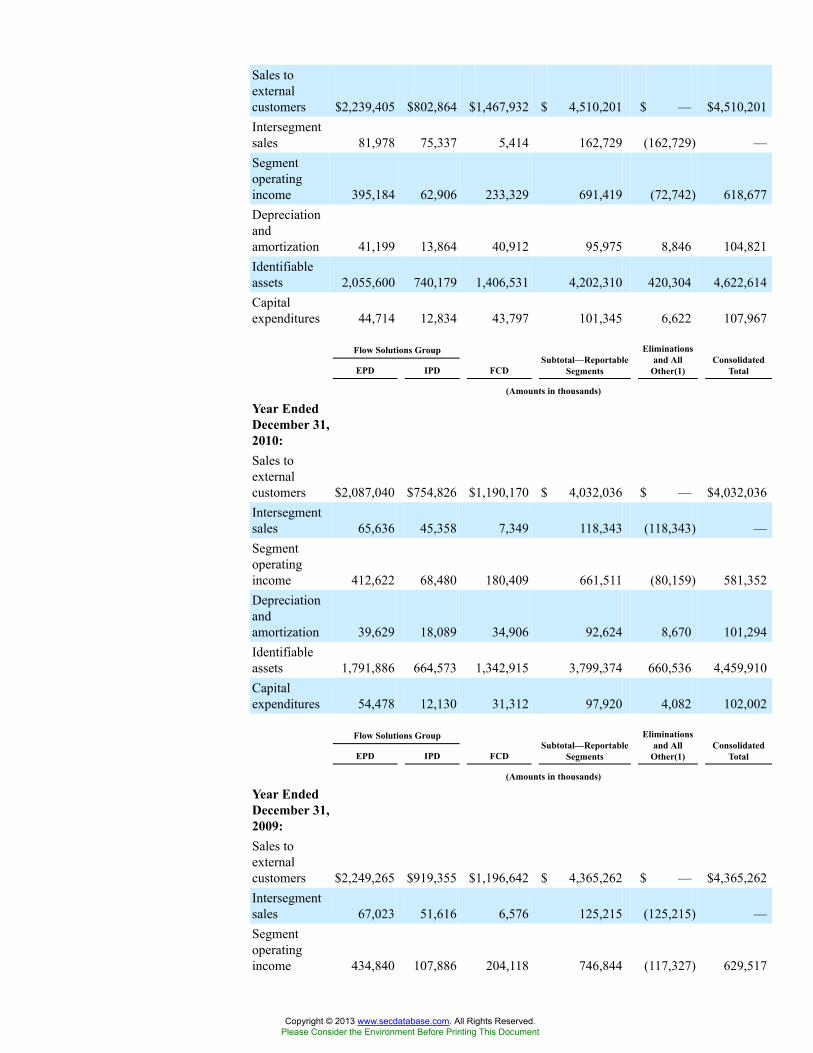
Sales toexternalcustomers $2,239,405 $802,864 $1,467,932 $ 4,510,201 $ — $4,510,201Intersegmentsales 81,978 75,337 5,414 162,729 (162,729) —Segmentoperatingincome 395,184 62,906 233,329 691,419 (72,742) 618,677Depreciationandamortization 41,199 13,864 40,912 95,975 8,846 104,821Identifiableassets 2,055,600 740,179 1,406,531 4,202,310 420,304 4,622,614Capitalexpenditures 44,714 12,834 43,797 101,345 6,622 107,967
Flow Solutions Group
EPD IPD FCDSubtotal—Reportable
Segments
Eliminationsand All
Other(1)Consolidated
Total
(Amounts in thousands)
Year EndedDecember 31,2010:Sales toexternalcustomers $2,087,040 $754,826 $1,190,170 $ 4,032,036 $ — $4,032,036Intersegmentsales 65,636 45,358 7,349 118,343 (118,343) —Segmentoperatingincome 412,622 68,480 180,409 661,511 (80,159) 581,352Depreciationandamortization 39,629 18,089 34,906 92,624 8,670 101,294Identifiableassets 1,791,886 664,573 1,342,915 3,799,374 660,536 4,459,910Capitalexpenditures 54,478 12,130 31,312 97,920 4,082 102,002
Flow Solutions Group
EPD IPD FCDSubtotal—Reportable
Segments
Eliminationsand All
Other(1)Consolidated
Total
(Amounts in thousands)
Year EndedDecember 31,2009:Sales toexternalcustomers $2,249,265 $919,355 $1,196,642 $ 4,365,262 $ — $4,365,262Intersegmentsales 67,023 51,616 6,576 125,215 (125,215) —Segmentoperatingincome 434,840 107,886 204,118 746,844 (117,327) 629,517
Copyright © 2013 www.secdatabase.com. All Rights Reserved.Please Consider the Environment Before Printing This Document
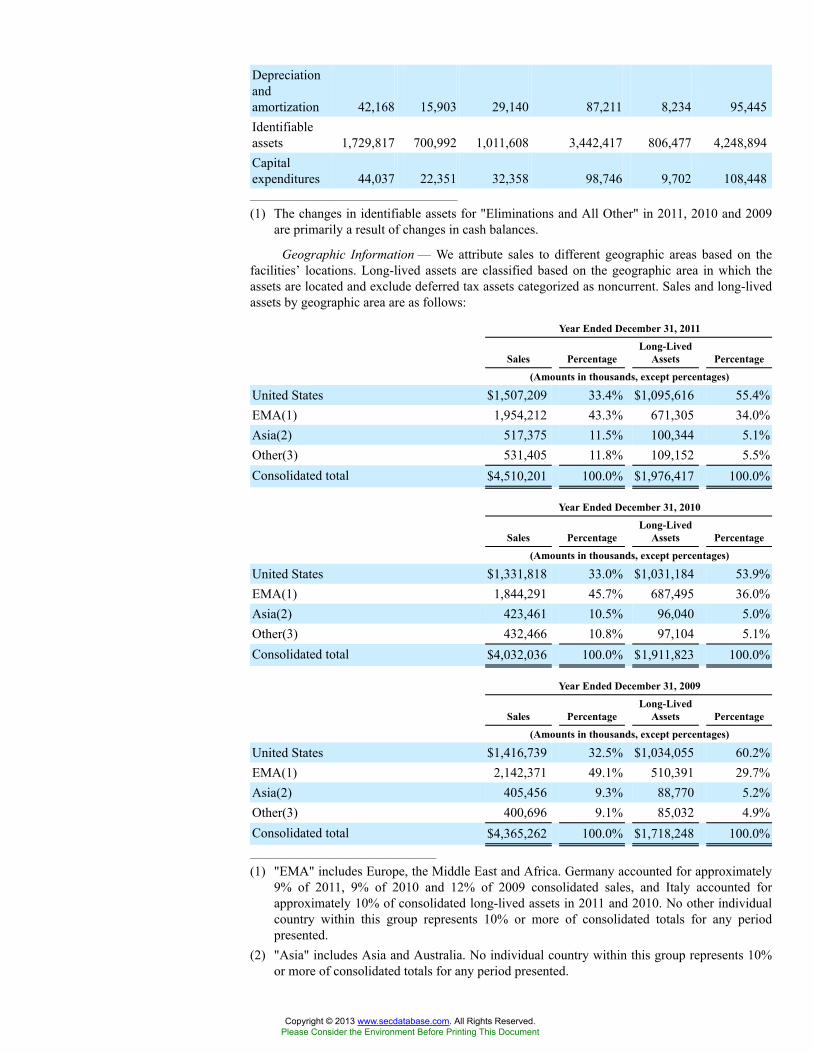
Depreciationandamortization 42,168 15,903 29,140 87,211 8,234 95,445Identifiableassets 1,729,817 700,992 1,011,608 3,442,417 806,477 4,248,894Capitalexpenditures 44,037 22,351 32,358 98,746 9,702 108,448_______________________________________
(1) The changes in identifiable assets for "Eliminations and All Other" in 2011, 2010 and 2009are primarily a result of changes in cash balances.
Geographic Information — We attribute sales to different geographic areas based on thefacilities’ locations. Long-lived assets are classified based on the geographic area in which theassets are located and exclude deferred tax assets categorized as noncurrent. Sales and long-livedassets by geographic area are as follows:
Year Ended December 31, 2011
Sales PercentageLong-Lived
Assets Percentage
(Amounts in thousands, except percentages)
United States $1,507,209 33.4% $1,095,616 55.4%EMA(1) 1,954,212 43.3% 671,305 34.0%Asia(2) 517,375 11.5% 100,344 5.1%Other(3) 531,405 11.8% 109,152 5.5%Consolidated total $4,510,201 100.0% $1,976,417 100.0%
Year Ended December 31, 2010
Sales PercentageLong-Lived
Assets Percentage
(Amounts in thousands, except percentages)
United States $1,331,818 33.0% $1,031,184 53.9%EMA(1) 1,844,291 45.7% 687,495 36.0%Asia(2) 423,461 10.5% 96,040 5.0%Other(3) 432,466 10.8% 97,104 5.1%Consolidated total $4,032,036 100.0% $1,911,823 100.0%
Year Ended December 31, 2009
Sales PercentageLong-Lived
Assets Percentage
(Amounts in thousands, except percentages)
United States $1,416,739 32.5% $1,034,055 60.2%EMA(1) 2,142,371 49.1% 510,391 29.7%Asia(2) 405,456 9.3% 88,770 5.2%Other(3) 400,696 9.1% 85,032 4.9%Consolidated total $4,365,262 100.0% $1,718,248 100.0%___________________________________
(1) "EMA" includes Europe, the Middle East and Africa. Germany accounted for approximately9% of 2011, 9% of 2010 and 12% of 2009 consolidated sales, and Italy accounted forapproximately 10% of consolidated long-lived assets in 2011 and 2010. No other individualcountry within this group represents 10% or more of consolidated totals for any periodpresented.
(2) "Asia" includes Asia and Australia. No individual country within this group represents 10%or more of consolidated totals for any period presented.
Copyright © 2013 www.secdatabase.com. All Rights Reserved.Please Consider the Environment Before Printing This Document

(3) "Other" includes Canada and Latin America. No individual country within this grouprepresents 10% or more of consolidated totals for any period presented.
Net sales to international customers, including export sales from the U.S., represented 73%of total sales in each of 2011, 2010 and 2009.
Major Customer Information — We have a large number of customers across a large numberof manufacturing and service facilities and do not believe that we have sales to any individualcustomer that represent 10% or more of consolidated sales for any of the years presented.
Copyright © 2013 www.secdatabase.com. All Rights Reserved.Please Consider the Environment Before Printing This Document

12 Months EndedGoodwill and OtherIntangible Assets (Changes
in Intangible Assets)(Details) (USD $)
Dec. 31, 2011years Dec. 31, 2010
Finite-Lived Intangible Assets [Line Items]Useful Life (Years), minimum 3Useful Life (Years), maximum 40Ending Gross Amount $ 188,527,000 $ 161,358,000Accumulated Amortization (103,007,000) (90,383,000)Write off of fully expired and full amortrized intangible assets and patents 200,000 11,300,000Indefinite-lived Intangible Assets [Roll Forward]Beginning Gross Amount 77,622,000 [1]
Ending Gross Amount 79,447,000 [1] 77,622,000 [1]
Accumulated Amortization (1,485,000) [1] (1,485,000) [1]
Engineering Drawings [Member]Finite-Lived Intangible Assets [Line Items]Useful Life (Years), minimum 10 [2] 10 [2]
Useful Life (Years), maximum 20 [2] 20 [2]
Ending Gross Amount 92,389,000 [2] 85,613,000 [2]
Accumulated Amortization (53,404,000) [2] (48,087,000) [2]
Distribution Networks [Member]Finite-Lived Intangible Assets [Line Items]Useful Life (Years), minimum 5 5Useful Life (Years), maximum 15 15Ending Gross Amount 13,700,000 13,941,000Accumulated Amortization (10,386,000) (9,755,000)Customer Relationships [Member]Finite-Lived Intangible Assets [Line Items]Useful Life (Years) 5Useful Life (Years), minimum 5 [3] 5 [3]
Useful Life (Years), maximum 10 [3] 10 [3]
Ending Gross Amount 32,188,000 [3] 16,846,000 [3]
Accumulated Amortization (5,468,000) [3] (1,543,000) [3]
Software [Member]Finite-Lived Intangible Assets [Line Items]Useful Life (Years) 10 10Ending Gross Amount 5,900,000 5,900,000Accumulated Amortization (5,900,000) (5,900,000)Patents [Member]Finite-Lived Intangible Assets [Line Items]Useful Life (Years), minimum 9 9
Copyright © 2013 www.secdatabase.com. All Rights Reserved.Please Consider the Environment Before Printing This Document
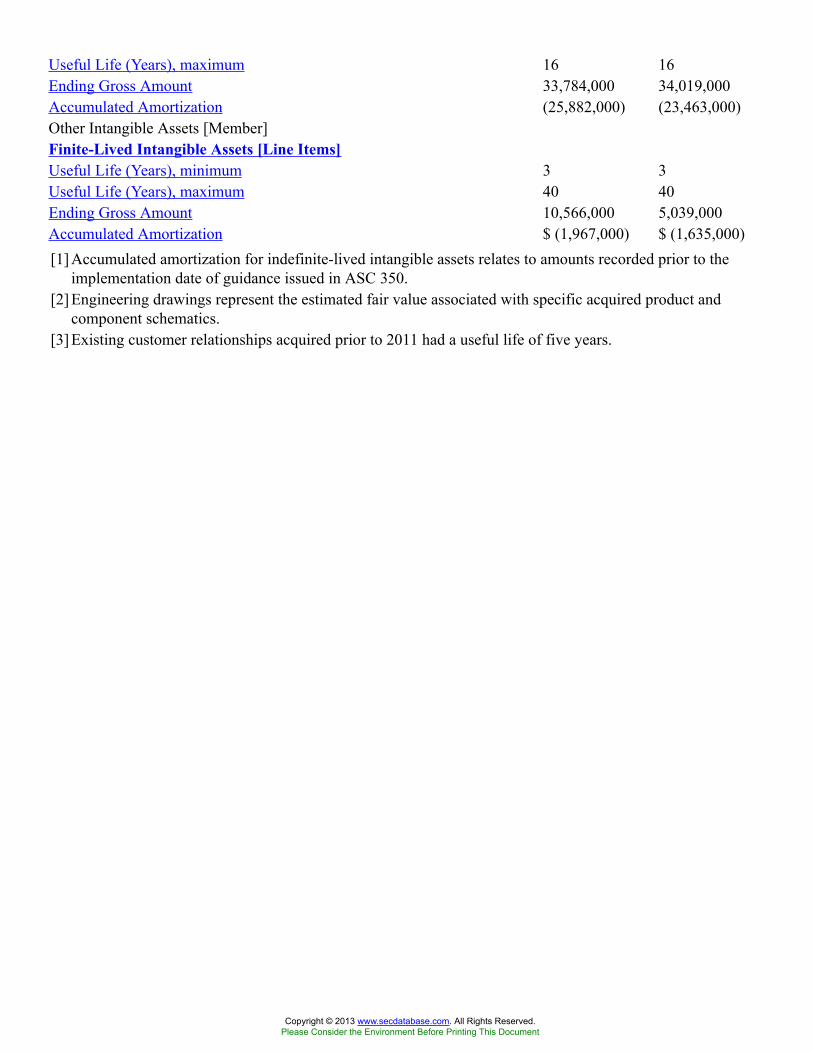
Useful Life (Years), maximum 16 16Ending Gross Amount 33,784,000 34,019,000Accumulated Amortization (25,882,000) (23,463,000)Other Intangible Assets [Member]Finite-Lived Intangible Assets [Line Items]Useful Life (Years), minimum 3 3Useful Life (Years), maximum 40 40Ending Gross Amount 10,566,000 5,039,000Accumulated Amortization $ (1,967,000) $ (1,635,000)[1] Accumulated amortization for indefinite-lived intangible assets relates to amounts recorded prior to the
implementation date of guidance issued in ASC 350.[2] Engineering drawings represent the estimated fair value associated with specific acquired product and
component schematics.[3] Existing customer relationships acquired prior to 2011 had a useful life of five years.
Copyright © 2013 www.secdatabase.com. All Rights Reserved.Please Consider the Environment Before Printing This Document
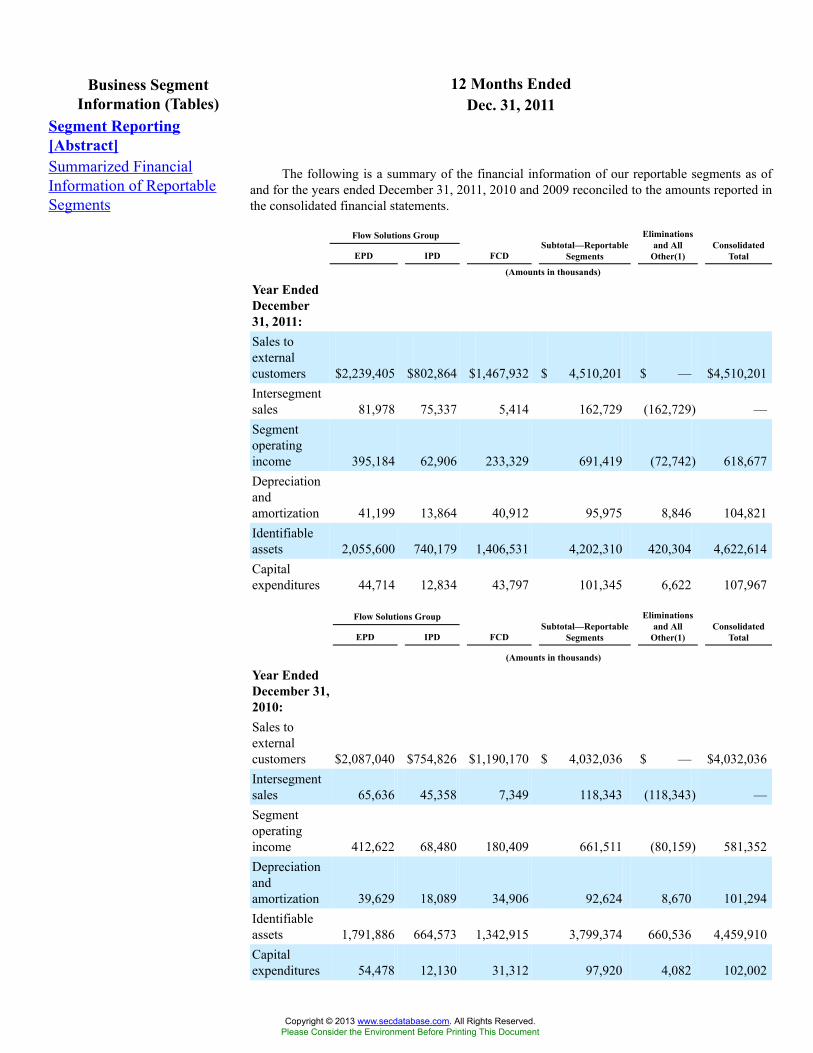
12 Months EndedBusiness SegmentInformation (Tables) Dec. 31, 2011
Segment Reporting[Abstract]Summarized FinancialInformation of ReportableSegments
The following is a summary of the financial information of our reportable segments as ofand for the years ended December 31, 2011, 2010 and 2009 reconciled to the amounts reported inthe consolidated financial statements.
Flow Solutions Group
EPD IPD FCDSubtotal—Reportable
Segments
Eliminationsand All
Other(1)Consolidated
Total
(Amounts in thousands)
Year EndedDecember31, 2011:Sales toexternalcustomers $2,239,405 $802,864 $1,467,932 $ 4,510,201 $ — $4,510,201Intersegmentsales 81,978 75,337 5,414 162,729 (162,729) —Segmentoperatingincome 395,184 62,906 233,329 691,419 (72,742) 618,677Depreciationandamortization 41,199 13,864 40,912 95,975 8,846 104,821Identifiableassets 2,055,600 740,179 1,406,531 4,202,310 420,304 4,622,614Capitalexpenditures 44,714 12,834 43,797 101,345 6,622 107,967
Flow Solutions Group
EPD IPD FCDSubtotal—Reportable
Segments
Eliminationsand All
Other(1)Consolidated
Total
(Amounts in thousands)
Year EndedDecember 31,2010:Sales toexternalcustomers $2,087,040 $754,826 $1,190,170 $ 4,032,036 $ — $4,032,036Intersegmentsales 65,636 45,358 7,349 118,343 (118,343) —Segmentoperatingincome 412,622 68,480 180,409 661,511 (80,159) 581,352Depreciationandamortization 39,629 18,089 34,906 92,624 8,670 101,294Identifiableassets 1,791,886 664,573 1,342,915 3,799,374 660,536 4,459,910Capitalexpenditures 54,478 12,130 31,312 97,920 4,082 102,002
Copyright © 2013 www.secdatabase.com. All Rights Reserved.Please Consider the Environment Before Printing This Document
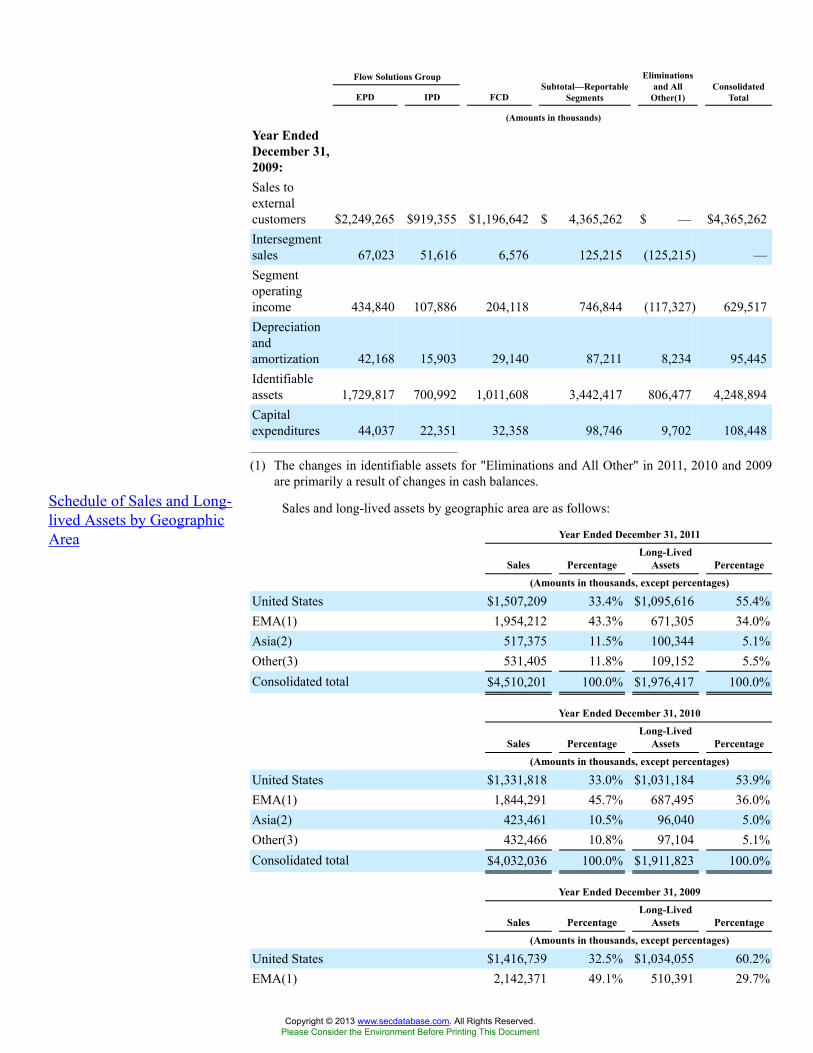
Flow Solutions Group
EPD IPD FCDSubtotal—Reportable
Segments
Eliminationsand All
Other(1)Consolidated
Total
(Amounts in thousands)
Year EndedDecember 31,2009:Sales toexternalcustomers $2,249,265 $919,355 $1,196,642 $ 4,365,262 $ — $4,365,262Intersegmentsales 67,023 51,616 6,576 125,215 (125,215) —Segmentoperatingincome 434,840 107,886 204,118 746,844 (117,327) 629,517Depreciationandamortization 42,168 15,903 29,140 87,211 8,234 95,445Identifiableassets 1,729,817 700,992 1,011,608 3,442,417 806,477 4,248,894Capitalexpenditures 44,037 22,351 32,358 98,746 9,702 108,448_______________________________________
(1) The changes in identifiable assets for "Eliminations and All Other" in 2011, 2010 and 2009are primarily a result of changes in cash balances.
Schedule of Sales and Long-lived Assets by GeographicArea
Sales and long-lived assets by geographic area are as follows:
Year Ended December 31, 2011
Sales PercentageLong-Lived
Assets Percentage
(Amounts in thousands, except percentages)
United States $1,507,209 33.4% $1,095,616 55.4%EMA(1) 1,954,212 43.3% 671,305 34.0%Asia(2) 517,375 11.5% 100,344 5.1%Other(3) 531,405 11.8% 109,152 5.5%Consolidated total $4,510,201 100.0% $1,976,417 100.0%
Year Ended December 31, 2010
Sales PercentageLong-Lived
Assets Percentage
(Amounts in thousands, except percentages)
United States $1,331,818 33.0% $1,031,184 53.9%EMA(1) 1,844,291 45.7% 687,495 36.0%Asia(2) 423,461 10.5% 96,040 5.0%Other(3) 432,466 10.8% 97,104 5.1%Consolidated total $4,032,036 100.0% $1,911,823 100.0%
Year Ended December 31, 2009
Sales PercentageLong-Lived
Assets Percentage
(Amounts in thousands, except percentages)
United States $1,416,739 32.5% $1,034,055 60.2%EMA(1) 2,142,371 49.1% 510,391 29.7%
Copyright © 2013 www.secdatabase.com. All Rights Reserved.Please Consider the Environment Before Printing This Document
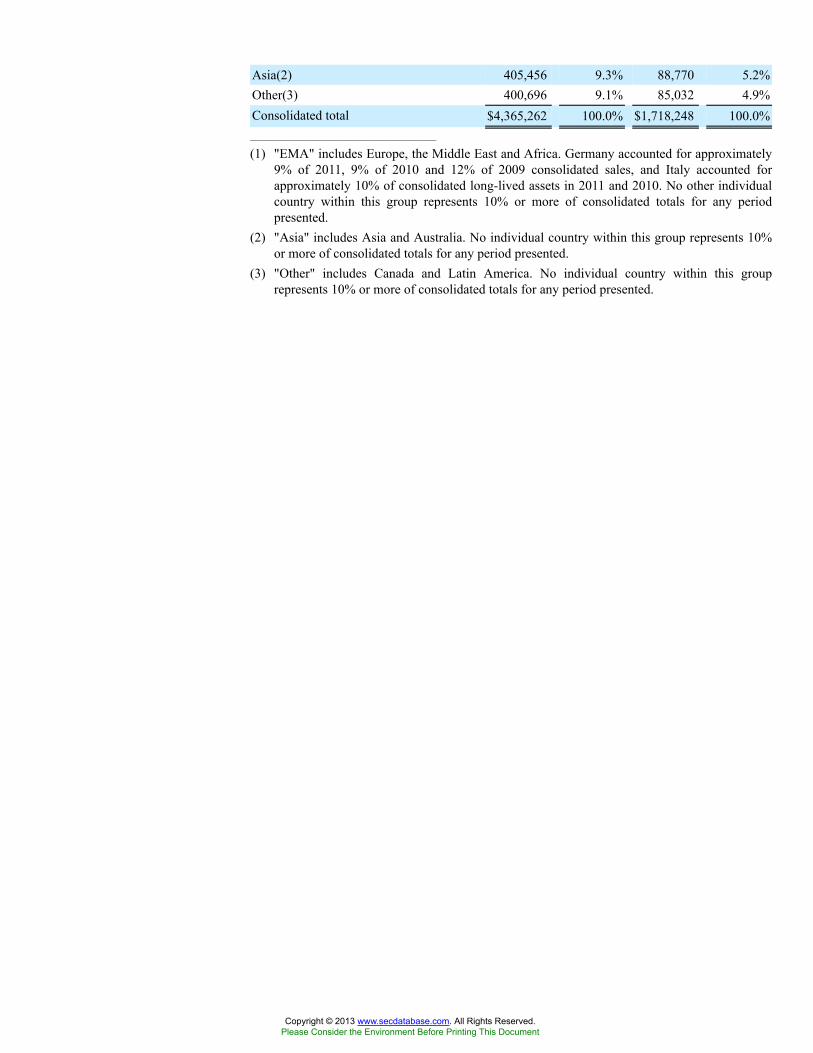
Asia(2) 405,456 9.3% 88,770 5.2%Other(3) 400,696 9.1% 85,032 4.9%Consolidated total $4,365,262 100.0% $1,718,248 100.0%___________________________________
(1) "EMA" includes Europe, the Middle East and Africa. Germany accounted for approximately9% of 2011, 9% of 2010 and 12% of 2009 consolidated sales, and Italy accounted forapproximately 10% of consolidated long-lived assets in 2011 and 2010. No other individualcountry within this group represents 10% or more of consolidated totals for any periodpresented.
(2) "Asia" includes Asia and Australia. No individual country within this group represents 10%or more of consolidated totals for any period presented.
(3) "Other" includes Canada and Latin America. No individual country within this grouprepresents 10% or more of consolidated totals for any period presented.
Copyright © 2013 www.secdatabase.com. All Rights Reserved.Please Consider the Environment Before Printing This Document
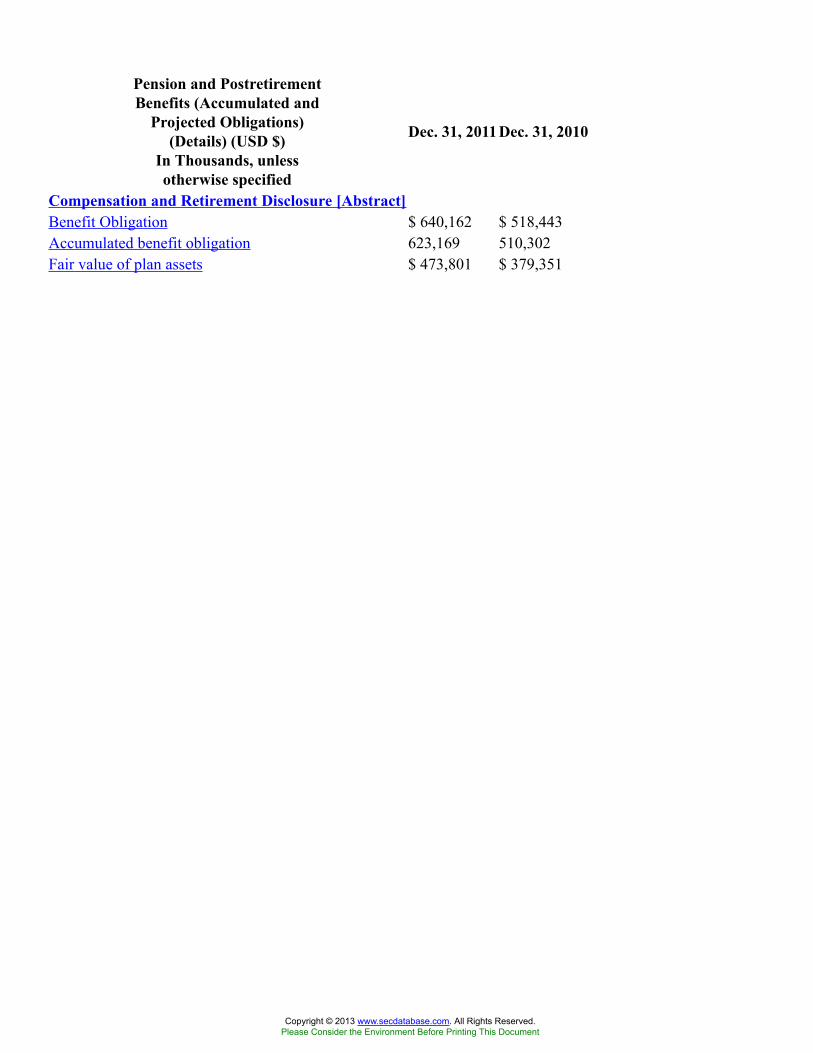
Pension and PostretirementBenefits (Accumulated and
Projected Obligations)(Details) (USD $)
In Thousands, unlessotherwise specified
Dec. 31, 2011Dec. 31, 2010
Compensation and Retirement Disclosure [Abstract]Benefit Obligation $ 640,162 $ 518,443Accumulated benefit obligation 623,169 510,302Fair value of plan assets $ 473,801 $ 379,351
Copyright © 2013 www.secdatabase.com. All Rights Reserved.Please Consider the Environment Before Printing This Document
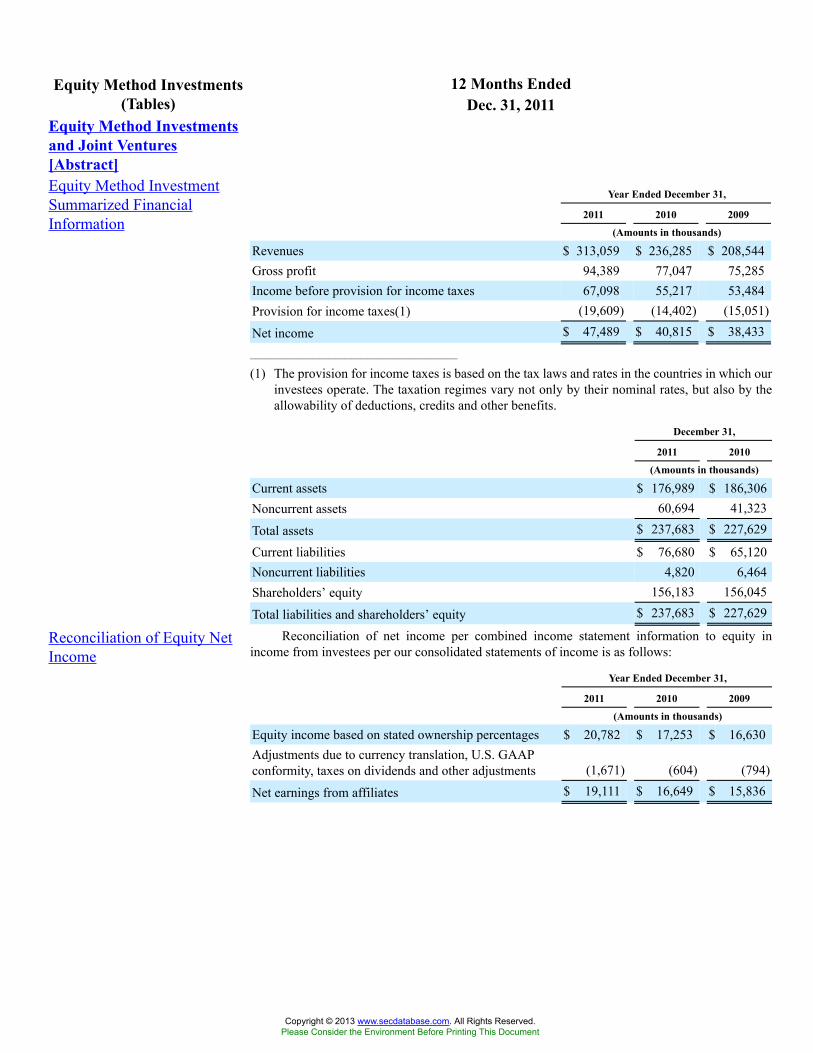
12 Months EndedEquity Method Investments(Tables) Dec. 31, 2011
Equity Method Investmentsand Joint Ventures[Abstract]Equity Method InvestmentSummarized FinancialInformation
Year Ended December 31,
2011 2010 2009
(Amounts in thousands)
Revenues $ 313,059 $ 236,285 $ 208,544Gross profit 94,389 77,047 75,285Income before provision for income taxes 67,098 55,217 53,484Provision for income taxes(1) (19,609) (14,402) (15,051)
Net income $ 47,489 $ 40,815 $ 38,433_______________________________________
(1) The provision for income taxes is based on the tax laws and rates in the countries in which ourinvestees operate. The taxation regimes vary not only by their nominal rates, but also by theallowability of deductions, credits and other benefits.
December 31,
2011 2010
(Amounts in thousands)
Current assets $ 176,989 $ 186,306Noncurrent assets 60,694 41,323
Total assets $ 237,683 $ 227,629
Current liabilities $ 76,680 $ 65,120Noncurrent liabilities 4,820 6,464Shareholders’ equity 156,183 156,045
Total liabilities and shareholders’ equity $ 237,683 $ 227,629
Reconciliation of Equity NetIncome
Reconciliation of net income per combined income statement information to equity inincome from investees per our consolidated statements of income is as follows:
Year Ended December 31,
2011 2010 2009
(Amounts in thousands)
Equity income based on stated ownership percentages $ 20,782 $ 17,253 $ 16,630Adjustments due to currency translation, U.S. GAAPconformity, taxes on dividends and other adjustments (1,671) (604) (794)
Net earnings from affiliates $ 19,111 $ 16,649 $ 15,836
Copyright © 2013 www.secdatabase.com. All Rights Reserved.Please Consider the Environment Before Printing This Document

12 Months EndedInventories (Details) (USD $) Dec. 31, 2011 Dec. 31, 2010 Dec. 31, 2009Net Components of InventoryRaw materials $ 329,120,000$ 265,742,000Work in process 793,053,000 711,751,000Finished goods 279,267,000 283,042,000Less: Progress billings (320,934,000) (305,541,000)Less: Excess and obsolete reserve (72,127,000) (68,263,000)Inventories, net 1,008,379,000886,731,000Expenses due to excess and obsolete inventory $ 16,500,000 $ 10,100,000 $ 13,700,000
Copyright © 2013 www.secdatabase.com. All Rights Reserved.Please Consider the Environment Before Printing This Document
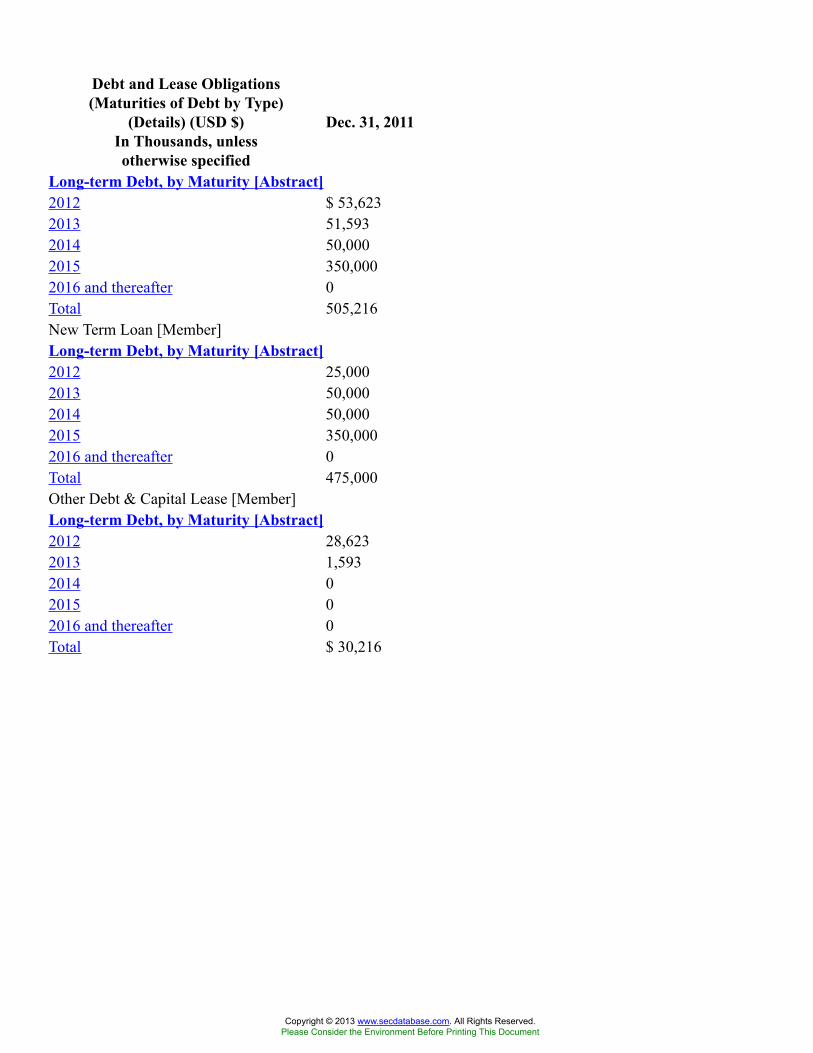
Debt and Lease Obligations(Maturities of Debt by Type)
(Details) (USD $)In Thousands, unlessotherwise specified
Dec. 31, 2011
Long-term Debt, by Maturity [Abstract]2012 $ 53,6232013 51,5932014 50,0002015 350,0002016 and thereafter 0Total 505,216New Term Loan [Member]Long-term Debt, by Maturity [Abstract]2012 25,0002013 50,0002014 50,0002015 350,0002016 and thereafter 0Total 475,000Other Debt & Capital Lease [Member]Long-term Debt, by Maturity [Abstract]2012 28,6232013 1,5932014 02015 02016 and thereafter 0Total $ 30,216
Copyright © 2013 www.secdatabase.com. All Rights Reserved.Please Consider the Environment Before Printing This Document
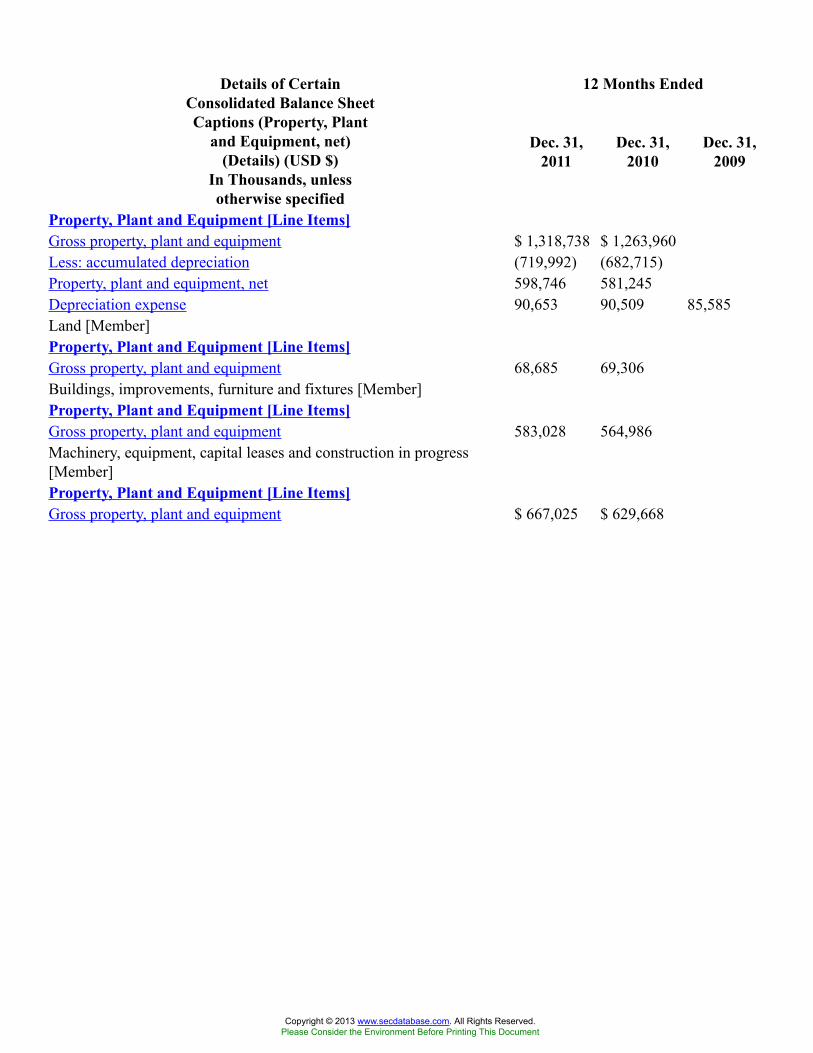
12 Months EndedDetails of CertainConsolidated Balance SheetCaptions (Property, Plant
and Equipment, net)(Details) (USD $)
In Thousands, unlessotherwise specified
Dec. 31,2011
Dec. 31,2010
Dec. 31,2009
Property, Plant and Equipment [Line Items]Gross property, plant and equipment $ 1,318,738 $ 1,263,960Less: accumulated depreciation (719,992) (682,715)Property, plant and equipment, net 598,746 581,245Depreciation expense 90,653 90,509 85,585Land [Member]Property, Plant and Equipment [Line Items]Gross property, plant and equipment 68,685 69,306Buildings, improvements, furniture and fixtures [Member]Property, Plant and Equipment [Line Items]Gross property, plant and equipment 583,028 564,986Machinery, equipment, capital leases and construction in progress[Member]Property, Plant and Equipment [Line Items]Gross property, plant and equipment $ 667,025 $ 629,668
Copyright © 2013 www.secdatabase.com. All Rights Reserved.Please Consider the Environment Before Printing This Document
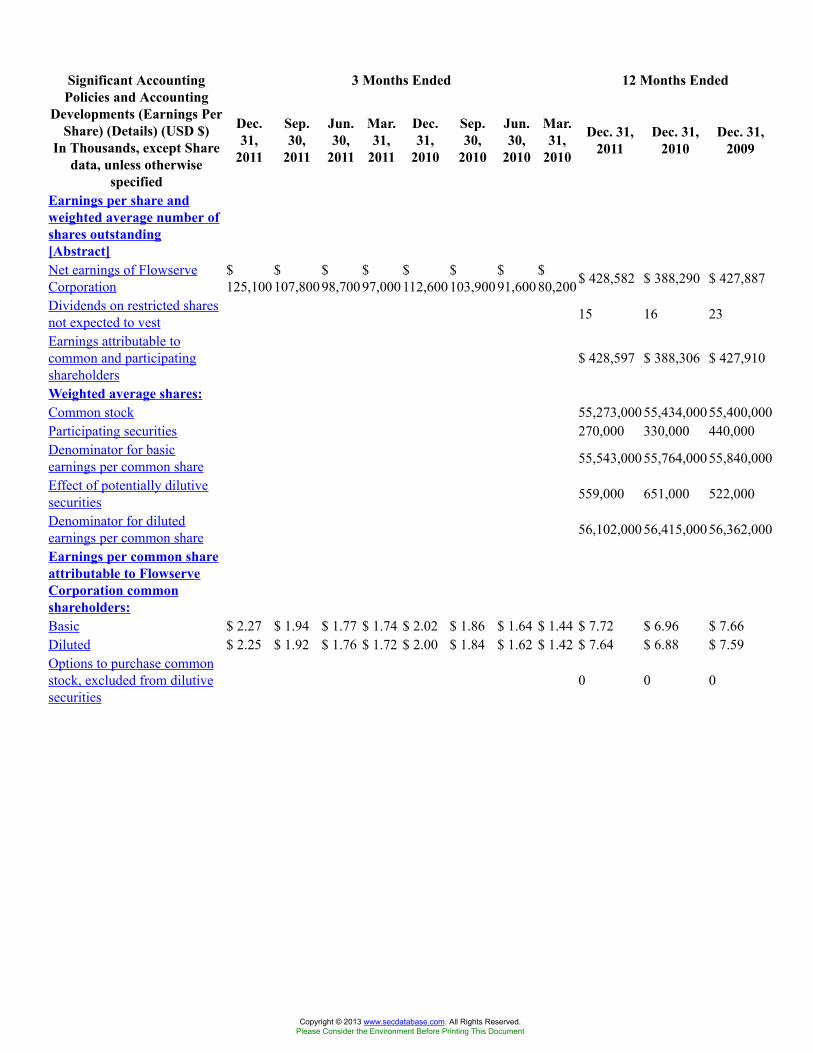
3 Months Ended 12 Months EndedSignificant AccountingPolicies and Accounting
Developments (Earnings PerShare) (Details) (USD $)
In Thousands, except Sharedata, unless otherwise
specified
Dec.31,
2011
Sep.30,
2011
Jun.30,
2011
Mar.31,
2011
Dec.31,
2010
Sep.30,
2010
Jun.30,
2010
Mar.31,
2010
Dec. 31,2011
Dec. 31,2010
Dec. 31,2009
Earnings per share andweighted average number ofshares outstanding[Abstract]Net earnings of FlowserveCorporation
$125,100
$107,800
$98,700
$97,000
$112,600
$103,900
$91,600
$80,200$ 428,582 $ 388,290 $ 427,887
Dividends on restricted sharesnot expected to vest 15 16 23
Earnings attributable tocommon and participatingshareholders
$ 428,597 $ 388,306 $ 427,910
Weighted average shares:Common stock 55,273,00055,434,00055,400,000Participating securities 270,000 330,000 440,000Denominator for basicearnings per common share 55,543,00055,764,00055,840,000
Effect of potentially dilutivesecurities 559,000 651,000 522,000
Denominator for dilutedearnings per common share 56,102,00056,415,00056,362,000
Earnings per common shareattributable to FlowserveCorporation commonshareholders:Basic $ 2.27 $ 1.94 $ 1.77 $ 1.74 $ 2.02 $ 1.86 $ 1.64 $ 1.44 $ 7.72 $ 6.96 $ 7.66Diluted $ 2.25 $ 1.92 $ 1.76 $ 1.72 $ 2.00 $ 1.84 $ 1.62 $ 1.42 $ 7.64 $ 6.88 $ 7.59Options to purchase commonstock, excluded from dilutivesecurities
0 0 0
Copyright © 2013 www.secdatabase.com. All Rights Reserved.Please Consider the Environment Before Printing This Document

12 Months EndedSignificant AccountingPolicies and Accounting
Developments Dec. 31, 2011
Accounting Policies[Abstract]Significant AccountingPolicies and AccountingDevelopments
SIGNIFICANT ACCOUNTING POLICIES AND ACCOUNTING DEVELOPMENTS
We are principally engaged in the worldwide design, manufacture, distribution and serviceof industrial flow management equipment. We provide long lead-time, custom and other highlyengineered pumps; standardized, general purpose pumps; mechanical seals; industrial valves; andrelated automation products and solutions primarily for oil and gas, chemical, power generation,water management and other general industries requiring flow management products and services.Equipment manufactured and serviced by us is predominantly used in industries that deal withdifficult-to-handle and corrosive fluids, as well as environments with extreme temperatures,pressure, horsepower and speed. Our business is affected by economic conditions in the UnitedStates ("U.S.") and other countries where our products are sold and serviced, by the cyclical natureand competitive environment of the oil and gas, chemical, power generation, water managementand other industries served, by the relationship of the U.S. dollar to other currencies and by thedemand for and pricing of our customers’ end products.
European Sovereign Debt Crisis — At December 31, 2011, we had no direct investmentsin European sovereign or non-sovereign debt. However, certain of our defined benefit plans holdinvestments in European equity and fixed income securities as discussed in Note 12. Other thanbroad, macro-level economic impacts, we did not experience any direct or measurable disruptionsin 2011 due to the European sovereign debt crisis. We will continue to monitor and evaluatethe impact of any future developments in the region on our current business, our customers andsuppliers and the state of the global economy. Additional adverse developments could potentiallyimpact our customers’ exposures to sovereign and non-sovereign European debt and could softenthe level of capital investment and demand for our products and services.
Ongoing Events in North Africa, Middle East and Japan — Ongoing political and economicconditions in North Africa have caused us to experience shipment delays to this region. Weestimate that the shipments to this region that have been delayed resulted in lost or delayedopportunities for operating income of $11.2 million for 2011. The preponderance of our physicalassets in the region are located in the Kingdom of Saudi Arabia and the United Arab Emirates andhave, to date, not been significantly affected by the unrest elsewhere in the region.
We continue to assess the conditions and potential adverse impacts of the earthquakeand tsunami in Japan in early 2011, in particular as they relate to our customers and suppliersin the impacted regions, as well as announced and potential regulatory impacts to the globalnuclear power market. During 2011, we did not experience any significant adverse impacts dueto shipment delays, collection issues or supply chain disruptions. We are also closely monitoringthe effects of the Japan crisis on the global nuclear power industry. While it is difficult to estimatethe long-term effect of the Fukushima plant shutdown on the global nuclear power market, wehave continued to ship nuclear orders in our backlog without significant disruption. We believethat there has been a related reduction in nuclear orders that could continue in the near term,though other parts of our overall power generation business could benefit as nuclear priorities arereevaluated.
Segment Reorganization — As previously disclosed in our Annual Report on Form 10-Kfor the year ended December 31, 2010, we reorganized our divisional operations by combiningthe former Flowserve Pump Division ("FPD") and former Flow Solutions Division ("FSD")into the Flow Solutions Group ("FSG"), effective January 1, 2010. FSG was divided into tworeportable segments based on type of product and how we manage the business: FSG EngineeredProduct Division ("EPD") and FSG Industrial Product Division ("IPD"). EPD includes the longerlead-time, custom and other highly engineered pump product operations of the former FPD andsubstantially all of the operations of the former FSD. IPD consists of the more standardized,general purpose engineered pump product operations of the former FPD. Flow Control Division
Copyright © 2013 www.secdatabase.com. All Rights Reserved.Please Consider the Environment Before Printing This Document
("FCD") was not affected. We have retrospectively adjusted prior period financial information toreflect the current reporting structure.
Venezuela — As previously disclosed in our Annual Report on Form 10-K for the yearended December 31, 2010, effective January 11, 2010, the Venezuelan government devalued itscurrency (Bolivar) and moved to a two-tier exchange structure. The official exchange rate movedfrom 2.15 to 4.30 Bolivars to the U.S. dollar for non-essential items and to 2.60 Bolivars to theU.S. dollar for essential items. Additionally, effective January 1, 2010, Venezuela was designatedas hyperinflationary, and as a result, we began to use the U.S. dollar as our functional currencyin Venezuela. On December 30, 2010, the Venezuelan government announced its intention toeliminate the favorable essential items rate effective January 1, 2011. Our operations in Venezuelagenerally consist of a service center that both imports equipment and parts from certain of our otherlocations for resale to third parties within Venezuela and performs service and repair activities.Our Venezuelan subsidiary’s sales for the year ended December 31, 2011 and total assets atDecember 31, 2011 represented less than 1% of our consolidated sales and total assets for the sameperiod.
Although approvals by Venezuela’s Commission for the Administration of ForeignExchange have slowed, we have historically been able to remit dividends and other payments at theofficial rate, and we currently anticipate doing so in the future. Accordingly, we used the officialrate of 4.30 Bolivars to the U.S. dollar for re-measurement of our Venezuelan financial statementsinto U.S. dollars for all periods presented.
As a result of the currency devaluation, we recognized a net loss of $7.6 million in 2010.The loss was reported in other income (expense), net in our consolidated statement of income andresulted in no tax benefit. The elimination of the favorable essential items rate, effective January 1,2011, had no impact on our consolidated financial position or results of operations as of and for theyear ended December 31, 2011 included in this Annual Report on Form 10-K for the year endedDecember 31, 2011 ("Annual Report").
We have evaluated the carrying value of related assets and concluded that there is nocurrent impairment. We are continuing to assess and monitor the ongoing impact of the currencydevaluations on our Venezuelan operations and imports into the market, including our Venezuelansubsidiary’s ability to remit cash for dividends and other payments at the official rate, as wellas further actions of the Venezuelan government and economic conditions in Venezuela that mayadversely impact our future consolidated financial condition or results of operations.
Principles of Consolidation — The consolidated financial statements include the accountsof our company and our wholly and majority-owned subsidiaries. In addition, we consolidate anyvariable interest entities for which we are deemed to be the primary beneficiary. Noncontrollinginterests of non-affiliated parties have been recognized for all majority-owned consolidatedsubsidiaries. Intercompany profits, transactions and balances among consolidated entities havebeen eliminated from our consolidated financial statements. Investments in unconsolidatedaffiliated companies, which represent noncontrolling ownership interests between 20% and 50%,are accounted for using the equity method, which approximates our equity interest in theirunderlying equivalent net book value under accounting principles generally accepted in the U.S.("GAAP"). Investments in interests where we own less than 20% of the investee are accountedfor by the cost method, whereby income is only recognized in the event of dividend receipt.Investments accounted for by the cost method are tested annually for impairment. We recorded a$3.1 million gain in 2010 on the sale of an investment in a joint venture that was accounted forunder the cost method.
Use of Estimates — The process of preparing financial statements in conformity with GAAPrequires management to make estimates and assumptions that affect reported amounts of certainassets, liabilities, revenues and expenses. Management believes its estimates and assumptions arereasonable; however, actual results may differ materially from such estimates. The most significantestimates and assumptions made by management are used in determining:
• Revenue recognition, net of liquidated damages and other delivery penalties;
Copyright © 2013 www.secdatabase.com. All Rights Reserved.Please Consider the Environment Before Printing This Document
• Income taxes, deferred taxes, tax valuation allowances and tax reserves;
• Reserves for contingent loss;
• Retirement and postretirement benefits; and
• Valuation of goodwill, indefinite-lived intangible assets and other long-lived assets.
Revenue Recognition — Revenues for product sales are recognized when the risks andrewards of ownership are transferred to the customers, which is typically based on the contractualdelivery terms agreed to with the customer and fulfillment of all but inconsequential or perfunctoryactions. In addition, our policy requires persuasive evidence of an arrangement, a fixed ordeterminable sales price and reasonable assurance of collectability. We defer the recognition ofrevenue when advance payments are received from customers before performance obligationshave been completed and/or services have been performed. Freight charges billed to customers areincluded in sales and the related shipping costs are included in cost of sales in our consolidatedstatements of income. Our contracts typically include cancellation provisions that requirecustomers to reimburse us for costs incurred up to the date of cancellation, as well as anycontractual cancellation penalties.
We enter into certain contracts with multiple deliverables that may include any combinationof designing, developing, manufacturing, modifying, installing and commissioning of flowmanagement equipment and providing services related to the performance of such products.Delivery of these products and services typically occurs within a one to two-year period, althoughmany arrangements, such as "book and ship" type orders, have a shorter timeframe for delivery.We aggregate or separate deliverables into units of accounting based on whether the deliverable(s)have standalone value to the customer and when no general right of return exists. Contract value isallocated ratably to the units of accounting in the arrangement based on their relative selling pricesdetermined as if the deliverables were sold separately.
Revenues for long-term contracts that exceed certain internal thresholds regarding the sizeand duration of the project and provide for the receipt of progress billings from the customer arerecorded on the percentage of completion method with progress measured on a cost-to-cost basis.Percentage of completion revenue represents less than 9% of our consolidated sales for each yearpresented.
Revenue on service and repair contracts is recognized after services have been agreed to bythe customer and rendered. Revenues generated under fixed fee service and repair contracts arerecognized on a ratable basis over the term of the contract. These contracts can range in duration,but generally extend for up to five years. Fixed fee service contracts represent aproximately 1% ofconsolidated sales for each year presented.
In certain instances, we provide guaranteed completion dates under the terms of ourcontracts. Failure to meet contractual delivery dates can result in late delivery penalties or non-recoverable costs. In instances where the payment of such costs are deemed to be probable, weperform a project profitability analysis, accounting for such costs as a reduction of realizablerevenues, which could potentially cause estimated total project costs to exceed projected totalrevenues realized from the project. In such instances, we would record reserves to cover suchexcesses in the period they are determined. In circumstances where the total projected revenuesstill exceed total projected costs, the incurrence of unrealized incentive fees or non-recoverablecosts generally reduces profitability of the project at the time of subsequent revenue recognition.
Cash and Cash Equivalents — We place temporary cash investments with financialinstitutions and, by policy, invest in those institutions and instruments that have minimal creditrisk and market risk. These investments, with an original maturity of three months or less whenpurchased, are classified as cash equivalents. They are highly liquid and principal values are notsubject to significant risk of change due to interest rate fluctuations.
Allowance for Doubtful Accounts and Credit Risk — The allowance for doubtful accountsis established based on estimates of the amount of uncollectible accounts receivable, which isdetermined principally based upon the aging of the accounts receivable, but also customer credithistory, industry and market segment information, economic trends and conditions and credit
Copyright © 2013 www.secdatabase.com. All Rights Reserved.Please Consider the Environment Before Printing This Document
reports. Customer credit issues, customer bankruptcies or general economic conditions may alsoimpact our estimates.
Credit risks are mitigated by the diversity of our customer base across many differentgeographic regions and industries and by performing creditworthiness analyses on our customers.Additionally, we mitigate credit risk through letters of credit and advance payments received fromour customers. As of December 31, 2011 and 2010, we do not believe that we have any significantconcentrations of credit risk.
Inventories and Related Reserves — Inventories are stated at the lower-of-cost or market.Cost is determined by the first-in, first-out method. Reserves for excess and obsolete inventoriesare based upon our assessment of market conditions for our products determined by historicalusage and estimated future demand. Due to the long life cycles of our products, we carry spareparts inventories that have historically low usage rates and provide reserves for such inventorybased on demonstrated usage and aging criteria.
Income Taxes, Deferred Taxes, Tax Valuation Allowances and Tax Reserves — We accountfor income taxes under the asset and liability method. Deferred tax assets and liabilities arerecognized for the future tax consequences attributable to differences between the financialstatement carrying amounts of existing assets and liabilities and their respective tax bases andoperating loss and tax credit carryforwards. Deferred tax assets and liabilities are calculated usingenacted tax rates expected to apply to taxable income in the years in which those temporarydifferences are expected to be recovered or settled. The effect on deferred tax assets and liabilitiesof a change in tax rates is recognized in the period that includes the enactment date. We recordvaluation allowances to reflect the estimated amount of deferred tax assets that may not be realizedbased upon our analysis of existing deferred tax assets, net operating losses and tax credits byjurisdiction and expectations of our ability to utilize these tax attributes through a review of past,current and estimated future taxable income and establishment of tax strategies.
We provide deferred taxes for the temporary differences associated with our investment inforeign subsidiaries that have a financial reporting basis that exceeds tax basis, unless we can assertpermanent reinvestment in foreign jurisdictions. Financial reporting basis and tax basis differencesin investments in foreign subsidiaries consist of both unremitted earnings and losses, as well asforeign currency translation adjustments.
The amount of income taxes we pay is subject to ongoing audits by federal, state, and foreigntax authorities, which often result in proposed assessments. We establish reserves for open taxyears for uncertain tax positions that may be subject to challenge by various tax authorities. Theconsolidated tax provision and related accruals include the impact of such reasonably estimablelosses and related interest and penalties as deemed appropriate.
We recognize the tax benefit from an uncertain tax position only if it is more likely than notthat the tax position will be sustained on examination by the taxing authorities. The determinationis based on the technical merits of the position and presumes that each uncertain tax position willbe examined by the relevant taxing authority that has full knowledge of all relevant information.The tax benefits recognized in the financial statements from such a position are measured based onthe largest benefit that has a greater than fifty percent likelihood of being realized upon ultimatesettlement.
While we believe we have adequately provided for any reasonably foreseeable outcomerelated to these matters, our future results may include favorable or unfavorable adjustments to ourestimated tax liabilities. To the extent that the expected tax outcome of these matters changes, suchchanges in estimate will impact the income tax provision in the period in which such determinationis made.
Legal and Environmental Accruals — Legal and environmental reserves are recorded basedupon a case-by-case analysis of the relevant facts and circumstances and an assessment of potentiallegal obligations and costs. Amounts relating to legal and environmental liabilities are recordedwhen it is probable that a loss has been incurred and such loss is estimable. Assessments of legaland environmental costs are based on information obtained from our independent and in-houseexperts and our loss experience in similar situations. Estimates are updated as applicable when new
Copyright © 2013 www.secdatabase.com. All Rights Reserved.Please Consider the Environment Before Printing This Document
information regarding the facts and circumstances of each matter becomes available. Legal feesassociated with legal and environmental liabilities are expensed as incurred.
Estimates of liabilities for unsettled asbestos-related claims are based on known claimsand on our experience during the preceding two years for claims filed, settled and dismissed,with adjustments for events deemed unusual and unlikely to recur, and are included in retirementobligations and other liabilities in our consolidated balance sheets. A substantial majority ofour asbestos-related claims are covered by insurance or indemnities. Estimated indemnities andreceivables from insurance carriers for unsettled claims and receivables for settlements and legalfees paid by us for asbestos-related claims are estimated using our historical experience withinsurance recovery rates and estimates of future recoveries, which include estimates of coverageand financial viability of our insurance carriers. Estimated receivables are included in other assets,net in our consolidated balance sheets. In one asbestos insurance related matter, we have a claim inlitigation against relevant insurers substantially in excess of the recorded receivable. If our claim isresolved more favorably than reflected in this receivable, we would benefit from a one-time gainin the amount of such excess. We are currently unable to estimate the impact, if any, of unassertedasbestos-related claims, although future claims would also be subject to existing indemnities andinsurance coverage.
Warranty Accruals — Warranty obligations are based upon product failure rates, materialsusage, service delivery costs, an analysis of all identified or expected claims and an estimate of thecost to resolve such claims. The estimates of expected claims are generally a factor of historicalclaims and known product issues. Warranty obligations based on these factors are adjusted basedon historical sales trends for the preceding 24 months.
Insurance Accruals — Insurance accruals are recorded for wholly or partially self-insuredrisks such as medical benefits and workers’ compensation and are based upon an analysis of ourclaim loss history, insurance deductibles, policy limits and other relevant factors and are includedin accrued liabilities in our consolidated balance sheets. The estimates are based upon informationreceived from actuaries, insurance company adjusters, independent claims administrators or otherindependent sources. Changes in claims and differences between actual and expected claimlosses could impact future accruals. Receivables from insurance carriers are estimated using ourhistorical experience with insurance recovery rates and estimates of future recoveries, whichinclude estimates of coverage and financial viability of our insurance carriers. Estimatedreceivables are included in accounts receivable, net and other assets, net, as applicable, in ourconsolidated balance sheets.
Pension and Postretirement Obligations — Determination of pension and postretirementbenefits obligations is based on estimates made by management in consultation with independentactuaries and investment advisors. Inherent in these valuations are assumptions including discountrates, expected rates of return on plan assets, retirement rates, mortality rates and rates ofcompensation increase and other factors. Current market conditions, including changes in rates ofreturn, interest rates and medical inflation rates, are considered in selecting these assumptions.
Actuarial gains and losses and prior service costs are recognized in accumulated othercomprehensive loss as they arise and we amortize these costs into net pension expense over theremaining expected service period.
Valuation of Goodwill, Indefinite-Lived Intangible Assets and Other Long-Lived Assets— The value of goodwill and indefinite-lived intangible assets is tested for impairment as ofDecember 31 each year or whenever events or circumstances indicate such assets may be impaired.In connection with our segment reorganization in 2010, we reallocated goodwill to our redefinedreporting units and evaluated goodwill for impairment. The identification of our reporting unitsbegan at the operating segment level: EPD, IPD and FCD, and considered whether componentsone level below the operating segment levels should be identified as reporting units for purposeof testing goodwill for impairment based on certain conditions. These conditions included, amongother factors, (i) the extent to which a component represents a business and (ii) the aggregationof economically similar components within the operating segments and resulted in nine reportingunits. Other factors that were considered in determining whether the aggregation of componentswas appropriate included the similarity of the nature of the products and services, the nature of theproduction processes, the methods of distribution and the types of industries served.
Copyright © 2013 www.secdatabase.com. All Rights Reserved.Please Consider the Environment Before Printing This Document
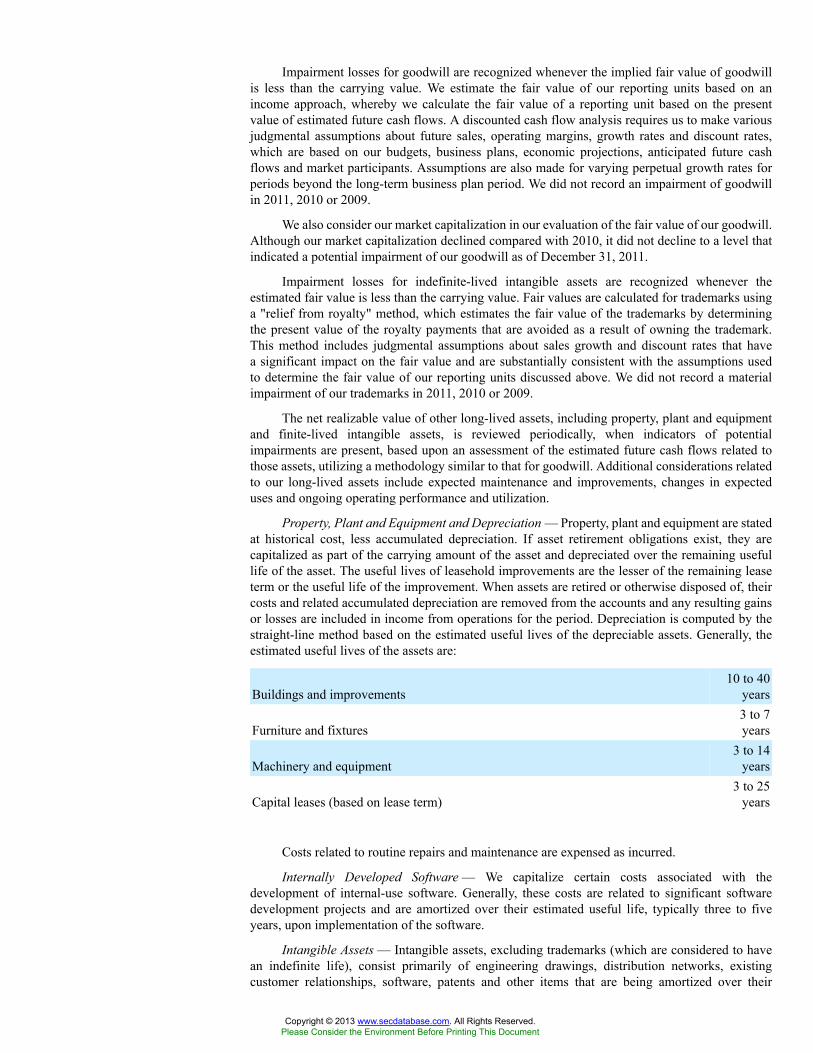
Impairment losses for goodwill are recognized whenever the implied fair value of goodwillis less than the carrying value. We estimate the fair value of our reporting units based on anincome approach, whereby we calculate the fair value of a reporting unit based on the presentvalue of estimated future cash flows. A discounted cash flow analysis requires us to make variousjudgmental assumptions about future sales, operating margins, growth rates and discount rates,which are based on our budgets, business plans, economic projections, anticipated future cashflows and market participants. Assumptions are also made for varying perpetual growth rates forperiods beyond the long-term business plan period. We did not record an impairment of goodwillin 2011, 2010 or 2009.
We also consider our market capitalization in our evaluation of the fair value of our goodwill.Although our market capitalization declined compared with 2010, it did not decline to a level thatindicated a potential impairment of our goodwill as of December 31, 2011.
Impairment losses for indefinite-lived intangible assets are recognized whenever theestimated fair value is less than the carrying value. Fair values are calculated for trademarks usinga "relief from royalty" method, which estimates the fair value of the trademarks by determiningthe present value of the royalty payments that are avoided as a result of owning the trademark.This method includes judgmental assumptions about sales growth and discount rates that havea significant impact on the fair value and are substantially consistent with the assumptions usedto determine the fair value of our reporting units discussed above. We did not record a materialimpairment of our trademarks in 2011, 2010 or 2009.
The net realizable value of other long-lived assets, including property, plant and equipmentand finite-lived intangible assets, is reviewed periodically, when indicators of potentialimpairments are present, based upon an assessment of the estimated future cash flows related tothose assets, utilizing a methodology similar to that for goodwill. Additional considerations relatedto our long-lived assets include expected maintenance and improvements, changes in expecteduses and ongoing operating performance and utilization.
Property, Plant and Equipment and Depreciation — Property, plant and equipment are statedat historical cost, less accumulated depreciation. If asset retirement obligations exist, they arecapitalized as part of the carrying amount of the asset and depreciated over the remaining usefullife of the asset. The useful lives of leasehold improvements are the lesser of the remaining leaseterm or the useful life of the improvement. When assets are retired or otherwise disposed of, theircosts and related accumulated depreciation are removed from the accounts and any resulting gainsor losses are included in income from operations for the period. Depreciation is computed by thestraight-line method based on the estimated useful lives of the depreciable assets. Generally, theestimated useful lives of the assets are:
Buildings and improvements10 to 40
years
Furniture and fixtures3 to 7years
Machinery and equipment3 to 14
years
Capital leases (based on lease term)3 to 25
years
Costs related to routine repairs and maintenance are expensed as incurred.
Internally Developed Software — We capitalize certain costs associated with thedevelopment of internal-use software. Generally, these costs are related to significant softwaredevelopment projects and are amortized over their estimated useful life, typically three to fiveyears, upon implementation of the software.
Intangible Assets — Intangible assets, excluding trademarks (which are considered to havean indefinite life), consist primarily of engineering drawings, distribution networks, existingcustomer relationships, software, patents and other items that are being amortized over their
Copyright © 2013 www.secdatabase.com. All Rights Reserved.Please Consider the Environment Before Printing This Document
estimated useful lives generally ranging from 3 to 40 years. These assets are reviewed forimpairment whenever events and circumstances indicate impairment may have occurred.
Deferred Loan Costs — Deferred loan costs, consisting of fees and other expenses associatedwith debt financing, are amortized over the term of the associated debt using the effective interestmethod. Additional amortization is recorded in periods where optional prepayments on debt aremade.
Fair Values of Financial Instruments — The carrying amounts of our financial instrumentsapproximated fair value at December 31, 2011 and 2010.
Assets and liabilities recorded at fair value in our consolidated balance sheets are categorizedbased upon the level of judgment associated with the inputs used to measure their fair values.Hierarchical levels, as defined by Accounting Standards Codification ("ASC") 820, "Fair ValueMeasurements and Disclosures," are directly related to the amount of subjectivity associated withthe inputs to fair valuation of these assets and liabilities. An asset or a liability’s categorizationwithin the fair value hierarchy is based on the lowest level of significant input to its valuation.Hierarchical levels are as follows:
Level I — Inputs are unadjusted, quoted prices in active markets for identical assetsor liabilities at the measurement date.
Level II — Inputs (other than quoted prices included in Level I) are either directly orindirectly observable for the asset or liability through correlation with market data at themeasurement date and for the duration of the instrument’s anticipated life.
Level III — Inputs reflect management’s best estimate of what market participantswould use in pricing the asset or liability at the measurement date. Consideration is given tothe risk inherent in the valuation technique and the risk inherent in the inputs to the model.
Derivatives and Hedging Activities — As part of our risk management strategy, we enterinto derivative contracts to mitigate certain financial risks related to foreign currencies and interestrates. We have a risk-management and derivatives policy outlining the conditions under which wecan enter into financial derivative transactions.
We employ a foreign currency economic hedging strategy to minimize potential losses inearnings or cash flows from unfavorable foreign currency exchange rate movements. This strategyalso minimizes potential gains from favorable exchange rate movements. Foreign currencyexposures arise from transactions, including firm commitments and anticipated transactions,denominated in a currency other than an entity’s functional currency and from translation offoreign-denominated assets and liabilities into U.S. dollars. The primary currencies in which weoperate, in addition to the U.S. dollar, are the Argentine peso, Australian dollar, Brazilian real,British pound, Canadian dollar, Chinese yuan, Colombian peso, Euro, Indian rupee, Japanese yen,Mexican peso, Singapore dollar, Swedish krona and Venezuelan bolivar. We enter into interestrate swap agreements for the purpose of hedging our exposure to floating interest rates on certainportions of our debt.
Our policy to achieve hedge accounting treatment requires us to document all relationshipsbetween hedging instruments and hedged items, our risk management objective and strategy forentering into hedges and whether we intend to designate a formal hedge accounting relationship.This process includes linking all derivatives that are designated in a formal hedge accountingrelationship as fair value, cash flow or foreign currency hedges of (1) specific assets and liabilitieson the balance sheet or (2) specific firm commitments or forecasted transactions. In cases wherewe designate a hedge, we assess (both at the inception of the hedge and on an ongoing basis)whether the derivatives have been highly effective in offsetting changes in the fair value or cashflows of hedged items and whether those derivatives may be expected to remain highly effectivein future periods. Failure to demonstrate effectiveness in offsetting exposures retroactively orprospectively would cause us to deem the hedge ineffective.
All derivatives are recognized on the balance sheet at their fair values. For derivatives thatdo not qualify for hedge accounting or for which we have not elected to apply hedge accounting,which includes substantially all of our forward exchange contracts, the changes in the fair values
Copyright © 2013 www.secdatabase.com. All Rights Reserved.Please Consider the Environment Before Printing This Document
of these derivatives are recognized in other income (expense), net in the consolidated statementsof income.
At the inception of a new derivative contract for which formal hedge accounting has beenelected, our policy requires us to designate the derivative as a hedge of (a) a forecasted transactionor (b) the variability of cash flows that are to be received or paid in connection with a recognizedasset or liability (a "cash flow" hedge). We have not historically entered into hedges of fair values.Changes in the fair value of a derivative that is highly effective, documented, designated andqualified as a cash flow hedge, to the extent that the hedge is effective, are recorded in othercomprehensive (expense) income, until earnings are affected by the variability of cash flowsof the hedged transaction. Upon settlement, realized gains and losses are recognized in otherincome (expense), net in the consolidated statements of income. Any hedge ineffectiveness (whichrepresents the amount by which the changes in the fair value of the derivative do not mirror thechange in the cash flow of the forecasted transaction) is recorded in current period earnings.
We discontinue hedge accounting when:
• we deem the hedge to be ineffective and determine that the designation of the derivativeas a hedging instrument is no longer appropriate;
• the derivative no longer effectively offsets changes in the cash flows of a hedged item(such as firm commitments or contracts);
• the derivative expires, terminates or is sold; or
• occurrence of the contracted or committed transaction is no longer probable, or will notoccur in the originally expected period.
When hedge accounting is discontinued and the derivative remains outstanding, we carry thederivative at its estimated fair value on the balance sheet, recognizing changes in the fair value incurrent period earnings. If a cash flow hedge becomes ineffective, any deferred gains or losses onthe cash flow hedge remain in accumulated other comprehensive loss until the exposure relatingto the item underlying the hedge is recognized. If it becomes probable that a hedged forecastedtransaction will not occur, deferred gains or losses on the hedging instrument are recognized inearnings immediately.
Foreign Currency Translation — Assets and liabilities of our foreign subsidiaries aretranslated to U.S. dollars at exchange rates prevailing at the balance sheet date, while income andexpenses are translated at average rates for each month. Translation gains and losses are reportedas a component of accumulated other comprehensive loss.
Transaction and translation gains and losses arising from intercompany balances are reportedas a component of accumulated other comprehensive loss when the underlying transaction stemsfrom a long-term equity investment or from debt designated as not due in the foreseeable future.Otherwise, we recognize transaction gains and losses arising from intercompany transactionsas a component of income. Where intercompany balances are not long-term investment relatedor not designated as due beyond the foreseeable future, we may mitigate risk associated withforeign currency fluctuations by entering into forward exchange contracts. See Note 6 for furtherdiscussion of these forward exchange contracts.
Transactional currency gains and losses arising from transactions in currencies other thanour sites’ functional currencies and changes in fair value of forward exchange contracts that donot qualify for hedge accounting are included in our consolidated results of operations. For theyears ended December 31, 2011, 2010 and 2009, we recognized net gains (losses) of $3.7 million,$(26.5) million and $(7.8) million, respectively, of such amounts in other income (expense), net inthe accompanying consolidated statements of income.
Stock-Based Compensation — Stock-based compensation is measured at the grant-date fairvalue. The exercise price of stock option awards and the value of restricted share, restricted shareunit and performance-based unit awards (collectively referred to as "Restricted Shares") are setat the closing price of our common stock on the New York Stock Exchange on the date of grant,which is the date such grants are authorized by our Board of Directors. Restricted share units
Copyright © 2013 www.secdatabase.com. All Rights Reserved.Please Consider the Environment Before Printing This Document

and performance-based units refer to restricted awards that do not have voting rights and accruedividends, which are forfeited if vesting does not occur.
Options are expensed using the graded vesting model, whereby we recognize compensationcost over the requisite service period for each separately vesting tranche of the award. We adjustshare-based compensation at least annually for changes to the estimate of expected equity awardforfeitures based on actual forfeiture experience. The intrinsic value of Restricted Shares, whichis typically the product of share price at the date of grant and the number of Restricted Sharesgranted, is amortized on a straight-line basis to compensation expense over the periods in whichthe restrictions lapse based on the expected number of shares that will vest. The forfeiture rateis based on unvested Restricted Shares forfeited compared with original total Restricted Sharesgranted over a 4-year period, excluding significant forfeiture events that are not expected to recur.
Earnings Per Share — We use the two-class method of calculating Earnings Per Share("EPS"). The "two-class" method is an earnings allocation formula that determines earnings pershare for each class of common stock and participating security as if all earnings for the periodhad been distributed. Unvested restricted share awards that earn non-forfeitable dividend rightsqualify as participating securities and, accordingly, are included in the basic computation as such.Our unvested restricted shares participate on an equal basis with common shares; therefore, thereis no difference in undistributed earnings allocated to each participating security. Accordingly, thepresentation below is prepared on a combined basis and is presented as earnings per commonshare. The following is a reconciliation of net earnings of Flowserve Corporation and weightedaverage shares for calculating basic net earnings per common share.
Earnings per weighted average common share outstanding was calculated as follows:
Year Ended December 31,
2011 2010 2009
(Amounts in thousands, except per sharedata)
Net earnings of Flowserve Corporation $ 428,582 $ 388,290 $ 427,887Dividends on restricted shares not expected to vest 15 16 23Earnings attributable to common and participatingshareholders $ 428,597 $ 388,306 $ 427,910
Weighted average shares:Common stock 55,273 55,434 55,400Participating securities 270 330 440Denominator for basic earnings per common share 55,543 55,764 55,840Effect of potentially dilutive securities 559 651 522
Denominator for diluted earnings per common share 56,102 56,415 56,362Net earnings per share attributable to FlowserveCorporation common shareholders:
Basic $ 7.72 $ 6.96 $ 7.66Diluted 7.64 6.88 7.59
Diluted earnings per share above is based upon the weighted average number of shares asdetermined for basic earnings per share plus shares potentially issuable in conjunction with stockoptions and Restricted Shares.
For each of the three years ended December 31, 2011, 2010 and 2009, we had no optionsto purchase common stock that were excluded from the computations of potentially dilutivesecurities.
Research and Development Expense — Research and development costs are charged toexpense when incurred. Aggregate research and development costs included in selling, generaland administrative expenses ("SG&A") were $35.0 million, $29.5 million and $29.4 million in
Copyright © 2013 www.secdatabase.com. All Rights Reserved.Please Consider the Environment Before Printing This Document
2011, 2010 and 2009, respectively. Costs incurred for research and development primarily includesalaries and benefits and consumable supplies, as well as rent, professional fees, utilities and thedepreciation of property and equipment used in research and development activities.
Business Combinations — All business combinations referred to in these financialstatements used the purchase method of accounting, under which we allocate the purchase priceto the identifiable tangible and intangible assets and liabilities, recognizing goodwill when thepurchase price exceeds fair value of such identifiable assets acquired, net of liabilities assumed.
Accounting Developments
Pronouncements Implemented
In January 2010, the Financial Accounting Standards Board ("FASB") issued AccountingStandards Update ("ASU") No. 2010-06, "Fair Value Measurements and Disclosures (ASC 820):Improving Disclosures about Fair Value Measurements," which requires additional disclosures ontransfers in and out of Level I and Level II and on activity for Level III fair value measurements.The new disclosures and clarifications of existing disclosures are effective for interim and annualreporting periods beginning after December 15, 2009, except for the disclosures of Level IIIactivity, which are effective for fiscal years beginning after December 15, 2010 and for interimperiods within those fiscal years. Our adoption of ASU No. 2010-06 had no material impact on ourconsolidated financial condition or results of operations.
In September 2009, the FASB issued ASU No. 2009-13, "Revenue Recognition (ASC 605):Multiple-Deliverable Revenue Arrangements - a consensus of the FASB Emerging Issues TaskForce," which addresses the accounting for multiple-deliverable arrangements to enable vendors toaccount for products or services separately rather than as a combined unit and requires expandedrevenue recognition policy disclosures. This amendment addresses how to separate deliverablesand how to measure and allocate arrangement consideration to one or more units of accounting.Our adoption of ASU No. 2009-13, effective January 1, 2011, had no impact on our consolidatedfinancial condition or results of operations.
In December 2010, the FASB issued ASU No. 2010-28, "Intangibles - Goodwill and Other(ASC 350): When to Perform Step 2 of the Goodwill Impairment Test for Reporting Unitswith Zero or Negative Carrying Amounts - a consensus of the FASB Emerging Issues TaskForce," which modifies Step 1 of the goodwill impairment test for reporting units with zero ornegative carrying amounts. This amendment requires an entity to perform Step 2 of the goodwillimpairment test if it is more likely than not that a goodwill impairment exists and to considerwhether there are any adverse qualitative factors indicating that an impairment may exist. Ouradoption of ASU No. 2010-28, effective January 1, 2011, had no impact on our consolidatedfinancial condition or results of operations.
In December 2010, the FASB issued ASU No. 2010-29, "Business Combinations (ASC805): Disclosure of Supplementary Pro Forma Information for Business Combinations - aconsensus of the FASB Emerging Issues Task Force," which specifies that if a public entitypresents comparative financial statements, the entity should disclose revenue and earnings ofthe combined entity as though the business combination that occurred during the current yearhad occurred as of the beginning of the comparable prior annual reporting period only. Thisamendment also expands the supplemental pro forma disclosures under ASC 805 to include adescription of the nature and amount of material, nonrecurring pro forma adjustments directlyattributable to the business combination included in the reported pro forma revenue and earnings.Our adoption of ASU No. 2010-29, effective January 1, 2011, had no material impact on ourconsolidated financial condition or results of operations.
Pronouncements Not Yet Implemented
In June 2011, the FASB issued ASU No. 2011-05, "Comprehensive Income (ASC 220):Presentation of Comprehensive Income," which specifies that an entity has the option to presentthe total of comprehensive income, the components of net income, and the components of othercomprehensive income either in a single continuous statement of comprehensive income or in twoseparate but consecutive statements. This amendment also requires an entity to present on the face
Copyright © 2013 www.secdatabase.com. All Rights Reserved.Please Consider the Environment Before Printing This Document

of the financial statements reclassification adjustments for items that are reclassified from othercomprehensive income to net income. In December 2011, the FASB issued ASU No. 2011-12 todefer the requirement to present on the face of the financial statements reclassification adjustmentsfor items that are reclassified from other comprehensive income to net income. ASU No. 2011-05and 2011-12 are effective for fiscal years, and interim periods within those years, beginning afterDecember 15, 2011. The presentation and disclosure requirements shall be applied retrospectivelyfor all periods presented. The adoption of ASU No. 2011-05 and 2011-12 will not have an impacton our consolidated financial condition and results of operations.
In September 2011, the FASB issued ASU No. 2011-08, "Intangibles - Goodwill and Other(ASC 350): Testing Goodwill for Impairment," which specifies that an entity has the option to firstassess qualitative factors to determine whether it is more likely than not that the fair value of areporting unit is less than its carrying amount as a basis for determining whether it is necessaryto perform the two-step goodwill impairment test. An entity is not required to calculate the fairvalue of a reporting unit unless the entity determines that it is more likely than not that its fairvalue is less than its carrying amount. ASU No. 2011-08 is effective for fiscal years, and interimperiods within those years, beginning after December 15, 2011. We do not expect the adoption ofASU No. 2011-08 to have a material impact on our consolidated financial condition and results ofoperations.
In December 2011, the FASB issued ASU No. 2011-11, "Disclosures about OffsettingAssets and Liabilities," which requires enhanced disclosures about financial instruments andderivative instruments that are either (1) offset in accordance with either ASC 210-20-45, "BalanceSheet - Offsetting," or ASC 815-10-45, "Derivatives and Hedging - Overall," or (2) subject toan enforceable master netting arrangement or similar agreement, irrespective of whether theyare offset in accordance with either ASC 210-20-45 or ASC 815-10-45. The adoption of ASUNo. 2011-11 will not have an impact on our consolidated financial condition and results ofoperations.
Copyright © 2013 www.secdatabase.com. All Rights Reserved.Please Consider the Environment Before Printing This Document
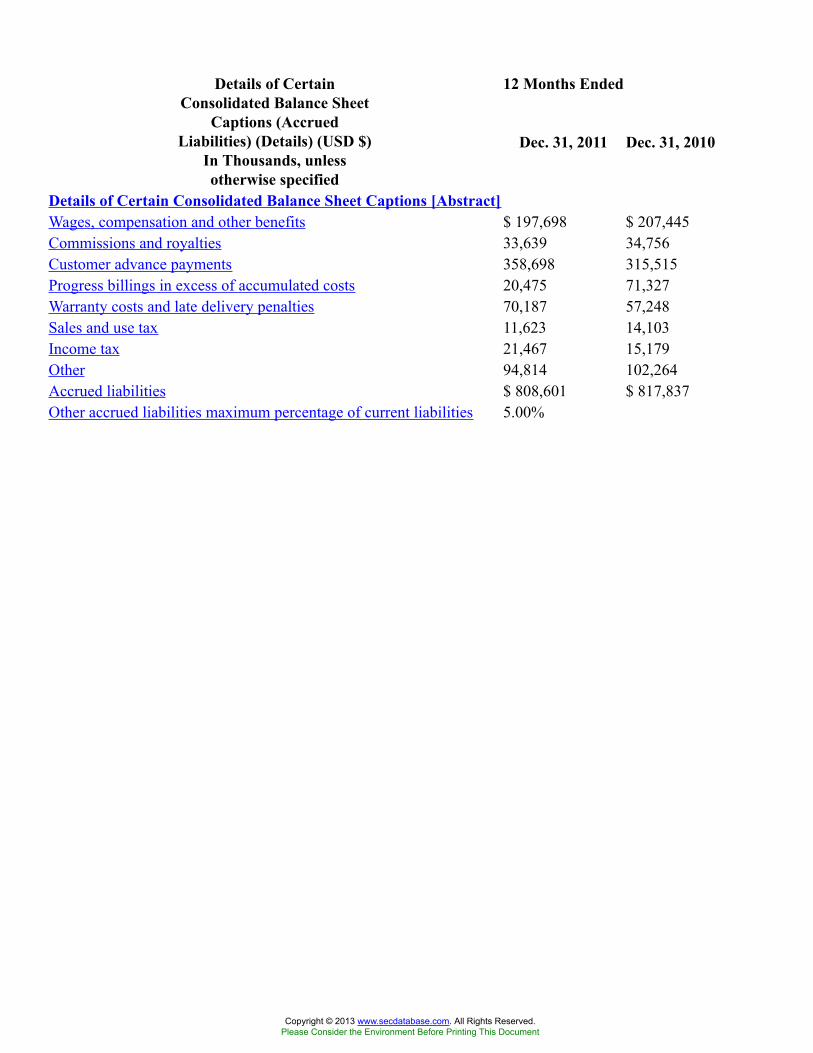
12 Months EndedDetails of CertainConsolidated Balance Sheet
Captions (AccruedLiabilities) (Details) (USD $)
In Thousands, unlessotherwise specified
Dec. 31, 2011 Dec. 31, 2010
Details of Certain Consolidated Balance Sheet Captions [Abstract]Wages, compensation and other benefits $ 197,698 $ 207,445Commissions and royalties 33,639 34,756Customer advance payments 358,698 315,515Progress billings in excess of accumulated costs 20,475 71,327Warranty costs and late delivery penalties 70,187 57,248Sales and use tax 11,623 14,103Income tax 21,467 15,179Other 94,814 102,264Accrued liabilities $ 808,601 $ 817,837Other accrued liabilities maximum percentage of current liabilities 5.00%
Copyright © 2013 www.secdatabase.com. All Rights Reserved.Please Consider the Environment Before Printing This Document
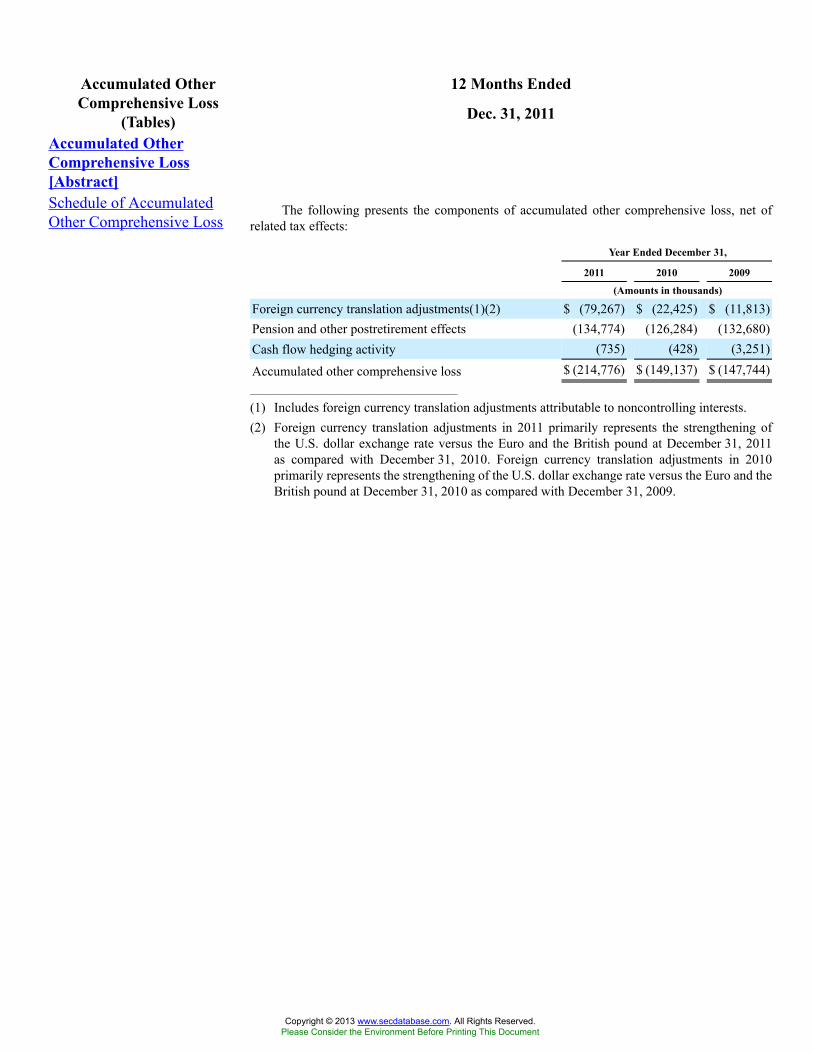
12 Months EndedAccumulated OtherComprehensive Loss
(Tables) Dec. 31, 2011
Accumulated OtherComprehensive Loss[Abstract]Schedule of AccumulatedOther Comprehensive Loss
The following presents the components of accumulated other comprehensive loss, net ofrelated tax effects:
Year Ended December 31,
2011 2010 2009
(Amounts in thousands)
Foreign currency translation adjustments(1)(2) $ (79,267) $ (22,425) $ (11,813)Pension and other postretirement effects (134,774) (126,284) (132,680)Cash flow hedging activity (735) (428) (3,251)
Accumulated other comprehensive loss $ (214,776) $ (149,137) $ (147,744)_______________________________________
(1) Includes foreign currency translation adjustments attributable to noncontrolling interests.(2) Foreign currency translation adjustments in 2011 primarily represents the strengthening of
the U.S. dollar exchange rate versus the Euro and the British pound at December 31, 2011as compared with December 31, 2010. Foreign currency translation adjustments in 2010primarily represents the strengthening of the U.S. dollar exchange rate versus the Euro and theBritish pound at December 31, 2010 as compared with December 31, 2009.
Copyright © 2013 www.secdatabase.com. All Rights Reserved.Please Consider the Environment Before Printing This Document
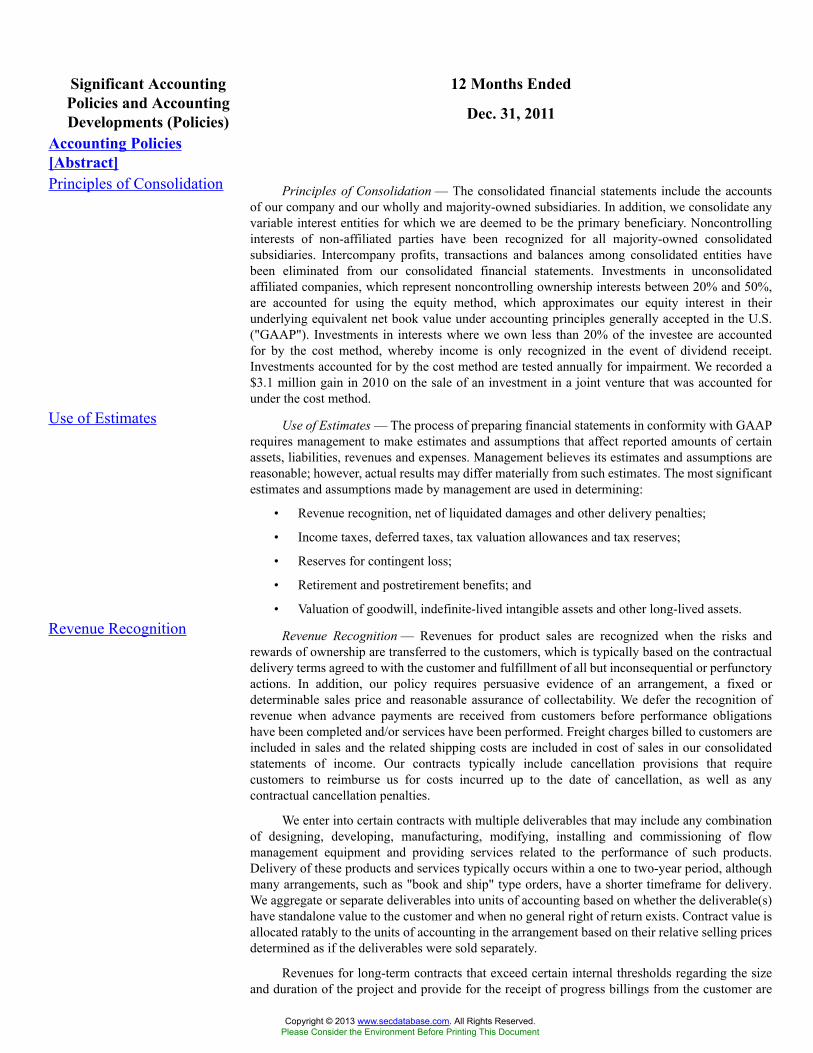
12 Months EndedSignificant AccountingPolicies and AccountingDevelopments (Policies) Dec. 31, 2011
Accounting Policies[Abstract]Principles of Consolidation Principles of Consolidation — The consolidated financial statements include the accounts
of our company and our wholly and majority-owned subsidiaries. In addition, we consolidate anyvariable interest entities for which we are deemed to be the primary beneficiary. Noncontrollinginterests of non-affiliated parties have been recognized for all majority-owned consolidatedsubsidiaries. Intercompany profits, transactions and balances among consolidated entities havebeen eliminated from our consolidated financial statements. Investments in unconsolidatedaffiliated companies, which represent noncontrolling ownership interests between 20% and 50%,are accounted for using the equity method, which approximates our equity interest in theirunderlying equivalent net book value under accounting principles generally accepted in the U.S.("GAAP"). Investments in interests where we own less than 20% of the investee are accountedfor by the cost method, whereby income is only recognized in the event of dividend receipt.Investments accounted for by the cost method are tested annually for impairment. We recorded a$3.1 million gain in 2010 on the sale of an investment in a joint venture that was accounted forunder the cost method.
Use of Estimates Use of Estimates — The process of preparing financial statements in conformity with GAAPrequires management to make estimates and assumptions that affect reported amounts of certainassets, liabilities, revenues and expenses. Management believes its estimates and assumptions arereasonable; however, actual results may differ materially from such estimates. The most significantestimates and assumptions made by management are used in determining:
• Revenue recognition, net of liquidated damages and other delivery penalties;
• Income taxes, deferred taxes, tax valuation allowances and tax reserves;
• Reserves for contingent loss;
• Retirement and postretirement benefits; and
• Valuation of goodwill, indefinite-lived intangible assets and other long-lived assets.Revenue Recognition Revenue Recognition — Revenues for product sales are recognized when the risks and
rewards of ownership are transferred to the customers, which is typically based on the contractualdelivery terms agreed to with the customer and fulfillment of all but inconsequential or perfunctoryactions. In addition, our policy requires persuasive evidence of an arrangement, a fixed ordeterminable sales price and reasonable assurance of collectability. We defer the recognition ofrevenue when advance payments are received from customers before performance obligationshave been completed and/or services have been performed. Freight charges billed to customers areincluded in sales and the related shipping costs are included in cost of sales in our consolidatedstatements of income. Our contracts typically include cancellation provisions that requirecustomers to reimburse us for costs incurred up to the date of cancellation, as well as anycontractual cancellation penalties.
We enter into certain contracts with multiple deliverables that may include any combinationof designing, developing, manufacturing, modifying, installing and commissioning of flowmanagement equipment and providing services related to the performance of such products.Delivery of these products and services typically occurs within a one to two-year period, althoughmany arrangements, such as "book and ship" type orders, have a shorter timeframe for delivery.We aggregate or separate deliverables into units of accounting based on whether the deliverable(s)have standalone value to the customer and when no general right of return exists. Contract value isallocated ratably to the units of accounting in the arrangement based on their relative selling pricesdetermined as if the deliverables were sold separately.
Revenues for long-term contracts that exceed certain internal thresholds regarding the sizeand duration of the project and provide for the receipt of progress billings from the customer are
Copyright © 2013 www.secdatabase.com. All Rights Reserved.Please Consider the Environment Before Printing This Document
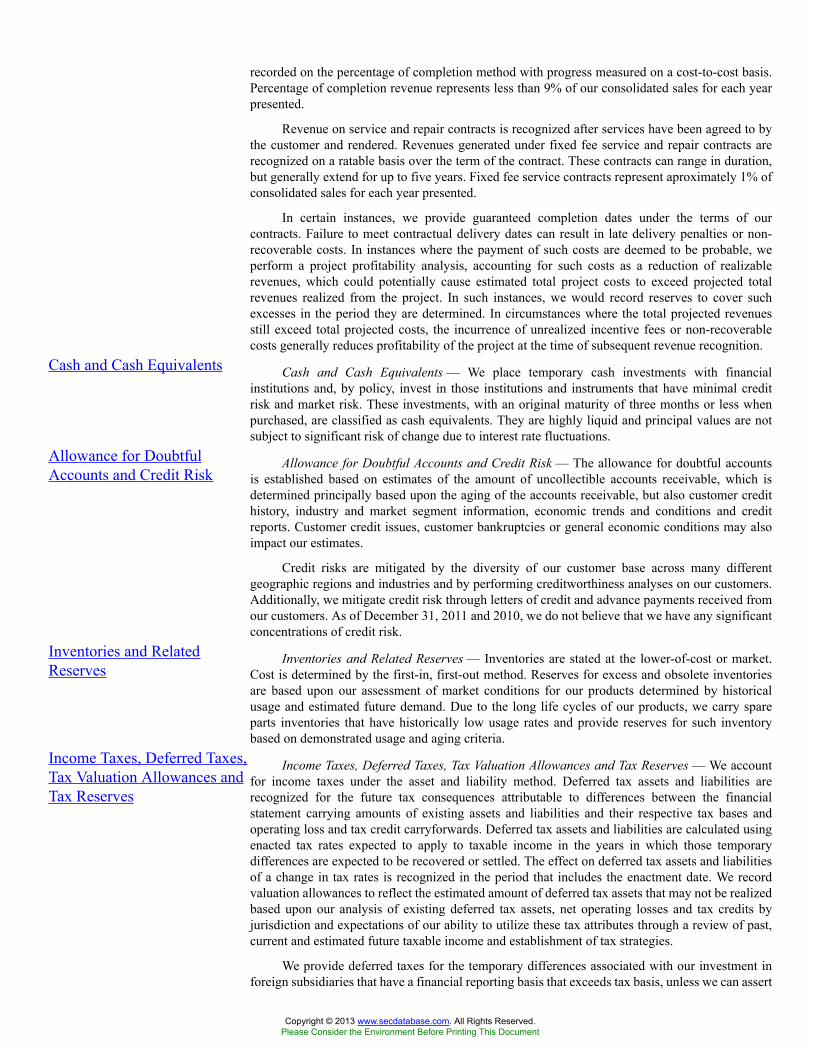
recorded on the percentage of completion method with progress measured on a cost-to-cost basis.Percentage of completion revenue represents less than 9% of our consolidated sales for each yearpresented.
Revenue on service and repair contracts is recognized after services have been agreed to bythe customer and rendered. Revenues generated under fixed fee service and repair contracts arerecognized on a ratable basis over the term of the contract. These contracts can range in duration,but generally extend for up to five years. Fixed fee service contracts represent aproximately 1% ofconsolidated sales for each year presented.
In certain instances, we provide guaranteed completion dates under the terms of ourcontracts. Failure to meet contractual delivery dates can result in late delivery penalties or non-recoverable costs. In instances where the payment of such costs are deemed to be probable, weperform a project profitability analysis, accounting for such costs as a reduction of realizablerevenues, which could potentially cause estimated total project costs to exceed projected totalrevenues realized from the project. In such instances, we would record reserves to cover suchexcesses in the period they are determined. In circumstances where the total projected revenuesstill exceed total projected costs, the incurrence of unrealized incentive fees or non-recoverablecosts generally reduces profitability of the project at the time of subsequent revenue recognition.
Cash and Cash Equivalents Cash and Cash Equivalents — We place temporary cash investments with financialinstitutions and, by policy, invest in those institutions and instruments that have minimal creditrisk and market risk. These investments, with an original maturity of three months or less whenpurchased, are classified as cash equivalents. They are highly liquid and principal values are notsubject to significant risk of change due to interest rate fluctuations.
Allowance for DoubtfulAccounts and Credit Risk
Allowance for Doubtful Accounts and Credit Risk — The allowance for doubtful accountsis established based on estimates of the amount of uncollectible accounts receivable, which isdetermined principally based upon the aging of the accounts receivable, but also customer credithistory, industry and market segment information, economic trends and conditions and creditreports. Customer credit issues, customer bankruptcies or general economic conditions may alsoimpact our estimates.
Credit risks are mitigated by the diversity of our customer base across many differentgeographic regions and industries and by performing creditworthiness analyses on our customers.Additionally, we mitigate credit risk through letters of credit and advance payments received fromour customers. As of December 31, 2011 and 2010, we do not believe that we have any significantconcentrations of credit risk.
Inventories and RelatedReserves
Inventories and Related Reserves — Inventories are stated at the lower-of-cost or market.Cost is determined by the first-in, first-out method. Reserves for excess and obsolete inventoriesare based upon our assessment of market conditions for our products determined by historicalusage and estimated future demand. Due to the long life cycles of our products, we carry spareparts inventories that have historically low usage rates and provide reserves for such inventorybased on demonstrated usage and aging criteria.
Income Taxes, Deferred Taxes,Tax Valuation Allowances andTax Reserves
Income Taxes, Deferred Taxes, Tax Valuation Allowances and Tax Reserves — We accountfor income taxes under the asset and liability method. Deferred tax assets and liabilities arerecognized for the future tax consequences attributable to differences between the financialstatement carrying amounts of existing assets and liabilities and their respective tax bases andoperating loss and tax credit carryforwards. Deferred tax assets and liabilities are calculated usingenacted tax rates expected to apply to taxable income in the years in which those temporarydifferences are expected to be recovered or settled. The effect on deferred tax assets and liabilitiesof a change in tax rates is recognized in the period that includes the enactment date. We recordvaluation allowances to reflect the estimated amount of deferred tax assets that may not be realizedbased upon our analysis of existing deferred tax assets, net operating losses and tax credits byjurisdiction and expectations of our ability to utilize these tax attributes through a review of past,current and estimated future taxable income and establishment of tax strategies.
We provide deferred taxes for the temporary differences associated with our investment inforeign subsidiaries that have a financial reporting basis that exceeds tax basis, unless we can assert
Copyright © 2013 www.secdatabase.com. All Rights Reserved.Please Consider the Environment Before Printing This Document
permanent reinvestment in foreign jurisdictions. Financial reporting basis and tax basis differencesin investments in foreign subsidiaries consist of both unremitted earnings and losses, as well asforeign currency translation adjustments.
The amount of income taxes we pay is subject to ongoing audits by federal, state, and foreigntax authorities, which often result in proposed assessments. We establish reserves for open taxyears for uncertain tax positions that may be subject to challenge by various tax authorities. Theconsolidated tax provision and related accruals include the impact of such reasonably estimablelosses and related interest and penalties as deemed appropriate.
We recognize the tax benefit from an uncertain tax position only if it is more likely than notthat the tax position will be sustained on examination by the taxing authorities. The determinationis based on the technical merits of the position and presumes that each uncertain tax position willbe examined by the relevant taxing authority that has full knowledge of all relevant information.The tax benefits recognized in the financial statements from such a position are measured based onthe largest benefit that has a greater than fifty percent likelihood of being realized upon ultimatesettlement.
While we believe we have adequately provided for any reasonably foreseeable outcomerelated to these matters, our future results may include favorable or unfavorable adjustments to ourestimated tax liabilities. To the extent that the expected tax outcome of these matters changes, suchchanges in estimate will impact the income tax provision in the period in which such determinationis made.
Legal and EnvironmentalAccruals
Legal and Environmental Accruals — Legal and environmental reserves are recorded basedupon a case-by-case analysis of the relevant facts and circumstances and an assessment of potentiallegal obligations and costs. Amounts relating to legal and environmental liabilities are recordedwhen it is probable that a loss has been incurred and such loss is estimable. Assessments of legaland environmental costs are based on information obtained from our independent and in-houseexperts and our loss experience in similar situations. Estimates are updated as applicable when newinformation regarding the facts and circumstances of each matter becomes available. Legal feesassociated with legal and environmental liabilities are expensed as incurred.
Warranty Accruals Warranty Accruals — Warranty obligations are based upon product failure rates, materialsusage, service delivery costs, an analysis of all identified or expected claims and an estimate of thecost to resolve such claims. The estimates of expected claims are generally a factor of historicalclaims and known product issues. Warranty obligations based on these factors are adjusted basedon historical sales trends for the preceding 24 months.
Insurance Accruals Insurance Accruals — Insurance accruals are recorded for wholly or partially self-insuredrisks such as medical benefits and workers’ compensation and are based upon an analysis of ourclaim loss history, insurance deductibles, policy limits and other relevant factors and are includedin accrued liabilities in our consolidated balance sheets. The estimates are based upon informationreceived from actuaries, insurance company adjusters, independent claims administrators or otherindependent sources. Changes in claims and differences between actual and expected claimlosses could impact future accruals. Receivables from insurance carriers are estimated using ourhistorical experience with insurance recovery rates and estimates of future recoveries, whichinclude estimates of coverage and financial viability of our insurance carriers. Estimatedreceivables are included in accounts receivable, net and other assets, net, as applicable, in ourconsolidated balance sheets.
Pension and PostretirementObligations
Pension and Postretirement Obligations — Determination of pension and postretirementbenefits obligations is based on estimates made by management in consultation with independentactuaries and investment advisors. Inherent in these valuations are assumptions including discountrates, expected rates of return on plan assets, retirement rates, mortality rates and rates ofcompensation increase and other factors. Current market conditions, including changes in rates ofreturn, interest rates and medical inflation rates, are considered in selecting these assumptions.
Copyright © 2013 www.secdatabase.com. All Rights Reserved.Please Consider the Environment Before Printing This Document
Actuarial gains and losses and prior service costs are recognized in accumulated othercomprehensive loss as they arise and we amortize these costs into net pension expense over theremaining expected service period.
Valuation of Goodwill,Indefinite-Lived IntangibleAssets and Other Long-LivedAssets
Valuation of Goodwill, Indefinite-Lived Intangible Assets and Other Long-Lived Assets— The value of goodwill and indefinite-lived intangible assets is tested for impairment as ofDecember 31 each year or whenever events or circumstances indicate such assets may be impaired.In connection with our segment reorganization in 2010, we reallocated goodwill to our redefinedreporting units and evaluated goodwill for impairment. The identification of our reporting unitsbegan at the operating segment level: EPD, IPD and FCD, and considered whether componentsone level below the operating segment levels should be identified as reporting units for purposeof testing goodwill for impairment based on certain conditions. These conditions included, amongother factors, (i) the extent to which a component represents a business and (ii) the aggregationof economically similar components within the operating segments and resulted in nine reportingunits. Other factors that were considered in determining whether the aggregation of componentswas appropriate included the similarity of the nature of the products and services, the nature of theproduction processes, the methods of distribution and the types of industries served.
Impairment losses for goodwill are recognized whenever the implied fair value of goodwillis less than the carrying value. We estimate the fair value of our reporting units based on anincome approach, whereby we calculate the fair value of a reporting unit based on the presentvalue of estimated future cash flows. A discounted cash flow analysis requires us to make variousjudgmental assumptions about future sales, operating margins, growth rates and discount rates,which are based on our budgets, business plans, economic projections, anticipated future cashflows and market participants. Assumptions are also made for varying perpetual growth rates forperiods beyond the long-term business plan period. We did not record an impairment of goodwillin 2011, 2010 or 2009.
We also consider our market capitalization in our evaluation of the fair value of our goodwill.Although our market capitalization declined compared with 2010, it did not decline to a level thatindicated a potential impairment of our goodwill as of December 31, 2011.
Impairment losses for indefinite-lived intangible assets are recognized whenever theestimated fair value is less than the carrying value. Fair values are calculated for trademarks usinga "relief from royalty" method, which estimates the fair value of the trademarks by determiningthe present value of the royalty payments that are avoided as a result of owning the trademark.This method includes judgmental assumptions about sales growth and discount rates that havea significant impact on the fair value and are substantially consistent with the assumptions usedto determine the fair value of our reporting units discussed above. We did not record a materialimpairment of our trademarks in 2011, 2010 or 2009.
The net realizable value of other long-lived assets, including property, plant and equipmentand finite-lived intangible assets, is reviewed periodically, when indicators of potentialimpairments are present, based upon an assessment of the estimated future cash flows related tothose assets, utilizing a methodology similar to that for goodwill. Additional considerations relatedto our long-lived assets include expected maintenance and improvements, changes in expecteduses and ongoing operating performance and utilization.
Property, Plant and Equipmentand Depreciation Property, Plant and Equipment and Depreciation — Property, plant and equipment are stated
at historical cost, less accumulated depreciation. If asset retirement obligations exist, they arecapitalized as part of the carrying amount of the asset and depreciated over the remaining usefullife of the asset. The useful lives of leasehold improvements are the lesser of the remaining leaseterm or the useful life of the improvement. When assets are retired or otherwise disposed of, theircosts and related accumulated depreciation are removed from the accounts and any resulting gainsor losses are included in income from operations for the period. Depreciation is computed by thestraight-line method based on the estimated useful lives of the depreciable assets.
Costs related to routine repairs and maintenance are expensed as incurredInternally Developed Software Internally Developed Software — We capitalize certain costs associated with the
development of internal-use software. Generally, these costs are related to significant software
Copyright © 2013 www.secdatabase.com. All Rights Reserved.Please Consider the Environment Before Printing This Document
development projects and are amortized over their estimated useful life, typically three to fiveyears, upon implementation of the software
Intangible AssetsIntangible Assets — Intangible assets, excluding trademarks (which are considered to have
an indefinite life), consist primarily of engineering drawings, distribution networks, existingcustomer relationships, software, patents and other items that are being amortized over theirestimated useful lives generally ranging from 3 to 40 years. These assets are reviewed forimpairment whenever events and circumstances indicate impairment may have occurred.
Deferred Loan CostsDeferred Loan Costs — Deferred loan costs, consisting of fees and other expenses associated
with debt financing, are amortized over the term of the associated debt using the effective interestmethod. Additional amortization is recorded in periods where optional prepayments on debt aremade.
Fair Value of FinancialInstruments Fair Values of Financial Instruments — The carrying amounts of our financial instruments
approximated fair value at December 31, 2011 and 2010.
Assets and liabilities recorded at fair value in our consolidated balance sheets are categorizedbased upon the level of judgment associated with the inputs used to measure their fair values.Hierarchical levels, as defined by Accounting Standards Codification ("ASC") 820, "Fair ValueMeasurements and Disclosures," are directly related to the amount of subjectivity associated withthe inputs to fair valuation of these assets and liabilities. An asset or a liability’s categorizationwithin the fair value hierarchy is based on the lowest level of significant input to its valuation.Hierarchical levels are as follows:
Level I — Inputs are unadjusted, quoted prices in active markets for identical assetsor liabilities at the measurement date.
Level II — Inputs (other than quoted prices included in Level I) are either directly orindirectly observable for the asset or liability through correlation with market data at themeasurement date and for the duration of the instrument’s anticipated life.
Level III — Inputs reflect management’s best estimate of what market participantswould use in pricing the asset or liability at the measurement date. Consideration is given tothe risk inherent in the valuation technique and the risk inherent in the inputs to the model.
Derivatives and HedgingActivities Derivatives and Hedging Activities — As part of our risk management strategy, we enter
into derivative contracts to mitigate certain financial risks related to foreign currencies and interestrates. We have a risk-management and derivatives policy outlining the conditions under which wecan enter into financial derivative transactions.
We employ a foreign currency economic hedging strategy to minimize potential losses inearnings or cash flows from unfavorable foreign currency exchange rate movements. This strategyalso minimizes potential gains from favorable exchange rate movements. Foreign currencyexposures arise from transactions, including firm commitments and anticipated transactions,denominated in a currency other than an entity’s functional currency and from translation offoreign-denominated assets and liabilities into U.S. dollars. The primary currencies in which weoperate, in addition to the U.S. dollar, are the Argentine peso, Australian dollar, Brazilian real,British pound, Canadian dollar, Chinese yuan, Colombian peso, Euro, Indian rupee, Japanese yen,Mexican peso, Singapore dollar, Swedish krona and Venezuelan bolivar. We enter into interestrate swap agreements for the purpose of hedging our exposure to floating interest rates on certainportions of our debt.
Our policy to achieve hedge accounting treatment requires us to document all relationshipsbetween hedging instruments and hedged items, our risk management objective and strategy forentering into hedges and whether we intend to designate a formal hedge accounting relationship.This process includes linking all derivatives that are designated in a formal hedge accountingrelationship as fair value, cash flow or foreign currency hedges of (1) specific assets and liabilitieson the balance sheet or (2) specific firm commitments or forecasted transactions. In cases wherewe designate a hedge, we assess (both at the inception of the hedge and on an ongoing basis)
Copyright © 2013 www.secdatabase.com. All Rights Reserved.Please Consider the Environment Before Printing This Document
whether the derivatives have been highly effective in offsetting changes in the fair value or cashflows of hedged items and whether those derivatives may be expected to remain highly effectivein future periods. Failure to demonstrate effectiveness in offsetting exposures retroactively orprospectively would cause us to deem the hedge ineffective.
All derivatives are recognized on the balance sheet at their fair values. For derivatives thatdo not qualify for hedge accounting or for which we have not elected to apply hedge accounting,which includes substantially all of our forward exchange contracts, the changes in the fair valuesof these derivatives are recognized in other income (expense), net in the consolidated statementsof income.
At the inception of a new derivative contract for which formal hedge accounting has beenelected, our policy requires us to designate the derivative as a hedge of (a) a forecasted transactionor (b) the variability of cash flows that are to be received or paid in connection with a recognizedasset or liability (a "cash flow" hedge). We have not historically entered into hedges of fair values.Changes in the fair value of a derivative that is highly effective, documented, designated andqualified as a cash flow hedge, to the extent that the hedge is effective, are recorded in othercomprehensive (expense) income, until earnings are affected by the variability of cash flowsof the hedged transaction. Upon settlement, realized gains and losses are recognized in otherincome (expense), net in the consolidated statements of income. Any hedge ineffectiveness (whichrepresents the amount by which the changes in the fair value of the derivative do not mirror thechange in the cash flow of the forecasted transaction) is recorded in current period earnings.
We discontinue hedge accounting when:
• we deem the hedge to be ineffective and determine that the designation of the derivativeas a hedging instrument is no longer appropriate;
• the derivative no longer effectively offsets changes in the cash flows of a hedged item(such as firm commitments or contracts);
• the derivative expires, terminates or is sold; or
• occurrence of the contracted or committed transaction is no longer probable, or will notoccur in the originally expected period.
When hedge accounting is discontinued and the derivative remains outstanding, we carry thederivative at its estimated fair value on the balance sheet, recognizing changes in the fair value incurrent period earnings. If a cash flow hedge becomes ineffective, any deferred gains or losses onthe cash flow hedge remain in accumulated other comprehensive loss until the exposure relatingto the item underlying the hedge is recognized. If it becomes probable that a hedged forecastedtransaction will not occur, deferred gains or losses on the hedging instrument are recognized inearnings immediately.
Foreign Currency TranslationForeign Currency Translation — Assets and liabilities of our foreign subsidiaries are
translated to U.S. dollars at exchange rates prevailing at the balance sheet date, while income andexpenses are translated at average rates for each month. Translation gains and losses are reportedas a component of accumulated other comprehensive loss.
Transaction and translation gains and losses arising from intercompany balances are reportedas a component of accumulated other comprehensive loss when the underlying transaction stemsfrom a long-term equity investment or from debt designated as not due in the foreseeable future.Otherwise, we recognize transaction gains and losses arising from intercompany transactionsas a component of income. Where intercompany balances are not long-term investment relatedor not designated as due beyond the foreseeable future, we may mitigate risk associated withforeign currency fluctuations by entering into forward exchange contracts. See Note 6 for furtherdiscussion of these forward exchange contracts.
Transactional currency gains and losses arising from transactions in currencies other thanour sites’ functional currencies and changes in fair value of forward exchange contracts that donot qualify for hedge accounting are included in our consolidated results of operations. For theyears ended December 31, 2011, 2010 and 2009, we recognized net gains (losses) of $3.7 million,
Copyright © 2013 www.secdatabase.com. All Rights Reserved.Please Consider the Environment Before Printing This Document
$(26.5) million and $(7.8) million, respectively, of such amounts in other income (expense), net inthe accompanying consolidated statements of income.
Stock-Based Compensation Stock-Based Compensation — Stock-based compensation is measured at the grant-date fairvalue. The exercise price of stock option awards and the value of restricted share, restricted shareunit and performance-based unit awards (collectively referred to as "Restricted Shares") are setat the closing price of our common stock on the New York Stock Exchange on the date of grant,which is the date such grants are authorized by our Board of Directors. Restricted share unitsand performance-based units refer to restricted awards that do not have voting rights and accruedividends, which are forfeited if vesting does not occur.
Options are expensed using the graded vesting model, whereby we recognize compensationcost over the requisite service period for each separately vesting tranche of the award. We adjustshare-based compensation at least annually for changes to the estimate of expected equity awardforfeitures based on actual forfeiture experience. The intrinsic value of Restricted Shares, whichis typically the product of share price at the date of grant and the number of Restricted Sharesgranted, is amortized on a straight-line basis to compensation expense over the periods in whichthe restrictions lapse based on the expected number of shares that will vest. The forfeiture rateis based on unvested Restricted Shares forfeited compared with original total Restricted Sharesgranted over a 4-year period, excluding significant forfeiture events that are not expected to recur.
Earnings Per ShareDiluted earnings per share above is based upon the weighted average number of shares as
determined for basic earnings per share plus shares potentially issuable in conjunction with stockoptions and Restricted Shares.
For each of the three years ended December 31, 2011, 2010 and 2009, we had no optionsto purchase common stock that were excluded from the computations of potentially dilutivesecurities.
Earnings Per Share — We use the two-class method of calculating Earnings Per Share("EPS"). The "two-class" method is an earnings allocation formula that determines earnings pershare for each class of common stock and participating security as if all earnings for the periodhad been distributed. Unvested restricted share awards that earn non-forfeitable dividend rightsqualify as participating securities and, accordingly, are included in the basic computation as such.Our unvested restricted shares participate on an equal basis with common shares; therefore, thereis no difference in undistributed earnings allocated to each participating security. Accordingly, thepresentation below is prepared on a combined basis and is presented as earnings per commonshare. The following is a reconciliation of net earnings of Flowserve Corporation and weightedaverage shares for calculating basic net earnings per common share.
Research and DevelopmentExpense
Research and Development Expense — Research and development costs are charged toexpense when incurred. Aggregate research and development costs included in selling, generaland administrative expenses ("SG&A") were $35.0 million, $29.5 million and $29.4 million in2011, 2010 and 2009, respectively. Costs incurred for research and development primarily includesalaries and benefits and consumable supplies, as well as rent, professional fees, utilities and thedepreciation of property and equipment used in research and development activities.
Business Combinations Business Combinations — All business combinations referred to in these financialstatements used the purchase method of accounting, under which we allocate the purchase priceto the identifiable tangible and intangible assets and liabilities, recognizing goodwill when thepurchase price exceeds fair value of such identifiable assets acquired, net of liabilities assumed.
Copyright © 2013 www.secdatabase.com. All Rights Reserved.Please Consider the Environment Before Printing This Document

12 Months EndedSchedule II - Valuation andQualifying Accounts Dec. 31, 2011
Valuation and QualifyingAccounts [Abstract]Schedule II - Valuation andQualifying Accounts
Schedule II — Valuation and Qualifying Accounts
Description
Balance atBeginning
of Year
AdditionsCharged
toCost andExpenses
AdditionsCharged to
OtherAccounts—Acquisitionsand RelatedAdjustments
DeductionsFrom
Reserve
Balanceat End of
Year
(Amounts in thousands)
Year Ended December 31, 2011Allowance for doubtfulaccounts(a): $ 18,632 $ 21,108 $ (57) $ (19,332) $20,351Deferred tax asset valuationallowance(b): 14,296 4,124 (43) (691) 17,686
Year Ended December 31, 2010Allowance for doubtfulaccounts(a): 18,769 17,045 505 (17,687) 18,632Deferred tax asset valuationallowance(b): 17,292 1,970 (315) (4,651) 14,296
Year Ended December 31, 2009Allowance for doubtfulaccounts(a): 23,667 18,461 50 (23,409) 18,769Deferred tax asset valuationallowance(b): 17,208 2,748 1,181 (3,845) 17,292
_______________________________________
(a) Deductions from reserve represent accounts written off, net of recoveries, and reductions dueto improved aging of receivables.
(b) Deductions from reserve result from the expiration or utilization of net operating losses andforeign tax credits previously reserved.
Copyright © 2013 www.secdatabase.com. All Rights Reserved.Please Consider the Environment Before Printing This Document
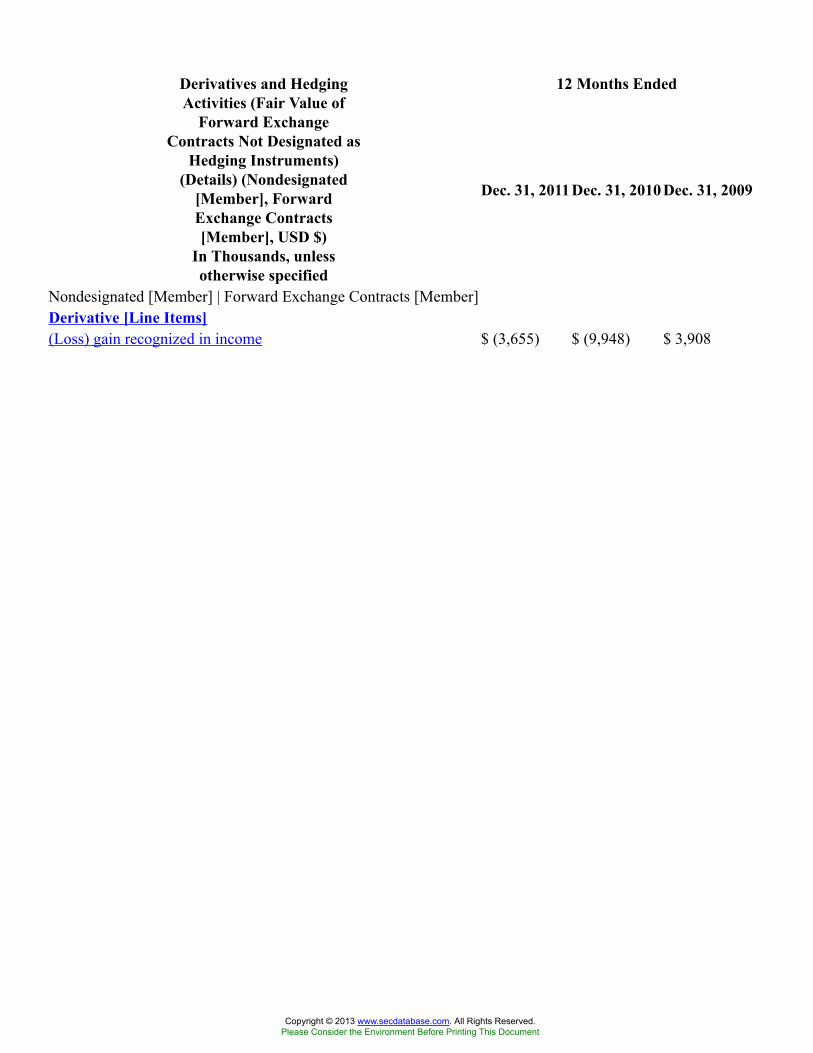
12 Months EndedDerivatives and HedgingActivities (Fair Value of
Forward ExchangeContracts Not Designated as
Hedging Instruments)(Details) (Nondesignated
[Member], ForwardExchange Contracts[Member], USD $)
In Thousands, unlessotherwise specified
Dec. 31, 2011Dec. 31, 2010 Dec. 31, 2009
Nondesignated [Member] | Forward Exchange Contracts [Member]Derivative [Line Items](Loss) gain recognized in income $ (3,655) $ (9,948) $ 3,908
Copyright © 2013 www.secdatabase.com. All Rights Reserved.Please Consider the Environment Before Printing This Document
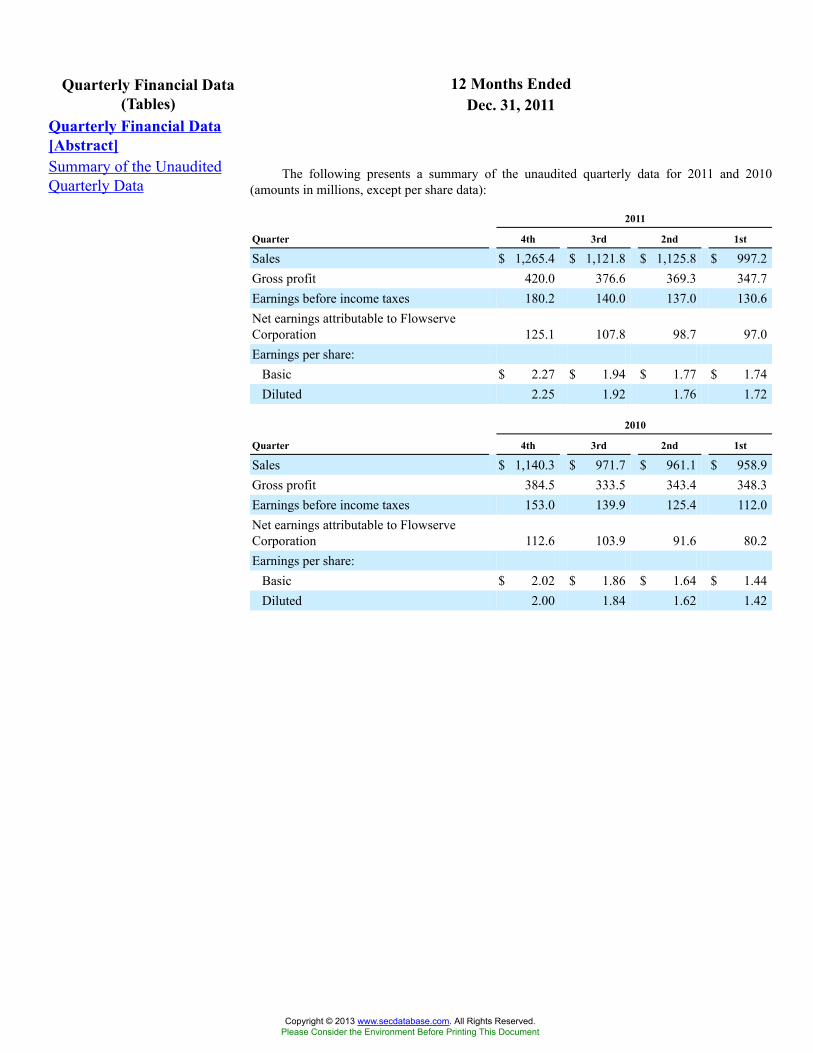
12 Months EndedQuarterly Financial Data(Tables) Dec. 31, 2011
Quarterly Financial Data[Abstract]Summary of the UnauditedQuarterly Data
The following presents a summary of the unaudited quarterly data for 2011 and 2010(amounts in millions, except per share data):
2011
Quarter 4th 3rd 2nd 1st
Sales $ 1,265.4 $ 1,121.8 $ 1,125.8 $ 997.2Gross profit 420.0 376.6 369.3 347.7Earnings before income taxes 180.2 140.0 137.0 130.6Net earnings attributable to FlowserveCorporation 125.1 107.8 98.7 97.0Earnings per share:
Basic $ 2.27 $ 1.94 $ 1.77 $ 1.74Diluted 2.25 1.92 1.76 1.72
2010
Quarter 4th 3rd 2nd 1st
Sales $ 1,140.3 $ 971.7 $ 961.1 $ 958.9Gross profit 384.5 333.5 343.4 348.3Earnings before income taxes 153.0 139.9 125.4 112.0Net earnings attributable to FlowserveCorporation 112.6 103.9 91.6 80.2Earnings per share:
Basic $ 2.02 $ 1.86 $ 1.64 $ 1.44Diluted 2.00 1.84 1.62 1.42
Copyright © 2013 www.secdatabase.com. All Rights Reserved.Please Consider the Environment Before Printing This Document

12 Months EndedSignificant AccountingPolicies and AccountingDevelopments (Tables) Dec. 31, 2011
Accounting Policies [Abstract]Schedule of Estimated Useful Lives of Assets Generally, the estimated useful lives of the assets are:
Buildings and improvements
10 to40
years
Furniture and fixtures3 to 7years
Machinery and equipment3 to 14
years
Capital leases (based on lease term)3 to 25
years
Calculation of Net Earnings per Common Share andWeighted Average Common Share Outstanding
Earnings per weighted average common share outstanding wascalculated as follows:
Year Ended December 31,
2011 2010 2009
(Amounts in thousands, except pershare data)
Net earnings of FlowserveCorporation $428,582 $388,290 $427,887Dividends on restricted shares notexpected to vest 15 16 23Earnings attributable to commonand participating shareholders $428,597 $388,306 $427,910
Weighted average shares:Common stock 55,273 55,434 55,400Participating securities 270 330 440Denominator for basic earningsper common share 55,543 55,764 55,840Effect of potentially dilutivesecurities 559 651 522Denominator for diluted earningsper common share 56,102 56,415 56,362Net earnings per share attributableto Flowserve Corporation commonshareholders:
Basic $ 7.72 $ 6.96 $ 7.66Diluted 7.64 6.88 7.59
Copyright © 2013 www.secdatabase.com. All Rights Reserved.Please Consider the Environment Before Printing This Document

12 Months EndedAcquisitions (Tables) Dec. 31, 2011Lawrence Pumps [Member]Business Acquisition [LineItems]Schedule of Purchase PriceAllocation
The purchase price was allocated on a preliminary basis to the assets acquired and liabilitiesassumed based on estimates of fair values at the date of acquisition and is summarized below:
(Amounts inmillions)
Current assets $ 28.0Property, plant and equipment 8.9Intangible assets 30.0Current liabilities (16.6)Net tangible and intangible assets 50.3Goodwill 39.3
Purchase price $ 89.6
Valbart Srl [Member]Business Acquisition [LineItems]Schedule of Purchase PriceAllocation
The purchase price was allocated to the assets acquired and liabilities assumed based onestimates of fair values at the date of acquisition and is summarized below:
(Amounts inmillions)
Accounts receivable $ 12.2Inventories 39.6Deferred taxes 8.7Prepaid expenses and other 1.0Intangible assets
Existing customer relationships 16.3Trademarks 11.5Non-compete agreements 2.7Engineering drawings 2.3
Property, plant and equipment 10.1Current liabilities (36.8)Noncurrent liabilities (13.6)Net tangible and intangible assets 54.0Goodwill 145.4
Purchase price $ 199.4
Copyright © 2013 www.secdatabase.com. All Rights Reserved.Please Consider the Environment Before Printing This Document
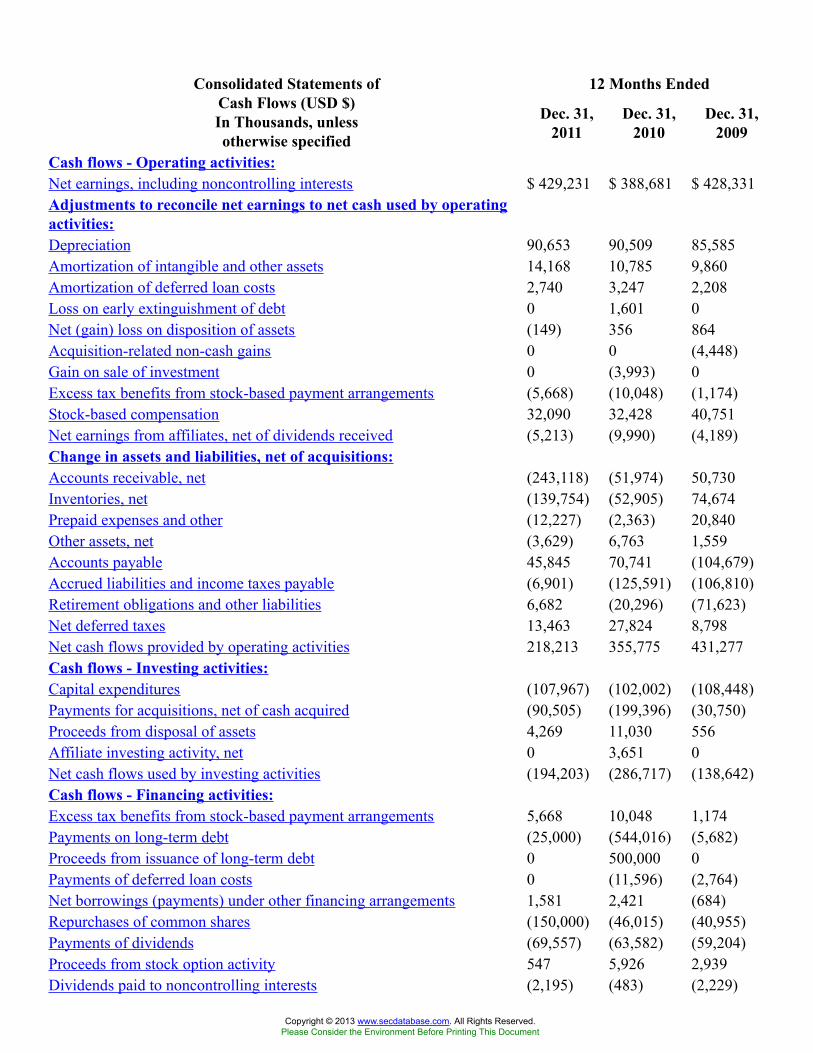
12 Months EndedConsolidated Statements ofCash Flows (USD $)In Thousands, unlessotherwise specified
Dec. 31,2011
Dec. 31,2010
Dec. 31,2009
Cash flows - Operating activities:Net earnings, including noncontrolling interests $ 429,231 $ 388,681 $ 428,331Adjustments to reconcile net earnings to net cash used by operatingactivities:Depreciation 90,653 90,509 85,585Amortization of intangible and other assets 14,168 10,785 9,860Amortization of deferred loan costs 2,740 3,247 2,208Loss on early extinguishment of debt 0 1,601 0Net (gain) loss on disposition of assets (149) 356 864Acquisition-related non-cash gains 0 0 (4,448)Gain on sale of investment 0 (3,993) 0Excess tax benefits from stock-based payment arrangements (5,668) (10,048) (1,174)Stock-based compensation 32,090 32,428 40,751Net earnings from affiliates, net of dividends received (5,213) (9,990) (4,189)Change in assets and liabilities, net of acquisitions:Accounts receivable, net (243,118) (51,974) 50,730Inventories, net (139,754) (52,905) 74,674Prepaid expenses and other (12,227) (2,363) 20,840Other assets, net (3,629) 6,763 1,559Accounts payable 45,845 70,741 (104,679)Accrued liabilities and income taxes payable (6,901) (125,591) (106,810)Retirement obligations and other liabilities 6,682 (20,296) (71,623)Net deferred taxes 13,463 27,824 8,798Net cash flows provided by operating activities 218,213 355,775 431,277Cash flows - Investing activities:Capital expenditures (107,967) (102,002) (108,448)Payments for acquisitions, net of cash acquired (90,505) (199,396) (30,750)Proceeds from disposal of assets 4,269 11,030 556Affiliate investing activity, net 0 3,651 0Net cash flows used by investing activities (194,203) (286,717) (138,642)Cash flows - Financing activities:Excess tax benefits from stock-based payment arrangements 5,668 10,048 1,174Payments on long-term debt (25,000) (544,016) (5,682)Proceeds from issuance of long-term debt 0 500,000 0Payments of deferred loan costs 0 (11,596) (2,764)Net borrowings (payments) under other financing arrangements 1,581 2,421 (684)Repurchases of common shares (150,000) (46,015) (40,955)Payments of dividends (69,557) (63,582) (59,204)Proceeds from stock option activity 547 5,926 2,939Dividends paid to noncontrolling interests (2,195) (483) (2,229)
Copyright © 2013 www.secdatabase.com. All Rights Reserved.Please Consider the Environment Before Printing This Document

Sales of shares to noncontrolling interests 0 4,384 327Net cash flows used by financing activities (238,956) (142,913) (107,078)Effect of exchange rate changes on cash (5,277) (22,886) (3,293)Net change in cash and cash equivalents (220,223) (96,741) 182,264Cash and cash equivalents at beginning of year 557,579 654,320 472,056Cash and cash equivalents at end of year 337,356 557,579 654,320Income taxes paid (net of refunds) 113,921 135,892 189,520Interest paid $ 32,368 $ 31,009 $ 38,067
Copyright © 2013 www.secdatabase.com. All Rights Reserved.Please Consider the Environment Before Printing This Document
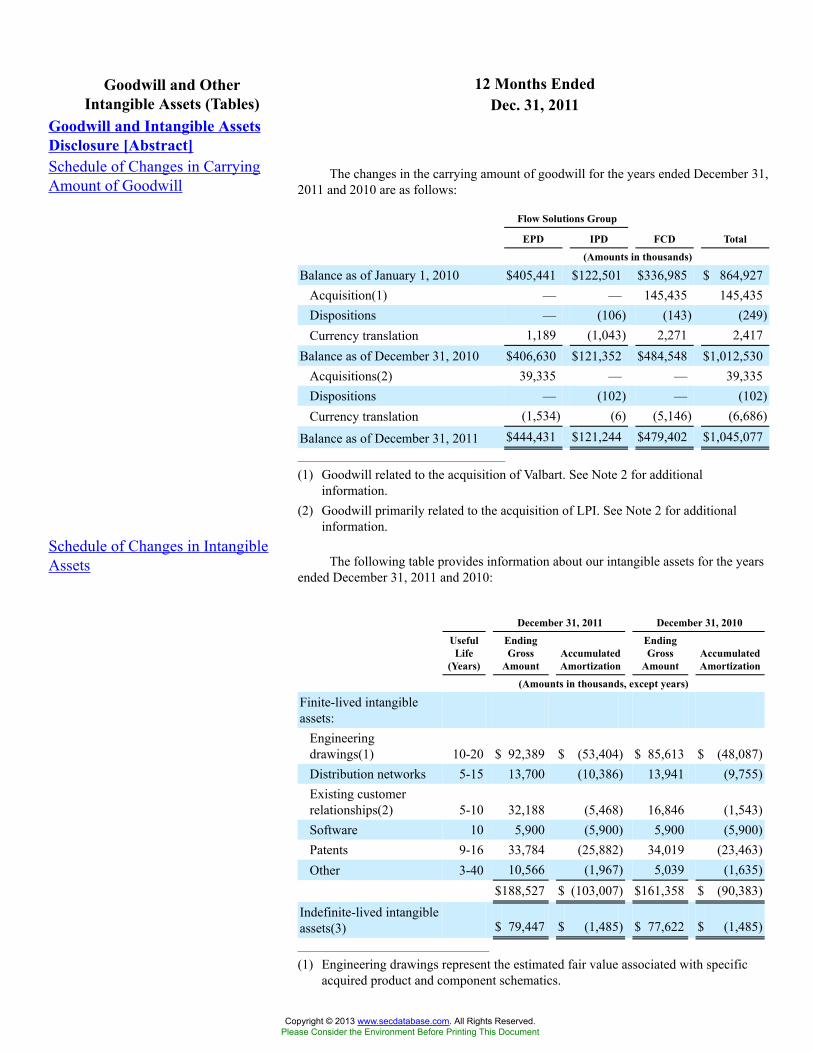
12 Months EndedGoodwill and OtherIntangible Assets (Tables) Dec. 31, 2011
Goodwill and Intangible AssetsDisclosure [Abstract]Schedule of Changes in CarryingAmount of Goodwill
The changes in the carrying amount of goodwill for the years ended December 31,2011 and 2010 are as follows:
Flow Solutions Group
EPD IPD FCD Total
(Amounts in thousands)
Balance as of January 1, 2010 $405,441 $122,501 $336,985 $ 864,927Acquisition(1) — — 145,435 145,435Dispositions — (106) (143) (249)Currency translation 1,189 (1,043) 2,271 2,417
Balance as of December 31, 2010 $406,630 $121,352 $484,548 $1,012,530Acquisitions(2) 39,335 — — 39,335Dispositions — (102) — (102)Currency translation (1,534) (6) (5,146) (6,686)
Balance as of December 31, 2011 $444,431 $121,244 $479,402 $1,045,077_______________________________________
(1) Goodwill related to the acquisition of Valbart. See Note 2 for additionalinformation.
(2) Goodwill primarily related to the acquisition of LPI. See Note 2 for additionalinformation.
Schedule of Changes in IntangibleAssets The following table provides information about our intangible assets for the years
ended December 31, 2011 and 2010:
December 31, 2011 December 31, 2010
UsefulLife
(Years)
EndingGross
AmountAccumulatedAmortization
EndingGross
AmountAccumulatedAmortization
(Amounts in thousands, except years)
Finite-lived intangibleassets:
Engineeringdrawings(1) 10-20 $ 92,389 $ (53,404) $ 85,613 $ (48,087)Distribution networks 5-15 13,700 (10,386) 13,941 (9,755)Existing customerrelationships(2) 5-10 32,188 (5,468) 16,846 (1,543)Software 10 5,900 (5,900) 5,900 (5,900)Patents 9-16 33,784 (25,882) 34,019 (23,463)Other 3-40 10,566 (1,967) 5,039 (1,635)
$188,527 $ (103,007) $161,358 $ (90,383)Indefinite-lived intangibleassets(3) $ 79,447 $ (1,485) $ 77,622 $ (1,485)____________________________________
(1) Engineering drawings represent the estimated fair value associated with specificacquired product and component schematics.
Copyright © 2013 www.secdatabase.com. All Rights Reserved.Please Consider the Environment Before Printing This Document
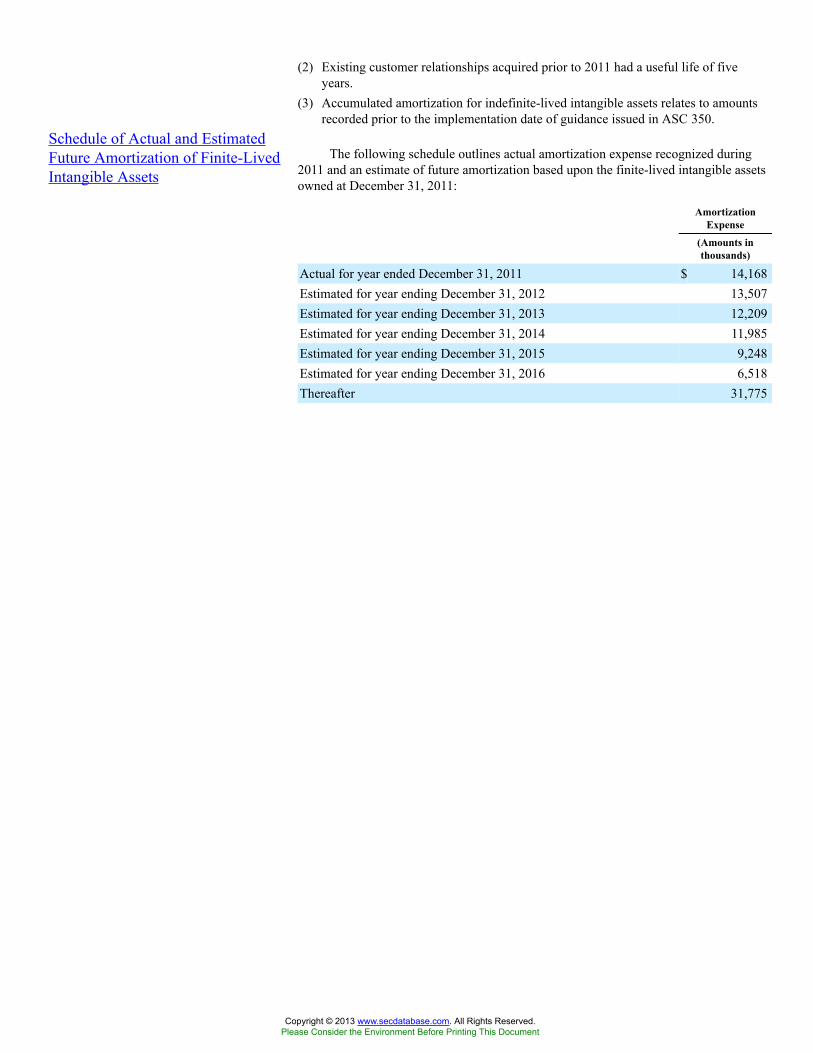
(2) Existing customer relationships acquired prior to 2011 had a useful life of fiveyears.
(3) Accumulated amortization for indefinite-lived intangible assets relates to amountsrecorded prior to the implementation date of guidance issued in ASC 350.
Schedule of Actual and EstimatedFuture Amortization of Finite-LivedIntangible Assets
The following schedule outlines actual amortization expense recognized during2011 and an estimate of future amortization based upon the finite-lived intangible assetsowned at December 31, 2011:
AmortizationExpense
(Amounts inthousands)
Actual for year ended December 31, 2011 $ 14,168Estimated for year ending December 31, 2012 13,507Estimated for year ending December 31, 2013 12,209Estimated for year ending December 31, 2014 11,985Estimated for year ending December 31, 2015 9,248Estimated for year ending December 31, 2016 6,518Thereafter 31,775
Copyright © 2013 www.secdatabase.com. All Rights Reserved.Please Consider the Environment Before Printing This Document
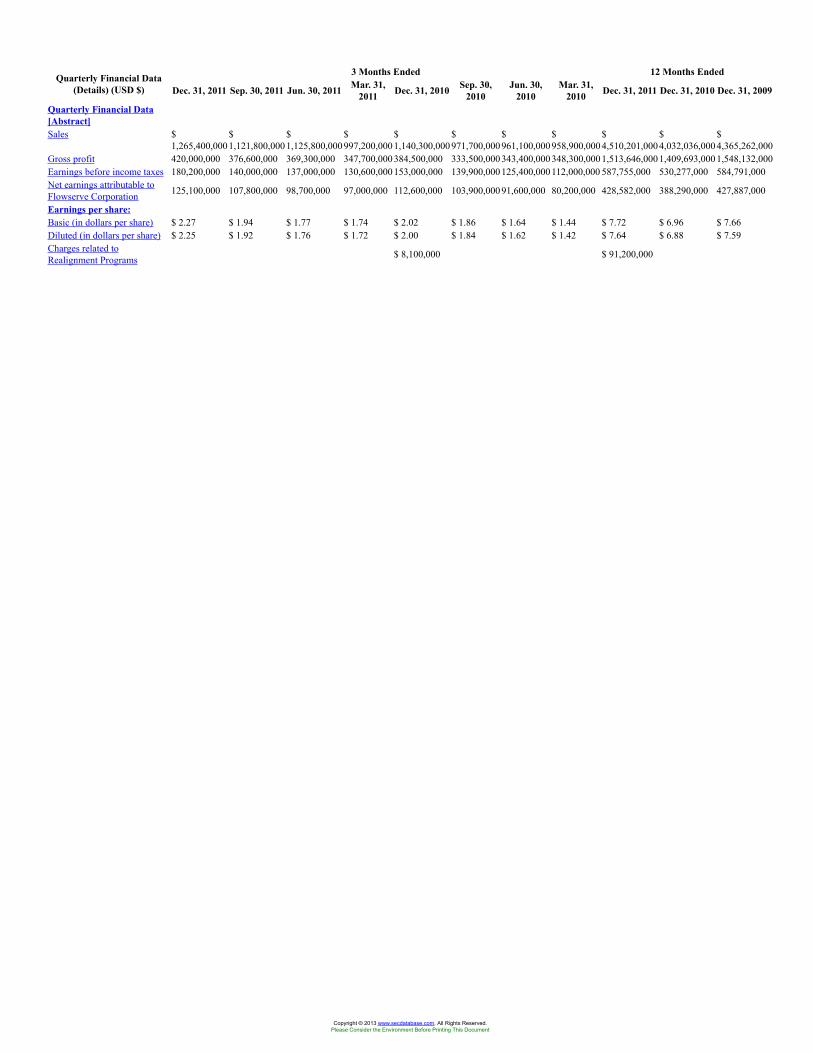
3 Months Ended 12 Months EndedQuarterly Financial Data(Details) (USD $) Dec. 31, 2011 Sep. 30, 2011 Jun. 30, 2011 Mar. 31,
2011 Dec. 31, 2010 Sep. 30,2010
Jun. 30,2010
Mar. 31,2010 Dec. 31, 2011 Dec. 31, 2010 Dec. 31, 2009
Quarterly Financial Data[Abstract]Sales $
1,265,400,000$1,121,800,000
$1,125,800,000
$997,200,000
$1,140,300,000
$971,700,000
$961,100,000
$958,900,000
$4,510,201,000
$4,032,036,000
$4,365,262,000
Gross profit 420,000,000 376,600,000 369,300,000 347,700,000384,500,000 333,500,000 343,400,000348,300,0001,513,646,0001,409,693,0001,548,132,000Earnings before income taxes 180,200,000 140,000,000 137,000,000 130,600,000153,000,000 139,900,000 125,400,000112,000,000 587,755,000 530,277,000 584,791,000Net earnings attributable toFlowserve Corporation 125,100,000 107,800,000 98,700,000 97,000,000 112,600,000 103,900,000 91,600,000 80,200,000 428,582,000 388,290,000 427,887,000
Earnings per share:Basic (in dollars per share) $ 2.27 $ 1.94 $ 1.77 $ 1.74 $ 2.02 $ 1.86 $ 1.64 $ 1.44 $ 7.72 $ 6.96 $ 7.66Diluted (in dollars per share) $ 2.25 $ 1.92 $ 1.76 $ 1.72 $ 2.00 $ 1.84 $ 1.62 $ 1.42 $ 7.64 $ 6.88 $ 7.59Charges related toRealignment Programs $ 8,100,000 $ 91,200,000
Copyright © 2013 www.secdatabase.com. All Rights Reserved.Please Consider the Environment Before Printing This Document
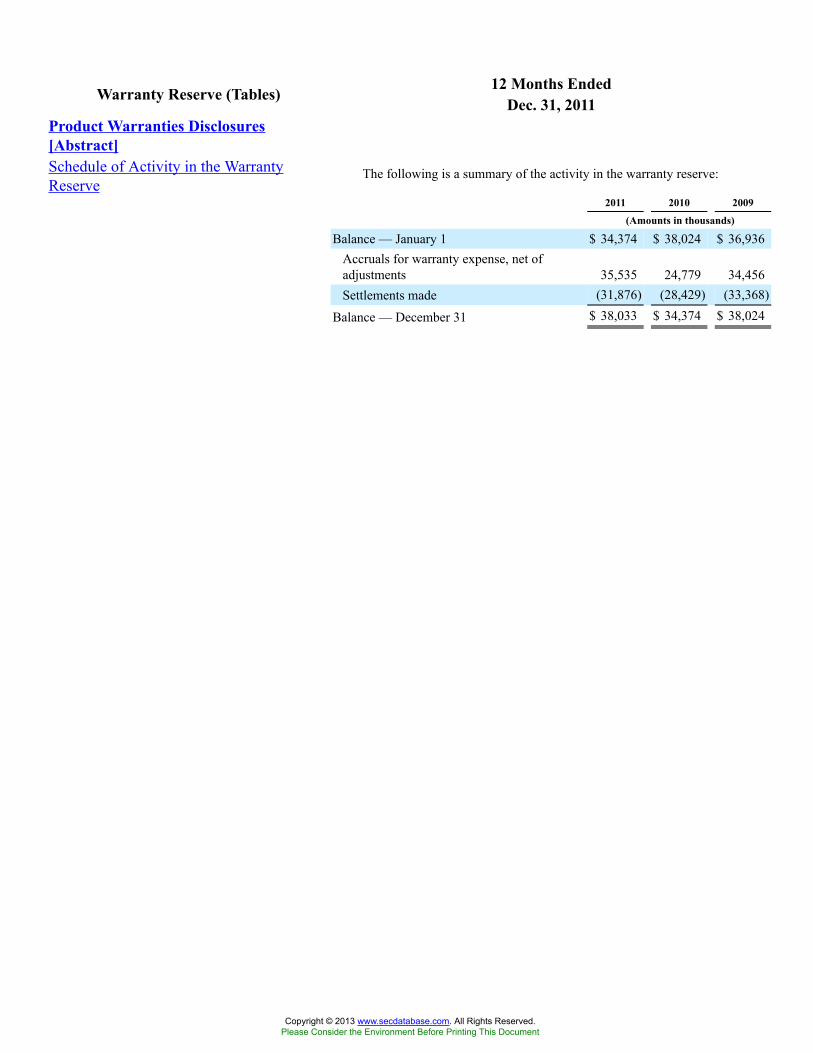
12 Months EndedWarranty Reserve (Tables) Dec. 31, 2011Product Warranties Disclosures[Abstract]Schedule of Activity in the WarrantyReserve
The following is a summary of the activity in the warranty reserve:
2011 2010 2009
(Amounts in thousands)
Balance — January 1 $ 34,374 $ 38,024 $ 36,936Accruals for warranty expense, net ofadjustments 35,535 24,779 34,456Settlements made (31,876) (28,429) (33,368)
Balance — December 31 $ 38,033 $ 34,374 $ 38,024
Copyright © 2013 www.secdatabase.com. All Rights Reserved.Please Consider the Environment Before Printing This Document
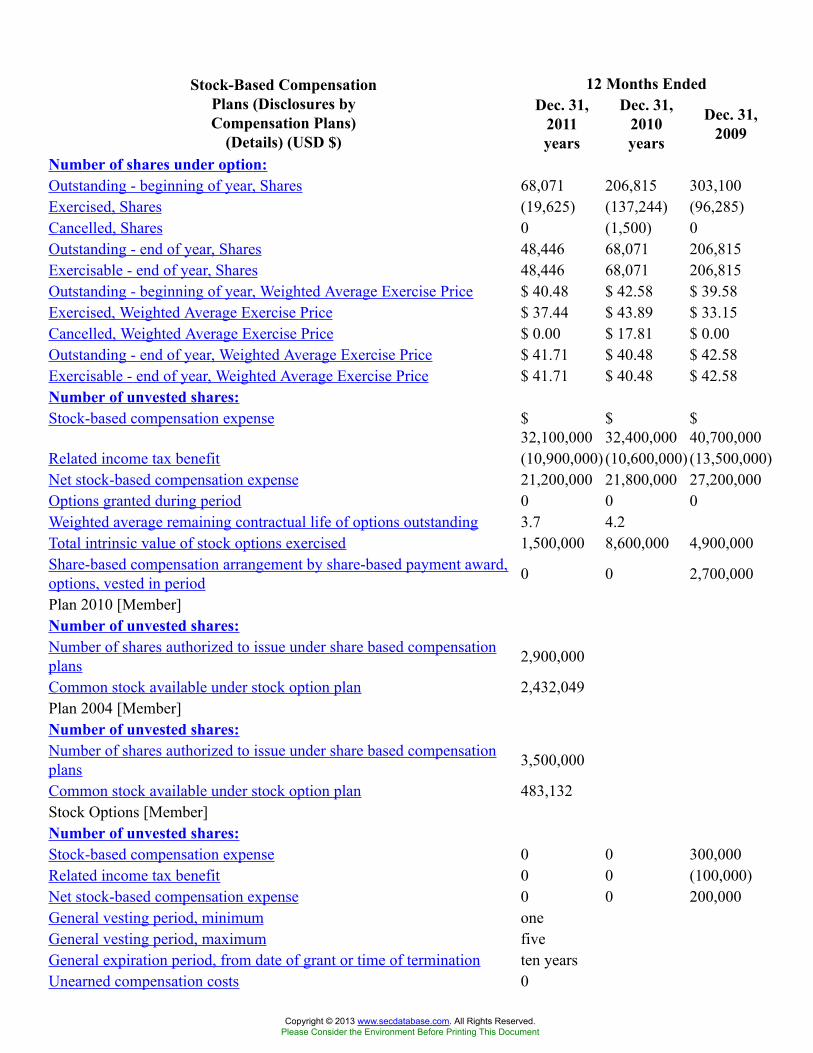
12 Months EndedStock-Based CompensationPlans (Disclosures byCompensation Plans)
(Details) (USD $)
Dec. 31,2011years
Dec. 31,2010years
Dec. 31,2009
Number of shares under option:Outstanding - beginning of year, Shares 68,071 206,815 303,100Exercised, Shares (19,625) (137,244) (96,285)Cancelled, Shares 0 (1,500) 0Outstanding - end of year, Shares 48,446 68,071 206,815Exercisable - end of year, Shares 48,446 68,071 206,815Outstanding - beginning of year, Weighted Average Exercise Price $ 40.48 $ 42.58 $ 39.58Exercised, Weighted Average Exercise Price $ 37.44 $ 43.89 $ 33.15Cancelled, Weighted Average Exercise Price $ 0.00 $ 17.81 $ 0.00Outstanding - end of year, Weighted Average Exercise Price $ 41.71 $ 40.48 $ 42.58Exercisable - end of year, Weighted Average Exercise Price $ 41.71 $ 40.48 $ 42.58Number of unvested shares:Stock-based compensation expense $
32,100,000$32,400,000
$40,700,000
Related income tax benefit (10,900,000) (10,600,000) (13,500,000)Net stock-based compensation expense 21,200,000 21,800,000 27,200,000Options granted during period 0 0 0Weighted average remaining contractual life of options outstanding 3.7 4.2Total intrinsic value of stock options exercised 1,500,000 8,600,000 4,900,000Share-based compensation arrangement by share-based payment award,options, vested in period 0 0 2,700,000
Plan 2010 [Member]Number of unvested shares:Number of shares authorized to issue under share based compensationplans 2,900,000
Common stock available under stock option plan 2,432,049Plan 2004 [Member]Number of unvested shares:Number of shares authorized to issue under share based compensationplans 3,500,000
Common stock available under stock option plan 483,132Stock Options [Member]Number of unvested shares:Stock-based compensation expense 0 0 300,000Related income tax benefit 0 0 (100,000)Net stock-based compensation expense 0 0 200,000General vesting period, minimum oneGeneral vesting period, maximum fiveGeneral expiration period, from date of grant or time of termination ten yearsUnearned compensation costs 0
Copyright © 2013 www.secdatabase.com. All Rights Reserved.Please Consider the Environment Before Printing This Document
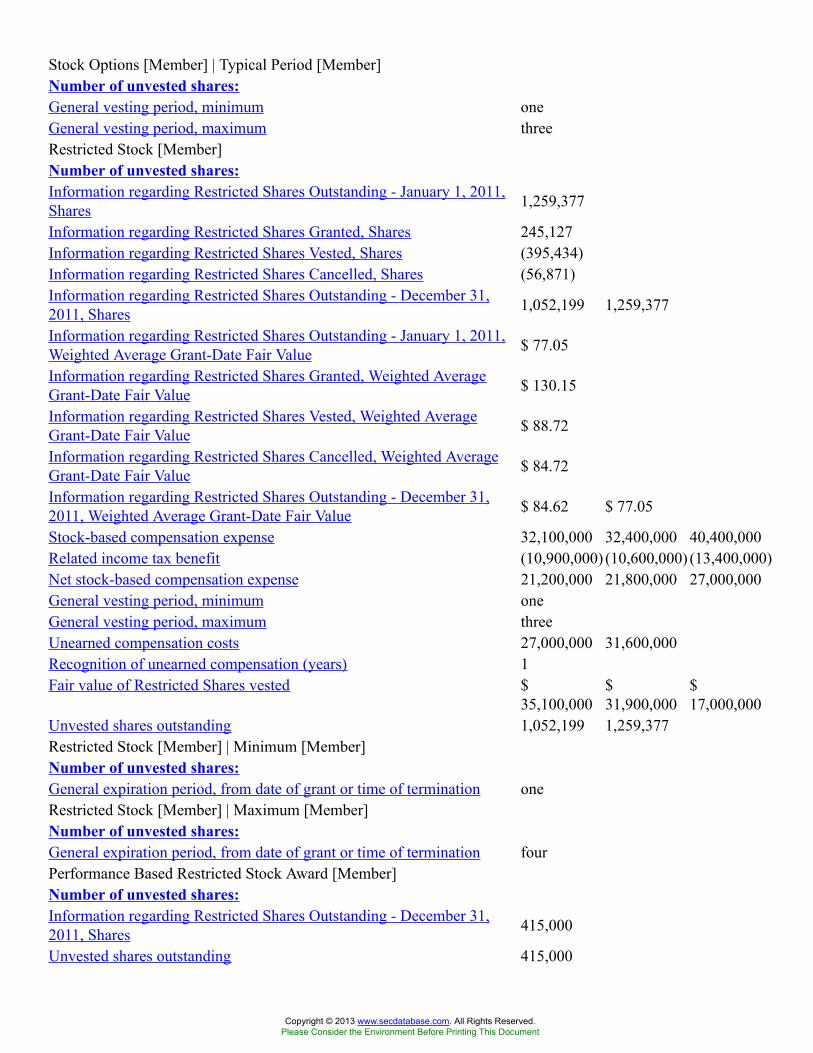
Stock Options [Member] | Typical Period [Member]Number of unvested shares:General vesting period, minimum oneGeneral vesting period, maximum threeRestricted Stock [Member]Number of unvested shares:Information regarding Restricted Shares Outstanding - January 1, 2011,Shares 1,259,377
Information regarding Restricted Shares Granted, Shares 245,127Information regarding Restricted Shares Vested, Shares (395,434)Information regarding Restricted Shares Cancelled, Shares (56,871)Information regarding Restricted Shares Outstanding - December 31,2011, Shares 1,052,199 1,259,377
Information regarding Restricted Shares Outstanding - January 1, 2011,Weighted Average Grant-Date Fair Value $ 77.05
Information regarding Restricted Shares Granted, Weighted AverageGrant-Date Fair Value $ 130.15
Information regarding Restricted Shares Vested, Weighted AverageGrant-Date Fair Value $ 88.72
Information regarding Restricted Shares Cancelled, Weighted AverageGrant-Date Fair Value $ 84.72
Information regarding Restricted Shares Outstanding - December 31,2011, Weighted Average Grant-Date Fair Value $ 84.62 $ 77.05
Stock-based compensation expense 32,100,000 32,400,000 40,400,000Related income tax benefit (10,900,000) (10,600,000) (13,400,000)Net stock-based compensation expense 21,200,000 21,800,000 27,000,000General vesting period, minimum oneGeneral vesting period, maximum threeUnearned compensation costs 27,000,000 31,600,000Recognition of unearned compensation (years) 1Fair value of Restricted Shares vested $
35,100,000$31,900,000
$17,000,000
Unvested shares outstanding 1,052,199 1,259,377Restricted Stock [Member] | Minimum [Member]Number of unvested shares:General expiration period, from date of grant or time of termination oneRestricted Stock [Member] | Maximum [Member]Number of unvested shares:General expiration period, from date of grant or time of termination fourPerformance Based Restricted Stock Award [Member]Number of unvested shares:Information regarding Restricted Shares Outstanding - December 31,2011, Shares 415,000
Unvested shares outstanding 415,000
Copyright © 2013 www.secdatabase.com. All Rights Reserved.Please Consider the Environment Before Printing This Document
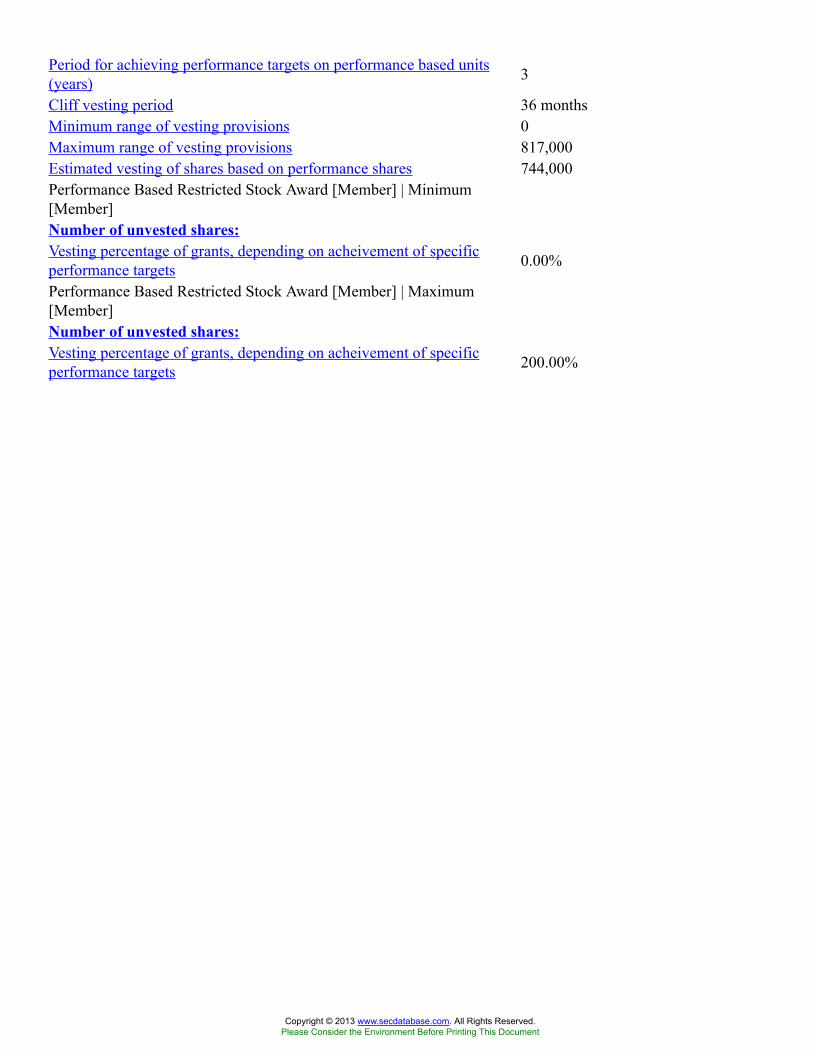
Period for achieving performance targets on performance based units(years) 3
Cliff vesting period 36 monthsMinimum range of vesting provisions 0Maximum range of vesting provisions 817,000Estimated vesting of shares based on performance shares 744,000Performance Based Restricted Stock Award [Member] | Minimum[Member]Number of unvested shares:Vesting percentage of grants, depending on acheivement of specificperformance targets 0.00%
Performance Based Restricted Stock Award [Member] | Maximum[Member]Number of unvested shares:Vesting percentage of grants, depending on acheivement of specificperformance targets 200.00%
Copyright © 2013 www.secdatabase.com. All Rights Reserved.Please Consider the Environment Before Printing This Document
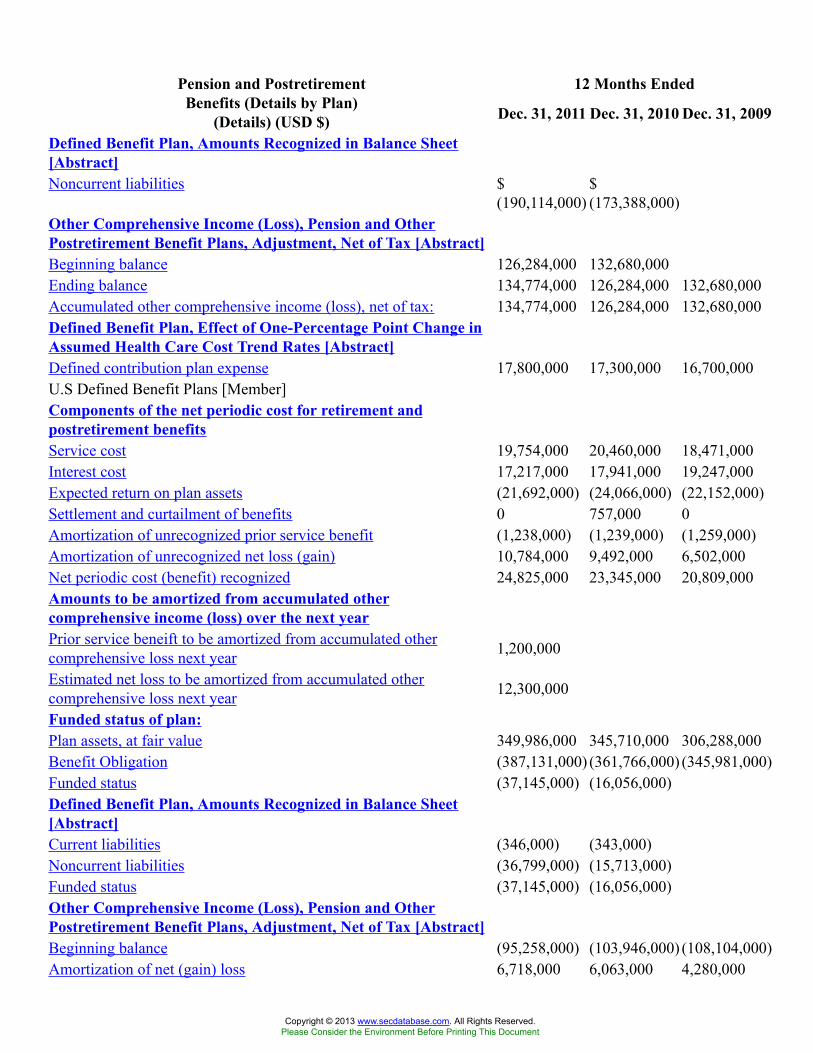
12 Months EndedPension and PostretirementBenefits (Details by Plan)
(Details) (USD $) Dec. 31, 2011 Dec. 31, 2010 Dec. 31, 2009
Defined Benefit Plan, Amounts Recognized in Balance Sheet[Abstract]Noncurrent liabilities $
(190,114,000)$(173,388,000)
Other Comprehensive Income (Loss), Pension and OtherPostretirement Benefit Plans, Adjustment, Net of Tax [Abstract]Beginning balance 126,284,000 132,680,000Ending balance 134,774,000 126,284,000 132,680,000Accumulated other comprehensive income (loss), net of tax: 134,774,000 126,284,000 132,680,000Defined Benefit Plan, Effect of One-Percentage Point Change inAssumed Health Care Cost Trend Rates [Abstract]Defined contribution plan expense 17,800,000 17,300,000 16,700,000U.S Defined Benefit Plans [Member]Components of the net periodic cost for retirement andpostretirement benefitsService cost 19,754,000 20,460,000 18,471,000Interest cost 17,217,000 17,941,000 19,247,000Expected return on plan assets (21,692,000) (24,066,000) (22,152,000)Settlement and curtailment of benefits 0 757,000 0Amortization of unrecognized prior service benefit (1,238,000) (1,239,000) (1,259,000)Amortization of unrecognized net loss (gain) 10,784,000 9,492,000 6,502,000Net periodic cost (benefit) recognized 24,825,000 23,345,000 20,809,000Amounts to be amortized from accumulated othercomprehensive income (loss) over the next yearPrior service beneift to be amortized from accumulated othercomprehensive loss next year 1,200,000
Estimated net loss to be amortized from accumulated othercomprehensive loss next year 12,300,000
Funded status of plan:Plan assets, at fair value 349,986,000 345,710,000 306,288,000Benefit Obligation (387,131,000) (361,766,000) (345,981,000)Funded status (37,145,000) (16,056,000)Defined Benefit Plan, Amounts Recognized in Balance Sheet[Abstract]Current liabilities (346,000) (343,000)Noncurrent liabilities (36,799,000) (15,713,000)Funded status (37,145,000) (16,056,000)Other Comprehensive Income (Loss), Pension and OtherPostretirement Benefit Plans, Adjustment, Net of Tax [Abstract]Beginning balance (95,258,000) (103,946,000) (108,104,000)Amortization of net (gain) loss 6,718,000 6,063,000 4,280,000
Copyright © 2013 www.secdatabase.com. All Rights Reserved.Please Consider the Environment Before Printing This Document

Amortization of prior service benefit (771,000) (791,000) (829,000)Net gain (loss) arising during the year (9,434,000) 3,509,000 773,000Prior service cost arising during the year 0 (93,000) (66,000)Ending balance (98,745,000) (95,258,000) (103,946,000)Unrecognized net gain (loss) (98,869,000) (96,164,000)Unrecognized prior service benefit (cost) 124,000 906,000Accumulated other comprehensive income (loss), net of tax: (98,745,000) (95,258,000) (103,946,000)Company contributions 8,871,000 33,380,000Non-U.S Defined Benefit Plans [Member]Components of the net periodic cost for retirement andpostretirement benefitsService cost 5,113,000 4,691,000 3,950,000Interest cost 13,867,000 12,776,000 12,099,000Expected return on plan assets (8,382,000) (7,164,000) (4,373,000)Settlement and curtailment of benefits 239,000 131,000 607,000Amortization of unrecognized net loss (gain) 2,172,000 2,367,000 2,604,000Net periodic cost (benefit) recognized 13,009,000 12,801,000 14,887,000Amounts to be amortized from accumulated othercomprehensive income (loss) over the next yearEstimated net loss to be amortized from accumulated othercomprehensive loss next year 3,800,000
Funded status of plan:Plan assets, at fair value 145,112,000 133,944,000 120,897,000Benefit Obligation (271,638,000) (263,970,000) (260,765,000)Funded status (126,526,000) (130,026,000)Defined Benefit Plan, Amounts Recognized in Balance Sheet[Abstract]Noncurrent assets 3,257,000 14,000Current liabilities (7,909,000) (7,775,000)Noncurrent liabilities (121,874,000) (122,265,000)Funded status (126,526,000) (130,026,000)Other Comprehensive Income (Loss), Pension and OtherPostretirement Benefit Plans, Adjustment, Net of Tax [Abstract]Beginning balance (38,819,000) (39,649,000) (34,156,000)Amortization of net (gain) loss 1,609,000 1,349,000 2,049,000Net gain (loss) arising during the year (6,763,000) (1,305,000) (5,018,000)Settlement loss 155,000 75,000 426,000Prior service cost arising during the year 191,000 (677,000) 0Currency translation impact 517,000 1,388,000 (2,950,000)Ending balance (43,110,000) (38,819,000) (39,649,000)Unrecognized net gain (loss) (42,433,000) (37,704,000)Unrecognized prior service benefit (cost) (677,000) (1,115,000)Accumulated other comprehensive income (loss), net of tax: (43,110,000) (38,819,000) (39,649,000)Company contributions 18,149,000 16,840,000Postretirement Medical Benefits [Member]
Copyright © 2013 www.secdatabase.com. All Rights Reserved.Please Consider the Environment Before Printing This Document

Defined Benefit Plan Disclosure [Line Items]Assumed rate of increase in medical costs 8.50% 9.00% 9.00%Minimum medical cost rate to be acheived 5.00%Components of the net periodic cost for retirement andpostretirement benefitsService cost 12,000 28,000 42,000Interest cost 1,782,000 1,940,000 2,493,000Amortization of unrecognized prior service benefit (1,558,000) (1,916,000) (1,974,000)Amortization of unrecognized net loss (gain) (1,463,000) (2,480,000) (2,903,000)Net periodic cost (benefit) recognized (1,227,000) (2,428,000) (2,342,000)Amounts to be amortized from accumulated othercomprehensive income (loss) over the next yearPrior service beneift to be amortized from accumulated othercomprehensive loss next year 100,000
Estimated net loss to be amortized from accumulated othercomprehensive loss next year 2,000,000
Funded status of plan:Benefit Obligation (35,045,000) (39,053,000) (40,170,000)Funded status (35,045,000) (39,053,000)Defined Benefit Plan, Amounts Recognized in Balance Sheet[Abstract]Current liabilities (4,278,000) (4,683,000)Noncurrent liabilities (30,767,000) (34,370,000)Funded status (35,045,000) (39,053,000)Other Comprehensive Income (Loss), Pension and OtherPostretirement Benefit Plans, Adjustment, Net of Tax [Abstract]Beginning balance 7,793,000 10,915,000 13,183,000Amortization of net (gain) loss (911,000) (1,525,000) (2,016,000)Amortization of prior service benefit (971,000) (1,179,000) (1,371,000)Net gain (loss) arising during the year 1,170,000 (418,000) 1,119,000Ending balance 7,081,000 7,793,000 10,915,000Unrecognized net gain (loss) 7,055,000 6,774,000Unrecognized prior service benefit (cost) 26,000 1,019,000Accumulated other comprehensive income (loss), net of tax: 7,081,000 7,793,000 10,915,000Company contributions 3,900,000 3,800,000 3,800,000Defined Benefit Plan, Effect of One-Percentage Point Change inAssumed Health Care Cost Trend Rates [Abstract]Effect on postretirement Benefit Obligation, 1% Decrease 436,000Effect on postretirement Benefit Obligation, 1% Increase (424,000)Effect on service cost plus interest cost, 1% Increase 17,000Effect on service cost plus interest cost, 1% Decrease $ (16,000)
Copyright © 2013 www.secdatabase.com. All Rights Reserved.Please Consider the Environment Before Printing This Document
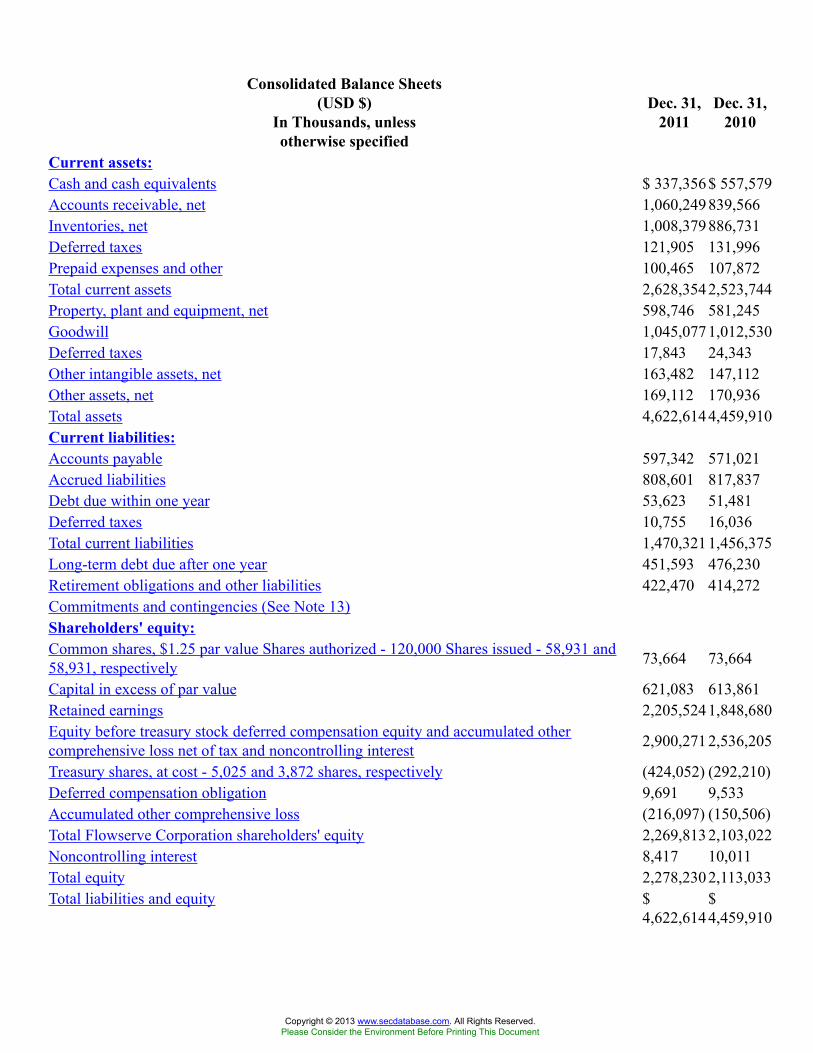
Consolidated Balance Sheets(USD $)
In Thousands, unlessotherwise specified
Dec. 31,2011
Dec. 31,2010
Current assets:Cash and cash equivalents $ 337,356$ 557,579Accounts receivable, net 1,060,249839,566Inventories, net 1,008,379886,731Deferred taxes 121,905 131,996Prepaid expenses and other 100,465 107,872Total current assets 2,628,3542,523,744Property, plant and equipment, net 598,746 581,245Goodwill 1,045,0771,012,530Deferred taxes 17,843 24,343Other intangible assets, net 163,482 147,112Other assets, net 169,112 170,936Total assets 4,622,6144,459,910Current liabilities:Accounts payable 597,342 571,021Accrued liabilities 808,601 817,837Debt due within one year 53,623 51,481Deferred taxes 10,755 16,036Total current liabilities 1,470,3211,456,375Long-term debt due after one year 451,593 476,230Retirement obligations and other liabilities 422,470 414,272Commitments and contingencies (See Note 13)Shareholders' equity:Common shares, $1.25 par value Shares authorized - 120,000 Shares issued - 58,931 and58,931, respectively 73,664 73,664
Capital in excess of par value 621,083 613,861Retained earnings 2,205,5241,848,680Equity before treasury stock deferred compensation equity and accumulated othercomprehensive loss net of tax and noncontrolling interest 2,900,2712,536,205
Treasury shares, at cost - 5,025 and 3,872 shares, respectively (424,052) (292,210)Deferred compensation obligation 9,691 9,533Accumulated other comprehensive loss (216,097) (150,506)Total Flowserve Corporation shareholders' equity 2,269,8132,103,022Noncontrolling interest 8,417 10,011Total equity 2,278,2302,113,033Total liabilities and equity $
4,622,614$4,459,910
Copyright © 2013 www.secdatabase.com. All Rights Reserved.Please Consider the Environment Before Printing This Document

12 Months Ended 12 MonthsEnded
3 MonthsEndedSignificant Accounting
Policies and AccountingDevelopments (Details)
In Millions, unless otherwisespecified
Dec. 31, 2011USD ($)
years
Dec. 31,2010
USD ($)
Dec. 31,2009
USD ($)
Jan. 11,2010VEF
Dec. 31, 2011North Africa
[Member]USD ($)
Mar. 31, 2010Venezuela[Member]USD ($)
Foreign Currency [Abstract]Unfavorable impact on operatingincome $ 11.2
Previous exchange rate 2.15Current exchange rate for nonessential items 4.30
Current exchange rate for essentialitems 2.60
Recognized loss due to currencydevaluation 7.6
Transactional currency gains (losses) 3.7 (26.5) (7.8)Gain on sale of investment in jointventure 3.1
Share-based Compensation[Abstract]Restricted shares grant period 4 yearsRevenue Recognition [Abstract]Period of delivery of products andservices
one to two-year period
Percentage of completion revenue 9.00% 9.00% 9.00%General extension periof for serviceand repair contracts 5 years
Maximum percentage of revenue onfixed fee services 1.00% 1.00% 1.00%
Warranty obligations sales trendperiod 24 months
Finite-Lived Intangible Assets[Abstract]Intangible assets, minimum usefullife 3
Intangible assets, maximum usefullife 40
Research and development costs $ 35.0 $ 29.5 $ 29.4
Copyright © 2013 www.secdatabase.com. All Rights Reserved.Please Consider the Environment Before Printing This Document
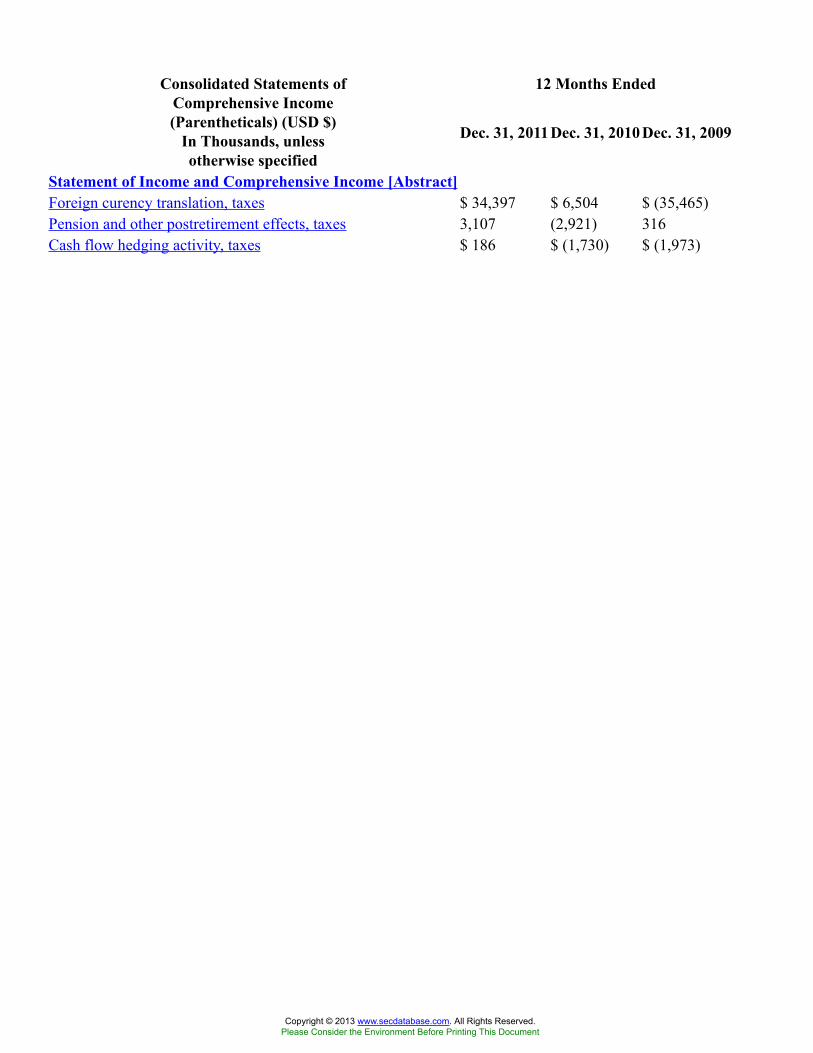
12 Months EndedConsolidated Statements ofComprehensive Income(Parentheticals) (USD $)
In Thousands, unlessotherwise specified
Dec. 31, 2011Dec. 31, 2010 Dec. 31, 2009
Statement of Income and Comprehensive Income [Abstract]Foreign curency translation, taxes $ 34,397 $ 6,504 $ (35,465)Pension and other postretirement effects, taxes 3,107 (2,921) 316Cash flow hedging activity, taxes $ 186 $ (1,730) $ (1,973)
Copyright © 2013 www.secdatabase.com. All Rights Reserved.Please Consider the Environment Before Printing This Document

3 MonthsEnded 12 Months EndedRealignment Programs
(Details) (USD $)In Millions, unless otherwise
specified Dec. 31, 2010 Dec. 31,2011
Dec. 31,2010
Dec. 31,2009
Segment Reporting Information [Line Items]Realignment Program charges, incurred $ 8.1 $ 91.2Realignment program charges 4.8 18.3 68.1Asseet write-down charges 3.0 6.4 6.1Expected Realignment Program charges 93Restructuring reserve 7.1 1.0 7.1IPD [Member]Segment Reporting Information [Line Items]Non restructuring charges 9Non restructuring charges incurred and recorded inCOS $ 7.2
Copyright © 2013 www.secdatabase.com. All Rights Reserved.Please Consider the Environment Before Printing This Document
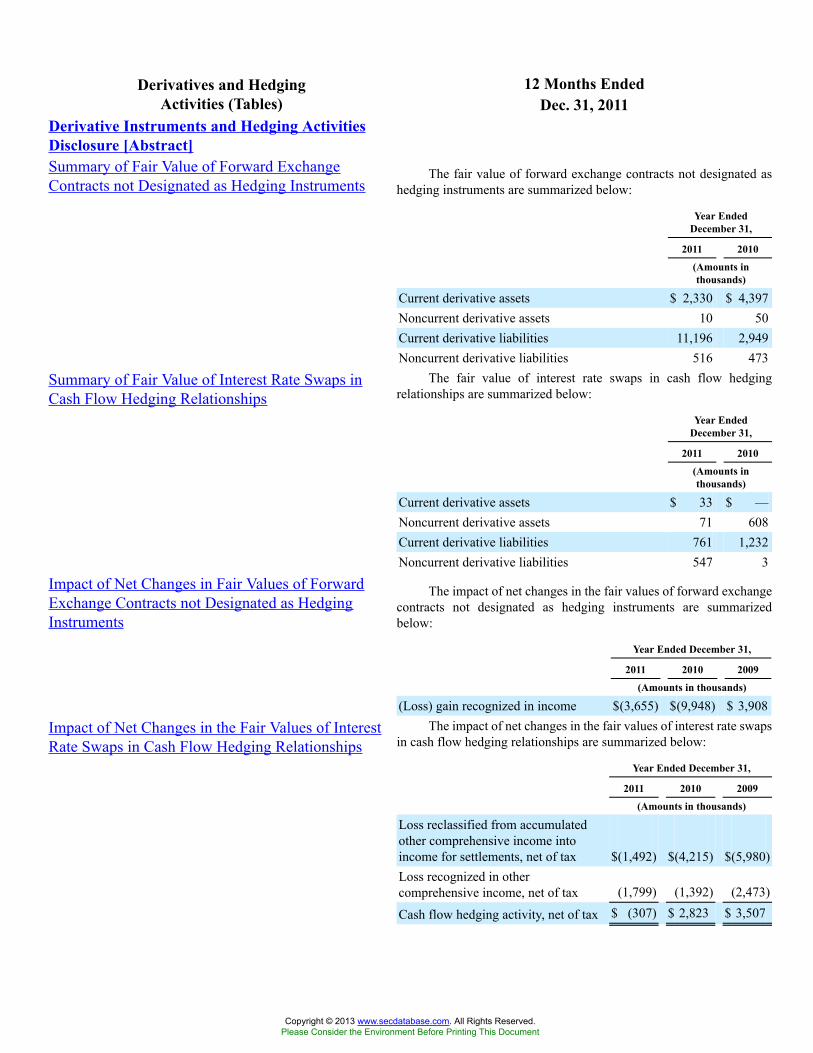
12 Months EndedDerivatives and HedgingActivities (Tables) Dec. 31, 2011
Derivative Instruments and Hedging ActivitiesDisclosure [Abstract]Summary of Fair Value of Forward ExchangeContracts not Designated as Hedging Instruments
The fair value of forward exchange contracts not designated ashedging instruments are summarized below:
Year EndedDecember 31,
2011 2010
(Amounts inthousands)
Current derivative assets $ 2,330 $ 4,397Noncurrent derivative assets 10 50Current derivative liabilities 11,196 2,949Noncurrent derivative liabilities 516 473
Summary of Fair Value of Interest Rate Swaps inCash Flow Hedging Relationships
The fair value of interest rate swaps in cash flow hedgingrelationships are summarized below:
Year EndedDecember 31,
2011 2010
(Amounts inthousands)
Current derivative assets $ 33 $ —Noncurrent derivative assets 71 608Current derivative liabilities 761 1,232Noncurrent derivative liabilities 547 3
Impact of Net Changes in Fair Values of ForwardExchange Contracts not Designated as HedgingInstruments
The impact of net changes in the fair values of forward exchangecontracts not designated as hedging instruments are summarizedbelow:
Year Ended December 31,
2011 2010 2009
(Amounts in thousands)
(Loss) gain recognized in income $(3,655) $(9,948) $ 3,908
Impact of Net Changes in the Fair Values of InterestRate Swaps in Cash Flow Hedging Relationships
The impact of net changes in the fair values of interest rate swapsin cash flow hedging relationships are summarized below:
Year Ended December 31,
2011 2010 2009
(Amounts in thousands)
Loss reclassified from accumulatedother comprehensive income intoincome for settlements, net of tax $(1,492) $(4,215) $(5,980)Loss recognized in othercomprehensive income, net of tax (1,799) (1,392) (2,473)
Cash flow hedging activity, net of tax $ (307) $ 2,823 $ 3,507
Copyright © 2013 www.secdatabase.com. All Rights Reserved.Please Consider the Environment Before Printing This Document
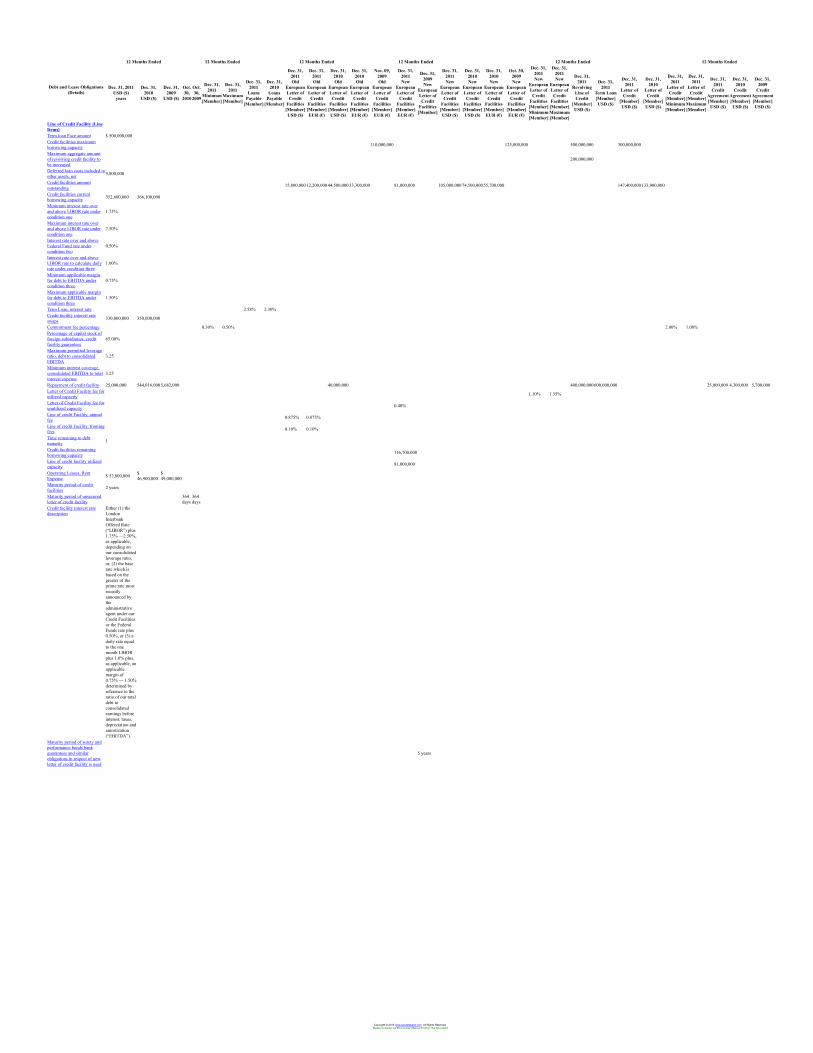
12 Months Ended 12 Months Ended 12 Months Ended 12 Months Ended 12 Months Ended 12 Months Ended
Debt and Lease Obligations(Details)
Dec. 31, 2011USD ($)
years
Dec. 31,2010
USD ($)
Dec. 31,2009
USD ($)
Oct.30,
2010
Oct.30,
2009
Dec. 31,2011
Minimum[Member]
Dec. 31,2011
Maximum[Member]
Dec. 31,2011
LoansPayable
[Member]
Dec. 31,2010
LoansPayable
[Member]
Dec. 31,2011Old
EuropeanLetter ofCredit
Facilities[Member]USD ($)
Dec. 31,2011Old
EuropeanLetter ofCredit
Facilities[Member]EUR (€)
Dec. 31,2010Old
EuropeanLetter ofCredit
Facilities[Member]USD ($)
Dec. 31,2010Old
EuropeanLetter ofCredit
Facilities[Member]EUR (€)
Nov. 09,2009Old
EuropeanLetter ofCredit
Facilities[Member]EUR (€)
Dec. 31,2011New
EuropeanLetter ofCredit
Facilities[Member]EUR (€)
Dec. 31,2009New
EuropeanLetter ofCredit
Facilities[Member]
Dec. 31,2011New
EuropeanLetter ofCredit
Facilities[Member]USD ($)
Dec. 31,2010New
EuropeanLetter ofCredit
Facilities[Member]USD ($)
Dec. 31,2010New
EuropeanLetter ofCredit
Facilities[Member]EUR (€)
Oct. 30,2009New
EuropeanLetter ofCredit
Facilities[Member]EUR (€)
Dec. 31,2011New
EuropeanLetter ofCredit
Facilities[Member]Minimum[Member]
Dec. 31,2011New
EuropeanLetter ofCredit
Facilities[Member]Maximum[Member]
Dec. 31,2011
RevolvingLine ofCredit
[Member]USD ($)
Dec. 31,2011
Term Loan[Member]USD ($)
Dec. 31,2011
Letter ofCredit
[Member]USD ($)
Dec. 31,2010
Letter ofCredit
[Member]USD ($)
Dec. 31,2011
Letter ofCredit
[Member]Minimum[Member]
Dec. 31,2011
Letter ofCredit
[Member]Maximum[Member]
Dec. 31,2011
CreditAgreement[Member]USD ($)
Dec. 31,2010
CreditAgreement[Member]USD ($)
Dec. 31,2009
CreditAgreement[Member]USD ($)
Line of Credit Facility [LineItems]Term loan Face amount $ 500,000,000Credit facilities maximumborrowing capacity 110,000,000 125,000,000 500,000,000 300,000,000
Maximum aggregate amountof revolving credit facility tobe increased
200,000,000
Deferred loan costs included inother assets, net 9,800,000
Credit facilities amountoutstanding 15,800,00012,200,00044,500,00033,300,000 81,000,000 105,000,00074,500,00055,700,000 147,400,000133,900,000
Credit facilities currentborrowing capacity 352,600,000 366,100,000
Minimum interest rate overand above LIBOR rate undercondition one
1.75%
Maximum interest rate overand above LIBOR rate undercondition one
2.50%
Interest rate over and aboveFederal Fund rate undercondition two
0.50%
Interest rate over and aboveLIBOR rate to calculate dailyrate under condition three
1.00%
Minimum applicable marginfor debt to EBITDA undercondition three
0.75%
Maximum applicable marginfor debt to EBITDA undercondition three
1.50%
Term Loan, interest rate 2.58% 2.30%Credit facility interest rateswaps 330,000,000 350,000,000
Commitment fee percentage 0.30% 0.50% 2.00% 1.00%Percentage of capital stock offoreign subsidiaries, creditfacility guarantees
65.00%
Maximum permitted leverageratio, debt to consolidatedEBITDA
3.25
Minimum interest coverage,consolidated EBITDA to totalinterest expense
3.25
Repayment of credit facility 25,000,000 544,016,0005,682,000 40,000,000 400,000,000600,000,000 25,000,000 4,300,000 5,700,000Letter of Credit Facility fee forutilized capacity 1.10% 1.35%
Letter of Credit Facility fee forunutilized capacity 0.40%
Line of credit Facility, annualfee 0.875% 0.875%
Line of credit Facility, frontingfees 0.10% 0.10%
Time remaining to debtmaturity 1
Credit facilities remainingborrowing capacity 116,700,000
Line of credit facility utilizedcapacity 81,000,000
Operating Leases, RentExpense $ 52,800,000 $
46,900,000$49,000,000
Maturity period of creditfacilities 2 years
Maturity period of unsecuredletter of credit facility
364days
364days
Credit facility interest ratedescription
Either (1) theLondonInterbankOffered Rate(“LIBOR”) plus1.75% —2.50%,as applicable,depending onour consolidatedleverage ratio,or, (2) the baserate which isbased on thegreater of theprime rate mostrecentlyannounced bytheadministrativeagent under ourCredit Facilitiesor the FederalFunds rate plus0.50%, or (3) adaily rate equalto the onemonth LIBORplus 1.0% plus,as applicable, anapplicablemargin of0.75% — 1.50%determined byreference to theratio of our totaldebt toconsolidatedearnings beforeinterest, taxes,depreciation andamortization(“EBITDA”).
Maturity period of surety andperformance bonds bankguarantees and similarobligations in respect of newletter of credit facility is used
5 years
Copyright © 2013 www.secdatabase.com. All Rights Reserved.Please Consider the Environment Before Printing This Document
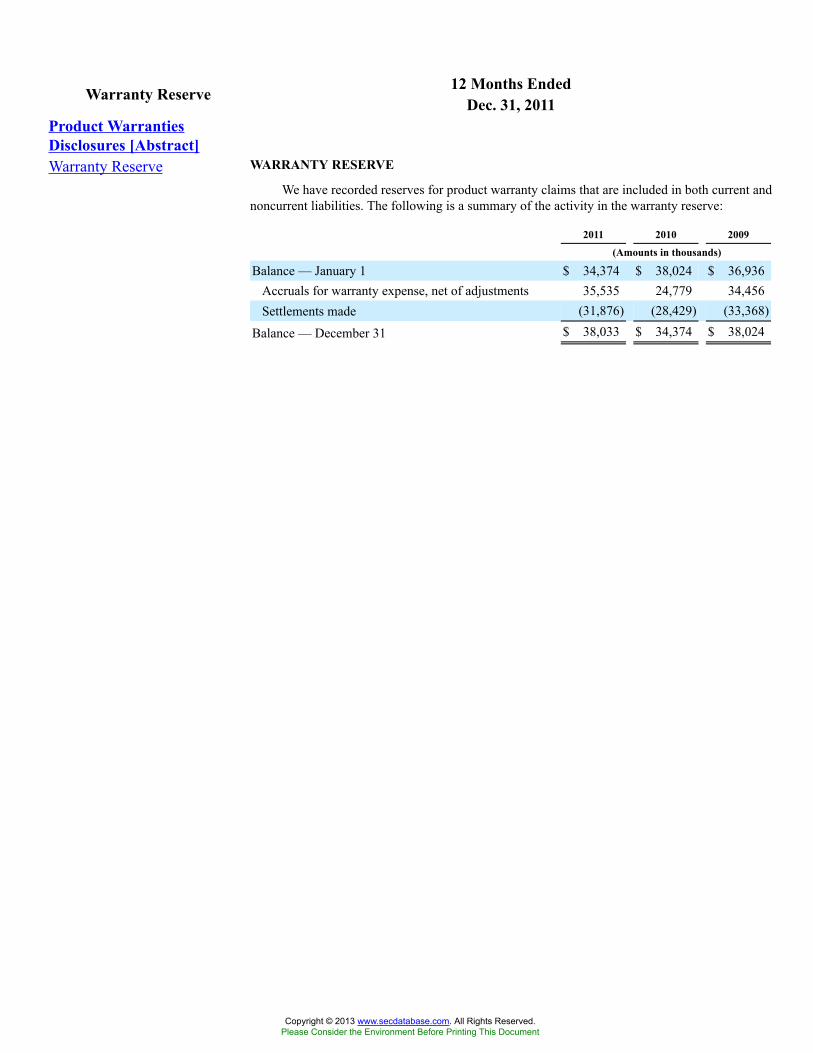
12 Months EndedWarranty Reserve Dec. 31, 2011Product WarrantiesDisclosures [Abstract]Warranty Reserve WARRANTY RESERVE
We have recorded reserves for product warranty claims that are included in both current andnoncurrent liabilities. The following is a summary of the activity in the warranty reserve:
2011 2010 2009
(Amounts in thousands)
Balance — January 1 $ 34,374 $ 38,024 $ 36,936Accruals for warranty expense, net of adjustments 35,535 24,779 34,456Settlements made (31,876) (28,429) (33,368)
Balance — December 31 $ 38,033 $ 34,374 $ 38,024
Copyright © 2013 www.secdatabase.com. All Rights Reserved.Please Consider the Environment Before Printing This Document

12 Months EndedDetails of CertainConsolidated Balance Sheet
Captions (Tables) Dec. 31, 2011
Details of Certain Consolidated Balance SheetCaptions [Abstract]Accounts Receivable, net Accounts Receivable, net — Accounts receivable, net were:
December 31,
2011 2010
(Amounts in thousands)
Trade receivables $1,028,316 $811,311Other receivables 52,284 46,887Less: allowance for doubtful accounts (20,351) (18,632)
Accounts receivable, net $1,060,249 $839,566
Property, Plant and Equipment, net Property, Plant and Equipment, net — Property, plant andequipment, net were:
December 31,
2011 2010
(Amounts in thousands)
Land $ 68,685 $ 69,306Buildings, improvements, furniture and fixtures 583,028 564,986Machinery, equipment, capital leases andconstruction in progress 667,025 629,668Gross property, plant and equipment 1,318,738 1,263,960Less: accumulated depreciation (719,992) (682,715)
Property, plant and equipment, net $ 598,746 $ 581,245
Accrued Liabilities Accrued Liabilities — Accrued liabilities were:
December 31,
2011 2010
(Amounts in thousands)
Wages, compensation and other benefits $197,698 $207,445Commissions and royalties 33,639 34,756Customer advance payments 358,698 315,515Progress billings in excess of accumulated costs 20,475 71,327Warranty costs and late delivery penalties 70,187 57,248Sales and use tax 11,623 14,103Income tax 21,467 15,179Other 94,814 102,264
Accrued liabilities $808,601 $817,837
Retirement Obligations and Other Liabilities Retirement Obligations and Other Liabilities — Retirementobligations and other liabilities were:
December 31,
2011 2010
(Amounts in thousands)
Copyright © 2013 www.secdatabase.com. All Rights Reserved.Please Consider the Environment Before Printing This Document
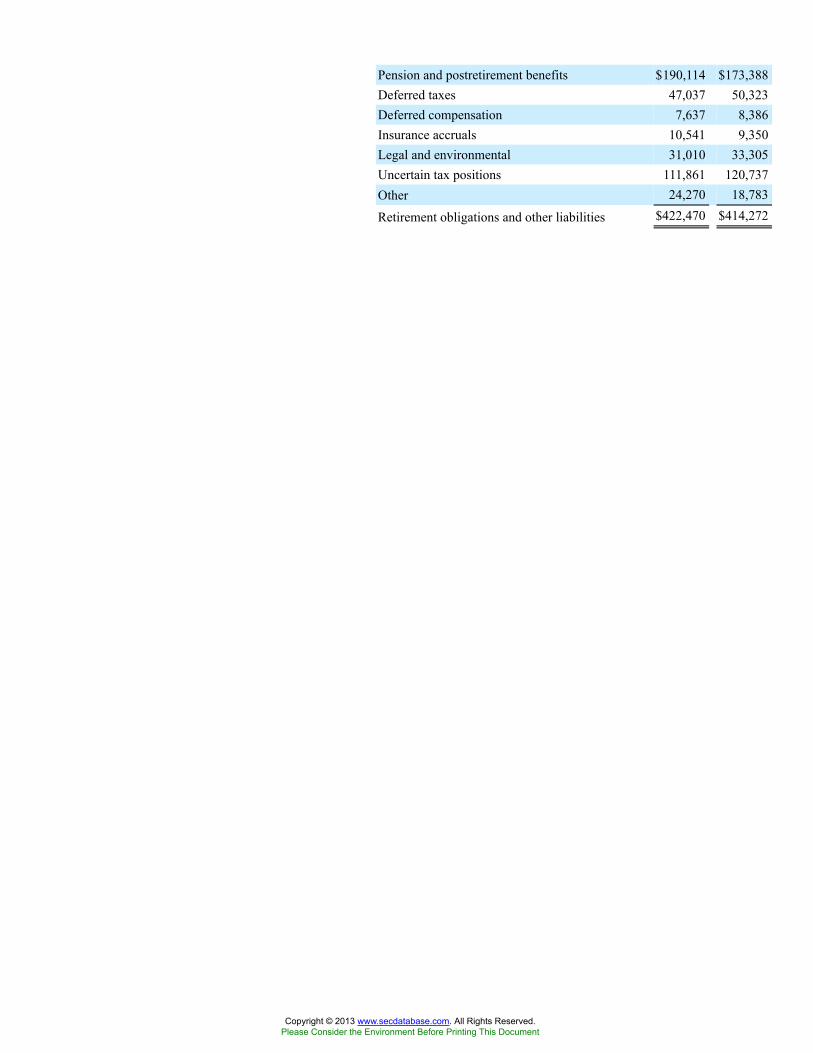
Pension and postretirement benefits $190,114 $173,388Deferred taxes 47,037 50,323Deferred compensation 7,637 8,386Insurance accruals 10,541 9,350Legal and environmental 31,010 33,305Uncertain tax positions 111,861 120,737Other 24,270 18,783
Retirement obligations and other liabilities $422,470 $414,272
Copyright © 2013 www.secdatabase.com. All Rights Reserved.Please Consider the Environment Before Printing This Document
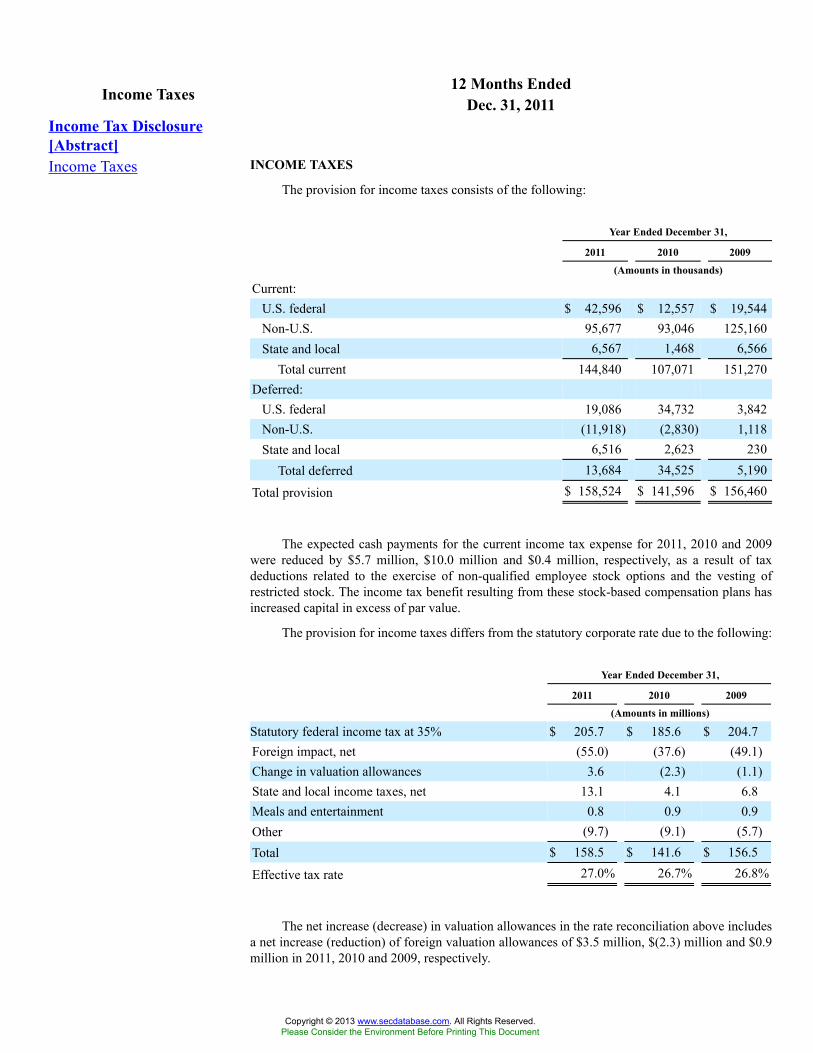
12 Months EndedIncome Taxes Dec. 31, 2011Income Tax Disclosure[Abstract]Income Taxes INCOME TAXES
The provision for income taxes consists of the following:
Year Ended December 31,
2011 2010 2009
(Amounts in thousands)
Current:U.S. federal $ 42,596 $ 12,557 $ 19,544Non-U.S. 95,677 93,046 125,160State and local 6,567 1,468 6,566
Total current 144,840 107,071 151,270Deferred:
U.S. federal 19,086 34,732 3,842Non-U.S. (11,918) (2,830) 1,118State and local 6,516 2,623 230
Total deferred 13,684 34,525 5,190
Total provision $ 158,524 $ 141,596 $ 156,460
The expected cash payments for the current income tax expense for 2011, 2010 and 2009were reduced by $5.7 million, $10.0 million and $0.4 million, respectively, as a result of taxdeductions related to the exercise of non-qualified employee stock options and the vesting ofrestricted stock. The income tax benefit resulting from these stock-based compensation plans hasincreased capital in excess of par value.
The provision for income taxes differs from the statutory corporate rate due to the following:
Year Ended December 31,
2011 2010 2009
(Amounts in millions)
Statutory federal income tax at 35% $ 205.7 $ 185.6 $ 204.7Foreign impact, net (55.0) (37.6) (49.1)Change in valuation allowances 3.6 (2.3) (1.1)State and local income taxes, net 13.1 4.1 6.8Meals and entertainment 0.8 0.9 0.9Other (9.7) (9.1) (5.7)Total $ 158.5 $ 141.6 $ 156.5
Effective tax rate 27.0% 26.7% 26.8%
The net increase (decrease) in valuation allowances in the rate reconciliation above includesa net increase (reduction) of foreign valuation allowances of $3.5 million, $(2.3) million and $0.9million in 2011, 2010 and 2009, respectively.
Copyright © 2013 www.secdatabase.com. All Rights Reserved.Please Consider the Environment Before Printing This Document
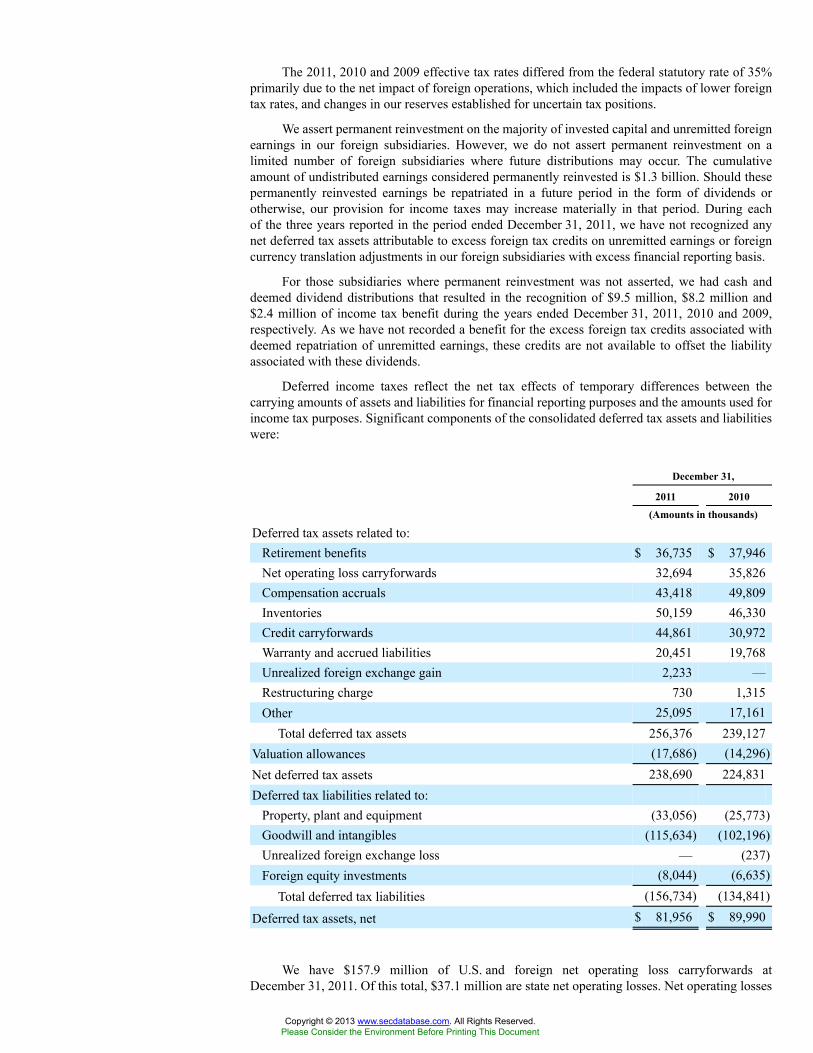
The 2011, 2010 and 2009 effective tax rates differed from the federal statutory rate of 35%primarily due to the net impact of foreign operations, which included the impacts of lower foreigntax rates, and changes in our reserves established for uncertain tax positions.
We assert permanent reinvestment on the majority of invested capital and unremitted foreignearnings in our foreign subsidiaries. However, we do not assert permanent reinvestment on alimited number of foreign subsidiaries where future distributions may occur. The cumulativeamount of undistributed earnings considered permanently reinvested is $1.3 billion. Should thesepermanently reinvested earnings be repatriated in a future period in the form of dividends orotherwise, our provision for income taxes may increase materially in that period. During eachof the three years reported in the period ended December 31, 2011, we have not recognized anynet deferred tax assets attributable to excess foreign tax credits on unremitted earnings or foreigncurrency translation adjustments in our foreign subsidiaries with excess financial reporting basis.
For those subsidiaries where permanent reinvestment was not asserted, we had cash anddeemed dividend distributions that resulted in the recognition of $9.5 million, $8.2 million and$2.4 million of income tax benefit during the years ended December 31, 2011, 2010 and 2009,respectively. As we have not recorded a benefit for the excess foreign tax credits associated withdeemed repatriation of unremitted earnings, these credits are not available to offset the liabilityassociated with these dividends.
Deferred income taxes reflect the net tax effects of temporary differences between thecarrying amounts of assets and liabilities for financial reporting purposes and the amounts used forincome tax purposes. Significant components of the consolidated deferred tax assets and liabilitieswere:
December 31,
2011 2010
(Amounts in thousands)
Deferred tax assets related to:Retirement benefits $ 36,735 $ 37,946Net operating loss carryforwards 32,694 35,826Compensation accruals 43,418 49,809Inventories 50,159 46,330Credit carryforwards 44,861 30,972Warranty and accrued liabilities 20,451 19,768Unrealized foreign exchange gain 2,233 —Restructuring charge 730 1,315Other 25,095 17,161
Total deferred tax assets 256,376 239,127Valuation allowances (17,686) (14,296)Net deferred tax assets 238,690 224,831Deferred tax liabilities related to:
Property, plant and equipment (33,056) (25,773)Goodwill and intangibles (115,634) (102,196)Unrealized foreign exchange loss — (237)Foreign equity investments (8,044) (6,635)
Total deferred tax liabilities (156,734) (134,841)
Deferred tax assets, net $ 81,956 $ 89,990
We have $157.9 million of U.S. and foreign net operating loss carryforwards atDecember 31, 2011. Of this total, $37.1 million are state net operating losses. Net operating losses
Copyright © 2013 www.secdatabase.com. All Rights Reserved.Please Consider the Environment Before Printing This Document
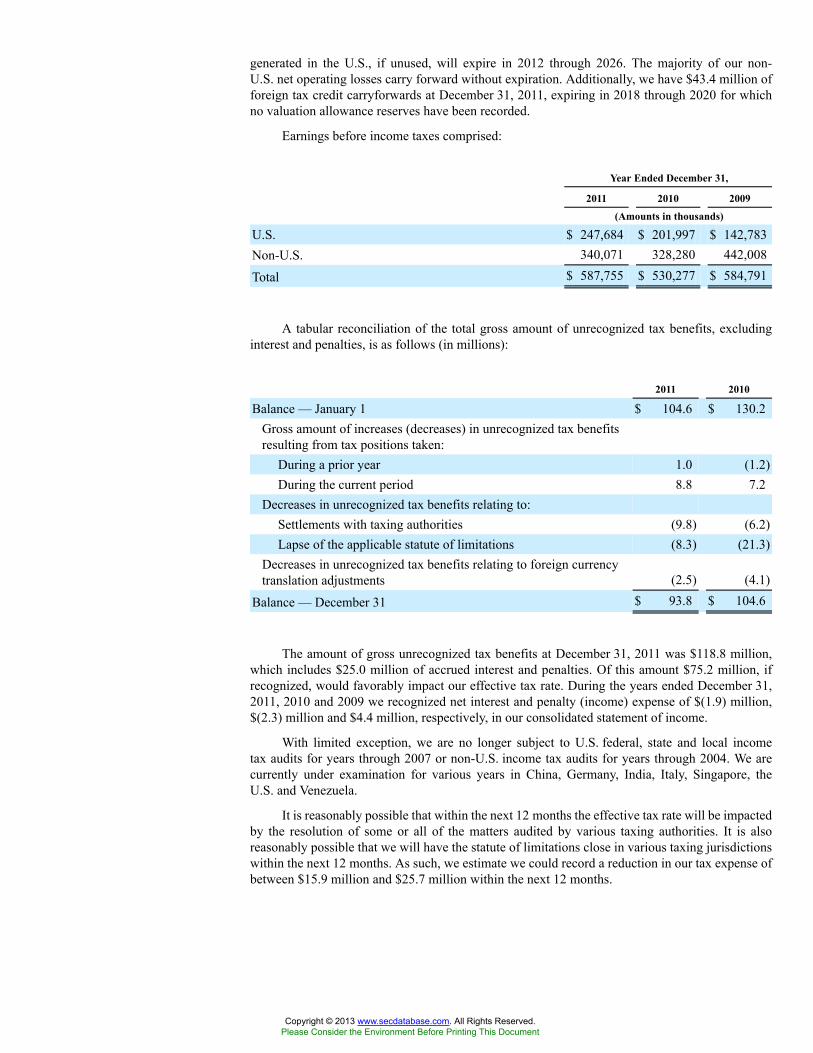
generated in the U.S., if unused, will expire in 2012 through 2026. The majority of our non-U.S. net operating losses carry forward without expiration. Additionally, we have $43.4 million offoreign tax credit carryforwards at December 31, 2011, expiring in 2018 through 2020 for whichno valuation allowance reserves have been recorded.
Earnings before income taxes comprised:
Year Ended December 31,
2011 2010 2009
(Amounts in thousands)
U.S. $ 247,684 $ 201,997 $ 142,783Non-U.S. 340,071 328,280 442,008
Total $ 587,755 $ 530,277 $ 584,791
A tabular reconciliation of the total gross amount of unrecognized tax benefits, excludinginterest and penalties, is as follows (in millions):
2011 2010
Balance — January 1 $ 104.6 $ 130.2Gross amount of increases (decreases) in unrecognized tax benefitsresulting from tax positions taken:
During a prior year 1.0 (1.2)During the current period 8.8 7.2
Decreases in unrecognized tax benefits relating to:Settlements with taxing authorities (9.8) (6.2)Lapse of the applicable statute of limitations (8.3) (21.3)
Decreases in unrecognized tax benefits relating to foreign currencytranslation adjustments (2.5) (4.1)
Balance — December 31 $ 93.8 $ 104.6
The amount of gross unrecognized tax benefits at December 31, 2011 was $118.8 million,which includes $25.0 million of accrued interest and penalties. Of this amount $75.2 million, ifrecognized, would favorably impact our effective tax rate. During the years ended December 31,2011, 2010 and 2009 we recognized net interest and penalty (income) expense of $(1.9) million,$(2.3) million and $4.4 million, respectively, in our consolidated statement of income.
With limited exception, we are no longer subject to U.S. federal, state and local incometax audits for years through 2007 or non-U.S. income tax audits for years through 2004. We arecurrently under examination for various years in China, Germany, India, Italy, Singapore, theU.S. and Venezuela.
It is reasonably possible that within the next 12 months the effective tax rate will be impactedby the resolution of some or all of the matters audited by various taxing authorities. It is alsoreasonably possible that we will have the statute of limitations close in various taxing jurisdictionswithin the next 12 months. As such, we estimate we could record a reduction in our tax expense ofbetween $15.9 million and $25.7 million within the next 12 months.
Copyright © 2013 www.secdatabase.com. All Rights Reserved.Please Consider the Environment Before Printing This Document
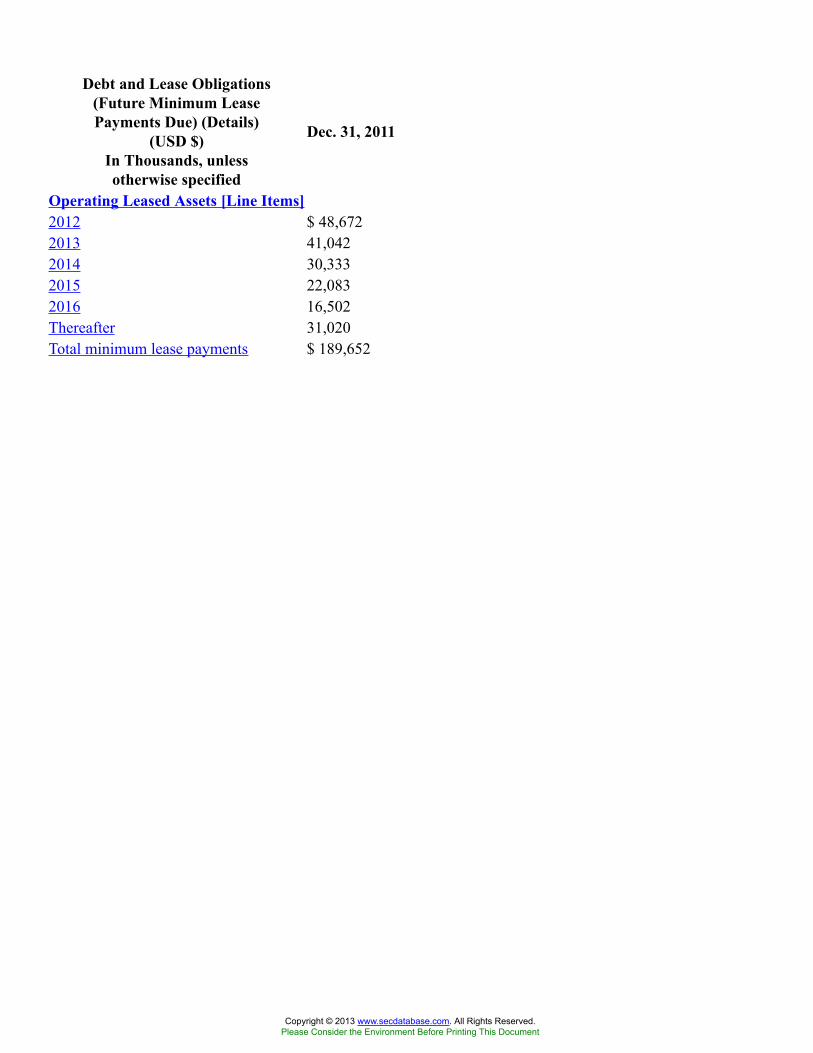
Debt and Lease Obligations(Future Minimum LeasePayments Due) (Details)
(USD $)In Thousands, unlessotherwise specified
Dec. 31, 2011
Operating Leased Assets [Line Items]2012 $ 48,6722013 41,0422014 30,3332015 22,0832016 16,502Thereafter 31,020Total minimum lease payments $ 189,652
Copyright © 2013 www.secdatabase.com. All Rights Reserved.Please Consider the Environment Before Printing This Document
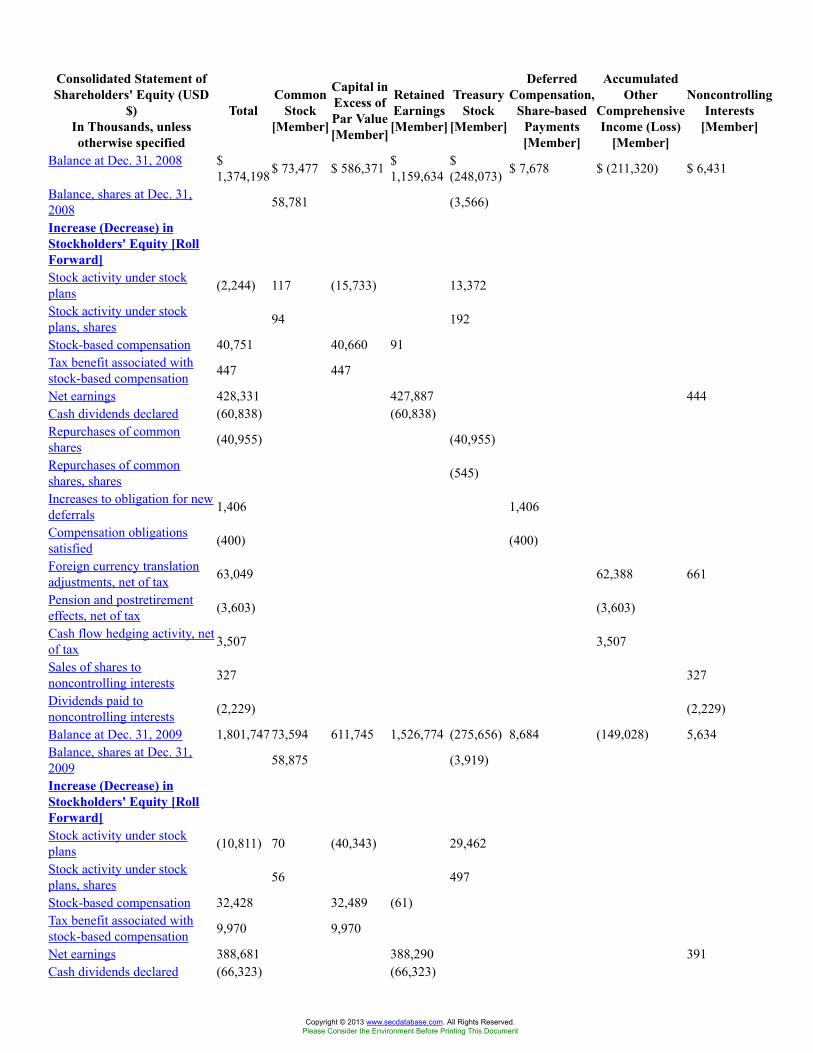
Consolidated Statement ofShareholders' Equity (USD
$)In Thousands, unlessotherwise specified
TotalCommon
Stock[Member]
Capital inExcess ofPar Value[Member]
RetainedEarnings[Member]
TreasuryStock
[Member]
DeferredCompensation,
Share-basedPayments[Member]
AccumulatedOther
ComprehensiveIncome (Loss)
[Member]
NoncontrollingInterests
[Member]
Balance at Dec. 31, 2008 $1,374,198$ 73,477 $ 586,371 $
1,159,634$(248,073) $ 7,678 $ (211,320) $ 6,431
Balance, shares at Dec. 31,2008 58,781 (3,566)
Increase (Decrease) inStockholders' Equity [RollForward]Stock activity under stockplans (2,244) 117 (15,733) 13,372
Stock activity under stockplans, shares 94 192
Stock-based compensation 40,751 40,660 91Tax benefit associated withstock-based compensation 447 447
Net earnings 428,331 427,887 444Cash dividends declared (60,838) (60,838)Repurchases of commonshares (40,955) (40,955)
Repurchases of commonshares, shares (545)
Increases to obligation for newdeferrals 1,406 1,406
Compensation obligationssatisfied (400) (400)
Foreign currency translationadjustments, net of tax 63,049 62,388 661
Pension and postretirementeffects, net of tax (3,603) (3,603)
Cash flow hedging activity, netof tax 3,507 3,507
Sales of shares tononcontrolling interests 327 327
Dividends paid tononcontrolling interests (2,229) (2,229)
Balance at Dec. 31, 2009 1,801,74773,594 611,745 1,526,774 (275,656) 8,684 (149,028) 5,634Balance, shares at Dec. 31,2009 58,875 (3,919)
Increase (Decrease) inStockholders' Equity [RollForward]Stock activity under stockplans (10,811) 70 (40,343) 29,462
Stock activity under stockplans, shares 56 497
Stock-based compensation 32,428 32,489 (61)Tax benefit associated withstock-based compensation 9,970 9,970
Net earnings 388,681 388,290 391Cash dividends declared (66,323) (66,323)
Copyright © 2013 www.secdatabase.com. All Rights Reserved.Please Consider the Environment Before Printing This Document
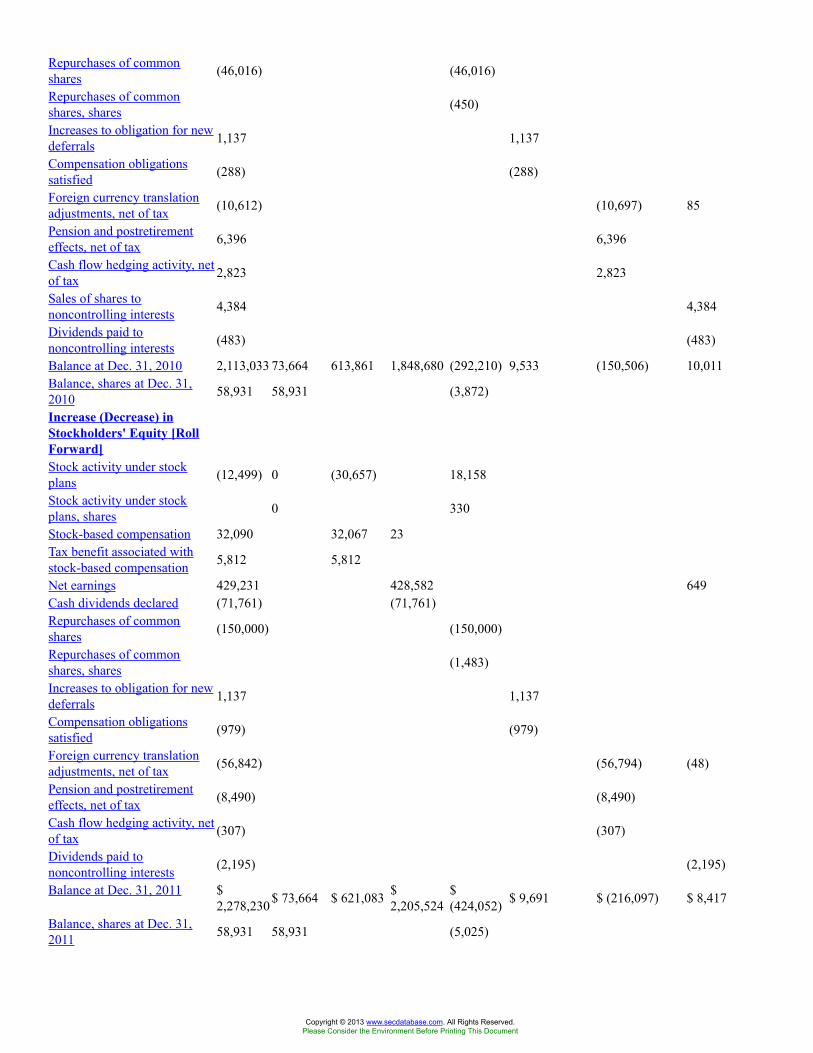
Repurchases of commonshares (46,016) (46,016)
Repurchases of commonshares, shares (450)
Increases to obligation for newdeferrals 1,137 1,137
Compensation obligationssatisfied (288) (288)
Foreign currency translationadjustments, net of tax (10,612) (10,697) 85
Pension and postretirementeffects, net of tax 6,396 6,396
Cash flow hedging activity, netof tax 2,823 2,823
Sales of shares tononcontrolling interests 4,384 4,384
Dividends paid tononcontrolling interests (483) (483)
Balance at Dec. 31, 2010 2,113,033 73,664 613,861 1,848,680 (292,210) 9,533 (150,506) 10,011Balance, shares at Dec. 31,2010 58,931 58,931 (3,872)
Increase (Decrease) inStockholders' Equity [RollForward]Stock activity under stockplans (12,499) 0 (30,657) 18,158
Stock activity under stockplans, shares 0 330
Stock-based compensation 32,090 32,067 23Tax benefit associated withstock-based compensation 5,812 5,812
Net earnings 429,231 428,582 649Cash dividends declared (71,761) (71,761)Repurchases of commonshares (150,000) (150,000)
Repurchases of commonshares, shares (1,483)
Increases to obligation for newdeferrals 1,137 1,137
Compensation obligationssatisfied (979) (979)
Foreign currency translationadjustments, net of tax (56,842) (56,794) (48)
Pension and postretirementeffects, net of tax (8,490) (8,490)
Cash flow hedging activity, netof tax (307) (307)
Dividends paid tononcontrolling interests (2,195) (2,195)
Balance at Dec. 31, 2011 $2,278,230$ 73,664 $ 621,083 $
2,205,524$(424,052) $ 9,691 $ (216,097) $ 8,417
Balance, shares at Dec. 31,2011 58,931 58,931 (5,025)
Copyright © 2013 www.secdatabase.com. All Rights Reserved.Please Consider the Environment Before Printing This Document
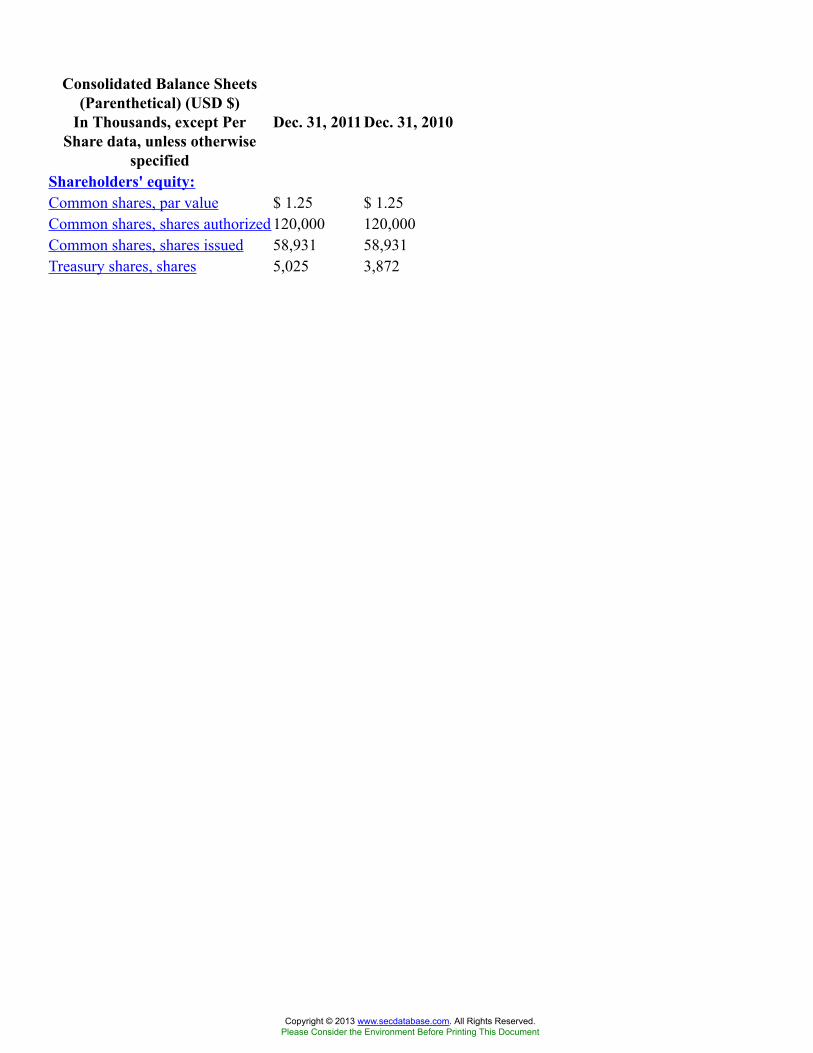
Consolidated Balance Sheets(Parenthetical) (USD $)
In Thousands, except PerShare data, unless otherwise
specified
Dec. 31, 2011Dec. 31, 2010
Shareholders' equity:Common shares, par value $ 1.25 $ 1.25Common shares, shares authorized 120,000 120,000Common shares, shares issued 58,931 58,931Treasury shares, shares 5,025 3,872
Copyright © 2013 www.secdatabase.com. All Rights Reserved.Please Consider the Environment Before Printing This Document
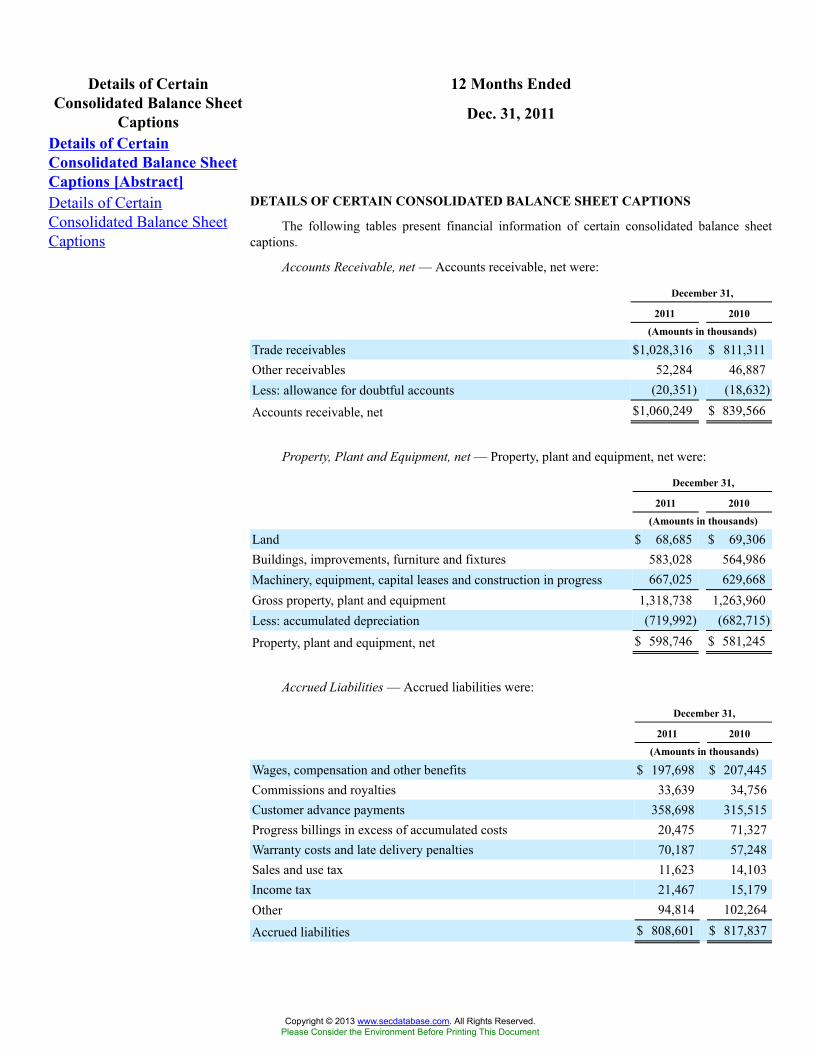
12 Months EndedDetails of CertainConsolidated Balance Sheet
Captions Dec. 31, 2011
Details of CertainConsolidated Balance SheetCaptions [Abstract]Details of CertainConsolidated Balance SheetCaptions
DETAILS OF CERTAIN CONSOLIDATED BALANCE SHEET CAPTIONS
The following tables present financial information of certain consolidated balance sheetcaptions.
Accounts Receivable, net — Accounts receivable, net were:
December 31,
2011 2010
(Amounts in thousands)
Trade receivables $1,028,316 $ 811,311Other receivables 52,284 46,887Less: allowance for doubtful accounts (20,351) (18,632)
Accounts receivable, net $1,060,249 $ 839,566
Property, Plant and Equipment, net — Property, plant and equipment, net were:
December 31,
2011 2010
(Amounts in thousands)
Land $ 68,685 $ 69,306Buildings, improvements, furniture and fixtures 583,028 564,986Machinery, equipment, capital leases and construction in progress 667,025 629,668Gross property, plant and equipment 1,318,738 1,263,960Less: accumulated depreciation (719,992) (682,715)
Property, plant and equipment, net $ 598,746 $ 581,245
Accrued Liabilities — Accrued liabilities were:
December 31,
2011 2010
(Amounts in thousands)
Wages, compensation and other benefits $ 197,698 $ 207,445Commissions and royalties 33,639 34,756Customer advance payments 358,698 315,515Progress billings in excess of accumulated costs 20,475 71,327Warranty costs and late delivery penalties 70,187 57,248Sales and use tax 11,623 14,103Income tax 21,467 15,179Other 94,814 102,264
Accrued liabilities $ 808,601 $ 817,837
Copyright © 2013 www.secdatabase.com. All Rights Reserved.Please Consider the Environment Before Printing This Document

"Other" accrued liabilities include professional fees, lease obligations, insurance, interest,freight, restructuring charges, accrued cash dividends payable, legal and environmental matters,derivative liabilities and other items, none of which individually exceed 5% of current liabilities.See Note 7 for additional information on our restructuring charges.
Retirement Obligations and Other Liabilities — Retirement obligations and other liabilitieswere:
December 31,
2011 2010
(Amounts in thousands)
Pension and postretirement benefits $ 190,114 $ 173,388Deferred taxes 47,037 50,323Deferred compensation 7,637 8,386Insurance accruals 10,541 9,350Legal and environmental 31,010 33,305Uncertain tax positions 111,861 120,737Other 24,270 18,783
Retirement obligations and other liabilities $ 422,470 $ 414,272
Copyright © 2013 www.secdatabase.com. All Rights Reserved.Please Consider the Environment Before Printing This Document
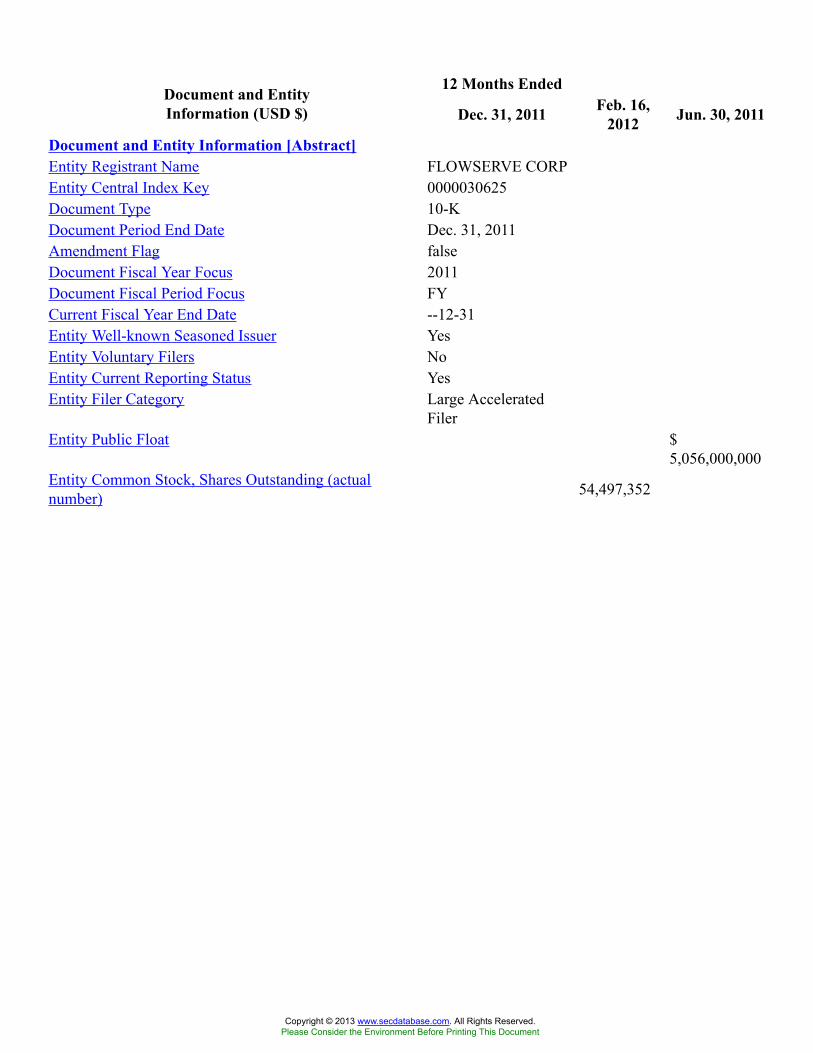
12 Months EndedDocument and EntityInformation (USD $) Dec. 31, 2011 Feb. 16,
2012 Jun. 30, 2011
Document and Entity Information [Abstract]Entity Registrant Name FLOWSERVE CORPEntity Central Index Key 0000030625Document Type 10-KDocument Period End Date Dec. 31, 2011Amendment Flag falseDocument Fiscal Year Focus 2011Document Fiscal Period Focus FYCurrent Fiscal Year End Date --12-31Entity Well-known Seasoned Issuer YesEntity Voluntary Filers NoEntity Current Reporting Status YesEntity Filer Category Large Accelerated
FilerEntity Public Float $
5,056,000,000Entity Common Stock, Shares Outstanding (actualnumber) 54,497,352
Copyright © 2013 www.secdatabase.com. All Rights Reserved.Please Consider the Environment Before Printing This Document
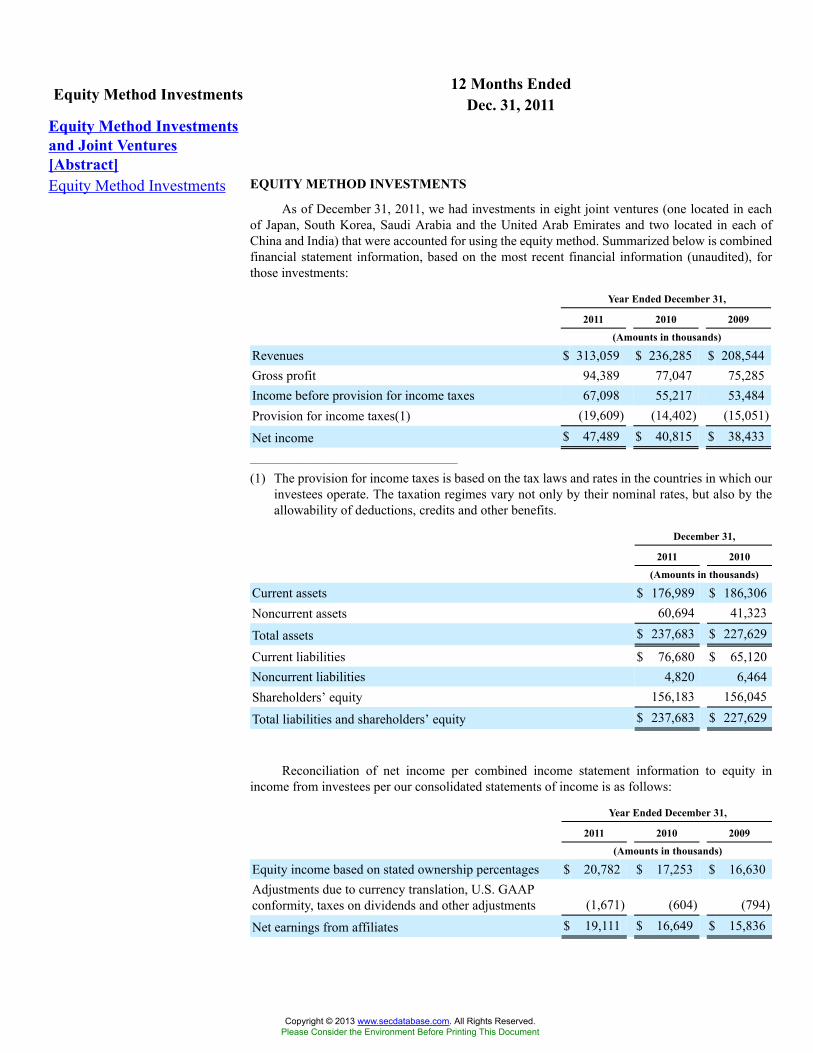
12 Months EndedEquity Method Investments Dec. 31, 2011Equity Method Investmentsand Joint Ventures[Abstract]Equity Method Investments EQUITY METHOD INVESTMENTS
As of December 31, 2011, we had investments in eight joint ventures (one located in eachof Japan, South Korea, Saudi Arabia and the United Arab Emirates and two located in each ofChina and India) that were accounted for using the equity method. Summarized below is combinedfinancial statement information, based on the most recent financial information (unaudited), forthose investments:
Year Ended December 31,
2011 2010 2009
(Amounts in thousands)
Revenues $ 313,059 $ 236,285 $ 208,544Gross profit 94,389 77,047 75,285Income before provision for income taxes 67,098 55,217 53,484Provision for income taxes(1) (19,609) (14,402) (15,051)
Net income $ 47,489 $ 40,815 $ 38,433_______________________________________
(1) The provision for income taxes is based on the tax laws and rates in the countries in which ourinvestees operate. The taxation regimes vary not only by their nominal rates, but also by theallowability of deductions, credits and other benefits.
December 31,
2011 2010
(Amounts in thousands)
Current assets $ 176,989 $ 186,306Noncurrent assets 60,694 41,323
Total assets $ 237,683 $ 227,629
Current liabilities $ 76,680 $ 65,120Noncurrent liabilities 4,820 6,464Shareholders’ equity 156,183 156,045
Total liabilities and shareholders’ equity $ 237,683 $ 227,629
Reconciliation of net income per combined income statement information to equity inincome from investees per our consolidated statements of income is as follows:
Year Ended December 31,
2011 2010 2009
(Amounts in thousands)
Equity income based on stated ownership percentages $ 20,782 $ 17,253 $ 16,630Adjustments due to currency translation, U.S. GAAPconformity, taxes on dividends and other adjustments (1,671) (604) (794)
Net earnings from affiliates $ 19,111 $ 16,649 $ 15,836
Copyright © 2013 www.secdatabase.com. All Rights Reserved.Please Consider the Environment Before Printing This Document

Our investments in unconsolidated affiliates were $70.3 million and $71.3 million as ofDecember 31, 2011 and 2010, respectively, recorded in other assets, net on the balance sheet.
Copyright © 2013 www.secdatabase.com. All Rights Reserved.Please Consider the Environment Before Printing This Document
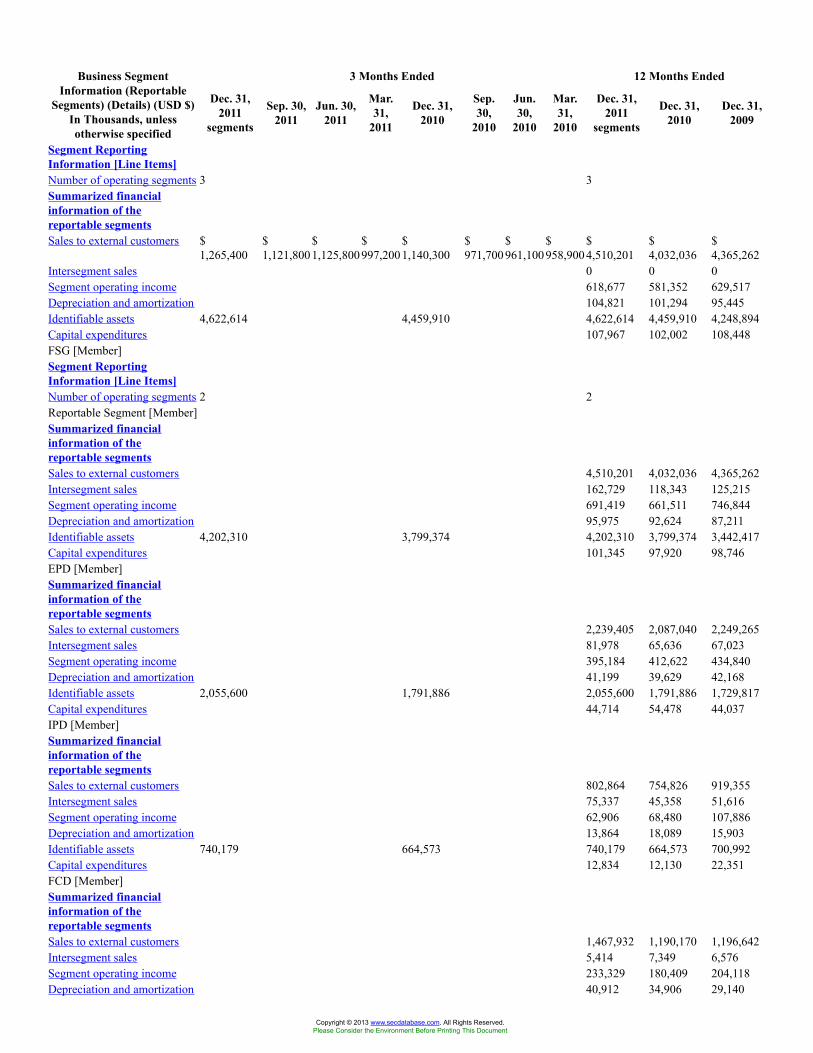
3 Months Ended 12 Months EndedBusiness SegmentInformation (Reportable
Segments) (Details) (USD $)In Thousands, unlessotherwise specified
Dec. 31,2011
segments
Sep. 30,2011
Jun. 30,2011
Mar.31,
2011
Dec. 31,2010
Sep.30,
2010
Jun.30,
2010
Mar.31,
2010
Dec. 31,2011
segments
Dec. 31,2010
Dec. 31,2009
Segment ReportingInformation [Line Items]Number of operating segments 3 3Summarized financialinformation of thereportable segmentsSales to external customers $
1,265,400$1,121,800
$1,125,800
$997,200
$1,140,300
$971,700
$961,100
$958,900
$4,510,201
$4,032,036
$4,365,262
Intersegment sales 0 0 0Segment operating income 618,677 581,352 629,517Depreciation and amortization 104,821 101,294 95,445Identifiable assets 4,622,614 4,459,910 4,622,614 4,459,910 4,248,894Capital expenditures 107,967 102,002 108,448FSG [Member]Segment ReportingInformation [Line Items]Number of operating segments 2 2Reportable Segment [Member]Summarized financialinformation of thereportable segmentsSales to external customers 4,510,201 4,032,036 4,365,262Intersegment sales 162,729 118,343 125,215Segment operating income 691,419 661,511 746,844Depreciation and amortization 95,975 92,624 87,211Identifiable assets 4,202,310 3,799,374 4,202,310 3,799,374 3,442,417Capital expenditures 101,345 97,920 98,746EPD [Member]Summarized financialinformation of thereportable segmentsSales to external customers 2,239,405 2,087,040 2,249,265Intersegment sales 81,978 65,636 67,023Segment operating income 395,184 412,622 434,840Depreciation and amortization 41,199 39,629 42,168Identifiable assets 2,055,600 1,791,886 2,055,600 1,791,886 1,729,817Capital expenditures 44,714 54,478 44,037IPD [Member]Summarized financialinformation of thereportable segmentsSales to external customers 802,864 754,826 919,355Intersegment sales 75,337 45,358 51,616Segment operating income 62,906 68,480 107,886Depreciation and amortization 13,864 18,089 15,903Identifiable assets 740,179 664,573 740,179 664,573 700,992Capital expenditures 12,834 12,130 22,351FCD [Member]Summarized financialinformation of thereportable segmentsSales to external customers 1,467,932 1,190,170 1,196,642Intersegment sales 5,414 7,349 6,576Segment operating income 233,329 180,409 204,118Depreciation and amortization 40,912 34,906 29,140
Copyright © 2013 www.secdatabase.com. All Rights Reserved.Please Consider the Environment Before Printing This Document
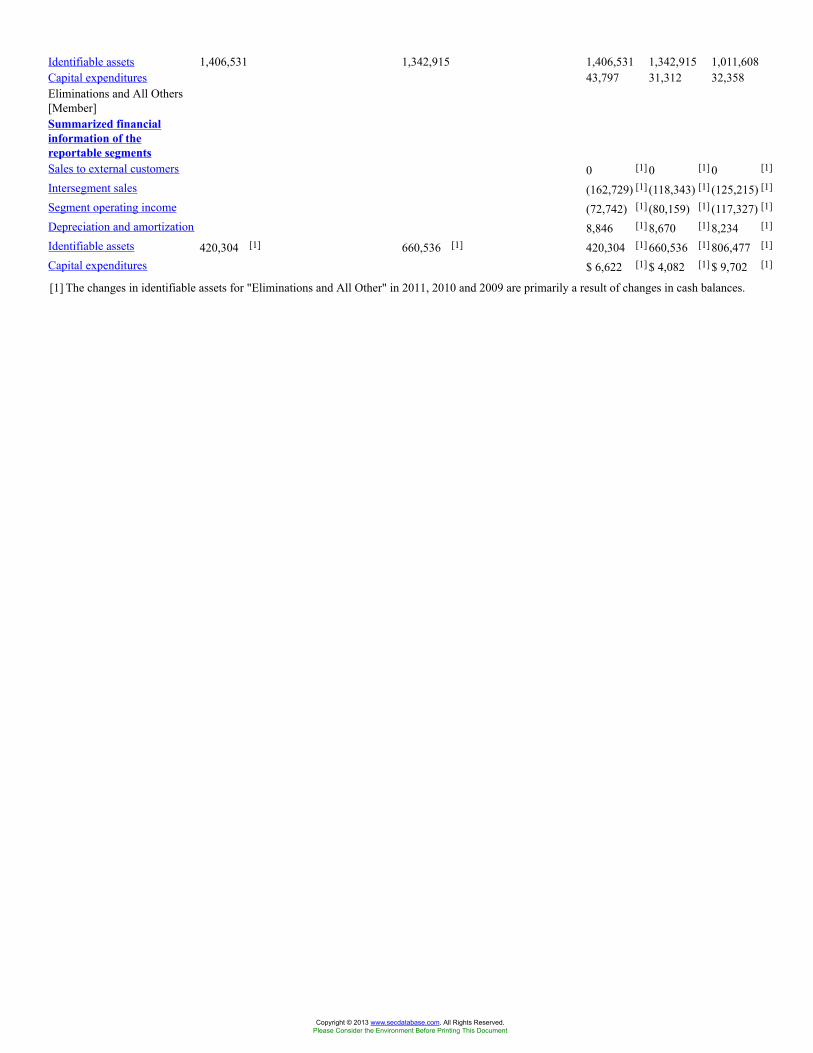
Identifiable assets 1,406,531 1,342,915 1,406,531 1,342,915 1,011,608Capital expenditures 43,797 31,312 32,358Eliminations and All Others[Member]Summarized financialinformation of thereportable segmentsSales to external customers 0 [1] 0 [1] 0 [1]
Intersegment sales (162,729) [1] (118,343) [1] (125,215) [1]
Segment operating income (72,742) [1] (80,159) [1] (117,327) [1]
Depreciation and amortization 8,846 [1] 8,670 [1] 8,234 [1]
Identifiable assets 420,304 [1] 660,536 [1] 420,304 [1] 660,536 [1] 806,477 [1]
Capital expenditures $ 6,622 [1] $ 4,082 [1] $ 9,702 [1]
[1] The changes in identifiable assets for "Eliminations and All Other" in 2011, 2010 and 2009 are primarily a result of changes in cash balances.
Copyright © 2013 www.secdatabase.com. All Rights Reserved.Please Consider the Environment Before Printing This Document
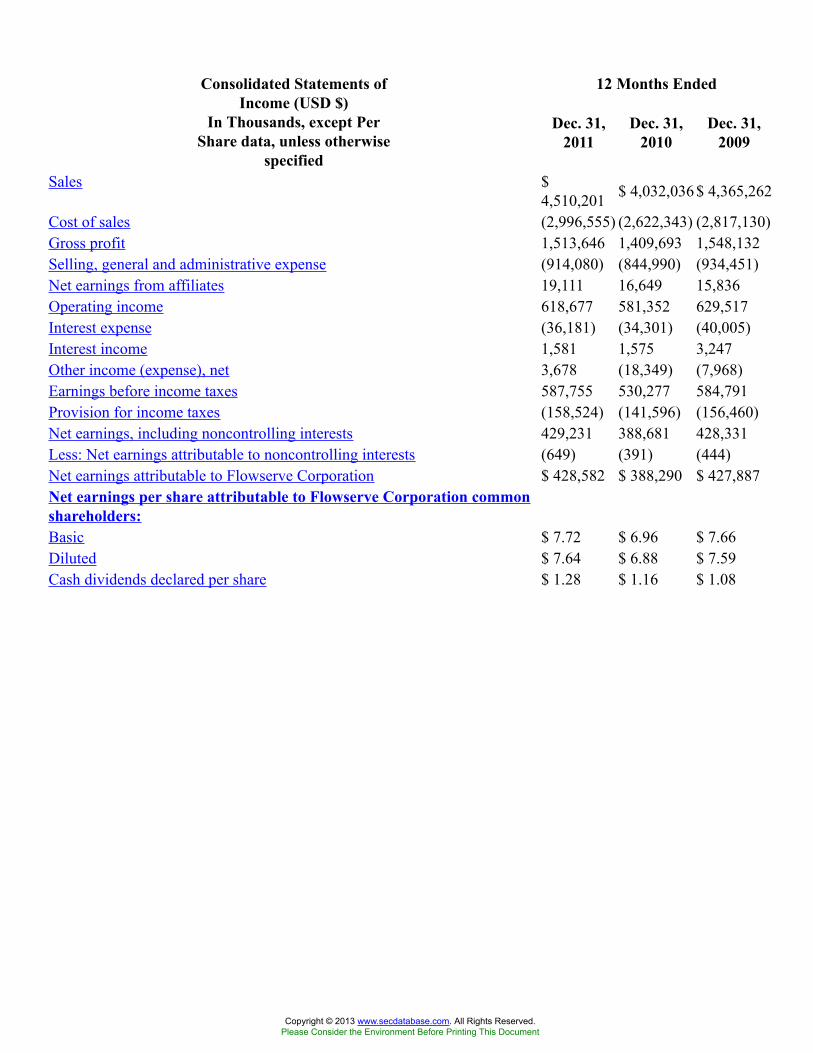
12 Months EndedConsolidated Statements ofIncome (USD $)
In Thousands, except PerShare data, unless otherwise
specified
Dec. 31,2011
Dec. 31,2010
Dec. 31,2009
Sales $4,510,201 $ 4,032,036 $ 4,365,262
Cost of sales (2,996,555) (2,622,343) (2,817,130)Gross profit 1,513,646 1,409,693 1,548,132Selling, general and administrative expense (914,080) (844,990) (934,451)Net earnings from affiliates 19,111 16,649 15,836Operating income 618,677 581,352 629,517Interest expense (36,181) (34,301) (40,005)Interest income 1,581 1,575 3,247Other income (expense), net 3,678 (18,349) (7,968)Earnings before income taxes 587,755 530,277 584,791Provision for income taxes (158,524) (141,596) (156,460)Net earnings, including noncontrolling interests 429,231 388,681 428,331Less: Net earnings attributable to noncontrolling interests (649) (391) (444)Net earnings attributable to Flowserve Corporation $ 428,582 $ 388,290 $ 427,887Net earnings per share attributable to Flowserve Corporation commonshareholders:Basic $ 7.72 $ 6.96 $ 7.66Diluted $ 7.64 $ 6.88 $ 7.59Cash dividends declared per share $ 1.28 $ 1.16 $ 1.08
Copyright © 2013 www.secdatabase.com. All Rights Reserved.Please Consider the Environment Before Printing This Document
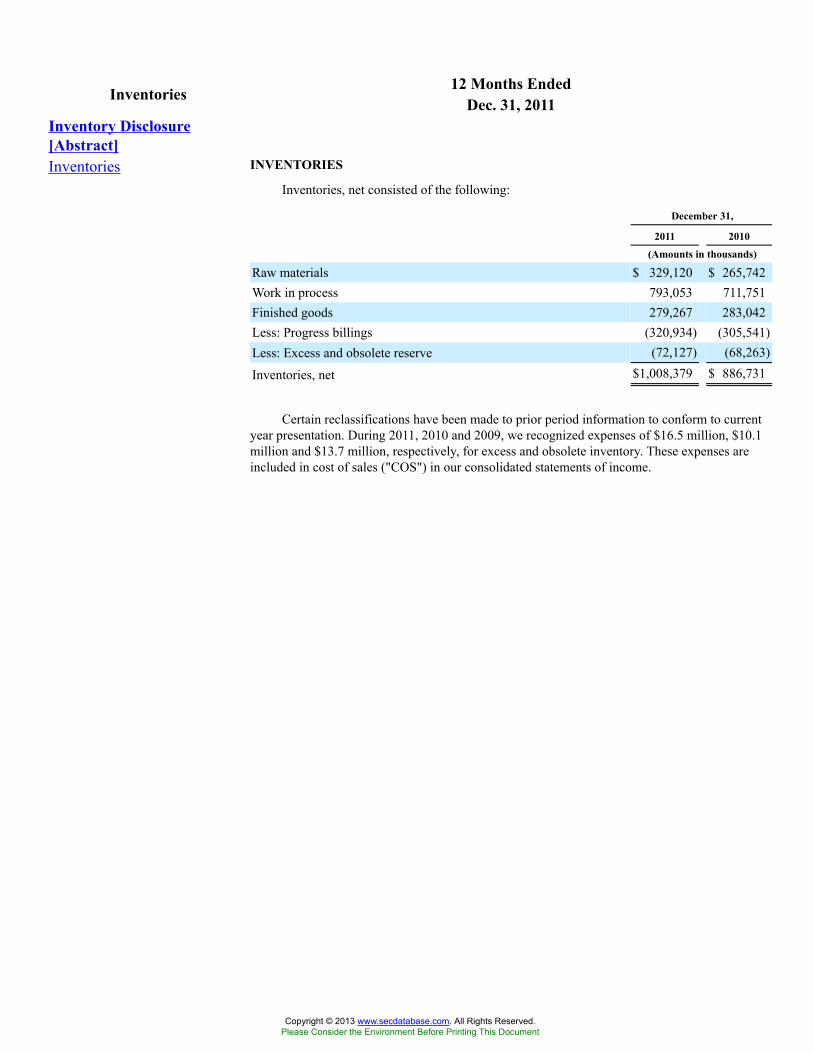
12 Months EndedInventories Dec. 31, 2011Inventory Disclosure[Abstract]Inventories INVENTORIES
Inventories, net consisted of the following:
December 31,
2011 2010
(Amounts in thousands)
Raw materials $ 329,120 $ 265,742Work in process 793,053 711,751Finished goods 279,267 283,042Less: Progress billings (320,934) (305,541)Less: Excess and obsolete reserve (72,127) (68,263)
Inventories, net $1,008,379 $ 886,731
Certain reclassifications have been made to prior period information to conform to currentyear presentation. During 2011, 2010 and 2009, we recognized expenses of $16.5 million, $10.1million and $13.7 million, respectively, for excess and obsolete inventory. These expenses areincluded in cost of sales ("COS") in our consolidated statements of income.
Copyright © 2013 www.secdatabase.com. All Rights Reserved.Please Consider the Environment Before Printing This Document
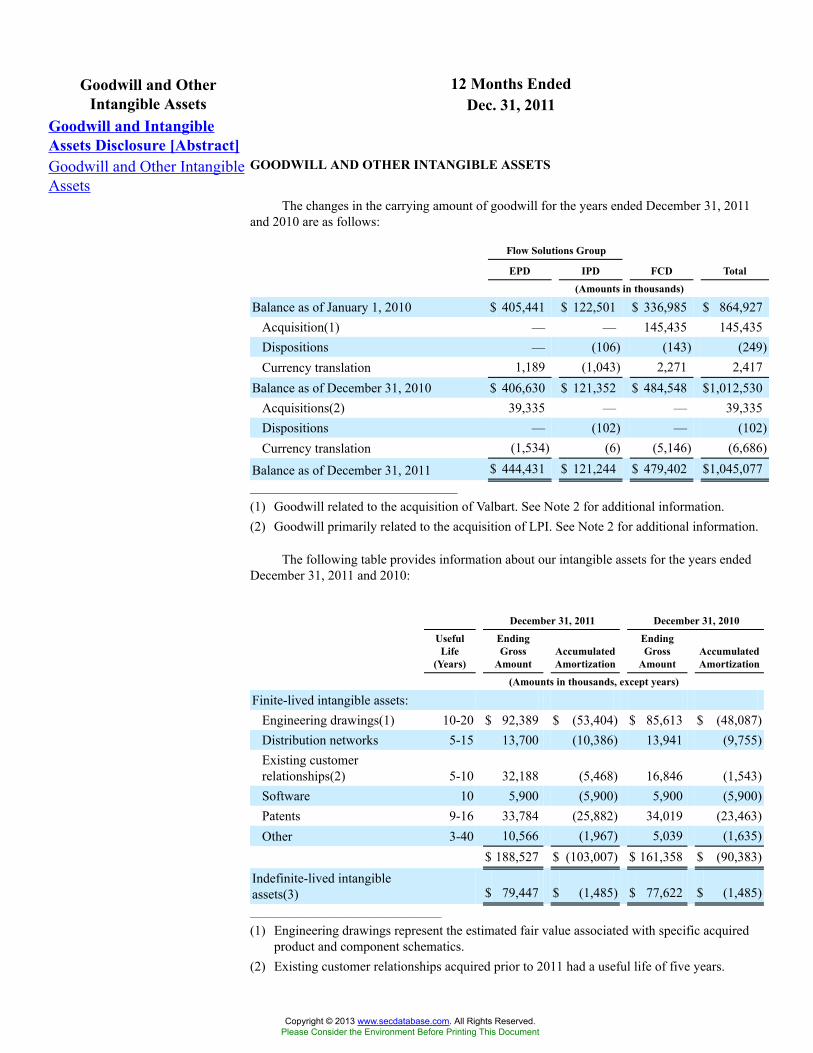
12 Months EndedGoodwill and OtherIntangible Assets Dec. 31, 2011
Goodwill and IntangibleAssets Disclosure [Abstract]Goodwill and Other IntangibleAssets
GOODWILL AND OTHER INTANGIBLE ASSETS
The changes in the carrying amount of goodwill for the years ended December 31, 2011and 2010 are as follows:
Flow Solutions Group
EPD IPD FCD Total
(Amounts in thousands)
Balance as of January 1, 2010 $ 405,441 $ 122,501 $ 336,985 $ 864,927Acquisition(1) — — 145,435 145,435Dispositions — (106) (143) (249)Currency translation 1,189 (1,043) 2,271 2,417
Balance as of December 31, 2010 $ 406,630 $ 121,352 $ 484,548 $1,012,530Acquisitions(2) 39,335 — — 39,335Dispositions — (102) — (102)Currency translation (1,534) (6) (5,146) (6,686)
Balance as of December 31, 2011 $ 444,431 $ 121,244 $ 479,402 $1,045,077_______________________________________
(1) Goodwill related to the acquisition of Valbart. See Note 2 for additional information.(2) Goodwill primarily related to the acquisition of LPI. See Note 2 for additional information.
The following table provides information about our intangible assets for the years endedDecember 31, 2011 and 2010:
December 31, 2011 December 31, 2010
UsefulLife
(Years)
EndingGross
AmountAccumulatedAmortization
EndingGross
AmountAccumulatedAmortization
(Amounts in thousands, except years)
Finite-lived intangible assets:Engineering drawings(1) 10-20 $ 92,389 $ (53,404) $ 85,613 $ (48,087)Distribution networks 5-15 13,700 (10,386) 13,941 (9,755)Existing customerrelationships(2) 5-10 32,188 (5,468) 16,846 (1,543)Software 10 5,900 (5,900) 5,900 (5,900)Patents 9-16 33,784 (25,882) 34,019 (23,463)Other 3-40 10,566 (1,967) 5,039 (1,635)
$ 188,527 $ (103,007) $ 161,358 $ (90,383)Indefinite-lived intangibleassets(3) $ 79,447 $ (1,485) $ 77,622 $ (1,485)____________________________________
(1) Engineering drawings represent the estimated fair value associated with specific acquiredproduct and component schematics.
(2) Existing customer relationships acquired prior to 2011 had a useful life of five years.
Copyright © 2013 www.secdatabase.com. All Rights Reserved.Please Consider the Environment Before Printing This Document
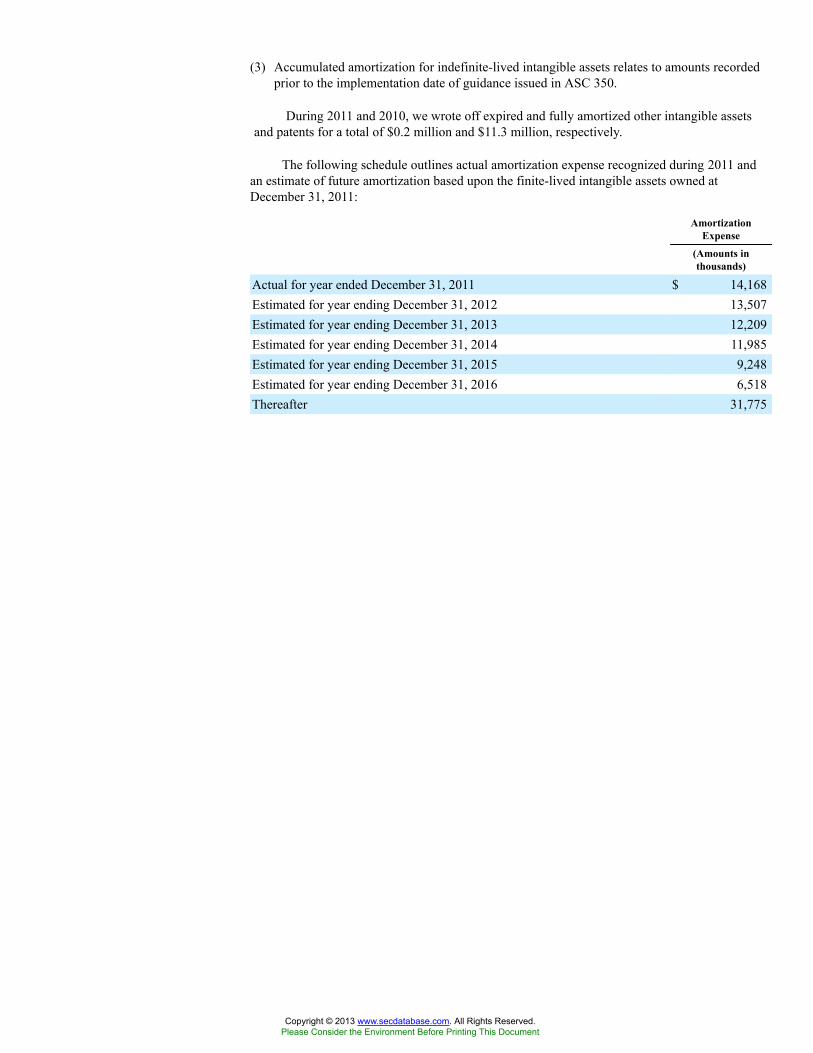
(3) Accumulated amortization for indefinite-lived intangible assets relates to amounts recordedprior to the implementation date of guidance issued in ASC 350.
During 2011 and 2010, we wrote off expired and fully amortized other intangible assetsand patents for a total of $0.2 million and $11.3 million, respectively.
The following schedule outlines actual amortization expense recognized during 2011 andan estimate of future amortization based upon the finite-lived intangible assets owned atDecember 31, 2011:
AmortizationExpense
(Amounts inthousands)
Actual for year ended December 31, 2011 $ 14,168Estimated for year ending December 31, 2012 13,507Estimated for year ending December 31, 2013 12,209Estimated for year ending December 31, 2014 11,985Estimated for year ending December 31, 2015 9,248Estimated for year ending December 31, 2016 6,518Thereafter 31,775
Copyright © 2013 www.secdatabase.com. All Rights Reserved.Please Consider the Environment Before Printing This Document
12 Months EndedShareholders' Equity Dec. 31, 2011Equity [Abstract]Stockholders' Equity SHAREHOLDERS’ EQUITY
On February 20, 2012, our Board of Directors authorized an increase in the payment ofquarterly dividends on our common stock from $0.32 per share to $0.36 per share payablequarterly beginning on April 13, 2012. On February 21, 2011, our Board of Directors authorized anincrease in the payment of quarterly dividends on our common stock from $0.29 per share to $0.32per share payable quarterly beginning on April 14, 2011. On February 22, 2010, our Board ofDirectors authorized an increase in the payment of quarterly dividends on our common stock from$0.27 per share to $0.29 per share payable quarterly beginning on April 7, 2010. Generally, ourdividend date-of-record is in the last month of the quarter, and the dividend is paid the followingmonth.
On February 27, 2008, our Board of Directors announced the approval of a program torepurchase up to $300.0 million of our outstanding common stock, which concluded in the fourthquarter of 2011. On September 12, 2011, our Board of Directors announced the approval of a newprogram to repurchase up to $300.0 million of our outstanding common stock over an unspecifiedtime period. We repurchased $7.3 million and $101.6 million of our common stock under theold and new programs, respectively, in the fourth quarter of 2011. On December 15, 2011, theBoard of Directors announced the approval of the replenishment of the new $300.0 million sharerepurchase program, providing the full $300.0 million in remaining authorized repurchase capacityat December 31, 2011. Our share repurchase program does not have an expiration date, and wereserve the right to limit or terminate the repurchase program at any time without notice.
We repurchased 1,482,833, 450,000 and 544,500 shares for $150.0 million, $46.0 million and$40.9 million during 2011, 2010 and 2009, respectively. To date, we have repurchased a total of4,218,433 shares for $401.9 million under these programs.
Copyright © 2013 www.secdatabase.com. All Rights Reserved.Please Consider the Environment Before Printing This Document

12 Months EndedDebt and Lease Obligations Dec. 31, 2011Debt Disclosure [Abstract]Debt and Lease Obligations DEBT AND LEASE OBLIGATIONS
Debt, including capital lease obligations, consisted of:
December 31,
2011 2010
(Amounts in thousands)
Term Loan, interest rate of 2.58% and 2.30% at December 31, 2011and 2010, respectively $ 475,000 $ 500,000Capital lease obligations and other borrowings 30,216 27,711Debt and capital lease obligations 505,216 527,711Less amounts due within one year 53,623 51,481
Total debt due after one year $ 451,593 $ 476,230
Scheduled maturities of the Credit Facilities (as described below), as well as capital leaseobligations and other borrowings, are:
TermLoan
Other Debt& Capital
Lease Total
(Amounts in thousands)
2012 $ 25,000 $ 28,623 $ 53,6232013 50,000 1,593 51,5932014 50,000 — 50,0002015 350,000 — 350,0002016 and thereafter — — —Total $ 475,000 $ 30,216 $ 505,216
Credit Facilities
On December 14, 2010 we entered into a credit agreement ("Credit Agreement") withBank of America, N.A., as swingline lender, letter of credit issuer and administrative agent, andthe other lenders party thereto (together, the "Lenders"). The Credit Agreement provides for a$500.0 million term loan facility with a maturity date of December 14, 2015 and a $500.0 millionrevolving credit facility with a maturity date of December 14, 2015 (collectively referred to as"Credit Facilities"). The revolving credit facility includes a $300.0 million sublimit for the issuanceof letters of credit. Subject to certain conditions, we have the right to increase the amount of therevolving credit facility by an aggregate amount not to exceed $200.0 million.
At December 31, 2011 we had $9.8 million in deferred loan costs included in other assets,net. These costs are being amortized over the term of the Credit Agreement and are recorded ininterest expense.
At December 31, 2011 and 2010, we had no amounts outstanding under the revolving creditfacility, respectively. We had outstanding letters of credit of $147.4 million and $133.9 millionat December 31, 2011 and 2010, respectively, which reduced our borrowing capacity to $352.6million and $366.1 million, respectively.
Borrowings under our Credit Facilities, other than in respect of swingline loans, bear interestat a rate equal to, at our option, either (1) the London Interbank Offered Rate ("LIBOR") plus1.75% to 2.50%, as applicable, depending on our consolidated leverage ratio, or, (2) the base ratewhich is based on the greater of the prime rate most recently announced by the administrative
Copyright © 2013 www.secdatabase.com. All Rights Reserved.Please Consider the Environment Before Printing This Document
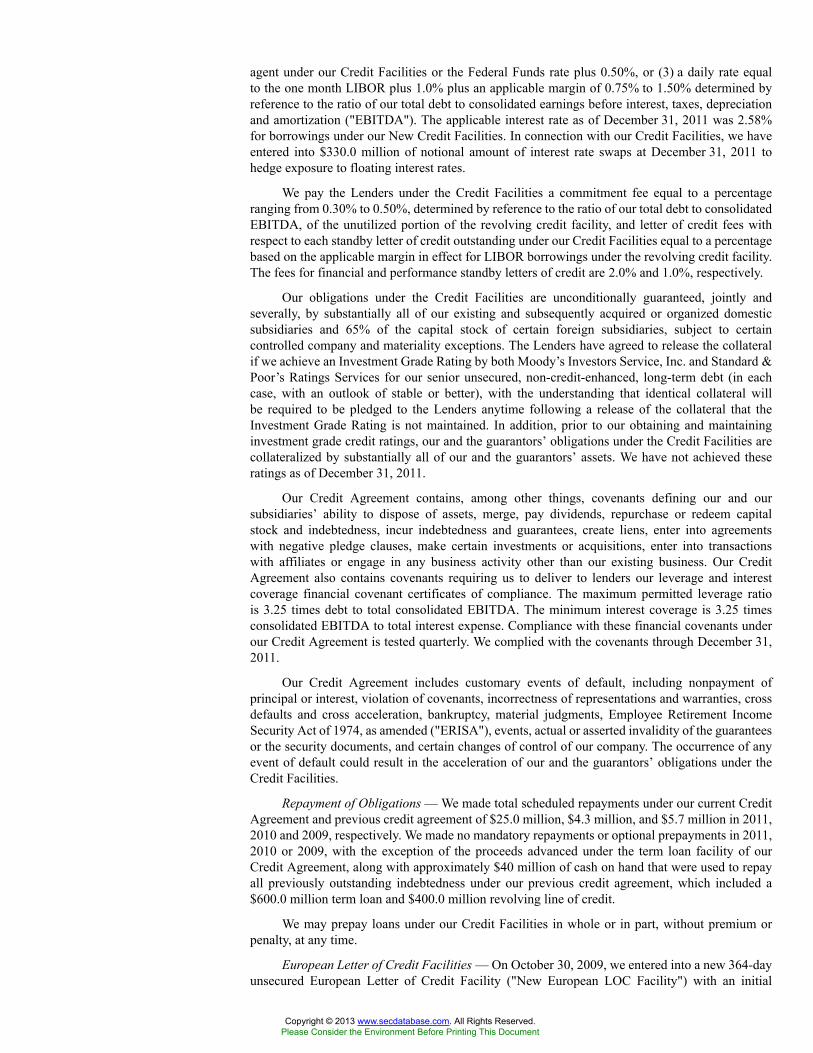
agent under our Credit Facilities or the Federal Funds rate plus 0.50%, or (3) a daily rate equalto the one month LIBOR plus 1.0% plus an applicable margin of 0.75% to 1.50% determined byreference to the ratio of our total debt to consolidated earnings before interest, taxes, depreciationand amortization ("EBITDA"). The applicable interest rate as of December 31, 2011 was 2.58%for borrowings under our New Credit Facilities. In connection with our Credit Facilities, we haveentered into $330.0 million of notional amount of interest rate swaps at December 31, 2011 tohedge exposure to floating interest rates.
We pay the Lenders under the Credit Facilities a commitment fee equal to a percentageranging from 0.30% to 0.50%, determined by reference to the ratio of our total debt to consolidatedEBITDA, of the unutilized portion of the revolving credit facility, and letter of credit fees withrespect to each standby letter of credit outstanding under our Credit Facilities equal to a percentagebased on the applicable margin in effect for LIBOR borrowings under the revolving credit facility.The fees for financial and performance standby letters of credit are 2.0% and 1.0%, respectively.
Our obligations under the Credit Facilities are unconditionally guaranteed, jointly andseverally, by substantially all of our existing and subsequently acquired or organized domesticsubsidiaries and 65% of the capital stock of certain foreign subsidiaries, subject to certaincontrolled company and materiality exceptions. The Lenders have agreed to release the collateralif we achieve an Investment Grade Rating by both Moody’s Investors Service, Inc. and Standard &Poor’s Ratings Services for our senior unsecured, non-credit-enhanced, long-term debt (in eachcase, with an outlook of stable or better), with the understanding that identical collateral willbe required to be pledged to the Lenders anytime following a release of the collateral that theInvestment Grade Rating is not maintained. In addition, prior to our obtaining and maintaininginvestment grade credit ratings, our and the guarantors’ obligations under the Credit Facilities arecollateralized by substantially all of our and the guarantors’ assets. We have not achieved theseratings as of December 31, 2011.
Our Credit Agreement contains, among other things, covenants defining our and oursubsidiaries’ ability to dispose of assets, merge, pay dividends, repurchase or redeem capitalstock and indebtedness, incur indebtedness and guarantees, create liens, enter into agreementswith negative pledge clauses, make certain investments or acquisitions, enter into transactionswith affiliates or engage in any business activity other than our existing business. Our CreditAgreement also contains covenants requiring us to deliver to lenders our leverage and interestcoverage financial covenant certificates of compliance. The maximum permitted leverage ratiois 3.25 times debt to total consolidated EBITDA. The minimum interest coverage is 3.25 timesconsolidated EBITDA to total interest expense. Compliance with these financial covenants underour Credit Agreement is tested quarterly. We complied with the covenants through December 31,2011.
Our Credit Agreement includes customary events of default, including nonpayment ofprincipal or interest, violation of covenants, incorrectness of representations and warranties, crossdefaults and cross acceleration, bankruptcy, material judgments, Employee Retirement IncomeSecurity Act of 1974, as amended ("ERISA"), events, actual or asserted invalidity of the guaranteesor the security documents, and certain changes of control of our company. The occurrence of anyevent of default could result in the acceleration of our and the guarantors’ obligations under theCredit Facilities.
Repayment of Obligations — We made total scheduled repayments under our current CreditAgreement and previous credit agreement of $25.0 million, $4.3 million, and $5.7 million in 2011,2010 and 2009, respectively. We made no mandatory repayments or optional prepayments in 2011,2010 or 2009, with the exception of the proceeds advanced under the term loan facility of ourCredit Agreement, along with approximately $40 million of cash on hand that were used to repayall previously outstanding indebtedness under our previous credit agreement, which included a$600.0 million term loan and $400.0 million revolving line of credit.
We may prepay loans under our Credit Facilities in whole or in part, without premium orpenalty, at any time.
European Letter of Credit Facilities — On October 30, 2009, we entered into a new 364-dayunsecured European Letter of Credit Facility ("New European LOC Facility") with an initial
Copyright © 2013 www.secdatabase.com. All Rights Reserved.Please Consider the Environment Before Printing This Document
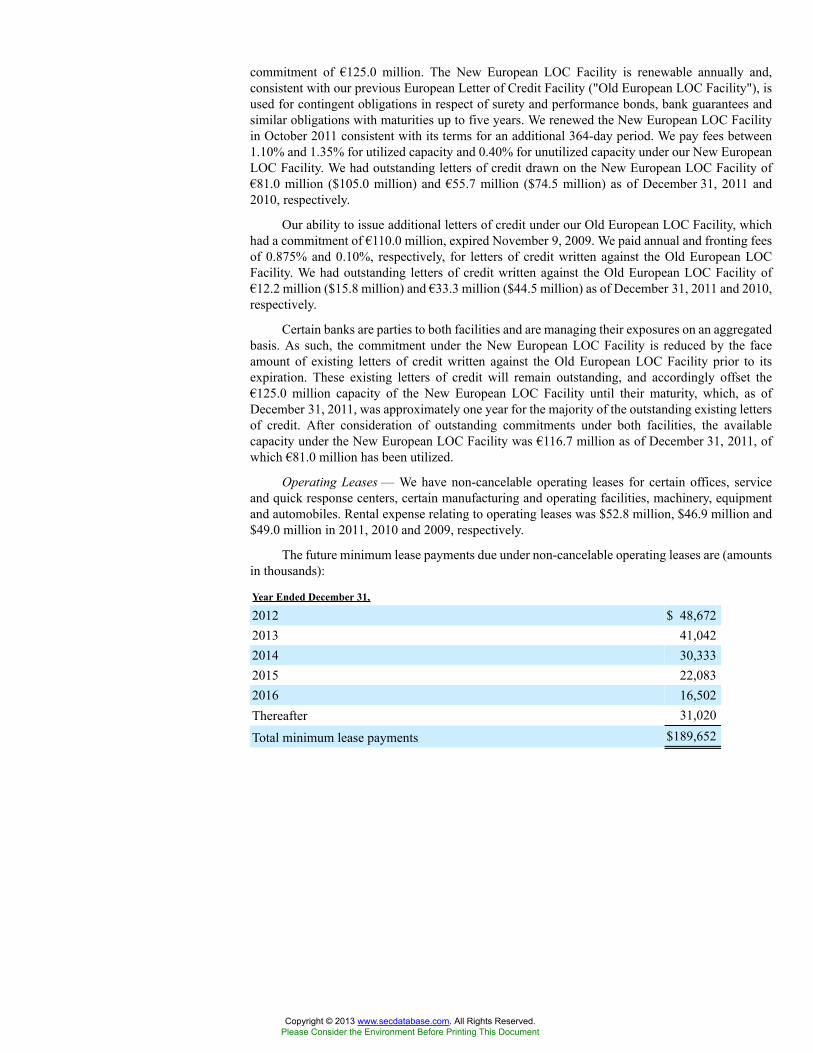
commitment of €125.0 million. The New European LOC Facility is renewable annually and,consistent with our previous European Letter of Credit Facility ("Old European LOC Facility"), isused for contingent obligations in respect of surety and performance bonds, bank guarantees andsimilar obligations with maturities up to five years. We renewed the New European LOC Facilityin October 2011 consistent with its terms for an additional 364-day period. We pay fees between1.10% and 1.35% for utilized capacity and 0.40% for unutilized capacity under our New EuropeanLOC Facility. We had outstanding letters of credit drawn on the New European LOC Facility of€81.0 million ($105.0 million) and €55.7 million ($74.5 million) as of December 31, 2011 and2010, respectively.
Our ability to issue additional letters of credit under our Old European LOC Facility, whichhad a commitment of €110.0 million, expired November 9, 2009. We paid annual and fronting feesof 0.875% and 0.10%, respectively, for letters of credit written against the Old European LOCFacility. We had outstanding letters of credit written against the Old European LOC Facility of€12.2 million ($15.8 million) and €33.3 million ($44.5 million) as of December 31, 2011 and 2010,respectively.
Certain banks are parties to both facilities and are managing their exposures on an aggregatedbasis. As such, the commitment under the New European LOC Facility is reduced by the faceamount of existing letters of credit written against the Old European LOC Facility prior to itsexpiration. These existing letters of credit will remain outstanding, and accordingly offset the€125.0 million capacity of the New European LOC Facility until their maturity, which, as ofDecember 31, 2011, was approximately one year for the majority of the outstanding existing lettersof credit. After consideration of outstanding commitments under both facilities, the availablecapacity under the New European LOC Facility was €116.7 million as of December 31, 2011, ofwhich €81.0 million has been utilized.
Operating Leases — We have non-cancelable operating leases for certain offices, serviceand quick response centers, certain manufacturing and operating facilities, machinery, equipmentand automobiles. Rental expense relating to operating leases was $52.8 million, $46.9 million and$49.0 million in 2011, 2010 and 2009, respectively.
The future minimum lease payments due under non-cancelable operating leases are (amountsin thousands):
Year Ended December 31,
2012 $ 48,6722013 41,0422014 30,3332015 22,0832016 16,502Thereafter 31,020
Total minimum lease payments $189,652
Copyright © 2013 www.secdatabase.com. All Rights Reserved.Please Consider the Environment Before Printing This Document

12 Months EndedSchedule II - Valuation andQualifying Accounts
(Details) (USD $)In Thousands, unlessotherwise specified
Dec. 31,2011
Dec. 31,2010
Dec. 31,2009
Allowance for Doubtful Accounts [Member]Valuation and Qualifying Accounts Disclosure [Line Items]Balance at Beginning of Year $ 18,632 [1] $ 18,769 [1] $ 23,667 [1]
Additions Charged to Cost and Expenses 21,108 [1] 17,045 [1] 18,461 [1]
Additions Charged to Other Accounts - Acquisitions and RelatedAdjustments (57) [1] 505 [1] 50 [1]
Deductions From Reserve (19,332) [1] (17,687) [1] (23,409) [1]
Balance at End of Year 20,351 [1] 18,632 [1] 18,769 [1]
Deferred Tax Asset Valuation Allowance [Member]Valuation and Qualifying Accounts Disclosure [Line Items]Balance at Beginning of Year 14,296 [2] 17,292 [2] 17,208 [2]
Additions Charged to Cost and Expenses 4,124 [2] 1,970 [2] 2,748 [2]
Additions Charged to Other Accounts - Acquisitions and RelatedAdjustments (43) [2] (315) [2] 1,181 [2]
Deductions From Reserve (691) [2] (4,651) [2] (3,845) [2]
Balance at End of Year $ 17,686 [2] $ 14,296 [2] $ 17,292 [2]
[1] Deductions from reserve represent accounts written off, net of recoveries, and reductions due to improvedaging of receivables.
[2] Deductions from reserve result from the expiration or utilization of net operating losses and foreign taxcredits previously reserved.
Copyright © 2013 www.secdatabase.com. All Rights Reserved.Please Consider the Environment Before Printing This Document
12 Months EndedRealignment Programs Dec. 31, 2011Restructuring and RelatedActivities [Abstract]Realignment Programs REALIGNMENT PROGRAMS
Beginning in 2009, we initiated realignment programs to reduce and optimize certain non-strategic manufacturing facilities and our overall cost structure by improving our operatingefficiency, reducing redundancies, maximizing global consistency and driving improved financialperformance, as well as expanding our efforts to optimize assets, respond to reduced ordersand drive an enhanced customer-facing organization ("Realignment Programs"). These programsare substantially complete as we currently expect total Realignment Program charges will beapproximately $93 million for approved plans, of which $91.2 million has been incurred throughDecember 31, 2011.
The Realignment Programs consist of both restructuring and non-restructuring charges.Restructuring charges represent costs associated with the relocation of certain business activities,outsourcing of some business activities and facility closures. Non-restructuring charges are costsincurred to improve operating efficiency and reduce redundancies and primarily representemployee severance. Expenses are reported in COS or SG&A, as applicable, in our consolidatedstatements of income.
Charges, net of adjustments, related to our Realignment Programs were $4.8 million, $18.3million and $68.1 million for year ended December 31, 2011, 2010 and 2009, respectively.
Generally, the aforementioned charges were or will be paid in cash, except for asset write-downs, which are non-cash charges. Asset write-down charges of $3.0 million, $6.4 million and$6.1 million were recorded during 2011, 2010 and 2009, respectively. The majority of remainingcash payments related to our Realignment Programs will be incurred by the end of 2012.
The restructuring reserve related to the Realignment Program was $1.0 million and $7.1million at December 31, 2011 and 2010, respectively. Other than cash payments, there was nosignificant activity related to the restructuring reserve during 2011.
In addition, in connection with our previously announced IPD recovery plan, in the secondquarter of 2011 we initiated new activities to optimize structural parts of IPD's business. We expectcharges related to this program to be non-restructuring in nature and will approximate $9 million,of which $7.2 million was incurred in 2011 with the substantial majority recorded in COS.
Copyright © 2013 www.secdatabase.com. All Rights Reserved.Please Consider the Environment Before Printing This Document
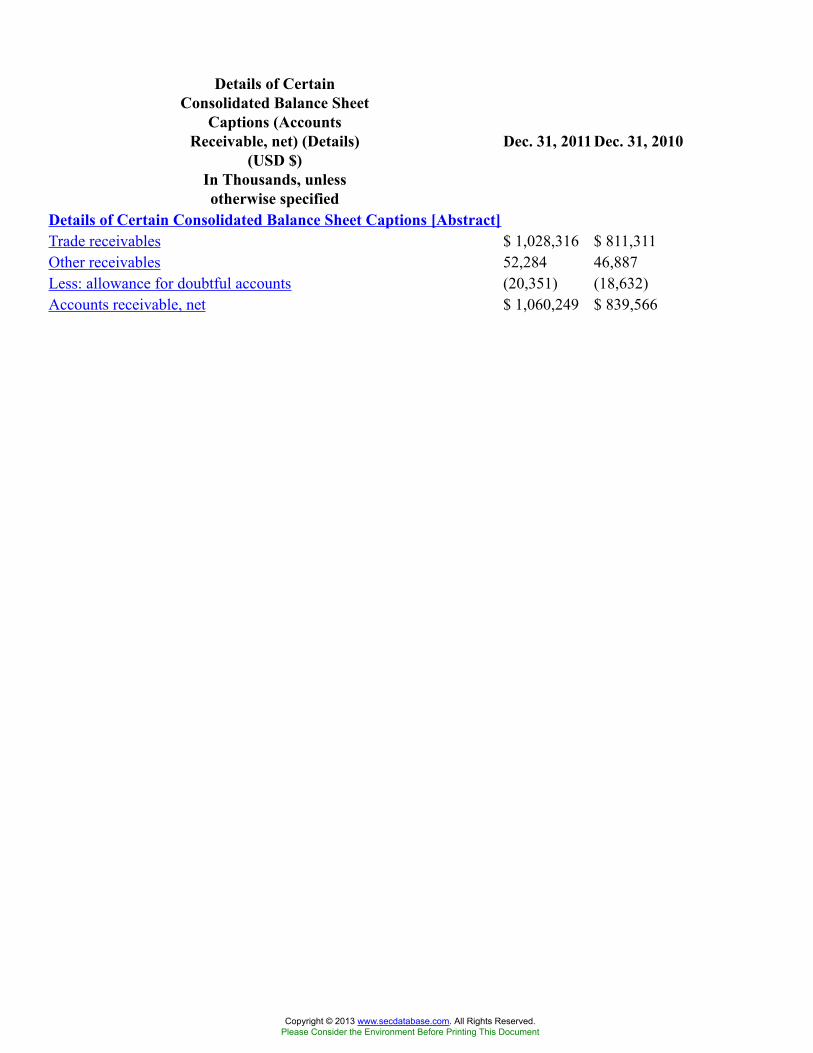
Details of CertainConsolidated Balance Sheet
Captions (AccountsReceivable, net) (Details)
(USD $)In Thousands, unlessotherwise specified
Dec. 31, 2011Dec. 31, 2010
Details of Certain Consolidated Balance Sheet Captions [Abstract]Trade receivables $ 1,028,316 $ 811,311Other receivables 52,284 46,887Less: allowance for doubtful accounts (20,351) (18,632)Accounts receivable, net $ 1,060,249 $ 839,566
Copyright © 2013 www.secdatabase.com. All Rights Reserved.Please Consider the Environment Before Printing This Document
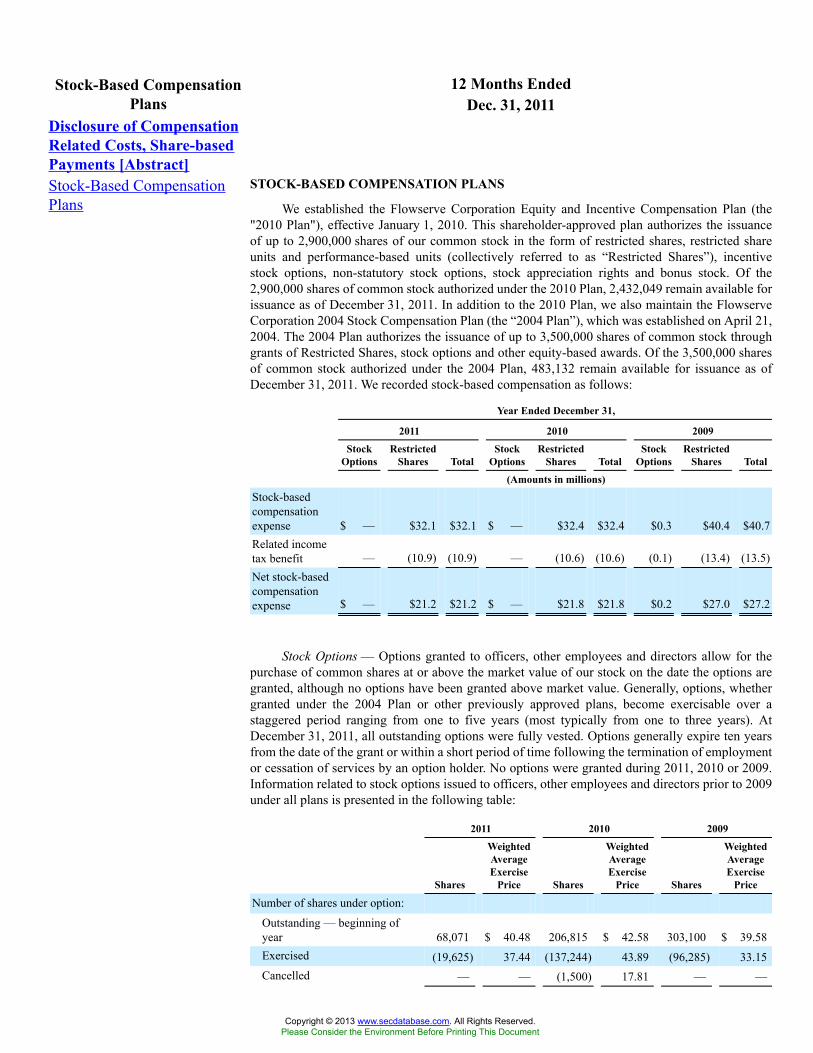
12 Months EndedStock-Based CompensationPlans Dec. 31, 2011
Disclosure of CompensationRelated Costs, Share-basedPayments [Abstract]Stock-Based CompensationPlans
STOCK-BASED COMPENSATION PLANS
We established the Flowserve Corporation Equity and Incentive Compensation Plan (the"2010 Plan"), effective January 1, 2010. This shareholder-approved plan authorizes the issuanceof up to 2,900,000 shares of our common stock in the form of restricted shares, restricted shareunits and performance-based units (collectively referred to as “Restricted Shares”), incentivestock options, non-statutory stock options, stock appreciation rights and bonus stock. Of the2,900,000 shares of common stock authorized under the 2010 Plan, 2,432,049 remain available forissuance as of December 31, 2011. In addition to the 2010 Plan, we also maintain the FlowserveCorporation 2004 Stock Compensation Plan (the “2004 Plan”), which was established on April 21,2004. The 2004 Plan authorizes the issuance of up to 3,500,000 shares of common stock throughgrants of Restricted Shares, stock options and other equity-based awards. Of the 3,500,000 sharesof common stock authorized under the 2004 Plan, 483,132 remain available for issuance as ofDecember 31, 2011. We recorded stock-based compensation as follows:
Year Ended December 31,
2011 2010 2009
StockOptions
RestrictedShares Total
StockOptions
RestrictedShares Total
StockOptions
RestrictedShares Total
(Amounts in millions)
Stock-basedcompensationexpense $ — $32.1 $32.1 $ — $32.4 $32.4 $0.3 $40.4 $40.7Related incometax benefit — (10.9) (10.9) — (10.6) (10.6) (0.1) (13.4) (13.5)Net stock-basedcompensationexpense $ — $21.2 $21.2 $ — $21.8 $21.8 $0.2 $27.0 $27.2
Stock Options — Options granted to officers, other employees and directors allow for thepurchase of common shares at or above the market value of our stock on the date the options aregranted, although no options have been granted above market value. Generally, options, whethergranted under the 2004 Plan or other previously approved plans, become exercisable over astaggered period ranging from one to five years (most typically from one to three years). AtDecember 31, 2011, all outstanding options were fully vested. Options generally expire ten yearsfrom the date of the grant or within a short period of time following the termination of employmentor cessation of services by an option holder. No options were granted during 2011, 2010 or 2009.Information related to stock options issued to officers, other employees and directors prior to 2009under all plans is presented in the following table:
2011 2010 2009
Shares
WeightedAverageExercise
Price Shares
WeightedAverageExercise
Price Shares
WeightedAverageExercise
Price
Number of shares under option:
Outstanding — beginning ofyear 68,071 $ 40.48 206,815 $ 42.58 303,100 $ 39.58Exercised (19,625) 37.44 (137,244) 43.89 (96,285) 33.15Cancelled — — (1,500) 17.81 — —
Copyright © 2013 www.secdatabase.com. All Rights Reserved.Please Consider the Environment Before Printing This Document
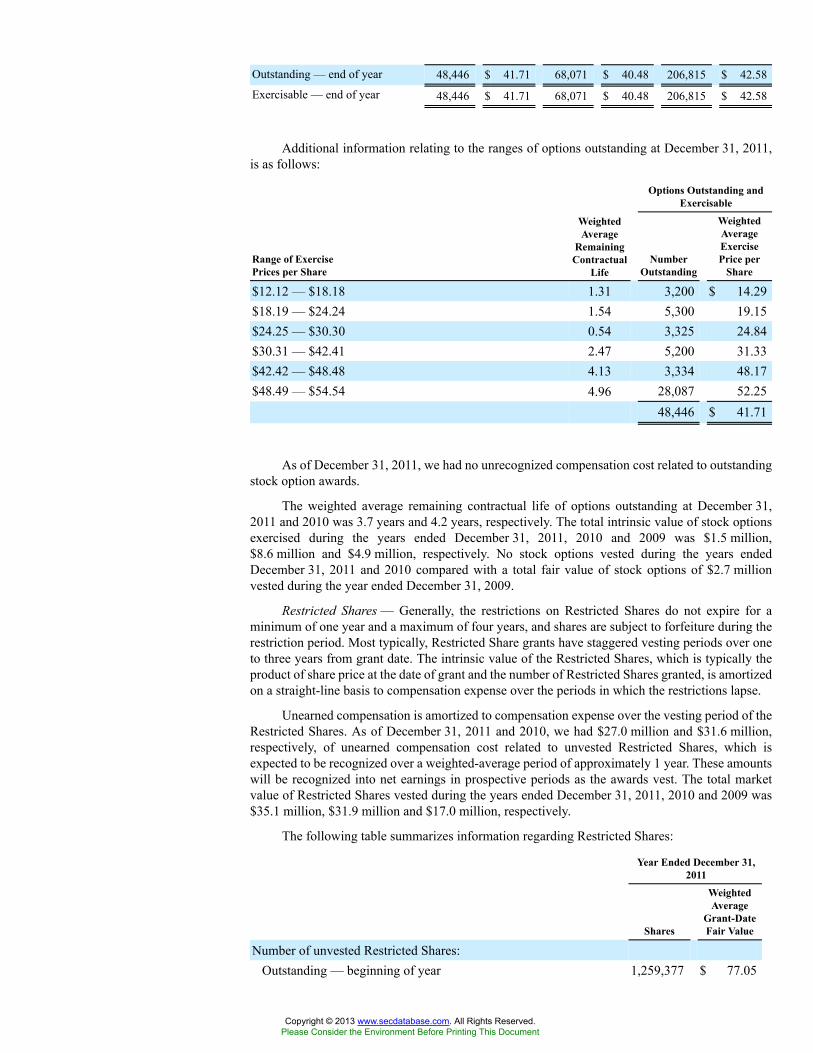
Outstanding — end of year 48,446 $ 41.71 68,071 $ 40.48 206,815 $ 42.58
Exercisable — end of year 48,446 $ 41.71 68,071 $ 40.48 206,815 $ 42.58
Additional information relating to the ranges of options outstanding at December 31, 2011,is as follows:
Options Outstanding andExercisable
Range of ExercisePrices per Share
WeightedAverage
RemainingContractual
LifeNumber
Outstanding
WeightedAverageExercisePrice per
Share
$12.12 — $18.18 1.31 3,200 $ 14.29$18.19 — $24.24 1.54 5,300 19.15$24.25 — $30.30 0.54 3,325 24.84$30.31 — $42.41 2.47 5,200 31.33$42.42 — $48.48 4.13 3,334 48.17$48.49 — $54.54 4.96 28,087 52.25
48,446 $ 41.71
As of December 31, 2011, we had no unrecognized compensation cost related to outstandingstock option awards.
The weighted average remaining contractual life of options outstanding at December 31,2011 and 2010 was 3.7 years and 4.2 years, respectively. The total intrinsic value of stock optionsexercised during the years ended December 31, 2011, 2010 and 2009 was $1.5 million,$8.6 million and $4.9 million, respectively. No stock options vested during the years endedDecember 31, 2011 and 2010 compared with a total fair value of stock options of $2.7 millionvested during the year ended December 31, 2009.
Restricted Shares — Generally, the restrictions on Restricted Shares do not expire for aminimum of one year and a maximum of four years, and shares are subject to forfeiture during therestriction period. Most typically, Restricted Share grants have staggered vesting periods over oneto three years from grant date. The intrinsic value of the Restricted Shares, which is typically theproduct of share price at the date of grant and the number of Restricted Shares granted, is amortizedon a straight-line basis to compensation expense over the periods in which the restrictions lapse.
Unearned compensation is amortized to compensation expense over the vesting period of theRestricted Shares. As of December 31, 2011 and 2010, we had $27.0 million and $31.6 million,respectively, of unearned compensation cost related to unvested Restricted Shares, which isexpected to be recognized over a weighted-average period of approximately 1 year. These amountswill be recognized into net earnings in prospective periods as the awards vest. The total marketvalue of Restricted Shares vested during the years ended December 31, 2011, 2010 and 2009 was$35.1 million, $31.9 million and $17.0 million, respectively.
The following table summarizes information regarding Restricted Shares:
Year Ended December 31,2011
Shares
WeightedAverage
Grant-DateFair Value
Number of unvested Restricted Shares:Outstanding — beginning of year 1,259,377 $ 77.05
Copyright © 2013 www.secdatabase.com. All Rights Reserved.Please Consider the Environment Before Printing This Document

Granted 245,127 130.15Vested (395,434) 88.72Cancelled (56,871) 84.72
Outstanding — ending of year 1,052,199 $ 84.62
Unvested Restricted Shares outstanding as of December 31, 2011, includes 415,000 unitswith performance-based vesting provisions. Performance-based units are issuable in commonstock and vest upon the achievement of pre-defined performance targets, primarily based onour average annual return on net assets over a three-year period as compared with the samemeasure for a defined peer group for the same period. Most units were granted in three annualgrants since January 1, 2009 and have a vesting percentage between 0% and 200% depending onthe achievement of the specific performance targets. Compensation expense is recognized overa 36-month cliff vesting period based on the fair market value of our common stock on thedate of grant, as adjusted for anticipated forfeitures. During the performance period, earned andunearned compensation expense is adjusted based on changes in the expected achievement of theperformance targets. Vesting provisions range from 0 to 817,000 shares based on performancetargets. As of December 31, 2011, we estimate vesting of 744,000 shares based on expectedachievement of performance targets.
Copyright © 2013 www.secdatabase.com. All Rights Reserved.Please Consider the Environment Before Printing This Document
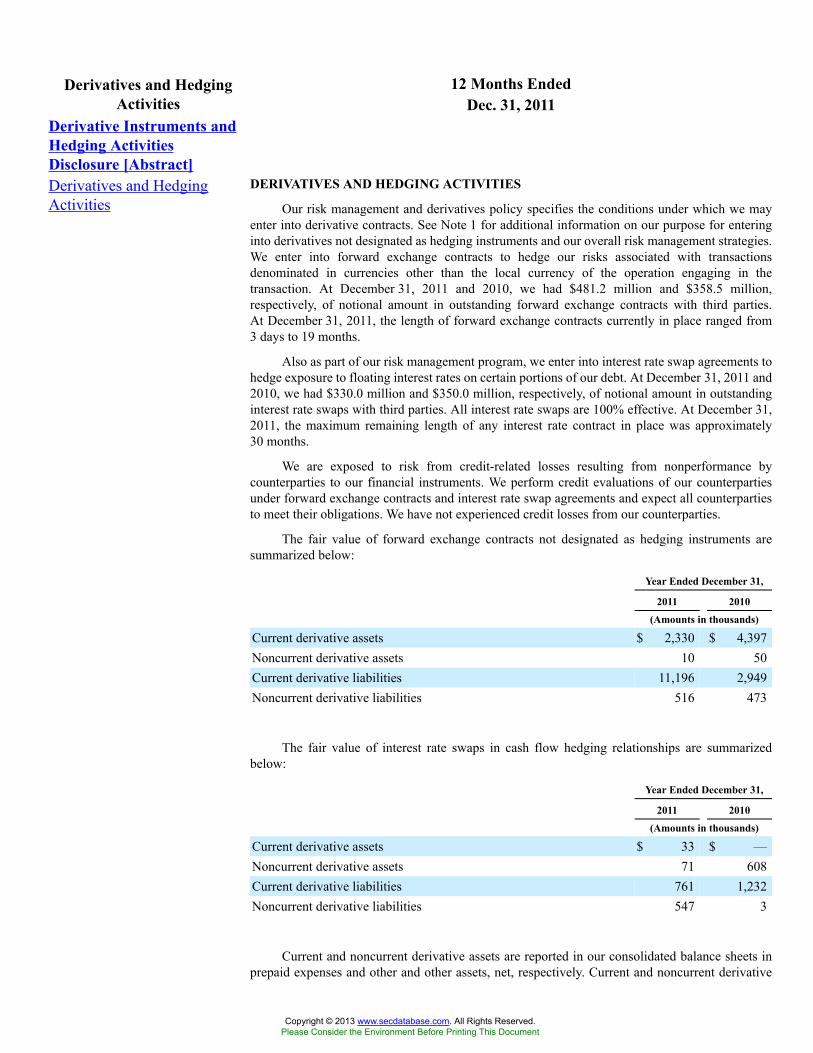
12 Months EndedDerivatives and HedgingActivities Dec. 31, 2011
Derivative Instruments andHedging ActivitiesDisclosure [Abstract]Derivatives and HedgingActivities
DERIVATIVES AND HEDGING ACTIVITIES
Our risk management and derivatives policy specifies the conditions under which we mayenter into derivative contracts. See Note 1 for additional information on our purpose for enteringinto derivatives not designated as hedging instruments and our overall risk management strategies.We enter into forward exchange contracts to hedge our risks associated with transactionsdenominated in currencies other than the local currency of the operation engaging in thetransaction. At December 31, 2011 and 2010, we had $481.2 million and $358.5 million,respectively, of notional amount in outstanding forward exchange contracts with third parties.At December 31, 2011, the length of forward exchange contracts currently in place ranged from3 days to 19 months.
Also as part of our risk management program, we enter into interest rate swap agreements tohedge exposure to floating interest rates on certain portions of our debt. At December 31, 2011 and2010, we had $330.0 million and $350.0 million, respectively, of notional amount in outstandinginterest rate swaps with third parties. All interest rate swaps are 100% effective. At December 31,2011, the maximum remaining length of any interest rate contract in place was approximately30 months.
We are exposed to risk from credit-related losses resulting from nonperformance bycounterparties to our financial instruments. We perform credit evaluations of our counterpartiesunder forward exchange contracts and interest rate swap agreements and expect all counterpartiesto meet their obligations. We have not experienced credit losses from our counterparties.
The fair value of forward exchange contracts not designated as hedging instruments aresummarized below:
Year Ended December 31,
2011 2010
(Amounts in thousands)
Current derivative assets $ 2,330 $ 4,397Noncurrent derivative assets 10 50Current derivative liabilities 11,196 2,949Noncurrent derivative liabilities 516 473
The fair value of interest rate swaps in cash flow hedging relationships are summarizedbelow:
Year Ended December 31,
2011 2010
(Amounts in thousands)
Current derivative assets $ 33 $ —Noncurrent derivative assets 71 608Current derivative liabilities 761 1,232Noncurrent derivative liabilities 547 3
Current and noncurrent derivative assets are reported in our consolidated balance sheets inprepaid expenses and other and other assets, net, respectively. Current and noncurrent derivative
Copyright © 2013 www.secdatabase.com. All Rights Reserved.Please Consider the Environment Before Printing This Document
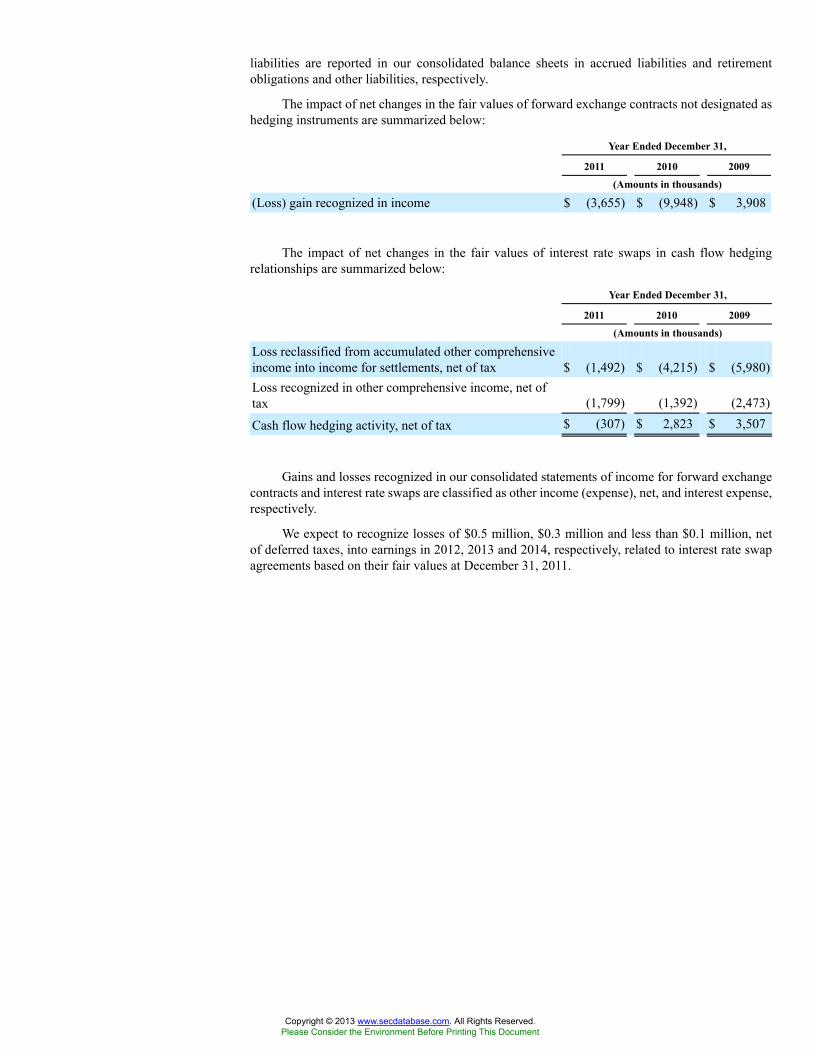
liabilities are reported in our consolidated balance sheets in accrued liabilities and retirementobligations and other liabilities, respectively.
The impact of net changes in the fair values of forward exchange contracts not designated ashedging instruments are summarized below:
Year Ended December 31,
2011 2010 2009
(Amounts in thousands)
(Loss) gain recognized in income $ (3,655) $ (9,948) $ 3,908
The impact of net changes in the fair values of interest rate swaps in cash flow hedgingrelationships are summarized below:
Year Ended December 31,
2011 2010 2009
(Amounts in thousands)
Loss reclassified from accumulated other comprehensiveincome into income for settlements, net of tax $ (1,492) $ (4,215) $ (5,980)Loss recognized in other comprehensive income, net oftax (1,799) (1,392) (2,473)
Cash flow hedging activity, net of tax $ (307) $ 2,823 $ 3,507
Gains and losses recognized in our consolidated statements of income for forward exchangecontracts and interest rate swaps are classified as other income (expense), net, and interest expense,respectively.
We expect to recognize losses of $0.5 million, $0.3 million and less than $0.1 million, netof deferred taxes, into earnings in 2012, 2013 and 2014, respectively, related to interest rate swapagreements based on their fair values at December 31, 2011.
Copyright © 2013 www.secdatabase.com. All Rights Reserved.Please Consider the Environment Before Printing This Document
12 Months EndedFair Value of FinancialInstruments Dec. 31, 2011
Fair Value Disclosures[Abstract]Fair Value of FinancialInstruments
FAIR VALUE OF FINANCIAL INSTRUMENTS
Our financial instruments are presented at fair value in our consolidated balance sheets. Fairvalue is defined as the price that would be received to sell an asset or paid to transfer a liabilityin an orderly transaction between market participants at the measurement date. Where available,fair value is based on observable market prices or parameters or derived from such prices orparameters. Where observable prices or inputs are not available, valuation models may be applied.Assets and liabilities recorded at fair value in our consolidated balance sheets are categorizedbased upon the level of judgment associated with the inputs used to measure their fair values.Hierarchical levels are directly related to the amount of subjectivity associated with the inputsto fair valuation of these assets and liabilities. Recurring fair value measurements are limited toinvestments in derivative instruments and some equity securities. The fair value measurements ofour derivative instruments are determined using models that maximize the use of the observablemarket inputs including interest rate curves and both forward and spot prices for currencies, andare classified as Level II under the fair value hierarchy. The fair values of our derivatives areincluded above in Note 6. The fair value measurements of our investments in equity securities aredetermined using quoted market prices. The fair values of our investments in equity securities, andchanges thereto, are immaterial to our consolidated financial position and results of operations.
Copyright © 2013 www.secdatabase.com. All Rights Reserved.Please Consider the Environment Before Printing This Document
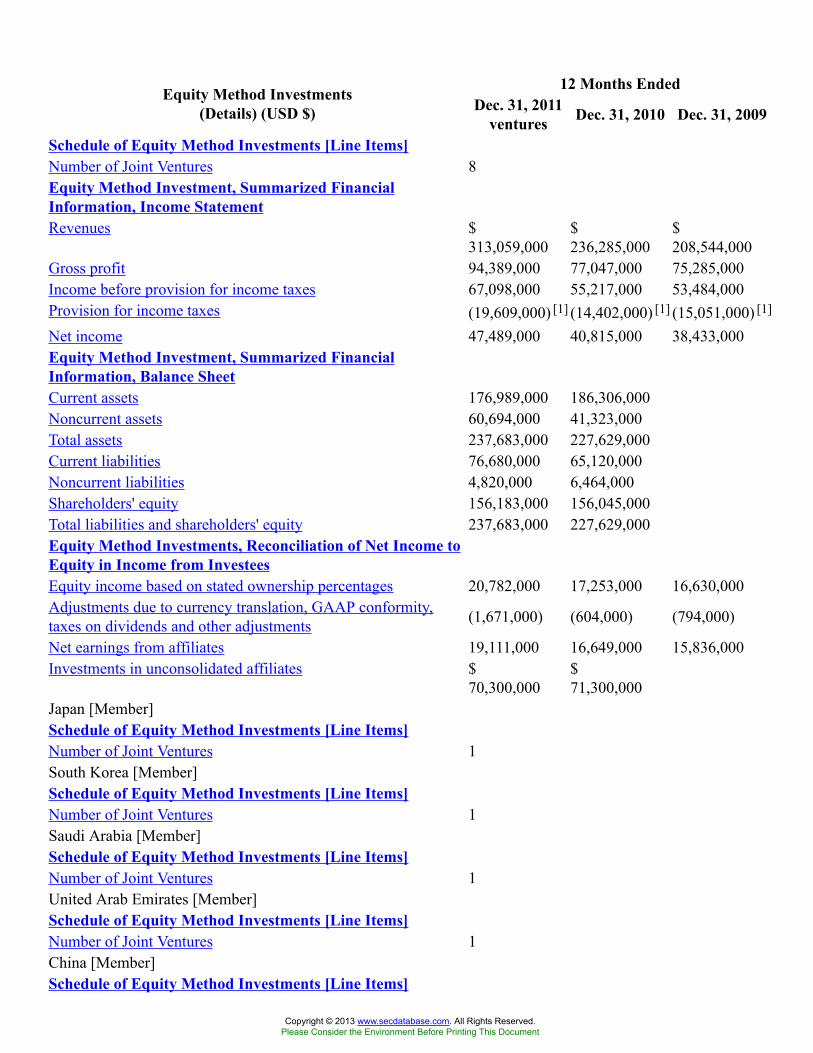
12 Months EndedEquity Method Investments(Details) (USD $) Dec. 31, 2011
ventures Dec. 31, 2010 Dec. 31, 2009
Schedule of Equity Method Investments [Line Items]Number of Joint Ventures 8Equity Method Investment, Summarized FinancialInformation, Income StatementRevenues $
313,059,000$236,285,000
$208,544,000
Gross profit 94,389,000 77,047,000 75,285,000Income before provision for income taxes 67,098,000 55,217,000 53,484,000Provision for income taxes (19,609,000) [1] (14,402,000) [1] (15,051,000) [1]
Net income 47,489,000 40,815,000 38,433,000Equity Method Investment, Summarized FinancialInformation, Balance SheetCurrent assets 176,989,000 186,306,000Noncurrent assets 60,694,000 41,323,000Total assets 237,683,000 227,629,000Current liabilities 76,680,000 65,120,000Noncurrent liabilities 4,820,000 6,464,000Shareholders' equity 156,183,000 156,045,000Total liabilities and shareholders' equity 237,683,000 227,629,000Equity Method Investments, Reconciliation of Net Income toEquity in Income from InvesteesEquity income based on stated ownership percentages 20,782,000 17,253,000 16,630,000Adjustments due to currency translation, GAAP conformity,taxes on dividends and other adjustments (1,671,000) (604,000) (794,000)
Net earnings from affiliates 19,111,000 16,649,000 15,836,000Investments in unconsolidated affiliates $
70,300,000$71,300,000
Japan [Member]Schedule of Equity Method Investments [Line Items]Number of Joint Ventures 1South Korea [Member]Schedule of Equity Method Investments [Line Items]Number of Joint Ventures 1Saudi Arabia [Member]Schedule of Equity Method Investments [Line Items]Number of Joint Ventures 1United Arab Emirates [Member]Schedule of Equity Method Investments [Line Items]Number of Joint Ventures 1China [Member]Schedule of Equity Method Investments [Line Items]
Copyright © 2013 www.secdatabase.com. All Rights Reserved.Please Consider the Environment Before Printing This Document
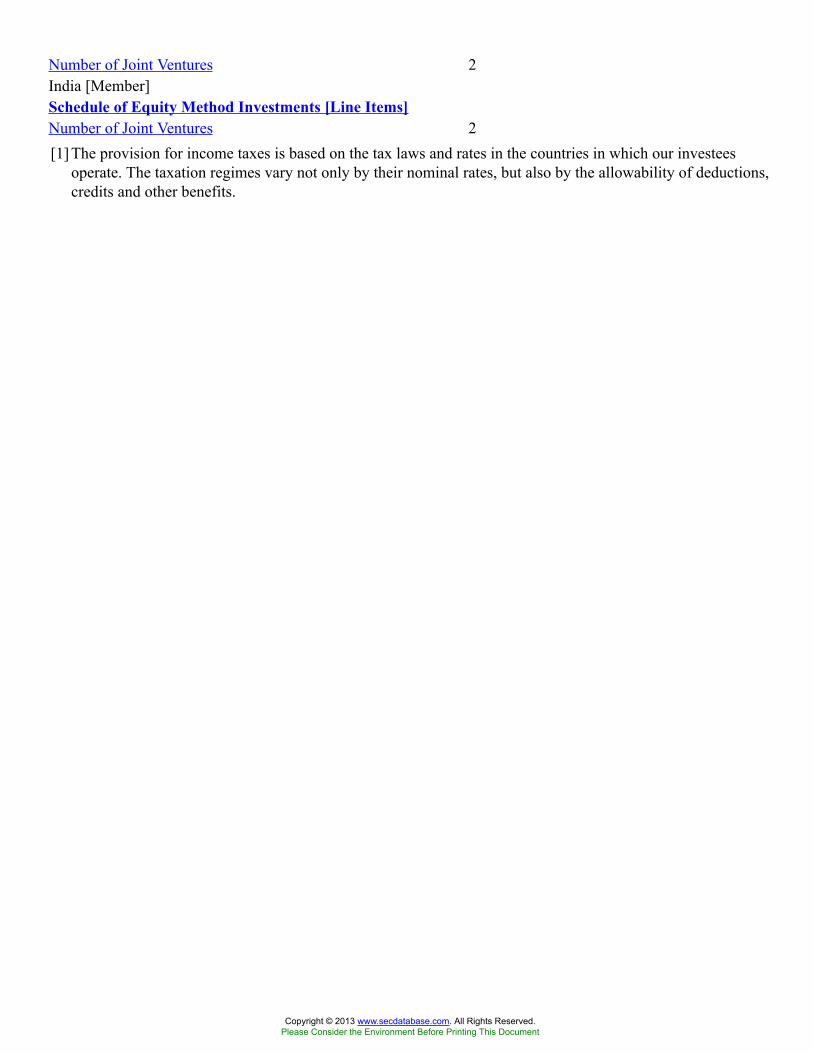
Number of Joint Ventures 2India [Member]Schedule of Equity Method Investments [Line Items]Number of Joint Ventures 2[1] The provision for income taxes is based on the tax laws and rates in the countries in which our investees
operate. The taxation regimes vary not only by their nominal rates, but also by the allowability of deductions,credits and other benefits.
Copyright © 2013 www.secdatabase.com. All Rights Reserved.Please Consider the Environment Before Printing This Document
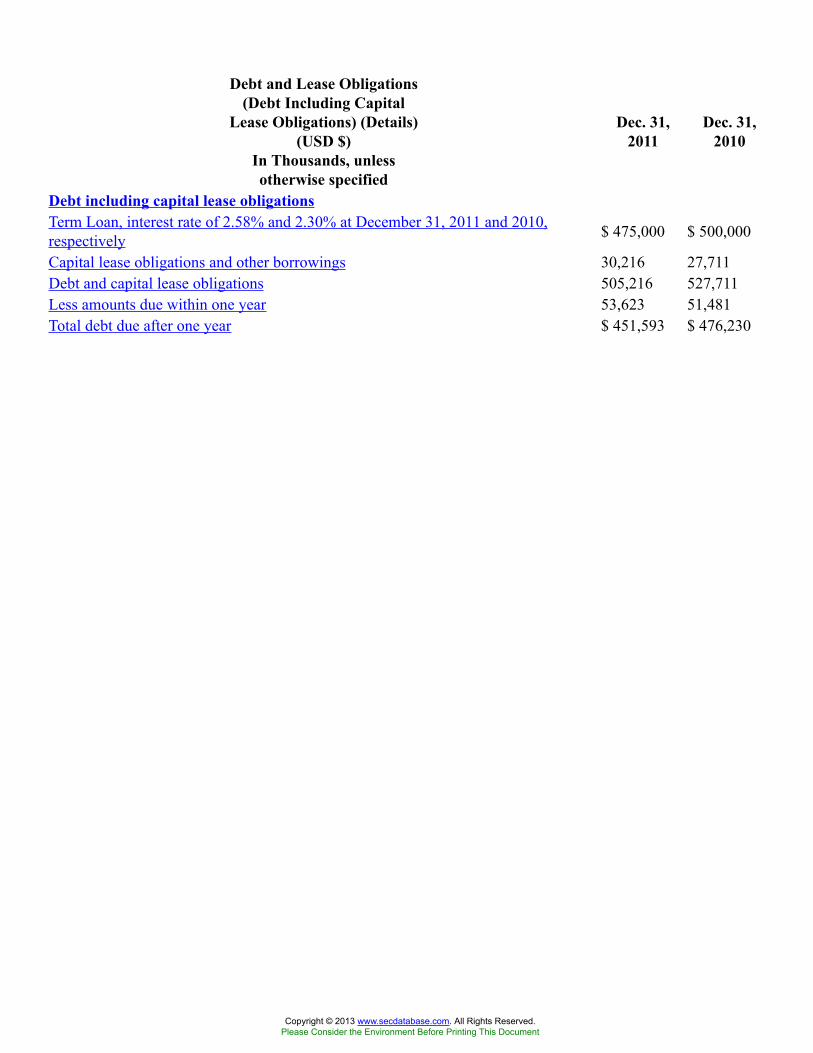
Debt and Lease Obligations(Debt Including Capital
Lease Obligations) (Details)(USD $)
In Thousands, unlessotherwise specified
Dec. 31,2011
Dec. 31,2010
Debt including capital lease obligationsTerm Loan, interest rate of 2.58% and 2.30% at December 31, 2011 and 2010,respectively $ 475,000 $ 500,000
Capital lease obligations and other borrowings 30,216 27,711Debt and capital lease obligations 505,216 527,711Less amounts due within one year 53,623 51,481Total debt due after one year $ 451,593 $ 476,230
Copyright © 2013 www.secdatabase.com. All Rights Reserved.Please Consider the Environment Before Printing This Document
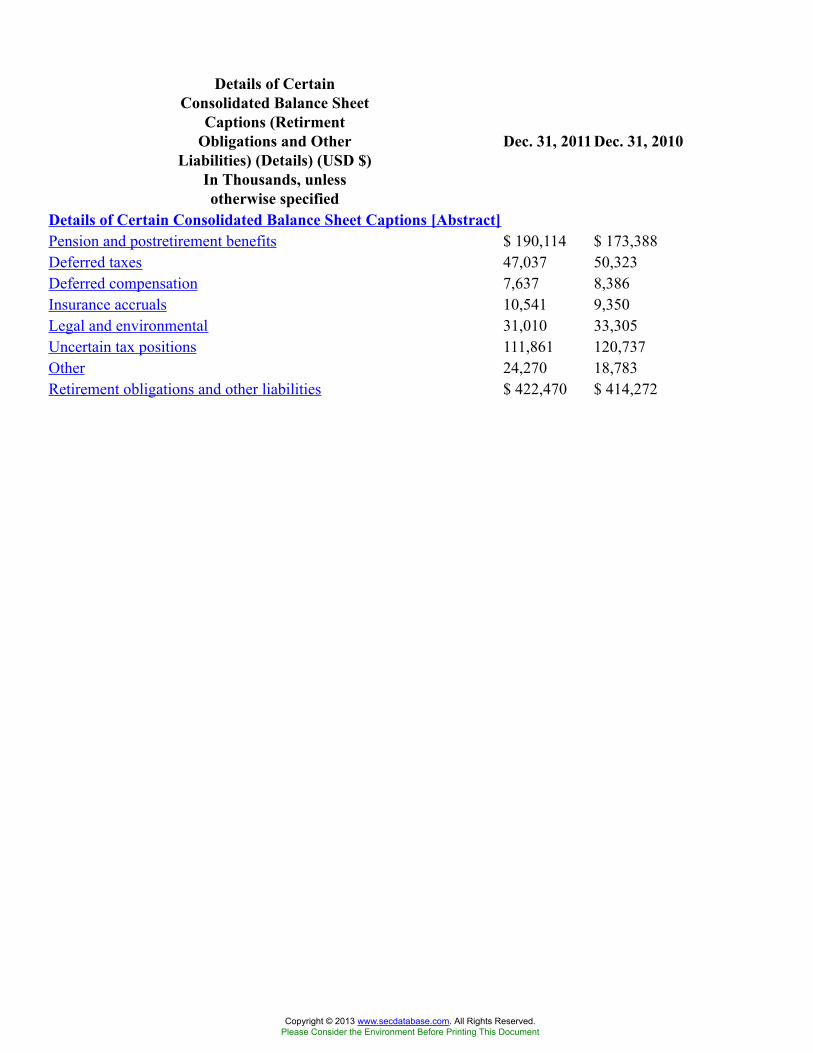
Details of CertainConsolidated Balance Sheet
Captions (RetirmentObligations and Other
Liabilities) (Details) (USD $)In Thousands, unlessotherwise specified
Dec. 31, 2011Dec. 31, 2010
Details of Certain Consolidated Balance Sheet Captions [Abstract]Pension and postretirement benefits $ 190,114 $ 173,388Deferred taxes 47,037 50,323Deferred compensation 7,637 8,386Insurance accruals 10,541 9,350Legal and environmental 31,010 33,305Uncertain tax positions 111,861 120,737Other 24,270 18,783Retirement obligations and other liabilities $ 422,470 $ 414,272
Copyright © 2013 www.secdatabase.com. All Rights Reserved.Please Consider the Environment Before Printing This Document
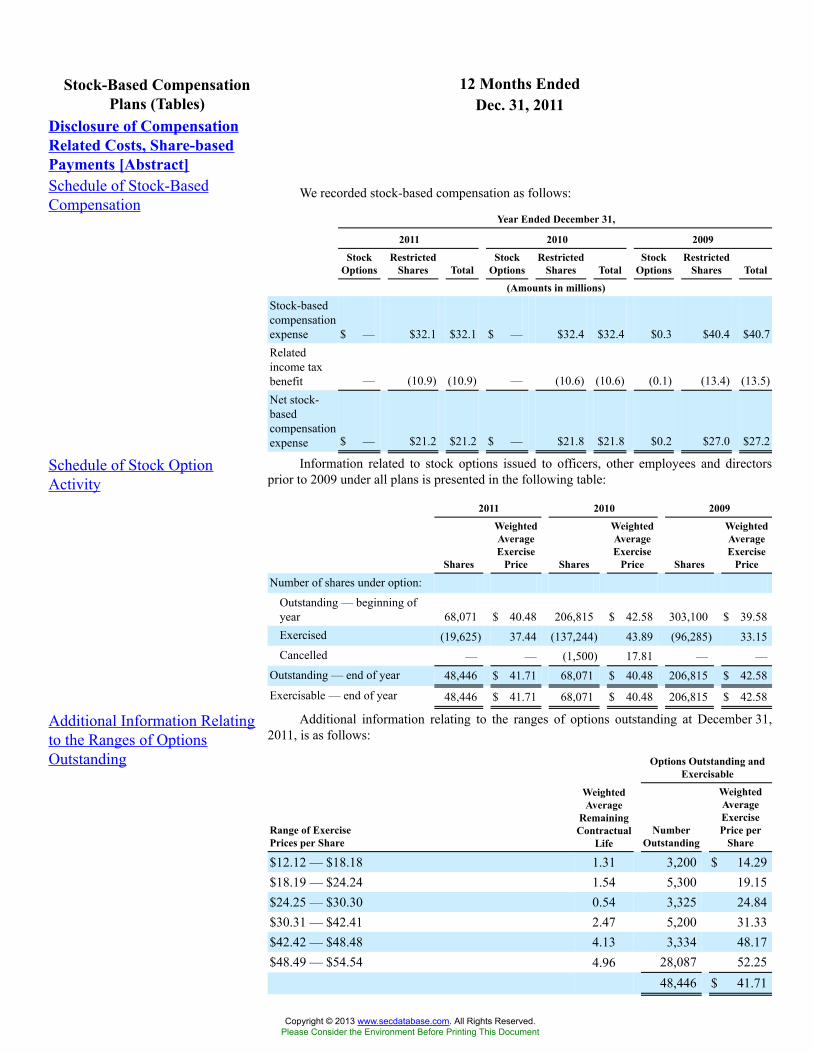
12 Months EndedStock-Based CompensationPlans (Tables) Dec. 31, 2011
Disclosure of CompensationRelated Costs, Share-basedPayments [Abstract]Schedule of Stock-BasedCompensation
We recorded stock-based compensation as follows:
Year Ended December 31,
2011 2010 2009
StockOptions
RestrictedShares Total
StockOptions
RestrictedShares Total
StockOptions
RestrictedShares Total
(Amounts in millions)
Stock-basedcompensationexpense $ — $32.1 $32.1 $ — $32.4 $32.4 $0.3 $40.4 $40.7Relatedincome taxbenefit — (10.9) (10.9) — (10.6) (10.6) (0.1) (13.4) (13.5)Net stock-basedcompensationexpense $ — $21.2 $21.2 $ — $21.8 $21.8 $0.2 $27.0 $27.2
Schedule of Stock OptionActivity
Information related to stock options issued to officers, other employees and directorsprior to 2009 under all plans is presented in the following table:
2011 2010 2009
Shares
WeightedAverageExercise
Price Shares
WeightedAverageExercise
Price Shares
WeightedAverageExercise
Price
Number of shares under option:
Outstanding — beginning ofyear 68,071 $ 40.48 206,815 $ 42.58 303,100 $ 39.58Exercised (19,625) 37.44 (137,244) 43.89 (96,285) 33.15Cancelled — — (1,500) 17.81 — —
Outstanding — end of year 48,446 $ 41.71 68,071 $ 40.48 206,815 $ 42.58
Exercisable — end of year 48,446 $ 41.71 68,071 $ 40.48 206,815 $ 42.58
Additional Information Relatingto the Ranges of OptionsOutstanding
Additional information relating to the ranges of options outstanding at December 31,2011, is as follows:
Options Outstanding andExercisable
Range of ExercisePrices per Share
WeightedAverage
RemainingContractual
LifeNumber
Outstanding
WeightedAverageExercisePrice per
Share
$12.12 — $18.18 1.31 3,200 $ 14.29$18.19 — $24.24 1.54 5,300 19.15$24.25 — $30.30 0.54 3,325 24.84$30.31 — $42.41 2.47 5,200 31.33$42.42 — $48.48 4.13 3,334 48.17$48.49 — $54.54 4.96 28,087 52.25
48,446 $ 41.71
Copyright © 2013 www.secdatabase.com. All Rights Reserved.Please Consider the Environment Before Printing This Document
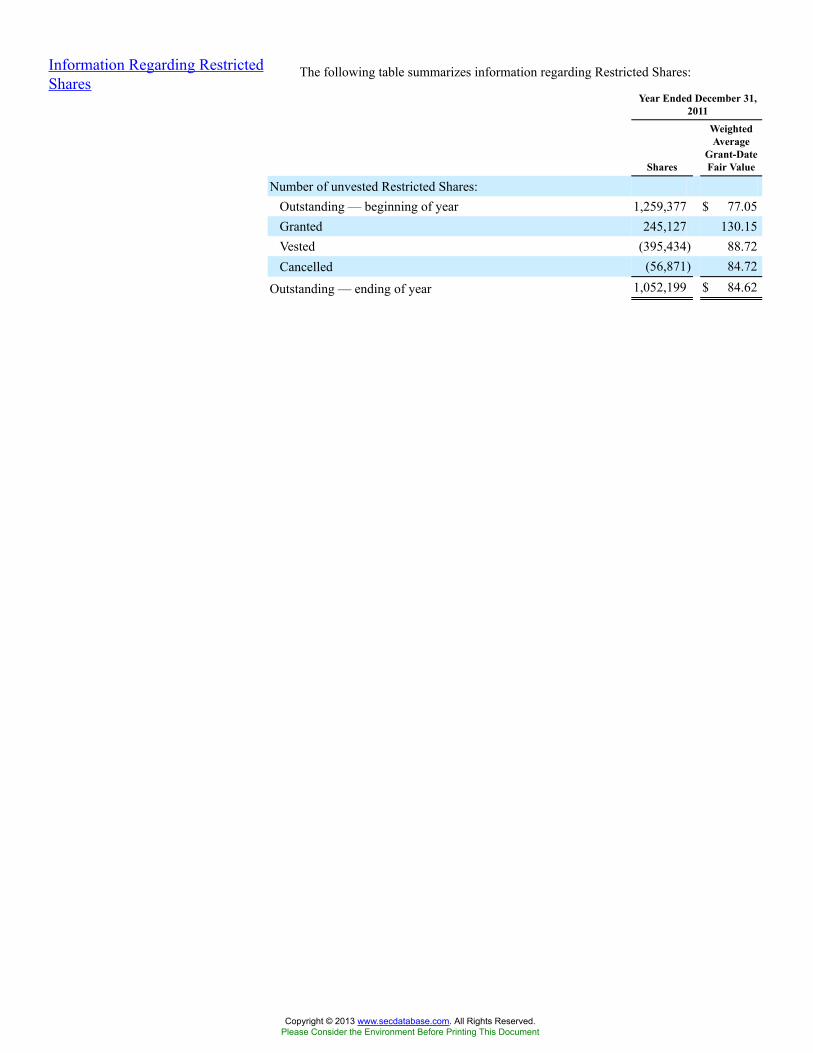
Information Regarding RestrictedShares
The following table summarizes information regarding Restricted Shares:
Year Ended December 31,2011
Shares
WeightedAverage
Grant-DateFair Value
Number of unvested Restricted Shares:Outstanding — beginning of year 1,259,377 $ 77.05Granted 245,127 130.15Vested (395,434) 88.72Cancelled (56,871) 84.72
Outstanding — ending of year 1,052,199 $ 84.62
Copyright © 2013 www.secdatabase.com. All Rights Reserved.Please Consider the Environment Before Printing This Document
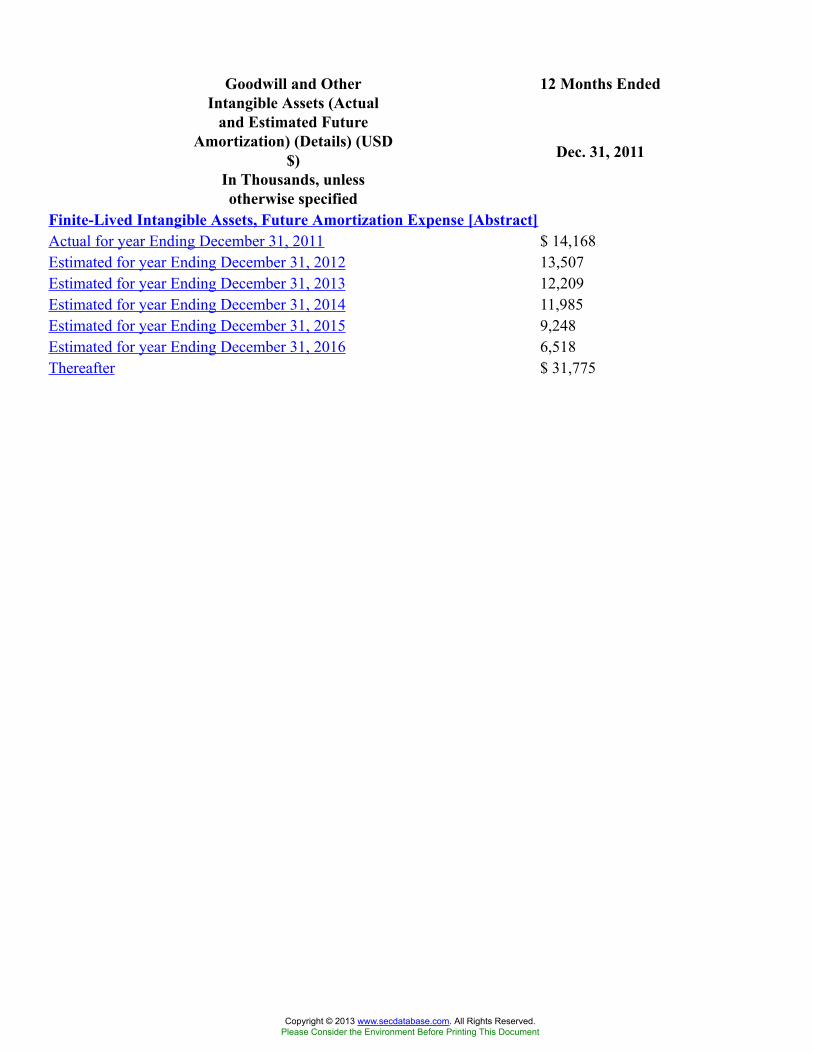
12 Months EndedGoodwill and OtherIntangible Assets (Actual
and Estimated FutureAmortization) (Details) (USD
$)In Thousands, unlessotherwise specified
Dec. 31, 2011
Finite-Lived Intangible Assets, Future Amortization Expense [Abstract]Actual for year Ending December 31, 2011 $ 14,168Estimated for year Ending December 31, 2012 13,507Estimated for year Ending December 31, 2013 12,209Estimated for year Ending December 31, 2014 11,985Estimated for year Ending December 31, 2015 9,248Estimated for year Ending December 31, 2016 6,518Thereafter $ 31,775
Copyright © 2013 www.secdatabase.com. All Rights Reserved.Please Consider the Environment Before Printing This Document
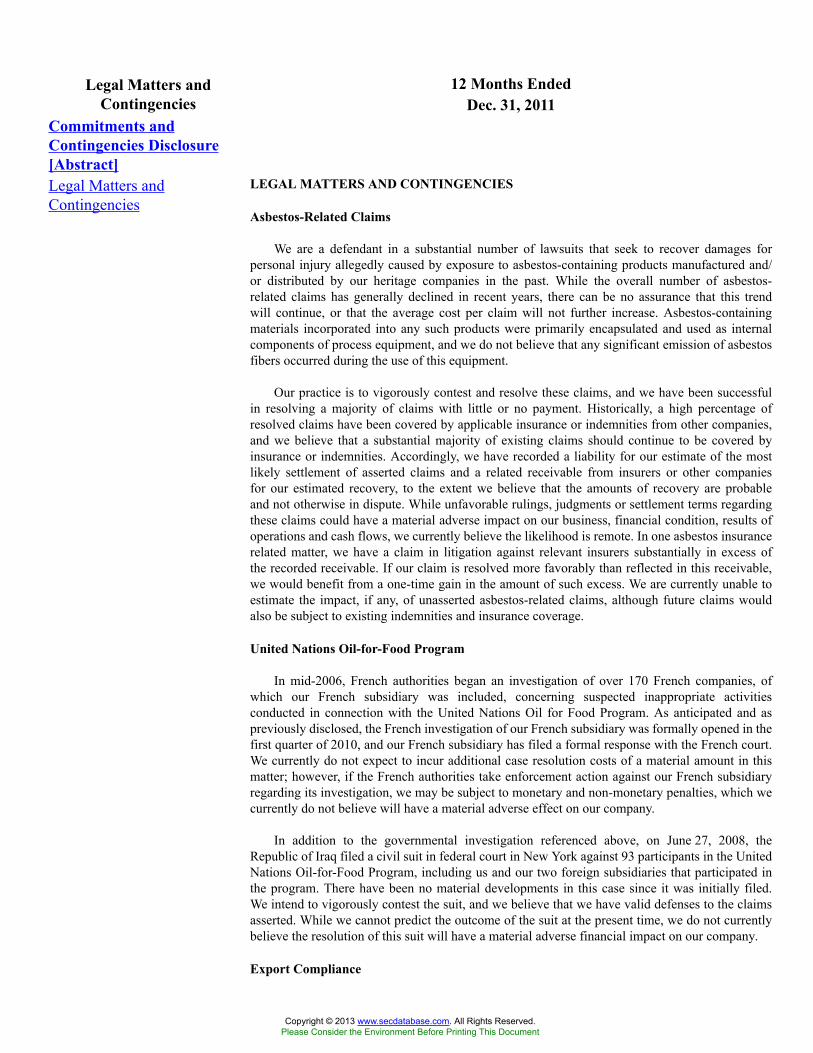
12 Months EndedLegal Matters andContingencies Dec. 31, 2011
Commitments andContingencies Disclosure[Abstract]Legal Matters andContingencies
LEGAL MATTERS AND CONTINGENCIES
Asbestos-Related Claims
We are a defendant in a substantial number of lawsuits that seek to recover damages forpersonal injury allegedly caused by exposure to asbestos-containing products manufactured and/or distributed by our heritage companies in the past. While the overall number of asbestos-related claims has generally declined in recent years, there can be no assurance that this trendwill continue, or that the average cost per claim will not further increase. Asbestos-containingmaterials incorporated into any such products were primarily encapsulated and used as internalcomponents of process equipment, and we do not believe that any significant emission of asbestosfibers occurred during the use of this equipment.
Our practice is to vigorously contest and resolve these claims, and we have been successfulin resolving a majority of claims with little or no payment. Historically, a high percentage ofresolved claims have been covered by applicable insurance or indemnities from other companies,and we believe that a substantial majority of existing claims should continue to be covered byinsurance or indemnities. Accordingly, we have recorded a liability for our estimate of the mostlikely settlement of asserted claims and a related receivable from insurers or other companiesfor our estimated recovery, to the extent we believe that the amounts of recovery are probableand not otherwise in dispute. While unfavorable rulings, judgments or settlement terms regardingthese claims could have a material adverse impact on our business, financial condition, results ofoperations and cash flows, we currently believe the likelihood is remote. In one asbestos insurancerelated matter, we have a claim in litigation against relevant insurers substantially in excess ofthe recorded receivable. If our claim is resolved more favorably than reflected in this receivable,we would benefit from a one-time gain in the amount of such excess. We are currently unable toestimate the impact, if any, of unasserted asbestos-related claims, although future claims wouldalso be subject to existing indemnities and insurance coverage.
United Nations Oil-for-Food Program
In mid-2006, French authorities began an investigation of over 170 French companies, ofwhich our French subsidiary was included, concerning suspected inappropriate activitiesconducted in connection with the United Nations Oil for Food Program. As anticipated and aspreviously disclosed, the French investigation of our French subsidiary was formally opened in thefirst quarter of 2010, and our French subsidiary has filed a formal response with the French court.We currently do not expect to incur additional case resolution costs of a material amount in thismatter; however, if the French authorities take enforcement action against our French subsidiaryregarding its investigation, we may be subject to monetary and non-monetary penalties, which wecurrently do not believe will have a material adverse effect on our company.
In addition to the governmental investigation referenced above, on June 27, 2008, theRepublic of Iraq filed a civil suit in federal court in New York against 93 participants in the UnitedNations Oil-for-Food Program, including us and our two foreign subsidiaries that participated inthe program. There have been no material developments in this case since it was initially filed.We intend to vigorously contest the suit, and we believe that we have valid defenses to the claimsasserted. While we cannot predict the outcome of the suit at the present time, we do not currentlybelieve the resolution of this suit will have a material adverse financial impact on our company.
Export Compliance
Copyright © 2013 www.secdatabase.com. All Rights Reserved.Please Consider the Environment Before Printing This Document
As previously reported, in March 2006, we initiated a voluntary systematic process todetermine our compliance with respect to U.S. export control and economic sanctions lawsand regulations. Our process included the onsite review of approximately 40 sites globally andaddressed the period of October 1, 2002 through October 1, 2007. At the end of 2008, wecompleted comprehensive disclosures to the Commerce Department's Bureau of Industry andSecurity ("BIS") and the Treasury Department's Office of Foreign Assets Control ("OFAC")regarding the results of our review process, and we continued to work closely with authorities overthe next several years to supplement and clarify specific aspects of our voluntary disclosures.
Based on the results of our review process, we determined and voluntarily self-disclosedthat certain of our domestic and foreign affiliates engaged in unlicensed exports and reexports ofpumps, valves and related components to Iran, Syria, Sudan, Cuba and various other countries.As previously disclosed in our Quarterly Report on Form 10-Q for the quarter ended September30, 2011, and as disclosed in the public releases of both BIS and OFAC, in late September 2011,we entered into settlement agreements with both BIS and OFAC that resolved in full all matterscontained in our voluntary self-disclosures. Under the settlements, we agreed to pay a civil penaltyof $2.5 million to BIS to settle 228 charges of unlicensed exports and reexports to Iran, Syriaand various other countries and $0.5 million to OFAC to settle charges alleging 58 violationsof OFAC's Iranian, Cuban and Sudanese sanctioned programs. As a part of our settlement withBIS, we also agreed to conduct a one-time, post-settlement compliance audit of 16 company siteslocated in the U.S. and overseas. The full amount of the civil penalties and the expected cost ofthe audit approximated the reserve previously established for the matter. As disclosed, effectiveJanuary 1, 2012, our foreign subsidiaries substantially completed the voluntary winding down ofbusiness in these countries.
Other
We are currently involved as a potentially responsible party at seven former public wastedisposal sites in various stages of evaluation or remediation. The projected cost of remediation atthese sites, as well as our alleged “fair share” allocation, will remain uncertain until all studieshave been completed and the parties have either negotiated an amicable resolution or the matterhas been judicially resolved. At each site, there are many other parties who have similarly beenidentified. Many of the other parties identified are financially strong and solvent companies thatappear able to pay their share of the remediation costs. Based on our information about the wastedisposal practices at these sites and the environmental regulatory process in general, we believethat it is likely that ultimate remediation liability costs for each site will be apportioned amongall liable parties, including site owners and waste transporters, according to the volumes and/ortoxicity of the wastes shown to have been disposed of at the sites. We believe that our exposure forexisting disposal sites will not be material.
We are also a defendant in a number of other lawsuits, including product liability claims,that are insured, subject to the applicable deductibles, arising in the ordinary course of business,and we are also involved in other uninsured routine litigation incidental to our business. Wecurrently believe none of such litigation, either individually or in the aggregate, is material to ourbusiness, operations or overall financial condition. However, litigation is inherently unpredictable,and resolutions or dispositions of claims or lawsuits by settlement or otherwise could have anadverse impact on our financial position, results of operations or cash flows for the reportingperiod in which any such resolution or disposition occurs.
Although none of the aforementioned potential liabilities can be quantified with absolutecertainty except as otherwise indicated above, we have established reserves covering exposuresrelating to contingencies, to the extent believed to be reasonably estimable and probable basedon past experience and available facts. While additional exposures beyond these reserves couldexist, they currently cannot be estimated. We will continue to evaluate and update the reserves asnecessary and appropriate.
Copyright © 2013 www.secdatabase.com. All Rights Reserved.Please Consider the Environment Before Printing This Document
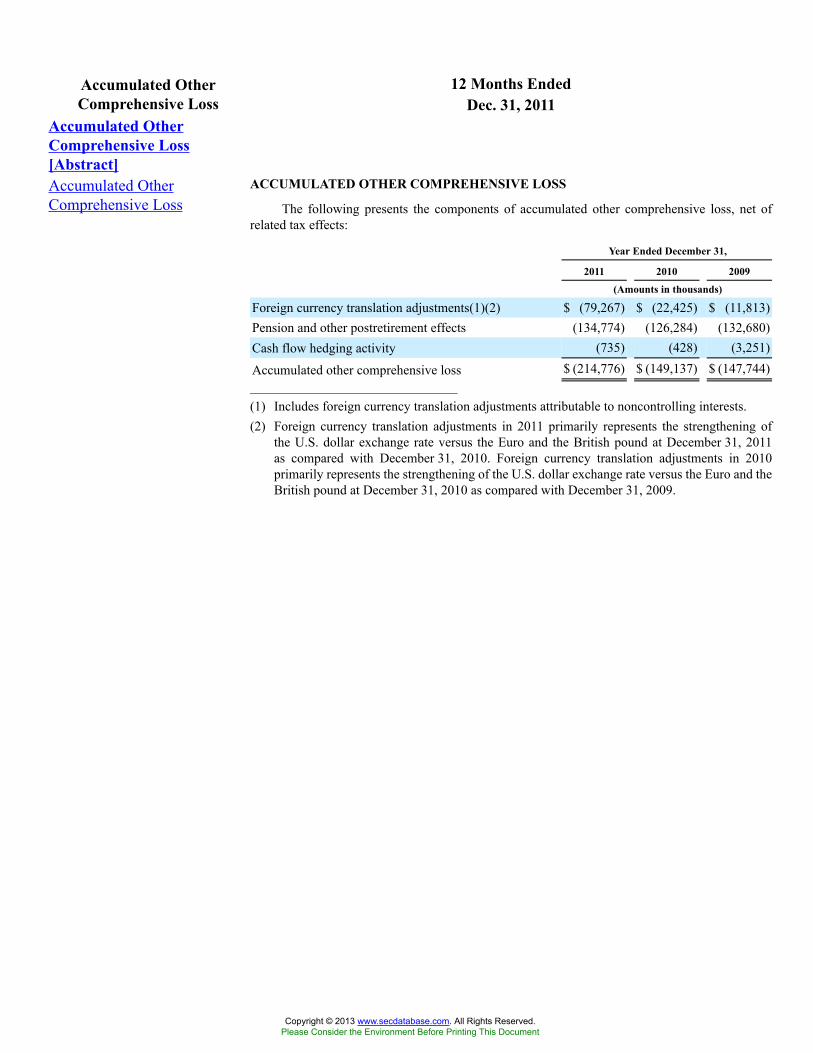
12 Months EndedAccumulated OtherComprehensive Loss Dec. 31, 2011
Accumulated OtherComprehensive Loss[Abstract]Accumulated OtherComprehensive Loss
ACCUMULATED OTHER COMPREHENSIVE LOSS
The following presents the components of accumulated other comprehensive loss, net ofrelated tax effects:
Year Ended December 31,
2011 2010 2009
(Amounts in thousands)
Foreign currency translation adjustments(1)(2) $ (79,267) $ (22,425) $ (11,813)Pension and other postretirement effects (134,774) (126,284) (132,680)Cash flow hedging activity (735) (428) (3,251)
Accumulated other comprehensive loss $ (214,776) $ (149,137) $ (147,744)_______________________________________
(1) Includes foreign currency translation adjustments attributable to noncontrolling interests.(2) Foreign currency translation adjustments in 2011 primarily represents the strengthening of
the U.S. dollar exchange rate versus the Euro and the British pound at December 31, 2011as compared with December 31, 2010. Foreign currency translation adjustments in 2010primarily represents the strengthening of the U.S. dollar exchange rate versus the Euro and theBritish pound at December 31, 2010 as compared with December 31, 2009.
Copyright © 2013 www.secdatabase.com. All Rights Reserved.Please Consider the Environment Before Printing This Document
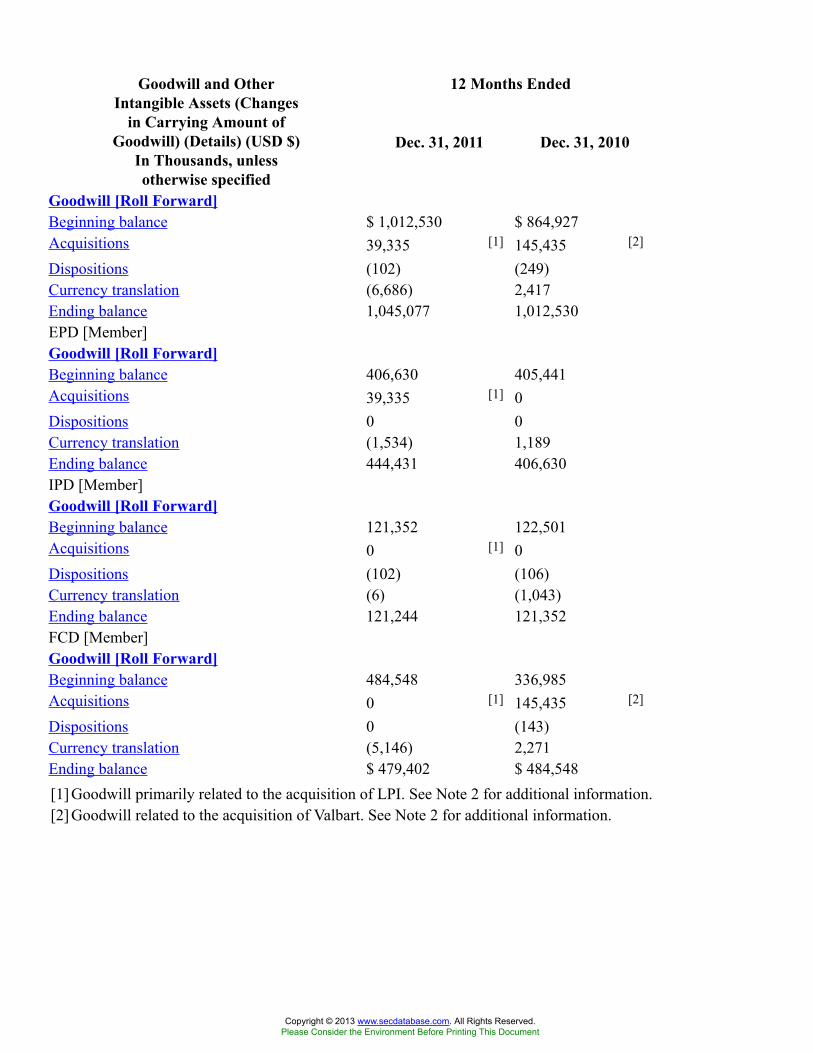
12 Months EndedGoodwill and OtherIntangible Assets (Changes
in Carrying Amount ofGoodwill) (Details) (USD $)
In Thousands, unlessotherwise specified
Dec. 31, 2011 Dec. 31, 2010
Goodwill [Roll Forward]Beginning balance $ 1,012,530 $ 864,927Acquisitions 39,335 [1] 145,435 [2]
Dispositions (102) (249)Currency translation (6,686) 2,417Ending balance 1,045,077 1,012,530EPD [Member]Goodwill [Roll Forward]Beginning balance 406,630 405,441Acquisitions 39,335 [1] 0Dispositions 0 0Currency translation (1,534) 1,189Ending balance 444,431 406,630IPD [Member]Goodwill [Roll Forward]Beginning balance 121,352 122,501Acquisitions 0 [1] 0Dispositions (102) (106)Currency translation (6) (1,043)Ending balance 121,244 121,352FCD [Member]Goodwill [Roll Forward]Beginning balance 484,548 336,985Acquisitions 0 [1] 145,435 [2]
Dispositions 0 (143)Currency translation (5,146) 2,271Ending balance $ 479,402 $ 484,548[1] Goodwill primarily related to the acquisition of LPI. See Note 2 for additional information.[2] Goodwill related to the acquisition of Valbart. See Note 2 for additional information.
Copyright © 2013 www.secdatabase.com. All Rights Reserved.Please Consider the Environment Before Printing This Document
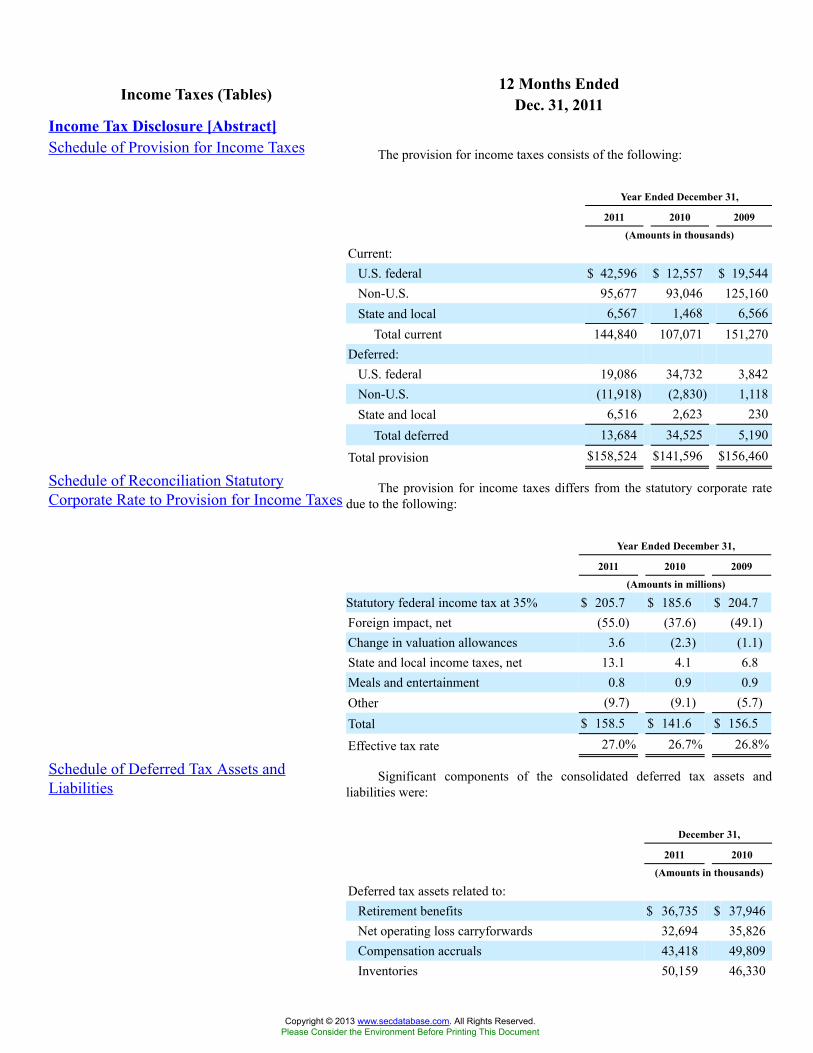
12 Months EndedIncome Taxes (Tables) Dec. 31, 2011Income Tax Disclosure [Abstract]Schedule of Provision for Income Taxes The provision for income taxes consists of the following:
Year Ended December 31,
2011 2010 2009
(Amounts in thousands)
Current:U.S. federal $ 42,596 $ 12,557 $ 19,544Non-U.S. 95,677 93,046 125,160State and local 6,567 1,468 6,566
Total current 144,840 107,071 151,270Deferred:
U.S. federal 19,086 34,732 3,842Non-U.S. (11,918) (2,830) 1,118State and local 6,516 2,623 230
Total deferred 13,684 34,525 5,190
Total provision $158,524 $141,596 $156,460
Schedule of Reconciliation StatutoryCorporate Rate to Provision for Income Taxes
The provision for income taxes differs from the statutory corporate ratedue to the following:
Year Ended December 31,
2011 2010 2009
(Amounts in millions)
Statutory federal income tax at 35% $ 205.7 $ 185.6 $ 204.7Foreign impact, net (55.0) (37.6) (49.1)Change in valuation allowances 3.6 (2.3) (1.1)State and local income taxes, net 13.1 4.1 6.8Meals and entertainment 0.8 0.9 0.9Other (9.7) (9.1) (5.7)Total $ 158.5 $ 141.6 $ 156.5
Effective tax rate 27.0% 26.7% 26.8%
Schedule of Deferred Tax Assets andLiabilities
Significant components of the consolidated deferred tax assets andliabilities were:
December 31,
2011 2010
(Amounts in thousands)
Deferred tax assets related to:Retirement benefits $ 36,735 $ 37,946Net operating loss carryforwards 32,694 35,826Compensation accruals 43,418 49,809Inventories 50,159 46,330
Copyright © 2013 www.secdatabase.com. All Rights Reserved.Please Consider the Environment Before Printing This Document
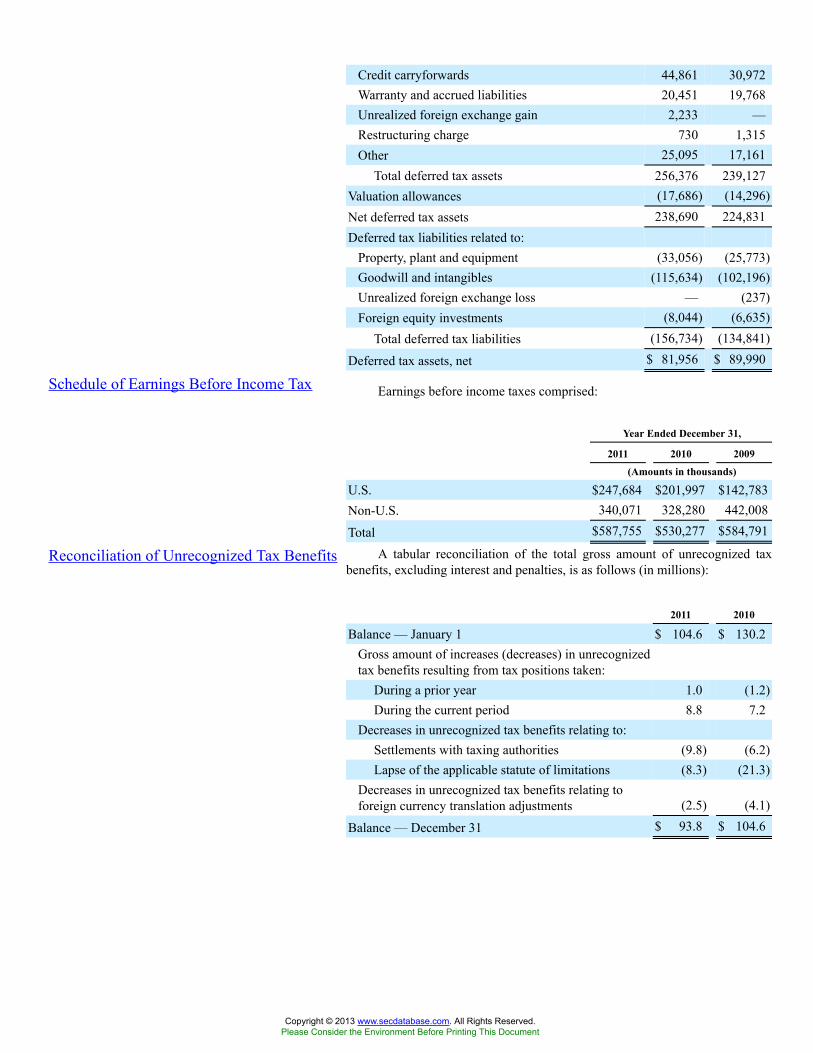
Credit carryforwards 44,861 30,972Warranty and accrued liabilities 20,451 19,768Unrealized foreign exchange gain 2,233 —Restructuring charge 730 1,315Other 25,095 17,161
Total deferred tax assets 256,376 239,127Valuation allowances (17,686) (14,296)Net deferred tax assets 238,690 224,831Deferred tax liabilities related to:
Property, plant and equipment (33,056) (25,773)Goodwill and intangibles (115,634) (102,196)Unrealized foreign exchange loss — (237)Foreign equity investments (8,044) (6,635)
Total deferred tax liabilities (156,734) (134,841)
Deferred tax assets, net $ 81,956 $ 89,990
Schedule of Earnings Before Income Tax Earnings before income taxes comprised:
Year Ended December 31,
2011 2010 2009
(Amounts in thousands)
U.S. $247,684 $201,997 $142,783Non-U.S. 340,071 328,280 442,008
Total $587,755 $530,277 $584,791
Reconciliation of Unrecognized Tax Benefits A tabular reconciliation of the total gross amount of unrecognized taxbenefits, excluding interest and penalties, is as follows (in millions):
2011 2010
Balance — January 1 $ 104.6 $ 130.2Gross amount of increases (decreases) in unrecognizedtax benefits resulting from tax positions taken:
During a prior year 1.0 (1.2)During the current period 8.8 7.2
Decreases in unrecognized tax benefits relating to:Settlements with taxing authorities (9.8) (6.2)Lapse of the applicable statute of limitations (8.3) (21.3)
Decreases in unrecognized tax benefits relating toforeign currency translation adjustments (2.5) (4.1)
Balance — December 31 $ 93.8 $ 104.6
Copyright © 2013 www.secdatabase.com. All Rights Reserved.Please Consider the Environment Before Printing This Document
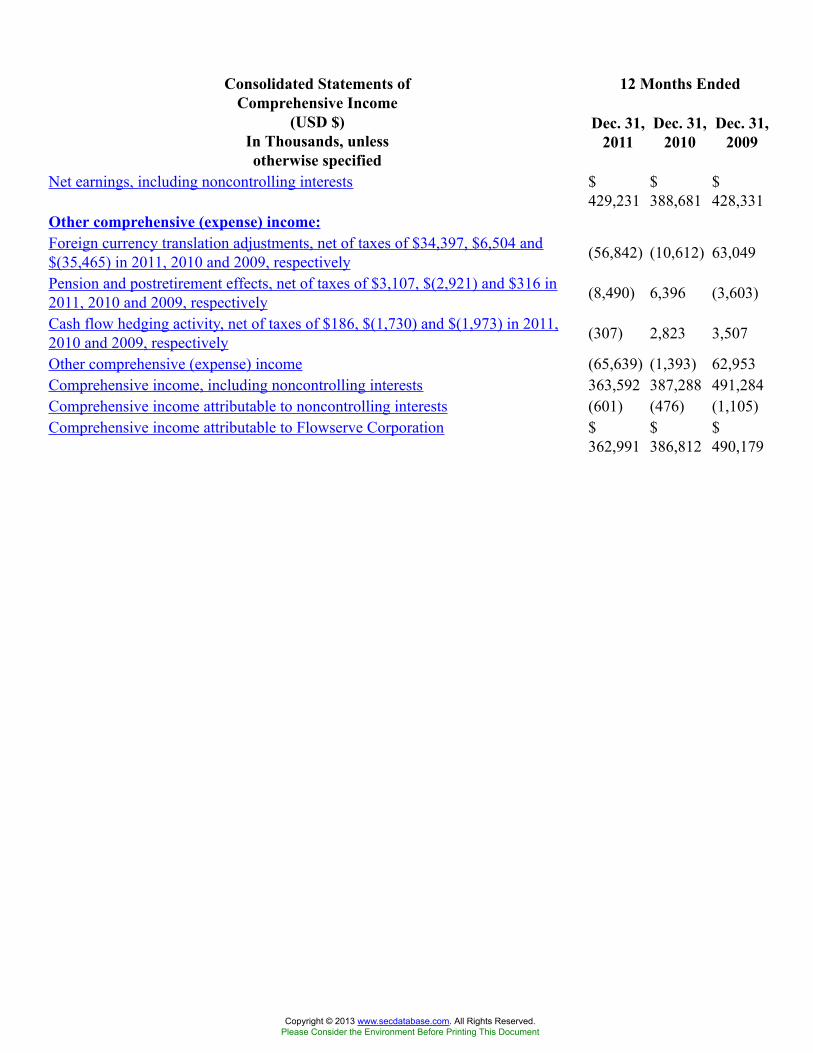
12 Months EndedConsolidated Statements ofComprehensive Income
(USD $)In Thousands, unlessotherwise specified
Dec. 31,2011
Dec. 31,2010
Dec. 31,2009
Net earnings, including noncontrolling interests $429,231
$388,681
$428,331
Other comprehensive (expense) income:Foreign currency translation adjustments, net of taxes of $34,397, $6,504 and$(35,465) in 2011, 2010 and 2009, respectively (56,842) (10,612) 63,049
Pension and postretirement effects, net of taxes of $3,107, $(2,921) and $316 in2011, 2010 and 2009, respectively (8,490) 6,396 (3,603)
Cash flow hedging activity, net of taxes of $186, $(1,730) and $(1,973) in 2011,2010 and 2009, respectively (307) 2,823 3,507
Other comprehensive (expense) income (65,639) (1,393) 62,953Comprehensive income, including noncontrolling interests 363,592 387,288 491,284Comprehensive income attributable to noncontrolling interests (601) (476) (1,105)Comprehensive income attributable to Flowserve Corporation $
362,991$386,812
$490,179
Copyright © 2013 www.secdatabase.com. All Rights Reserved.Please Consider the Environment Before Printing This Document

12 Months EndedAcquisitions Dec. 31, 2011Business Combinations[Abstract]Acquisitions ACQUISITIONS
Lawrence Pumps, Inc.
Effective October 28, 2011, we acquired for inclusion in EPD, 100% of Lawrence Pumps,Inc. ("LPI"), a privately-owned, U.S.-based pump manufacturer, in a share purchase for cashof $89.6 million, subject to final adjustments. LPI specializes in the design, development andmanufacture of engineered centrifugal slurry pumps for critical services within the petroleumrefining, petrochemical, pulp and paper and energy markets. Under the terms of the purchaseagreement, we deposited $1.5 million into escrow to be held and applied against any breach ofrepresentations, warranties or indemnities for 24 months. Additionally, we have the right to makeindemnification claims up to 15% of the purchase price for 18 months. At the expiration of theescrow period, any residual amounts shall be released to the sellers in satisfaction of the purchaseprice.
The purchase price was allocated on a preliminary basis to the assets acquired and liabilitiesassumed based on estimates of fair values at the date of acquisition and is summarized below:
(Amounts inmillions)
Current assets $ 28.0Property, plant and equipment 8.9Intangible assets 30.0Current liabilities (16.6)Net tangible and intangible assets 50.3Goodwill 39.3
Purchase price $ 89.6
The excess of the acquisition date fair value of the total purchase price over the estimatedfair value of the net tangible and intangible assets was recorded as goodwill. Goodwill representsthe value expected to be obtained from the ability to be more competitive through the offering ofa more complete pump product portfolio and from leveraging our current sales, distribution andservice network. LPI products have proprietary niche applications that strategically complementour product portfolio. The goodwill related to this acquisition is recorded in the EPD segmentand is not expected to be deductible for tax purposes. Finite-lived intangible assets have expectedweighted average useful lives of ten years.
Subsequent to October 28, 2011, the revenues and expenses of LPI have been includedin our consolidated statements of income. No pro forma information has been provided dueto immateriality. LPI generated approximately $44 million in sales during its fiscal year endedDecember 31, 2010.
Valbart Srl
Effective July 16, 2010, we acquired for inclusion in FCD, 100% of Valbart Srl ("Valbart"),a privately-owned Italian valve manufacturer, in a share purchase for cash of $199.4 million,which included $33.8 million of existing Valbart net debt (defined as Valbart’s third party debt lesscash on hand) that was repaid at closing. Valbart manufactures trunnion-mounted ball valves usedprimarily in upstream and midstream oil and gas applications, which enables us to offer a morecomplete valve product portfolio to our oil and gas project customers. The acquisition includedValbart’s portion of the joint venture with us that we entered into in December 2009 that was notoperational during 2010. Under the terms of the purchase agreement, we deposited $5.8 million
Copyright © 2013 www.secdatabase.com. All Rights Reserved.Please Consider the Environment Before Printing This Document

into escrow to be held and applied against any breach of representations, warranties or indemnitiesfor 30 months. At the expiration of the escrow, any residual amounts shall be released to the sellersin satisfaction of the purchase price.
The purchase price was allocated to the assets acquired and liabilities assumed based onestimates of fair values at the date of acquisition and is summarized below:
(Amounts inmillions)
Accounts receivable $ 12.2Inventories 39.6Deferred taxes 8.7Prepaid expenses and other 1.0Intangible assets
Existing customer relationships 16.3Trademarks 11.5Non-compete agreements 2.7Engineering drawings 2.3
Property, plant and equipment 10.1Current liabilities (36.8)Noncurrent liabilities (13.6)Net tangible and intangible assets 54.0Goodwill 145.4
Purchase price $ 199.4
The excess of the acquisition date fair value of the total purchase price over the estimatedfair value of the net tangible and intangible assets was recorded as goodwill. Goodwill representsthe value expected to be obtained from the ability to be more competitive through the offeringof a more complete valve product portfolio and from leveraging our current sales, distributionand service network. The goodwill related to this acquisition is recorded in the FCD segmentand is not expected to be deductible for tax purposes. Trademarks are indefinite-lived intangibleassets. Existing customer relationships, non-compete agreements and engineering drawings haveexpected weighted average useful lives of five years, four years and ten years, respectively. Intotal, amortizable intangible assets have a weighted average useful life of approximately five years.
Subsequent to July 16, 2010, the revenues and expenses of Valbart have been includedin our consolidated statements of income. No pro forma information has been provided due toimmateriality.
Calder AG
Effective April 21, 2009, we acquired for inclusion in EPD, Calder AG ("Calder"), a privateSwiss company and a supplier of energy recovery technology for use in the global desalinationmarket, for up to $44.1 million, net of cash acquired. Of the total purchase price, $28.4 millionwas paid at closing and $2.4 million was paid after the working capital valuation was completedin early July 2009. The remaining $13.3 million of the total purchase price was contingent uponCalder achieving certain performance metrics during the twelve months following the acquisition,and, to the extent achieved, was expected to be paid in cash within 12 months of the acquisitiondate. We initially recognized a liability of $4.4 million as an estimate of the acquisition date fairvalue of the contingent consideration, which was based on the weighted probability of achievementof the performance metrics over a specified period of time as of the date of the acquisition.
The purchase price was allocated to the assets acquired and liabilities assumed based onestimates of fair values at the date of acquisition. The excess of the acquisition date fair value of
Copyright © 2013 www.secdatabase.com. All Rights Reserved.Please Consider the Environment Before Printing This Document
the total purchase price over the estimated fair value of the net tangible and intangible assets wasrecorded as goodwill. No pro forma information has been provided due to immateriality.
During the second half of 2009, the estimated fair value of the contingent consideration wasreduced to $0 based on 2009 results and an updated weighted probability of achievement of theperformance metrics. The resulting gain was included in SG&A in our consolidated statementof income. The final measurement date of the performance metrics was March 31, 2010. Theperformance metrics were not met, resulting in no payment of contingent consideration.
Copyright © 2013 www.secdatabase.com. All Rights Reserved.Please Consider the Environment Before Printing This Document
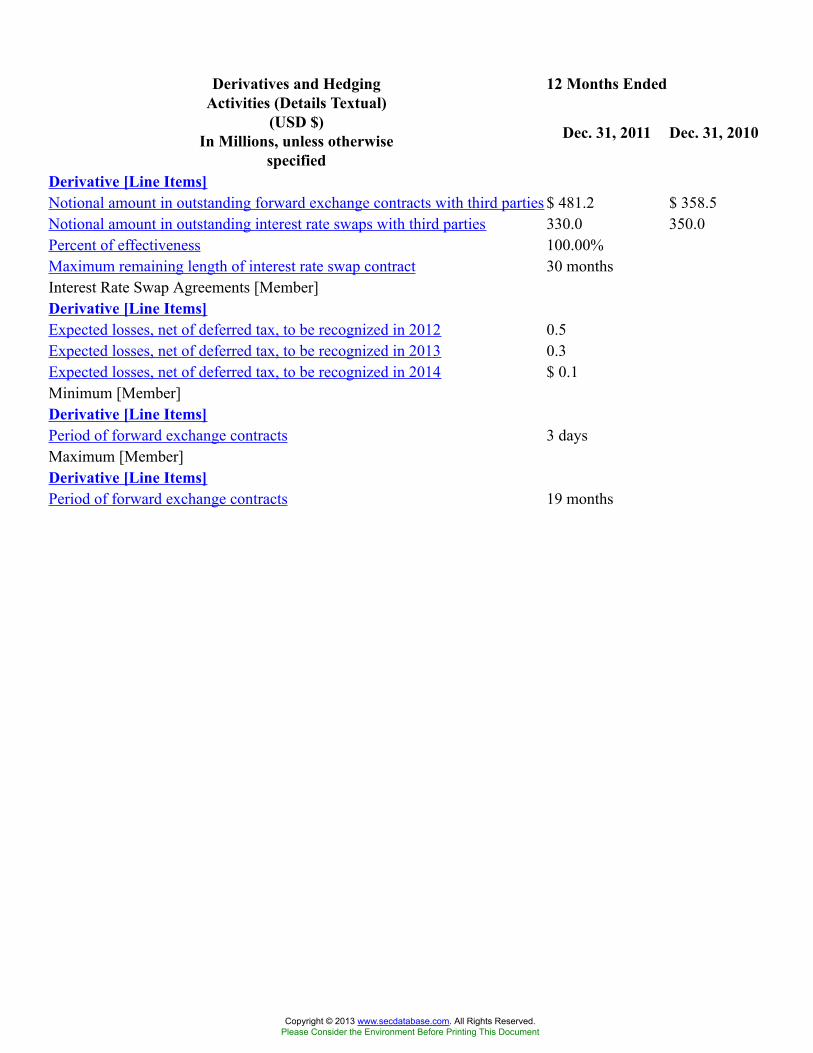
12 Months EndedDerivatives and HedgingActivities (Details Textual)
(USD $)In Millions, unless otherwise
specified
Dec. 31, 2011 Dec. 31, 2010
Derivative [Line Items]Notional amount in outstanding forward exchange contracts with third parties $ 481.2 $ 358.5Notional amount in outstanding interest rate swaps with third parties 330.0 350.0Percent of effectiveness 100.00%Maximum remaining length of interest rate swap contract 30 monthsInterest Rate Swap Agreements [Member]Derivative [Line Items]Expected losses, net of deferred tax, to be recognized in 2012 0.5Expected losses, net of deferred tax, to be recognized in 2013 0.3Expected losses, net of deferred tax, to be recognized in 2014 $ 0.1Minimum [Member]Derivative [Line Items]Period of forward exchange contracts 3 daysMaximum [Member]Derivative [Line Items]Period of forward exchange contracts 19 months
Copyright © 2013 www.secdatabase.com. All Rights Reserved.Please Consider the Environment Before Printing This Document
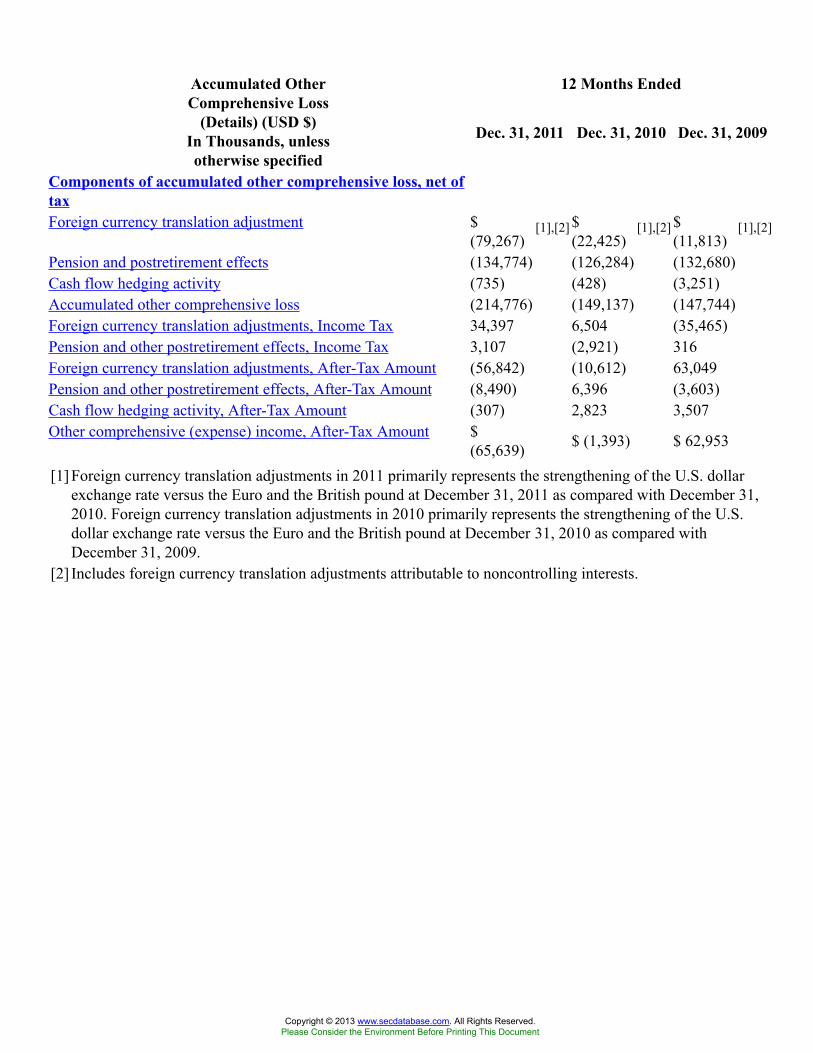
12 Months EndedAccumulated OtherComprehensive Loss
(Details) (USD $)In Thousands, unlessotherwise specified
Dec. 31, 2011 Dec. 31, 2010 Dec. 31, 2009
Components of accumulated other comprehensive loss, net oftaxForeign currency translation adjustment $
(79,267)[1],[2] $
(22,425)[1],[2] $
(11,813)[1],[2]
Pension and postretirement effects (134,774) (126,284) (132,680)Cash flow hedging activity (735) (428) (3,251)Accumulated other comprehensive loss (214,776) (149,137) (147,744)Foreign currency translation adjustments, Income Tax 34,397 6,504 (35,465)Pension and other postretirement effects, Income Tax 3,107 (2,921) 316Foreign currency translation adjustments, After-Tax Amount (56,842) (10,612) 63,049Pension and other postretirement effects, After-Tax Amount (8,490) 6,396 (3,603)Cash flow hedging activity, After-Tax Amount (307) 2,823 3,507Other comprehensive (expense) income, After-Tax Amount $
(65,639) $ (1,393) $ 62,953
[1] Foreign currency translation adjustments in 2011 primarily represents the strengthening of the U.S. dollarexchange rate versus the Euro and the British pound at December 31, 2011 as compared with December 31,2010. Foreign currency translation adjustments in 2010 primarily represents the strengthening of the U.S.dollar exchange rate versus the Euro and the British pound at December 31, 2010 as compared withDecember 31, 2009.
[2] Includes foreign currency translation adjustments attributable to noncontrolling interests.
Copyright © 2013 www.secdatabase.com. All Rights Reserved.Please Consider the Environment Before Printing This Document
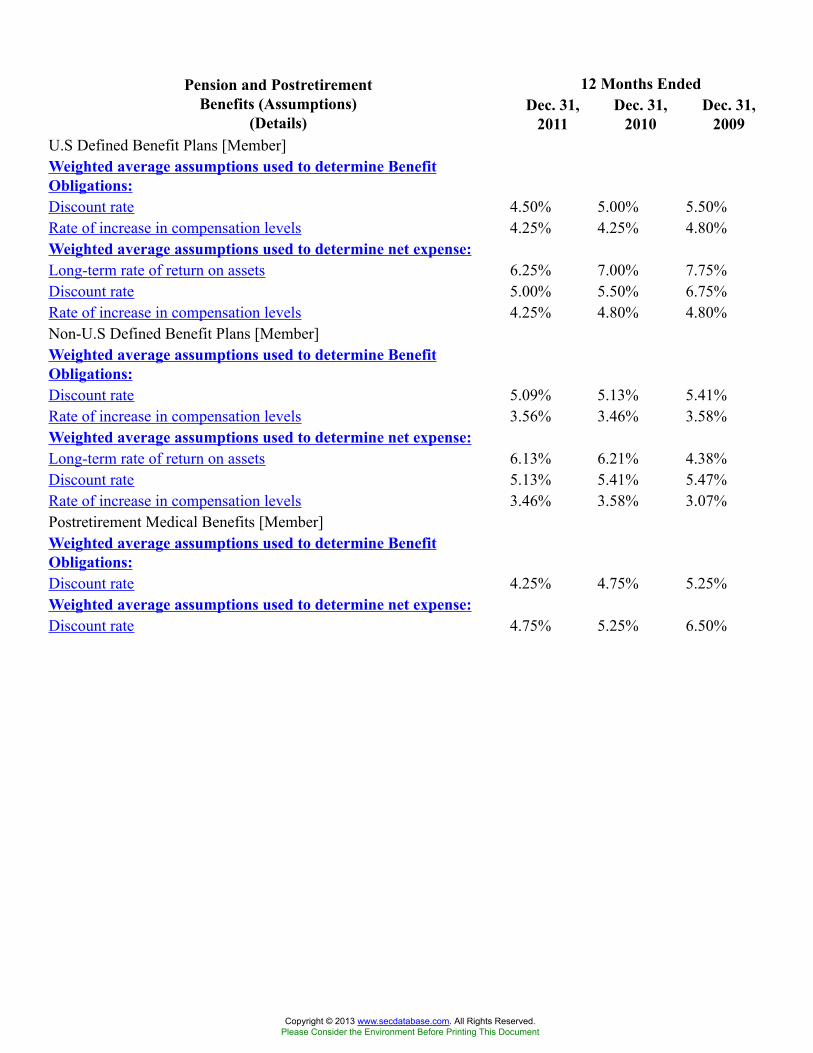
12 Months EndedPension and PostretirementBenefits (Assumptions)
(Details)Dec. 31,
2011Dec. 31,
2010Dec. 31,
2009U.S Defined Benefit Plans [Member]Weighted average assumptions used to determine BenefitObligations:Discount rate 4.50% 5.00% 5.50%Rate of increase in compensation levels 4.25% 4.25% 4.80%Weighted average assumptions used to determine net expense:Long-term rate of return on assets 6.25% 7.00% 7.75%Discount rate 5.00% 5.50% 6.75%Rate of increase in compensation levels 4.25% 4.80% 4.80%Non-U.S Defined Benefit Plans [Member]Weighted average assumptions used to determine BenefitObligations:Discount rate 5.09% 5.13% 5.41%Rate of increase in compensation levels 3.56% 3.46% 3.58%Weighted average assumptions used to determine net expense:Long-term rate of return on assets 6.13% 6.21% 4.38%Discount rate 5.13% 5.41% 5.47%Rate of increase in compensation levels 3.46% 3.58% 3.07%Postretirement Medical Benefits [Member]Weighted average assumptions used to determine BenefitObligations:Discount rate 4.25% 4.75% 5.25%Weighted average assumptions used to determine net expense:Discount rate 4.75% 5.25% 6.50%
Copyright © 2013 www.secdatabase.com. All Rights Reserved.Please Consider the Environment Before Printing This Document
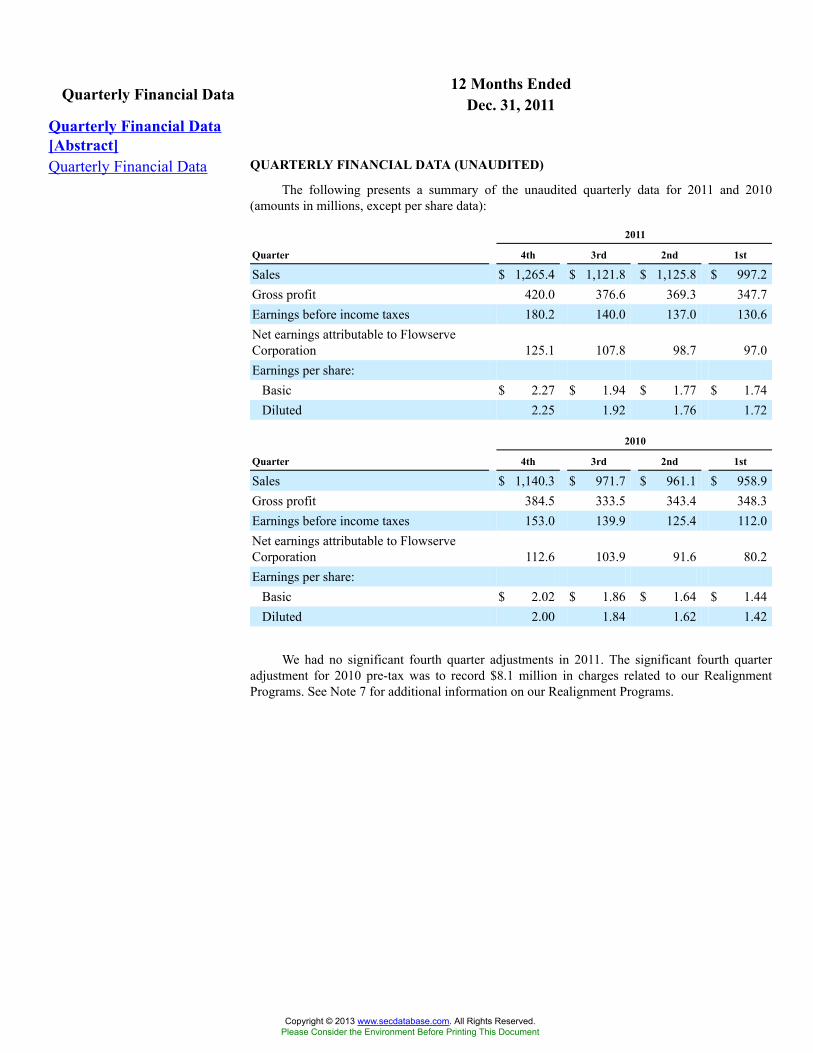
12 Months EndedQuarterly Financial Data Dec. 31, 2011Quarterly Financial Data[Abstract]Quarterly Financial Data QUARTERLY FINANCIAL DATA (UNAUDITED)
The following presents a summary of the unaudited quarterly data for 2011 and 2010(amounts in millions, except per share data):
2011
Quarter 4th 3rd 2nd 1st
Sales $ 1,265.4 $ 1,121.8 $ 1,125.8 $ 997.2Gross profit 420.0 376.6 369.3 347.7Earnings before income taxes 180.2 140.0 137.0 130.6Net earnings attributable to FlowserveCorporation 125.1 107.8 98.7 97.0Earnings per share:
Basic $ 2.27 $ 1.94 $ 1.77 $ 1.74Diluted 2.25 1.92 1.76 1.72
2010
Quarter 4th 3rd 2nd 1st
Sales $ 1,140.3 $ 971.7 $ 961.1 $ 958.9Gross profit 384.5 333.5 343.4 348.3Earnings before income taxes 153.0 139.9 125.4 112.0Net earnings attributable to FlowserveCorporation 112.6 103.9 91.6 80.2Earnings per share:
Basic $ 2.02 $ 1.86 $ 1.64 $ 1.44Diluted 2.00 1.84 1.62 1.42
We had no significant fourth quarter adjustments in 2011. The significant fourth quarteradjustment for 2010 pre-tax was to record $8.1 million in charges related to our RealignmentPrograms. See Note 7 for additional information on our Realignment Programs.
Copyright © 2013 www.secdatabase.com. All Rights Reserved.Please Consider the Environment Before Printing This Document
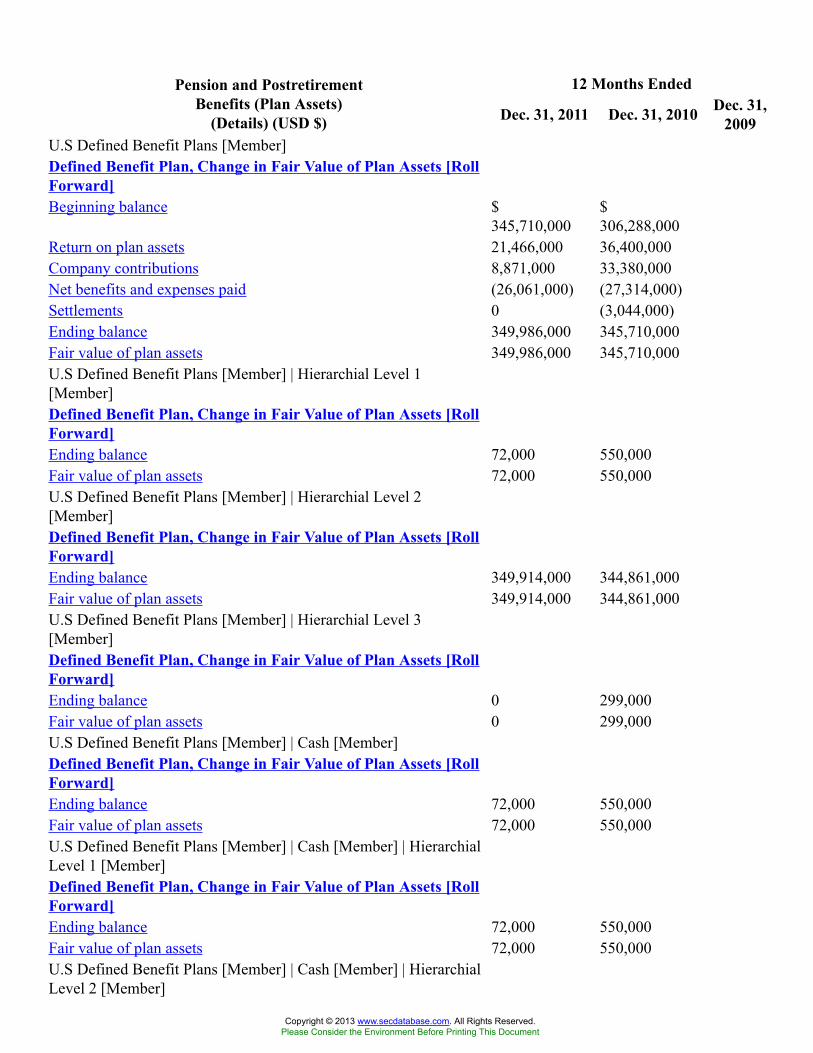
12 Months EndedPension and PostretirementBenefits (Plan Assets)
(Details) (USD $) Dec. 31, 2011 Dec. 31, 2010 Dec. 31,2009
U.S Defined Benefit Plans [Member]Defined Benefit Plan, Change in Fair Value of Plan Assets [RollForward]Beginning balance $
345,710,000$306,288,000
Return on plan assets 21,466,000 36,400,000Company contributions 8,871,000 33,380,000Net benefits and expenses paid (26,061,000) (27,314,000)Settlements 0 (3,044,000)Ending balance 349,986,000 345,710,000Fair value of plan assets 349,986,000 345,710,000U.S Defined Benefit Plans [Member] | Hierarchial Level 1[Member]Defined Benefit Plan, Change in Fair Value of Plan Assets [RollForward]Ending balance 72,000 550,000Fair value of plan assets 72,000 550,000U.S Defined Benefit Plans [Member] | Hierarchial Level 2[Member]Defined Benefit Plan, Change in Fair Value of Plan Assets [RollForward]Ending balance 349,914,000 344,861,000Fair value of plan assets 349,914,000 344,861,000U.S Defined Benefit Plans [Member] | Hierarchial Level 3[Member]Defined Benefit Plan, Change in Fair Value of Plan Assets [RollForward]Ending balance 0 299,000Fair value of plan assets 0 299,000U.S Defined Benefit Plans [Member] | Cash [Member]Defined Benefit Plan, Change in Fair Value of Plan Assets [RollForward]Ending balance 72,000 550,000Fair value of plan assets 72,000 550,000U.S Defined Benefit Plans [Member] | Cash [Member] | HierarchialLevel 1 [Member]Defined Benefit Plan, Change in Fair Value of Plan Assets [RollForward]Ending balance 72,000 550,000Fair value of plan assets 72,000 550,000U.S Defined Benefit Plans [Member] | Cash [Member] | HierarchialLevel 2 [Member]
Copyright © 2013 www.secdatabase.com. All Rights Reserved.Please Consider the Environment Before Printing This Document
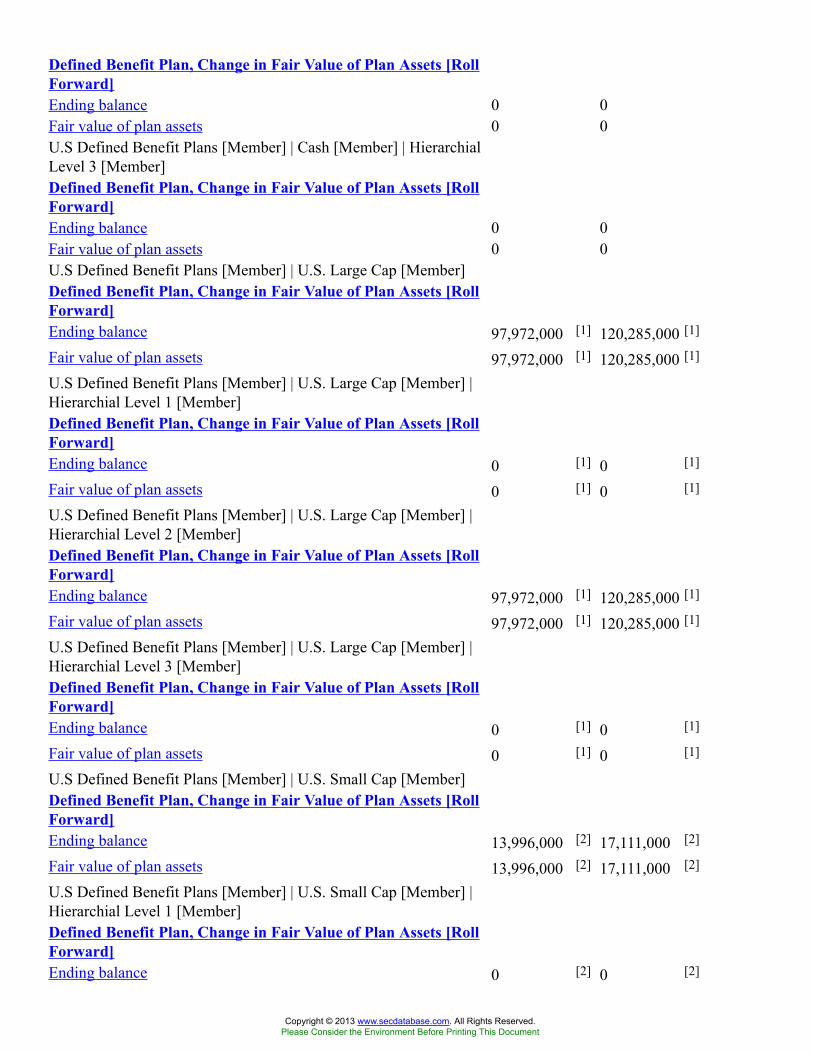
Defined Benefit Plan, Change in Fair Value of Plan Assets [RollForward]Ending balance 0 0Fair value of plan assets 0 0U.S Defined Benefit Plans [Member] | Cash [Member] | HierarchialLevel 3 [Member]Defined Benefit Plan, Change in Fair Value of Plan Assets [RollForward]Ending balance 0 0Fair value of plan assets 0 0U.S Defined Benefit Plans [Member] | U.S. Large Cap [Member]Defined Benefit Plan, Change in Fair Value of Plan Assets [RollForward]Ending balance 97,972,000 [1] 120,285,000 [1]
Fair value of plan assets 97,972,000 [1] 120,285,000 [1]
U.S Defined Benefit Plans [Member] | U.S. Large Cap [Member] |Hierarchial Level 1 [Member]Defined Benefit Plan, Change in Fair Value of Plan Assets [RollForward]Ending balance 0 [1] 0 [1]
Fair value of plan assets 0 [1] 0 [1]
U.S Defined Benefit Plans [Member] | U.S. Large Cap [Member] |Hierarchial Level 2 [Member]Defined Benefit Plan, Change in Fair Value of Plan Assets [RollForward]Ending balance 97,972,000 [1] 120,285,000 [1]
Fair value of plan assets 97,972,000 [1] 120,285,000 [1]
U.S Defined Benefit Plans [Member] | U.S. Large Cap [Member] |Hierarchial Level 3 [Member]Defined Benefit Plan, Change in Fair Value of Plan Assets [RollForward]Ending balance 0 [1] 0 [1]
Fair value of plan assets 0 [1] 0 [1]
U.S Defined Benefit Plans [Member] | U.S. Small Cap [Member]Defined Benefit Plan, Change in Fair Value of Plan Assets [RollForward]Ending balance 13,996,000 [2] 17,111,000 [2]
Fair value of plan assets 13,996,000 [2] 17,111,000 [2]
U.S Defined Benefit Plans [Member] | U.S. Small Cap [Member] |Hierarchial Level 1 [Member]Defined Benefit Plan, Change in Fair Value of Plan Assets [RollForward]Ending balance 0 [2] 0 [2]
Copyright © 2013 www.secdatabase.com. All Rights Reserved.Please Consider the Environment Before Printing This Document
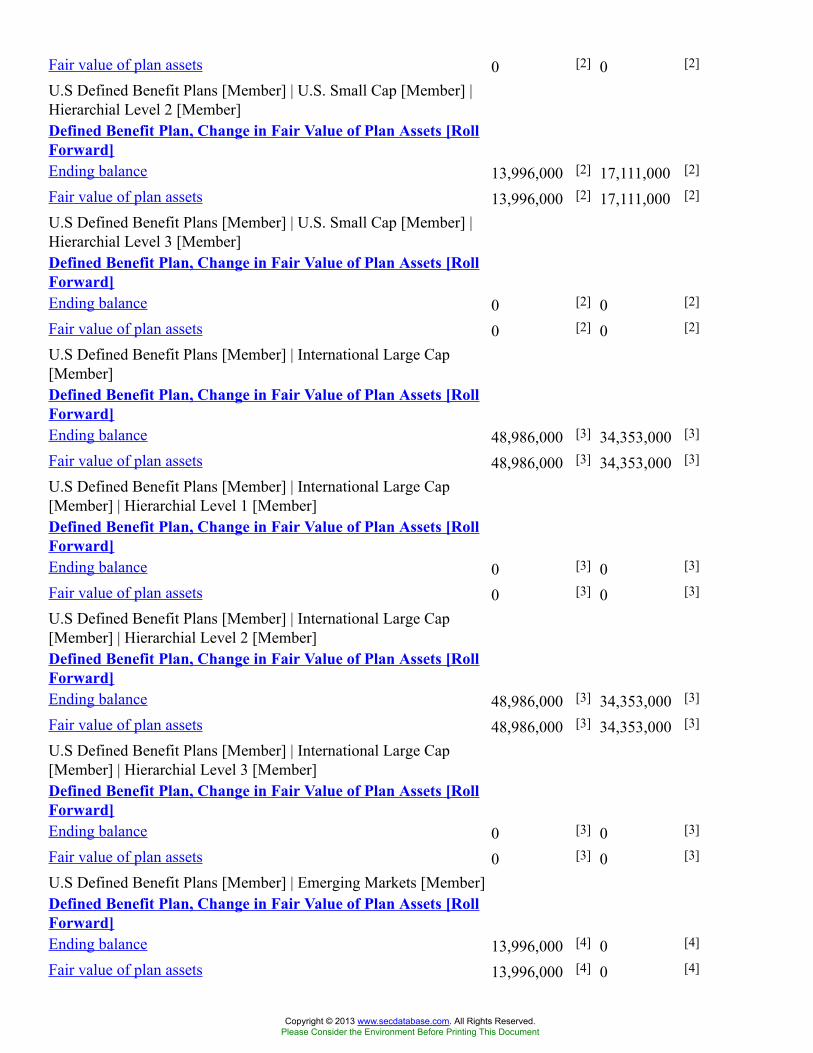
Fair value of plan assets 0 [2] 0 [2]
U.S Defined Benefit Plans [Member] | U.S. Small Cap [Member] |Hierarchial Level 2 [Member]Defined Benefit Plan, Change in Fair Value of Plan Assets [RollForward]Ending balance 13,996,000 [2] 17,111,000 [2]
Fair value of plan assets 13,996,000 [2] 17,111,000 [2]
U.S Defined Benefit Plans [Member] | U.S. Small Cap [Member] |Hierarchial Level 3 [Member]Defined Benefit Plan, Change in Fair Value of Plan Assets [RollForward]Ending balance 0 [2] 0 [2]
Fair value of plan assets 0 [2] 0 [2]
U.S Defined Benefit Plans [Member] | International Large Cap[Member]Defined Benefit Plan, Change in Fair Value of Plan Assets [RollForward]Ending balance 48,986,000 [3] 34,353,000 [3]
Fair value of plan assets 48,986,000 [3] 34,353,000 [3]
U.S Defined Benefit Plans [Member] | International Large Cap[Member] | Hierarchial Level 1 [Member]Defined Benefit Plan, Change in Fair Value of Plan Assets [RollForward]Ending balance 0 [3] 0 [3]
Fair value of plan assets 0 [3] 0 [3]
U.S Defined Benefit Plans [Member] | International Large Cap[Member] | Hierarchial Level 2 [Member]Defined Benefit Plan, Change in Fair Value of Plan Assets [RollForward]Ending balance 48,986,000 [3] 34,353,000 [3]
Fair value of plan assets 48,986,000 [3] 34,353,000 [3]
U.S Defined Benefit Plans [Member] | International Large Cap[Member] | Hierarchial Level 3 [Member]Defined Benefit Plan, Change in Fair Value of Plan Assets [RollForward]Ending balance 0 [3] 0 [3]
Fair value of plan assets 0 [3] 0 [3]
U.S Defined Benefit Plans [Member] | Emerging Markets [Member]Defined Benefit Plan, Change in Fair Value of Plan Assets [RollForward]Ending balance 13,996,000 [4] 0 [4]
Fair value of plan assets 13,996,000 [4] 0 [4]
Copyright © 2013 www.secdatabase.com. All Rights Reserved.Please Consider the Environment Before Printing This Document
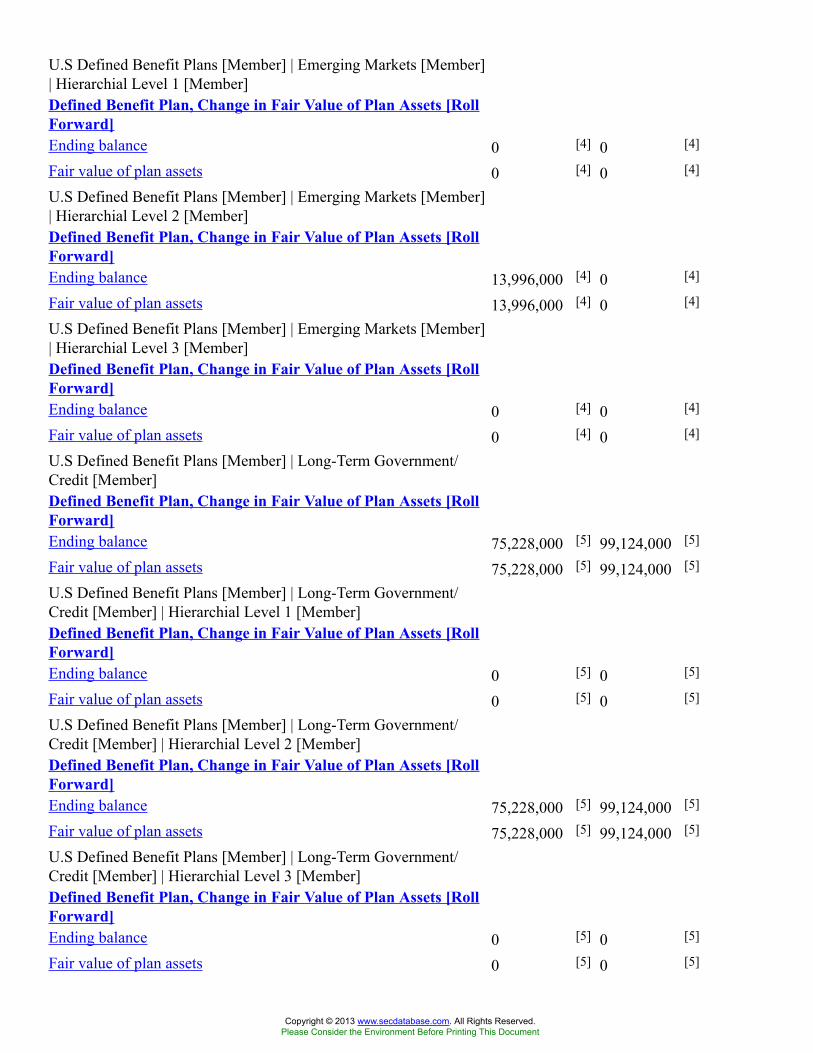
U.S Defined Benefit Plans [Member] | Emerging Markets [Member]| Hierarchial Level 1 [Member]Defined Benefit Plan, Change in Fair Value of Plan Assets [RollForward]Ending balance 0 [4] 0 [4]
Fair value of plan assets 0 [4] 0 [4]
U.S Defined Benefit Plans [Member] | Emerging Markets [Member]| Hierarchial Level 2 [Member]Defined Benefit Plan, Change in Fair Value of Plan Assets [RollForward]Ending balance 13,996,000 [4] 0 [4]
Fair value of plan assets 13,996,000 [4] 0 [4]
U.S Defined Benefit Plans [Member] | Emerging Markets [Member]| Hierarchial Level 3 [Member]Defined Benefit Plan, Change in Fair Value of Plan Assets [RollForward]Ending balance 0 [4] 0 [4]
Fair value of plan assets 0 [4] 0 [4]
U.S Defined Benefit Plans [Member] | Long-Term Government/Credit [Member]Defined Benefit Plan, Change in Fair Value of Plan Assets [RollForward]Ending balance 75,228,000 [5] 99,124,000 [5]
Fair value of plan assets 75,228,000 [5] 99,124,000 [5]
U.S Defined Benefit Plans [Member] | Long-Term Government/Credit [Member] | Hierarchial Level 1 [Member]Defined Benefit Plan, Change in Fair Value of Plan Assets [RollForward]Ending balance 0 [5] 0 [5]
Fair value of plan assets 0 [5] 0 [5]
U.S Defined Benefit Plans [Member] | Long-Term Government/Credit [Member] | Hierarchial Level 2 [Member]Defined Benefit Plan, Change in Fair Value of Plan Assets [RollForward]Ending balance 75,228,000 [5] 99,124,000 [5]
Fair value of plan assets 75,228,000 [5] 99,124,000 [5]
U.S Defined Benefit Plans [Member] | Long-Term Government/Credit [Member] | Hierarchial Level 3 [Member]Defined Benefit Plan, Change in Fair Value of Plan Assets [RollForward]Ending balance 0 [5] 0 [5]
Fair value of plan assets 0 [5] 0 [5]
Copyright © 2013 www.secdatabase.com. All Rights Reserved.Please Consider the Environment Before Printing This Document
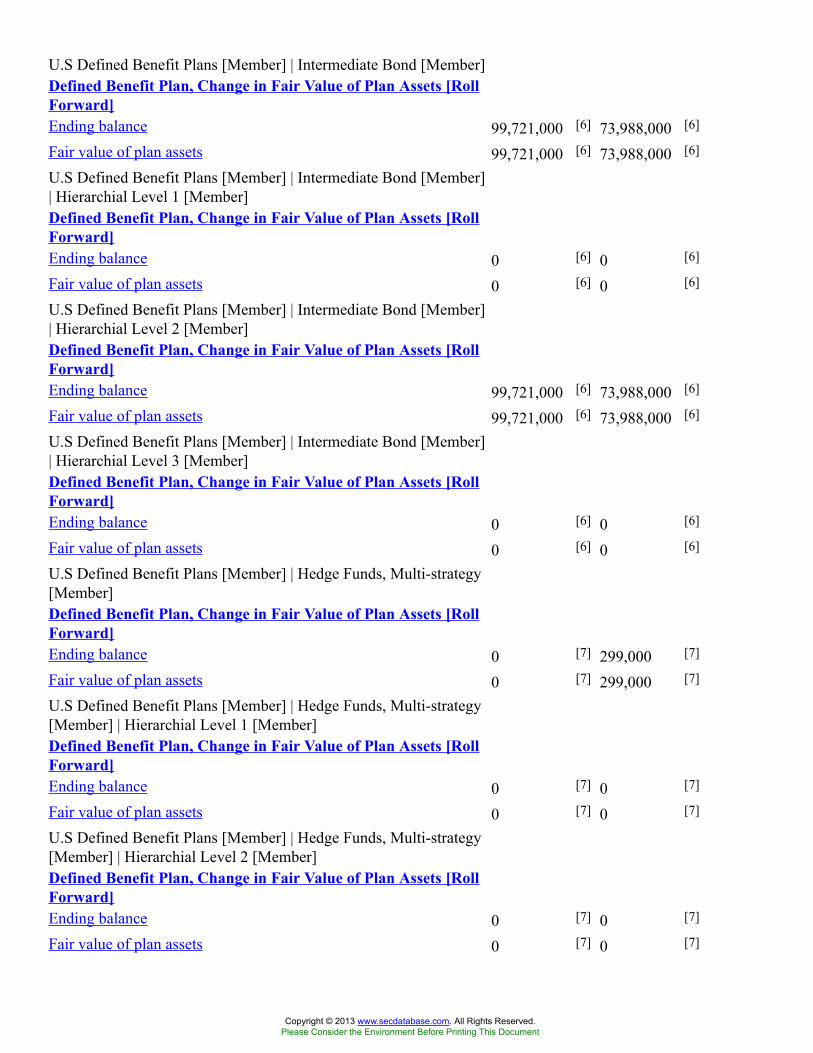
U.S Defined Benefit Plans [Member] | Intermediate Bond [Member]Defined Benefit Plan, Change in Fair Value of Plan Assets [RollForward]Ending balance 99,721,000 [6] 73,988,000 [6]
Fair value of plan assets 99,721,000 [6] 73,988,000 [6]
U.S Defined Benefit Plans [Member] | Intermediate Bond [Member]| Hierarchial Level 1 [Member]Defined Benefit Plan, Change in Fair Value of Plan Assets [RollForward]Ending balance 0 [6] 0 [6]
Fair value of plan assets 0 [6] 0 [6]
U.S Defined Benefit Plans [Member] | Intermediate Bond [Member]| Hierarchial Level 2 [Member]Defined Benefit Plan, Change in Fair Value of Plan Assets [RollForward]Ending balance 99,721,000 [6] 73,988,000 [6]
Fair value of plan assets 99,721,000 [6] 73,988,000 [6]
U.S Defined Benefit Plans [Member] | Intermediate Bond [Member]| Hierarchial Level 3 [Member]Defined Benefit Plan, Change in Fair Value of Plan Assets [RollForward]Ending balance 0 [6] 0 [6]
Fair value of plan assets 0 [6] 0 [6]
U.S Defined Benefit Plans [Member] | Hedge Funds, Multi-strategy[Member]Defined Benefit Plan, Change in Fair Value of Plan Assets [RollForward]Ending balance 0 [7] 299,000 [7]
Fair value of plan assets 0 [7] 299,000 [7]
U.S Defined Benefit Plans [Member] | Hedge Funds, Multi-strategy[Member] | Hierarchial Level 1 [Member]Defined Benefit Plan, Change in Fair Value of Plan Assets [RollForward]Ending balance 0 [7] 0 [7]
Fair value of plan assets 0 [7] 0 [7]
U.S Defined Benefit Plans [Member] | Hedge Funds, Multi-strategy[Member] | Hierarchial Level 2 [Member]Defined Benefit Plan, Change in Fair Value of Plan Assets [RollForward]Ending balance 0 [7] 0 [7]
Fair value of plan assets 0 [7] 0 [7]
Copyright © 2013 www.secdatabase.com. All Rights Reserved.Please Consider the Environment Before Printing This Document

U.S Defined Benefit Plans [Member] | Hedge Funds, Multi-strategy[Member] | Hierarchial Level 3 [Member]Defined Benefit Plan, Change in Fair Value of Plan Assets [RollForward]Ending balance 0 [7] 299,000 [7]
Fair value of plan assets 0 [7] 299,000 [7]
U.S Defined Benefit Plans [Member] | Other [Member]Defined Benefit Plan, Change in Fair Value of Plan Assets [RollForward]Ending balance 15,000 [8]
Fair value of plan assets 15,000 [8]
U.S Defined Benefit Plans [Member] | Other [Member] | HierarchialLevel 1 [Member]Defined Benefit Plan, Change in Fair Value of Plan Assets [RollForward]Ending balance 0 [8] 0 [8]
Fair value of plan assets 0 [8] 0 [8]
U.S Defined Benefit Plans [Member] | Other [Member] | HierarchialLevel 2 [Member]Defined Benefit Plan, Change in Fair Value of Plan Assets [RollForward]Ending balance 15,000 [8] 0 [8]
Fair value of plan assets 15,000 [8] 0 [8]
U.S Defined Benefit Plans [Member] | Other [Member] | HierarchialLevel 3 [Member]Defined Benefit Plan, Change in Fair Value of Plan Assets [RollForward]Ending balance 0 [8] 0 [8]
Fair value of plan assets 0 [8] 0 [8]
Non-U.S Defined Benefit Plans [Member]Defined Benefit Plan, Change in Fair Value of Plan Assets [RollForward]Beginning balance 133,944,000 120,897,000Return on plan assets 10,279,000 13,237,000Employee contributions 345,000 512,000Company contributions 18,149,000 16,840,000Currency translation impact and other (1,797,000) (4,285,000)Net benefits and expenses paid (15,525,000) (13,257,000)Settlements (283,000) 0Ending balance 145,112,000 133,944,000Estimated contributions in the next year 10,000,000Fair value of plan assets 145,112,000 133,944,000
Copyright © 2013 www.secdatabase.com. All Rights Reserved.Please Consider the Environment Before Printing This Document
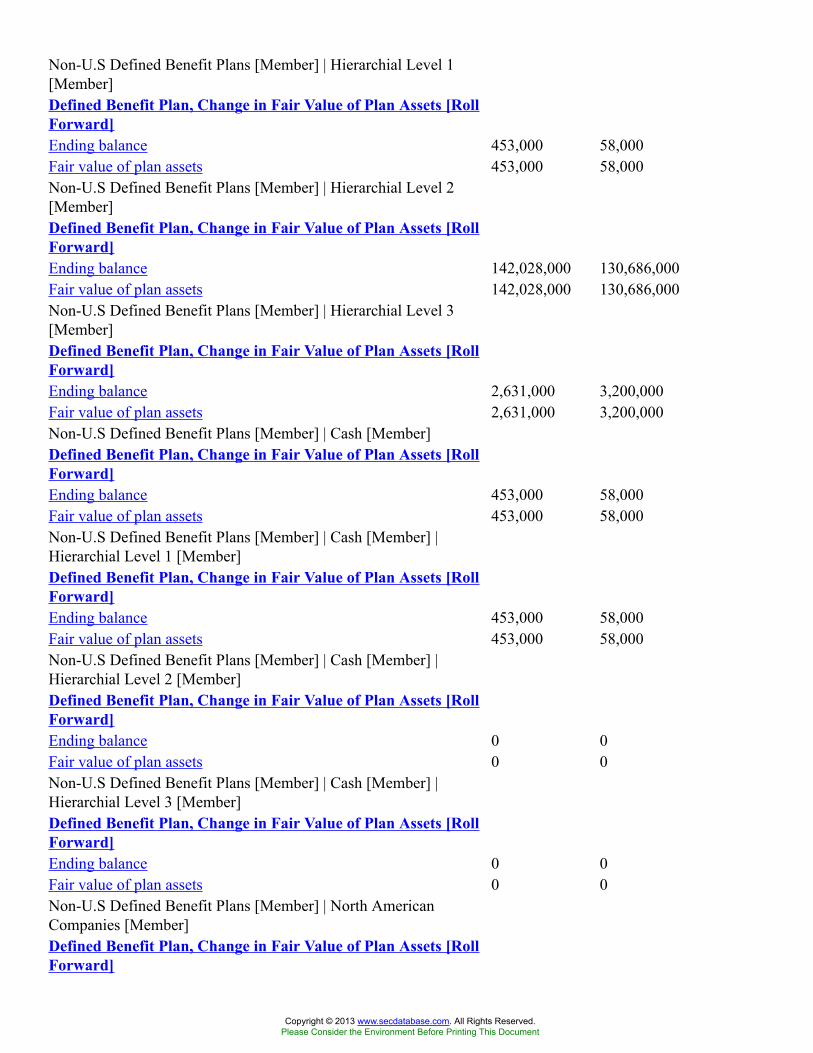
Non-U.S Defined Benefit Plans [Member] | Hierarchial Level 1[Member]Defined Benefit Plan, Change in Fair Value of Plan Assets [RollForward]Ending balance 453,000 58,000Fair value of plan assets 453,000 58,000Non-U.S Defined Benefit Plans [Member] | Hierarchial Level 2[Member]Defined Benefit Plan, Change in Fair Value of Plan Assets [RollForward]Ending balance 142,028,000 130,686,000Fair value of plan assets 142,028,000 130,686,000Non-U.S Defined Benefit Plans [Member] | Hierarchial Level 3[Member]Defined Benefit Plan, Change in Fair Value of Plan Assets [RollForward]Ending balance 2,631,000 3,200,000Fair value of plan assets 2,631,000 3,200,000Non-U.S Defined Benefit Plans [Member] | Cash [Member]Defined Benefit Plan, Change in Fair Value of Plan Assets [RollForward]Ending balance 453,000 58,000Fair value of plan assets 453,000 58,000Non-U.S Defined Benefit Plans [Member] | Cash [Member] |Hierarchial Level 1 [Member]Defined Benefit Plan, Change in Fair Value of Plan Assets [RollForward]Ending balance 453,000 58,000Fair value of plan assets 453,000 58,000Non-U.S Defined Benefit Plans [Member] | Cash [Member] |Hierarchial Level 2 [Member]Defined Benefit Plan, Change in Fair Value of Plan Assets [RollForward]Ending balance 0 0Fair value of plan assets 0 0Non-U.S Defined Benefit Plans [Member] | Cash [Member] |Hierarchial Level 3 [Member]Defined Benefit Plan, Change in Fair Value of Plan Assets [RollForward]Ending balance 0 0Fair value of plan assets 0 0Non-U.S Defined Benefit Plans [Member] | North AmericanCompanies [Member]Defined Benefit Plan, Change in Fair Value of Plan Assets [RollForward]
Copyright © 2013 www.secdatabase.com. All Rights Reserved.Please Consider the Environment Before Printing This Document
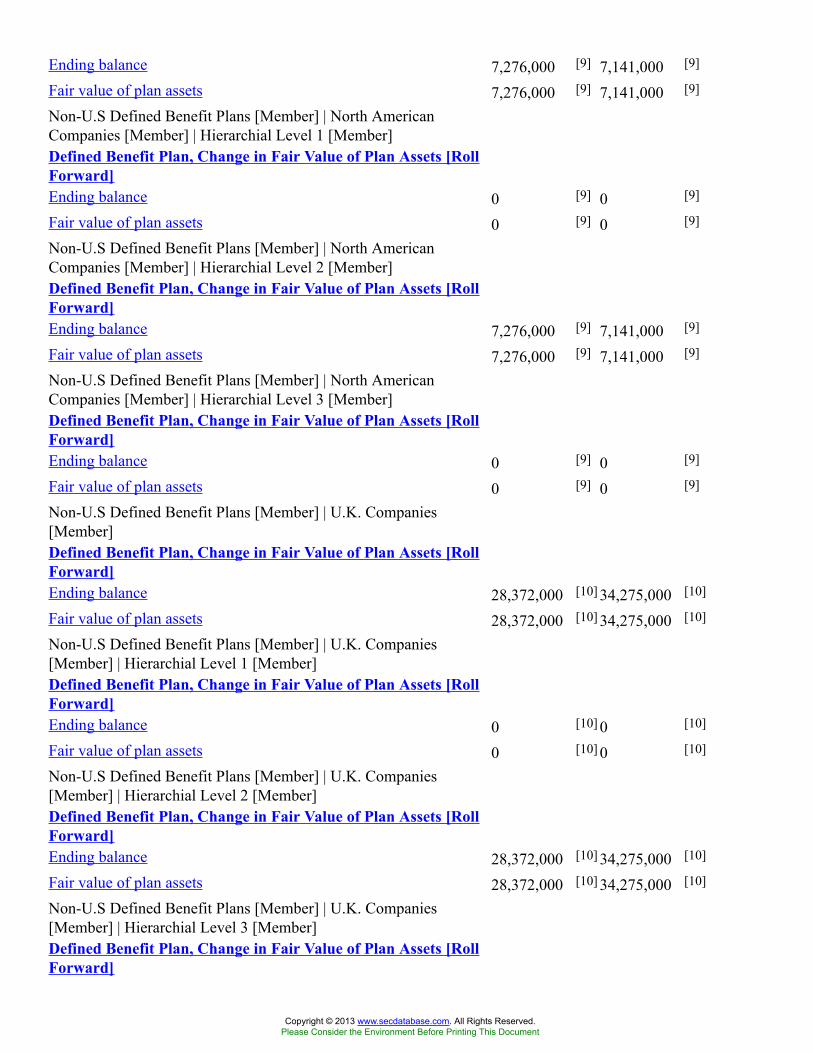
Ending balance 7,276,000 [9] 7,141,000 [9]
Fair value of plan assets 7,276,000 [9] 7,141,000 [9]
Non-U.S Defined Benefit Plans [Member] | North AmericanCompanies [Member] | Hierarchial Level 1 [Member]Defined Benefit Plan, Change in Fair Value of Plan Assets [RollForward]Ending balance 0 [9] 0 [9]
Fair value of plan assets 0 [9] 0 [9]
Non-U.S Defined Benefit Plans [Member] | North AmericanCompanies [Member] | Hierarchial Level 2 [Member]Defined Benefit Plan, Change in Fair Value of Plan Assets [RollForward]Ending balance 7,276,000 [9] 7,141,000 [9]
Fair value of plan assets 7,276,000 [9] 7,141,000 [9]
Non-U.S Defined Benefit Plans [Member] | North AmericanCompanies [Member] | Hierarchial Level 3 [Member]Defined Benefit Plan, Change in Fair Value of Plan Assets [RollForward]Ending balance 0 [9] 0 [9]
Fair value of plan assets 0 [9] 0 [9]
Non-U.S Defined Benefit Plans [Member] | U.K. Companies[Member]Defined Benefit Plan, Change in Fair Value of Plan Assets [RollForward]Ending balance 28,372,000 [10] 34,275,000 [10]
Fair value of plan assets 28,372,000 [10] 34,275,000 [10]
Non-U.S Defined Benefit Plans [Member] | U.K. Companies[Member] | Hierarchial Level 1 [Member]Defined Benefit Plan, Change in Fair Value of Plan Assets [RollForward]Ending balance 0 [10] 0 [10]
Fair value of plan assets 0 [10] 0 [10]
Non-U.S Defined Benefit Plans [Member] | U.K. Companies[Member] | Hierarchial Level 2 [Member]Defined Benefit Plan, Change in Fair Value of Plan Assets [RollForward]Ending balance 28,372,000 [10] 34,275,000 [10]
Fair value of plan assets 28,372,000 [10] 34,275,000 [10]
Non-U.S Defined Benefit Plans [Member] | U.K. Companies[Member] | Hierarchial Level 3 [Member]Defined Benefit Plan, Change in Fair Value of Plan Assets [RollForward]
Copyright © 2013 www.secdatabase.com. All Rights Reserved.Please Consider the Environment Before Printing This Document
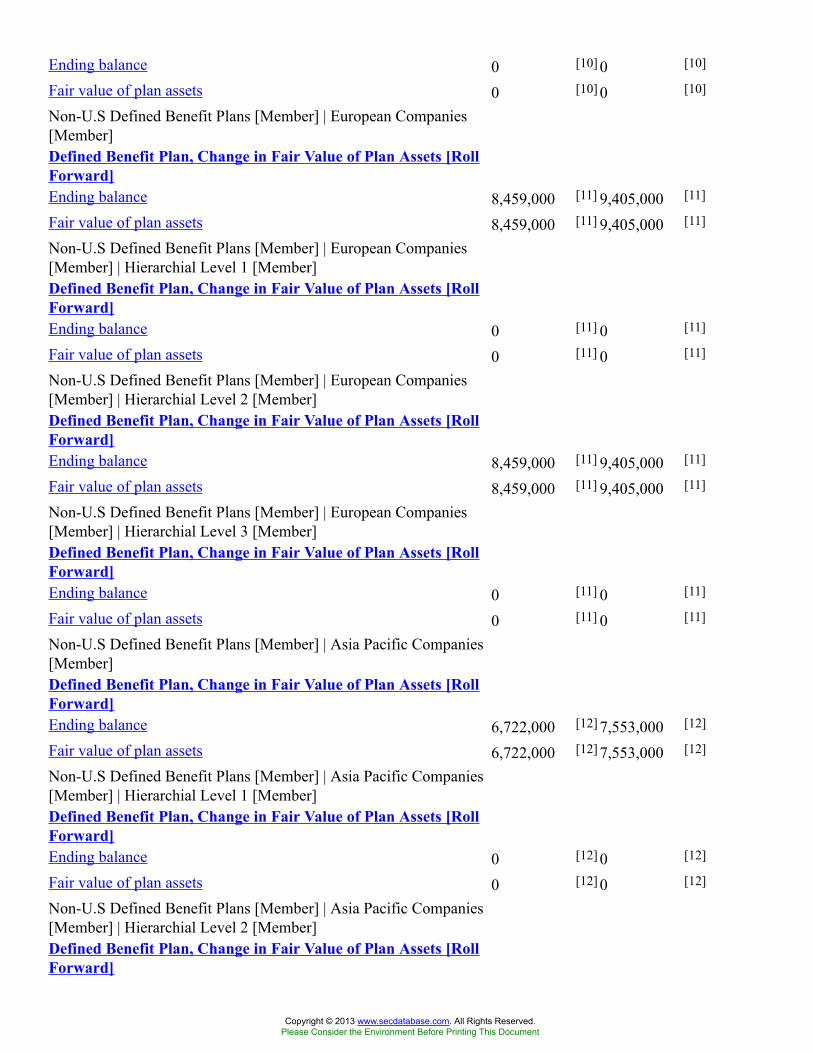
Ending balance 0 [10] 0 [10]
Fair value of plan assets 0 [10] 0 [10]
Non-U.S Defined Benefit Plans [Member] | European Companies[Member]Defined Benefit Plan, Change in Fair Value of Plan Assets [RollForward]Ending balance 8,459,000 [11] 9,405,000 [11]
Fair value of plan assets 8,459,000 [11] 9,405,000 [11]
Non-U.S Defined Benefit Plans [Member] | European Companies[Member] | Hierarchial Level 1 [Member]Defined Benefit Plan, Change in Fair Value of Plan Assets [RollForward]Ending balance 0 [11] 0 [11]
Fair value of plan assets 0 [11] 0 [11]
Non-U.S Defined Benefit Plans [Member] | European Companies[Member] | Hierarchial Level 2 [Member]Defined Benefit Plan, Change in Fair Value of Plan Assets [RollForward]Ending balance 8,459,000 [11] 9,405,000 [11]
Fair value of plan assets 8,459,000 [11] 9,405,000 [11]
Non-U.S Defined Benefit Plans [Member] | European Companies[Member] | Hierarchial Level 3 [Member]Defined Benefit Plan, Change in Fair Value of Plan Assets [RollForward]Ending balance 0 [11] 0 [11]
Fair value of plan assets 0 [11] 0 [11]
Non-U.S Defined Benefit Plans [Member] | Asia Pacific Companies[Member]Defined Benefit Plan, Change in Fair Value of Plan Assets [RollForward]Ending balance 6,722,000 [12] 7,553,000 [12]
Fair value of plan assets 6,722,000 [12] 7,553,000 [12]
Non-U.S Defined Benefit Plans [Member] | Asia Pacific Companies[Member] | Hierarchial Level 1 [Member]Defined Benefit Plan, Change in Fair Value of Plan Assets [RollForward]Ending balance 0 [12] 0 [12]
Fair value of plan assets 0 [12] 0 [12]
Non-U.S Defined Benefit Plans [Member] | Asia Pacific Companies[Member] | Hierarchial Level 2 [Member]Defined Benefit Plan, Change in Fair Value of Plan Assets [RollForward]
Copyright © 2013 www.secdatabase.com. All Rights Reserved.Please Consider the Environment Before Printing This Document
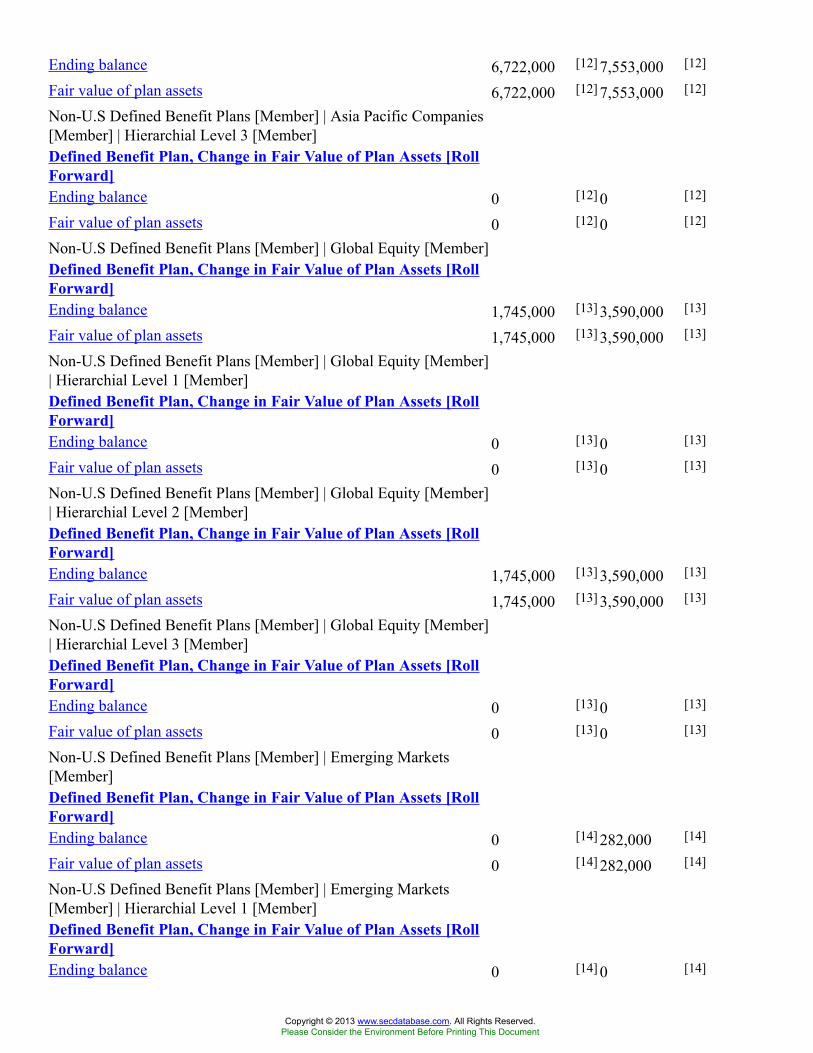
Ending balance 6,722,000 [12] 7,553,000 [12]
Fair value of plan assets 6,722,000 [12] 7,553,000 [12]
Non-U.S Defined Benefit Plans [Member] | Asia Pacific Companies[Member] | Hierarchial Level 3 [Member]Defined Benefit Plan, Change in Fair Value of Plan Assets [RollForward]Ending balance 0 [12] 0 [12]
Fair value of plan assets 0 [12] 0 [12]
Non-U.S Defined Benefit Plans [Member] | Global Equity [Member]Defined Benefit Plan, Change in Fair Value of Plan Assets [RollForward]Ending balance 1,745,000 [13] 3,590,000 [13]
Fair value of plan assets 1,745,000 [13] 3,590,000 [13]
Non-U.S Defined Benefit Plans [Member] | Global Equity [Member]| Hierarchial Level 1 [Member]Defined Benefit Plan, Change in Fair Value of Plan Assets [RollForward]Ending balance 0 [13] 0 [13]
Fair value of plan assets 0 [13] 0 [13]
Non-U.S Defined Benefit Plans [Member] | Global Equity [Member]| Hierarchial Level 2 [Member]Defined Benefit Plan, Change in Fair Value of Plan Assets [RollForward]Ending balance 1,745,000 [13] 3,590,000 [13]
Fair value of plan assets 1,745,000 [13] 3,590,000 [13]
Non-U.S Defined Benefit Plans [Member] | Global Equity [Member]| Hierarchial Level 3 [Member]Defined Benefit Plan, Change in Fair Value of Plan Assets [RollForward]Ending balance 0 [13] 0 [13]
Fair value of plan assets 0 [13] 0 [13]
Non-U.S Defined Benefit Plans [Member] | Emerging Markets[Member]Defined Benefit Plan, Change in Fair Value of Plan Assets [RollForward]Ending balance 0 [14] 282,000 [14]
Fair value of plan assets 0 [14] 282,000 [14]
Non-U.S Defined Benefit Plans [Member] | Emerging Markets[Member] | Hierarchial Level 1 [Member]Defined Benefit Plan, Change in Fair Value of Plan Assets [RollForward]Ending balance 0 [14] 0 [14]
Copyright © 2013 www.secdatabase.com. All Rights Reserved.Please Consider the Environment Before Printing This Document
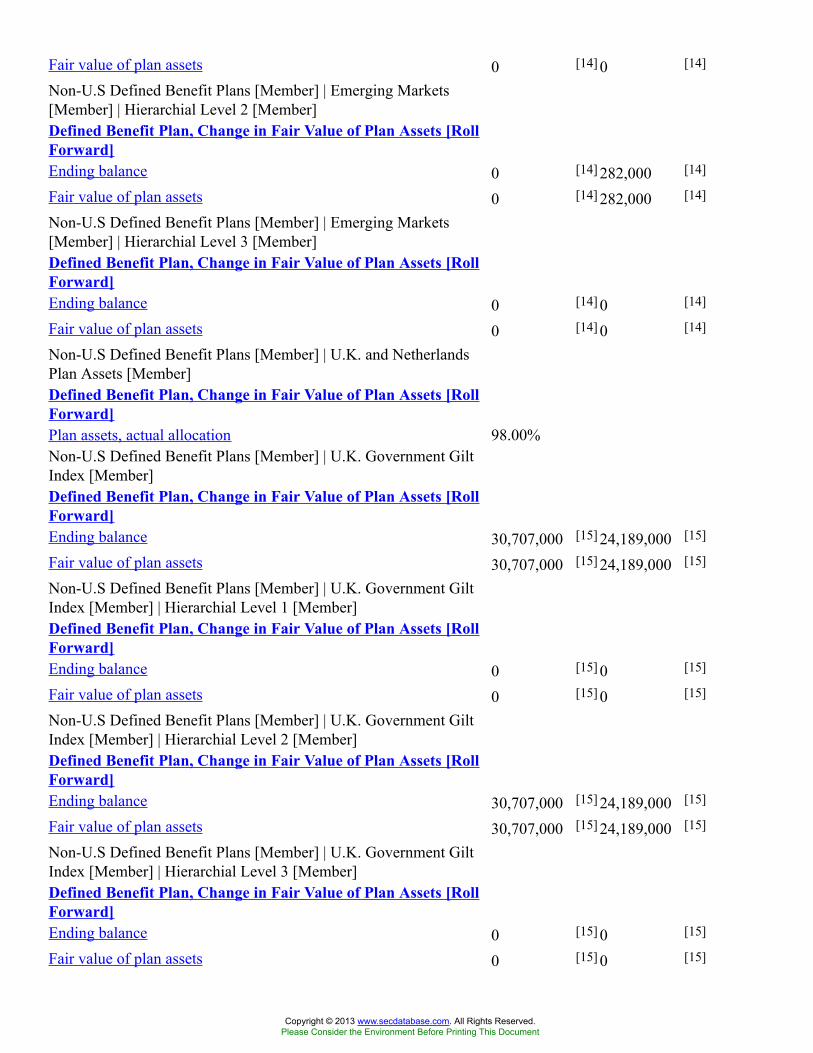
Fair value of plan assets 0 [14] 0 [14]
Non-U.S Defined Benefit Plans [Member] | Emerging Markets[Member] | Hierarchial Level 2 [Member]Defined Benefit Plan, Change in Fair Value of Plan Assets [RollForward]Ending balance 0 [14] 282,000 [14]
Fair value of plan assets 0 [14] 282,000 [14]
Non-U.S Defined Benefit Plans [Member] | Emerging Markets[Member] | Hierarchial Level 3 [Member]Defined Benefit Plan, Change in Fair Value of Plan Assets [RollForward]Ending balance 0 [14] 0 [14]
Fair value of plan assets 0 [14] 0 [14]
Non-U.S Defined Benefit Plans [Member] | U.K. and NetherlandsPlan Assets [Member]Defined Benefit Plan, Change in Fair Value of Plan Assets [RollForward]Plan assets, actual allocation 98.00%Non-U.S Defined Benefit Plans [Member] | U.K. Government GiltIndex [Member]Defined Benefit Plan, Change in Fair Value of Plan Assets [RollForward]Ending balance 30,707,000 [15] 24,189,000 [15]
Fair value of plan assets 30,707,000 [15] 24,189,000 [15]
Non-U.S Defined Benefit Plans [Member] | U.K. Government GiltIndex [Member] | Hierarchial Level 1 [Member]Defined Benefit Plan, Change in Fair Value of Plan Assets [RollForward]Ending balance 0 [15] 0 [15]
Fair value of plan assets 0 [15] 0 [15]
Non-U.S Defined Benefit Plans [Member] | U.K. Government GiltIndex [Member] | Hierarchial Level 2 [Member]Defined Benefit Plan, Change in Fair Value of Plan Assets [RollForward]Ending balance 30,707,000 [15] 24,189,000 [15]
Fair value of plan assets 30,707,000 [15] 24,189,000 [15]
Non-U.S Defined Benefit Plans [Member] | U.K. Government GiltIndex [Member] | Hierarchial Level 3 [Member]Defined Benefit Plan, Change in Fair Value of Plan Assets [RollForward]Ending balance 0 [15] 0 [15]
Fair value of plan assets 0 [15] 0 [15]
Copyright © 2013 www.secdatabase.com. All Rights Reserved.Please Consider the Environment Before Printing This Document
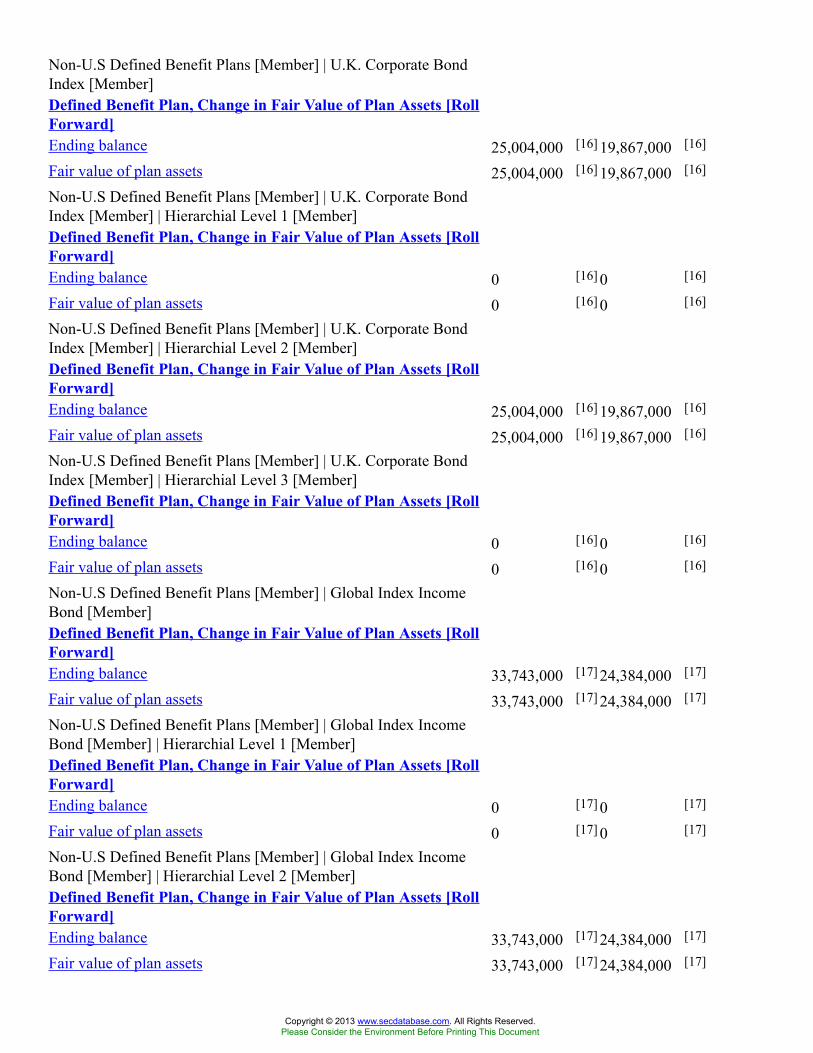
Non-U.S Defined Benefit Plans [Member] | U.K. Corporate BondIndex [Member]Defined Benefit Plan, Change in Fair Value of Plan Assets [RollForward]Ending balance 25,004,000 [16] 19,867,000 [16]
Fair value of plan assets 25,004,000 [16] 19,867,000 [16]
Non-U.S Defined Benefit Plans [Member] | U.K. Corporate BondIndex [Member] | Hierarchial Level 1 [Member]Defined Benefit Plan, Change in Fair Value of Plan Assets [RollForward]Ending balance 0 [16] 0 [16]
Fair value of plan assets 0 [16] 0 [16]
Non-U.S Defined Benefit Plans [Member] | U.K. Corporate BondIndex [Member] | Hierarchial Level 2 [Member]Defined Benefit Plan, Change in Fair Value of Plan Assets [RollForward]Ending balance 25,004,000 [16] 19,867,000 [16]
Fair value of plan assets 25,004,000 [16] 19,867,000 [16]
Non-U.S Defined Benefit Plans [Member] | U.K. Corporate BondIndex [Member] | Hierarchial Level 3 [Member]Defined Benefit Plan, Change in Fair Value of Plan Assets [RollForward]Ending balance 0 [16] 0 [16]
Fair value of plan assets 0 [16] 0 [16]
Non-U.S Defined Benefit Plans [Member] | Global Index IncomeBond [Member]Defined Benefit Plan, Change in Fair Value of Plan Assets [RollForward]Ending balance 33,743,000 [17] 24,384,000 [17]
Fair value of plan assets 33,743,000 [17] 24,384,000 [17]
Non-U.S Defined Benefit Plans [Member] | Global Index IncomeBond [Member] | Hierarchial Level 1 [Member]Defined Benefit Plan, Change in Fair Value of Plan Assets [RollForward]Ending balance 0 [17] 0 [17]
Fair value of plan assets 0 [17] 0 [17]
Non-U.S Defined Benefit Plans [Member] | Global Index IncomeBond [Member] | Hierarchial Level 2 [Member]Defined Benefit Plan, Change in Fair Value of Plan Assets [RollForward]Ending balance 33,743,000 [17] 24,384,000 [17]
Fair value of plan assets 33,743,000 [17] 24,384,000 [17]
Copyright © 2013 www.secdatabase.com. All Rights Reserved.Please Consider the Environment Before Printing This Document
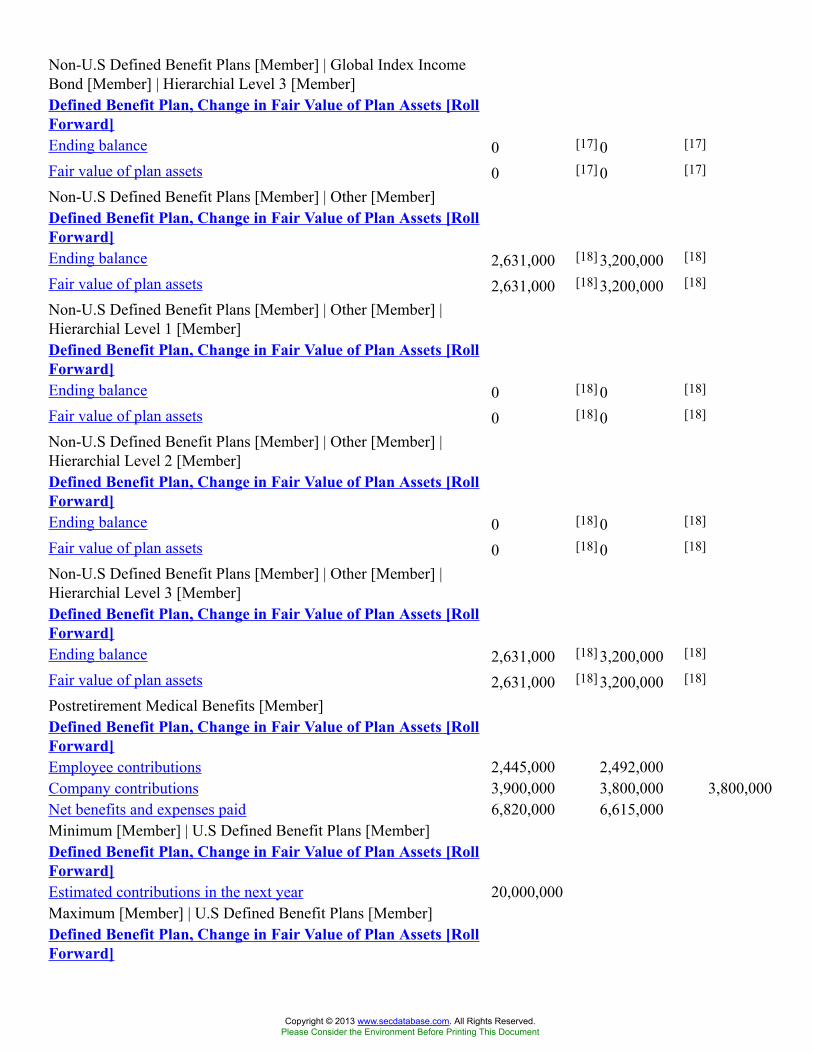
Non-U.S Defined Benefit Plans [Member] | Global Index IncomeBond [Member] | Hierarchial Level 3 [Member]Defined Benefit Plan, Change in Fair Value of Plan Assets [RollForward]Ending balance 0 [17] 0 [17]
Fair value of plan assets 0 [17] 0 [17]
Non-U.S Defined Benefit Plans [Member] | Other [Member]Defined Benefit Plan, Change in Fair Value of Plan Assets [RollForward]Ending balance 2,631,000 [18] 3,200,000 [18]
Fair value of plan assets 2,631,000 [18] 3,200,000 [18]
Non-U.S Defined Benefit Plans [Member] | Other [Member] |Hierarchial Level 1 [Member]Defined Benefit Plan, Change in Fair Value of Plan Assets [RollForward]Ending balance 0 [18] 0 [18]
Fair value of plan assets 0 [18] 0 [18]
Non-U.S Defined Benefit Plans [Member] | Other [Member] |Hierarchial Level 2 [Member]Defined Benefit Plan, Change in Fair Value of Plan Assets [RollForward]Ending balance 0 [18] 0 [18]
Fair value of plan assets 0 [18] 0 [18]
Non-U.S Defined Benefit Plans [Member] | Other [Member] |Hierarchial Level 3 [Member]Defined Benefit Plan, Change in Fair Value of Plan Assets [RollForward]Ending balance 2,631,000 [18] 3,200,000 [18]
Fair value of plan assets 2,631,000 [18] 3,200,000 [18]
Postretirement Medical Benefits [Member]Defined Benefit Plan, Change in Fair Value of Plan Assets [RollForward]Employee contributions 2,445,000 2,492,000Company contributions 3,900,000 3,800,000 3,800,000Net benefits and expenses paid 6,820,000 6,615,000Minimum [Member] | U.S Defined Benefit Plans [Member]Defined Benefit Plan, Change in Fair Value of Plan Assets [RollForward]Estimated contributions in the next year 20,000,000Maximum [Member] | U.S Defined Benefit Plans [Member]Defined Benefit Plan, Change in Fair Value of Plan Assets [RollForward]
Copyright © 2013 www.secdatabase.com. All Rights Reserved.Please Consider the Environment Before Printing This Document
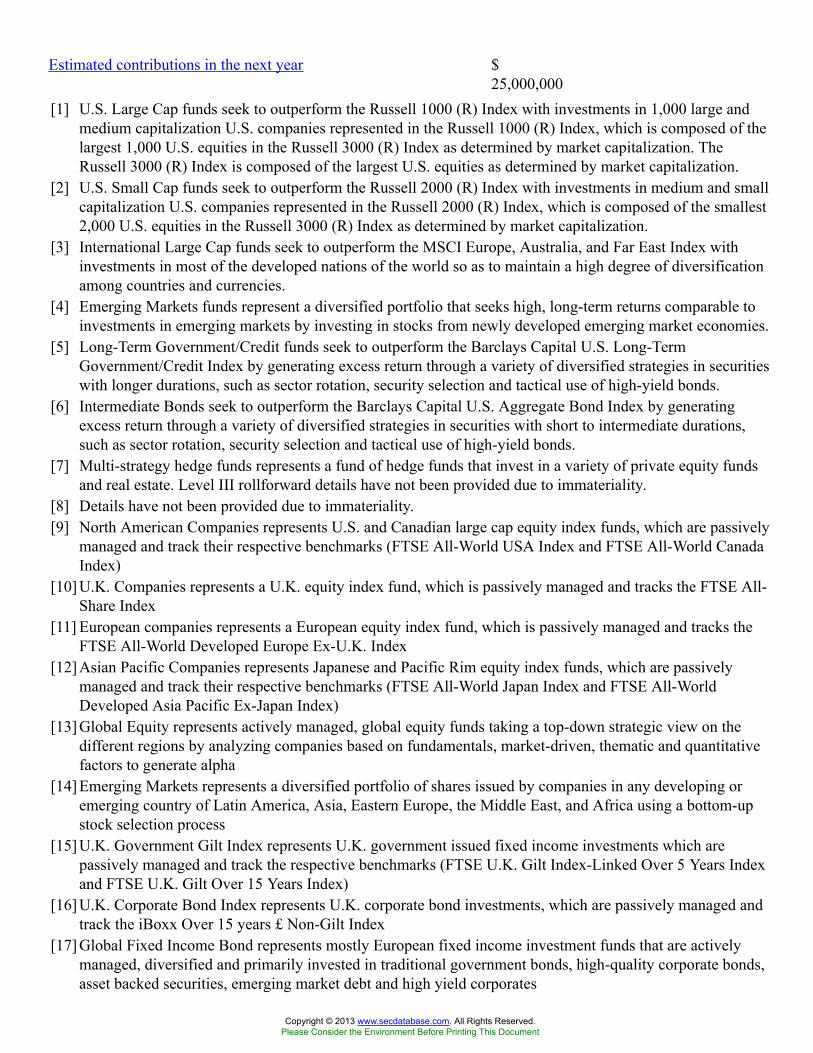
Estimated contributions in the next year $25,000,000
[1] U.S. Large Cap funds seek to outperform the Russell 1000 (R) Index with investments in 1,000 large andmedium capitalization U.S. companies represented in the Russell 1000 (R) Index, which is composed of thelargest 1,000 U.S. equities in the Russell 3000 (R) Index as determined by market capitalization. TheRussell 3000 (R) Index is composed of the largest U.S. equities as determined by market capitalization.
[2] U.S. Small Cap funds seek to outperform the Russell 2000 (R) Index with investments in medium and smallcapitalization U.S. companies represented in the Russell 2000 (R) Index, which is composed of the smallest2,000 U.S. equities in the Russell 3000 (R) Index as determined by market capitalization.
[3] International Large Cap funds seek to outperform the MSCI Europe, Australia, and Far East Index withinvestments in most of the developed nations of the world so as to maintain a high degree of diversificationamong countries and currencies.
[4] Emerging Markets funds represent a diversified portfolio that seeks high, long-term returns comparable toinvestments in emerging markets by investing in stocks from newly developed emerging market economies.
[5] Long-Term Government/Credit funds seek to outperform the Barclays Capital U.S. Long-TermGovernment/Credit Index by generating excess return through a variety of diversified strategies in securitieswith longer durations, such as sector rotation, security selection and tactical use of high-yield bonds.
[6] Intermediate Bonds seek to outperform the Barclays Capital U.S. Aggregate Bond Index by generatingexcess return through a variety of diversified strategies in securities with short to intermediate durations,such as sector rotation, security selection and tactical use of high-yield bonds.
[7] Multi-strategy hedge funds represents a fund of hedge funds that invest in a variety of private equity fundsand real estate. Level III rollforward details have not been provided due to immateriality.
[8] Details have not been provided due to immateriality.[9] North American Companies represents U.S. and Canadian large cap equity index funds, which are passively
managed and track their respective benchmarks (FTSE All-World USA Index and FTSE All-World CanadaIndex)
[10] U.K. Companies represents a U.K. equity index fund, which is passively managed and tracks the FTSE All-Share Index
[11] European companies represents a European equity index fund, which is passively managed and tracks theFTSE All-World Developed Europe Ex-U.K. Index
[12] Asian Pacific Companies represents Japanese and Pacific Rim equity index funds, which are passivelymanaged and track their respective benchmarks (FTSE All-World Japan Index and FTSE All-WorldDeveloped Asia Pacific Ex-Japan Index)
[13] Global Equity represents actively managed, global equity funds taking a top-down strategic view on thedifferent regions by analyzing companies based on fundamentals, market-driven, thematic and quantitativefactors to generate alpha
[14] Emerging Markets represents a diversified portfolio of shares issued by companies in any developing oremerging country of Latin America, Asia, Eastern Europe, the Middle East, and Africa using a bottom-upstock selection process
[15] U.K. Government Gilt Index represents U.K. government issued fixed income investments which arepassively managed and track the respective benchmarks (FTSE U.K. Gilt Index-Linked Over 5 Years Indexand FTSE U.K. Gilt Over 15 Years Index)
[16] U.K. Corporate Bond Index represents U.K. corporate bond investments, which are passively managed andtrack the iBoxx Over 15 years £ Non-Gilt Index
[17] Global Fixed Income Bond represents mostly European fixed income investment funds that are activelymanaged, diversified and primarily invested in traditional government bonds, high-quality corporate bonds,asset backed securities, emerging market debt and high yield corporates
Copyright © 2013 www.secdatabase.com. All Rights Reserved.Please Consider the Environment Before Printing This Document

[18] Includes assets held by plans outside the U.K. and The Netherlands. Details, including Level III rollforwarddetails, have not been provided due to immateriality
Copyright © 2013 www.secdatabase.com. All Rights Reserved.Please Consider the Environment Before Printing This Document
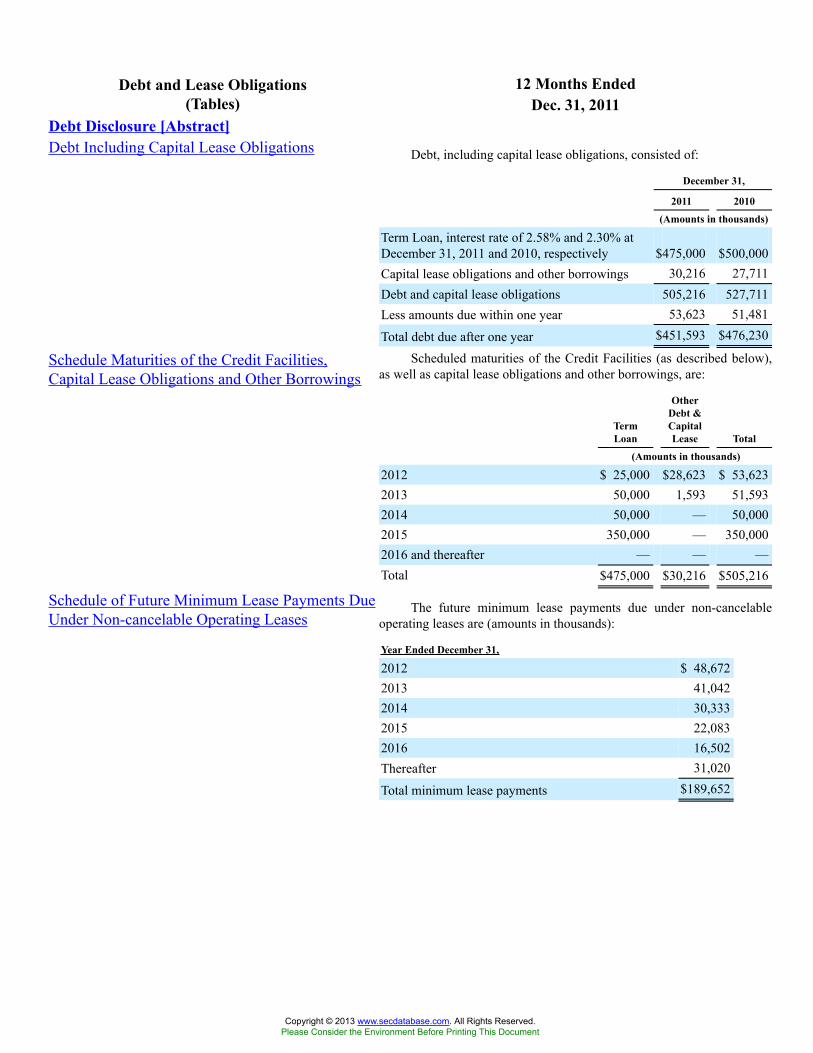
12 Months EndedDebt and Lease Obligations(Tables) Dec. 31, 2011
Debt Disclosure [Abstract]Debt Including Capital Lease Obligations Debt, including capital lease obligations, consisted of:
December 31,
2011 2010
(Amounts in thousands)
Term Loan, interest rate of 2.58% and 2.30% atDecember 31, 2011 and 2010, respectively $475,000 $500,000Capital lease obligations and other borrowings 30,216 27,711Debt and capital lease obligations 505,216 527,711Less amounts due within one year 53,623 51,481
Total debt due after one year $451,593 $476,230
Schedule Maturities of the Credit Facilities,Capital Lease Obligations and Other Borrowings
Scheduled maturities of the Credit Facilities (as described below),as well as capital lease obligations and other borrowings, are:
TermLoan
OtherDebt &CapitalLease Total
(Amounts in thousands)
2012 $ 25,000 $28,623 $ 53,6232013 50,000 1,593 51,5932014 50,000 — 50,0002015 350,000 — 350,0002016 and thereafter — — —Total $475,000 $30,216 $505,216
Schedule of Future Minimum Lease Payments DueUnder Non-cancelable Operating Leases
The future minimum lease payments due under non-cancelableoperating leases are (amounts in thousands):
Year Ended December 31,
2012 $ 48,6722013 41,0422014 30,3332015 22,0832016 16,502Thereafter 31,020
Total minimum lease payments $189,652
Copyright © 2013 www.secdatabase.com. All Rights Reserved.Please Consider the Environment Before Printing This Document
12 Months EndedPension and PostretirementBenefits Dec. 31, 2011
Compensation andRetirement Disclosure[Abstract]Retirement and PostretirementBenefits
PENSION AND POSTRETIREMENT BENEFITS
We sponsor several noncontributory defined benefit pension plans, covering substantiallyall U.S. employees and certain non-U.S. employees, which provide benefits based on years ofservice, age, job grade levels and type of compensation. Retirement benefits for all other coveredemployees are provided through contributory pension plans, cash balance pension plans andgovernment-sponsored retirement programs. All funded defined benefit pension plans receivefunding based on independent actuarial valuations to provide for current service and an amountsufficient to amortize unfunded prior service over periods not to exceed 30 years, with fundingfalling within the legal limits prescribed by prevailing regulation. We also maintain unfundeddefined benefit plans that, as permitted by local regulations, receive funding only when benefitsbecome due.
Our defined benefit plan strategy is to ensure that current and future benefit obligations areadequately funded in a cost-effective manner. Additionally, our investing objective is to achievethe highest level of investment performance that is compatible with our risk tolerance and prudentinvestment practices. Because of the long-term nature of our defined benefit plan liabilities, ourfunding strategy is based on a long-term perspective for formulating and implementing investmentpolicies and evaluating their investment performance.
The asset allocation of our defined benefit plans reflect our decision about the proportion ofthe investment in equity and fixed income securities, and, where appropriate, the various sub-assetclasses of each. At least annually, we complete a comprehensive review of our asset allocationpolicy and the underlying assumptions, which includes our long-term capital markets rate of returnassumptions and our risk tolerances relative to our defined benefit plan liabilities.
The expected rates of return on defined benefit plan assets are derived from review of theasset allocation strategy, expected long-term performance of asset classes, risks and other factorsadjusted for our specific investment strategy. These rates are impacted by changes in generalmarket conditions, but because they are long-term in nature, short-term market changes do notsignificantly impact the rates.
Our U.S. defined benefit plan assets consist of a balanced portfolio of U.S. equity and fixedincome securities. Our non-U.S. defined benefit plan assets include a significant concentration ofUnited Kingdom ("U.K.") equity and fixed income securities. We monitor investment allocationsand manage plan assets to maintain acceptable levels of risk. In addition, certain of our definedbenefit plans hold investments in European equity and fixed income securities.
For all periods presented, we used a measurement date of December 31 for all of ourworldwide pension and postretirement medical plans.
U.S. Defined Benefit Plans — We maintain qualified and non-qualified defined benefitpension plans in the U.S. The qualified plan provides coverage for substantially all full-timeU.S. employees who receive benefits, up to an earnings threshold specified by the U.S. Departmentof Labor. The non-qualified plans primarily cover a small number of employees including currentand former members of senior management, providing them with benefit levels equivalent to otherparticipants, but that are otherwise limited by U.S. Department of Labor rules. The U.S. plans aredesigned to operate as "cash balance" arrangements, under which the employee has the option totake a lump sum payment at the end of their service. The total accumulated benefit obligation isequivalent to the total projected benefit obligation ("Benefit Obligation").
The following are assumptions related to the U.S. defined benefit pension plans:
Year Ended December 31,
2011 2010 2009
Copyright © 2013 www.secdatabase.com. All Rights Reserved.Please Consider the Environment Before Printing This Document

Weighted average assumptions used to determineBenefit Obligations:
Discount rate 4.50% 5.00% 5.50%Rate of increase in compensation levels 4.25 4.25 4.80
Weighted average assumptions used to determine netpension expense:
Long-term rate of return on assets 6.25% 7.00% 7.75%Discount rate 5.00 5.50 6.75Rate of increase in compensation levels 4.25 4.80 4.80
At December 31, 2011 as compared to December 31, 2010, we decreased our discount ratefrom 5.00% to 4.50% based on an analysis of publicly-traded investment grade U.S. corporatebonds, which had a lower yield due to current market conditions. At December 31, 2011 ascompared to December 31, 2010 our average assumed rate of compensation remained constantat 4.25%. In determining 2011 expense, we decreased the expected rate of return on assets from7.00% to 6.25%, primarily based on our target allocations and expected long-term asset returns.The long-term rate of return assumption is calculated using a quantitative approach that utilizesunadjusted historical returns and asset allocation as inputs for the calculation.
Net pension expense for the U.S. defined benefit pension plans (including both qualified andnon-qualified plans) was:
Year Ended December 31,
2011 2010 2009
(Amounts in thousands)
Service cost $ 19,754 $ 20,460 $ 18,471Interest cost 17,217 17,941 19,247Expected return on plan assets (21,692) (24,066) (22,152)Settlement and curtailment of benefits — 757 —Amortization of unrecognized prior service benefit (1,238) (1,239) (1,259)Amortization of unrecognized net loss 10,784 9,492 6,502
U.S. net pension expense $ 24,825 $ 23,345 $ 20,809
The estimated prior service benefit for the defined benefit pension plans that will beamortized from accumulated other comprehensive loss into U.S. pension expense in 2012 is$1.2 million. The estimated net loss for the defined benefit pension plans that will be amortizedfrom accumulated other comprehensive loss into U.S. pension expense in 2012 is $12.3 million.We amortize estimated prior service benefits and estimated net losses over the remaining expectedservice period.
The following summarizes the net pension liability for U.S. plans:
December 31,
2011 2010
(Amounts in thousands)
Plan assets, at fair value $ 349,986 $ 345,710Benefit Obligation (387,131) (361,766)
Funded status $ (37,145) $ (16,056)
The following summarizes amounts recognized in the balance sheet for U.S. plans:
Copyright © 2013 www.secdatabase.com. All Rights Reserved.Please Consider the Environment Before Printing This Document

December 31,
2011 2010
(Amounts in thousands)
Current liabilities $ (346) $ (343)Noncurrent liabilities (36,799) (15,713)
Funded status $ (37,145) $ (16,056)
The following is a summary of the changes in the U.S. defined benefit plans’ pensionobligations:
2011 2010
(Amounts in thousands)
Balance — January 1 $ 361,766 $ 345,981Service cost 19,754 20,460Interest cost 17,217 17,941Settlements, plan amendments and other — (3,148)Actuarial loss 14,455 7,846Benefits paid (26,061) (27,314)
Balance — December 31 $ 387,131 $ 361,766
Accumulated benefit obligations at December 31 $ 387,131 $ 361,766
The following table summarizes the expected cash benefit payments for the U.S. definedbenefit pension plans in the future (amounts in millions):
2012 $ 32.62013 34.12014 34.82015 35.82016 35.52017-2021 195.7
The following table shows the change in accumulated other comprehensive loss attributableto the components of the net cost and the change in Benefit Obligations for U.S. plans, net of tax:
2011 2010 2009
(Amounts in thousands)
Balance — January 1 $ (95,258) $ (103,946) $ (108,104)Amortization of net loss 6,718 6,063 4,280Amortization of prior service benefit (771) (791) (829)Net (loss) gain arising during the year (9,434) 3,509 773New prior service cost arising during the year — (93) (66)
Balance — December 31 $ (98,745) $ (95,258) $ (103,946)
Amounts recorded in accumulated other comprehensive loss consist of:
December 31,
2011 2010
Copyright © 2013 www.secdatabase.com. All Rights Reserved.Please Consider the Environment Before Printing This Document
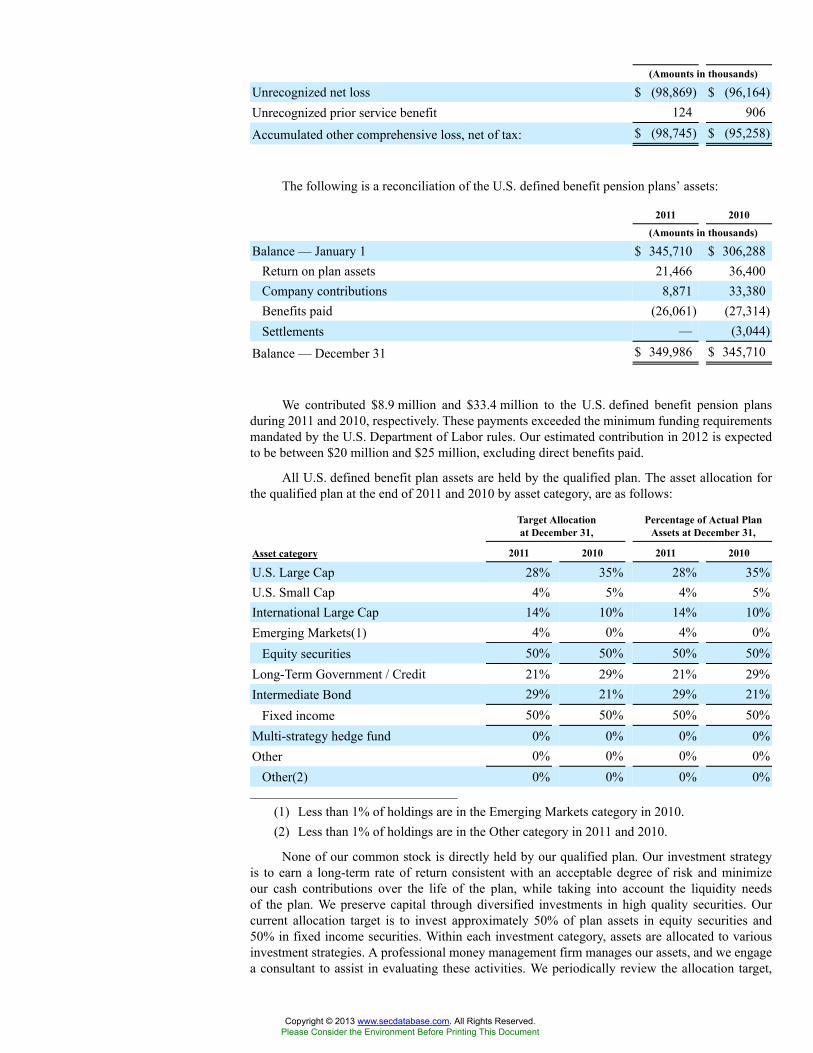
(Amounts in thousands)
Unrecognized net loss $ (98,869) $ (96,164)Unrecognized prior service benefit 124 906
Accumulated other comprehensive loss, net of tax: $ (98,745) $ (95,258)
The following is a reconciliation of the U.S. defined benefit pension plans’ assets:
2011 2010
(Amounts in thousands)
Balance — January 1 $ 345,710 $ 306,288Return on plan assets 21,466 36,400Company contributions 8,871 33,380Benefits paid (26,061) (27,314)Settlements — (3,044)
Balance — December 31 $ 349,986 $ 345,710
We contributed $8.9 million and $33.4 million to the U.S. defined benefit pension plansduring 2011 and 2010, respectively. These payments exceeded the minimum funding requirementsmandated by the U.S. Department of Labor rules. Our estimated contribution in 2012 is expectedto be between $20 million and $25 million, excluding direct benefits paid.
All U.S. defined benefit plan assets are held by the qualified plan. The asset allocation forthe qualified plan at the end of 2011 and 2010 by asset category, are as follows:
Target Allocationat December 31,
Percentage of Actual PlanAssets at December 31,
Asset category 2011 2010 2011 2010
U.S. Large Cap 28% 35% 28% 35%U.S. Small Cap 4% 5% 4% 5%International Large Cap 14% 10% 14% 10%Emerging Markets(1) 4% 0% 4% 0%
Equity securities 50% 50% 50% 50%Long-Term Government / Credit 21% 29% 21% 29%Intermediate Bond 29% 21% 29% 21%
Fixed income 50% 50% 50% 50%Multi-strategy hedge fund 0% 0% 0% 0%Other 0% 0% 0% 0%
Other(2) 0% 0% 0% 0%_______________________________________
(1) Less than 1% of holdings are in the Emerging Markets category in 2010.(2) Less than 1% of holdings are in the Other category in 2011 and 2010.
None of our common stock is directly held by our qualified plan. Our investment strategyis to earn a long-term rate of return consistent with an acceptable degree of risk and minimizeour cash contributions over the life of the plan, while taking into account the liquidity needsof the plan. We preserve capital through diversified investments in high quality securities. Ourcurrent allocation target is to invest approximately 50% of plan assets in equity securities and50% in fixed income securities. Within each investment category, assets are allocated to variousinvestment strategies. A professional money management firm manages our assets, and we engagea consultant to assist in evaluating these activities. We periodically review the allocation target,
Copyright © 2013 www.secdatabase.com. All Rights Reserved.Please Consider the Environment Before Printing This Document
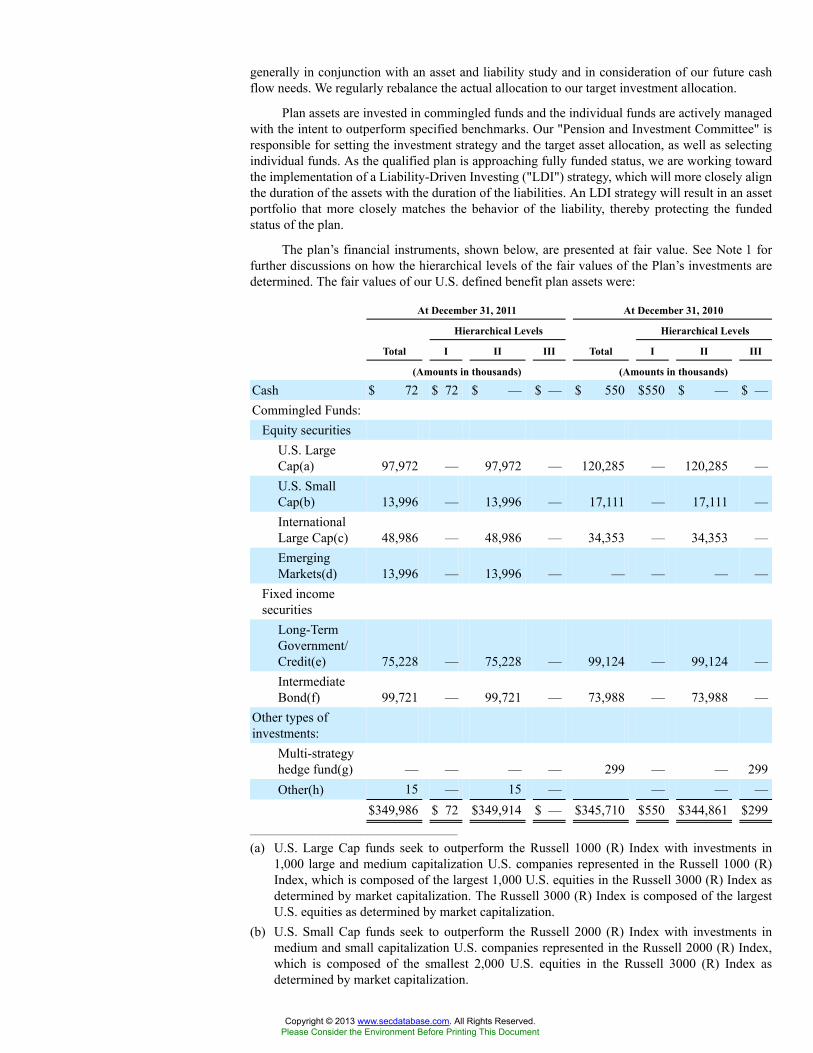
generally in conjunction with an asset and liability study and in consideration of our future cashflow needs. We regularly rebalance the actual allocation to our target investment allocation.
Plan assets are invested in commingled funds and the individual funds are actively managedwith the intent to outperform specified benchmarks. Our "Pension and Investment Committee" isresponsible for setting the investment strategy and the target asset allocation, as well as selectingindividual funds. As the qualified plan is approaching fully funded status, we are working towardthe implementation of a Liability-Driven Investing ("LDI") strategy, which will more closely alignthe duration of the assets with the duration of the liabilities. An LDI strategy will result in an assetportfolio that more closely matches the behavior of the liability, thereby protecting the fundedstatus of the plan.
The plan’s financial instruments, shown below, are presented at fair value. See Note 1 forfurther discussions on how the hierarchical levels of the fair values of the Plan’s investments aredetermined. The fair values of our U.S. defined benefit plan assets were:
At December 31, 2011 At December 31, 2010
Hierarchical Levels Hierarchical Levels
Total I II III Total I II III
(Amounts in thousands) (Amounts in thousands)
Cash $ 72 $ 72 $ — $ — $ 550 $550 $ — $ —Commingled Funds:
Equity securitiesU.S. LargeCap(a) 97,972 — 97,972 — 120,285 — 120,285 —U.S. SmallCap(b) 13,996 — 13,996 — 17,111 — 17,111 —InternationalLarge Cap(c) 48,986 — 48,986 — 34,353 — 34,353 —EmergingMarkets(d) 13,996 — 13,996 — — — — —
Fixed incomesecurities
Long-TermGovernment/Credit(e) 75,228 — 75,228 — 99,124 — 99,124 —IntermediateBond(f) 99,721 — 99,721 — 73,988 — 73,988 —
Other types ofinvestments:
Multi-strategyhedge fund(g) — — — — 299 — — 299Other(h) 15 — 15 — — — —
$349,986 $ 72 $349,914 $ — $345,710 $550 $344,861 $299_______________________________________
(a) U.S. Large Cap funds seek to outperform the Russell 1000 (R) Index with investments in1,000 large and medium capitalization U.S. companies represented in the Russell 1000 (R)Index, which is composed of the largest 1,000 U.S. equities in the Russell 3000 (R) Index asdetermined by market capitalization. The Russell 3000 (R) Index is composed of the largestU.S. equities as determined by market capitalization.
(b) U.S. Small Cap funds seek to outperform the Russell 2000 (R) Index with investments inmedium and small capitalization U.S. companies represented in the Russell 2000 (R) Index,which is composed of the smallest 2,000 U.S. equities in the Russell 3000 (R) Index asdetermined by market capitalization.
Copyright © 2013 www.secdatabase.com. All Rights Reserved.Please Consider the Environment Before Printing This Document
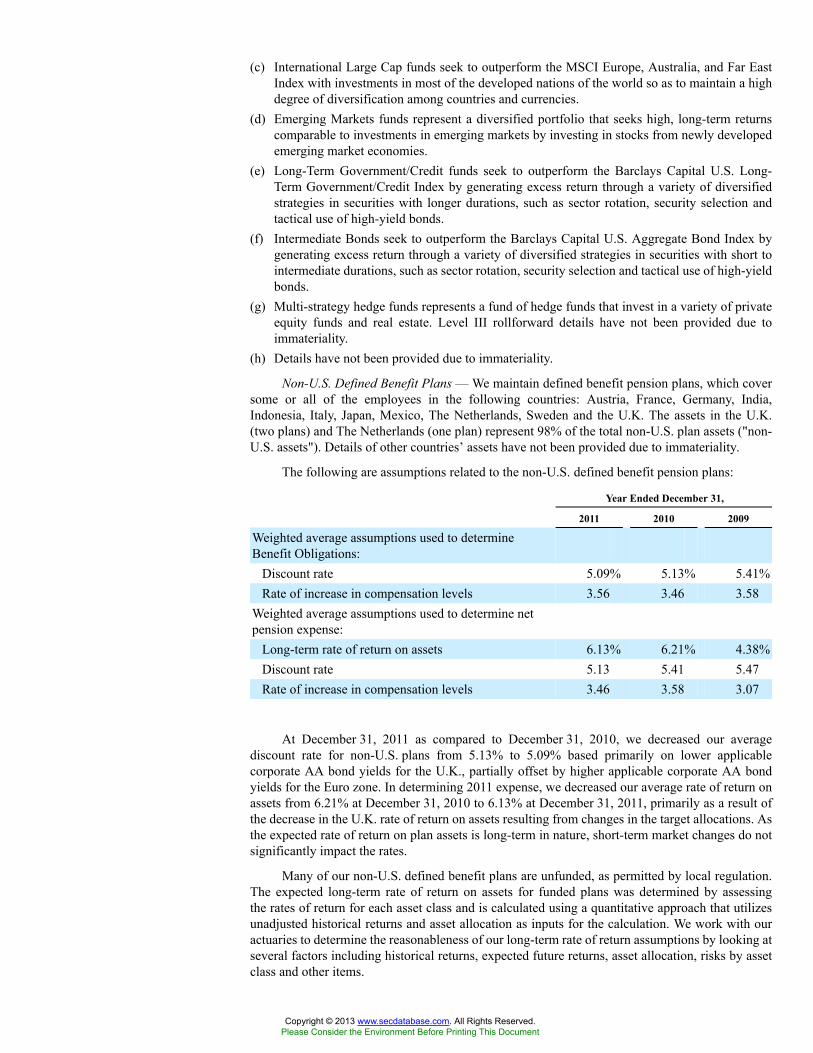
(c) International Large Cap funds seek to outperform the MSCI Europe, Australia, and Far EastIndex with investments in most of the developed nations of the world so as to maintain a highdegree of diversification among countries and currencies.
(d) Emerging Markets funds represent a diversified portfolio that seeks high, long-term returnscomparable to investments in emerging markets by investing in stocks from newly developedemerging market economies.
(e) Long-Term Government/Credit funds seek to outperform the Barclays Capital U.S. Long-Term Government/Credit Index by generating excess return through a variety of diversifiedstrategies in securities with longer durations, such as sector rotation, security selection andtactical use of high-yield bonds.
(f) Intermediate Bonds seek to outperform the Barclays Capital U.S. Aggregate Bond Index bygenerating excess return through a variety of diversified strategies in securities with short tointermediate durations, such as sector rotation, security selection and tactical use of high-yieldbonds.
(g) Multi-strategy hedge funds represents a fund of hedge funds that invest in a variety of privateequity funds and real estate. Level III rollforward details have not been provided due toimmateriality.
(h) Details have not been provided due to immateriality.
Non-U.S. Defined Benefit Plans — We maintain defined benefit pension plans, which coversome or all of the employees in the following countries: Austria, France, Germany, India,Indonesia, Italy, Japan, Mexico, The Netherlands, Sweden and the U.K. The assets in the U.K.(two plans) and The Netherlands (one plan) represent 98% of the total non-U.S. plan assets ("non-U.S. assets"). Details of other countries’ assets have not been provided due to immateriality.
The following are assumptions related to the non-U.S. defined benefit pension plans:
Year Ended December 31,
2011 2010 2009
Weighted average assumptions used to determineBenefit Obligations:
Discount rate 5.09% 5.13% 5.41%Rate of increase in compensation levels 3.56 3.46 3.58
Weighted average assumptions used to determine netpension expense:
Long-term rate of return on assets 6.13% 6.21% 4.38%Discount rate 5.13 5.41 5.47Rate of increase in compensation levels 3.46 3.58 3.07
At December 31, 2011 as compared to December 31, 2010, we decreased our averagediscount rate for non-U.S. plans from 5.13% to 5.09% based primarily on lower applicablecorporate AA bond yields for the U.K., partially offset by higher applicable corporate AA bondyields for the Euro zone. In determining 2011 expense, we decreased our average rate of return onassets from 6.21% at December 31, 2010 to 6.13% at December 31, 2011, primarily as a result ofthe decrease in the U.K. rate of return on assets resulting from changes in the target allocations. Asthe expected rate of return on plan assets is long-term in nature, short-term market changes do notsignificantly impact the rates.
Many of our non-U.S. defined benefit plans are unfunded, as permitted by local regulation.The expected long-term rate of return on assets for funded plans was determined by assessingthe rates of return for each asset class and is calculated using a quantitative approach that utilizesunadjusted historical returns and asset allocation as inputs for the calculation. We work with ouractuaries to determine the reasonableness of our long-term rate of return assumptions by looking atseveral factors including historical returns, expected future returns, asset allocation, risks by assetclass and other items.
Copyright © 2013 www.secdatabase.com. All Rights Reserved.Please Consider the Environment Before Printing This Document
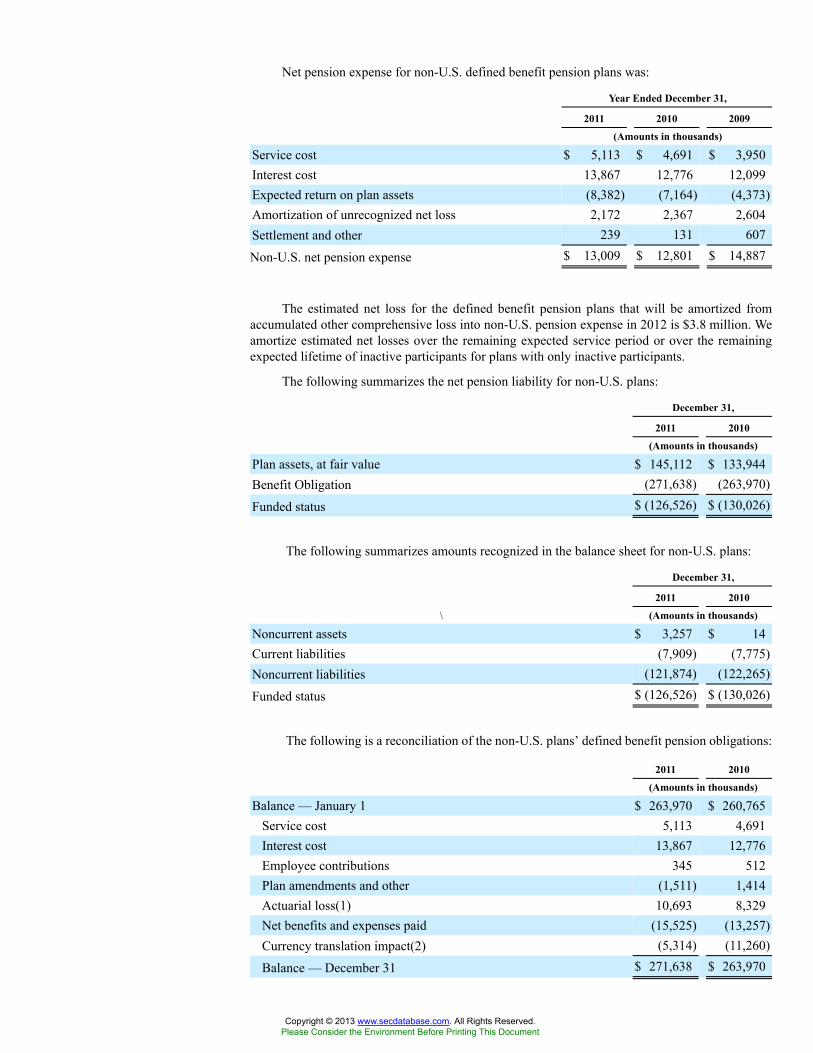
Net pension expense for non-U.S. defined benefit pension plans was:
Year Ended December 31,
2011 2010 2009
(Amounts in thousands)
Service cost $ 5,113 $ 4,691 $ 3,950Interest cost 13,867 12,776 12,099Expected return on plan assets (8,382) (7,164) (4,373)Amortization of unrecognized net loss 2,172 2,367 2,604Settlement and other 239 131 607
Non-U.S. net pension expense $ 13,009 $ 12,801 $ 14,887
The estimated net loss for the defined benefit pension plans that will be amortized fromaccumulated other comprehensive loss into non-U.S. pension expense in 2012 is $3.8 million. Weamortize estimated net losses over the remaining expected service period or over the remainingexpected lifetime of inactive participants for plans with only inactive participants.
The following summarizes the net pension liability for non-U.S. plans:
December 31,
2011 2010
(Amounts in thousands)
Plan assets, at fair value $ 145,112 $ 133,944Benefit Obligation (271,638) (263,970)
Funded status $ (126,526) $ (130,026)
The following summarizes amounts recognized in the balance sheet for non-U.S. plans:
December 31,
2011 2010
\ (Amounts in thousands)
Noncurrent assets $ 3,257 $ 14Current liabilities (7,909) (7,775)Noncurrent liabilities (121,874) (122,265)
Funded status $ (126,526) $ (130,026)
The following is a reconciliation of the non-U.S. plans’ defined benefit pension obligations:
2011 2010
(Amounts in thousands)
Balance — January 1 $ 263,970 $ 260,765Service cost 5,113 4,691Interest cost 13,867 12,776Employee contributions 345 512Plan amendments and other (1,511) 1,414Actuarial loss(1) 10,693 8,329Net benefits and expenses paid (15,525) (13,257)Currency translation impact(2) (5,314) (11,260)
Balance — December 31 $ 271,638 $ 263,970
Copyright © 2013 www.secdatabase.com. All Rights Reserved.Please Consider the Environment Before Printing This Document
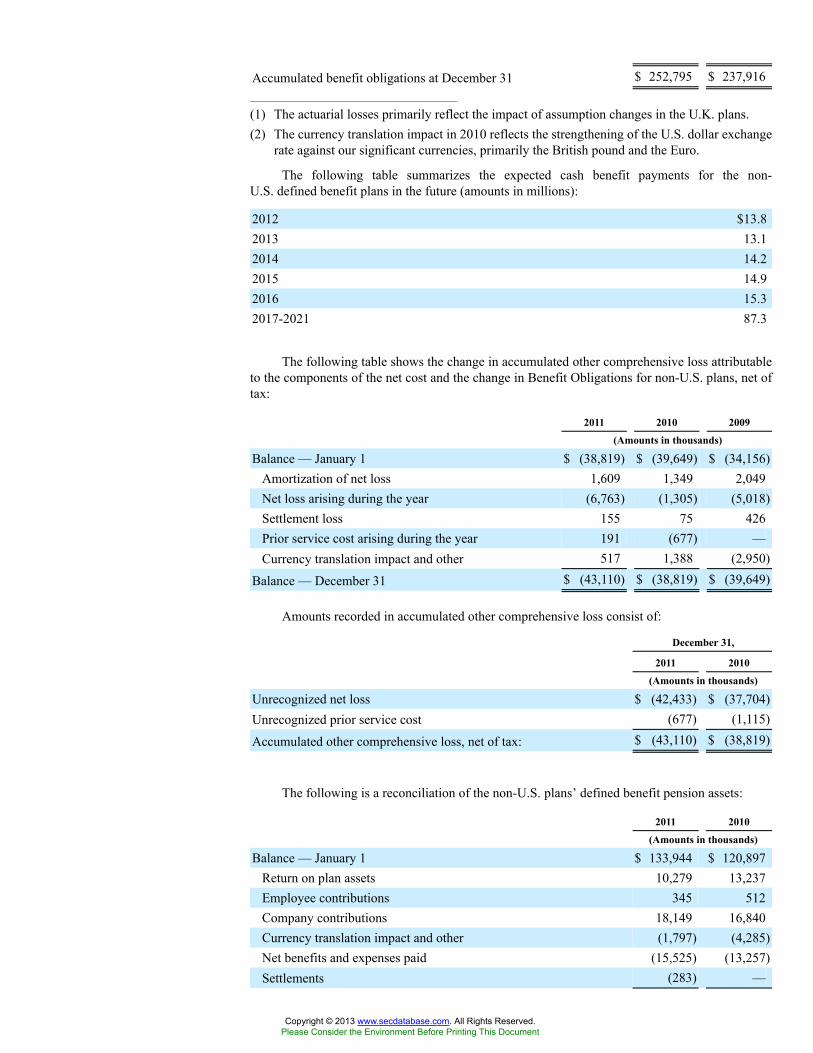
Accumulated benefit obligations at December 31 $ 252,795 $ 237,916_______________________________________
(1) The actuarial losses primarily reflect the impact of assumption changes in the U.K. plans.(2) The currency translation impact in 2010 reflects the strengthening of the U.S. dollar exchange
rate against our significant currencies, primarily the British pound and the Euro.
The following table summarizes the expected cash benefit payments for the non-U.S. defined benefit plans in the future (amounts in millions):
2012 $13.82013 13.12014 14.22015 14.92016 15.32017-2021 87.3
The following table shows the change in accumulated other comprehensive loss attributableto the components of the net cost and the change in Benefit Obligations for non-U.S. plans, net oftax:
2011 2010 2009
(Amounts in thousands)
Balance — January 1 $ (38,819) $ (39,649) $ (34,156)Amortization of net loss 1,609 1,349 2,049Net loss arising during the year (6,763) (1,305) (5,018)Settlement loss 155 75 426Prior service cost arising during the year 191 (677) —Currency translation impact and other 517 1,388 (2,950)
Balance — December 31 $ (43,110) $ (38,819) $ (39,649)
Amounts recorded in accumulated other comprehensive loss consist of:
December 31,
2011 2010
(Amounts in thousands)
Unrecognized net loss $ (42,433) $ (37,704)Unrecognized prior service cost (677) (1,115)
Accumulated other comprehensive loss, net of tax: $ (43,110) $ (38,819)
The following is a reconciliation of the non-U.S. plans’ defined benefit pension assets:
2011 2010
(Amounts in thousands)
Balance — January 1 $ 133,944 $ 120,897Return on plan assets 10,279 13,237Employee contributions 345 512Company contributions 18,149 16,840Currency translation impact and other (1,797) (4,285)Net benefits and expenses paid (15,525) (13,257)Settlements (283) —
Copyright © 2013 www.secdatabase.com. All Rights Reserved.Please Consider the Environment Before Printing This Document
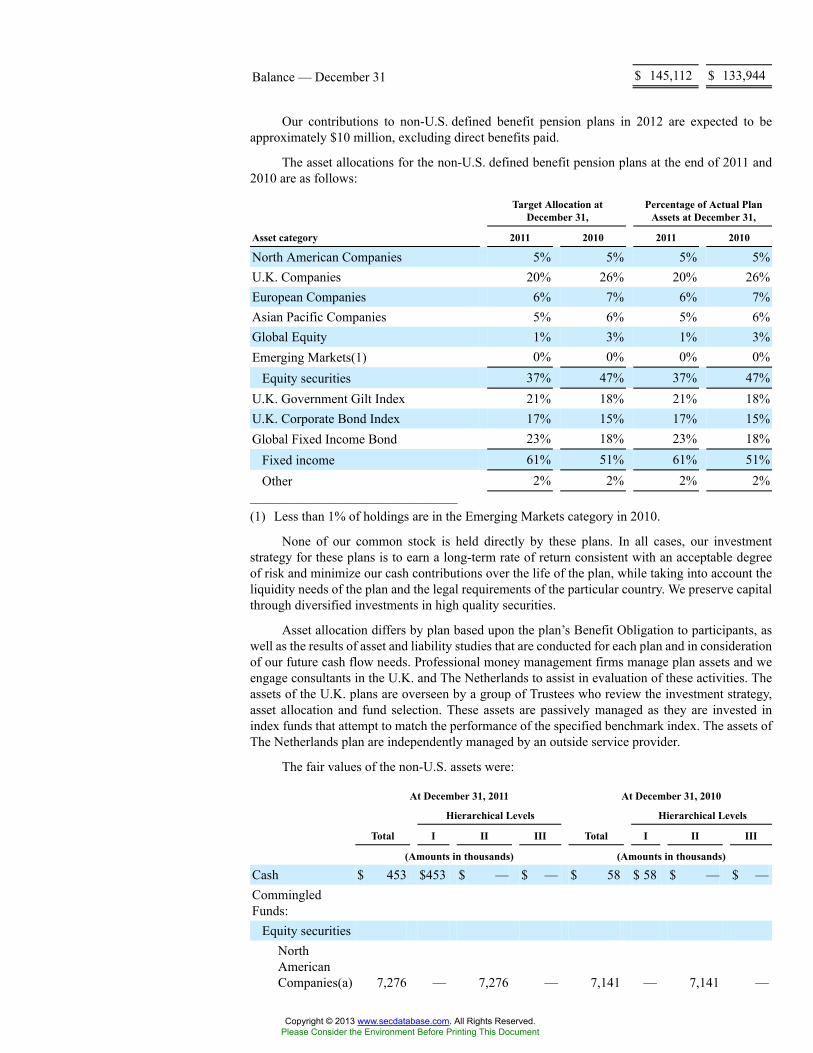
Balance — December 31 $ 145,112 $ 133,944
Our contributions to non-U.S. defined benefit pension plans in 2012 are expected to beapproximately $10 million, excluding direct benefits paid.
The asset allocations for the non-U.S. defined benefit pension plans at the end of 2011 and2010 are as follows:
Target Allocation atDecember 31,
Percentage of Actual PlanAssets at December 31,
Asset category 2011 2010 2011 2010
North American Companies 5% 5% 5% 5%U.K. Companies 20% 26% 20% 26%European Companies 6% 7% 6% 7%Asian Pacific Companies 5% 6% 5% 6%Global Equity 1% 3% 1% 3%Emerging Markets(1) 0% 0% 0% 0%
Equity securities 37% 47% 37% 47%U.K. Government Gilt Index 21% 18% 21% 18%U.K. Corporate Bond Index 17% 15% 17% 15%Global Fixed Income Bond 23% 18% 23% 18%
Fixed income 61% 51% 61% 51%Other 2% 2% 2% 2%
_______________________________________
(1) Less than 1% of holdings are in the Emerging Markets category in 2010.
None of our common stock is held directly by these plans. In all cases, our investmentstrategy for these plans is to earn a long-term rate of return consistent with an acceptable degreeof risk and minimize our cash contributions over the life of the plan, while taking into account theliquidity needs of the plan and the legal requirements of the particular country. We preserve capitalthrough diversified investments in high quality securities.
Asset allocation differs by plan based upon the plan’s Benefit Obligation to participants, aswell as the results of asset and liability studies that are conducted for each plan and in considerationof our future cash flow needs. Professional money management firms manage plan assets and weengage consultants in the U.K. and The Netherlands to assist in evaluation of these activities. Theassets of the U.K. plans are overseen by a group of Trustees who review the investment strategy,asset allocation and fund selection. These assets are passively managed as they are invested inindex funds that attempt to match the performance of the specified benchmark index. The assets ofThe Netherlands plan are independently managed by an outside service provider.
The fair values of the non-U.S. assets were:
At December 31, 2011 At December 31, 2010
Hierarchical Levels Hierarchical Levels
Total I II III Total I II III
(Amounts in thousands) (Amounts in thousands)
Cash $ 453 $453 $ — $ — $ 58 $ 58 $ — $ —CommingledFunds:
Equity securitiesNorthAmericanCompanies(a) 7,276 — 7,276 — 7,141 — 7,141 —
Copyright © 2013 www.secdatabase.com. All Rights Reserved.Please Consider the Environment Before Printing This Document
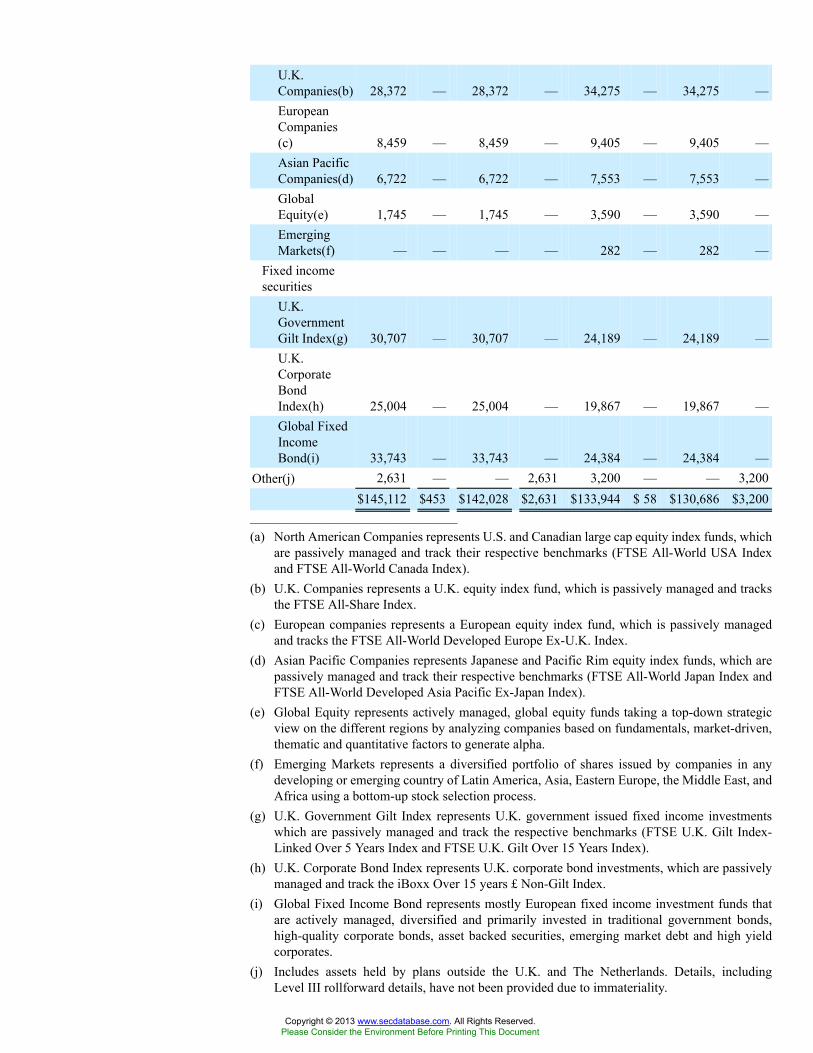
U.K.Companies(b) 28,372 — 28,372 — 34,275 — 34,275 —EuropeanCompanies(c) 8,459 — 8,459 — 9,405 — 9,405 —Asian PacificCompanies(d) 6,722 — 6,722 — 7,553 — 7,553 —GlobalEquity(e) 1,745 — 1,745 — 3,590 — 3,590 —EmergingMarkets(f) — — — — 282 — 282 —
Fixed incomesecurities
U.K.GovernmentGilt Index(g) 30,707 — 30,707 — 24,189 — 24,189 —U.K.CorporateBondIndex(h) 25,004 — 25,004 — 19,867 — 19,867 —Global FixedIncomeBond(i) 33,743 — 33,743 — 24,384 — 24,384 —
Other(j) 2,631 — — 2,631 3,200 — — 3,200$145,112 $453 $142,028 $2,631 $133,944 $ 58 $130,686 $3,200
_______________________________________
(a) North American Companies represents U.S. and Canadian large cap equity index funds, whichare passively managed and track their respective benchmarks (FTSE All-World USA Indexand FTSE All-World Canada Index).
(b) U.K. Companies represents a U.K. equity index fund, which is passively managed and tracksthe FTSE All-Share Index.
(c) European companies represents a European equity index fund, which is passively managedand tracks the FTSE All-World Developed Europe Ex-U.K. Index.
(d) Asian Pacific Companies represents Japanese and Pacific Rim equity index funds, which arepassively managed and track their respective benchmarks (FTSE All-World Japan Index andFTSE All-World Developed Asia Pacific Ex-Japan Index).
(e) Global Equity represents actively managed, global equity funds taking a top-down strategicview on the different regions by analyzing companies based on fundamentals, market-driven,thematic and quantitative factors to generate alpha.
(f) Emerging Markets represents a diversified portfolio of shares issued by companies in anydeveloping or emerging country of Latin America, Asia, Eastern Europe, the Middle East, andAfrica using a bottom-up stock selection process.
(g) U.K. Government Gilt Index represents U.K. government issued fixed income investmentswhich are passively managed and track the respective benchmarks (FTSE U.K. Gilt Index-Linked Over 5 Years Index and FTSE U.K. Gilt Over 15 Years Index).
(h) U.K. Corporate Bond Index represents U.K. corporate bond investments, which are passivelymanaged and track the iBoxx Over 15 years £ Non-Gilt Index.
(i) Global Fixed Income Bond represents mostly European fixed income investment funds thatare actively managed, diversified and primarily invested in traditional government bonds,high-quality corporate bonds, asset backed securities, emerging market debt and high yieldcorporates.
(j) Includes assets held by plans outside the U.K. and The Netherlands. Details, includingLevel III rollforward details, have not been provided due to immateriality.
Copyright © 2013 www.secdatabase.com. All Rights Reserved.Please Consider the Environment Before Printing This Document
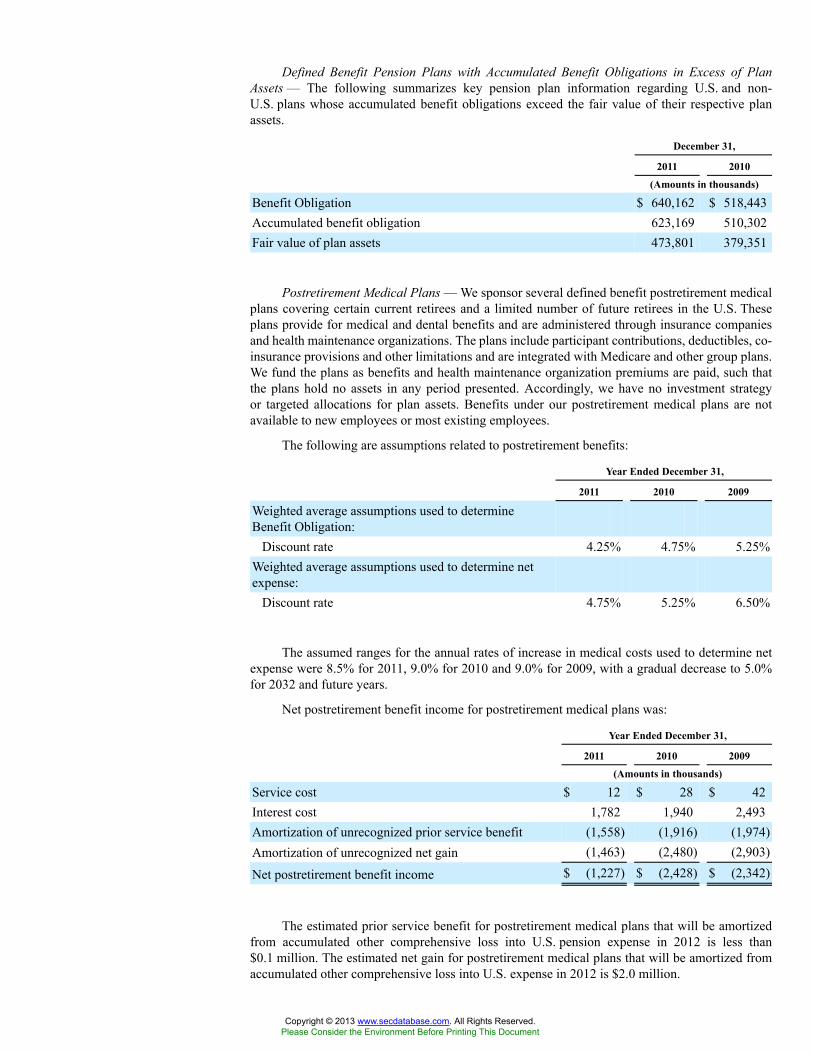
Defined Benefit Pension Plans with Accumulated Benefit Obligations in Excess of PlanAssets — The following summarizes key pension plan information regarding U.S. and non-U.S. plans whose accumulated benefit obligations exceed the fair value of their respective planassets.
December 31,
2011 2010
(Amounts in thousands)
Benefit Obligation $ 640,162 $ 518,443Accumulated benefit obligation 623,169 510,302Fair value of plan assets 473,801 379,351
Postretirement Medical Plans — We sponsor several defined benefit postretirement medicalplans covering certain current retirees and a limited number of future retirees in the U.S. Theseplans provide for medical and dental benefits and are administered through insurance companiesand health maintenance organizations. The plans include participant contributions, deductibles, co-insurance provisions and other limitations and are integrated with Medicare and other group plans.We fund the plans as benefits and health maintenance organization premiums are paid, such thatthe plans hold no assets in any period presented. Accordingly, we have no investment strategyor targeted allocations for plan assets. Benefits under our postretirement medical plans are notavailable to new employees or most existing employees.
The following are assumptions related to postretirement benefits:
Year Ended December 31,
2011 2010 2009
Weighted average assumptions used to determineBenefit Obligation:
Discount rate 4.25% 4.75% 5.25%Weighted average assumptions used to determine netexpense:
Discount rate 4.75% 5.25% 6.50%
The assumed ranges for the annual rates of increase in medical costs used to determine netexpense were 8.5% for 2011, 9.0% for 2010 and 9.0% for 2009, with a gradual decrease to 5.0%for 2032 and future years.
Net postretirement benefit income for postretirement medical plans was:
Year Ended December 31,
2011 2010 2009
(Amounts in thousands)
Service cost $ 12 $ 28 $ 42Interest cost 1,782 1,940 2,493Amortization of unrecognized prior service benefit (1,558) (1,916) (1,974)Amortization of unrecognized net gain (1,463) (2,480) (2,903)
Net postretirement benefit income $ (1,227) $ (2,428) $ (2,342)
The estimated prior service benefit for postretirement medical plans that will be amortizedfrom accumulated other comprehensive loss into U.S. pension expense in 2012 is less than$0.1 million. The estimated net gain for postretirement medical plans that will be amortized fromaccumulated other comprehensive loss into U.S. expense in 2012 is $2.0 million.
Copyright © 2013 www.secdatabase.com. All Rights Reserved.Please Consider the Environment Before Printing This Document
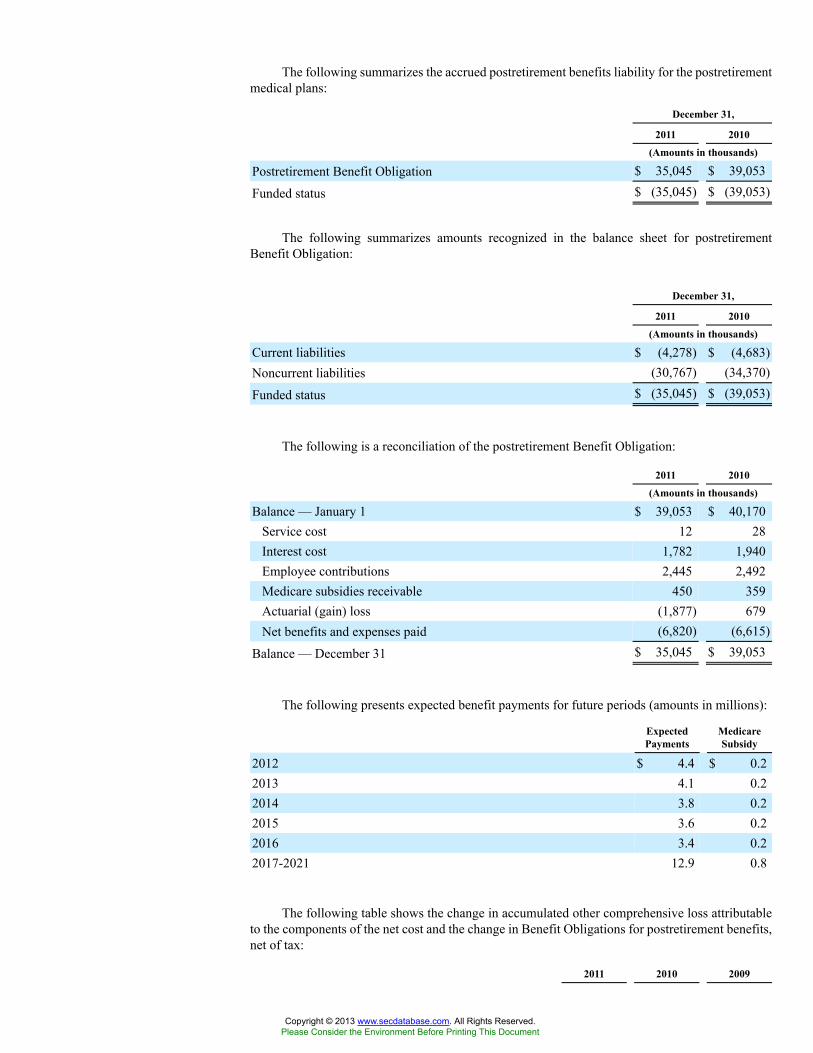
The following summarizes the accrued postretirement benefits liability for the postretirementmedical plans:
December 31,
2011 2010
(Amounts in thousands)
Postretirement Benefit Obligation $ 35,045 $ 39,053
Funded status $ (35,045) $ (39,053)
The following summarizes amounts recognized in the balance sheet for postretirementBenefit Obligation:
December 31,
2011 2010
(Amounts in thousands)
Current liabilities $ (4,278) $ (4,683)Noncurrent liabilities (30,767) (34,370)
Funded status $ (35,045) $ (39,053)
The following is a reconciliation of the postretirement Benefit Obligation:
2011 2010
(Amounts in thousands)
Balance — January 1 $ 39,053 $ 40,170Service cost 12 28Interest cost 1,782 1,940Employee contributions 2,445 2,492Medicare subsidies receivable 450 359Actuarial (gain) loss (1,877) 679Net benefits and expenses paid (6,820) (6,615)
Balance — December 31 $ 35,045 $ 39,053
The following presents expected benefit payments for future periods (amounts in millions):
ExpectedPayments
MedicareSubsidy
2012 $ 4.4 $ 0.22013 4.1 0.22014 3.8 0.22015 3.6 0.22016 3.4 0.22017-2021 12.9 0.8
The following table shows the change in accumulated other comprehensive loss attributableto the components of the net cost and the change in Benefit Obligations for postretirement benefits,net of tax:
2011 2010 2009
Copyright © 2013 www.secdatabase.com. All Rights Reserved.Please Consider the Environment Before Printing This Document

(Amounts in thousands)
Balance — January 1 $ 7,793 $ 10,915 $ 13,183Amortization of net gain (911) (1,525) (2,016)Amortization of prior service benefit (971) (1,179) (1,371)Net gain (loss) arising during the year 1,170 (418) 1,119
Balance — December 31 $ 7,081 $ 7,793 $ 10,915
Amounts recorded in accumulated other comprehensive loss consist of:
December 31,
2011 2010
(Amounts in thousands)
Unrecognized net gain $ 7,055 $ 6,774Unrecognized prior service benefit 26 1,019
Accumulated other comprehensive income, net of tax: $ 7,081 $ 7,793
We made contributions to the postretirement medical plans to pay benefits of $3.9 millionin 2011, $3.8 million in 2010 and $3.8 million in 2009. Because the postretirement medical plansare unfunded, we make contributions as the covered individuals’ claims are approved for payment.Accordingly, contributions during any period are directly correlated to the benefits paid.
Assumed health care cost trend rates have an effect on the amounts reported for thepostretirement medical plans. A one-percentage point change in assumed health care cost trendrates would have the following effect on the 2011 reported amounts (in thousands):
1% Increase 1% Decrease
Effect on postretirement Benefit Obligation $ 436 $ (424)Effect on service cost plus interest cost 17 (16)
Defined Contribution Plans — We sponsor several defined contribution plans coveringsubstantially all U.S. and Canadian employees and certain other non-U.S. employees. Employeesmay contribute to these plans, and these contributions are matched in varying amounts by us,including opportunities for discretionary matching contributions by us. Defined contribution planexpense was $17.8 million in 2011, $17.3 million in 2010 and $16.7 million in 2009.
Participants in the U.S. defined contribution plan have the option to invest in our commonstock and, prior to 2009, discretionary contributions by us were funded with our common stock;therefore, the plan assets include such holdings of our common stock.
Copyright © 2013 www.secdatabase.com. All Rights Reserved.Please Consider the Environment Before Printing This Document