fluctuations in ism thermal pressures measured from c i observations edward b. jenkins princeton...
TRANSCRIPT

Fluctuations in ISM Thermal Pressures Measured from C I
Observations
Edward B. JenkinsPrinceton University
Observatory

Fundamentals …• Most of the free carbon atoms in the ISM are
singly ionized, but a small fraction of the ions have recombined into the neutral form.
• The ground electronic state of C I is split into three fine-structure levels with small energy separations.
• Our objective is to study the relative populations of these three levels, which are influenced by local conditions (density & temperature.

Fine-structure Levels in the Ground State of C I
3P0 (E = 0 cm-1, g = 1)
3P1 (E = 16.4 cm-1, g = 3)
3P2 (E = 43.4 cm-1, g = 5)
C IC I*
C I**
Upper Electronic Levels
Collisionally Induced Transitions
Optical Pumping (by Starlight)Spontaneous Radiative
Decays
E/k = 23.6 KE/k = 23.6 K
E/k = 62.4 KE/k = 62.4 K

C I Absorption Features in the UV Spectrum of λ Cep Recorded at a Resolution of 1.5 km s-1 by STIS on HST
From Jenkins & Tripp (2001: ApJS, 137, 297)

Col
umn
dens
ity p
er u
nit
velo
city
[10
13 c
m-2 (
km s
-1)-1
]
Velocity (km s-1)
C I
C I*
C I**
λ Cep

Most Useful Way to Express Fine-structure Population Ratios
• n(C I)total = n(C I) + n(C I*) + n(C I**)
• f1 n(C I*)/n(C I)total
• f2 n(C I**)/n(C I)total
f1f2Then consider the plot:
Collision partners at a given density and temperature are expected to yield specific values of f1 and f2

n(H) = 10 cm-3
n(H) = 100 cm-3
n(H) = 1000 cm-3
n(H) = 104 cm-3
n(H) = 105 cm-3
Collisional Excitation by Neutral H
T = 100 K

Collisional Excitation by Neutral H Plus Optical
Pumping by the Average Galactic Starlight Field
n(H) = 10 cm-3
n(H) = 100 cm-3
n(H) = 1000 cm-3
n(H) = 104 cm-3
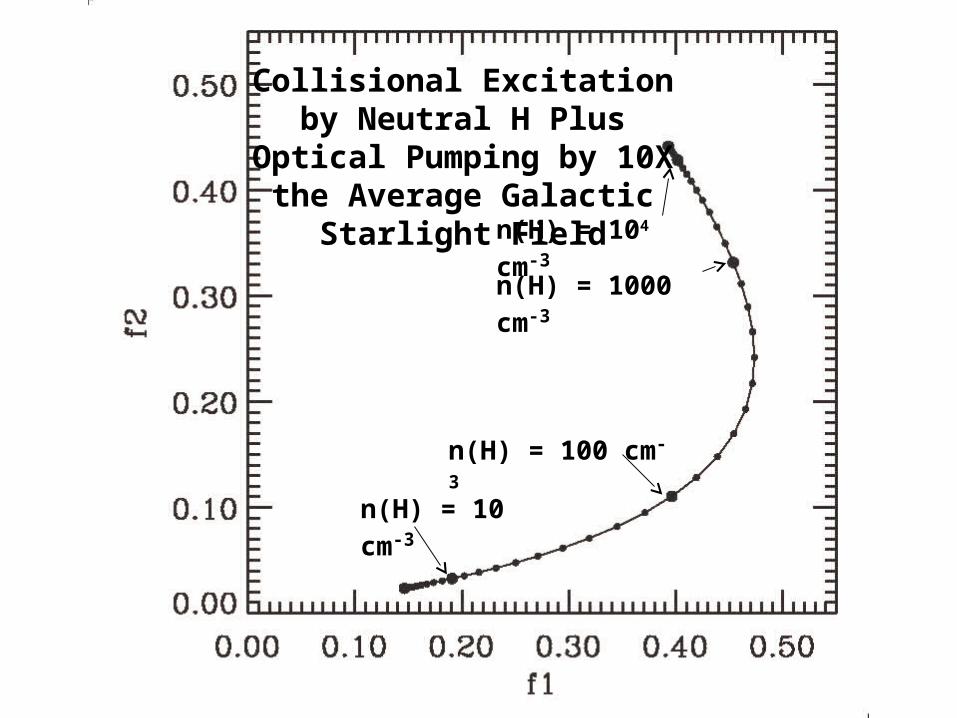
Collisional Excitation by Neutral H Plus Optical Pumping by 10X the
Average Galactic Starlight Field
n(H) = 10 cm-3
n(H) = 100 cm-3
n(H) = 1000 cm-3
n(H) = 104 cm-3

Tracks for Different Temperatures
n(H) = 100 cm-3
T = 30 K
T = 60 K
T = 120 K
T = 240 K

Tracks for Different Temperatures
T = 30 K
T = 60 K
T = 120 K
T = 240 K
p/k = 104 cm-3 K

(Back to simple f1f2 diag.)

Cloud 1
Cloud 2
A Theorem on how to deal with superpositions

A Theorem on how to deal with superpositions
C I-weighted “Center of
Mass” gives Composite
f1,f2

Allowed Region for Composite
Results
P/k

Results
• Original observations reported by Jenkins & Tripp (2001) included 21 stars.
• We have now expanded this survey to about 100 stars by downloading from the MAST archive all suitable STIS observations that used the highest resolution echelle spectrograph (E140H).
• The archival results have somewhat lower velocity resolution because the standard entrance aperture was usually used (instead of the extremely narrow slit chosen for the Jenkins & Tripp survey).

Composite over all velocities and stars:
f1 = 0.217, f2 = 0.073
T = 20K
T = 40K
T = 80K
T = 160K
H II reg.

T = 20K
T = 40K
T = 80K
T = 160K
H II reg.
Note: HISA-land is down here

VLSR
VDifferential Galactic Rotation
Positive Velocities
Negative VelocitiesAllowed Velocities
Sun
Target
KinematicsKinematicsKinematicsKinematicsC
olu
mn
de
nsi
ty p
er
un
it ve
loci
ty [
1013
cm
-2 (
km s
-1)-1
]
Velocity (km s-1)
C I
C I*
C I**
λ Cep
(heliocentric)

Allowed VelocitiesComposite f1 = 0.203, f2 = 0.063
T = 20K
T = 40K
T = 80K
T = 160K
H II reg.

Positive VelocitiesPositive VelocitiesNegative Velocities
Composite f1 = 0.231, f2 = 0.082 for both velocity intervals
T = 20K
T = 40K
T = 80K
T = 160K
H II reg.

eff = 0.72
Barytropic index
(Wolfire, Hollenbach, McKee, Tielens & Bakes 1995, ApJ 443, 152)

Gamma_eff on f1f2 (0.72)

Gamma_eff on f1f2 (0.72, 0.90)

Log-normal Distribution of Mass vs. Density
Rel
ativ
e M
ass
Fra
ctio
n
n(H I) (cm-3)

Observed composite f1, f2
Log-normal distribution of H I mass fraction vs. n(H), with γeff = 5/3
H IC I

Observed composite f1, f2
H IC I
Log-normal distribution of H I mass fraction vs. n(H), with γeff = 5/3

Observed composite f1, f2
H IC I
Log-normal distribution of H I mass fraction vs. n(H), with γeff = 5/3

Observed composite f1, f2
H IC I
Log-normal distribution of H I mass fraction vs. n(H), with γeff = 5/3

Observed composite f1, f2
H IC I
Log-normal distribution of H I mass fraction vs. n(H), with γeff = 5/3

Observed composite f1, f2
H IC I
Log-normal distribution of H I mass fraction vs. n(H), with γeff = 5/3

Obs.
Model for a random Model for a random mixture of high and mixture of high and low pressure gaslow pressure gas
Obs.

Pressure Distribution Function
p/k (cm-3 K)
Rel
ativ
e M
ass
Fra
ctio
n
H I mass fraction
Note: The width of this peak is a lower limit, since the observations at each velocity probably exhibit some averaging of pressure extremes along the straight portion of the f1-f2 curve.
Note: The width of this peak is a lower limit, since the observations at each velocity probably exhibit some averaging of pressure extremes along the straight portion of the f1-f2 curve.
The width and central pressure of this peak are not well known, but the height of the peak is well determined.
The width and central pressure of this peak are not well known, but the height of the peak is well determined.

Pressure Distribution Function
p/k (cm-3 K)
Rel
ativ
e M
ass
Fra
ctio
n
C I mass fractionH I mass fraction

A Question to Consider About the High Pressure Component
• Could this component arise simply from the action of radiation or mass loss from the target stars (or their associations) either of which could compress the gas?
• Probably not: recall that negative velocity material behaved in much the same way as positive velocity material
Except for some gas parcels that have only high pressures
Blue = neg. vel.Red = pos. vel.

HS0624+6907HS0624+6907 Galactic Coordinates: l = Galactic Coordinates: l =
145.7145.7°°, b = +23.4, b = +23.4°°
Nearest O- or B-type star to the line Nearest O- or B-type star to the line
of sight: 43 Cam (V = 5.14, of sight: 43 Cam (V = 5.14,
spectral type: B7IV), about 2spectral type: B7IV), about 2° away° away
p/k (cm-3 K)
Rel
ativ
e M
ass
Fra
ctio
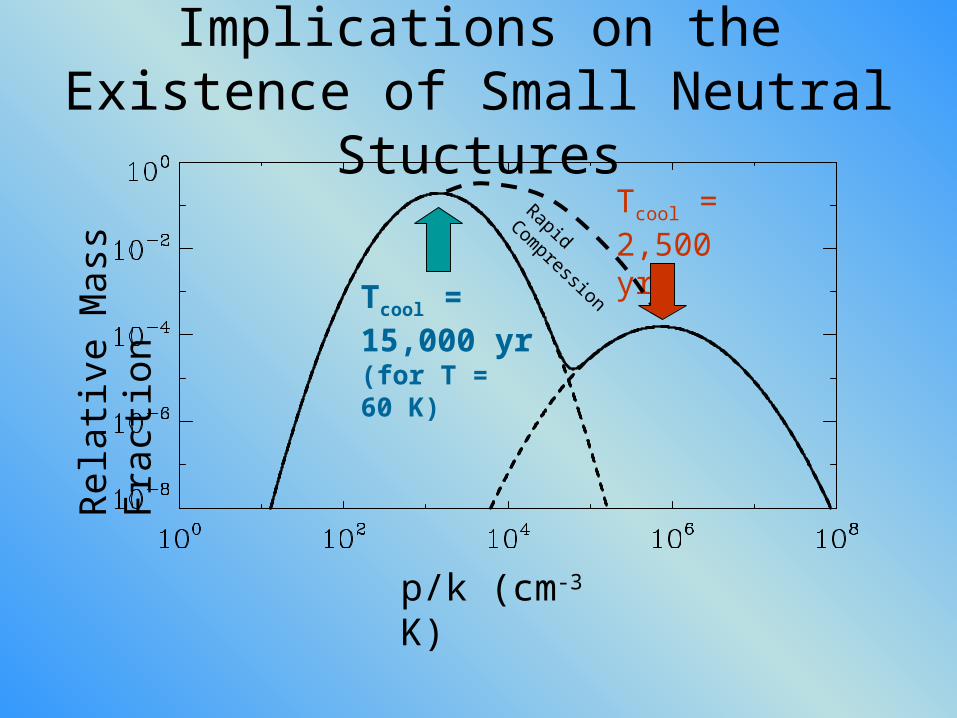
nImplications on the Existence of Small
Neutral Stuctures
Tcool = 15,000 yr (for T = 60 K)
Tcool = 2,500 yr
Rapid Compression

• High pressure component mass fraction is low (~10-3), relative to most of the gas.
• It has n(H I) ~ 103 −104 cm-3 and T ≥ 100 K.
• Tcool ≤ 2500 yr, which implies a typical dimension of only 0.00025 pc (i.e., 50 AU), or less, if crossing-time velocities are of order 10 km s-1 and the compression is nearly adiabatic.
Implications on the Existence of Small Neutral Stuctures