fluctuations in running and skill-related performance in...
TRANSCRIPT

Seediscussions,stats,andauthorprofilesforthispublicationat:https://www.researchgate.net/publication/307511557
Fluctuationsinrunningandskill-relatedperformanceineliterugbyunionmatch-play
Article·August2016
DOI:10.1080/17461391.2016.1220986
CITATIONS
0
READS
53
4authors,including:
MathieuLacome
FFR.
11PUBLICATIONS25CITATIONS
SEEPROFILE
JulienPiscione
FédérationFrançaisedeRugby
30PUBLICATIONS140CITATIONS
SEEPROFILE
J.-P.Hager
CentreOrthopediqueSanty
26PUBLICATIONS230CITATIONS
SEEPROFILE
AllcontentfollowingthispagewasuploadedbyMathieuLacomeon14November2016.
Theuserhasrequestedenhancementofthedownloadedfile.Allin-textreferencesunderlinedinblueareaddedtotheoriginaldocument
andarelinkedtopublicationsonResearchGate,lettingyouaccessandreadthemimmediately.

Full Terms & Conditions of access and use can be found athttp://www.tandfonline.com/action/journalInformation?journalCode=tejs20
Download by: [UNIVERSITY OF BRIGHTON] Date: 14 November 2016, At: 11:59
European Journal of Sport Science
ISSN: 1746-1391 (Print) 1536-7290 (Online) Journal homepage: http://www.tandfonline.com/loi/tejs20
Fluctuations in running and skill-relatedperformance in elite rugby union match-play
Mathieu Lacome, Julien Piscione, Jean-Philippe Hager & Chris Carling
To cite this article: Mathieu Lacome, Julien Piscione, Jean-Philippe Hager & Chris Carling(2016): Fluctuations in running and skill-related performance in elite rugby union match-play,European Journal of Sport Science, DOI: 10.1080/17461391.2016.1220986
To link to this article: http://dx.doi.org/10.1080/17461391.2016.1220986
Published online: 30 Aug 2016.
Submit your article to this journal
Article views: 327
View related articles
View Crossmark data

ORIGINAL ARTICLE
Fluctuations in running and skill-related performance in elite rugbyunion match-play
MATHIEU LACOME1, JULIEN PISCIONE1, JEAN-PHILIPPE HAGER1, &CHRIS CARLING2
1Research Department, French Rugby Union, Marcoussis, France & 2Institute of Coaching and Performance, University ofCentral Lancashire, Preston, UK
AbstractThis study investigated end-game and transient changes in running activities and whether these were concomitantlyassociated with reductions in skill-related performance in senior international rugby union match-play. Altogether, 18official matches were analysed (322 individual observations) using computerised video-based tracking and event coding(Amisco Pro®, SUP, Nice, France). In forwards and backs, trivial to small reductions (% difference: −2.1, ±1.3 to −10.0,±4.0%) in total distance and that covered at high speeds (>18.0 km h−1) occurred in the second- versus the first-half whilethere were trivial differences in skill-related performance measures (−2.3, ±4.5 to 7.5, ±14.0%). In both positions, smallto moderate declines (−42, ±10 to −21, ±7%) occurred in high-speed running in the final 10-min and 5-min periodsversus mean values for all other 10-min and 5-min periods throughout the game while only small changes (−18, ±51 to13, ±41%) in skill-related performance were observed. Trivial changes in running and skill-related performance (−11, ±74to 7, ±39%) were observed in the 5-min period immediately following the most intense 5-minute periods of playcompared to mean performance over the other 5-min periods. These findings suggest that international rugby unionplayers were generally able to maintain skill-related performance over the course of match-play even when declines inrunning performance occurred.
Keywords: Performance; fatigue; team sport; skill
Introduction
In elite rugby union match-play, a large body of lit-erature has described the physical demands usingtime-motion analyses of running activities, such asthe total distance covered and that travelled at high-speeds. In comparison, patterns of fatigue rep-resented by declines in distances covered havereceived less attention. Investigations have neverthe-less reported that running activity (e.g. total distance,high-speed running) was frequently unaffected acrossmatch halves, quarters and 10-minute intervals(Cunniffe, Proctor, Baker, & Davies, 2009; Duthie,Pyne, & Hooper, 2005; Lacome, Piscione, Hager,& Bourdin, 2014; Roberts, Trewartha, Higgitt, El-Abd, & Stokes, 2008). Thus, it would seem thatelite players generally do not experience accumulated‘fatigue’ manifested by a progressive drop in running
activity over the course of play although furtherresearch particularly at international standards andusing a larger number of match observations is war-ranted. Studies notably in elite rugby league(Kempton, Sirotic, & Coutts, 2014) and soccer(Bradley & Noakes, 2013; Carling & Dupont,2011) have also examined running performance inthe very latter stages of match-play (e.g. final 5-minute period). Kempton et al. (2014) reportedthat overall distance covered in the final 5 minutesof rugby league matches declined significantly(∼14% decrease) in comparison to the first 5-minute period suggesting that players were possiblyfatigued in the closing stages of play. A similar tem-poral analysis of running performance is warrantedin elite rugby union as previous analyses of 10-minute intervals did not demonstrate any reductionsin activity. This information has the potential to
© 2016 European College of Sport Science
Correspondence: Mathieu Lacome, Research Department, French rugby union, 3-5 rue Jean de Montaigu, 91460 Marcoussis, France.Email: [email protected]
European Journal of Sport Science, 2016http://dx.doi.org/10.1080/17461391.2016.1220986

identify whether fatigue represented by a decline indistance run occurs at the very end of play therebyinforming coach decision-making (e.g. substitutions,tactics) particularly if the match result is stillundecided.To our knowledge, there is no information on
the existence of transient fatigue represented bytemporary reductions in running activity in eliterugby union competition. Research in elite soccerand rugby league has shown that high-speed distancein the 5-minute period immediately following themost intense 5-minute period of activity wasreduced in comparison to the mean value for all theother 5-minute match periods (Bradley & Noakes,2013; Kempton, Sirotic, Cameron, & Coutts,2013). However, conflicting results exist in rugbyleague (Hulin & Gabbett, 2015; Hulin, Gabbett,Kearney, & Corvo, 2015) as sub-elite and eliteplayers maintained performance following thepeak 5-min activity period. Research into these afore-mentioned areas is warranted in an attempt todetermine whether transient changes also occur inelite rugby union match-play. Data could informprescription of physical conditioning regimens inorder to help prepare players cope with the mostintense running demands that arise during shortperiods of play (Jones, West, Crewther, Cook, &Kilduff, 2015).Up to now, no study has examined the potential
association between fatigue indirectly determinedby time-motion analyses and skill-related perform-ance in elite rugby union match-play. In otherteam sports contrasting findings have been reported(Rampinini, Impellizzeri, Castagna, Coutts, &Wisloff, 2009; Sirotic, Coutts, Knowles, & Catterick,2009). In elite soccer, moderate declines occurred inhigh-speed running following short intense phasesand at the end of match-play (effect sizes: ∼−0.7)whereas only small reductions (effect sizes: ∼−0.4)in the frequency of and success rates in technicalactions such as passing (Carling & Dupont, 2011)were concomitantly observed. In contrast, total dis-tance covered, the ‘quality’ of skill performance,and the number of ball involvements were allreduced both transiently and in the very finalstages of matches in rugby league players withthese drops possibly linked to glycogen depletion inindividual muscle fibres, dehydration arising fromhyperthermia and declines in cognitive function(Kempton et al., 2013). Similar information wouldbe pertinent for elite rugby union training settingsto determine, for example, whether there is a needfor players to practice game skills under ‘fatigued’conditions. Consequently, the aim of this study inelite rugby union match-play was to examine end-game and transient changes in running performance
using time-motion analyses and determine whetherthese were accompanied by altered skill-relatedperformance.
Method
In this study, male player performance in official inter-national rugby union competition was examined. Atotal of 18 matches of which 7 test (autumn tours)and 11 Six Nations tournament matches playedbetween 2005 and 2011 were analysed. All playerswere either members of the French national team ortheir direct opponents (nine different teams) and com-pleted all matches in their entirety. Players either sub-stituted or replaced were not included. Altogether,322 match performance observations for 188 differentplayers were collected. In order to conduct inter-positional comparisons, players were subdivided intoforwards (match observations: n= 154) and backs(match observations: n= 168). Further breakdown ofplaying positions was not feasible due to insufficientnumbers of match observations. To ensure player con-fidentiality, all performance data were anonymisedbefore the analysis. Approval for the study wasobtained from the Fédération Française de Rugby.
Study design
An optical computerised player tracking system(Amisco Pro®, Sport Universal Process, Nice,France) was used to analyse performance in inter-national rugby union match-play at the Stade deFrance stadium (St Denis, France). This systempassively tracked the movements of every playerover the entire course of play. Simultaneously,trained operators coded post-match each technicalaction involving the ball. The workings and qualitycontrol of AMISCO Pro® have been described else-where (Carling, Bloomfield, Nelsen, & Reilly, 2008;Carling, Williams, & Reilly, 2005; Lacome et al.,2014; Randers, Mujika, & Hewitt, 2010).Two categories of performance measures were
employed:
(1) Running performance: total distance run andthat covered in high-speed running. Thelatter was also categorised according toteam ball possession: running during ownteam and opponent possession. Movementsrecorded at speeds above 18.0 km h−1 wereconsidered high-speed running actions(Roberts et al., 2008).
(2) Measures of skill-related performance definedin the and coded internally by AMISCOPro®-trained company match analysts included thetotal number of passes and tackles and
2 M. Lacome et al.
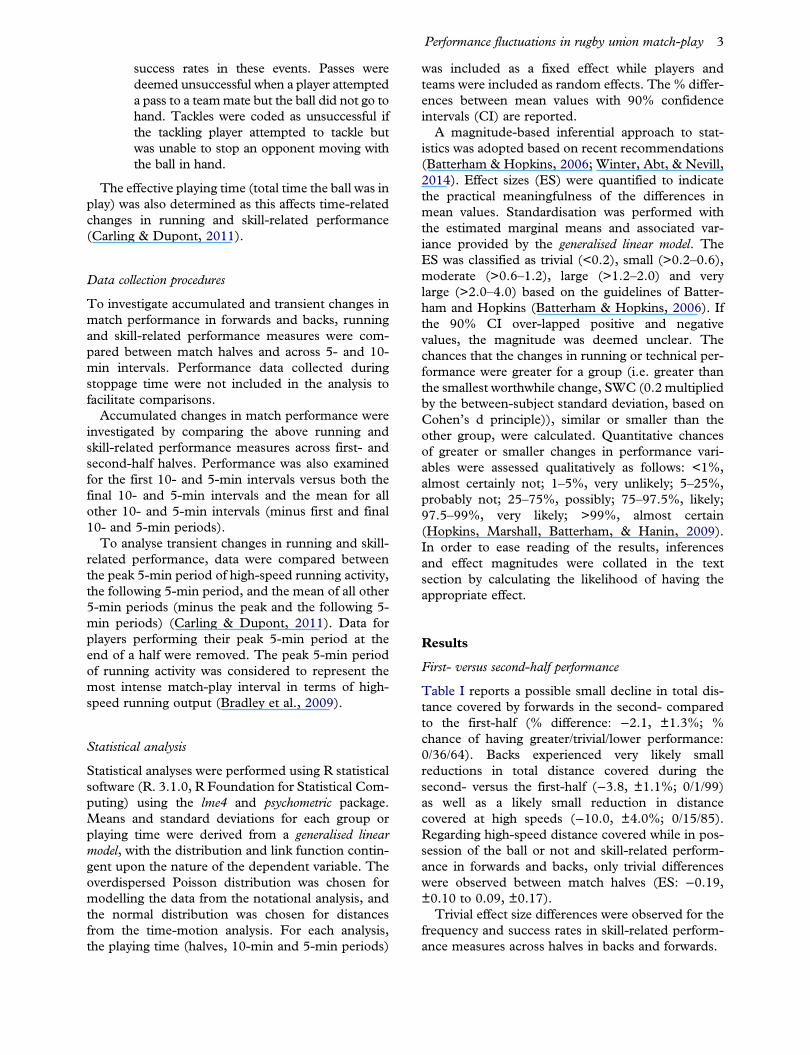
success rates in these events. Passes weredeemed unsuccessful when a player attempteda pass to a teammate but the ball did not go tohand. Tackles were coded as unsuccessful ifthe tackling player attempted to tackle butwas unable to stop an opponent moving withthe ball in hand.
The effective playing time (total time the ball was inplay) was also determined as this affects time-relatedchanges in running and skill-related performance(Carling & Dupont, 2011).
Data collection procedures
To investigate accumulated and transient changes inmatch performance in forwards and backs, runningand skill-related performance measures were com-pared between match halves and across 5- and 10-min intervals. Performance data collected duringstoppage time were not included in the analysis tofacilitate comparisons.Accumulated changes in match performance were
investigated by comparing the above running andskill-related performance measures across first- andsecond-half halves. Performance was also examinedfor the first 10- and 5-min intervals versus both thefinal 10- and 5-min intervals and the mean for allother 10- and 5-min intervals (minus first and final10- and 5-min periods).To analyse transient changes in running and skill-
related performance, data were compared betweenthe peak 5-min period of high-speed running activity,the following 5-min period, and the mean of all other5-min periods (minus the peak and the following 5-min periods) (Carling & Dupont, 2011). Data forplayers performing their peak 5-min period at theend of a half were removed. The peak 5-min periodof running activity was considered to represent themost intense match-play interval in terms of high-speed running output (Bradley et al., 2009).
Statistical analysis
Statistical analyses were performed using R statisticalsoftware (R. 3.1.0, R Foundation for Statistical Com-puting) using the lme4 and psychometric package.Means and standard deviations for each group orplaying time were derived from a generalised linearmodel, with the distribution and link function contin-gent upon the nature of the dependent variable. Theoverdispersed Poisson distribution was chosen formodelling the data from the notational analysis, andthe normal distribution was chosen for distancesfrom the time-motion analysis. For each analysis,the playing time (halves, 10-min and 5-min periods)
was included as a fixed effect while players andteams were included as random effects. The % differ-ences between mean values with 90% confidenceintervals (CI) are reported.A magnitude-based inferential approach to stat-
istics was adopted based on recent recommendations(Batterham & Hopkins, 2006; Winter, Abt, & Nevill,2014). Effect sizes (ES) were quantified to indicatethe practical meaningfulness of the differences inmean values. Standardisation was performed withthe estimated marginal means and associated var-iance provided by the generalised linear model. TheES was classified as trivial (<0.2), small (>0.2–0.6),moderate (>0.6–1.2), large (>1.2–2.0) and verylarge (>2.0–4.0) based on the guidelines of Batter-ham and Hopkins (Batterham & Hopkins, 2006). Ifthe 90% CI over-lapped positive and negativevalues, the magnitude was deemed unclear. Thechances that the changes in running or technical per-formance were greater for a group (i.e. greater thanthe smallest worthwhile change, SWC (0.2 multipliedby the between-subject standard deviation, based onCohen’s d principle)), similar or smaller than theother group, were calculated. Quantitative chancesof greater or smaller changes in performance vari-ables were assessed qualitatively as follows: <1%,almost certainly not; 1–5%, very unlikely; 5–25%,probably not; 25–75%, possibly; 75–97.5%, likely;97.5–99%, very likely; >99%, almost certain(Hopkins, Marshall, Batterham, & Hanin, 2009).In order to ease reading of the results, inferencesand effect magnitudes were collated in the textsection by calculating the likelihood of having theappropriate effect.
Results
First- versus second-half performance
Table I reports a possible small decline in total dis-tance covered by forwards in the second- comparedto the first-half (% difference: −2.1, ±1.3%; %chance of having greater/trivial/lower performance:0/36/64). Backs experienced very likely smallreductions in total distance covered during thesecond- versus the first-half (−3.8, ±1.1%; 0/1/99)as well as a likely small reduction in distancecovered at high speeds (−10.0, ±4.0%; 0/15/85).Regarding high-speed distance covered while in pos-session of the ball or not and skill-related perform-ance in forwards and backs, only trivial differenceswere observed between match halves (ES: −0.19,±0.10 to 0.09, ±0.17).Trivial effect size differences were observed for the
frequency and success rates in skill-related perform-ance measures across halves in backs and forwards.
Performance fluctuations in rugby union match-play 3

When normalised to effective playing time, therewas a possibly moderate decline in total distancecovered by forwards in the second- versus the first-half (−7.7, ±1.7%; 0/32/68) as well as a possiblysmall decline in high-speed distance (−15.0,±5.7%; 0/30/70). In backs, there was a likely moder-ate decline in total distance covered (−8.9, ±1.6%; 0/7/93) and a most likely small decline in high-speeddistance (−16.0, ±3.7%; 0/0/100) in the second-half. Unclear or trivial effect size differences wereobserved for the frequency of passes and tackleswhen normalised to effective playing time in forwardsand backs.
End-game performance
Final 10-min interval. In backs and forwards, possiblymoderate to likely large declines (% difference range:−17, ±4% to −47, ±20%) in measures of runningperformance were observed for the first 10-minversus the 70–80-min period (Table II). Regardingthe 70–80-min period versus the mean for other 10-min periods, there were most likely to possiblesmall declines (−28, ±18 to −7.1, ±2.1%) inmeasures of running performance for both positionalroles. When normalised to effective playing time,there were possibly small declines in distance
covered at high speeds in forwards (−18, ±13%;0/48/52) and likely small declines in backs (−16,±8%; 0/10/90).Regarding skill-related performance in backs and
forwards, trivial or unclear effect size differences inthe frequency and success rates of skill-related per-formance measures were observed between the first10-min versus the 70–80-min period. Similarly,there were trivial or unclear effect size differences inthe frequency and success rates of skill-related per-formance measures between the 70–80-min periodversus the mean for all 10-min periods.
Final 5-min interval. In Table III, likely moderate tolikely large declines (−24, ±6.6% to −68, ±33) inrunning performance are reported for backs and for-wards for the first 5-min versus the 75–80-minperiod. In comparison to the mean for 5-minperiods, backs experienced very likely small to likelymoderate declines in running performance in the75–80-min period (−10.2, ±2.9 to −42, ±10%)while forwards showed possibly to very likely smallreductions (−8.9, ±3.5 to −42, ±23%).When results were expressed relative to effective
playing time, very likely small to possibly largedeclines (−11, ±5% to −65, ±24%) in running per-formance were observed for forwards and backs
Table I. Comparisons of running and skill-related performance for back and forwards across the first- and second-halves of match-play.
First half Second half Diff% (90% CI) ES (90% CI) % chances
Performance for forwards (n = 154)TD (m) 3122 ± 248 3056 ± 260 −2.1, ±1.3 −0.23, ±0.14 0/36/64HS (m) 249 ± 131 228 ± 123 −8.4, ±5.6 −0.13, ±0.09 0/91/9HS (%) 7.8 ± 3.8 7.3 ± 3.7 −6.8, ±5.2 −0.11, ±0.085 0/95/5HS in posses (m) 130 ± 68 119 ± 70 −8.1, ±6.6 −0.12, ±0.10 0/92/8HS out of posses (m) 107 ± 73 101 ± 72 −5.6, ±9.4 −0.07, ±0.12 0/96/4Passes (n) 1.64 ± 1.87 1.76 ± 1.96 7.5, ±14.0 0.05, ±0.09 0/100/0Tackles (n) 3.81 ± 2.34 4.05 ± 2.72 6.3, ±12.0 0.09, ±0.17 14/86/0Successful passes (%) 92 ± 19 92 ± 24 −0.77, ±4.7 −0.04, ±0.22 4/85/11Successful tackles (%) 87 ± 20 85 ± 18 −2.3, ±4.5 −0.10, ±0.20 1/79/21Effective playing time (s) 900 ± 77 957 ± 103 6.2, ±1.8 0.62, ±0.18 100/0/0TD (m min of effective time) 209.8 ± 28.1 193.7 ± 32.0 −7.7, ±1.7 −0.64, ±0.14 0/32/68HS (m min of effective time) 16.9 ± 10.1 14.4 ± 8.7 −15.0, ±5.7 −0.23, ±0.09 0/30/70Performance for backs (n = 168)TD (m) 3515 ± 289 3381 ± 322 −3.8, ±1.1 −0.35, ±0.10 0/1/99HS (m) 432 ± 132 389 ± 126 −10.0, ±4.0 −0.26, ±0.10 0/15/85HS (%) 12.2 ± 3.3 11.4 ± 3.3 −6.6, ±3.5 −0.19, ±0.10 0/57/43HS in posses (m) 228 ± 86 211 ± 90 −7.8, ±5.9 −0.17, ±0.13 0/65/35HS out of posses (m) 165 ± 70 151 ± 74 −8.6, ±7.0 −0.18, ±0.14 0/60/40Passes (n) 5.19 ± 9.26 5.50 ± 8.59 6, ±11 0.03, ±0.045 0/100/0Tackles (n) 2.81 ± 2.38 2.81 ± 2.17 0, ±13 −0.00, ±0.14 1/98/1Successful passes (%) 92 ± 16 94 ± 10 2.6, ±4.1 0.12, ±0.19 24/75/0Successful tackles (%) 82 ± 27 83 ± 27 1.0, ±6.4 0.04, ±0.24 13/82/5Effective playing time (s) 897 ± 75 952 ± 108 6.2, ±1.8 0.60, ±0.17 100/0/0TD (m min of effective time) 237 ± 29 215 ± 38 −8.9, ±1.6 −0.72, ±0.13 0/7/93HS (m min of effective time) 29 ± 10 25 ± 8 −16.0, ±3.7 −0.43, ±0.10 0/0/100
Notes: ES, effect size; % chances, % chances that the true difference is +ive/trivial/ −ive; TD, total distance; HS, high-speed distance; HS (%),high-speed distance relative to total distance.
4 M. Lacome et al.

Table II. Running and skill-related performance in back and forwards during the first 10-min period, the last 10-min period and the mean 10-min period of match-play.
End-game fluctuations
Observed values Last 10 min vs First 10 min First 10 min vs Mean 10 min Last 10 min vs Mean 10 min
First10 min Last 10 min
Mean10 min
Diff % (90%CI)
ES (90%CI)
%Chances
Diff % (90%CI)
ES (90%CI)
%Chances
Diff % (90%CI)
ES (90%CI)
%Chances
Performance for forwards (n = 154)TD (m) 863 ± 100 712 ± 102 766 ± 57 −18.0, ±5.2 −1.60,
±0.470/0/100 13.0, ±3.7 1.0, ±0.3 100/0/0 −7.1, ±2.1 −0.57,
±0.170/0/100
HS (m) 84 ± 52 44 ± 36 58 ± 31 −47, ±20 −0.82,±0.34
0/0/100 45, ±19 0.54, ±0.22 99/1/0 −24, ±11 −0.28,±0.13
0/15/85
HS (%) 9.4 ± 5.3 5.9 ± 4.5 7.4 ± 3.7 −37, ±15 −0.66,±0.27
0/0/100 28, ±11 0.38, ±0.16 97/3/0 −20.0, ±9.6 −0.27,±0.13
0/18/82
HS in posses (m) 45 ± 30 24 ± 22 30 ± 16 −46, ±23 −0.72,±0.36
0/1/99 49, ±24 0.52, ±0.26 98/2/0 −19, ±14 −0.20,±0.15
0/48/52
HS out of posses (m) 35 ± 31 18 ± 23 25 ± 17 −48, ±24 −0.65,±0.32
0/1/99 40, ±20 0.38, ±0.19 94/6/0 −28, ±18 −0.27,±0.17
0/26/74
Passes (n) 0.46 ± 0.78 0.38 ± 0.62 0.43 ± 0.43 −16, ±32 −0.09,±0.19
1/82/17 6, ±73 0.03, ±0.40 25/58/17 −11, ±46 −0.06,±0.25
5/78/18
Tackles (n) 1.26 ± 1.28 1.05 ± 1.30 0.90 ± 0.93 −17, ±22 −0.19,±0.25
0/51/49 36, ±25 0.30, ±0.21 78/22/0 13, ±41 0.11, ±0.35 33/60/7
Successful passes (%) 85 ± 32 82 ± 40 87 ± 16 −3, ±196 −0.02,±1.40
39/19/41 −3, ±184 −0.025,±1.4
39/20/41 −6, ±96 −0.05,±0.72
27/37/36
Successful tackles (%) 92 ± 24 91 ± 22 86 ± 16 1.0 ± 60 −0.02,±1.70
41/16/43 7, ±10 0.17, ±0.26 43/56/1 6, ±10 0.15, ±0.27 39/60/2
Effective playing time (s) 243 ± 64 225 ± 46 232 ± 14 −7.4, ±3.9 −0.39,±0.20
0/6/94 5.1, ±4.5 0.26, ±0.23 66/34/0 −2.7, ±6.1 −0.13,±0.31
4/60/36
TD (m min of effectivetime)
222 ± 42 198 ± 47 199 ± 18 −11, ±3.9 −0.62,±0.23
0/0/100 11, ±4.1 0.58, ±0.21 100/0/0 −0.8, ±15 −0.04,±0.78
30/33/37
HS (m min of effectivetime)
22 ± 14 12 ± 10 15 ± 8 −43, ±21 −0.73,±0.36
0/1/99 45, ±22 0.52, ±0.26 98/2/0 −18, ±13 −0.21,±0.15
0/48/52
Performance for backs (n = 168)TD (m) 960 ± 111 795 ± 104 859 ± 70 −17.0, ±4.1 −1.50,
±0.360/0/100 11.8, ±2.8 0.93, ±0.22 100/0/0 −7.4, ±1.8 −0.59,
±0.140/0/100
HS (m) 131 ± 56 80 ± 44 102 ± 28 −39, ±13 −1.0, ±0.34 0/0/100 29.4, ±9.6 0.60, ±0.20 100/0/0 −21.3, ±6.9 −0.44,±0.14
0/0/100
HS (%) 13.5 ± 5.2 9.8 ± 4.8 11.7 ± 2.9 −27, ±11 −0.76,±0.31
0/0/100 14.9, ±6.2 0.36, ±0.15 96/4/0 −16.5, ±6.9 −0.40,±0.16
0/2/98
HS in posses (m) 68 ± 39 42 ± 32 55 ± 18 −38, ±16 −0.79,±0.33
0/0/100 23.5, ±9.8 0.39, ±0.16 97/3/0 −23.9, ±9.9 −0.40,±0.17
0/2/98
HS out of posses (m) 51 ± 34 32 ± 29 38 ± 15 −37, ±18 −0.67,±0.33
0/1/99 33, ±16 0.45, ±0.22 97/3/0 −16, ±15 −0.22,±0.20
0/44/56
(Continued)
Perform
ancefluctuations
inrugby
unionmatch-play
5

between the first 5-min and the 75–80-min period.Differences in running performance in the 75–80-min period compared to the mean 5-min periodwere possibly to very likely small (−5.4, ±6.3 to−40, ±15%) in forwards while in backs, likely moder-ate differences in the distance covered at high speed(−45, ±13%; 0/0/100) were observed.Regarding skill-related performance in backs and
forwards, only possibly small to trivial declines inthe frequency of tackles and passes performed wereobserved between the first 5-min and the 75–80-min period. Similarly, only trivial or unclear differ-ences were observed between the final 5-min periodand the mean 5-min period for the number ofpasses and tackles performed. Differences insuccess rates in skill-related actions were not exam-ined due to insufficient numbers. When expressedrelative to effective playing time, unclear to trivialdifferences were reported for the frequency ofpasses and tackles.
In-game performance
In backs and forwards, very likely small to possiblevery large declines in running performance (−25,±12 to −51, ±19%) between the 5-min peak periodof activity and the following 5-min period wereobserved, whereas there were only unclear to possibletrivial differences in the frequency of skill-relatedmeasures (Table IV). Only unclear to likely trivialdifferences in high-speed running performance andthe frequency of skill-related measures were reportedbetween the 5-min period following the 5-min peakperiod and the mean 5-min period of the game.Differences in success rates in skill-related actionsonce again were not examined due to insufficientnumbers. When expressed relative to effectiveplaying time, there were only unclear to very likelysmall differences in the majority of the variables.
Discussion
To our knowledge, this is the first study to investigatefluctuations in physical and skill-related performanceduring international 15-a-side rugby union compe-tition. The main findings were: 1. A small drop intotal distance covered in the second-half wasobserved but generally this was not accompanied bydeclines in high-speed running distance or in the fre-quency of or success in skill-related perform-ance. 2. Players experienced substantial decrementsin high-speed running distance towards the end incomparison to the start of play but were able to main-tain skill-related action frequency and successrates. 3. There was no clear performance decrementin high-speed running performance and theT
able
II.Con
tinued
.
End
-gam
eflu
ctua
tion
s
Observedvalues
Last10
min
vsFirst
10min
First
10min
vsMean10
min
Last10
min
vsMean10
min
First
10min
Last1
0min
Mean
10min
Diff
%(90%
CI)
ES(90%
CI)
%Cha
nces
Diff
%(90%
CI)
ES(90%
CI)
%Cha
nces
Diff
%(90%
CI)
ES(90%
CI)
%Cha
nces
Passes(n)
1.4±2.6
1.3±2.5
1.4±2.3
−3,
±11
0−0.01
,±0.47
23/51/26
−2,
±16
0−0.01
,±0.72
32/35/33
−4,
±65
−0.02
,±0.29
11/74/15
Tackles
(n)
0.64
±1.00
0.70
±1.01
0.70
±0.50
10,±53
0.07
5,±0.39
30/58/12
−10
,±46
−0.08
,±0.37
11/60/30
−1,
±74
0−0.00
,±6.00
48/4/48
Suc
cessfulp
asses(%
)96
±12
89±22
95±6
−6.4,
±8.2
−0.20
,±0.25
1/51
/49
0,±90
0.01
,±2.7
45/10/45
−6.0,
±8.5
−0.18
,±0.26
1/53
/46
Suc
cessfultackles
(%)
83±35
68±42
77±21
−17
,±25
−0.18
,±0.26
1/53
/46
8,±48
0.08
,±0.47
33/51/16
−11
,±37
−0.11
,±0.36
8/59
/33
Effective
playingtime(s)
241±60
224±48
231±14
−7.0,
±3.6
−0.36
,±0.19
92/8/0
4.2,
±4.4
0.23
,±0.24
57/43/0
−3.1,
±5.1
−0.17
,±0.27
1/47
/52
TD
(mmin
ofeffective
time)
248±48
223±53
224±20
−10
,±3.8
−0.59
,±0.21
0/0/10
011
,±4
0.57
,±0.21
100/0/0
−0.44
,±22
−0.0,
±1.1
37/23/40
HS(m
min
ofeffective
time)
34±16
22±12
26±7
−36
,±15
−0.9,
±0.37
0/0/10
030
,±12
0.58
,±0.24
100/0/0
−16
,±8
−0.32
,±0.15
0/10
/90
6 M. Lacome et al.

Table III. Running and skill-related performance in back and forwards during the first 5-min period, the last 5-min period and the mean 5-min period of match-play.
End-game fluctuations
Observed values Last 5 min vs First 5 min First 5 min vs Mean 5 min Last 5 min vs Mean 5 min
First 5 min Last 5 min Mean 5 minDiff % (90%
CI)ES (90%
CI)%
ChancesDiff % (90%
CI)ES (90%
CI)%
ChancesDiff % (90%
CI)ES (90%
CI)%
Chances
Performance for forwards (n = 154)TD (m) 463 ± 67 349 ± 95 383 ± 28 −24.7, ±8.9 −1.65,
±0.600/0/100 21.0, ±7.6 1.16, ±0.42 100/0/0 −8.9, ±3.5 −0.49,
±0.190/1/99
HS (m) 53 ± 37 18 ± 20 29 ± 15 −66, ±24 −1.22,±0.44
0/0/100 87, ±31 0.86, ±0.31 100/0/0 −36, ±15 −0.36,±0.15
0/4/96
HS (%) 11.3 ± 6.7 4.7 ± 4.8 7.1 ± 8.3 −59, ±19 −1.11,±0.36
0/0/100 59, ±19 0.70, ±0.23 100/0/0 −34, ±12 −0.41,±0.14
0/1/99
HS in posses (m) 29 ± 23 11 ± 14 15 ± 8 −64, ±32 −1.06,±0.52
0/0/100 99, ±49 0.82, ±0.41 99/1/0 −29, ±22 −0.24,±0.18
0/37/63
HS out of posses (m) 23 ± 22 7 ± 12 13 ± 8 −68, ±33 −0.91,±0.45
0/0/100 79, ±39 0.59, ±0.29 99/1/0 −42, ±23 −0.32,±0.17
0/13/87
Passes (n) 0.22 ± 0.49 0.19 ± 0.41 0.21 ± 0.22 −15, ±60 −0.07,±0.29
6/70/24 6.8, ±130 0.03, ±0.6 32/42/26 −9, ±100 −0.04,±0.46
19/52/28
Tackles (n) 0.70 ± 0.98 0.50 ± 0.92 0.48 ± 0.24 −29, ±25 −0.26,±0.23
0/34/66 45, ±36 0.28, ±0.22 72/28/0 3, ±250 0.02, ±1.57 42/17/41
Effective playing time (s) 131 ± 33 120 ± 38 114 ± 7 −8.8, ±4.5 −0.39,±0.20
0/6/94 15.1, ±7.5 0.59, ±0.29 99/1/0 5.0, ±6.5 0.20, ±0.25 49/50/0
TD (m min of effectivetime)
221 ± 51 190 ± 72 201 ± 18 −14, ±6.9 −0.59,±0.29
0/1/99 9.8, ±5.3 0.38, ±0.21 93/7/0 −5.4, ±6.3 −0.21,±0.24
0/47/53
HS (m min of effectivetime)
26 ± 18 9 ± 10 15 ± 8 −65, ±24 −1.16,±0.42
0/0/100 72, ±26 0.75, ±0.27 100/0/0 −40, ±15 −0.41,±0.15
0/1/99
Performance for backs (n = 168)TD (m) 507 ± 82 385 ± 90 429 ± 35 −24.0, ±6.6 −1.60,
±0.440/0/100 18.3, ±5.0 1.03, ±0.28 100/0/0 −10.2, ±2.9 −0.57,
±0.160/0/100
HS (m) 73 ± 42 30 ± 28 51 ± 14 −59, ±14 −1.34,±0.32
0/0/100 43, ±10 0.68, ±0.16 100/0/0 −42, ±10 −0.66,±0.16
0/0/100
HS (%) 13.9 ± 6.7 7.0 ± 4.8 11.3 ± 8.3 −49, ±20 −1.19,±0.49
0/0/100 22.3, ±9.2 0.44, ±0.18 98/2/0 −38, ±16 −0.75,±0.31
0/0/100
HS in posses (m) 39 ± 26 16 ± 20 27 ± 9 −59, ±17 −1.09,±0.32
0/0/100 43, ±13 0.56, ±0.17 100/0/0 −41, ±13 −0.53,±0.17
0/0/100
HS out of posses (m) 29 ± 25 12 ± 17 20 ± 7 −59, ±22 −0.93,±0.34
0/0/100 48, ±17 0.51, ±0.18 100/0/0 −40, ±16 −0.42,±0.17
0/2/98
Passes (n) 0.72 ± 1.54 0.63 ± 1.61 0.68 ± 1.10 −12, ±49 −0.05,±0.20
2/88/10 5, ±110 0.02, ±0.43 24/56/20 −8, ±79 −0.03,±0.30
10/72/17
Tackles (n) 0.37 ± 0.77 0.29 ± 0.64 0.35 ± 0.23 −22, ±41 −0.14,±0.25
1/65/33 6, ±130 0.03, ±0.73 35/35/30 −18, ±51 −0.10,±0.30
5/66/29
(Continued)
Perform
ancefluctuations
inrugby
unionmatch-play
7
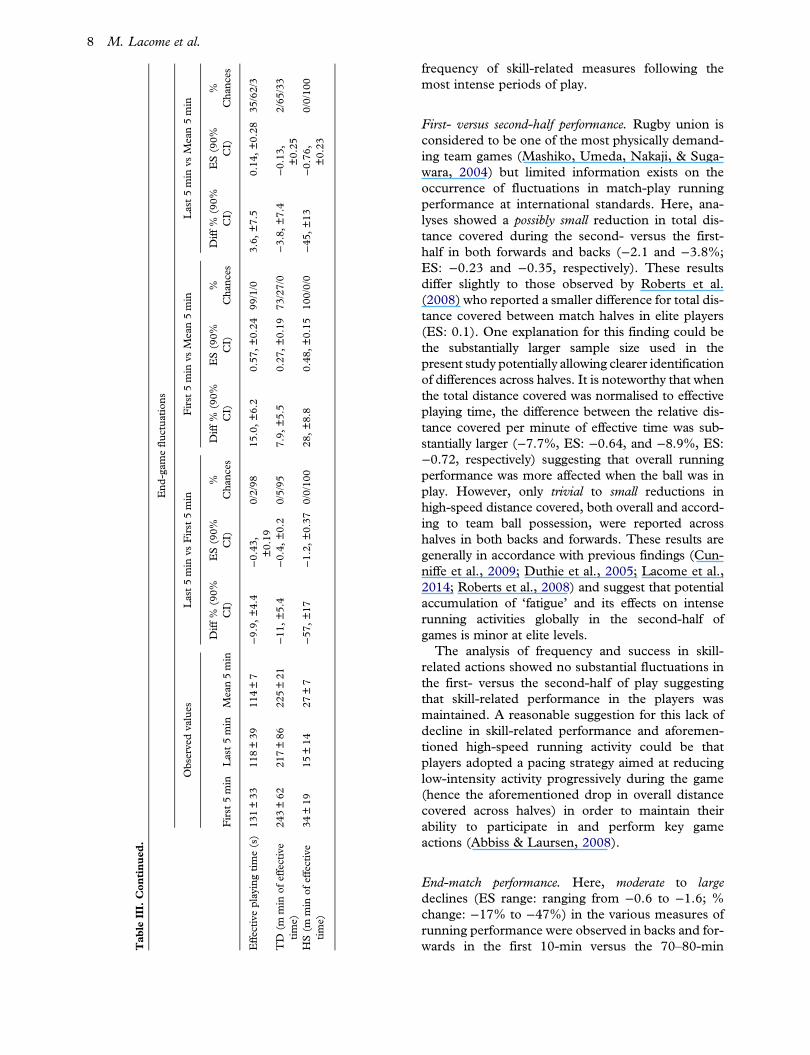
frequency of skill-related measures following themost intense periods of play.
First- versus second-half performance. Rugby union isconsidered to be one of the most physically demand-ing team games (Mashiko, Umeda, Nakaji, & Suga-wara, 2004) but limited information exists on theoccurrence of fluctuations in match-play runningperformance at international standards. Here, ana-lyses showed a possibly small reduction in total dis-tance covered during the second- versus the first-half in both forwards and backs (−2.1 and −3.8%;ES: −0.23 and −0.35, respectively). These resultsdiffer slightly to those observed by Roberts et al.(2008) who reported a smaller difference for total dis-tance covered between match halves in elite players(ES: 0.1). One explanation for this finding could bethe substantially larger sample size used in thepresent study potentially allowing clearer identificationof differences across halves. It is noteworthy that whenthe total distance covered was normalised to effectiveplaying time, the difference between the relative dis-tance covered per minute of effective time was sub-stantially larger (−7.7%, ES: −0.64, and −8.9%, ES:−0.72, respectively) suggesting that overall runningperformance was more affected when the ball was inplay. However, only trivial to small reductions inhigh-speed distance covered, both overall and accord-ing to team ball possession, were reported acrosshalves in both backs and forwards. These results aregenerally in accordance with previous findings (Cun-niffe et al., 2009; Duthie et al., 2005; Lacome et al.,2014; Roberts et al., 2008) and suggest that potentialaccumulation of ‘fatigue’ and its effects on intenserunning activities globally in the second-half ofgames is minor at elite levels.The analysis of frequency and success in skill-
related actions showed no substantial fluctuations inthe first- versus the second-half of play suggestingthat skill-related performance in the players wasmaintained. A reasonable suggestion for this lack ofdecline in skill-related performance and aforemen-tioned high-speed running activity could be thatplayers adopted a pacing strategy aimed at reducinglow-intensity activity progressively during the game(hence the aforementioned drop in overall distancecovered across halves) in order to maintain theirability to participate in and perform key gameactions (Abbiss & Laursen, 2008).
End-match performance. Here, moderate to largedeclines (ES range: ranging from −0.6 to −1.6; %change: −17% to −47%) in the various measures ofrunning performance were observed in backs and for-wards in the first 10-min versus the 70–80-minT
able
III.
Con
tinued
.
End
-gam
eflu
ctua
tion
s
Observedvalues
Last5min
vsFirst
5min
First
5min
vsMean5min
Last5min
vsMean5min
First
5min
Last5min
Mean5min
Diff
%(90%
CI)
ES(90%
CI)
%Cha
nces
Diff
%(90%
CI)
ES(90%
CI)
%Cha
nces
Diff
%(90%
CI)
ES(90%
CI)
%Cha
nces
Effective
playingtime(s)
131±33
118±39
114±7
−9.9,
±4.4
−0.43
,±0.19
0/2/98
15.0,±6.2
0.57
,±0.24
99/1/0
3.6,
±7.5
0.14
,±0.28
35/62/3
TD
(mmin
ofeffective
time)
243±62
217±86
225±21
−11
,±5.4
−0.4,
±0.2
0/5/95
7.9,
±5.5
0.27
,±0.19
73/27/0
−3.8,
±7.4
−0.13
,±0.25
2/65
/33
HS(m
min
ofeffective
time)
34±19
15±14
27±7
−57
,±17
−1.2,
±0.37
0/0/10
028
,±8.8
0.48
,±0.15
100/0/0
−45
,±13
−0.76
,±0.23
0/0/10
0
8 M. Lacome et al.

Table IV. Running and skill-related performance in back and forwards during the peak 5-min period, the following 5-min period and the mean 5-min period of match-play.
In-game fluctuations
Observed values Following 5 min vs Peak 5 min Peak 5 min vs Mean 5 min Following 5 min vs Mean 5 min
Peak5 min
Following5 min
Mean5 min
Diff % (90%CI)
ES (90%CI)
%Chances
Diff % (90%CI)
ES (90%CI)
%Chances
Diff % (90%CI)
ES (90%CI)
%Chances
Performance for forwards (n = 133)TD (m) 522 ± 49 391 ± 66 377 ± 26 −25, ±12 −2.4, ±1.2 0/0/100 39, ±19 2.7, ±1.3 100/0/0 3.8, ±2.8 0.26,
±0.1970/30/0
HS (m) 59 ± 39 30 ± 27 28 ± 15 −50, ±21 −0.90,±0.37
0/0/100 110, ±47 0.96,±0.40
100/0/0 7, ±39 0.06,±0.33
24/66/9
HS (%) 11.1 ±6.7
7.4 ± 6.4 7.0 ± 8.8 −33, ±14 −0.57,±0.23
0/1/99 58, ±24 0.63,±0.26
100/0/0 6, ±29 0.06,±0.32
23/68/9
HS in posses (m) 30 ± 25 15 ± 15 15 ± 8 −50, ±16 −0.78,±0.25
0/0/100 100, ±34 0.80,±0.26
100/0/0 2, ±240 0.01, ±1.9 43/14/43
HS out of posses (m) 27 ± 24 13 ± 18 12 ± 7 −51, ±21 −0.70,±0.29
0/0/100 130, ±54 0.78,±0.32
100/0/0 13, ±54 0.08,±0.32
27/66/7
Passes (n) 0.27 ±0.51
0.18 ± 0.42 0.21 ±0.21
−32, ±27 −0.18,±0.15
0/57/43 31, ±40 0.13,±0.17
26/74/0 −11, ±74 −0.05,±0.32
10/68/22
Tackles (n) 0.48 ±0.66
0.44 ± 0.73 0.49 ±0.25
−10, ±49 −0.075,±0.38
11/60/29 −1, ±280 0.0, ±2.2 44/12/44 −11, ±43 −0.09,±0.34
8/63/29
Effective playing time(s)
156 ± 32 106 ± 37 114 ± 8 −31, ±13 −1.68,±0.70
0/0/100 39, ±16 1.52,±0.63
100/0/0 −4.0, ±7.3 −0.16,±0.28
2/58/40
TD (m min ofeffective time)
205.6 ±43
233.7 ± 69 200.2 ±20
14, ±5.7 0.57, ±0.24 99/1/0 2.7, ±8.4 0.11,±0.34
34/60/7 17, ±6.9 0.69,±0.28
69/31/0
HS (m min of effectivetime)
23.6 ± 16 18.9 ± 19 14.8 ± 8 −20, ±12 −0.27,±0.16
0/23/77 59, ±29 0.51,±0.25
98/2/0 28, ±19 0.24,±0.16
67/33/0
Performance for backs (n = 146)TD (m) 567 ± 57 428 ± 72 422 ± 33 −24, ±10 −1.90,
±0.790/0/100 35, ±14 1.02,
±0.42100/0/0 2.6, ±2.8 0.15,
±0.1631/69/0
HS (m) 95 ± 40 47 ± 31 47 ± 13 −49, ±16 −1.37,±0.45
0/0/100 99, ±32 0.69,±0.23
100/0/0 1, ±96 0.01,±1.35
41/19/40
HS (%) 16 ± 6.1 10 ± 6.4 11 ± 2.7 −36, ±13 −1.00,±0.36
0/0/100 54, ±19 0.48,±0.17
100/0/0 −2, ±29 −0.04,±0.53
23/47/31
HS in posses (m) 51 ± 30 26 ± 24 25 ± 8 −50, ±18 −1.09,±0.39
0/0/100 110, ±39 0.56,±0.20
100/0/0 4, ±60 0.04,±0.63
34/40/26
HS out of posses (m) 36 ± 24 17 ± 19 19 ± 7 −51, ±19 −0.98,±0.35
0/0/100 94, ±34 0.46,±0.17
99/1/0 −5, ±51 −0.05,±0.5
20/49/31
Passes (n) 0.9 ± 1.6 0.6 ± 1.2 0.6 ± 1.1 −31, ±18 −0.16,±0.09
0/76/24 33, ±25 0.07,±0.05
0/100/0 −8, ±58 −0.03,±0.23
5/84/11
Tackles (n) 0.4 ± 0.7 0.3 ± 0.6 0.4 ± 0.2 −20, ±39 −0.13,±0.26
2/64/34 13, ±63 0.04,±0.19
8/90/2 −9, ±82 −0.06,±0.49
20/49/32
(Continued)
Perform
ancefluctuations
inrugby
unionmatch-play
9
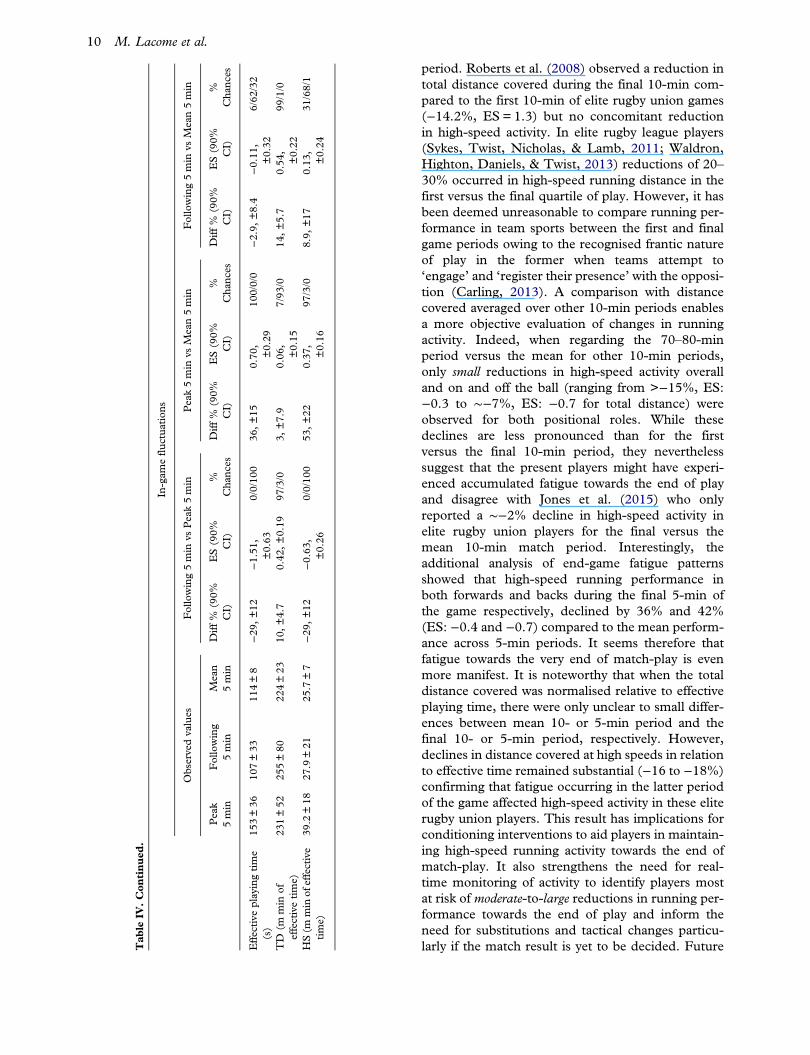
period. Roberts et al. (2008) observed a reduction intotal distance covered during the final 10-min com-pared to the first 10-min of elite rugby union games(−14.2%, ES = 1.3) but no concomitant reductionin high-speed activity. In elite rugby league players(Sykes, Twist, Nicholas, & Lamb, 2011; Waldron,Highton, Daniels, & Twist, 2013) reductions of 20–30% occurred in high-speed running distance in thefirst versus the final quartile of play. However, it hasbeen deemed unreasonable to compare running per-formance in team sports between the first and finalgame periods owing to the recognised frantic natureof play in the former when teams attempt to‘engage’ and ‘register their presence’ with the opposi-tion (Carling, 2013). A comparison with distancecovered averaged over other 10-min periods enablesa more objective evaluation of changes in runningactivity. Indeed, when regarding the 70–80-minperiod versus the mean for other 10-min periods,only small reductions in high-speed activity overalland on and off the ball (ranging from >−15%, ES:−0.3 to ∼−7%, ES: −0.7 for total distance) wereobserved for both positional roles. While thesedeclines are less pronounced than for the firstversus the final 10-min period, they neverthelesssuggest that the present players might have experi-enced accumulated fatigue towards the end of playand disagree with Jones et al. (2015) who onlyreported a ∼−2% decline in high-speed activity inelite rugby union players for the final versus themean 10-min match period. Interestingly, theadditional analysis of end-game fatigue patternsshowed that high-speed running performance inboth forwards and backs during the final 5-min ofthe game respectively, declined by 36% and 42%(ES: −0.4 and −0.7) compared to the mean perform-ance across 5-min periods. It seems therefore thatfatigue towards the very end of match-play is evenmore manifest. It is noteworthy that when the totaldistance covered was normalised relative to effectiveplaying time, there were only unclear to small differ-ences between mean 10- or 5-min period and thefinal 10- or 5-min period, respectively. However,declines in distance covered at high speeds in relationto effective time remained substantial (−16 to −18%)confirming that fatigue occurring in the latter periodof the game affected high-speed activity in these eliterugby union players. This result has implications forconditioning interventions to aid players in maintain-ing high-speed running activity towards the end ofmatch-play. It also strengthens the need for real-time monitoring of activity to identify players mostat risk of moderate-to-large reductions in running per-formance towards the end of play and inform theneed for substitutions and tactical changes particu-larly if the match result is yet to be decided. FutureT
able
IV.Con
tinued
.
In-gam
eflu
ctua
tion
s
Observedvalues
Following5min
vsPeak5min
Peak5min
vsMean5min
Following5min
vsMean5min
Peak
5min
Following
5min
Mean
5min
Diff
%(90%
CI)
ES(90%
CI)
%Cha
nces
Diff
%(90%
CI)
ES(90%
CI)
%Cha
nces
Diff
%(90%
CI)
ES(90%
CI)
%Cha
nces
Effective
playingtime
(s)
153±36
107±33
114±8
−29
,±12
−1.51
,±0.63
0/0/10
036
,±15
0.70
,±0.29
100/0/0
−2.9,
±8.4
−0.11
,±0.32
6/62
/32
TD
(mmin
ofeffectivetime)
231±52
255±80
224±23
10,±4.7
0.42
,±0.19
97/3/0
3,±7.9
0.06
,±0.15
7/93
/014
,±5.7
0.54
,±0.22
99/1/0
HS(m
min
ofeffective
time)
39.2
±18
27.9
±21
25.7
±7
−29
,±12
−0.63
,±0.26
0/0/10
053
,±22
0.37
,±0.16
97/3/0
8.9,
±17
0.13
,±0.24
31/68/1
10 M. Lacome et al.

work using both GPS and heart-rate monitoringwould be pertinent to analyse whether time-relatedchanges also occur for accelerations, collisions andforces exerted, repeated high-intensity activity andphysiological responses.It is noteworthy that no clear differences were
reported for the frequency of and success rates inskill-related events for the 70–80-min interval versusthe mean for 10-min periods suggesting skill-relatedperformance was maintained until the end of play.These results are in accordance with those observedin elite soccer (Carling &Dupont, 2011). A reasonableexplanation could be that the players adopted pacingstrategies in order to maintain their ability toperform key actions such as tackles and passes bydecreasing running activities notably low-intensityoutput (Jones et al., 2015). These results could alsotestify a change in collective strategy towards the endof the game. Indeed, irrespective of score, teamsmight aim to conserve ball possession using shortpasses close to the rucking zone rather than optingfor a kicking or expansive game thereby leading to anincreased frequency of actions such as tackles.Further studies are necessary to investigate whetherchanges in playing strategy impacts running andother elements of skill-related performance.
In-match performance. Research in team-sport match-play has shown that high-speed running distance and/or skill-related performance can be deleteriouslyaffected immediately following the most intense(peak) period of high-speed activity (Carling &Dupont, 2011; Kempton et al., 2014). Here, theanalysis of the 5-minute period following the peak5-minute period showed large to very large decreasesin high-speed distance covered. Yet whether playersactually experienced transient fatigue is unclear asrunning and skill-related performance during the5-min period immediately following the intense5-min period was not clearly affected when comparedto performance for the mean across other 5-minperiods. In addition, it is noteworthy that themost intense period of high-speed activity wasaccompanied by a very large increase in effectiveplaying time (time the ball was in play). Thus anysubsequent declines in relation to the following5-min period might simply be linked to a reductionin the time the ball was in play rather than to transientfatigue with the natural ebb and flow of the gameallowing players sufficient time to recover (Carling& Dupont, 2011). This suggestion was confirmedwhen running activity was normalised to effectiveplaying time. Indeed, though fluctuations wereobserved between the peak 5-min period and the fol-lowing 5-min period, running performance remainedhigher in both periods compared to the mean 5-min
period, in forwards and backs. These findingssuggest that players were comfortable with perform-ing game skills in situations of fatigue due to theircurrent training regimens and/or raise doubts onthe real-world need for players to actually practiceexecuting game skills under ‘fatigued’ conditions.Research is nevertheless warranted to analyserunning and skill-related performance followingintense prolonged continual attacking/defendingsequences where the ball is continually in play (e.g.up to 2-min) and whether individual physical fitnessis related to decrements in running activity.
Limitations. A limitation here was that player pos-itions were broken down into forward and back pos-itional groups only. Larger scale studies are thereforewarranted to provide more detailed inter-positionalcomparisons. In addition, the distance run at highspeeds was assessed using an absolute speedthreshold and not tailored to individual physiologicalcapacity potentially leading to under- or over-esti-mations in running performance (Reardon, Tobin,& Delahunt, 2015). Finally, recent evidence hasdemonstrated that pre-defined periods do not accu-rately represent peak running demands compared torolling periods (Varley, Elias, & Aughey, 2012). Assuch peak activity periods reported here should beinterpreted with caution.
Conclusion. This study investigated fluctuations inrunning and skill-related performance in inter-national 15-a-side rugby union competition. The dis-tance covered overall and at high speed during thesecond- versus the first-half did not decrease substan-tially in either forwards and backs while frequency ofand success in skill-related actions were unaffectedsuggesting that players were able to maintain per-formance. While no clear decrement in high-speedactivity was observed immediately following themost intense periods of the game, a clear reductionoccurred towards the end of play. However, skill-related performance remained unchanged suggestingthat the present international rugby union playersemployed pacing strategies to maintain their abilityto perform key actions throughout play.
Disclosure statement
No potential conflict of interest was reported by the authors.
References
Abbiss, C. R., & Laursen, P. B. (2008). Describing and under-standing pacing strategies during athletic competition. SportsMedicine, 38(3), 239–252.
Performance fluctuations in rugby union match-play 11

Batterham, A. M., & Hopkins, W. G. (2006). Making meaningfulinferences about magnitudes. International Journal of SportsPhysiology Perform, 1(1), 50–57.
Bradley, P. S., & Noakes, T. D. (2013). Match running perform-ance fluctuations in elite soccer: Indicative of fatigue, pacingor situational influences? Journal of Sports Sciences, 31(15),1627–1638. doi:10.1080/02640414.2013.796062
Bradley, P. S., Sheldon, W., Wooster, B., Olsen, P., Boanas, P., &Krustrup, P. (2009). High-intensity running in English FAPremier League soccer matches. Journal of Sports Sciences, 27(2), 159–68. doi:10.1080/02640410802512775
Carling, C. (2013). Interpreting Physical Performance inProfessional Soccer Match-Play: Should We be MorePragmatic in Our Approach? Sports Medicine , 43(8), 655–63.doi:10.1007/s40279-013-0055-8
Carling, C., Bloomfield, J., Nelsen, L., & Reilly, T. (2008). Therole of motion analysis in elite soccer: Contemporary perform-ance measurement techniques and work rate data. SportsMedicine, 38(10), 839–862.
Carling, C., & Dupont, G. (2011). Are declines in physical per-formance associated with a reduction in skill-related perform-ance during professional soccer match-play? Journal of SportsSciences, 29(1), 63–71. doi:10.1080/02640414.2010.521945
Carling, C., Williams, A. M., & Reilly, T. (2005). The handbook ofsoccer match analysis. Abington: Routledge.
Cunniffe, B., Proctor, W., Baker, J. S., & Davies, B. (2009). Anevaluation of the physiological demands of elite rugby unionusing global positioning system tracking software. Journal ofStrength and Conditioning Research, 23(4), 1195–1203. doi:10.1519/JSC.0b013e3181a3928b
Duthie, G., Pyne, D., & Hooper, S. (2005). Time motion analysisof 2001 and 2002 super 12 rugby. Journal of Sports Sciences, 23(5), 523–530. doi:10.1080/02640410410001730188
Hopkins, W. G., Marshall, S. W., Batterham, A. M., & Hanin, J.(2009). Progressive statistics for studies in sports medicineand exercise science. Medicine and Science in Sports andExercise, 41(1), 3–13. doi:10.1249/MSS.0b013e31818cb278
Hulin, B. T., &Gabbett, T. J. (2015). Activity profiles of successfuland less-successful semi-elite Rugby league teams. InternationalJournal of Sports Medicine, 36(6), 485–489. doi:10.1055/s-0034-1398532
Hulin, B. T., Gabbett, T. J., Kearney, S., & Corvo, A. (2015).Physical demands of match play in successful and less-successfulelite Rugby league teams. International Journal of Sports Physiologyand Performance, 10(6), 703–710. doi:10.1123/ijspp.2014-0080
Jones, M. R., West, D. J., Crewther, B. T., Cook, C. J., & Kilduff,L. P. (2015). Quantifying positional and temporal movementpatterns in professional rugby union using global positioningsystem. European Journal of Sport Science, 15(6), 488–96.doi:10.1080/17461391.2015.1010106
Kempton, T., Sirotic, A. C., Cameron, M., & Coutts, A. J. (2013).Match-related fatigue reduces physical and technical
performance during elite rugby league match-play: A casestudy. Journal of Sports Sciences, 31(16), 1770–1780. doi:10.1080/02640414.2013.803583
Kempton, T., Sirotic, A. C., & Coutts, A. J. (2014). An integratedanalysis of match-related fatigue in professional rugby league.Journal of Sports Sciences, 33(1), 39–47. doi:10.1080/02640414.2014.921832
Lacome, M., Piscione, J., Hager, J.-P., & Bourdin, M. (2014). Anew approach to quantifying physical demand in rugby union.Journal of Sports Sciences, 32(3), 290–300. doi:10.1080/02640414.2013.823225
Mashiko, T., Umeda, T., Nakaji, S., & Sugawara, K. (2004).Position related analysis of the appearance of and relationshipbetween post-match physical and mental fatigue in universityrugby football players. British Journal of Sports Medicine, 38(5),617–621.
Rampinini, E., Impellizzeri, F. M., Castagna, C., Coutts, A. J., &Wisloff, U. (2009). Technical performance during soccermatches of the Italian serie a league: Effect of fatigue and com-petitive level. Journal of Science and Medicine in Sport, 12(1),227–233. doi:10.1016/j.jsams.2007.10.002
Randers, M., Mujika, I., & Hewitt, A. (2010). Application of fourdifferent football match analysis systems: A comparative study.Journal of Sports Sciences, 28(2), 171–182.
Reardon, C., Tobin, D. P., & Delahunt, E. (2015). Application ofindividualized speed thresholds to interpret position specificrunning demands in elite professional Rugby union: A GPSstudy. PloS One, 10(7), e0133410. doi:10.1371/journal.pone.0133410
Roberts, S. P., Trewartha, G., Higgitt, R. J., El-Abd, J., & Stokes,K. A. (2008). The physical demands of elite English rugbyunion. Journal of Sports Sciences, 26(8), 825–833. doi:10.1080/02640410801942122
Sirotic, A. C., Coutts, A. J., Knowles, H., & Catterick, C. (2009).A comparison of match demands between elite and semi-eliterugby league competition. Journal of Sports Sciences, 27(3),203–211. doi:10.1080/02640410802520802
Sykes, D., Twist, C., Nicholas, C., & Lamb, K. (2011). Changes inlocomotive rates during senior elite rugby league matches, 29(12), 1263–1271. doi:10.1080/02640414.2011.582507
Varley,M. C., Elias, G. P., & Aughey, R. J. (2012). Current match-analysis techniques’ underestimation of intense periods of high-velocity running. International Journal of Sports PhysiologyPerform, 7(2), 183–185.
Waldron, M., Highton, J., Daniels, M., & Twist, C. (2013).Preliminary evidence of transient fatigue and pacing duringinterchanges in rugby league. International Journal of SportsPhysiology Perform, 8(2), 157–164. doi:10.1123/ijspp.2013-0390
Winter, E. M., Abt, G. A., & Nevill, A. M. (2014). Metrics ofmeaningfulness as opposed to sleights of significance. Journalof Sports Sciences, 32(10), 901–902. doi:10.1080/02640414.2014.895118
12 M. Lacome et al.
View publication statsView publication stats