fluctuations of the sunspot umbra-penumbra ratio
TRANSCRIPT
MASTER’S THESIS
2003:169 CIV
CSILLA SZASZ
Fluctuations of theSunspot Umbra-Penumbra Ratio
MASTER OF SCIENCE PROGRAMME
Kiruna Space and Environment Campus
2003:169 CIV • ISSN: 1402 - 1617 • ISRN: LTU - EX - - 03/169 - - SE

Abstract
In this thesis the search for any solar variable showing a cyclic behaviour in the DebrecenPhotoheliographic Data (DPD) is presented. DPD is a detailed sunspot catalogue thathas not been explored in this way before. The method used is to test parametersincluded, or calculated out of the given ones in the DPD and plotting the monthlyaverages with the standard error. Fluctuations present, reveal themselves as periodiccurves.
In our analyses the umbra-penumbra area ratio is found to vary in a quasi-biennialmanner. The amplitude of the periodicity decreases with increasing size of sunspots butseems to be independent of, e.g., the complexness and age of sunspot groups.
Periodicity analyses of the phenomenon show that the variation has a period thatmay vary from 1.5 to 3 years or more during the solar cycle.
i


Preface
When I started my university studies four and a half years ago, the diploma work seemedas distant as the Sun, but time has brought me along quickly. This master thesis containsmy last efforts at the Master of Science Programme in Space Engineering at the LuleåUniversity of Technology (LTU) in Sweden.
This preface does not only appear in my thesis but also in the thesis Solar Mid-TermPeriodicities, written by Johan Kero. We have composed the preface together sincewe, both being students at the same study programme, have accomplished our diplomawork in close collaboration. Our research has been carried out at the HeliophysicalObservatory of the Hungarian Academy of Sciences, in the city of Debrecen, Hungary,where we have spent five months during the autumn of 2002. Already during the firstmonths of our analyses, we discovered something interesting enough about sunspots todeserve full-time concern from the both of us during the rest of our stay. To satisfy thedemand of two separate reports from our home institution at LTU, our investigationsare divided into two self-reliant parts, compiled to be digestible on their own. For acomplete overview, the interested reader is advised to read both theses.
We would first of all like to thank our supervisor András Ludmány at the HeliophysicalObservatory for his engagement, help and encouragement during the course of our work.Also Tünde Baranyi has been a great help, taking her time to look at new results andtrying to interpret them. Without the help of György Mezo, with his experience andpatience opening doors to methods and software of which we did not have previousknowledge, the computations would have been much slower. All three of them havehelped us with valuable ideas and discussions making our work interesting and fun.
We would also like to express our gratitude to László Tóth for taking active part inmaking our stay at the Heliophysical Observatory unforgettable.
Sverker Fredriksson and Björn Graneli have been our allies at LTU, encouraging andassisting us with the arrangements before we left for Hungary and always eager to helpand answer questions during our stay abroad.
This research work has been financed by long-term scholarships from the HungarianMinistry of Education and support from Ångpanneföreningen’s Research Foundation.Our journey to Hungary has been funded by travel scholarships from the Seth M. KempeFoundation.
The content of this thesis has been partly presented at two separate occasions in Hun-gary. One was a talk at the 30th National Ionospheric and Magnetospheric Seminarin Tihany, November 11-13, 2002, the other a one-hour seminar at the AstronomicalDepartment at the Eötvös Loránd University in Budapest, November 20, 2002.
iii


Csilla Szasz - Fluctuations of the Sunspot Umbra-Penumbra Ratio
Contents
1 Introduction 1
2 Introduction to Sunspot Physics 32.1 The Structure of the Photosphere . . . . . . . . . . . . . . . . . . . . . . 3
2.1.1 The Granulation . . . . . . . . . . . . . . . . . . . . . . . . . . . 32.1.2 The Mesogranulation . . . . . . . . . . . . . . . . . . . . . . . . . 42.1.3 The Supergranulation . . . . . . . . . . . . . . . . . . . . . . . . 4
2.2 The Solar Cycle . . . . . . . . . . . . . . . . . . . . . . . . . . . . . . . 42.3 Descriptive Introduction to Sunspots . . . . . . . . . . . . . . . . . . . . 52.4 Sunspots as Described by Magnetic Flux Tubes . . . . . . . . . . . . . . 5
2.4.1 Simplified Description of Sunspot Formation . . . . . . . . . . . 62.4.2 Monolithic and Cluster Models . . . . . . . . . . . . . . . . . . . 7
2.5 Limb Darkening . . . . . . . . . . . . . . . . . . . . . . . . . . . . . . . . 92.6 The Wilson Effect . . . . . . . . . . . . . . . . . . . . . . . . . . . . . . 9
3 DPD - Debrecen Photoheliographic Data 113.1 Overview and History . . . . . . . . . . . . . . . . . . . . . . . . . . . . 113.2 Observational Technique . . . . . . . . . . . . . . . . . . . . . . . . . . 11
3.2.1 Instruments and Observational Material . . . . . . . . . . . . . . 123.2.2 Systematic Error Reduction . . . . . . . . . . . . . . . . . . . . . 123.2.3 Procedure for Cloudy Days . . . . . . . . . . . . . . . . . . . . . 12
3.3 Measuring Positions and Areas . . . . . . . . . . . . . . . . . . . . . . . 133.3.1 Position . . . . . . . . . . . . . . . . . . . . . . . . . . . . . . . . 133.3.2 Umbra and Penumbra Areas . . . . . . . . . . . . . . . . . . . . 133.3.3 Resolution . . . . . . . . . . . . . . . . . . . . . . . . . . . . . . . 13
3.4 Catalogue Extension . . . . . . . . . . . . . . . . . . . . . . . . . . . . . 143.5 Catalogue Structure . . . . . . . . . . . . . . . . . . . . . . . . . . . . . 14
3.5.1 The Graphical Catalogue . . . . . . . . . . . . . . . . . . . . . . 143.5.2 The Numerical Catalogue . . . . . . . . . . . . . . . . . . . . . . 15
4 Other Sunspot Databases 194.1 Greenwich Photoheliographic Results . . . . . . . . . . . . . . . . . . . . 194.2 DPR - Debrecen Photoheliographic Results . . . . . . . . . . . . . . . . 194.3 SOON - Solar Optical Observing Network . . . . . . . . . . . . . . . . . 204.4 Mount Wilson Data . . . . . . . . . . . . . . . . . . . . . . . . . . . . . 204.5 Catania Astrophysical Observatory . . . . . . . . . . . . . . . . . . . . . 214.6 Solar Phenomena . . . . . . . . . . . . . . . . . . . . . . . . . . . . . . . 214.7 The Chinese Solar-Geophysical Data . . . . . . . . . . . . . . . . . . . . 214.8 Sunspot Index Data Centre . . . . . . . . . . . . . . . . . . . . . . . . . 214.9 Conclusions . . . . . . . . . . . . . . . . . . . . . . . . . . . . . . . . . . 21
5 Earlier Investigations on the Umbra-Penumbra Ratio 235.1 On the Umbra-Penumbra Area Ratio . . . . . . . . . . . . . . . . . . . . 235.2 Conclusions . . . . . . . . . . . . . . . . . . . . . . . . . . . . . . . . . . 23
v

Csilla Szasz - Fluctuations of the Sunspot Umbra-Penumbra Ratio
6 Our Investigations 256.1 Scientific Goal . . . . . . . . . . . . . . . . . . . . . . . . . . . . . . . . . 256.2 Attempts Carried into Effect . . . . . . . . . . . . . . . . . . . . . . . . 256.3 Investigation Methods . . . . . . . . . . . . . . . . . . . . . . . . . . . . 256.4 Error Reduction in the DPD Catalogue . . . . . . . . . . . . . . . . . . 26
7 The Umbra and Penumbra Areas for Sunspot Groups 277.1 The Mean Umbra Area . . . . . . . . . . . . . . . . . . . . . . . . . . . 277.2 The Mean Penumbra Area . . . . . . . . . . . . . . . . . . . . . . . . . . 287.3 Conclusions . . . . . . . . . . . . . . . . . . . . . . . . . . . . . . . . . . 28
8 The Umbra-Penumbra Area Ratio 338.1 The Umbra-Penumbra Area Ratio for Sunspots . . . . . . . . . . . . . . 33
8.1.1 Procedure . . . . . . . . . . . . . . . . . . . . . . . . . . . . . . . 338.1.2 All Sunspots Included . . . . . . . . . . . . . . . . . . . . . . . . 338.1.3 Each Sunspot Group Only Counted Once . . . . . . . . . . . . . 348.1.4 Sunspots at the Solar Limb Omitted . . . . . . . . . . . . . . . . 358.1.5 Sunspots on the Northern and Southern Hemisphere Separated . 368.1.6 Sunspots Divided into Sizes . . . . . . . . . . . . . . . . . . . . . 368.1.7 Sunspots with More than one Umbra or/and Penumbra Excluded 408.1.8 Short- and Long-Lived Sunspots . . . . . . . . . . . . . . . . . . 418.1.9 With the Second Half of the Year 1989 Included . . . . . . . . . 42
8.2 The Umbra-Penumbra Area Ratio for Sunspot Groups . . . . . . . . . . 428.2.1 The DPD . . . . . . . . . . . . . . . . . . . . . . . . . . . . . . . 438.2.2 Jumps in the Two-Year Periodicity . . . . . . . . . . . . . . . . . 438.2.3 The DPR . . . . . . . . . . . . . . . . . . . . . . . . . . . . . . . 468.2.4 The Greenwich Catalogue . . . . . . . . . . . . . . . . . . . . . . 46
8.3 Conclusions . . . . . . . . . . . . . . . . . . . . . . . . . . . . . . . . . . 46
9 Quasi-Biennial Variations of the Sunspot Umbra-Penumbra Ratio 499.1 Spectral Analysis of the Umbra-Penumbra Area Ratio Fluctuation . . . 499.2 A Bridge Over the Gap? . . . . . . . . . . . . . . . . . . . . . . . . . . . 519.3 Variation of the Cycle Length? . . . . . . . . . . . . . . . . . . . . . . . 519.4 Conclusions . . . . . . . . . . . . . . . . . . . . . . . . . . . . . . . . . . 53
10 The Future 5510.1 The Future of the DPD at the Debrecen Heliophysical Observatory . . . 5510.2 The Future of the Quasi-Biennial Variation of the Sunspot Umbra-Penumbra
Area Ratio . . . . . . . . . . . . . . . . . . . . . . . . . . . . . . . . . . 55
Appendix A. Table of Photoheliograms in the DPD 57
Appendix B. Table of the Number of Sunspots in Different Investigations 59
References 61
vi

Csilla Szasz - Fluctuations of the Sunspot Umbra-Penumbra Ratio
1 Introduction
Our nearest star, the Sun, is very interesting not the least because of its great influenceon life here on Earth. Visible features that are relatively easy to observe are sunspots,tempting scientists around the world to toil at their telescopes in search for betterunderstanding of the heart of our solar system.
During my diploma work at the Heliophysical Observatory in Debrecen, Hungary, Ihave together with Johan Kero found a new feature in the behaviour of sunspots thathas not been seen before. The umbra-penumbra area ratio of sunspots has interestedscientists before, but none has detected the quasi-biennial fluctuation of this parameter,found by analyses based on the Debrecen Photoheliographic Data (DPD), a detailedcatalogue of the sunspot activity.
This thesis gives a complete description of our analyses, beginning with an introduc-tion to sunspot physics (Section 2) followed by a presentation of the DPD containinginformation about the instruments used, measuring techniques and catalogue structure(Section 3). After some words about other well-known sunspot databases in the world,Section 5 deals with earlier investigations on related subjects. Sections 6 summarizes ourtask, which was to search any solar photospheric features showing a periodicity presentin the DPD, and method of investigation of our diploma work.
The results regarding the umbra and penumbra areas for sunspot groups and the al-ready mentioned quasi-biennial periodicity of the umbra-penumbra area ratio for mainlysunspots, but also for sunspot groups, can be found in Sections 7 and 8 respectively.Period analyses of this phenomenon can be found in Section 9.
The final section, Section 10, reveals the future of the DPD and also the work wehave concluded. Though the last chapter in this thesis, our work did not end at thatpoint. When finished with our data analyses, an investigation on some ideas of possiblephysical interpretations began and this can be found, together with a wide survey ofother solar mid-term periodicities, in the thesis of J. Kero [Ke03].
1


Csilla Szasz - Fluctuations of the Sunspot Umbra-Penumbra Ratio
2 Introduction to Sunspot Physics
The striking visible features of sunspots are the dark central umbra and a lighter outerpenumbra. This has been known for a very long time. The Egyptians, for example, wereprobably aware of sunspots already at their time since their sign for the Sun, which westill use today, is a circle with a dot in the middle, i.e., ¯. Indeed, very large singlesunspots or more often compact sunspot groups are visible to the naked eye, throughan appropriate filter of course. The Egyptians probably had good opportunities to seesunspots during, e.g., sand storms. A suitably thick cloud cover or heavy smoke from afire are other natural filters more common here in Europe.
J. Fabricius, G. Galilei and C. Scheiner made the first telescopic observations ofthe Sun in the year of 1611. Engravings made during the 17th century show that theobservations of that time were already detailed enough to enable distinction betweenthe umbra and the penumbra. The umbra and the penumbra of sunspots being situateddeeper than the surrounding photosphere like a saucer, termed the Wilson depression,was discovered during the next century, in 1769 to be precise. The penumbral filamentswere revealed in 1801 by W. Herschel [Pr84]. Observations of the latter are front-page news still today because of the successful first half-year of the Swedish 1-m SolarTelescope on La Palma, Canary Islands and its outstanding high-resolution pictureswhere the filaments can be seen to consist of dark cores inside lighter outer shells [Sh02].
2.1 The Structure of the Photosphere
The photosphere is the outer surface of the Sun as seen in white light, but being entirelygaseous, the Sun has no solid surface. The word photosphere means the sphere in whichsunlight originates and comes from the Greek ’photos’ for light. The photosphere isextremely thin and is situated at the top of the Sun’s convective zone. It is easier tostudy the photosphere than the unseen zones below and the transparent and variablelayers above.
The photosphere is covered with a small-scale velocity pattern known as granulation,and large-scale ones called mesogranulation and supergranulation.
2.1.1 The Granulation
The photosphere is not uniformly bright, nor is it still. The Sun’s surface at the photo-spheric level is completely covered by irregularly polygonally shaped granules, as seenin Figure 1.
The granules are bright with dark, narrow lines in-between. The granules are con-vective overshoots of the centre of which hot plasma is rising (0.4 km/s) from the Sun’s
Figure 1: The granular structure of the photosphere.
3

Csilla Szasz - Fluctuations of the Sunspot Umbra-Penumbra Ratio
interior, then spreading horizontally (0.25 km/s). At the intergranular boundaries atthe edges of the cells, cool material is falling.
The diameter of the granules are typically 700 to 1500 km, corresponding to anangular size of 1 to 2 arcseconds. The mean distance between the cells is about 1800 km,and their mean lifetime is circa 8 minutes.
2.1.2 The Mesogranulation
The mesogranulation is very difficult to detect and is therefore less well-known thanthe granulation and the supergranulation. Typical sizes of the mesogranules are 5 000to 10 000 km. The characteristic speed in both the vertical and horizontal direction isabout 60 m/s.
2.1.3 The Supergranulation
There is also a much larger scale pattern than the granulation, namely the supergran-ulation. The supergranulation gives rise to a network of irregularly shaped cells, withdiameters ranging from 20 000 to 54 000 km and magnetic fields concentrated at theirboundaries. They are made up of plasma rising in the centre (0.1 km/s) and continuinghorizontally outward (0.3 - 0.4 km/s) to descend at the rims (0.1 - 0.2 km/s) of thesupergranules.
All these velocities are difficult to sense, but the fastest winds in the most severehurricanes here on Earth have a velocity of 0.1 km/s.
[Fo90] [La00] [Ni82] [Pr84] [Zi88]
2.2 The Solar Cycle
The number of sunspots visible on the solar disc varies in a periodic way, and this 11-year cyclic behaviour of solar activity was discovered in 1843 by H. Schwabe [Fo90]. Thestate of the solar cycle is given by the relative sunspot number defined as
R = K · (10g + f ), (1)
where g is the observed number of groups, f the observed number of sunspots, andK is a correction factor (typically 0.6), different for different observatories allowingfor varying sizes of telescopes, atmospheric conditions and relative enthusiasm of theobserver making the counts [Zi88]. This formula was introduced in 1848 by the Swissastronomer J. R. Wolf [Pr84] as a measure of solar activity. It is therefore also referredto as the Wolf number.
The solar cycle is not exactly 11 years but varies. The cycle rises from minimumto maximum faster than it declines to minimum again. The average time between twomaxima varies from 7.3 to 17.1 years and between minima from 9.0 to 13.6 years [Pr84].
During activity minimum the number of sunspots on the Sun is low compared tothe huge amount of spots that are often observed during maximum. Sunspots are mostoften located between the equator and a latitude of ± 35. In the beginning of a solarcycle sunspots appear on higher latitudes, but the highest active latitude drifts towardsthe equator as the solar cycle elapses. The average latitude being dependent on thephase of the solar cycle was first detected in 1859 by R. Carrington [Fo90].
4

Csilla Szasz - Fluctuations of the Sunspot Umbra-Penumbra Ratio
Around 97% of all leading spots of bipolar sunspot groups have the same polaritythroughout the solar cycle, but with opposite signs on both hemispheres. With theleading spot, the west spot is meant, which leads in the solar rotation and the eastspot is denoted as following. The polarity of the sun reverses at about solar maximum,forming a 22-year cycle called the Hale cycle.
An interesting magnetic feature is that the magnetic axis of bipolar sunspot groupsis inclined in such a way that the leading spot is closer to the equator than the followingones. [Fo90] [Pr84] [Ze98]
2.3 Descriptive Introduction to Sunspots
Regions with high magnetic activity are called active regions, and it is within thesethat sunspots most often arise. Sunspots observed in white-light consist typically of adarker, inner region called umbra surrounded by a lighter penumbra. The reason forthe sunspots being darker than the surrounding photosphere is that they are cooler.There is a wide variety of sunspot structures. Sunspots are irregular in shape and onlyvery seldom circular, if ever, sometimes an umbra even lacks a penumbra or vice versa.Umbra diameter sizes range from about 2 000 km to far above 20 000 km.
Less dark features without a penumbra and smaller than about 2 500 km in diameterare termed pores. These have much shorter lifetimes than spots, about a few tens ofminutes. The sunspots live from a couple of hours to weeks.
A granulation structure similar to the photospheric one, but in smaller scale, can beobserved within the umbra area. The penumbra consists of penumbral filaments, which,in turn, consist of dark cores inside lighter outer shells.
Sunspots occur most frequently in groups, which can have different characteristics.The Mt. Wilson magnetic classification of sunspots, or rather sunspot groups, wasintroduced in 1919 and is summarized in Table 1. [Fo90] [Pr84] [Zi88]
Sunspot Class Characteristics
α A single, dominant spotβ A pair of dominant spots of opposite polarityγ Complex groups with irregular distributions of polaritiesβγ Bipolar groups with no marked north-south inversion lineδ Umbrae with opposite polarity in a single penumbra
Table 1: Table of the Mt. Wilson magnetic classification of sunspots. [Zi88]
2.4 Sunspots as Described by Magnetic Flux Tubes
The knowledge of the structure of sunspots is in a sense not more certain than theassumptions one can make of the structure of a tree by looking at the tree top fromabove. The leaves and branches hide the underlying stem from direct inspection. Severaltheoretical attempts have been made to describe the sunspot phenomenon, but it is stillnot possible to distinguish right from wrong. Different models are used in differentcontexts.
5

Csilla Szasz - Fluctuations of the Sunspot Umbra-Penumbra Ratio
2.4.1 Simplified Description of Sunspot Formation
Deep in the convective zone the kinetic energy density of the plasma convective motionsis much higher than the magnetic energy density,
ρ · U22
À B2
2µ, (2)
where ρ is the plasma mass density, U is the characteristic speed, B the magnetic fieldstrength and µ the magnetic permeability. Furthermore the magnetic Reynold’s numberRm can be much larger than unity,
Rm =U · Lη
À 1 (3)
where L is the characteristic length scale and η is the magnetic diffusivity. In these casesthe magnetic field lines behave as if they were frozen into the plasma. They move withit and can be stretched and wound up by the plasma motions. These processes continueuntil the magnetic field lines are stretched so much that the magnetic energy densityexceeds the kinetic energy density or the local magnetic Reynold’s number decreases toan order of unity.
Many magnetic phenomena of the Sun, such as the overall structure of sunspotsand prominences, can be described by magnetohydrostatic equations since they appearstationary on time-scales comparable to the Alfvén travel time, τA. The Alfvén traveltime is given by
τA = L · 1vA= L ·
√µ · ρ0B0
, (4)
where L once again is the characteristic length scale of the phenomenon, vA the Alfvénvelocity, ρ0 and B0 are typical values of the plasma density and the magnetic fieldstrength. The characteristics of a magnetic flux tube in hydrostatic pressure equilibriumwith its surroundings are governed by
kB · Te · ρeme
=kB · Ti · ρi
mi+B2i2µ, (5)
where kB is Boltzmann’s constant, T the temperature, ρ the density, m the mean par-ticle mass and B the magnetic field strength, all with indices e and i corresponding toexternal and internal properties of the flux tube. The magnetic field strength outsideflux tubes is low enough for the external magnetic pressure to be neglected in compari-son with the dominating plasma gas pressure, appearing alone on the left-hand side ofEquation (5). This is not the case inside flux tubes where the contributions from themagnetic pressure, given by the second term on the right-hand side of Equation (5), aresignificant. The flux tube will hereby due to equilibrium conditions have an internaldensity and temperature lower than its surroundings since the external gas pressure onthe left-hand side of Equation (5) is balanced by the sum of the internal gas pressureand the internal magnetic pressure on the right-hand side.
If the flux tube has lower density than its surroundings, it will start rising due togravitational forces, as illustrated in Figure 2.
6

Csilla Szasz - Fluctuations of the Sunspot Umbra-Penumbra Ratio
Figure 2: Schematic sketch of emerging flux tube [Pr84]. Where the Ω-shaped flux tube penetrates thephotospheric surface, sunspots are seen having the characteristic temperature deficiency and excess ofmagnetic field strength compared to the surrounding photosphere.
The rising process of flux tubes can continue as long as the buoyancy forces on theleft-hand side of Equation (6) are larger than the restoring magnetic tension on theright-hand side, caused by the curvature of the field lines,
(ρe − ρi) · g >B2iµ · d , (6)
where g is the local gravitational constant and d is the distance between the footprintsof the flux tube in the convective zone. The magnetic field strength of the flux tubedecreases as the tube reaches the photospheric surface. There the flux tube, still con-sidered to be in horizontal equilibrium, is allowed to fan out because of the with heightdecreasing external temperature. Depending on the distance between the footprints ofthe flux tube, the vertically rising tube can decelerate to an equilibrium where the buoy-ancy force equals the magnetic tension force, since the latter is a function of the radiusof curvature. Where the flux tube penetrates the visible photospheric surface, sunspotsare seen, having the characteristics of the flux tube: a temperature deficit and an excessof magnetic field strength compared to the surrounding plasma.
2.4.2 Monolithic and Cluster Models
There are basically three different theoretical models for how sunspots are formed byflux tubes and maintained stable in the photosphere. The classical picture is that asunspot is formed by a single magnetic flux tube, which makes out the base of themagnetohydrostatic and magnetoconvective models. These models are called monolithicand one expects that the vertical dimensions of a sunspot is of the same order as thehorizontal dimensions, as illustrated in Figure 3, from [Pa79]. The third theoreticalmodel is called the cluster model.
The monolithic models of sunspots are developed on a well-defined set of mathe-matical equations, but have difficulties in explaining why the surface temperature of∼3 900 K and the magnetic field strength of 3 kG seem to be independent of sunspotdimensions. The cluster model introduced by E. N. Parker in 1979 [Pa79] is, on the
7

Csilla Szasz - Fluctuations of the Sunspot Umbra-Penumbra Ratio
Figure 3: Cross-section sketch illustrating the scaling of the magnetic structure of sunspots according tomonolithic sunspot models by E. N. Parker [Pa79].
other hand, not firmly developed on a mathematical basis, but explains the mentionedqualitative features well.
In the cluster model, a sunspot is made up of a bunch of flux tubes held togetherby buoyancy forces due to the fanning out of field lines in the upper photosphere,appearing as one single visible unit. A qualitative sketch by E. N. Parker is presentedin Figure 4. Any small flux tube that tries to separate from the unified cluster in theupper photosphere, has to move outward and downward against the stabilizing buoyancyforces. Further down, where the sides of the flux tubes decline to the vertical direction,the buoyancy forces can no longer stabilize the cluster, and the flux tubes break apart.The depth where this happens can be thought as approximately the same for all sizes ofsunspots. There might also be a characteristic size of the separate flux tubes involved,which might explain the independence of sunspot size to parameters such as surfacetemperature and magnetic field strength.
Figure 4: Cross-section of the magnetic structure of a large sunspot according to the cluster model [Pa79].
8
Csilla Szasz - Fluctuations of the Sunspot Umbra-Penumbra Ratio
2.5 Limb Darkening
The brightness of the solar disc falls off near the limb. This phenomenon is called limbdarkening. The temperature of the different regions of the Sun decreases with distancefrom its centre. When looking at the centre of the disc, the observer is looking throughphotospheric layers until the photosphere becomes opaque. The light seen comes mostlyfrom the hotter and therefore more luminous lower-lying regions of the photosphere. Onthe other hand, when looking towards the limb the line of sight is in the direction of theupper, cooler and less bright levels of the photosphere. [Ni82]
2.6 The Wilson Effect
The sunspots look different during their passage from the eastern to the western limb.When the spot is located at the eastern limb, the west side of its penumbra is thinnerthan the east side and vice versa. This implies that the sunspot is a saucer-shapeddepression into the surrounding photosphere and is called the Wilson effect after itsdiscoverer A. Wilson, a Scottish astronomer, in 1769 [Ni82]. The effect is caused by thesunspots being less dense and therefore having a lower opacity than their surroundings,which means that the observed light comes from a greater depth. [Ni82] [Pr84]
9


Csilla Szasz - Fluctuations of the Sunspot Umbra-Penumbra Ratio
3 DPD - Debrecen Photoheliographic Data
The Debrecen Photoheliographic Data (DPD) is the most detailed sunspot data setavailable ([Ba01]).
3.1 Overview and History
Why not start from the very beginning? Solar physics in Hungary began with two greatpersonalities, Miklós Konkoly Thege (1842-1916) and Gyula Fényi (1845-1927).
Konkoly had very many interests, both scientific and others, and astronomy was onlyone of them. He conducted full-disc graphical observations covering every day from 1873to 1916 at his self-founded Observatory in Ógyalla, Hungary, today Hurbanovo, situatedin Slovakia. He also has the credit of having founded the first Hungarian Observatory,today named Konkoly Observatory belonging to the Hungarian Academy of Sciences, ofwhich the Debrecen Heliophysical Observatory is the solar department.
Fényi’s greatest interest was prominences. He went through the solar limb with hisprominence spectroscope and gathered a huge amount of drawings between the years of1885 and 1920. His residence was the Haynald Observatory at Kalocsa of which he wasthe director. Fényi had about 185 publications, still today considered a great number.
Details from a photospheric drawing made at Kalocsa observatory on October 20,1905 can be found on the cover of this diploma work.
The observations of these two eminent men have been enlarged with about 200 000photographic plates since 1958 by the Debrecen Heliophysical Observatory.
The Debrecen Photoheliographic Data is a catalogue containing sunspot parameters.The production of the DPD is based on analyses of full-disc solar photographic plates inthe continuous visible spectrum of light, or white-light for short. Parameters includedin the data set are those extractable from full-disc solar photographic plates, as positionand area of the umbra and penumbra, not only for sunspot groups but also for individualspots. It is the only sunspot catalogue taking into account every spot observed, eventhe smallest ones.
The ancestor of this data set is the Greenwich Photoheliographic Results, being theclassical catalogue containing sunspot characteristics for every day from the year 1874 to1976. Beginning with 1977, the programme was taken over by the Debrecen Heliophysi-cal Observatory, and the Debrecen Photoheliographic Results (DPR) was born. Being amore complex catalogue than the one it is the continuation of, the process of compilingdata is slow. This delay has given rise to a new catalogue, the DPD. Preparations forthe production of the DPD began in 1992 and the first compiled year of the series wasintroduced in 1996.
Like the DPR and the Greenwich catalogue, the DPD contains data for every dayof the year. Observations are made at the Debrecen Heliophysical Observatory and itsGyula observing station, situated 150 km from Debrecen.
3.2 Observational Technique
The sections to come describe the instruments and the observational material at theDebrecen Heliophysical Observatory, along with an explanation of how systematic errorsare avoided.
11

Csilla Szasz - Fluctuations of the Sunspot Umbra-Penumbra Ratio
3.2.1 Instruments and Observational Material
The photoheliographs used in Debrecen and Gyula are quite similar. Both are fromthe end of the 19th century, the one in Debrecen was constructed in 1882. Qualityand accuracy are not all about modern equipment though, but good optics and makingthe most out of the instrument. The aperture is about 14 cm with a focal length ofnearly two metres. Both heliographs house a magnifying lens system, projecting anabout five times enlarged image on the secondary focal plane. The photos are takenthrough a yellow filter on 13×14 cm negatives. The diameter of the solar disc is 11 cmon the Debrecen plates and 10 cm on the plates taken in Gyula. The crosshairs, madeof spider-wire, at the focal plane of the objective are oriented in the north-south andeast-west directions respectively.
3.2.2 Systematic Error Reduction
If the weather conditions are favourable, observations are made several times a day andthe best set of plates is chosen for analyses. Each observation consists of three platestaken in order to reduce systematic errors, as described below.
The plane of the photographic plate should be perpendicular to the secondary focusin order to ensure a completely sharp image. The inclination of the photographic plate,if present, can be deduced by taking one picture from the east and one from the westside of the pier on which the heliograph is mounted.
In order to determine the deviation angle of the north-south directed spider-wirefrom the real north-south direction, a double exposure of the solar disc is made with theclockwork stopped and with an interval of about two minutes. This procedure resultsin a plate with two, overlapping solar discs, as illustrated in Figure 5. The line joiningthe two intersection points of the limbs of the solar images is the correct north-southdirection. The angle between this intersection line and the north-southerly directedspider-wire enable a very accurate position determination of sunspots.
Figure 5: A schematic illustration of the double exposure of the solar image.
3.2.3 Procedure for Cloudy Days
About 300 days a year can be covered by daily observations made at either the Debrecenor the Gyula observing station. When weather conditions prohibit photoheliograms tobe made at either of these two sites, plates from other observatories around the worldhave to be provided. Finding material for missing days is a challenging task since it isnot certain that a full-disc, white-light image was taken anywhere a specific day.
12

Csilla Szasz - Fluctuations of the Sunspot Umbra-Penumbra Ratio
The list of all observatories contributing with photoheliograms to the production ofthe DPD can be found in Appendix A where also the number of plates from the differentobservatories included in the DPD are indicated.
3.3 Measuring Positions and Areas
Two very important parts of the production process of the DPD is the measuring ofpositions and areas of sunspots and sunspot groups.
3.3.1 Position
The position measurements of the sunspots are done by first determining the positionsof the four points at the intersection between the spider-wires and the solar limb. Inaddition, 12 more points are measured around the limb, three between each intersectionpoint. This procedure enables the position determination of sunspots with respect tothe solar limb or the centre of the crosshairs. The accuracy of the position determinationis about 1/10 of a heliographic degree.
When the real north-south direction of the solar disc on the photoheliogram is known,derived as described in Section 3.2.2, the Sun’s rotational axis on the disc can be calcu-lated.
As motivated in Section 3.2.2, one observation consists of three plates of which allare measured in order to minimize positional errors, but only the best quality plate isdigitized for the area measurement to be carried out.
3.3.2 Umbra and Penumbra Areas
The digitization of the plates is done with a 16-bit camera. The whole plate cannotbe digitized at the same time, because the resolution would not be high enough. Eachsunspot group is taken separately. The sunspots on each piece of the solar disc areput under the 16-bit camera and the position measurements of the same spots on theoriginal photoheliogram are fitted to each other.
The border between the umbra and penumbra and between the penumbra and thephotosphere is indicated by differences in intensity on the digitized image. In the idealcase the edges are obvious jumps in intensity, but nothing is ever easy. A softwaredeveloped by L. Gyori recognizes the rim of the umbra and the penumbra, but it is easyto modify by hand, which is done in many cases. Every border is checked by an observerbefore it is approved. The areas are rounded to integers in the definite version of thecatalogue.
In case of small spots, it can from time to time be difficult to decide whether it isa spot or a pore. In these situations all three plates are examined, but it should bestressed that the spot does not have to be visible on all plates to be considered a spot.
Measurements of sunspots close to the limb can contain uncertainties due to thelimb darkening (see Section 2.5) and the fact that the contrast between the photosphereand the spots is lower than closer to the centre of the solar disc. It can sometimes bedifficult to see the difference between spots and the granulation.
3.3.3 Resolution
A resolution of one arcsecond or better can be achieved for the photoheliograms whenthe weather conditions are good, but is not as good during for example wintertime,
13

Csilla Szasz - Fluctuations of the Sunspot Umbra-Penumbra Ratio
when the Sun stands lower. Gyula observing station has often better quality platesthan Debrecen because it is situated at an altitude of 40 m on top of a water tower,whereas the Debrecen telescope is situated 10 m above ground level. The resolution islimited because of atmospheric motions, but the height difference between the two sitesmakes the air turbulence lower for Gyula observing station.
3.4 Catalogue Extension
To date, the DPD consists of three published and five unpublished years. The publishedyears are 1986 to 1988 ([Gy96], [Gy98], [Gy01]), and the set of unpublished years containthe almost complete year of 1989 (January to November) together with 1993 to 1996.The latter years are not published because they still have some gaps. In the case of 1996only one December-day is missing, but photographic plates from other observatories are,as described in Section 3.2.3, not easy to obtain.
The most recent data are August to November 1989, finished in mid November 2002.This means that we have only had the first part of the year to our disposal during ouranalyses.
The area data for the year 1986 and the first half of 1987 were measured with theoldest method, a machine called Dareal. With the second half of 1987, the method waschanged and the sunspot groups were digitized with an 8-bit camera, which also wasused for digitizing all observations for the first two months of 1993 and for all foreignplates that year. The rest of the 1993 analyses were redone with a 16-bit camera. Theyear 1993 was followed in chronological order by 1988, 1994, 1996, 1995 and 1989, forall of which a 16-bit camera was used.
The published years are, of course, checked. Among the unpublished years the firsthalf of 1993 and all 1996 data are checked.
3.5 Catalogue Structure
The DPD catalogue consists of two parts, a numerical and a graphical one. Let us firstconsider the latter.
3.5.1 The Graphical Catalogue
Each active region that is found on the photographic plates is scanned. These picturesare available in .jpeg and .fits-format in the digital library of the Debrecen HeliophysicalObservatory, accessible at their ftp-server. Every measured spot in a sunspot group isnumbered, see Figure 6 for an example. The numbers indicated on the pictures are thesame as in the numerical catalogue. The header contains information about the nameof the observing station, the date and time for the observation and the NOAA1 sunspotgroup number. In the figure, the resolution is marked by showing the correspondingdimension of one arcsecond in the direction of the rows and columns of the picture.Also the heliographic north and west directions of the centre of the disc are indicated.
The photographic plates are digitized with a 16-bit camera, as earlier mentioned, butthe published images are converted to 8-bits to make them easier to handle. The aimwith the graphical catalogue is not for the viewer to be able to redo the measurementsfound in the numerical catalogue, but to be able to do complex analyses. The pictures
1The sunspot group number as given by the National Oceanic and Atmospheric Administration(NOAA).
14

Csilla Szasz - Fluctuations of the Sunspot Umbra-Penumbra Ratio
Figure 6: This is the scanned image of the sunspot group with NOAA number 4925 on January 19, 1998.Each figure in the graphical catalogue, like this one, contains one spot group, and the spots within thesunspot group are numbered. The spot numbers correspond to the numbering in the numerical catalogue.
enable the analyzer to view the group morphology and to make comparisons with otherobservations as magnetic and H-alpha.
3.5.2 The Numerical Catalogue
The numerical catalogue consists of a series of text files (ASCII), one for each year, witha certain format. Here follows a shortened explanation of what can be found in thesetext files. The complete version of the explanation can be found in [Gy96], [Gy98] and[Gy01].
Table 2 contains an extract of the 1996 catalogue, and it clearly demonstrates thethree different types of rows that the catalogue contains. The row beginning with a’d’, standing for ’day’, contains information about the sunspots visible that specific day,given by the date. It is possible to gain information about the origin of the observation,in this case the Debrecen observatory, the daily sum of the projected umbra area, themeasured total, i.e., umbra plus penumbra area, the for foreshortening corrected umbraand total area, and the Julian Date. Also the position angle P of the northern extremityof the axis and the heliographic latitude B0 of the central point of the disc at the timeof observation are indicated. All projected area measurements in all three kinds of rowsare given in units of millionths of the solar disc, whereas the corrected areas are given
Table 2: This extract from the 1996 numerical catalogue illustrates how the data is stored in the DPDcatalogue. There is a ’day’-row for each day of the year followed by rows for the observed groups, if any,the specified day, followed by rows for each spot in the sunspot groups. On January 30, 1996 there weretwo sunspot groups visible on the solar disc consisting of one and four sunspots, respectively.
15

Csilla Szasz - Fluctuations of the Sunspot Umbra-Penumbra Ratio
in millionths of the solar hemisphere2.If there were no spots visible on the solar disc, the ’day’-row is followed by the next
’day’-row and the areas and positions are zero. On days with active regions visiblethough, the ’day’-row is followed by a row beginning with the letter ’g’, which stands for’group’. Here information about the group or groups in NOAA sunspot group numberorder is listed. Like the ’day’-rows, the ’group’-rows contain the date and time for theobservation and also the NOAA number, the sum of the umbra and total projectedand corrected area of the group, the heliographic latitude (B) and longitude (L), thelongitudinal distance (LCM) from the solar central meridian, the position angle andfinally the distance from the centre of the solar disc measured in units of the solarradius.
Since each sunspot group is divided into spots, the next line or lines are dedicatedto the spots within the group. These rows begin with the character ’s’ for ’spot’. Againthe lines start with the date and time for the observation. Further tabulated parametersfor sunspots are the NOAA sunspot group number, i.e., which group the specified spotbelongs to, the spot number within the group, the projected and corrected umbra andtotal spot area, B, L, LCM, the position angle and the distance from the centre of thesolar disc for each spot. The position of a spot means the position of the centre of theumbra, if any, otherwise the centre of the penumbra is given.
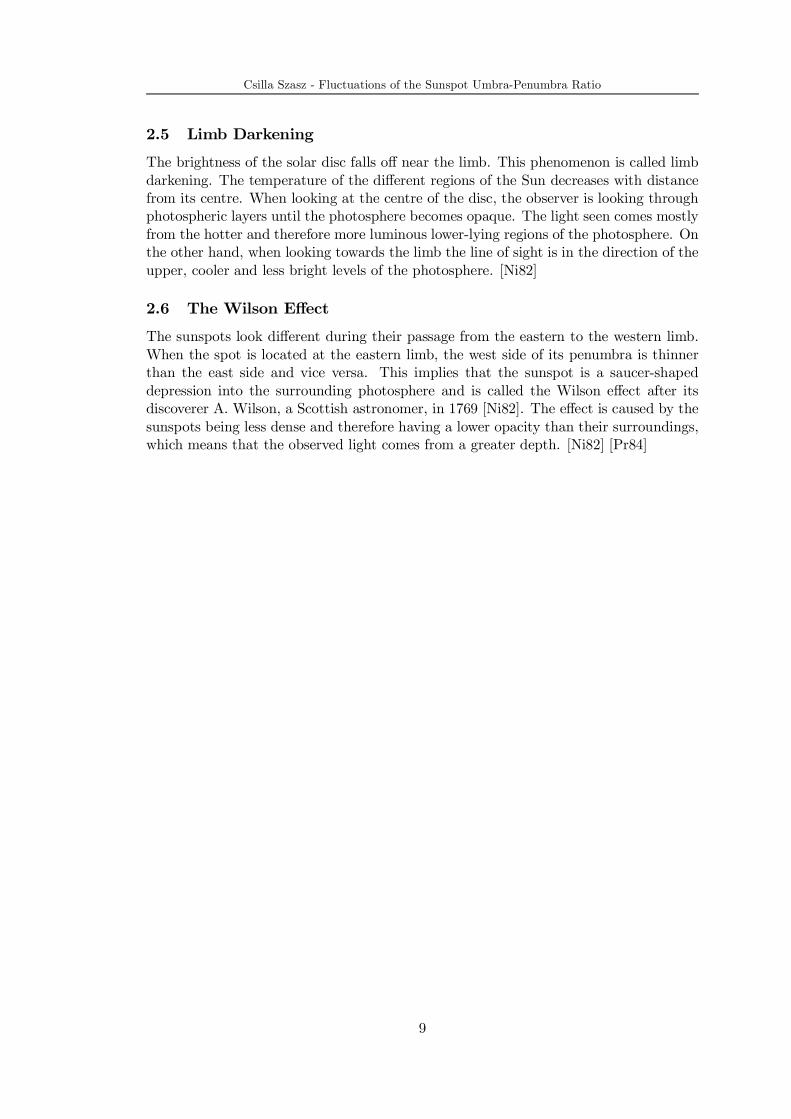
The case of several spots sharing a common umbra or penumbra, is marked by anegative value in the projected umbra or total area column respectively. The negativenumber indicates at which spot the total area for the common umbra or penumbra canbe found, in the manner shown in Table 3. Spots sharing a common umbra occur whenan umbra consists of fragmented regions, which cannot be separated without losingumbra area. It is also worth mentioning that the spots within a group do not bear thesame number every day, since it would be an enormous work identifying every spot fromone day to the next. The spot numbering is thus arbitrary.
The total area given for each group is the sum of the areas of all the spots in thatgroup, and the daily sum of the areas are based on these numbers. The mean positionof each group is calculated by multiplying the positions of all separately measured spotsof every group by their corrected total areas and dividing the sums of the products bythe sum of the areas.
When a penumbra contains more than one umbra, the position of the centre ofgravity of the components is determined by weighting the positions of the umbrae withthe corrected umbra areas before the mean position of the whole group is calculated.
Intermittent3 sunspot groups are indicated with zero areas in the catalogue and nopositions are given.
[Gy96] [Gy98] [Gy01]
21 millionth of the solar hemisphere corresponds to a circular sunspot with a diameter of 1970 kmand an area of about 3.0·106 km2.
3Coming and going at intervals; not continuous
16
Csilla Szasz - Fluctuations of the Sunspot Umbra-Penumbra Ratio
Table 3: The case of several spots sharing a common umbra or penumbra, is marked by a negative valuein the projected umbra or total area column, respectively. The negative number indicates at which spotthe values for the common umbra or penumbra can be found. In the table the bold columns are, from leftto right, sunspot number, umbra area and total area.
17


Csilla Szasz - Fluctuations of the Sunspot Umbra-Penumbra Ratio
4 Other Sunspot Databases
There are several sunspot databases produced by single or networks of observatoriesaround the world, all with their own flavour. This section gives a short overview of themost known sunspot data sets.
A common feature for the different sunspot databases is that a number is given toeach sunspot group in the order of appearance and retained until the group disappearsaround the western limb or dies out. This number is in the case of the DPD identical withthe number given by the National Oceanic and Atmospheric Administration (NOAA).
4.1 Greenwich Photoheliographic Results
The Greenwich series of solar photographs is the classical sunspot database and it com-menced in April 1874. More than one hundred years later, in 1977, the catalogue changedand the umbra area data were only estimated, until 1981, which is the last year of thecatalogue. This very first database has been very important and has enabled manyanalyses and publications.
The photographs of the Sun obtained at Greenwich Royal Observatory were takenwith a 10.16 cm photoheliograph. In 1910 the original object glass was replaced by aphotographic objective. The original enlarging system was improved in 1926, giving animage of the Sun of about 19 cm in diameter.
The measures of the photographs for each day were made with a large position-micrometer. The area counts were carried out with a magnifier with a scale glassaccurately ruled with cross-lines into squares with sides of one hundredth of an inch(0.254 mm, corresponds to two millionths of the solar hemisphere). The integral num-ber of squares and parts of squares that covered the spot was estimated by the observer.
The Greenwich Photoheliographic Results contain the following parameters for sunspotgroups and until 1915 also for spots: time of observation, group number, distance fromthe solar centre in terms of the solar radius, the position angle measured from thenorth pole of the solar axis, heliographic longitude and latitude, umbra and whole areacorrected for foreshortening.
At NOAA National Geophysical Data Center (NGDC) the data for sunspot groupsin the Greenwich Photoheliographic Results were digitized and are available in electronicform from 1874 to 1981. [Ch05] [De87] [Jo38] [Jo57] [La75] [Ne58]
4.2 DPR - Debrecen Photoheliographic Results
The daily photoheliographic programme of the Royal Greenwich Observatory was afterits termination in 1976 taken over by the Debrecen Heliophysical Observatory and theDebrecen Photoheliographic Results (DPR) were born. The DPR indicates among othercharacteristics, unlike the DPD, the polarity of the considered sunspots and remarksabout the evolution and types of the sunspot groups. During the course of compilingboth the DPR and the DPD all sunspots recognized as such on the photoheliograms aremeasured. However, spots published in the DPR are only those that can be identifiedday by day during their whole lifetime, or spots that are important for the developingprocess of the sunspot group they belong to.
The detailed analyses of the evolution of the groups and the polarity data of spotsprovide very useful information for further study, but they demand a tremendous and
19
Csilla Szasz - Fluctuations of the Sunspot Umbra-Penumbra Ratio
time-consuming work, and the publication of the DPR suffers an enormous delay. Theavailable years are 1977 and 1978.
4.3 SOON - Solar Optical Observing Network
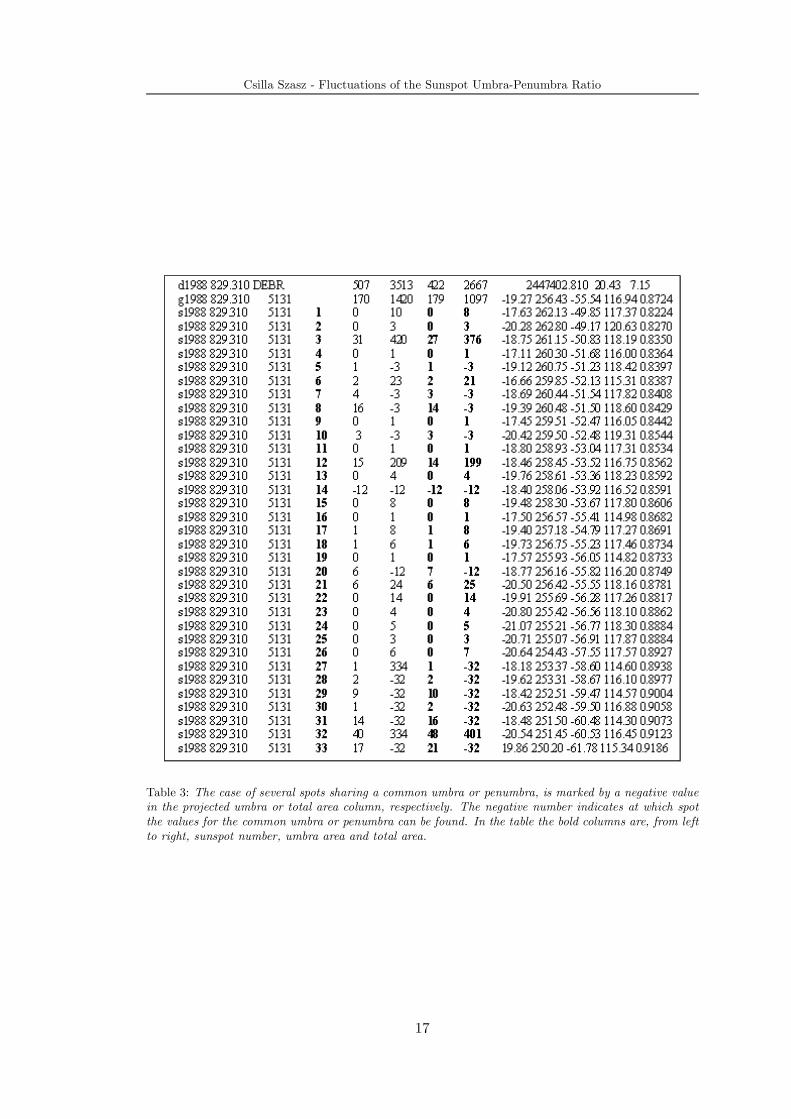
SOON stands for Solar Optical Observing Network and is operated by the U.S. Air Forcesince 1976. It is used for space weather specification and forecast. The SOON consistsof five solar observatories around the globe at widely spread longitudes in order to allowobservations 24 hours a day. The database is graphical, i.e., is based on sunspot drawingsmade daily on each site from a projected solar image with a diameter of 18 cm. Thefive observing stations are Palehua on Hawaii, Holloman in the U.S., Ramey in PuertoRico, San Vito in Italy and Learmonth in Australia, as illustrated by Figure 7.
For the purpose of SOON, real time observations are needed day to day. Therefore,time is of the main interest and accuracy is of lower priority. Sunspots smaller than tenmillionths of the solar hemisphere are usually not considered. [Ba01]
Figure 7: Map showing the five SOON sites. (Picture from NOAA.)
4.4 Mount Wilson Data
The series of white-light photographs taken at the Tower Telescope at Mount Wilson,U.S., was begun in 1916. The Tower Telescope is located inside a dome at the top ofan 18 m high tower and has an aperture of 30 cm. The solar image photographed hasa diameter of 17 cm.
The Mount Wilson data contain parameters for the observed sunspots and sunspotgroups as, for example, classification of the sunspot penumbra and the sunspot groupcompactness. Given are also the maximum magnetic field strength in every group mea-sured, and of course the position for the sunspots and sunspot groups. Also the areasof sunspots are measured, but only the total area is made available. The umbra andpenumbra areas are not separately indicated. The data are not corrected for atmosphericrefraction, optical aberration or any other effect, which makes it difficult to work with.[Ho84] [Ho99]
20
Csilla Szasz - Fluctuations of the Sunspot Umbra-Penumbra Ratio
4.5 Catania Astrophysical Observatory
The sunspot catalogue published by the Catania Astrophysical Observatory, Italy, isbased on daily full-disc white-light photographs taken with an hourly frequency andone drawing per day of pores, sunspots and faculae4. The drawings are made from aprojected solar image with a diameter of 24.5 cm.
Some of the parameters listed in the Catanian catalogue are position, type and areaof each sunspot group and also the total number of spots and pores in each group. [Te95]
4.6 Solar Phenomena
The Solar Phenomena bulletins are published by the Rome Astronomical Observatory.They contain information about position, class, number of spots, total and umbra areafor sunspot groups.
4.7 The Chinese Solar-Geophysical Data
The Chinese Solar-Geophysical Data are produced by the Chinese Academy of Sciencesand contains position, daily total area of sunspot groups and also magnetic and velocityfields of solar active regions.
4.8 Sunspot Index Data Centre
The main task of the Sunspot Index Data Center at the Royal Observatory of Belgium isto gather the observational data of several observatories and to compute and broadcastthe daily, monthly and yearly international sunspot numbers, defined by Equation (1)in Section 2.2.
4.9 Conclusions
There exist several other solar data sets than the DPD, but investigations fully compa-rable to those described in the sections to come cannot be done on any of them. Theother catalogues are either not as precise and detailed as the DPD in the matter of smallsunspots, they do not provide the sunspot parameters we need, or they do not cover atime period long enough for the conclusion of a quasi-biennial periodicity being present.
4 In white-light, photospheric faculae are brightenings that mark active regions. Faculae have greatertemperatures and densities than their surrounding. [Ze98]
21


Csilla Szasz - Fluctuations of the Sunspot Umbra-Penumbra Ratio
5 Earlier Investigations on the Umbra-Penumbra Ratio
Investigating sunspot parameters is not a new activity. This section discusses brieflysome of the analyses made during the years.
5.1 On the Umbra-Penumbra Area Ratio
P. N. Brandt, W. Schmidt and M. Steinegger [Br90] have investigated the umbra-penumbra area ratio for 126 sunspots and sunspot groups. The analyses are basedon sunspot photographs taken by the 40 cm Vacuum Newton Telescope at the TeideObservatory, Tenerife, from August 9 to September 1980, near the maximum of the solarcycle number 21. The results show a linear relation between the logarithm of the umbraand the penumbra area. The average umbra-penumbra area ratio found was 0.24 forsmall spots and 0.32 for large spots. Sunspots with a total area of around 50 millionthsof the solar hemisphere are referred to as small.
When we dug deep to find earlier results on the umbra-penumbra area ratio in-vestigations, we found several articles claiming that the umbra-penumbra area ratio forsunspot groups generally tends to follow the solar cycle. One example is an inquiry madeby L. Dezso and O. Gerlei [De64]. They have plotted the two-year means for sunspotgroups with an umbra area larger than or equal to 10 and smaller than 40 millionthsof the solar hemisphere in the Greenwich catalogue, observed between 1886 and 1955.Other examples are the article by A. Antalová [An71] and references therein.
5.2 Conclusions
The conclusions drawn from earlier investigations on the umbra-penumbra area ratio isthat spots with an umbra area smaller than 10 millionths of the solar hemisphere havenot been investigated.
Investigating 126 sunspots and sunspot groups, as done by P. N. Brandt, W. Schmidtand M. Steinegger, is a small statistical sample. To be able to draw quantitative conclu-sions about the real umbra-penumbra area ratio a larger set of data has to be considered,and spots and sunspot groups have to be taken into account separately. Sunspots andsunspot groups should not be mixed because they are distinct phenomena in the sensethat groups can contain spots with different characteristics.
The research done by L. Dezso and O. Gerlei and also others, was searching forperiods in the penumbra-umbra area ratio comparable with the solar cycle. Such periodscan only be traceable as trends in the DPD, since the available catalogue consists ofonly seven and a half years in total, separated into two intervals, in the ascending anddescending phase of the solar cycle number 22.
23


Csilla Szasz - Fluctuations of the Sunspot Umbra-Penumbra Ratio
6 Our Investigations
In this section we describe our expectations and plans for our work. It is always difficultto know in advance how things will work out, and intentions change as features are foundthat need further investigation, even if this means that other interesting characteristicsare left for the future to be discovered.
6.1 Scientific Goal
The goal with our data analyses of the DPD catalogue is to test all kinds of parametersand see if a plot versus time reveals any periodicity whatsoever. The DPD catalogueis unique in its kind as it takes into account even the smallest spots, but has until nowbeen unexplored. We are very agog to find out whether some of the parameters showany solar cycle dependence, as suggested in, e.g., [De64].
A general belief among observers is that the sunspot group compactness varies withthe solar cycle and that the greatest spots usually occur before or after the solar cyclemaximum [Zi88]. Sunspot group compactness (Cg) is given by
Cg =
Pri · aiPai
, (7)
which depends on the distances from the centre of area of the group to the centre ofarea of the spots (ri) and the areas of the spots (ai). Except for investigating this, itwould be very interesting to find out whether some heliographic longitudinal bands aremore active than others.
Some of the other interesting parameters that we avidly want to investigate are thenumber of spots per group versus time, the size of spots versus time and the longitudinaldistribution of spots within a group.
We have the published years of 1986 to 1988 ([Gy96], [Gy98], [Gy01]) to our disposalbut also the unpublished first half of 1989 together with 1993 to 1996. This may soundlike too few years, but that depends on what kinds of periodicities the material maycontain. It is perhaps difficult to detect an 11-year period, if any, but since maximumoccurred in 1989, i.e., in the gap, a trend could be visible since the first years are in theascending and the later in the descending phase of the solar cycle number 22.
6.2 Attempts Carried into Effect
As a first attempt, we want to delve into the mysteries of the average umbra andpenumbra sizes both for groups and spots. We are also very eager to calculate theumbra-penumbra area ratio for sunspot groups. This would help us get acquainted withhow calculations easiest are made.
In our calculations of the mean umbra-penumbra area ratio we exclude the spotswith zero umbra and/or penumbra area. The DPD contains total and umbra areameasurements. We have calculated the penumbra areas from these two parameters.
6.3 Investigation Methods
The first headache to find a cure for is to get the DPD database into a manageableformat that is easy to work with. Since the database contains three different rows of
25
Csilla Szasz - Fluctuations of the Sunspot Umbra-Penumbra Ratio
information, as described in Chapter 3.5.2, we import the catalogue into three differentdatabases, one for the days, one for the sunspot groups and one for the sunspots. Ourtask consists, besides the brainwork, mainly of two parts, namely to calculate newparameters out of the given ones, and then to investigate the characteristics of thesenew parameters by, e.g., making evaluable plots. For the computations on the databaseswe use Microsoft Access, and when more complicated calculations are needed, we switchto Matlab since we have a better knowledge of that programming language than of SQLand VisualBasic. For making our plots we mostly use the statistical software packageSPSS but also Matlab.
We have found SPSS not being the most suitable statistical software for intermittentdata sets since it is not possible to automatically make the x-axis represent a continuoustime line with gaps in the plot where data are missing. SPSS interprets the x-axisparameter values as categories, one plotted after the other in a user-specified order,but not with internal distances corresponding to the differences of consecutive valuesproducing a continuous time line. This makes error bar plots difficult to interpret if thereare no values for some time epochs. In these cases we have been forced to manually putin ’holes’ in the time series. Yet SPSS is a very useful software with many easy-to-usefunctions as its case selecting toolbox.
We calculate half year, quarterly and monthly means of the interesting parameters.Our observational data are continuous in the sense that observations are made everyday. However, since sunspots are not every-day phenomena, the occurrence of sunspotson the from the Earth visible hemisphere of the Sun is very discontinuous. In additionto this, sunspots appear with various characteristics in the sense that some of them arelonely and isolated from other spots, while others are gathered in complex groups, assummarized in Table 1 in Section 2.3. As a first attempt we therefore treat all spotsalike, averaging their features over time periods of differing lengths.
6.4 Error Reduction in the DPD Catalogue
Due to the human factor it is inevitable that mistakes occur in a partly manual proce-dure. It is therefore not surprising that during the course of our investigations we havecome across some ambiguities, since we are working with partly unpublished materialthat has not previously been used in analysis. These errors have been reported forcorrection.
A missing or a duplicate number in the numbering of spots within groups, mismatchbetween NOAA numbers in the group and spot rows, spots sharing umbra or penumbrawith another spot but with a reference in the numerical catalogue to the wrong spotare examples of what we have been able to bring into light. After encountering aninaccuracy we have designed Matlab programmes searching for more of the same type.This has revealed only a handful errors among the 8 376 877 characters of the 107 770lines on the 1 891 pages of data we have used, which leads us to the conclusion that theDPD is consistent.
26

Csilla Szasz - Fluctuations of the Sunspot Umbra-Penumbra Ratio
7 The Umbra and Penumbra Areas for Sunspot Groups
As our first calculation, we plot the mean sunspot group umbra and penumbra area.In Figure 8 the quarterly mean value of the umbra area with one standard deviationcan be seen. This plot tells us that the standard deviation in many cases will probablynot be the most suitable dispersion parameter to describe our data graphically sincethe structure of the data is suppressed by the large standard deviation. The scatter ofseveral of our proposed parameters to study is large due to the wide variety of sunspots,as described in Section 2.3, which will give rise to large standard deviations.
In the rest of this report we will use the estimated standard error of mean, Sx,defined by
Sx =S√N, (8)
where S is the sample standard deviation of the epoch, and N is the sample size. Withour data, this parameter is preferable as the choice of the measure of dispersion. Weexpect trends to reveal themselves as significant variations in the mean values of theinvestigated parameters. The standard error will be small if the number of observationscontributing to a certain mean value is large compared to the standard deviation of theaveraged population. However, if the population consists only of a few observations themean value of the period should be considered less reliable. This is due to the possibilitythat an occurrence of only a single spot with unusual characteristics can have dominantinfluence. These epochs will be recognized by their large standard errors.
Date
19961995
19941993
19921991
19901989
19881987
1986
Mea
n U
Are
a fo
r Gro
ups
(+-1
SD
)
150
125
100
75
50
25
0
-25
-50
Figure 8: Quarterly mean of umbra area for sunspot groups with one standard deviation. Each sunspotgroup is only counted once, namely when its umbra area is the largest.
7.1 The Mean Umbra Area
The mean umbra area for groups can be viewed in Figure 9. The mean umbra areaseems very much to be solar cycle dependent since an ascending and a descending trendwith the solar cycle are visible. If we connect the two sides of the plot in Figure 9 we
27

Csilla Szasz - Fluctuations of the Sunspot Umbra-Penumbra Ratio
end up with an umbra area peak sometime in late 1990 or early 1991. No conclusionscan be drawn, however, because of the lack of data in the middle of our time series.
Some of the monthly mean values, for example February 1986 and the last monthsof 1996, deviate from the rest of the values. This is because these months containone or more large sunspot groups that stayed large several days. An example fromNovember 1996 can be found in Figure 11, the sunspot group with NOAA number 7999as photographed on two different days. The largest spot of the group covered more than108 millionths of the solar hemisphere five days in a row, while the biggest spots in theother observable groups were at most 69 millionths of the solar hemisphere during thesame month.
We are also interested in the umbra area for sunspot groups counting each grouponly once. The reason for this is to reduce the influence of the long-lived groups. Wehave chosen to consider every group when its umbra area takes on the largest value ofits lifetime. The result is presented in Figure 10. The ascending and descending trendis still visible, but the spread has grown, which can be explained by the reduction ofdata. The number of months when the average of the umbra area deviates from the bigcrowd has also grown. The reason for this can be that both the large and small groupsare counted when they are the largest and therefore able to raise the mean value abovethe trend.
7.2 The Mean Penumbra Area
The mean penumbra area for groups show a similar behaviour as the mean umbra area,and is presented in Figure 12. Just like the mean umbra area for groups, the penumbraarea seems to peak somewhere late 1990 or early 1991.
The penumbra area values are higher than the umbra area values, which comes fromthe fact that the penumbra is time to time very difficult to separate into smaller units.A single, large penumbra often contains more than one umbra. This means that severalumbrae with a common penumbra can give rise to a large penumbra.
The next plot, Figure 13, shows the mean penumbra area for groups when eachgroup is considered only once, namely when its umbra area takes on the largest valueof its lifetime. This figure resembles the group penumbra area plot where every sunspotgroup is considered as many times as it was observed (Figure 12). The main differencebetween the two figures is the much greater spread in the latter (Figure 13), which canbe explained by the reduction of data.
7.3 Conclusions
Both the mean umbra and penumbra area for groups seem to follow the solar cycle.
28

Csilla Szasz - Fluctuations of the Sunspot Umbra-Penumbra Ratio
Date
19961995
19941993
19921991
19901989
19881987
1986
Mea
n U
Are
a fo
r Gro
ups
(+-1
SE)
60
55
50
45
40
35
30
25
20
15
10
50
Figure 9: Monthly mean of umbra area for sunspot groups. Every group is counted as many times as thenumber of days it lived.
Date
19961995
19941993
19921991
19901989
19881987
1986
Mea
n U
Are
a fo
r Gro
ups
(+-1
SE)
90
80
70
60
50
40
30
20
10
0
Figure 10: Monthly mean of umbra area for sunspot groups. Each sunspot group is only counted once,namely when its umbra area is the largest.
29

Csilla Szasz - Fluctuations of the Sunspot Umbra-Penumbra Ratio
Figure 11: The sunspot group NOAA 7999 as observed on November 28 and 30. 1996. It stayed verylarge for five days in a row.
30

Csilla Szasz - Fluctuations of the Sunspot Umbra-Penumbra Ratio
Date
19961995
19941993
19921991
19901989
19881987
1986
Mea
n P
Area
for G
roup
s (+
-1 S
E)
400
350
300
250
200
150
100
50
0
Figure 12: Monthly mean of penumbra area for sunspot groups. Each group is counted as many times asthe number of days it lived.
Date
19961995
19941993
19921991
19901989
19881987
1986
Mea
n P
Area
for G
roup
s (+
-1 S
E)
450
400
350
300
250
200
150
100
50
0
Figure 13: Monthly mean of penumbra area for sunspot groups. Each sunspot group is counted only once,namely when its umbra area has its maximum.
31

Csilla Szasz - Fluctuations of the Sunspot Umbra-Penumbra Ratio
8 The Umbra-Penumbra Area Ratio
The umbra-penumbra area ratio is a parameter that can be an important indicator ofthe magnetic structure of the sunspot umbra and penumbra.
8.1 The Umbra-Penumbra Area Ratio for Sunspots
We start with calculations of the umbra-penumbra area ratio for sunspots and will thenalso see if the same trend is visible for the umbra-penumbra area ratio for sunspotgroups.
8.1.1 Procedure
The first thing to do, before plotting the umbra-penumbra area ratio for sunspots, is toadd all the corrected umbra area values to the associated spots. These are indicated bynegative numbers in the corrected total area column. The negative number indicatesat which spot the values for the common umbra can be found (Section 3.5.2). Anotherpossibility is to omit spots with common umbra or penumbra areas.
The following two statements are valid for the DPD series: A spot cannot shareits umbra with other spots without also sharing its penumbra with other spots. Onthe other hand, a spot can have a common penumbra with other spots but still havean umbra of its own. The summing of umbra area values is a good approximation ifthe spots are of the same polarity. If they are not, we sum anyway in lack of betterprocedure since it is out of the scope of this diploma work to study the magnetogramof every spot with shared penumbra area.
The summing of umbra areas is somewhat tricky, since the spots can have commonumbrae with spots with lower sunspot number but also higher (see Table 3 in Sec-tion 3.5.2). We need a programme that can search in the right direction for the sunspotindicated with a negative number. Matlab is the suitable tool for this task.
8.1.2 All Sunspots Included
The mean umbra-penumbra area ratio with all spots included is presented in Figure 14.Spots with zero umbra or penumbra area, as already mentioned in Section 6.2, areomitted and the between spots shared umbra areas are added. A clear period of abouttwo years can be seen. The amplitude seems to be about 50% of the mean value, but itcan be variable.
The data for 1986 are a bit rude in the sense that they do not take part in the trendthe rest of the data have agreed on. The period is nevertheless there, and if we imaginea two-year period during the empty years, we can connect the two ends of the graph.The deviating value in late 1996 contains only three small spots, which means that itslocation off the curve is uncertain. The error bars are evidence of this. The swervingvalue in mid-95 though, is calculated on 69 spots but since it occurs during a maximum,its deviation is not significant.
There is one monthly mean missing, May 1986. No sunspots were visible during thismonth.
33

Csilla Szasz - Fluctuations of the Sunspot Umbra-Penumbra Ratio
8.1.3 Each Sunspot Group Only Counted Once
Figure 15 illustrates the mean umbra-penumbra area ratio for spots that lived when thegroup they belonged to took on the largest value of its lifetime. By making this selection,long-lived and short-lived groups give equal contribution to the summation statistics asevery group is counted only once. The error bars have grown, mostly because of thereduction of data, but the two-year period can still be discerned. We can draw theconclusion that the periodic feature of the mean umbra-penumbra area ratio is notcaused only by long-lived groups.
Date
19961995
19941993
19921991
19901989
19881987
1986
Mon
thly
Mea
n of
U/P
Are
a R
atio
(+-1
SE) .9
.8
.7
.6
.5
.4
.3
.2
.1
Figure 14: Monthly mean of the umbra-penumbra area ratio for sunspots with both a distinguishableumbra and penumbra area.
Date
19961995
19941993
19921991
19901989
19881987
1986
Mon
thly
Mea
n of
U/P
Are
a R
atio
(+-1
SE) 1.1
1.0
.9
.8
.7
.6
.5
.4
.3
.2
.10.0
Figure 15: Monthly mean of the umbra-penumbra area ratio for spots that lived when the group theybelonged to was the largest of its lifetime.
34

Csilla Szasz - Fluctuations of the Sunspot Umbra-Penumbra Ratio
Date
19961995
19941993
19921991
19901989
19881987
1986
Mon
thly
Mea
n of
U/P
Are
a R
atio
(+-1
SE) 1.1
1.0
.9
.8
.7
.6
.5
.4
.3
.2
.10.0
Figure 16: Monthly mean of the umbra-penumbra area ratio for spots located less than 0.9 solar radiifrom the solar disc centre.
8.1.4 Sunspots at the Solar Limb Omitted
One of the possible explanations of the spread of the 1986 data can be the uncertaintiesin the area measuring process of spots close to the solar limb, as described in Section 3.3.In order to exclude this possibility we have filtered the data for spots with larger distancefrom the solar disc centre than 0.9 solar radii, which corresponds to an angle of 64 tothe LCM, and plotted the remaining spots in Figure 16. The spread of the 1986 valuesis just as high as earlier.
Another possible cause of the spread can be a low number of sunspots. The numberof sunspots during the years we are working with are summarized in Table 4. Duringthe year 1986 the number of sunspots is much lower than during years closer to the cyclemaximum. Fewer observed sunspots can very well be the cause the big spread. Also1996 suffers from a reduced amount of spots, causing larger error bars than previousyears (compare with Figure 14).
Year No of Spots No of Spots∗ withU, P, U+P > 0
1986 3060 6021987 8592 15831988 26740 48651989∗∗ 24580 51711993 15181 33841994 7923 11701995 5910 11001996 2179 511P
94165 18386∗After having added the umbra values for spots with common penumbrae.∗∗The year 1989 is not complete. We have data for January to July only.Table 4: Number of spots observed during the years in the DPD.
35

Csilla Szasz - Fluctuations of the Sunspot Umbra-Penumbra Ratio
8.1.5 Sunspots on the Northern and Southern Hemisphere Separated
The next attempt is to separate spots on the northern and southern hemisphere andsee if they show the same behaviour. The plot can be seen in Figure 17. A meanumbra-penumbra area ratio value of 1.7 in mid 1986 has been omitted from the plot byzooming in the variable axes. We found this value insignificant because it has a verylarge standard error of mean and is only based on two sunspots.
The spots on both hemispheres lie on the same curve. The deviating values alwaysbelong to either hemisphere, both do not deviate at the same time, and most of thedeviating points contain only a few sunspots.
Date
19961995
19941993
19921991
19901989
19881987
1986
Mon
thly
Mea
n of
U/P
Are
a R
atio
(+-1
SE) 1.2
1.1
1.0
.9
.8
.7
.6
.5
.4
.3
.2
.10.0
Northern Hemisphere
Southern Hemisphere
Figure 17: Monthly mean of the umbra-penumbra area ratio for spots divided into the solar northern andsouthern hemispheres according to their occurrence.
8.1.6 Sunspots Divided into Sizes
An interesting aspect is whether all sizes of spots show the same behaviour. For thisreason, we have divided the spots into four different size-groups according to Table 5.The graphs for the different spot sizes are presented in Figures 18 - 21. It appearsthat it is the smallest spots, with a corrected total area less than 15 millionths of thesolar hemisphere, that show the most evident cycle dependence (Figure 18). The two-year period is also visible for spots with sizes between 15 and 49 millionths of the solarhemisphere but with lower amplitude, which sinks even more for spots of sizes between50 and 299 millionths of the solar hemisphere. A comparing graph between the threefirst size-groups is given in Figure 22, where the decrease of the amplitude with theincrease of spot size is evident.
Figure 21 shows that spots with an area larger than 300 millionths of the solarhemisphere do not show any periodicity at all. This can have several reasons. One isthe fact that there is a total amount of only 1042 spots this large (see Table 5), whichgives less than 12 spots a month on average. Another reason can be that whatevermechanism is causing the quasi-biennial periodicity is less efficient the larger a spot is,because it causes the same absolute area change within all sizes. This would make thefluctuation stronger for small spots, since it constitutes a larger proportion of the area.
36

Csilla Szasz - Fluctuations of the Sunspot Umbra-Penumbra Ratio
Spot Size No of Spots∗
in 1106 of the solar disc
U+P U, P, U+P > 0
< 15 7491≥ 15 and < 50 4308≥ 50 and < 300 5545
≥ 300 1042∗Number of spots after having added the umbra
values for spots with common penumbrae.
Table 5: Number of sunspots in four different size groups.
We will dig deeper into this matter by investigating the umbra-penumbra area ratioversus the umbra area.
Figure 23 shows the umbra-penumbra area ratio as a function of umbra area. Wehave divided the data set roughly into fluctuation minima and maxima according toFigure 14, by separating the minimum years of 1988 and 1994 from the maximum yearsof 1993 and 1995. In Figure 23 we see that the periodicity is caused by spots with anumbra area smaller than approximately 16 millionths of the solar hemisphere.
During minima all spots have an almost uniform umbra-penumbra area ratio, whereasspots with an umbra area smaller than 16 millionths of the solar hemisphere clearly di-verge to higher umbra-penumbra values during maxima. The deviation increases withdecreasing size of the umbra. There may be a tendency for small spots to have a depart-ing umbra-penumbra ratio also during minima, but this deviation is of a much lowerorder than at maxima and is perhaps caused by measurement uncertainties as areas arerounded to integer values.
Date
19961995
19941993
19921991
19901989
19881987
1986
Mon
thly
Mea
n of
U/P
Are
a R
atio
(+-1
SE) 1.3
1.2
1.1
1.0
.9
.8
.7
.6
.5
.4
.3
.2
.10.0
Figure 18: Monthly mean of the umbra-penumbra area ratio for spots with corrected total area less than15 millionths of the solar hemisphere.
37

Csilla Szasz - Fluctuations of the Sunspot Umbra-Penumbra Ratio
Date
19961995
19941993
19921991
19901989
19881987
1986
Mon
thly
Mea
n of
U/P
Are
a R
atio
(+-1
SE) 1.0
.9
.8
.7
.6
.5
.4
.3
.2
.1
0.0
Figure 19: Monthly mean of the umbra-penumbra area ratio for spots with corrected total area equal toor larger than 15 but less than 50 millionths of the solar hemisphere.
Date
19961995
19941993
19921991
19901989
19881987
1986
Mon
thly
Mea
n of
U/P
Are
a R
atio
(+-1
SE) .4
.3
.2
.1
Figure 20: Monthly mean of the umbra-penumbra area ratio for spots with corrected total area equal toor larger than 50 but less than 300 millionths of the solar hemisphere.
38

Csilla Szasz - Fluctuations of the Sunspot Umbra-Penumbra Ratio
Date
19961995
19941993
19921991
19901989
19881987
1986
Mon
thly
Mea
n of
U/P
Are
a R
atio
(+-1
SE) .40
.35
.30
.25
.20
.15
.10
.05
0.00
Figure 21: Monthly mean of the umbra-penumbra area ratio for spots with corrected total area equal toor larger than 300 millionths of the solar hemisphere.
Date
19961995
19941993
19921991
19901989
19881987
1986
Mon
thly
Mea
n of
U/P
Are
a R
atio
(+-1
SE) 1.1
1.0
.9
.8
.7
.6
.5
.4
.3
.2
.10.0
U + P Area < 15
15 ≤ U + P Area < 50
50 ≤ U + P Area < 300
Figure 22: Umbra-penumbra area ratio for sunspots divided into three different size-groups according totheir corrected total area.
39

Csilla Szasz - Fluctuations of the Sunspot Umbra-Penumbra Ratio
Umbra Area
51413121111
Mea
n U
/P A
rea
Rat
io (+
-1 S
E).7
.6
.5
.4
.3
.2
.1
0.0
• 1993 Max • 1995 Max
• 1988 Min• 1994 Min
Figure 23: The umbra-penumbra area ratio as a function of umbra area. The data set is divided roughlyinto fluctuation minima and maxima by separating the minimum years of 1988 and 1994 as well as themaximum years of 1993 and 1995.
8.1.7 Sunspots with More than one Umbra or/and Penumbra Excluded
We have two choices to treat spots with common features with other spots. The choicesare either to omit spots with summed penumbra values but common umbra values withother spots, or to sum the common umbra values for the spots with common penumbrae.Until now we have considered only the latter case, and now the time has come for theomitting option. In Figure 24 spots with common umbrae or/and penumbrae with one ormore spots are excluded. We can establish that this procedure did not lower the spreadof the 1986 data either. We have also tried to exclude whole groups if spots within themwere complex, but this only reduced the amount of data without any result. We willcontinue to work with the summed common umbra values for the spots with commonpenumbrae.
Date
19961995
19941993
19921991
19901989
19881987
1986
Mon
thly
Mea
n of
U/P
Are
a R
atio
(+-1
SE) 1.0
.9
.8
.7
.6
.5
.4
.3
.2
.1
0.0
Figure 24: Monthly mean of the umbra-penumbra area ratio for spots. Spots with more than one umbraor/and penumbra are excluded.
40
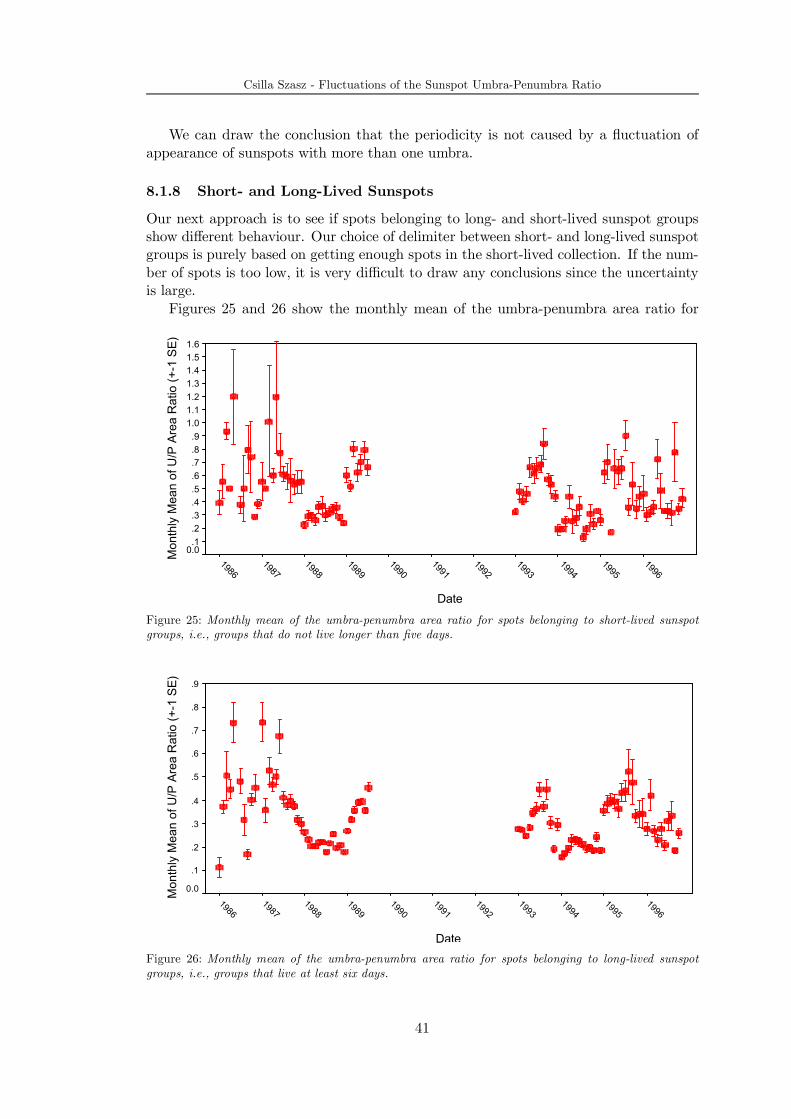
Csilla Szasz - Fluctuations of the Sunspot Umbra-Penumbra Ratio
We can draw the conclusion that the periodicity is not caused by a fluctuation ofappearance of sunspots with more than one umbra.
8.1.8 Short- and Long-Lived Sunspots
Our next approach is to see if spots belonging to long- and short-lived sunspot groupsshow different behaviour. Our choice of delimiter between short- and long-lived sunspotgroups is purely based on getting enough spots in the short-lived collection. If the num-ber of spots is too low, it is very difficult to draw any conclusions since the uncertaintyis large.
Figures 25 and 26 show the monthly mean of the umbra-penumbra area ratio for
Date
19961995
19941993
19921991
19901989
19881987
1986
Mon
thly
Mea
n of
U/P
Are
a R
atio
(+-1
SE) 1.6
1.51.41.31.21.11.0.9.8.7.6.5.4.3.2.1
0.0
Figure 25: Monthly mean of the umbra-penumbra area ratio for spots belonging to short-lived sunspotgroups, i.e., groups that do not live longer than five days.
Date
19961995
19941993
19921991
19901989
19881987
1986
Mon
thly
Mea
n of
U/P
Are
a R
atio
(+-1
SE) .9
.8
.7
.6
.5
.4
.3
.2
.1
0.0
Figure 26: Monthly mean of the umbra-penumbra area ratio for spots belonging to long-lived sunspotgroups, i.e., groups that live at least six days.
41

Csilla Szasz - Fluctuations of the Sunspot Umbra-Penumbra Ratio
spots within sunspot groups that, respectively, do not live longer than five days or liveat least six days. Both categories show a periodicity, but the short-lived spots have ahigher amplitude than the long-lived. This is because the short-lived spots most oftenare small, i.e., this is the same phenomenon as we have seen earlier.
8.1.9 With the Second Half of the Year 1989 Included
During the course of our work, the compilation of August to November of the year 1989was completed. We had come too far in our investigation to redo all analyses, but a plotwith these months with all sunspots included, except the zero umbra or penumbra ones,is shown in Figure 27. The new mean values fit well to the plot, and continue whereJuly 1989 left off.
Date
19961995
19941993
19921991
19901989
19881987
1986
Mon
thly
Mea
n of
U/P
Are
a R
atio
(+-1
SE) .9
.8
.7
.6
.5
.4
.3
.2
.1
Figure 27: Umbra-penumbra area ratio for sunspots for the years 1986 to November 1989, and 1993 to1996.
8.2 The Umbra-Penumbra Area Ratio for Sunspot Groups
There are some other sunspot catalogues than the DPD in which we can look for a quasi-biennial periodicity of the sunspot umbra-penumbra area ratio, the DPR (Section 4.2)and the Greenwich Catalogue (Section 4.1). The available digitized Greenwich Cataloguecontains data only for sunspot groups, not for individual spots. The DPR contains datafor spots, but only for spots interesting for some reason, i.e., not every spot observed.In order to compare analyses of these databases with analyses made on the DPD, aninvestigation of the umbra-penumbra area ratio for sunspot groups is needed.
42

Csilla Szasz - Fluctuations of the Sunspot Umbra-Penumbra Ratio
8.2.1 The DPD
As indicated in Figure 28, the monthly mean of the umbra-penumbra area ratio forsunspot groups also shows a two-year periodicity, just like for the individual spots,but with a lower amplitude (compare Figure 14). This lower amplitude is caused bythe sunspots being gathered into sunspot groups where the contributions from smallspots, if any, make out a much smaller amount than the contribution from possiblelarge spots. As described in the previous section, the amplitude of the quasi-biennialvariation decreases with increasing spot size.
Date
19961995
19941993
19921991
19901989
19881987
1986
Mea
n U
/P A
rea
Rat
io fo
r Gro
ups
(+-1
SE) .6
.5
.4
.3
.2
.1
Figure 28: Monthly mean of the umbra-penumbra area ratio for sunspot groups.
8.2.2 Jumps in the Two-Year Periodicity
When zooming in the plot of the mean umbra-penumbra area ratio for sunspot groups,two or perhaps three jumps in the periodicity are seen. Figures 29 and 30 show themonthly mean of the umbra-penumbra area ratio for the years 1986 to 1989 and 1993to 1996, respectively. The two clear leaps are from 1988 to 1989 and from 1993 to 1994.The change from 1987 to 1988 can also be considered as a jump, but less obvious thanthe two previously mentioned ones. Discontinuities in the graphs can be there naturally.The reason that these caught our eye is that the changes in all three cases are betweenthe months December and January.
Our first thought was that perhaps the years 1988 and 1994, the ones with lowermean umbra-penumbra area ratio values than the other years, have been measured sep-arately, but they have not. The method and chronology of the process of producing thecatalogue are described in Section 3.4. The most likely explanation for jumps occurringin December and January, rather than some other time, is that the complete years arecompiled more or less uniformly, but small improvements in the measuring methods andalgorithms are made from year to year. These small changes can very well be the causeof the jumps, since there were no modifications whatsoever between the years 1986 and1987, nor between 1995 and 1996, resulting in a smooth transition between the monthsDecember and January in both cases. Another reason for jumps occurring at this time
43

Csilla Szasz - Fluctuations of the Sunspot Umbra-Penumbra Ratio
of year can be that the observations made at the Earth’s Northern hemisphere sufferthe worst period of visibility conditions.
It is also interesting to note that the 1996 values, which are descending toward aminimum, do not reach a mean ratio as low as the minimum years 1988 and 1994 do,i.e., 0.15. On the other hand, the length of the period may vary and the lowest value isperhaps not reached until 1997.
Taking a closer look at the mean umbra-penumbra area ratio for sunspots, Figures 31and 32, the jumps seen for sunspot groups are less obvious, but a grouping of the yearscan be sensed.
Date
19891988
19871986
Mea
n U
/P A
rea
Rat
io fo
r Gro
ups
(+-1
SE) .5
.4
.3
.2
.1
Figure 29: Monthly mean of the umbra-penumbra area ratio for sunspot groups for the years 1986 to July1989.
Date
19961995
19941993
Mea
n U
/P A
rea
Rat
io fo
r Gro
ups
(+-1
SE) .6
.5
.4
.3
.2
.1
Figure 30: Monthly mean of the umbra-penumbra area ratio for sunspot groups for the years 1993 to1996.
44

Csilla Szasz - Fluctuations of the Sunspot Umbra-Penumbra Ratio
Date
19891988
19871986
Mea
n U
/P A
rea
Rat
io fo
r Spo
ts (+
-1 S
E) .9
.8
.7
.6
.5
.4
.3
.2
.1
Figure 31: Monthly mean of the umbra-penumbra area ratio for sunspots for the years 1986 to July 1989.
Date
19961995
19941993
Mea
n U
/P A
rea
Rat
io fo
r Spo
ts (+
-1 S
E) .8
.7
.6
.5
.4
.3
.2
.1
Figure 32: Monthly mean of the umbra-penumbra area ratio for sunspots for the years 1993 to 1996.
45

Csilla Szasz - Fluctuations of the Sunspot Umbra-Penumbra Ratio
8.2.3 The DPR
The analyses of the monthly mean of the umbra-penumbra area ratio for sunspot groupsin the DPR for the available years of 1977 and 1978 give a one-year period in the mannerindicated in Figure 33. There is a discrepancy in the period when comparing the DPRto the DPD, but a consistency in amplitude. However, the shorter period in the DPRdoes not have to contradict the two-year period found in the DPD, since the length ofthe cycle may vary.
Date
19791978
1977
Mea
n U
/P A
rea
Rat
io in
the
DPR
(+-1
SE) .6
.5
.4
.3
.2
.1
Figure 33: Monthly mean of the umbra-penumbra area ratio for sunspot groups in the Debrecen Photo-heliographic Results (DPR).
8.2.4 The Greenwich Catalogue
We have also searched the Greenwich Catalogue for similar periodicities as found inthe DPD and the DPR. Some occasional one- or two-year periods can be found, butnot continuously. However, the large scatter of data and the different long-term trendsprohibit to draw any conclusions.
8.3 Conclusions
The umbra-penumbra area ratio varies in what seems to be a quasi-biennial manner.Period analyses are needed to make sure and investigate this periodicity further.
We have investigated several subgroups of sunspots to find out if one or a group ofthem is the cause of the fluctuation. Sunspots occurring on both the northern and south-ern hemisphere behave similarly, sunspots sharing umbra or/and penumbra with otherspots do not have an influence on the two-year periodicity, and both short- and long-lived sunspots lie on the same type of curve. The amplitude of the periodicity decreaseswith increasing spot size, to disappear completely for spots larger than 300 millionthsof the solar hemisphere. We can draw the conclusion that this may be caused by themechanism causing the fluctuation being more efficient on smaller than on larger spots.
We have tried to see if the spread of the 1986 data decreases by excluding sunspotsclose to the solar limb, dividing the spots into size groups and excluding spots with
46

Csilla Szasz - Fluctuations of the Sunspot Umbra-Penumbra Ratio
common umbra or/and penumbra with other spots, but the spread has shown to resistour attempts. The deviation from the main trend of a two-year periodicity of the 1986and the first half of the 1987 data coincide with the change from the old area-measuringmethod with the Dareal. This is the most likely explanation for the sudden decrease ofboth the spread and the error bars.
Also the umbra-penumbra area ratio for sunspot groups in the DPD show a quasi-biennial fluctuation, but with a lower amplitude than for the sunspots. The DPR showsa one-year periodicity, but that does not have to contradict the two-year periodicity inthe DPD, since the period may vary.
We did not find any quasi-biennial variation in the Greenwich data but ’the absenceof evidence is not evidence of absence’5.
5Said by B. Roberts, in a different context, at the NATO Advanced Research Workshop Turbulence,Waves and Instabilities in the Solar Plasma, Budapest, Hungary, September 2002
47


Csilla Szasz - Fluctuations of the Sunspot Umbra-Penumbra Ratio
9 Quasi-Biennial Variations of the Sunspot Umbra-PenumbraRatio
In this section we analyze the periodic behaviour of the DPD umbra-penumbra arearatio.
9.1 Spectral Analysis of the Umbra-Penumbra Area Ratio Fluctuation
There are several different methods of investigating the spectral contents of a discretesignal. With the help of Matlab, we have analyzed the periodic behaviour of the umbra-penumbra area ratio fluctuations found in the DPD, by estimating its power spectraldensity (PSD) using periodogram. The two different time intervals, 1986 to 1989 and1993 to 1996, have been treated separately since the fast Fourier transform (FFT) re-quires a sampled signal without gaps to give an accurate result. The samples used arefor the sake of simplicity the monthly means with all sunspots included, as presented inSection 8.1.2. The error introduced by the varying sample interval (due to varying num-ber of days in the months of the year) is small in comparison with the crudity of probinga quasi-biennial signal in a four-year long data set. The highest analyzable frequencyhas a period of twice the sampling period, according to the Nyqvist sampling theorem.A higher sampling frequency than of the order of one month is not suitable for this dataset since the number of gaps increases fast with shorter averaging intervals. As we areinterested in deducing the characteristics of a quasi-biennial period, the frequency rangefrom zero to six cycles per year is enough. In place of the one and only missing monthlymean of May 1986, the mean of the two neighbouring monthly values is used due to theneed of a consistent time series.
0 1 2 3 4 5 6-35
-30
-25
-20
-15
-10
Frequency (1/yr)
Pow
er S
pect
ral D
ensi
ty (d
B(1
/yr))
1986 - 1989
freq = 0.28125 => T = 3.56 years = 42.7 months
Figure 34: PSD estimate for the monthly mean series of the umbra-penumbra area ratio for 1986 to 1989.We have centred the observed fluctuation around zero by subtracting the mean value prior to analysis.
49

Csilla Szasz - Fluctuations of the Sunspot Umbra-Penumbra Ratio
In Figure 34 the PSD estimate for the 1986 to 1989 time interval can be seen, andin Figure 35 the estimate for 1993 to 1996. The mean umbra-penumbra area ratios ofthe intervals have been subtracted from the two sets of monthly values, respectively,to center the data around zero and only reveal their periodic behaviour. The spectralpeaks are broad due to the shortness of the data sets as discussed previously, but we areable to make rough estimations for their frequency contents.
The 1986 to 1989 data set has their highest spectral peak at a frequency correspond-ing to a period of almost 43 months. This can be visualized by fitting an imaginedsinusoidal curve with a 43-month-period to the minimum of 1988 and the high monthlyvalues of 1986 and early 1987 in Figure 14 in Section 8.1.2. This curve would have a veryhigh amplitude compared to any more rapidly varying curve fitted to the low values of1986 and therefore also have higher energy density. The peak is broadened in the senseof shorter periods and has a bump at a frequency corresponding to a period of about20 months. Since the data of 1986 and the first half of 1987 are more spread than themonthly averages of the following years we find the period of 43 months untrustwor-thy. The broadening of the peak towards shorter periods and the bump are signs of aquasi-biennial signal with a shorter period than 43 months.
The 1993-1996 spectral analysis in Figure 35 has its highest spectral peak at afrequency corresponding to approximately 21 months. This peak has a lower absolutevalue than the highest peak of Figure 34 and is broadened in the sense of longer periods.There is a local minimum limiting the peak to periods longer than one and a halfyears. In both Figure 34 and Figure 35 there are significant peaks also at a frequencycorresponding to exactly one year. This might be a sign of observational seasonal effectssince the period of one Earth-rotation around the Sun is not expected to appear in afeature of solar origin.The Earth’s contribution to the angular momentum of our solar
0 1 2 3 4 5 6-35
-30
-25
-20
-15
Pow
er S
pect
ral D
ensi
ty (d
B(1
/yr))
1993 - 1996
freq = 0.5625 => T = 1.78 years = 21.3 months
Frequency (1/yr)
Figure 35: PSD estimate for the monthly mean series of the umbra-penumbra area ratio for 1993 to 1996.We have centred the observed fluctuation around zero by subtracting the mean value before the analysis.
50
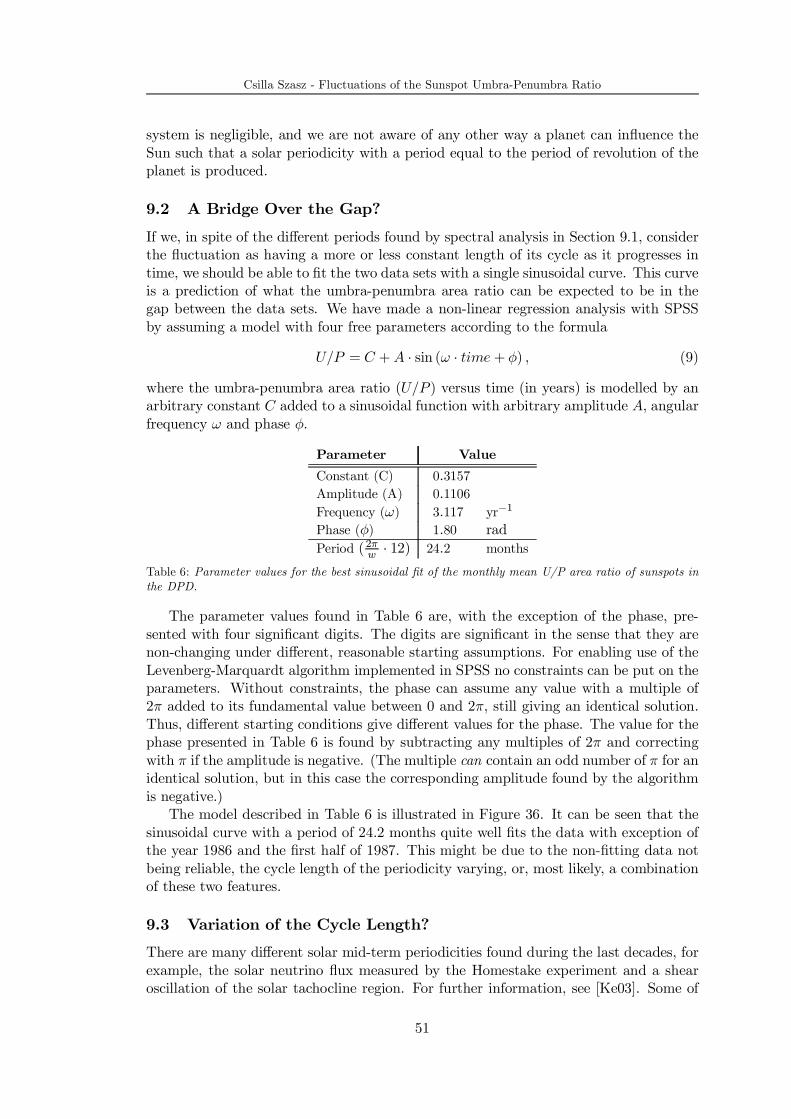
Csilla Szasz - Fluctuations of the Sunspot Umbra-Penumbra Ratio
system is negligible, and we are not aware of any other way a planet can influence theSun such that a solar periodicity with a period equal to the period of revolution of theplanet is produced.
9.2 A Bridge Over the Gap?
If we, in spite of the different periods found by spectral analysis in Section 9.1, considerthe fluctuation as having a more or less constant length of its cycle as it progresses intime, we should be able to fit the two data sets with a single sinusoidal curve. This curveis a prediction of what the umbra-penumbra area ratio can be expected to be in thegap between the data sets. We have made a non-linear regression analysis with SPSSby assuming a model with four free parameters according to the formula
U/P = C +A · sin (ω · time+ φ) , (9)
where the umbra-penumbra area ratio (U/P ) versus time (in years) is modelled by anarbitrary constant C added to a sinusoidal function with arbitrary amplitude A, angularfrequency ω and phase φ.
Parameter Value
Constant (C) 0.3157Amplitude (A) 0.1106Frequency (ω) 3.117 yr−1
Phase (φ) 1.80 radPeriod (2πw · 12) 24.2 months
Table 6: Parameter values for the best sinusoidal fit of the monthly mean U/P area ratio of sunspots inthe DPD.
The parameter values found in Table 6 are, with the exception of the phase, pre-sented with four significant digits. The digits are significant in the sense that they arenon-changing under different, reasonable starting assumptions. For enabling use of theLevenberg-Marquardt algorithm implemented in SPSS no constraints can be put on theparameters. Without constraints, the phase can assume any value with a multiple of2π added to its fundamental value between 0 and 2π, still giving an identical solution.Thus, different starting conditions give different values for the phase. The value for thephase presented in Table 6 is found by subtracting any multiples of 2π and correctingwith π if the amplitude is negative. (The multiple can contain an odd number of π for anidentical solution, but in this case the corresponding amplitude found by the algorithmis negative.)
The model described in Table 6 is illustrated in Figure 36. It can be seen that thesinusoidal curve with a period of 24.2 months quite well fits the data with exception ofthe year 1986 and the first half of 1987. This might be due to the non-fitting data notbeing reliable, the cycle length of the periodicity varying, or, most likely, a combinationof these two features.
9.3 Variation of the Cycle Length?
There are many different solar mid-term periodicities found during the last decades, forexample, the solar neutrino flux measured by the Homestake experiment and a shearoscillation of the solar tachocline region. For further information, see [Ke03]. Some of
51

Csilla Szasz - Fluctuations of the Sunspot Umbra-Penumbra Ratio
1986 1987 1988 1989 1990 1991 1992 1993 1994 1995 1996 1997
0.2
0.3
0.4
0.5
0.6
0.7
0.8
Date
U/P
Are
a R
atio
Best Fit = 0.3157 + 0.1106 * sin( 3.117 * time + 1.80 )Monthly Mean
Figure 36: Monthly mean of the umbra-penumbra area ratio for sunspots and the best sinusoidal fit foundby nonlinear regression with SPSS. The error bars correspond to two standard errors.
these periodicities are less well-established than others, but even the most well-knownseem to have an evolving cycle length. The main eleven-year sunspot cycle has also beenvarying between less than ten to an almost twelve years length during the last 140 years[La00], for which reliable observations have been done.
The behaviour of many discovered phenomena of our star are as dynamic as the waythey reveal themselves, like the gigantic outbursts of coronal mass ejections. There is noreason to expect a complete regularity in the case of an umbra-penumbra fluctuation,even though the appearance of sunspots in the photosphere observed in white-light is aquite quiescent phenomenon.
To be able to reveal the main trends of the cyclic behaviour of the umbra-penumbraarea ratio, we have treated the two data sets separately and fitted each of them withleast-square-methods in Matlab. The data series are first normalized according to
X =U/P − µ1
µ2, (10)
where X is the normalized data, U/P the original data, µ1 the mean value and µ2the standard deviation. Then a least-square fit is made whereafter the fitted curve istransformed back with the inversion of Equation (10) to enable comparisons with theoriginal data. We have by inspection found a polynomial degree of six to be suitable forthe curves to show the quasi-biennial trend as clearly as possible, but not contain fastervariations similar to the scatter of the original data.
52

Csilla Szasz - Fluctuations of the Sunspot Umbra-Penumbra Ratio
Figure 37: The monthly mean umbra-penumbra area ratio fitted with polynomials of degree six.
Plots for both time intervals are shown in Figure 37. The data from 1986 and the firsthalf of 1987 may be uncertain, as discussed previously. The monthly mean of October1996 has not been taken into account when fitting polynomials to the time interval 1993to 1996 since it has large error bars but due to its deviant value strongly influences thepolynomial fit.
It can be seen in Figure 37 that the cycle length may be shorter close to activitymaximum (i.e., near the gap between the data sets) than at lower activity periodshowever, the amplitudes of the polynomial curves are rather uniform.
9.4 Conclusions
Since the intervals of available data are short compared to the cycle length of the fluctu-ation, it is at this moment difficult to conclude anything else than that the variation hasa period that may vary from 1.5 to 3 years or more depending on how much confidenceone has in the data of 1986 and the first half of 1987.
53


Csilla Szasz - Fluctuations of the Sunspot Umbra-Penumbra Ratio
10 The Future
In a way the future is already here. This section says in what way.
10.1 The Future of the DPD at the Debrecen Heliophysical Observa-tory
In early December 2002, a grant was approved for a new high-resolution scanner to bebought. This will speed up the production of the DPD series because it will be possibleto scan photoheliograms in one piece, with a very good resolution. There will be noneed of separate position and area measurements, as described in Section 3.3. Bothcan be carried out at the same time. When the software to be used is fully developedand calibrated, it will be a powerful tool. The umbra and penumbra areas will still bemanually checked, but the complete process will be faster and easier, due to fewer stepsand the data will contain even less errors than they do today.
10.2 The Future of the Quasi-Biennial Variation of the Sunspot Umbra-Penumbra Area Ratio
A two-year period seems to be present in the sunspot umbra-penumbra area ratio forthe DPD. Further analyses of more data will be very interesting. With the quickercompilation of the DPD catalogue, the possibility of an extended investigation is notfar in the future. Since the periodicity we have found is very exiting, it will not beforgotten. A scientific article on the subject is planned.
55


Csilla Szasz - Fluctuations of the Sunspot Umbra-Penumbra Ratio
Appendix A
Table of Photoheliograms in the DPD
Table 7 contains the number of photoheliograms used in the DPD from the differentcontributing observatories around the world.
Observatory No. of Plates
Gyula Observing Station (Hungary) 1644Debrecen Heliophysical Observatory (Hungary) 576Kislovodsk Observing Station of Pulkovo Observatory (Russia) 268Kanzelhöhe Solar Observatory (Austria) 129Ramey, Puerto Rico (U.S.) 40High Altitude Observatory, Boulder (U.S.) 25Kodaikanal Solar Observatory (India) 9Ebro Observatory (Spain) 7Helwan Solar Station (Egypt) 6Tashkent Observatory (Uzbekistan) 6Kiev Universtiy Observatory (Ukraine) 5Abastumani Astrophysical Observatory (Georgia) 3Holloman (U.S.) 3Mount Wilson Observatory (U.S.) 2P14
P2723
Table 7: Number of photoheliograms from around the world used in the DPD for the years 1986 to July1989 and 1993 to 1996.
57


Csilla Szasz - Fluctuations of the Sunspot Umbra-Penumbra Ratio
Appendix B
Table of the Number of Sunspots in Different Investigations
.
Criteria No. of Spots∗
U, P, U+P > 0
In total 18386Where U of groups is maximal 3234Distance < 0.9 solar radii from the centre of the solar disc 15174Spots with common features with other spots excluded 10989Short-lived spots ( ≤ 5 days) 1899Long-lived spots ( > 5 days) 16487∗Number of spots after adding the umbra values for spots with common penumbrae.
Table 8: Number of sunspots in the DPD used in different investigations for the years 1986 to July 1989and 1993 to 1996.
59


Csilla Szasz - Fluctuations of the Sunspot Umbra-Penumbra Ratio
References
[An71] A. Antalová; The Ratio of Penumbral and Umbral Area of Sunspots in the 11-Year Solar Activity Cycle; Bulletin of the Astronomical Institutes of Czechoslo-vakia 22, p. 352-370 (1971)
[Ba01] T. Baranyi, L. Gyori, A. Ludmány, H. E. Coffey; Comparison of Sunspot AreaData Bases; Monthly Notices of the Royal Astronomical Society 323, p. 223-230(2001)
[Br90] P. N. Brandt, W. Schmidt, M. Steinegger; On the Umbra-Penumbra Area Ratioof Sunspots ; Solar Physics 129, p. 191-194 (1990)
[Ch05] W. H. M. Christie et al.; Greenwich Photoheliographic Results, 1903 ; Neill &Company Ltd., Bellevue, England, p. 1-63 (1905)
[De64] L. Dezso, O. Gerlei; Variation of the Average Penumbra-Umbra Ratio of SunspotsDuring the Solar Cycle; Czechoslovak Academy of Sciences Astronomical Insti-tute Publication No. 51, p. 41-45 (1964)
[De87] L. Dezso, O. Gerlei, Á. Kovács; Debrecen Photoheliographic Results 1977 ; Pub-lication of Debrecen Heliographic Observatory, Heliographic Series No. 1, p. 11-208 (1987)
[Fo90] P. Foukal; Solar Astrophysics ; John Wiley & Sons, Inc.; USA (1990); ISBN:0-471-83935-3
[Gy96] L. Gyori, T. Baranyi, Gy. Csepura, O. Gerlei, A. Ludmany; Debrecen Pho-toheliographic Data for the Year 1986 ; Publication of Debrecen HeliographicObservatory, Heliographic Series No. 10, p. 1-61 (1996)
[Gy98] L. Gyori, T. Baranyi, Gy. Csepura, O. Gerlei, A. Ludmany; Debrecen Pho-toheliographic Data for the Year 1987 ; Publication of Debrecen HeliographicObservatory, Heliographic Series No. 11, p. 1-45 (1998)
[Gy01] L. Gyori, T. Baranyi, A. Ludmany, O. Gerlei, G. Csepura; Debrecen Photoheli-ographic Data for the Year 1988 ; Publication of Debrecen Heliographic Obser-vatory, Heliographic Series No. 12, p. 1-60 (2001)
[Ho84] R. Howard, P. A. Gilman, P. I. Gilman; Rotation of the Sun Measured fromMount Wilson White-Light Images ; The Astrophysical Journal 283, p. 373-384(1984)
[Ho99] R. F. Howard, S. S. Gupta, K. R. Sivaraman;Measurement of Kodaikanal White-Light Images, II. Rotation Comparison and Merging with Mount Wilson Data;Solar Physics 186, p. 25-41 (1999)
[Jo38] H. S. Jones et al.; Greenwich Photoheliographic Results, 1936 ; Published by HisMajesty’s Stationary Office, London, England, p. 1-161 (1938)
[Jo57] H. S. Jones et al.; Greenwich Photoheliographic Results, 1950 ; Published by HerMajesty’s Stationary Office, London, England, p. 1-137 (1957)
61

Csilla Szasz - Fluctuations of the Sunspot Umbra-Penumbra Ratio
[Ke03] J. Kero; Solar Mid-Term Periodicities ; Master’s Thesis at Luleå University ofTechnology, Luleå, Sweden, (in press), 2003
[La75] P. S. Laurie et al; Photoheliographic Results 1967 ; Royal Observatory AnnalsNo. 11, p. 1-114 (1975)
[La00] K. R. Lang; The Sun from Space; Springer-Verlag Berlin Heidelberg; Germany(2000); ISBN: 0941-7834
[Ne58] H. W. Newton; The Face of the Sun; Penguin Books Ltd, Richard Clay &Company Ltd, Bungay, Suffolk, Great Britain (1958)
[Ni82] I. Nicolson; The Sun; Michell Beazley Publishers, London, Great Britain (1985);ISBN: 0-85533-311-1
[Pa79] E. N. Parker; Sunspots and the Physics of Magnetic Flux Tubes. I. The GeneralNature of the Sunspot ; The Astrophysical Journal 230, p. 905-913 (1979)
[Pr84] E. R. Priest; Solar Magnetohydrodynamics ; D. Reidel Publishing Company; Dor-drech, Holland (1984); ISBN: 90-277-1374-X, 90-277-1833-4
[Sh02] G. B. Sharmer et al.; Dark Cores in Sunspot Penumbral Filaments ; Nature 420,p. 151-152 (2002)
[Te95] M. Ternullo (editor); Solar Observations made at Catania Astrophysical Obser-vatory during 1993 ; Publicazione Nuova Serie n. 18, p. 1-83 (1995)
[Ze98] M. Zeilik, S. A. Gregory; Introductory Astronomy & Astrophysics; 4th edition;Saunders College Publishing, U.S.(1998); ISBN: 0-03-006228-4
[Zi88] H. Zirin; Astrophysics of the Sun; Cambridge University Press (1988); ISBN:0-521-316073
62